Response of the Downstream Braided Channel to Zhikong Reservoir on Lhasa River


1
School of Hydraulic Engineering, Changsha University of Science & Technology, Changsha 410114, China
2
State Key Laboratory of Plateau Ecology and Agriculture, Qinghai University, Xining 810016, China
3
Department of Geography, Syracuse University, Syracuse, NY 13244, USA
4
Key Laboratory of Water-Sediment Sciences and Water Disaster Prevention of Hunan Province, Changsha 410114, China
5
State Key Laboratory of Water Resources and Hydropower Engineering Science, Wuhan University, Wuhan 430072, China
*
Author to whom correspondence should be addressed.
Water 2018, 10(9), 1144; https://doi.org/10.3390/w10091144
Submission received: 3 August 2018
/
Revised: 19 August 2018
/
Accepted: 23 August 2018
/
Published: 27 August 2018
(This article belongs to the Section Water Resources Management, Policy and Governance)
Abstract
:Lhasa River basin is situated in the southern part of the Qinghai-Tibet Plateau, which is the most important region of economic and social development in Tibet. In order to efficiently utilize water resources in the basin and ease the shortage of regional electric power supply, Zhikong Reservoir was built in the upstream reach of the Lhasa River in 2006. Impoundment of this reservoir evidently affected the morphology and stability of the downstream braided channel below the dam. Yet, little is known about the complex responses of the downstream braided channel to the Zhikong Dam. Landsat images in the 2000–2016 period, together with daily discharges and field observations in the 2017–2018 period, were used to investigate the morphological response of the braided channel to the Zhikong Dam. The downstream Lhasa River below the Zhikong Dam was divided into four reaches (i.e., RS1, RS2, RS3 and RS4) based on the confluence of three downstream tributaries. Results showed that the number and area of central bars in the braided reach closest to Zhikong Dam (RS1) were increased because of main channel incision and water level drop. This increasing trend attenuated along the downstream channel of this reach. Braiding number index of multithread channels in RS1 obviously increased by 3 in one section and reduced by 2 in two sections, while changed in all sections randomly with no pronounced trend along the RS2 to RS3 and RS4 reaches. The average bar area in two focus reaches, RS1_B1 and RS2_B2, 6.0 km and 36.8 km far away to the Zhikong Dam, respectively, followed opposite trends with the former increasing and the later reducing. Furthermore, the mean dissection, landscape dissection and fragmentation shape indices in RS1, showed an increasing trend from 2001 to 2016, indicating the shape of irregular central bars varied greatly because clean water release of Zhikong Dam eroded the downstream braided channel.
1. Introduction
Qinghai-Tibet Plateau is the birthplace of the Asian large rivers, where the well-developed braided rivers often produce riverine wetlands in a wide variety of valley ranges [1,2]. Braided riverine wetlands on the plateau are the main habitats for aquatic organisms, fish and birds and hence play a key role in maintaining ecological balance, carbon cycle and socioeconomic development on the plateau [3,4,5,6]. Typically, they are distributed in wide valleys of the middle and lower reaches of plateau rivers such as Tuotuo, Dangqu, Chumar and Buqu Rivers in Yangtze River source, Maduo-Dari reach in Yellow River source, Zhaqu reach in Lancang (Mekong) River source and the middle and lower reach of Yarlung Tsangpo and Lhasa Rivers in the Qinghai-Tibet Plateau [2,7,8,9]. Nevertheless, in recent decades, constructed large reservoirs in plateau rivers have significantly changed natural runoff, intercepted sediment and nutrients and reduced the probability of floodplain inundation in downstream riverine wetlands, leading to reduction of wetland areas and degradation of wetland functions, which may further endanger ecological balance of the region [10,11,12,13,14]. Therefore, it is essential to understand the impacts of large reservoirs on the morphological processes of downstream braided channel and riverine wetlands in the plateau rivers.
Since 1980s, extensive studies have been conducted on impacts of reservoir impoundment on riverine wetlands and aquatic ecology in low-altitude areas [13,15,16,17,18,19]. For instance, dams affect fluvial processes and wetland ecological systems in the middle and lower Yangtze River (e.g., Dongting and Poyang Lakes), Hanjiang River, lower Yellow River, Nile River, Colorado River and many medium-sized or small rivers around the world [10,20,21,22,23,24,25,26,27,28,29,30,31]. What have been systematically summarized were impacts of dam construction on various components of river ecosystems, including runoff, sediment load, biogenic material transport and water quality in the middle and lower reaches of a river, as well as wetland function, biological habitat and biodiversity [11,17,32,33,34,35]. The degree of downstream dam impacts not only depends on the dam location in the watershed and reservoir capacity but also is related to downstream channel pattern (e.g., meandering or braided), bed and bank materials and vegetation coverage. Thus, it is of importance to elaborate the different response modes of the downstream channel of different river patterns (single-thread or multithread channels) to reservoir impoundment.
In the Qinghai-Tibet Plateau, however, rivers on which many dams have been built since 2000, often have narrow and deep gorges upstream of the dams (e.g., upper Yangtze River, upper Mekong River and upper Yellow River) and alluvial channels in the downstream reaches. Consequently, elements of biotic materials (e.g., carbon, nitrogen and phosphorus) are mostly trapped and deposited in the upstream reaches of the dams, leaving little in the downstream channels. Only a few dams (e.g., upper Lhasa River) were built at the exits of upstream gorges, such that their downstream reaches are featured by wide and shallow gravel-bed braided channels, which are very sensitive to the fluctuation of water level affected by the reservoir operation. As such, dam closure and reservoir operation inevitably generate severe negative impacts on downstream river morphology and function of riverine wetlands [20,21,22,31,36,37,38]. However, little is known about these impacts in plateau rivers so far.
The downstream braided channel of Lhasa River below Zhikong Dam, a main tributary of the middle Yarlung Tsangpo River, serves as a good example for understanding dam impacts on riverine wetlands of plateau rivers and hence was selected in this study. The lower and middle reaches of Lhasa River are typical gravel-bed braided channels bounded by wide valleys. These channels not only have many side bars, central bars and islands within active channel but also are partly used as farmlands and urban construction lands in Lhasa City and other counties [9,39]. After the construction of the Zhikong Dam in 2006, runoff and sediment supply to the downstream braided channels have been reduced, which significantly affected their bar-island dynamics and braided riverine wetlands. This brought about complex adjustments of the downstream braided channel including the magnitude and variability of incoming discharges (water level), the quantity of sediment transport load and grain size of riverbed. How to quantitatively identify these responses to the Zhikong Dam is still unclear because these responses are coupled outcome of multiple factors involving both human activities and natural fluvial process.
The main objectives of this study were (i) characterizing morphological changes of four studied reaches in the downstream braided channel using Landsat (30 m resolution) and Google Earth (0.6 m resolution) images (2000–2016) with incoming discharges; (2) examining responses of two braiding indices in braided channel to the Zhikong Dam; and (3) analyzing inter-and intra-annual changes of morphological structures of the downstream braided channel reaches using four landscape pattern indices.
2. Study Area and Methods
2.1. Study Area
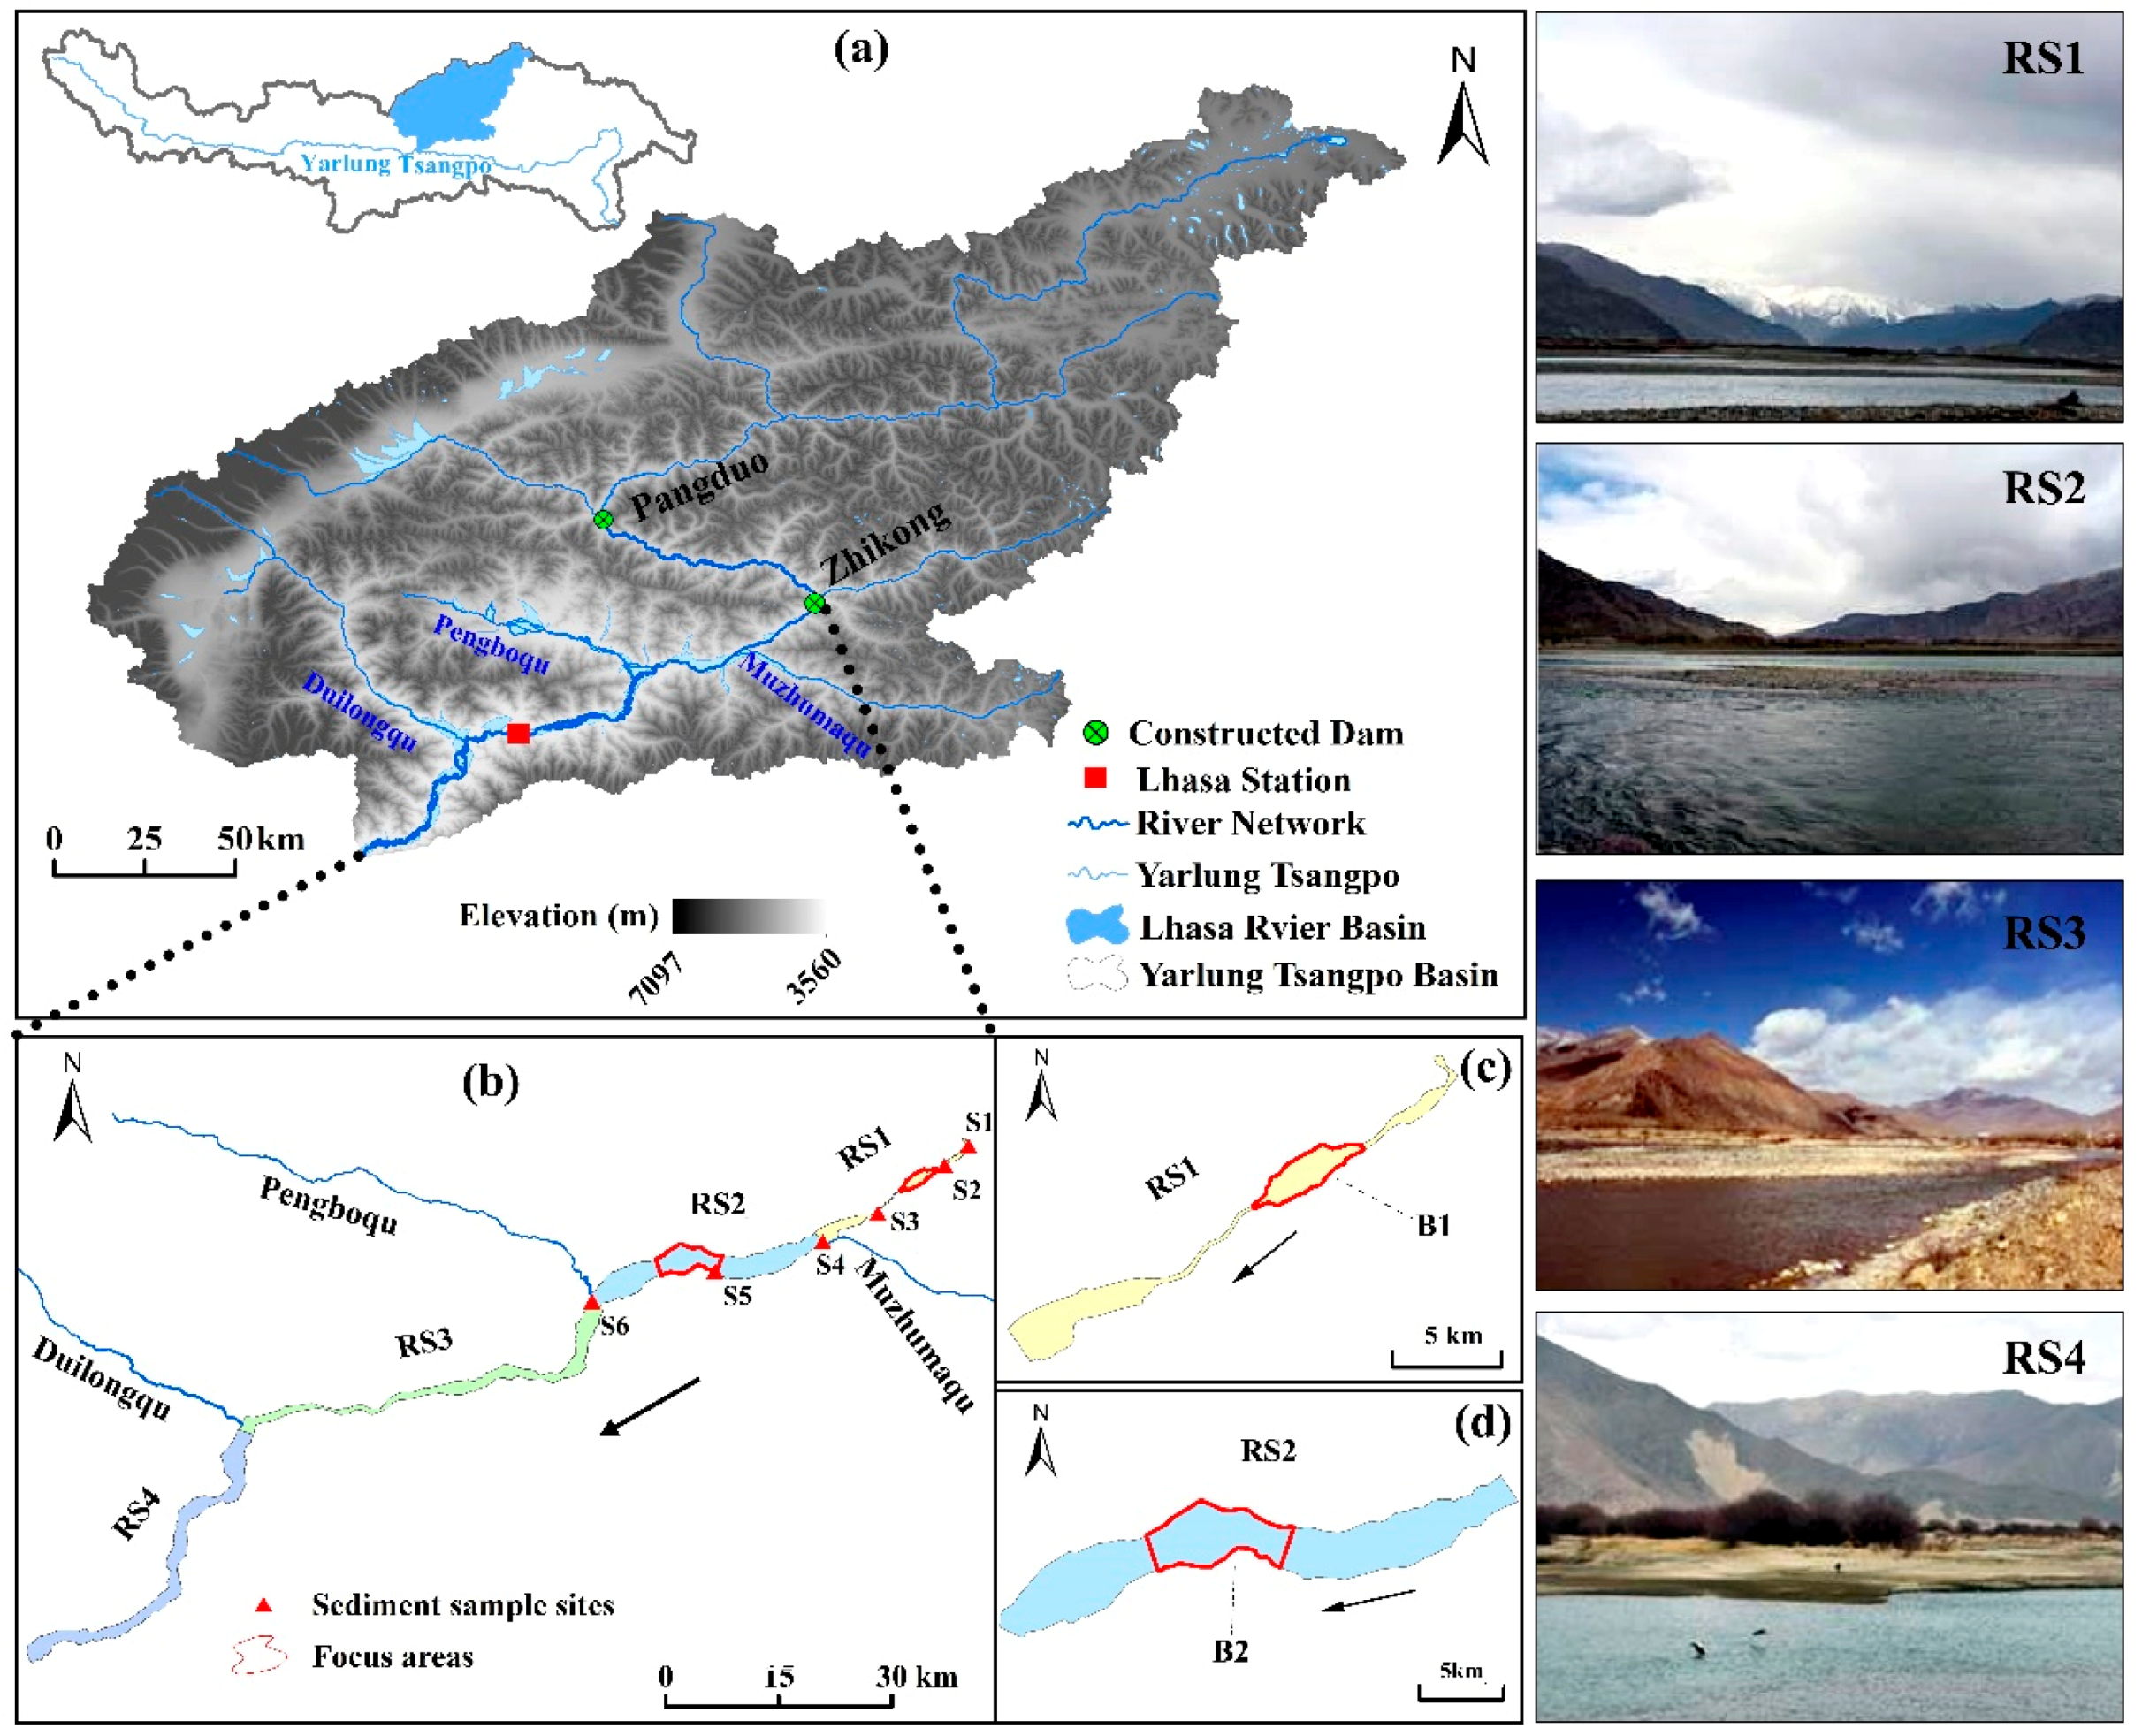
Lhasa River basin is located in the central and southern part of Tibet Autonomous Region (29°19′–31°15′ N, 90°06′–93°20′ E), where the average altitude is higher than 3600 m. The basin area is 32,471 km2, 702 km2 of which is covered by glaciers. This area accounts for about 13.5% of the total area of Yarlung Tsangpo River basin (Figure 1a). Lhasa River is one of the five major tributaries of the Yarlung Tsangpo River, originated from the northern piedmont of the Nyenchen Tanggula Mountains. Its mean annual runoff is 10.972 billion m3 with the potential hydropower of 1.177 million kWh, ranking the third of the five tributaries. The total length of Lhasa River is 551 km with an average channel gradient of 0.29%.
In the upper Lhasa River, Zhikong and Pangduo Dams were built in 2006 and 2013, respectively (Figure 1a). This study only focused on the downstream reach of the Zhikong Dam, which is 66.5 km below the Pangduo Dam, because the former has a larger contributing area than the latter does. The Zhikong Dam is located about 96-km upstream of the urban area of Lhasa City (Figure 1a). It has a contributing area of 20,179 km2 with the mean annual discharge of 237 m3/s and annual runoff of 7.47 billion m3. Mean annual suspended load and bed load are 0.720 and 0.151 million tons, respectively [40]. The impoundment and operation of Zhikong Dam directly altered the hydrological regime of the downstream braided channel.
Our studied area is within the middle and lower Lhasa River valley, whose boundary is defined as the bluffs on both sides of the river. Within this valley, we focused on morphological changes of braided channels. Thus, farmland, constructed land and urban area were excluded by the boundary lines of active river channel (Figure 1b). Wide braided reaches in the middle and lower Lhasa River are generally multithread channels with many unstable bars and some stable vegetated islands. Specifically, the downstream channel reach is about 150-km long with a gravel bed. To characterize this longitudinal attenuation and the additional influence of three tributaries (Muzhumaqu, Pengboqu and Duilongqu Rivers) on the reach, we divided the downstream channel into four reaches, RS1, RS2, RS3 and RS4, separated by the three tributaries (Figure 1b). The channel slope decreased from 0.26 to 0.10% along the channel from RS1 to RS4. RS1 is 22.5 km long and 2.0 km wide with a 7-km long single-thread section confined by mountains; RS2 is 30.4 km long and 3.0 km wide; RS3 is 54.3 km long and 1.5 km wide including a 13-km long single-thread channel affected by urbanization and channelization; and RS4 is 43.3 km long and 1.8 km wide, featured by a relatively free braided channel (Table 1). Within RS1 and RS2, two smaller segments (B1 and B2) containing a braided channel reach with the length of 5.3 and 6.6 km were selected for examining their inter- and intra-annual morphological changes (Figure 1c,d). They were 6.1 and 36.8 km downstream of the Zhikong Dam, respectively and thus their morphologic responses to the dam were more sensitive. In April 2018, we selected six sites in the first two reaches to measure b-axis of gravels and boulders using a band tape (1 mm accuracy) with a 1-m interval along the channel (Figure 1b), S1 (N = 181 grains), S2 (N = 197 grains) and S3 (N = 136 grains) in RS1 and S4 (N = 121 grains), S5 (N = 127 grains) and S6 (N = 240 grains) in RS2. Particle size analysis were subsequently performed to obtain their median grain size.
2.2. Data Source and Processing
Lhasa hydrological station in the Lhasa City is 120 km below the Zhikong Dam (Figure 1a). Daily discharges from 1956 to 2010 measured at this station were obtained from the Hydrological Bureau of Tibet Autonomous Region. Satellite images of Landsat 8 OLI_TIRS, Landsat 7 ETM SLC-ON, Landsat 4–5 TM (United States Geological Survey, Reston, VA, USA) and Google Earth were selected for analyzing morphological changes. Unfortunately, these datasets were not successive and complete. For example, the suitable images (i.e., strip (138, 40)) in 2011 were not available. Instead, they were replaced by those on 11 April 2010. Although the spatial resolution of the Landsat images is only 30 m, it is sufficient to identify side and central bars in valley with the width of 1.5–3.0 km (Table 1). Images of satisfactory quality were finally selected to match the available daily or monthly discharges. Google Earth images with the resolution of 0.6 m were used to identify the accurate boundary of valley and local active channels of the studied reaches. These considerations ended up with Landsat strips (137, 39), (137, 40), (138, 39) and (138, 40) covering RS1, RS2, RS3 and RS4 in different combinations.
2.3. Data Analysis
Using ENVI 5.2 (Harris Geospatial Solutions, Inc., Boulder, CO, USA) and ArcGIS 10.3 (Environmental Systems Research Institute, Inc., Redlands, CA, USA), images of bands involved in each reach were processed through seamless mosaic, band fusion and mask extraction. In combination with land use classification and high-resolution images of Google Earth in the study area, water bodies and related bar boundaries were identified using supervised classification, object-oriented image feature extraction and improved normalized difference surface water index. Morphological changes of the four reaches (RS1, RS2, RS3 and RS4) during the 2001–2016 period were subsequently examined using these data in two ways. First, we described temporal changes of bars and islands by comparing the changes of channel branches in each reach from 2001 to 2016. Second, we inferred temporal changes of channel morphology by establishing linear correlation between the area of surface water and the associated mean daily discharge in each reach.
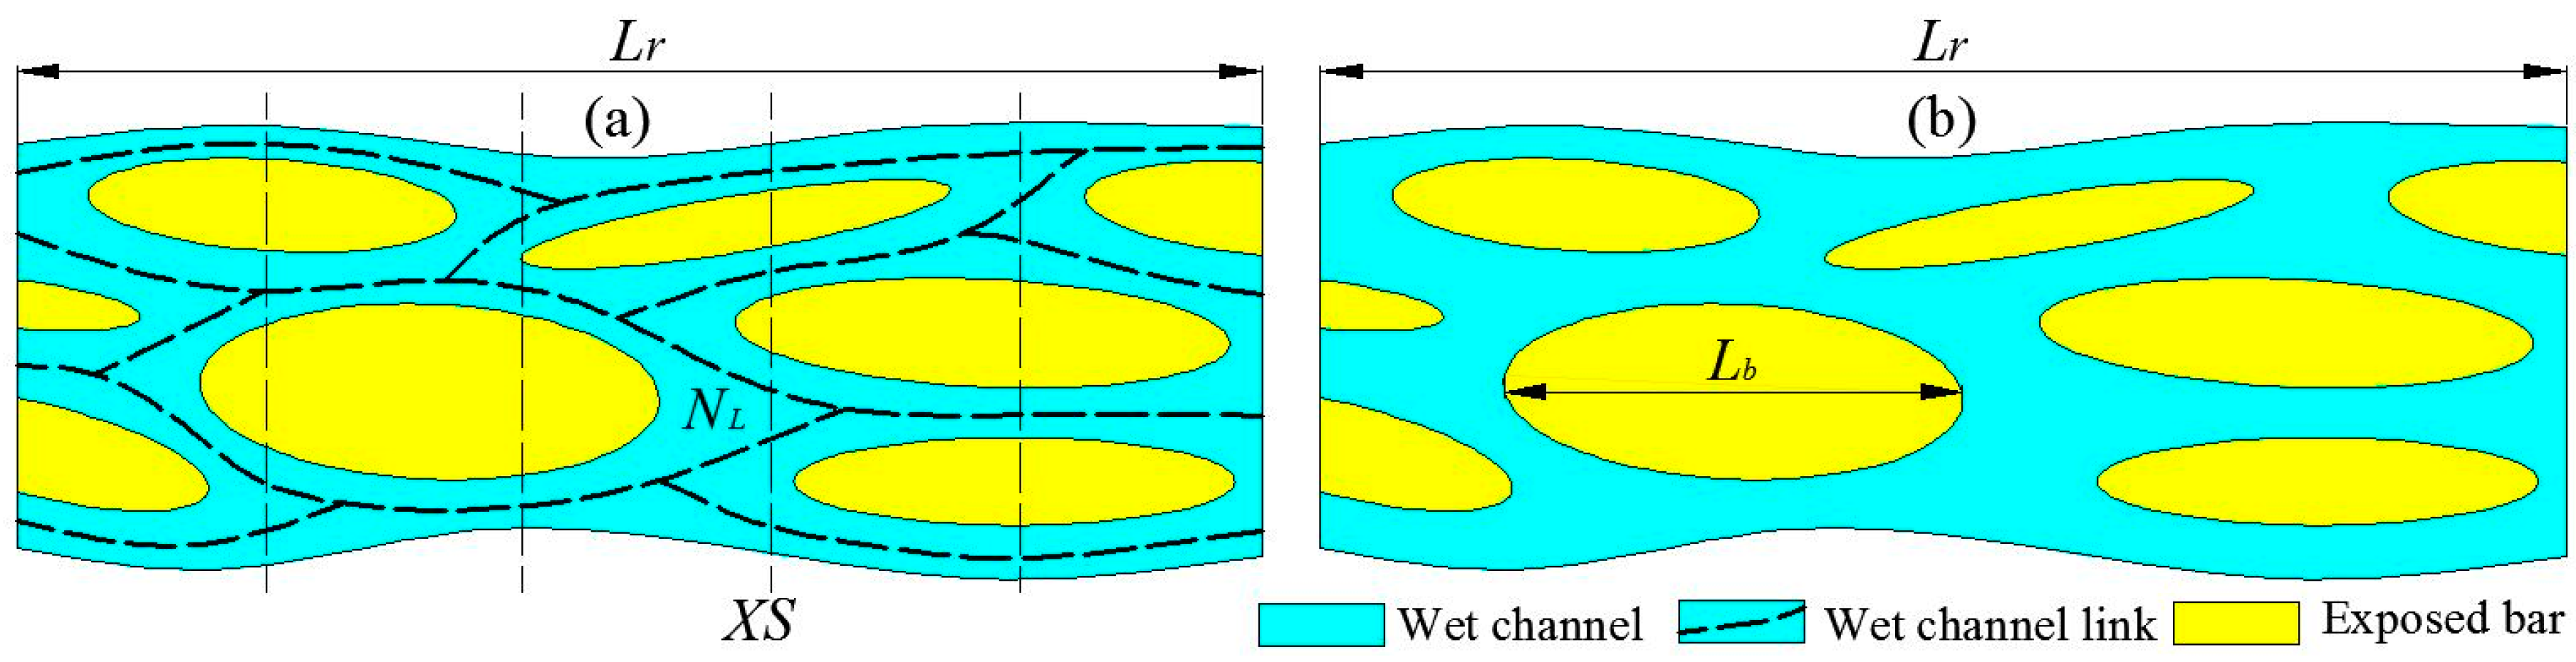
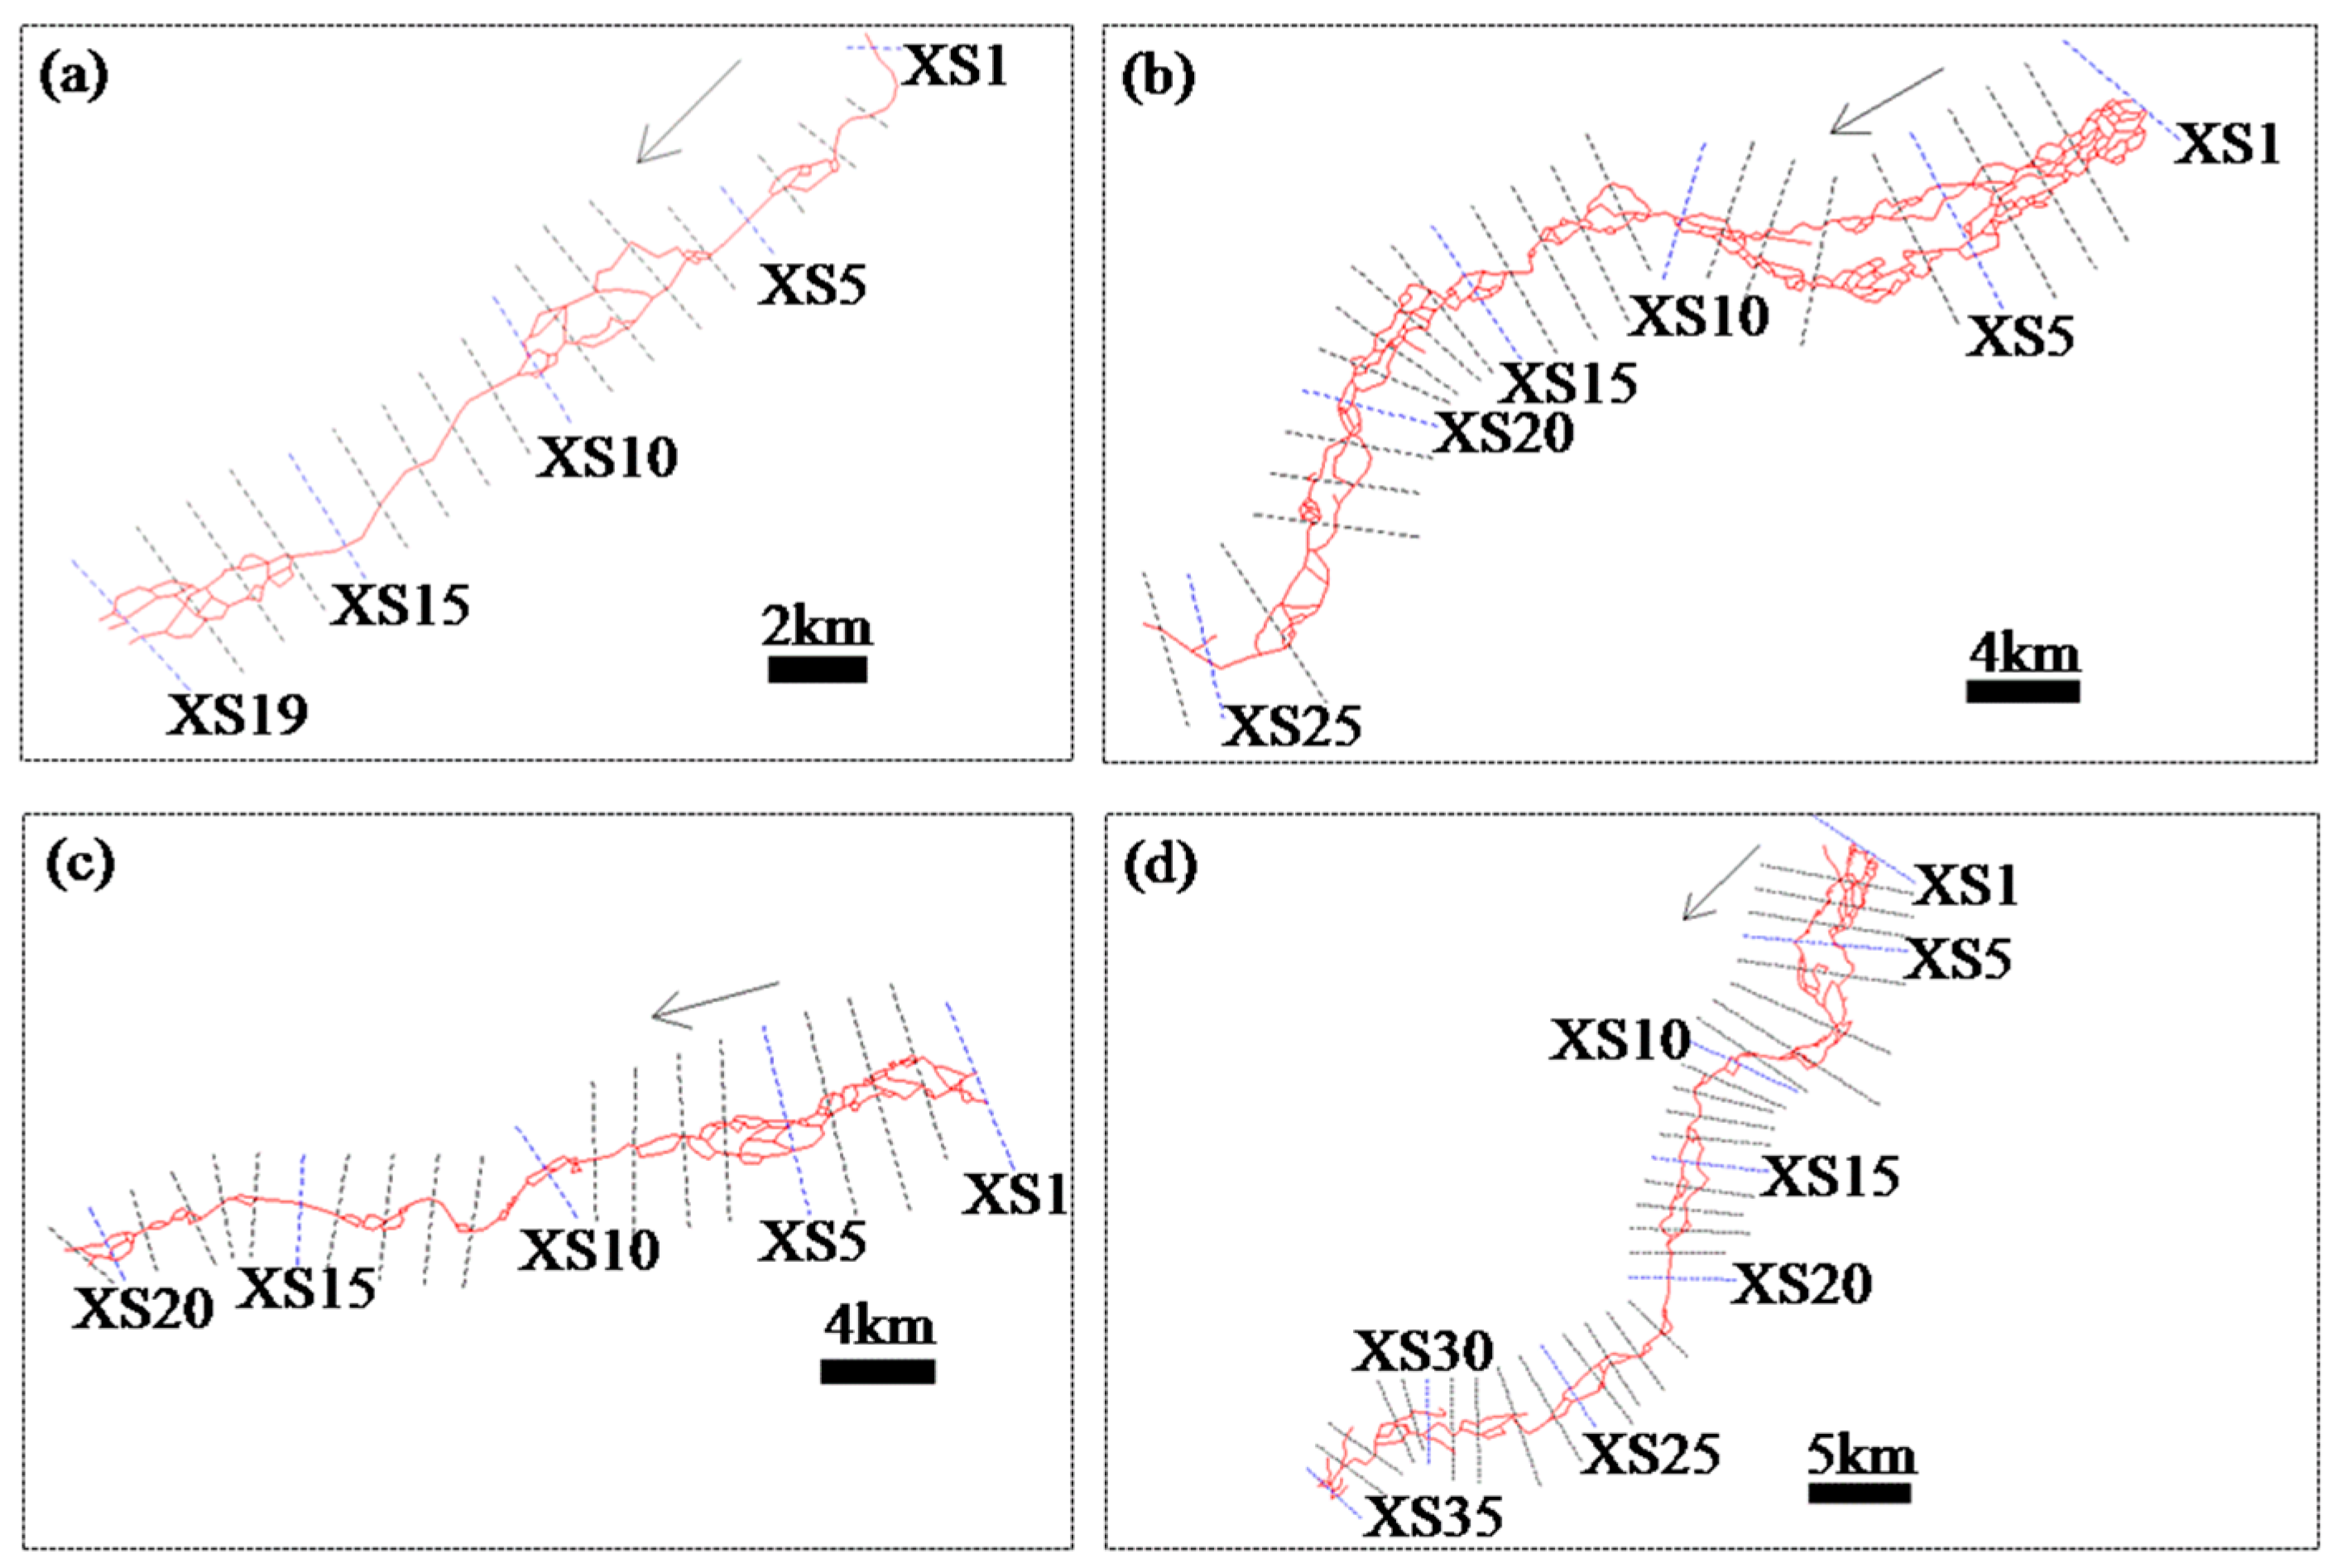
The downstream reach of the Zhikong Dam is featured as a wide and complex braided channel. Its response to the impoundment of the dam was quantified by calculating the change of two braiding indices (braiding number index and bar length index) in 2001, 2011 and 2016 based on the method summarized by [41]. Extracting and calculating braiding number index (Figure 2a) do not need to consider the effect of channel width and bar size, so the channel reach in RS1, RS2, RS3 and RS4 was divided by cross sections with a 1-km interval and the centerline of braiding channel is simplified as a line (Figure 3). These sections along each line were denoted as a series of numbers after XS (e.g., XS1, XS5 and XS19 in Figure 3a).
Braiding number index (BIT) is defined as the average number of braiding channels along each cross-section of the selected braided river,
where NL is the number of braiding channels along a cross-section and XS is the cross section selected along each reach, which will be explained later in detail.
Bar length index requires the measurement of the length of all gravel bars in each river reach (Figure 2b). We only selected RS1 and RS4 to calculate this index because these two reaches have the largest difference of the response to the dam, the former suffered the strongest impact from the dam, whereas the later was almost beyond the impact distance of the dam. In order to compare the morphological responses of different segments of RS1 and RS4 to the dam, we further divided RS1 and RS4 into three segments of equal lengths (DS1, DS2 and DS3).
Bar length index (BIB) is defined as the ratio of two times of the total length of the gravel bar to the length of the river reach,
where Lr is the length of the centerline of the river and Lb is the length of a gravel bar.
In addition, the local morphologic responses of two active segments (B1 in RS1 (Figure 1c) and B2 in RS2 (Figure 1d)) to the Zhikong Dam, were quantified using landscape pattern indices, which can quantitatively characterize wetland changes and spatial and temporal variations of landscape structure and fragmentation [42,43,44,45]. A single patch of braided channel in remote sensing images is defined as a bar separated by water flow. Patch number in RS1_B1 and RS2_B2 was calculated and patch density is defined as patch number per unit area. Three landscape pattern indices including mean dissection, landscape dissection and fragmentation shape were selected to quantify the inter- and intra-annual change of local braided channels (RS1_B1 and RS2_B2). The dissection index, Di for bars is defined as the perimeter of a patch divided by that of a circle with an area equal to that of the patch. The mean dissection index (D) may be subsequently calculated using all Di values, which is proportional to the landscape fragmentation [43,46]:
where Pi is perimeter of patch i; Ai is the area of patch i and n is the number of patches in the landscape. Di is primarily used as an index characterizing the irregularity or degree of dissection of patch shape.
The landscape dissection index (LDI) is defined as [46]:
where A is the total area of the region. LDI is an expression of the proportion of edge to area in a landscape. It is essential to estimate LDI in connection with the sum of patch sizes because one has to know whether the sum of Ai has increased or not in order to interpret changes of LDI as either a reduction or an enhancement of the landscape fragmentation.
Fragmentation shape index (FS) is closely related to patch’s area. FS1 is defined as the average fragmentation index of patch shape, while FS2 is defined as the fragmentation index of average shape weighted by patch area [44]:
where MSI is the average shape index, , SIi is the shape index of the n patches (i = 1, …, n), is based on the shape of square whose shape index is 1 while index of other shapes is greater than 1; Pi is the perimeter of the n patches (i = 1, 2, …, n); Ai is the area of the n patches (i = 1, …, n); ASI is average shape index considering area weight, , A is the area of the whole landscape, , n is the patches of the landscape. By definition, higher FS1 and FS2 mean that the fragmentation of bar shapes is larger.
3. Results and Analysis
3.1. Changes of Annual and Monthly Discharges at the Lhasa Station
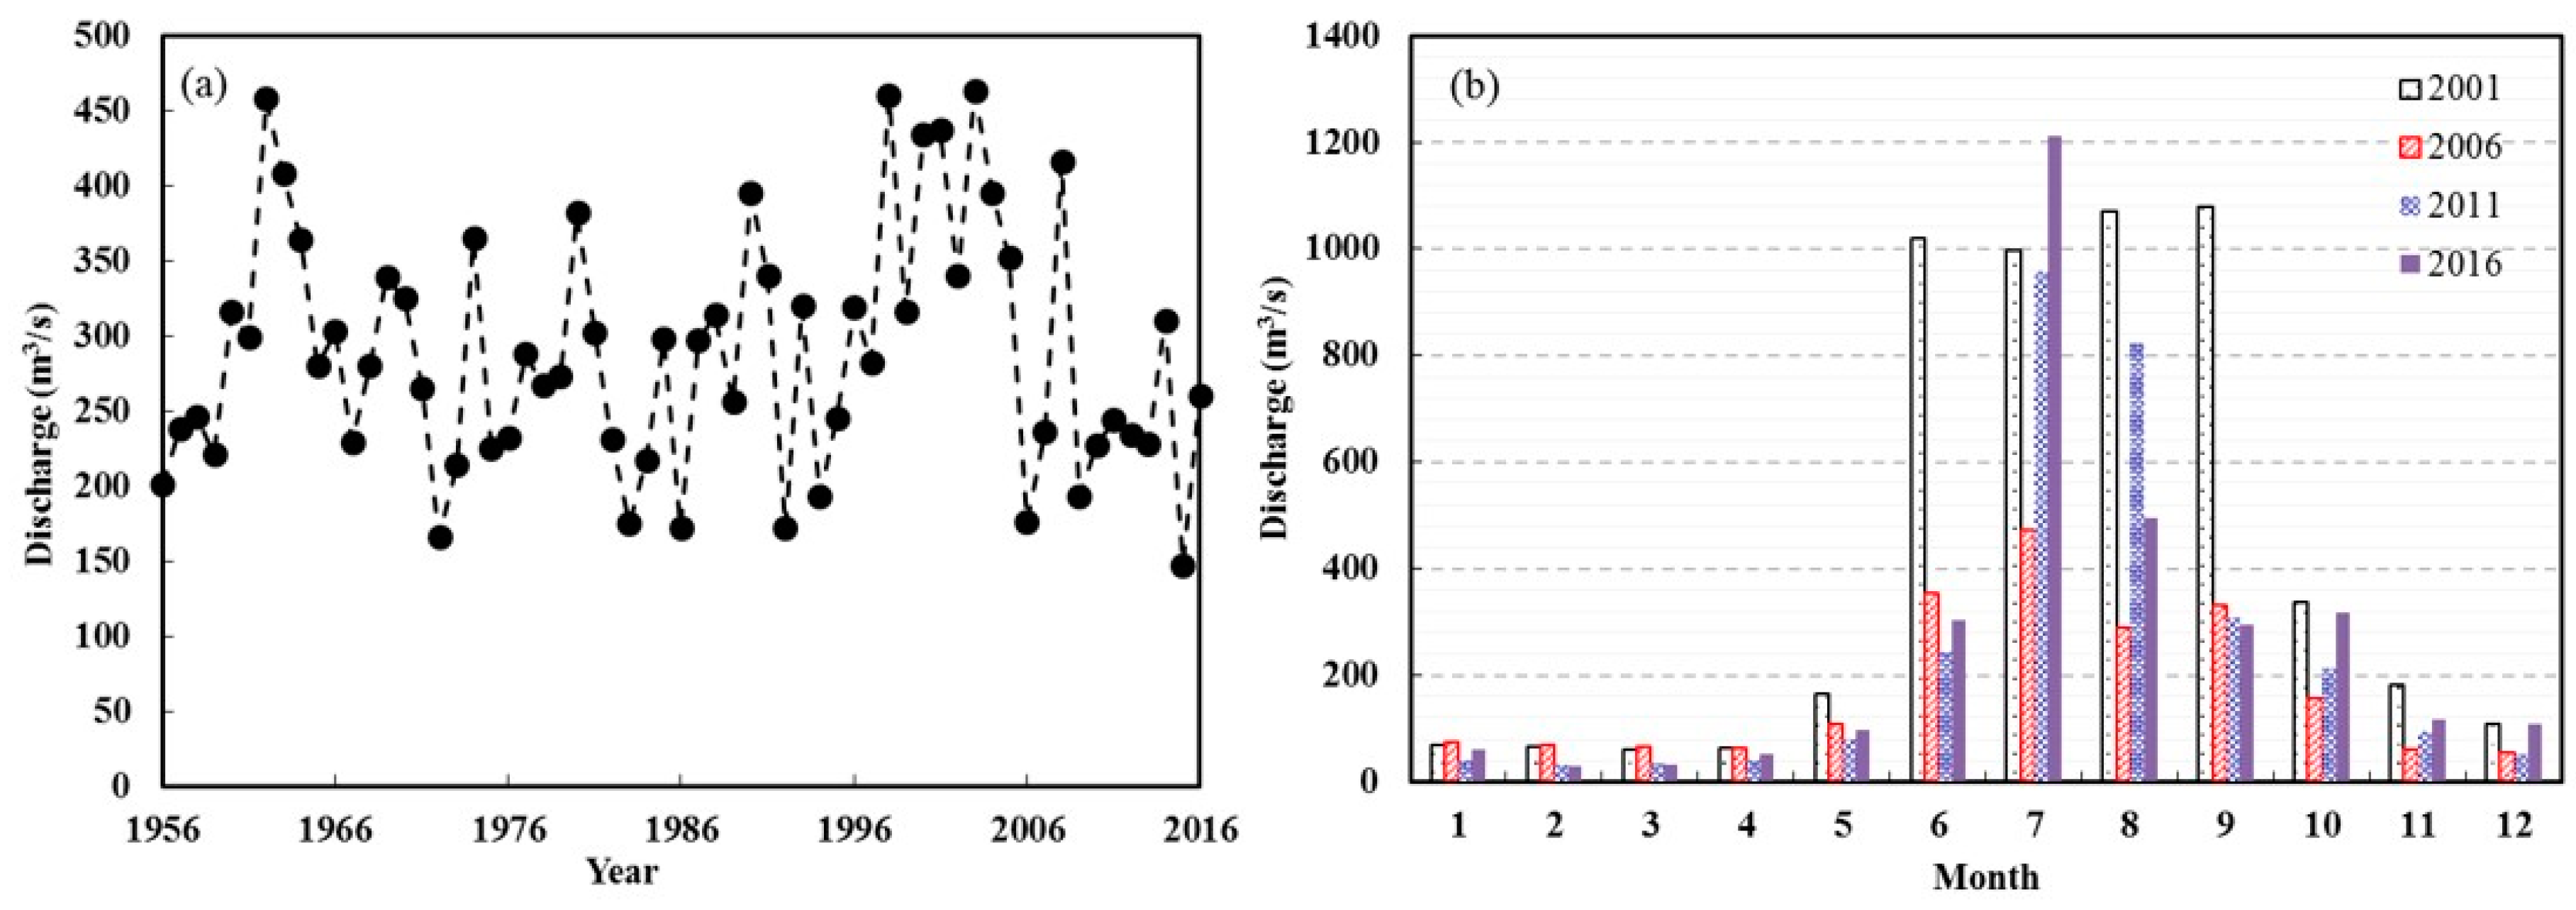
Mean annual discharge rate from 1956 to 2016 was 288.2 m3/s (Figure 4a). About 15.5% of it was attributed to the three above-mentioned tributaries based on the data from another station immediately below the dam (not shown here). The annual runoff had no obvious trend in the past 60 years even after 2006 when the Zhikong Dam was impounded [40]. The mean monthly discharge rate during the flood season (June–October) was 589.7 m3/s and the maximum discharge rate was 872.1 m3/s in August. During the dry season from November to May, the mean monthly discharge rate was 79.2 m3/s, only about 13.5% of that in the flood period. This large difference between the two seasons indicated that the change of braided channel morphology and riverine wetland dynamics mainly occurred in the flood period from June to October in the middle and lower Lhasa River.
The impoundment of Zhikong dam in 2006 changed the hydrological regime in the downstream Lhasa River. Monthly discharge in June, July, August and September in 1995–2005 decreased by 53.2%, 25.8%, 32.0% and 34.4% in comparison with that in the period of 2006–2016, respectively (Figure 4b). Moreover, the mean monthly discharge of the flood season in 1995–2005 was 844.7 m3/s, 34.4% higher than that in 2006–2010, which was 554.0 m3/s, indicating that the impoundment of Zhikong dam significantly decreased water discharges in the downstream channel during flood seasons.
3.2. Morphological Changes of the Downstream Braided Channel
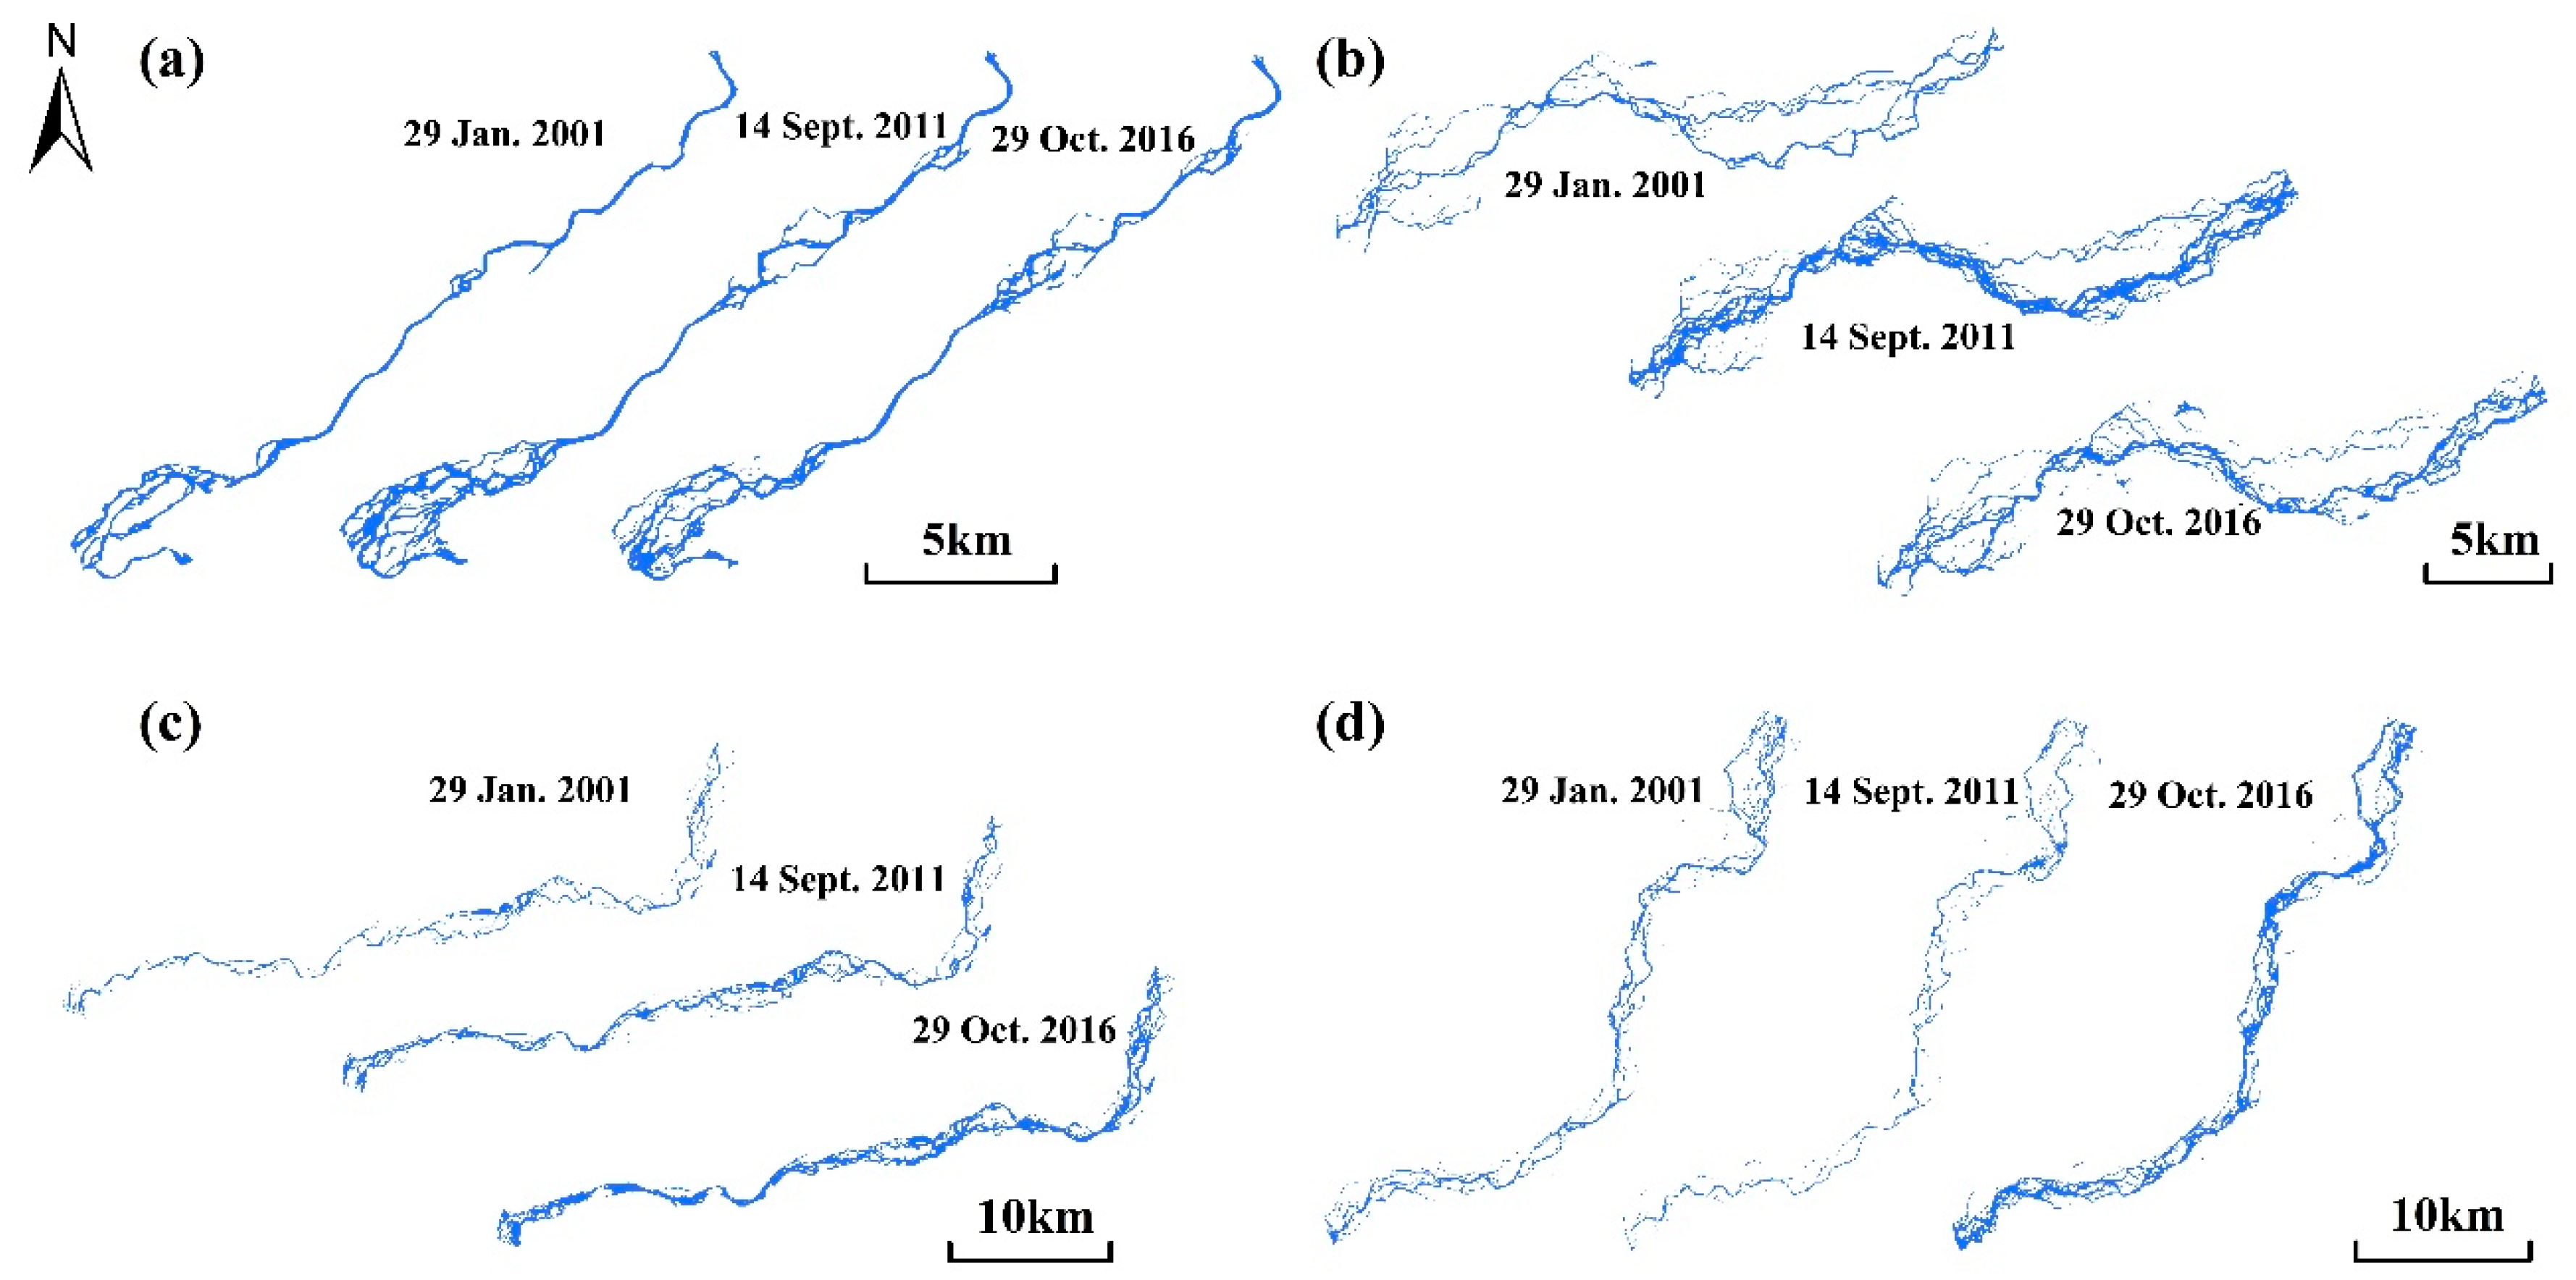
Covering periods of the pre- and post-construction of the Zhikong Dam, the images in 29 January 2001 (non-flooding period), 14 September 2011 (flooding period) and 29 October 2016 (non-flooding period) were used to analyze the different responses of the braided channel to the dam. In RS1, along the channel from the constrained single river reaches to the semi-constrained braided reaches, the number of channel branches apparently increased continuously from 2001 to 2016. Although such increase from 2011 to 2016 might be partially due to the lower water level in 2016 than that in 2011, it was obvious between 2011 and 2001 or 2016 and 2001, indicating the clear increase of central and side bars longitudinally after the dam construction (Figure 5a). About 5 km downstream of the dam, the originally single channel in 2001 became a braided channel with multiple branches in 2011. Similar change may be observed in the section toward the end of RS1 (Figure 5a).
In RS2, the number of braided branches increased greatly from 2001 to 2011, indicating a significant increase of the number of central and side bars after the dam construction. This increased number of braided branches from 2001 to 2011 within the same reach visually led to more fragmented bars in 2011 (Figure 5b). The apparent decrease of the number of braided branches in 2016 was mainly caused by the fact that water level was higher (in October) than that in 2011 (in September) (Figure 5b). In RS3, comparison of the size of the reach in three different periods showed that the extent of the downstream section of the reach tended to be reduced from 2001 to 2011 and remained unchanged afterward (Figure 5c). This change mainly reflected the impact of urbanization encroachment in Lhasa City. Our field observation three times in 2017–2018 showed that RS4 was an unconstrained braided river with many unstable bars or vegetated islands. Comparison of its size and shape among the three selected years indicated that there were no discernable temporal changes, suggesting the significantly reduced impact of the dam on its morphology due to the longer distance (Figure 5d).
Areas of surface water in the 2001–2016 period were poorly correlated with the associated water discharges in RS1 with R2 = 0.294 (Figure 6). For RS2, this correlation increased greatly with R2 = 0.678. The two variables in RS3 and RS4 showed very strong correlations with R2 greater than 0.92. The higher correlations in RS3 and RS4 indicated that as the discharge in these two reaches changed, the area of surface water of the braided channels changed following a similar trend (i.e., either increase with increased discharges or decrease with decreased discharges). This nature indirectly suggested that morphological structures of the braided channels in RS3 and RS4 had limited change during the 2001–2016 period. Similarly, the less degreed correlation in RS2 implied that channel morphology has changed to certain degree during the same period, which is consistent with the change of the number of the braided channel branches described previously. Following this argument, the poor correlation in RS1 clearly suggested that both single-thread and braided channels in RS1 changed significantly. Since the hydrological regime in the studied reach has been changed by the dam operation, the identifiable morphologic changes in RS1 indicated that construction of the Zhikong Dam caused obvious morphologic changes of the channels in its nearest downstream reach (i.e., RS1). Yet, this impact attenuated longitudinally in the following downstream reach (i.e., RS2) and gradually disappeared further downstream in RS3 and RS4. This downstream trend was indirectly reflected by the increased R2 values for the relationship between the water body and discharge from RS2 to RS4 (Figure 6), which agreed well with those in the changed numbers of channels in all four reaches.
3.3. Braiding Intensity Indices in Response to the Reservoir Impoundment
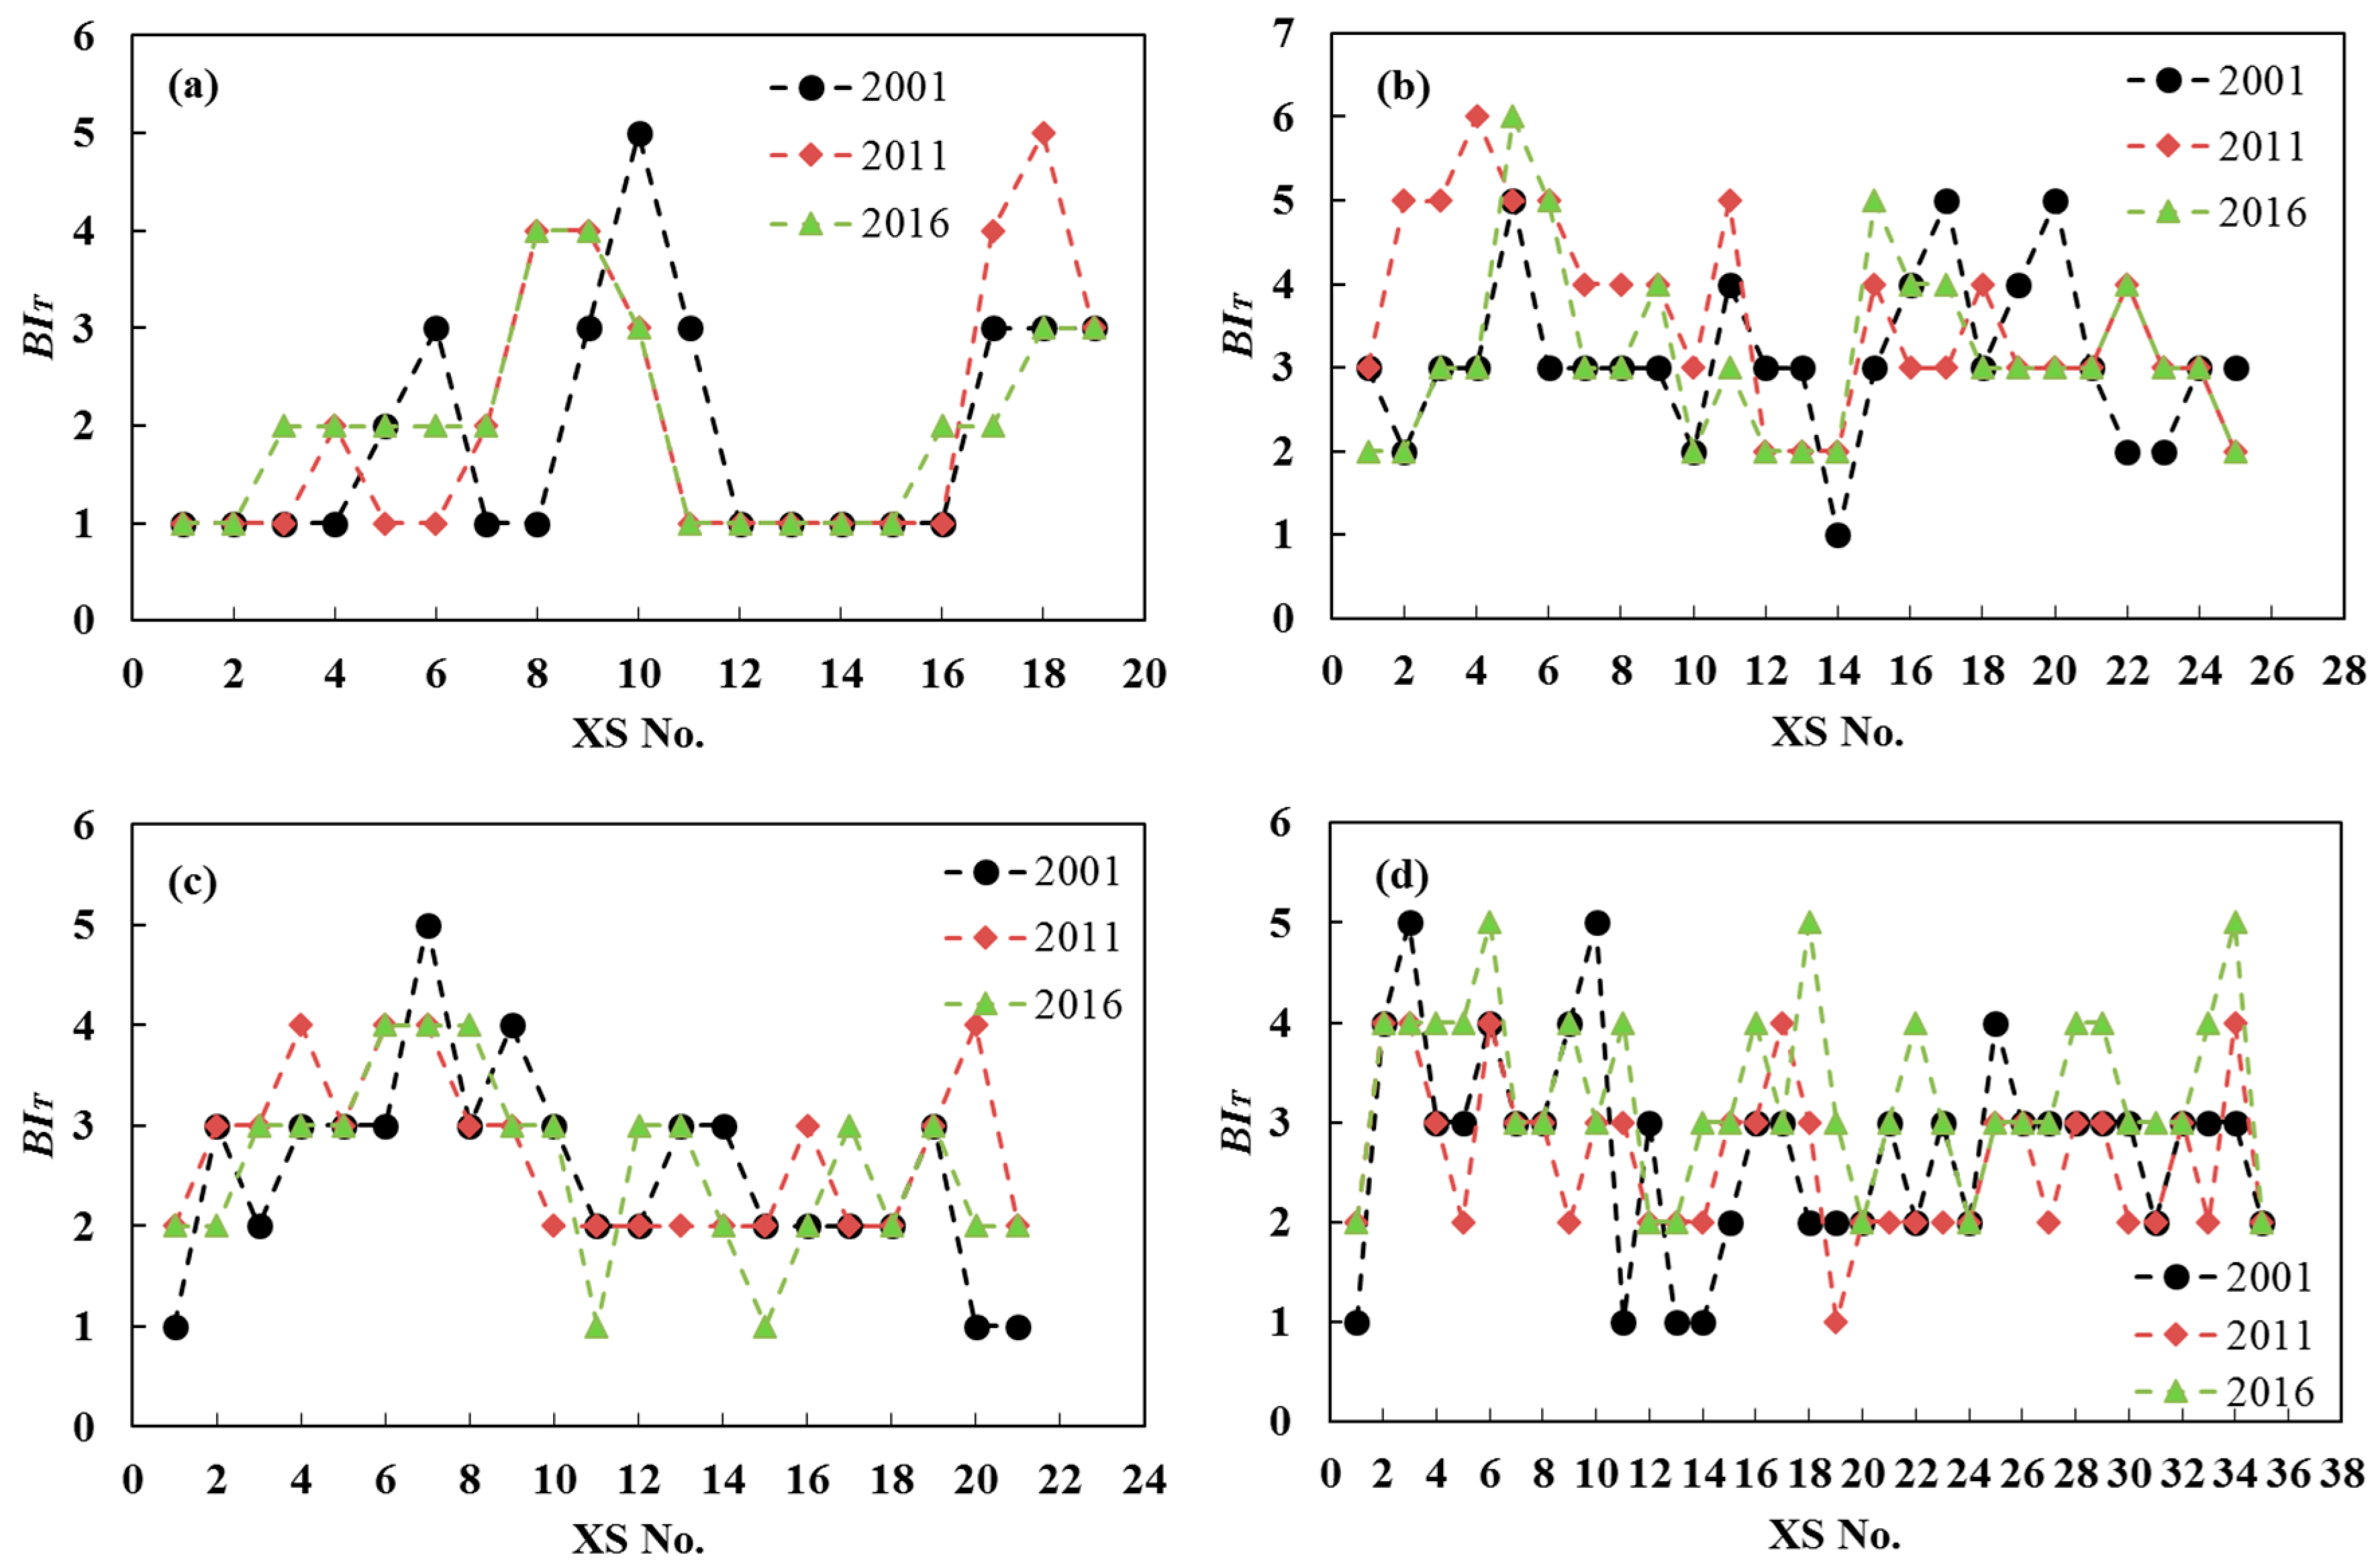
Branches and central bars are the most sensitive morphological units that respond to the reservoir impoundment. Their changes were reflected by the temporal changes of braiding number index (BIT) between the 2001–2011 and 2011–2016 periods (Figure 7). In RS1, values of BIT remained unchanged for XS1-2 and XS12-15, which belong to single-thread constrained channel segments located in narrow valleys. Other cross sections with multithread channels in other sections changed from 2001 to 2011. Specifically, BIT in XS3-4 increased by 1. Values of BIT changed the most in XS8-11 with the largest increase in XS8 by 3 and decrease in XS10-11 by 2 (Figure 7a). From 2011 to 2016, most cross sections experienced no change or a change of BIT by 1, while values of BIT in XS17-18 were reduced by 2.
In RS2, BIT of all multithread sections changed more or less in the 2001–2011 period (Figure 7b). In particular, BIT in XS2 and XS4 increased by 3, in XS3, XS6 and XS22 increased by 2, in XS17 and XS20 reduced by 2. Most of changed sections were located in the upper part of RS2, which is closer to the dam. In RS3, other than that BIT increased by 3 in XS20, all cross sections had minor changes in the 2001–2016 period (Figure 7c). In RS4, multithread channels in all cross sections changed randomly with no pronounced trend, which seemed to be consistent with the freely evolutional nature of this braided channel reach (Figure 7d). In summary, the change of BIT slightly decreased from RS1 to RS3 with that in RS4 roughly kept unchanged. This quantitative pattern indicated that as moving downstream away from the Zhikong Dam, branches and central bars of braided channel reaches were affected by the construction of Zhikong Dam less and less.
Changes of BIB in RS1 and RS4 were examined to compare the different dam impacts on the nearest and furthest downstream reaches (Table 2). From 2001 to 2011, BIB in RS1_DS2 and RS1_DS3 increased by 31.7% and 122.0%, respectively, which indicated that on average more central bars exposed after the Zhikong impoundment. From 2011 to 2016, BIB in RS1_DS2 merely increased by 13.2% but decreased by 45.0% in RS1_DS3. These changes showed that during the impoundment of the Zhikong Dam, the multithread channels of RS1 had generally undergone larger changes, which were reflected by the changes of bar lengths. The average change of BIB in three sections of RS4 from 2001 to 2016 was very limited, less than 38%, suggested that the dam impact on RS4 was hardly identifiable in the bar length index.
It is worth noting that values of BIB in RS4 were mostly 1.2–3.6 times higher than those in RS1 but the amplitude changes of BIB in RS4 tended to be smaller than those in RS1, again this might be because RS4 was about 110 km farther downstream of the Zhikong Dam than RS1. Moreover, major changes generally took place in RS1 and RS4 from 2001 to 2011, rather than the 2011–2016 period, demonstrated that the construction of Zhikong Dam on average had stronger impact on multithread channels in years immediately after the completion of the dam.
3.4. Inter- and Intra-Annual Changes of Local Braided Channel
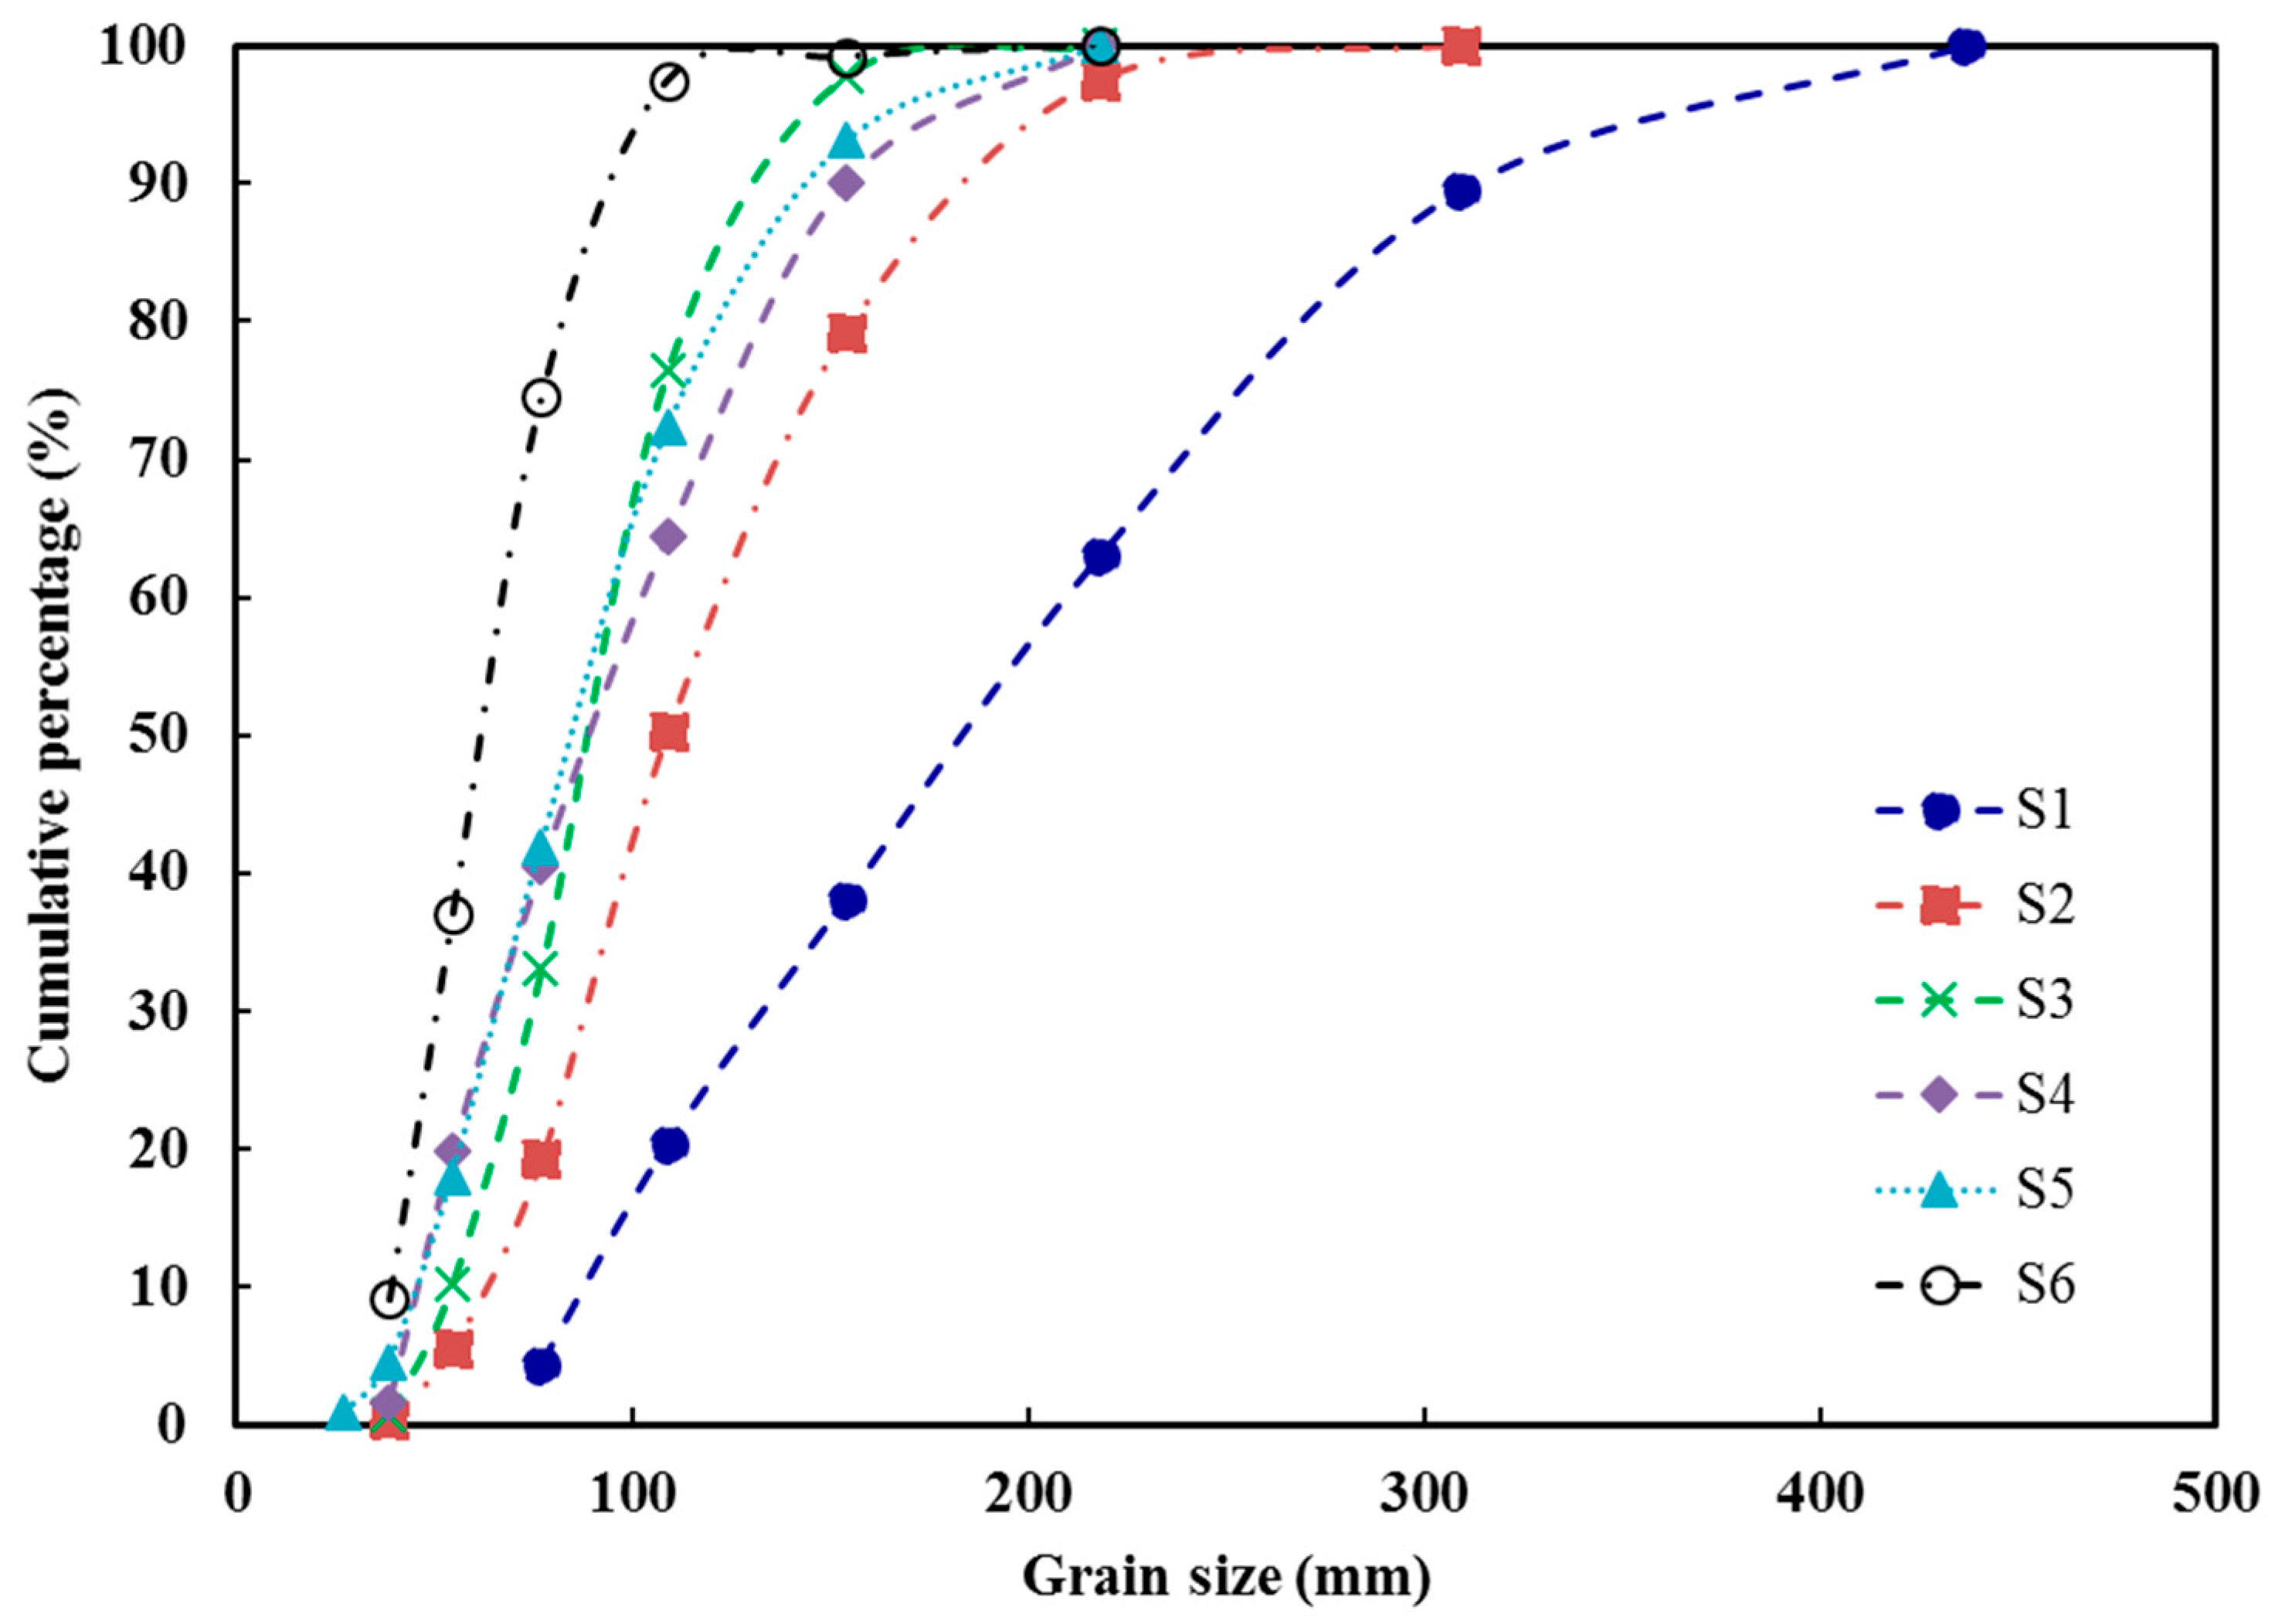
Particle size analysis showed that median size of gravels and boulders (D50) decreases along the channel below the dam (i.e., 210, 130, 100, 100, 99 and 71 mm from S1 to S6) (Figure 8). Given that these six sites were located in RS1 and RS2 (Figure 1b), the decreasing trend of D50 indicated that the gravel bed materials in RS1 and RS2 were coarsened. In addition to the change of particle sizes, morphological changes of RS1_B1 and RS2_B2 (Figure 1c,d) during the 2001–2016 period (Figure 9) further revealed local responses of the braided channel to the Zhikong Dam.
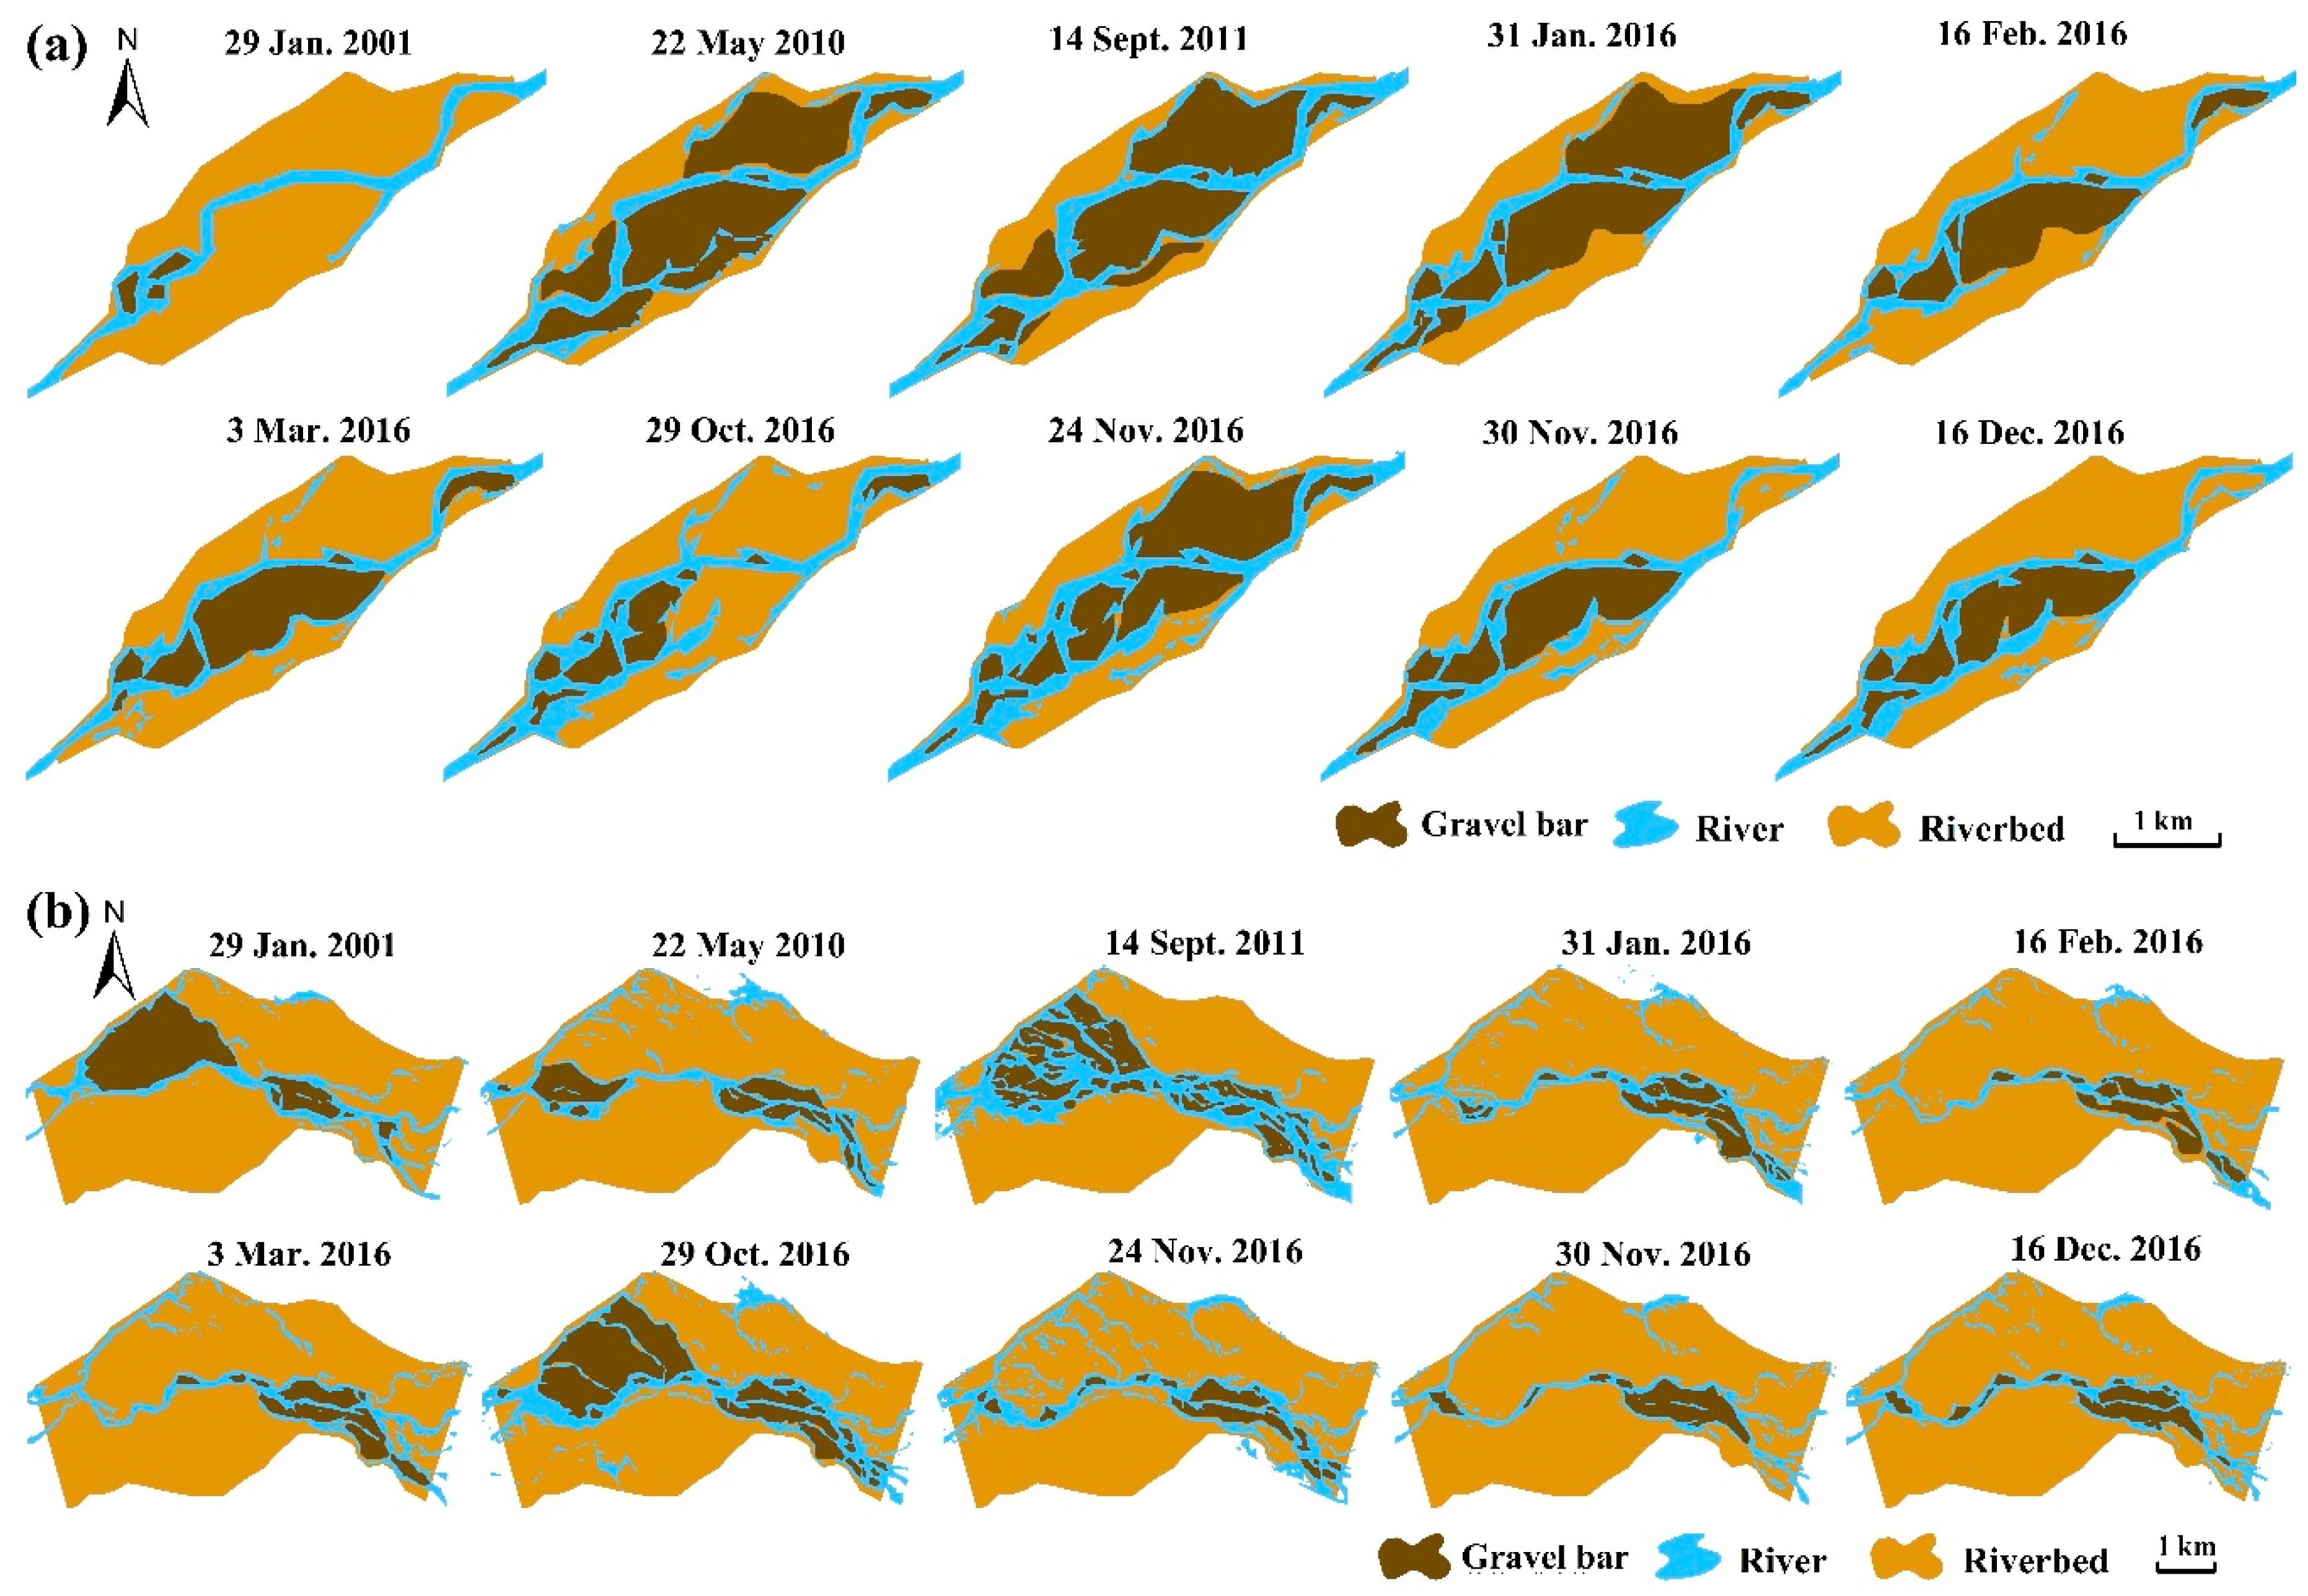
Comparing morphological structures of RS1_B1 in 2001, 2010, 2011 and 2016 indicated that bar number and branches tended to increase from 2001 to 2011 and then changed little from 2011 to 2016 but the inactive sidebars and main channel had little change for the entire period (Figure 9a). Furthermore, the intra-annual morphological changes of RS1_B1 in 2016 demonstrated repeated dissection and adjustment of central bars and formation or disappearance of branches, signifying a strong response of the braided channel reach to the operation of Zhikong Dam. In comparison with the braided channel in non-flood seasons, RS1_B1 had more active central bars and branches on 31 January 2016 than those on 29 January 2001 because the regularized discharge release (meaning much less degree of seasonal changes of discharge rates) from the Zhikong Dam helped maintain relatively lower water depths in non-flood season. Inter- and intra-annual morphological changes in RS2_B2 demonstrated a similar trend to that in RS1_B1 (Figure 9b) but the discrepancy of active bars and branches on 31 January 2016 and 29 January 2011 was not obvious because the distance of RS2_B2 to Zhikong Dam was farther than that of RS1_B1.
The middle part of RS1_B1 was a wide and shallow braided channel and thus its morphological structure of bars and branches was relatively simple (Figure 9a). Yet, the channel morphology of RS2_B2 was more complicated than that of RS1_B1. Moreover, braided channels in RS2_B2 was out of phase with alternatively wide and narrow sections and the number of small patches (or bars) in RS2_B2 were generally 2–4 times greater than that in RS1_B1, while the patch density in RS2_B1 was 1.2–4.8 times higher than that in RS1_B2 (Table 3). Temporal changes of patch number and density in RS1_B1 may reflect variable discharges and the undulation of water levels. In winter, 2001, the patch density of central bars was 0.6, which was small. In dam operation, more bars in RS1-B1 were exposed or developed obviously from 2010 to 2016, evidenced by the increase of patch density from 0.6 to 1.7. By contrast, the patch density in RS2_B2 was increased from 0.3 to 0.8, which was possibly caused by dividing the large-area bars into multiple patches of smaller sizes (Figure 9b). The average area of bars in 2001 was 3.11 km2. It was then decreased to 1.71 km2 due to the fragmentation of central bars in 2010–2016.
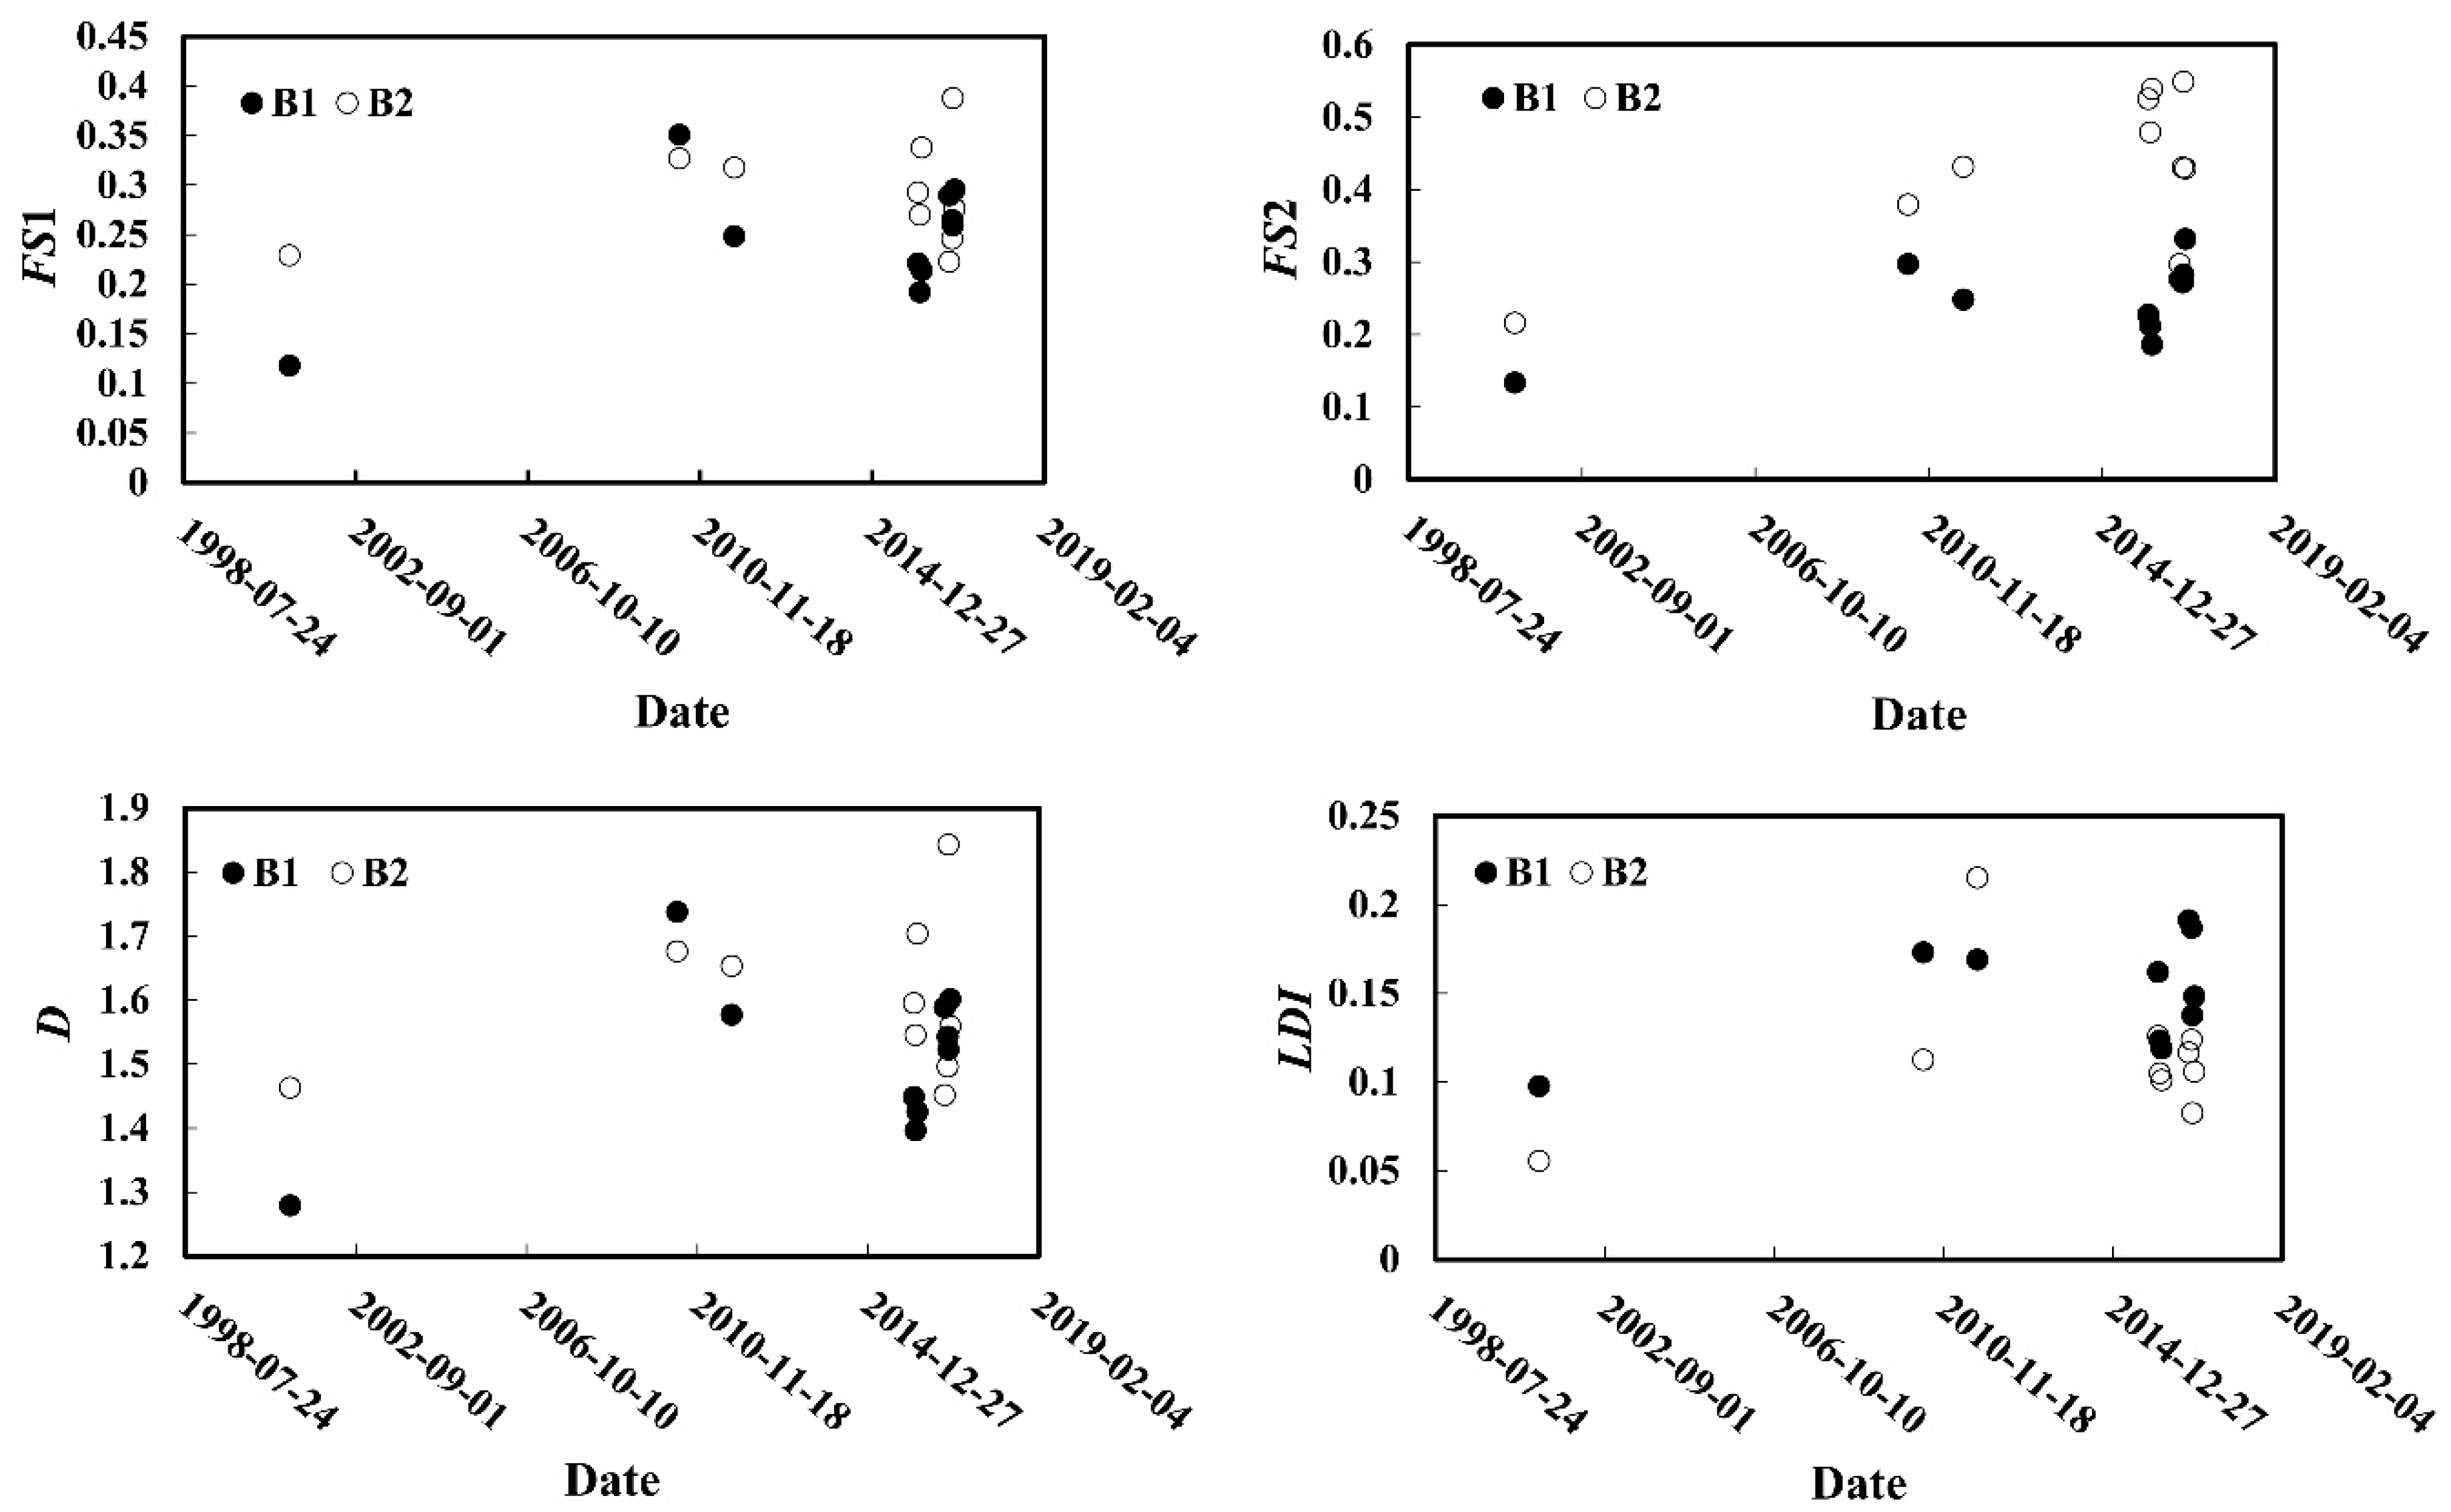
Calculated landscape pattern indices showed that the changing trend of the four indices of RS1_B1 and RS2_B2 had a similar increasing trend (Figure 10). Both the mean dissection index D and landscape dissection index LDI in RS1_B1 and RS1_B2 showed an increasing trend from 2001 to 2010–2016. In 2001, D and LDI were 1.28 and 0.098 in RS1_B1, while 1.46 and 0.056 in RS2_B2, respectively. In 2010–2016 they were 1.54 and 0.16 in RS1_B1 and 1.61 and 0.12 in RS2_B2, respectively. Temporal changes of D and LDI indicated that the degree of fragmentation of central bars in 2010–2016 was higher than that in 2001 (Figure 10). Meanwhile, the fragmentation shape index (i.e., FS1 and FS2) also showed an increasing trend, indicating that central bars changed greatly in an irregular shape likely indicating the clean water release of Zhikong Dam eroded the downstream riverbed of braided channel. The similar temporal trends of these four indices not only mutually verified the above-mentioned nature of the changes of fragmentation but also quantitatively revealed the downstream effect of the dam on the local channel segments.
4. Discussion
4.1. Reliability and Uncertainty of Downstream Braided Channel Adjustment
This study investigated morphology changes of the downstream braided channel reach below the Zhikong Dam based on historical Landsat images. These changes were complex because the interaction of irregular bars and water level were very dynamic after the dam construction. The reliability of extracting braided channel morphology from remote sensing images depends on the available time series of the images and their resolution, the classification criteria of active channel boundaries, particularly the effect of water levels on extracted areas [47,48,49,50,51,52,53]. According to the results of braided intensity indices and fragmentation indices, RS1 had the strongest response to the Zhikong Dam. However, subject to the limited availability of remote sensing images, the images used in this study were in July 2001, May 2010, September 2011 and 2016. Therefore, there existed a large degree of uncertainty in the information extracted due to the naturally different water levels among different months of the same year. One of them is comparing morphological characteristics of the four study reaches in the 10-year period (i.e., 2001–2010) with those in the following 5-year period (i.e., 2011–2016). We argue that our comparison was not for attempting to establish an empirical model of quantifying rates of the morphological changes over the entire study period, rather, for illustrating channel morphological adjustment after dam construction. The fact that data in the first 10-year period represented the morphological features of the study reaches before existence of the dam and those in the second 5-year period stood for those after the dam assured the reliability of our comparison. In the future, however, more multi-period and multi-source images should be used to avoid this type of uncertainty.
Another uncertainty tied to the response of braided channel to the dam construction is how to separate the effect of natural processes on the adjustment of the downstream braided channel from that of the dam. In other words, even if no reservoir was built upstream, the current downstream braided channel should have been continuously adjusted in flood and non-flood periods [22,54,55,56,57]. The greatest downstream impact of reservoirs is intercepting sediment load and reducing water level in flood seasons, which not only reduces sediment source of central and side bars but also weakens the intensity of riverbed adjustment. Therefore, though some degree of morphology adjustment may be due to regular hydrological changes, our results still clearly showed that operation of the Zhikong Dam lead to more bar exposition during flood seasons, prompting more vegetation encroachment and growth on bars and islands. The degree of such impact has decreased along the channel, such that this impact was barely identified in RS3 and RS4 (Figure 5 and Figure 7). This highlights the importance of comparing the fragmentation indices of local segments (i.e., RS1_B1 and RS_B2) because they are closer to the dam and hence were more sensitive to the changed hydrological and sediment regimes due to the dam. This logic was confirmed by our results that the change of four indices in the two segments were different (Figure 9 and Figure 10).
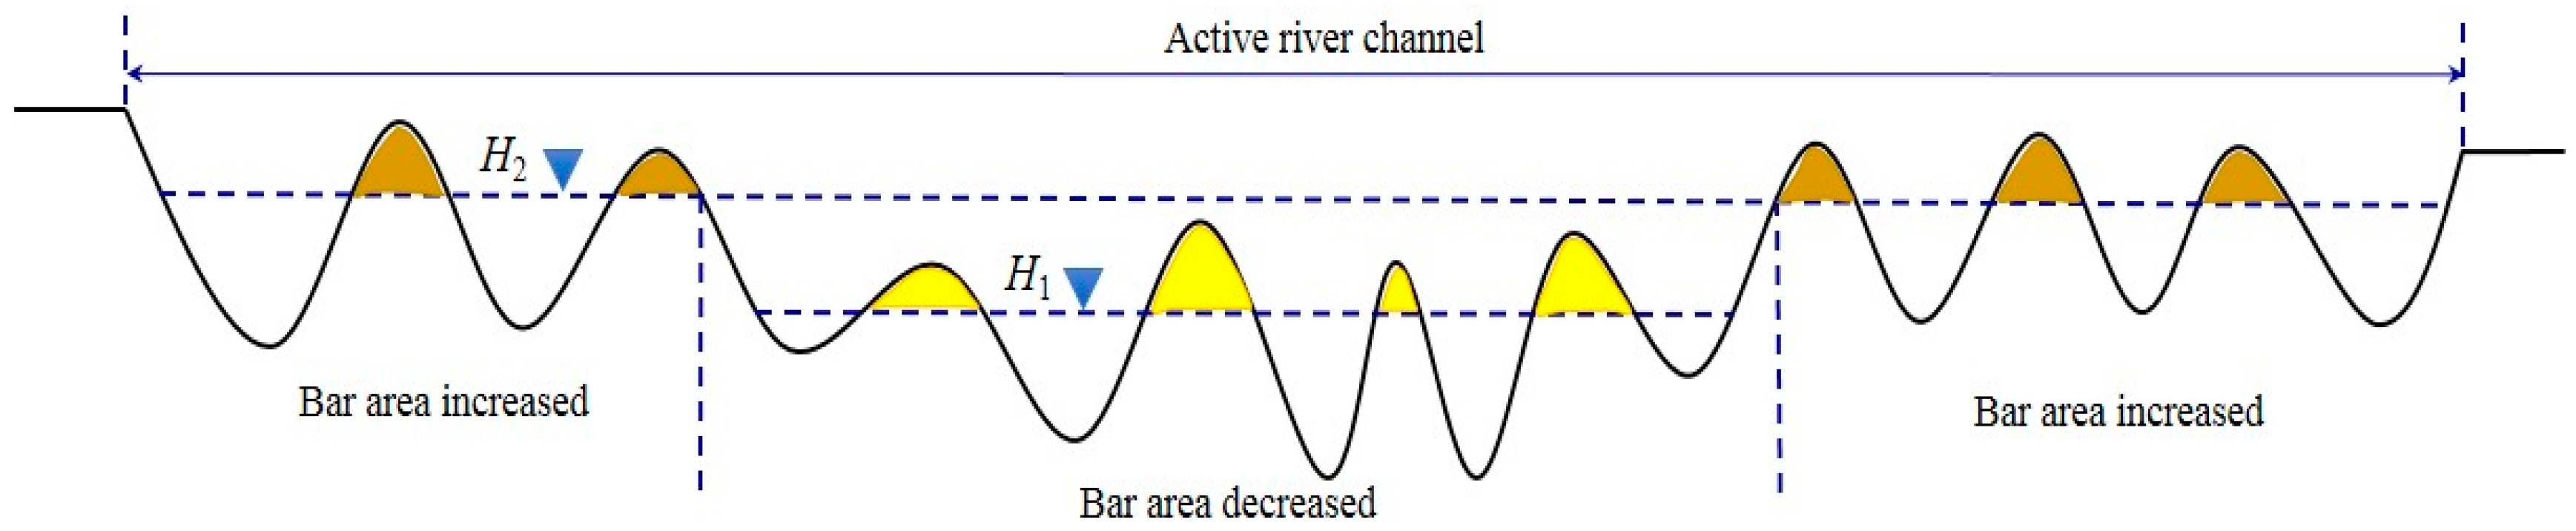
The final uncertainty concerned the fact that the number of bars and branches was not a monotonic function of water level. Discharge increase may lead to decrease of the bar number in the main active channel but increase of the bar number in partially active channels close to both banks (Figure 11). Specifically, the complexity of water level changes caused by the operation and management of the Zhikong Dam was the consequence of two opposite effects in braided reaches: (1) reducing the released discharge in flood season and (2) increasing the released discharge in non-flooding season (Figure 11). The former may either reduce the bar number by scouring or increase the bar number by lowering water level in the entire active river channel. Similarly, the latter may reduce the bar number by increasing water level, which may submerge more bars in the active main channel or increase the bar number by raising water level in the entire active channels, which expand the lateral extent of the active channels. This complex dynamic needs to be studied further with more process-based data on riverbed topography.
4.2. Comparison of Lhasa River with Other Dammed Rivers
The downstream impacts of the Zhikong Reservoir on the middle and lower Lhasa River are different from many other rivers below a dam around the world. First, the Zhikong Dam entrapped the majority of sediment load to the lower Lhasa River because the control basin area of Zhikong Dam is 62% of the whole Lhasa River basin. This makes it different from the downstream Snake River below the Jackson Lake Dam where sediment load from the upstream river was partly trapped by the dam [36]. Second, the downstream channels influenced by large dams in most previous studies are single-thread rivers (e.g., bedrock or meandering channels) [36,37] or multi-thread channels with a sand bed [58]. Nevertheless, the alluvial channel below the Zhikong Dam is mainly wide and shallow gravel-bed braided channel with more active lateral spaces than those of the single-thread ones. Morphological changes and braiding indices of the long multithread, gravel-bed channel in response to the reservoir impoundment are much more difficult to be quantified. For instance, aerial photo-based studies on the Snake River and field-based studies on the Piave River below a dam demonstrated the substantial morphological change occurred in the multithread channels. In the former, the change of downstream channel below the Jackson Lake Dam was complex over time along the channel [36], whereas in the latter, river pattern of the multithread reaches was transitioned from braided to wandering channel owing to the dam construction [37]. These two examples demonstrated that a dam may not only produce more complex morphological adjustment of downstream multithread channel than that in single-thread channel but also lead to the transition of river pattern types, for example, a braided channel transitioned to a relatively stable anabranching channel in the middle of Hanjiang River after the impoundment of the Danjiangkou Reservoir in 1968 [58,59].
4.3. Management Implication of the Downstream Morphological Adjustment
Alluvial rivers (meandering, braided and anabranching) at low altitudes have also experienced morphological responses to upstream cascaded reservoirs, which are typically represented by riverbed incision, bank collapse and bar erosion [20,27,29,30,60,61]. However, the Lhasa River is located in areas with high altitudes. Its middle reach downstream the Zhikong Dam is a typical braided river with the bed mainly covered by coarse sand and gravels. Therefore, its morphological responses were mainly manifested as relatively weak bed incision and intense bar erosion. This character of channel adjustment had unique implications on establishing new riverine wetlands and reservoir operation.
At low water levels, numbers and areas of (side and central) bars and islands might be increased, whereas at high water levels, the opposite case occurs (Figure 11). This pattern indicates that more physical habitats are possibly available during relatively low flows. Nonetheless, the increased physical habitats are insufficient to guarantee the development of new riverine wetlands as vegetation growth on these bars require nutrients that are typically attached to fine sediments. The arrival of these fine sediments from the reservoir to these bars and islands relies on relatively high flows that may carry enough fine sediments to the downstream reach. In addition, fine sediments with rich nutrients may be also carried downstream partly by natural high flows from the three tributaries to the study reach (Figure 1b). Consequently, it is important to understand the coupling effect between the dam-altered hydrological regime in the main channel of the study reach and the natural flow regimes in the three tributaries within the studied reach. This would provide valuable scientific guidelines on the optimum reservoir operation that can achieve its multiple roles including flood control, agricultural irrigation and reestablishment of new braided riverine wetlands.
5. Conclusions
Using Landsat and Google Earth images during the 2001–2016 period as data sources, together with field survey conducted the 2017–2018 period, we investigated the downstream braided channel before and after the impoundment of the Zhikong Dam in Lhasa River. Despite some uncertainty and complexity caused by the possibility of mixed impacts from the dam and natural fluvial processes in the middle and lower Lhasa River, our findings from qualitative description and quantitatively analysis of images are valuable for understanding the downstream impacts of the Zhikong Dam associated with braided channel adjustment, which are summarized as follows: (i) More central bars in RS1 were exposed in comparison with other three reaches due to riverbed erosion in the main channel and released discharge decreased by the Zhikong Reservoir; (ii) the median size of gravel riverbed approaching the dam was coarser twice than that at the end of RS1 and about three times than at the end of RS2 twelve years after dam completion (i.e., in 2018); (iii) Attenuated downstream response to the Zhikong Dam along the channel was identified from channel morphological change (braiding number and bar length indices); (iv) Inter- and intra-annual changes of two local braided channels (RS1_B1 and RS2_B2) also confirmed the attenuated downstream impacts. Large bars were split into multiple patches of different sizes, such that the mean dissection, landscape dissection and fragmentation indices increased consistently after the dam construction. This study is of significance for understanding similar scenarios of the downstream impacts below a dam in other plateau rivers.
Author Contributions
Conceptualization, Z.L. and P.G.; Methodology, Z.L. and X.W.; Software, X.W.; Formal Analysis, Z.L., X.W. and P.G.; Investigation, Z.L.; Resources, C.H.; Data Curation, X.W. and C.H.; Writing-Original Draft Preparation, Z.L, P.G. and X.W.; Writing-Review & Editing, P.G.; Project Administration, Z.L.; Funding Acquisition, T.H.
Funding
This research was funded by [National Natural Science Foundation of China] grant number [91647204, 51709020, 51622901]; [Open Project of State Key Laboratory of Plateau Ecology and Agriculture, Qinghai University] grant number [2017-KF-01]; [Project of Qinghai Science & Technology Department] grant number [2016-ZJ-Y01, 2017-HZ-802] and [Natural Science Foundation of Hunan Province] grant number [2018JJ3547].
Acknowledgments
We thank Mengya Jia and Yuchi You for processing images and Jing Liu, Yuan Ma and Xinya Yuan for three field investigations in 2017 and 2018. We also thank two anonymous reviewers and editors for constructive suggestions and comments.
Conflicts of Interest
The authors declare no conflicts of interest.
References
- Jiang, T.; Fischer, T.; Lu, X.X.; He, H. Larger Asian rivers: Impacts from human activities and climate change. Quat. Int. 2015, 380–381, 1–4. [Google Scholar] [CrossRef]
- Yu, G.A.; Brierley, G.; Huang, H.Q.; Wang, Z.; Blue, B.; Ma, Y. An environmental gradient of vegetative controls upon channel planform in the source region of the Yangtze and Yellow Rivers. Catena 2014, 119, 143–153. [Google Scholar] [CrossRef]
- Gran, K.B.; Tal, M.; Wartman, E.D. Co-evolution of riparian vegetation and channel dynamics in an aggrading braided river system, Mount Pinatubo, Philippines. Earth Surf. Process. Landf. 2015, 40, 1101–1115. [Google Scholar] [CrossRef]
- Ligon, F.K.; William, E.D.; William, J.T. Downstream ecological effects of dams. Bioscience 1995, 45, 183–192. [Google Scholar] [CrossRef]
- Nilsson, C.; Jansson, R.; Zinko, U. Long-term responses of river-margin vegetation to water-level regulation. Science 1997, 276, 798–800. [Google Scholar] [CrossRef] [PubMed]
- Zhang, Y.; Wang, G.; Wang, Y. Changes in alpine wetland ecosystems of the Qinghai-Tibetan plateau from 1967–2004. Environ. Monit. Assess. 2011, 180, 189–199. [Google Scholar] [CrossRef] [PubMed]
- Blue, B.; Brierley, G.; Yu, G.A. Geodiversity in the Yellow River source zone. J. Geogr. Sci. 2013, 23, 775–792. [Google Scholar] [CrossRef]
- Wang, Z.; Li, Z.; Xu, M.; Yu, G. River Morphodynamics and Stream Ecology of the Qinghai-Tibet Plateau; CRC Press, Taylor & Francis Ltd.: Abingdon, UK, 2016. [Google Scholar]
- Zhang, Y.L.; Wang, C.L.; Bai, W.Q.; Wang, Z.F.; Tu, Y.L.; Yangjaen, D.G. Alpine wetlands in the Lhasa River Basin, China. J. Geogr. Sci. 2010, 20, 375–388. [Google Scholar] [CrossRef] [Green Version]
- Asaeda, T.; Siong, K.; Kawashima, T.; Sakamoto, K. Growth of Phragmites Japonica on a sandbar of regulated river: Morphological adaptation of the plant to low water and nutrient availability in the substrate. River Res. Appl. 2009, 25, 874–891. [Google Scholar] [CrossRef]
- Kellogg, C.H.; Zhou, X.B. Impacts of the construction of a large dam on riparian vegetation cover at different elevation zones as observed from remotely sensed data. Int. J. Appl. Earth Obs. Geoinf. 2004, 32, 19–34. [Google Scholar] [CrossRef]
- Li, X.; Xu, L. Feature of riparian soil elements induced by hydropower development in Lhasa River. Environ. Sci. Technol. 2015, 38, 148–156. [Google Scholar]
- Pan, B.; Wang, H.; Li, Z.; Ban, X.; Liang, X. Macroinvertebrate assemblages in relation to environments in the Dongting Lake, with implications for ecological management of river-connected lakes affected by dam construction. Environ. Prog. Sustain. Energy 2017, 36, 914–920. [Google Scholar] [CrossRef]
- Shi, W.; Chen, Q.; Yi, Q.; Yu, J.; Ji, Y.; Hu, L.; Chen, Y. Carbon emission from cascade reservoirs: Spatial heterogeneity and mechanisms. Environ. Sci. Technol. 2017, 51, 12175–12181. [Google Scholar] [CrossRef] [PubMed]
- Dai, H.; Zheng, T.; Liu, D. Effects of reservoir impounding on key ecological factors in the Three Gorges Region. Procedia Environ. Sci. 2010, 2, 15–24. [Google Scholar] [CrossRef]
- Guo, W.; Wang, H.; Xu, J.; Xia, Z. Ecological operation for Three Gorges Reservoir. Water Sci. Eng. 2011, 4, 143–156. [Google Scholar]
- Lian, J.; Yao, Y.; Ma, C.; Guo, Q. Reservoir operation rules for controlling algal blooms in a tributary to the impoundment of Three Gorges Dam. Water 2014, 6, 3200–3223. [Google Scholar] [CrossRef]
- Shi, R. Ecological environment oroblems of the Three Gorges Reservoir area and countermeasures. Procedia Environ. Sci. 2011, 10, 1431–1434. [Google Scholar] [CrossRef]
- Surian, N.; Rinaldi, M. Morphological response to river engineering and management in alluvial channels in Italy. Geomorphology 2003, 50, 307–326. [Google Scholar] [CrossRef] [Green Version]
- Casado, A.; Peiry, J.L.; Campo, A.M. Geomorphic and vegetation changes in a meandering dryland river regulated by a large dam, Sauce Grande River, Argentina. Geomorphology 2016, 268, 21–34. [Google Scholar] [CrossRef] [Green Version]
- Csiki, S.J.C.; Rhoads, B.L. Influence of four run-of-river dams on channel morphology and sediment characteristics in Illinois, USA. Geomorphology 2014, 206, 215–229. [Google Scholar] [CrossRef]
- Draut, A.E.; Logan, J.B.; Mastin, M.C. Channel evolution on the dammed Elwha River, Washington, USA. Geomorphology 2011, 127, 71–87. [Google Scholar] [CrossRef]
- Graf, W.L. Downstream hydrologic and geomorphic effects of large dams on American rivers. Geomorphology 2006, 79, 336–360. [Google Scholar] [CrossRef]
- Ma, Y.; Huang, H.Q.; Nanson, G.C.; Li, Y.; Yao, W. Channel adjustments in response to the operation of large dams: The upper reach of the lower Yellow River. Geomorphology 2012, 147–148, 35–48. [Google Scholar] [CrossRef]
- Phillips, J.D.; Slattery, M.C.; Musselman, Z.A. Channel adjustments of the lower Trinity River, Texas, downstream of Livingston Dam. Earth Surf. Process. Landf. 2005, 30, 1419–1439. [Google Scholar] [CrossRef]
- Raslan, Y.; Salama, R. Development of Nile River islands between old Aswan dam and new Esna barrages. Water Sci. 2015, 29, 77–92. [Google Scholar] [CrossRef]
- Smith, V.B.; Mohrig, D. Geomorphic signature of a dammed Sandy River: The lower Trinity River downstream of Livingston Dam in Texas, USA. Geomorphology 2017, 297, 122–136. [Google Scholar] [CrossRef]
- Wang, Z.Y.; Wu, B.; Wang, G. Fluvial processes and morphological response in the Yellow and Weihe Rivers to closure and operation of Sanmenxia Dam. Geomorphology 2007, 91, 65–79. [Google Scholar] [CrossRef]
- Xia, J.; Deng, S.; Zhou, M.; Lu, J.; Xu, Q. Geomorphic response of the Jingjiang Reach to the Three Gorges Project operation. Earth Surf. Process. Landf. 2017, 42, 866–876. [Google Scholar] [CrossRef]
- Xu, J. Evolution of mid-channel bars in a braided river and complex response to reservoir construction: An example from the middle Hanjiang River, China. Earth Surf. Process. Landf. 1997, 22, 953–965. [Google Scholar]
- Yang, S.L.; Milliman, J.D.; Xu, K.H.; Deng, B.; Zhang, X.Y.; Luo, X.X. Downstream sedimentary and geomorphic impacts of the Three Gorges Dam on the Yangtze River. Earth-Sci. Rev. 2014, 138, 469–486. [Google Scholar] [CrossRef]
- Baker, C.; Lawrence, R.L.; Montagne, C.; Patten, D. Change detection of wetland ecosystems using Landsat imagery and change vector analysis. Wetlands 2007, 27, 610–619. [Google Scholar] [CrossRef]
- Ji, D.; Wells, S.A.; Yang, Z.; Liu, D.; Huang, Y.; Ma, J.; Berger, C.J. Impacts of water level rise on algal bloom prevention in the tributary of Three Gorges Reservoir, China. Ecol. Eng. 2017, 98, 70–81. [Google Scholar] [CrossRef]
- Petts, G. Impounded Rivers: Perspectives for Ecological Management; Wiley: Chichebster, UK; New York, NY, USA, 1984. [Google Scholar]
- Petts, G.E.; Gurnell, A.M. Dams and geomorphology: Research progress and future directions. Geomorphology 2005, 71, 22–47. [Google Scholar] [CrossRef]
- Nelson, N.C.; Erwin, S.O.; Schmidt, J.C. Spatial and temporal patterns in channel change on the Snake River downstream from Jackson Lake dam, Wyoming. Geomorphology 2013, 200, 132–142. [Google Scholar] [CrossRef]
- Surian, N. Channel changes due to river regulation: The case of the Piave River, Italy. Earth Surf. Process. Landf. 1999, 24, 1135–1151. [Google Scholar] [CrossRef]
- Zhao, Q.; Liu, S.; Deng, L.; Dong, S.; Wang, C. Soil degradation associated with water-level fluctuations in the Manwan Reservoir, Lancang River Basin. Catena 2014, 113, 226–235. [Google Scholar] [CrossRef]
- Xiao, C.; Wang, J.; Zhao, J. Analysis and measures of ecological elements in Lhasha River basin. China Water Resour. 2009, 21, 29–31. (In Chinese) [Google Scholar]
- Lin, X.; Zhang, Y.; Yao, Z.; Gong, T.; Wang, H.; Chu, D.; Liu, L.; Zhang, F. The trend on runoff variations in the Lhasa River Basin. J. Geogr. Sci. 2008, 18, 95–106. [Google Scholar] [CrossRef]
- Egozi, R.; Ashmore, P. Defining and measuring braiding intensity. Earth Surf. Process. Landf. 2008, 33, 2121–2138. [Google Scholar] [CrossRef]
- Bai, J.; Hua, O.; Cui, B.; Wang, Q.; Chen, H. Changes in landscape pattern of alpine wetlands on the Zoige Plateau in the past four decades. Acta Ecol. Sin. 2008, 28, 2245–2252. [Google Scholar]
- Jaeger, J.A.G. Landscape division, splitting index, and effective mesh size new measures of landscape fragmentation. Landsc. Ecol. 2000, 15, 115–130. [Google Scholar] [CrossRef]
- Liu, H.Y.; Lv, X.G.; Zhang, S.K.; Yang, Q. Fragmentation process of wetland landscape in water sheds of Sanjiang Plain, China. Chin. J. Appl. Ecol. 2005, 16, 289–295. [Google Scholar]
- You, C.; Zhou, Y.B.; Yu, L.F. An introduction of quantitative methods in landscape pattern framentation. Chin. Agric. Sci. Bull. 2006, 22, 146–151. [Google Scholar]
- Bowen, G.W. A Quantitative Analysis of Forest Island Pattern in Selected Ohio Landscapes; University of Tennessee: Knoxville, TN, USA, 1981. [Google Scholar]
- Finch, J.W. Monitoring small dams in semi-arid regions using remote sensing and GIS. J. Hydrol. 1997, 195, 335–351. [Google Scholar] [CrossRef]
- Frazier, P.S.; Page, K.J. Water body detection and delineation with Landsat TM data. Photogramm. Eng. Remote Sens. 2000, 66, 1461–1467. [Google Scholar]
- Frazier, P.; Page, K.; Louis, J.; Briggs, S.; Robertson, A.I. Relating wetland inundation to river flow using Landsat TM data. Int. J. Remote Sens. 2003, 24, 3755–3770. [Google Scholar] [CrossRef]
- Nones, M.; Ronco, P.; Di Silvio, G. Modelling the impact of large impoundments on the Lower Zambezi River. Int. J. River Basin Manag. 2013, 11, 221–236. [Google Scholar] [CrossRef]
- Ritchie, J.C.; Schiebe, F.R.; Cooper, C.M. Remote sensing of off-Site downstream effects of erosion in freshwater lakes and reservoirs. Lake Reserv. Manag. 1989, 5, 95–100. [Google Scholar] [CrossRef]
- Sanford, J.P. Dam Regulation Effects on Sand Bar Migration on the Missouri River: Southeastern South Dakota. Master’s Thesis, University of Montana, Montana, MT, USA, 2007. [Google Scholar]
- Smith, L.C. Satellite remote sensing of river inundation area, stage, and discharge: A review. Hydrol. Process. 1997, 11, 1427–1439. [Google Scholar] [CrossRef]
- Boruah, S.; Gilvear, D.; Hunter, P.; Sharma, N. Quantifying channel planform and physical habitat dynamics on a large braided river using satellite data—The Brahmaputra, India. River Res. Appl. 2008, 24, 650–660. [Google Scholar] [CrossRef]
- Chien, N. Changs in river regime after the construction of upstream reservoirs. Earth Surf. Process. Landf. 1985, 10, 143–159. [Google Scholar] [CrossRef]
- Lane, S.N.; Westaway, R.M.; Murray Hicks, D. Estimation of erosion and deposition volumes in a large, gravel-bed, braided river using synoptic remote sensing. Earth Surf. Process. Landf. 2003, 28, 249–271. [Google Scholar] [CrossRef]
- Takagi, T.; Oguchi, T.; Matsumoto, J.; Grossman, M.J.; Sarker, M.H.; Matin, M.A. Channel braiding and stability of the Brahmaputra River, Bangladesh, since 1967: GIS and remote sensing analyses. Geomorphology 2007, 85, 294–305. [Google Scholar] [CrossRef]
- Xu, J. Wandering braided river channel pattern developed under quasi-equilibrium: An example from the Hanjiang River, China. J. Hydrol. 1996, 181, 85–103. [Google Scholar] [CrossRef]
- Pan, Q.; Zeng, J.; Ouyang, L. Fluvial process downstram of Danjiangkou Reservoir and its effect on the navigation channel. J. Hydraul. Eng. 1982, 8, 54–63. (In Chinese) [Google Scholar]
- Kotti, F.; Dezileau, L.; Mahe, G.; Habaieb, H.; Benabdallah, S. Impact of dams and climate on the evolution of the sediment loads to the sea by the Mejerda River (Golf of Tunis) using a paleo-hydrological approach. J. Afr. Earth Sci. 2018, 142, 226–233. [Google Scholar] [CrossRef]
- Piqué, G.; Batalla, R.J.; López, R.; Sabater, S. The fluvial sediment budget of a dammed river (upper Muga, southern Pyrenees). Geomorphology 2017, 293, 211–226. [Google Scholar] [CrossRef]
Figure 1.
(a) Location of Lhasa River basin; (b) Four study reaches (whose extents were reflected by four different colors) divided by the confluences of three tributaries in lower Lhasa River and six sediment sampling sites (photos of four reaches took in March 2017); (c) A focus area B1 in RS1 (marked in red); (d) Another focus area B2 in RS2 (marked in red).

Figure 2.
Diagrams of the parameters used for calculating braiding number and bar length indices (modified based on [41]).
Figure 2.
Diagrams of the parameters used for calculating braiding number and bar length indices (modified based on [41]).

Figure 3.
Simplified braided channels of the four reaches and the divided cross sections. The cross sections were named orderly from the first one in the upstream end (i.e., XS1) (a) RS1; (b) RS2; (c) RS3; (d) RS4.
Figure 3.
Simplified braided channels of the four reaches and the divided cross sections. The cross sections were named orderly from the first one in the upstream end (i.e., XS1) (a) RS1; (b) RS2; (c) RS3; (d) RS4.

Figure 4.
(a) Mean annual discharge rates of Lhasa station from 1956 to 2016; (b) Mean monthly discharge rates of Lhasa station in the four representative years (i.e., 2001, 2006, 2011 and 2016).
Figure 4.
(a) Mean annual discharge rates of Lhasa station from 1956 to 2016; (b) Mean monthly discharge rates of Lhasa station in the four representative years (i.e., 2001, 2006, 2011 and 2016).

Figure 5.
Morphological change of braided channel in four reaches along the channel in 2001, 2011 and 2016 (a) RS1; (b) RS2; (c) RS3; (d) RS4.
Figure 5.
Morphological change of braided channel in four reaches along the channel in 2001, 2011 and 2016 (a) RS1; (b) RS2; (c) RS3; (d) RS4.

Figure 6.
Relation between the mean daily discharge for each year from 2001 to 2016 at the Lhasa station and the area of surface water.
Figure 6.
Relation between the mean daily discharge for each year from 2001 to 2016 at the Lhasa station and the area of surface water.

Figure 7.
Changes of BIT values in four reaches along the channel (a) RS1; (b) RS2; (c) RS3; (d) RS4.
Figure 7.
Changes of BIT values in four reaches along the channel (a) RS1; (b) RS2; (c) RS3; (d) RS4.

Figure 8.
Grain size distributions of surface bed materials at six sites in RS1 and RS2.

Figure 9.
Morphological changes of local braided channel in RS1 and RS2 based on the remote sensing data. (a) RS1_B1; (b) RS2_B2.
Figure 9.
Morphological changes of local braided channel in RS1 and RS2 based on the remote sensing data. (a) RS1_B1; (b) RS2_B2.

Figure 10.
Changes of four landscape pattern indices in RS1_B1 and RS2_B2 during 2001–2016.

Figure 11.
Schematic diagram of impacts of water level rising on braided channel within active river channel of the middle and lower Lhasa River.
Figure 11.
Schematic diagram of impacts of water level rising on braided channel within active river channel of the middle and lower Lhasa River.


Table 1.
Basic features of four reaches and two active focused areas in RS1 and RS2 below Zhikong Dam.
Table 1.
Basic features of four reaches and two active focused areas in RS1 and RS2 below Zhikong Dam.
| Section No. | Channel Length (km) | Average Valley Width (km) | Channel Slope (%) | Channel Braiding |
|---|---|---|---|---|
| RS1 | 22.5 | 2.0 | 0.26 | single-thread and multithread reach |
| RS2 | 30.4 | 3.0 | 0.25 | multithread reach |
| RS3 | 54.3 | 1.5 | 0.17 | single-thread and multithread reach |
| RS4 | 43.3 | 1.8 | 0.10 | multithread reach |
| RS1_B1 | 5.3 | 1.8 | 0.26 | multithread reach |
| RS2_B2 | 6.6 | 3.0 | 0.25 | multithread reach |
Table 2.
Change of BIB in three equal distance segments in RS1 and RS4.
| Segment | RS1 | RS4 | ||||
|---|---|---|---|---|---|---|
| 2001 | 2011 | 2016 | 2001 | 2011 | 2016 | |
| DS1 | 1.502 | / | / | 5.358 | 5.877 | 6.049 |
| DS2 | 1.405 | 1.850 | 2.094 | 3.216 | 2.592 | 4.341 |
| DS3 | 1.658 | 3.681 | 2.025 | 3.589 | 4.290 | 4.175 |
Table 3.
Patch number and density in RS1_B1 and RS2_B2.
| Date | RS1_B1 | RS2_B2 | ||
|---|---|---|---|---|
| Patch Number | Patch Density (Number/km²) | Patch Number | Patch Density (Number/km²) | |
| 29 January 2001 | 3 | 0.60 | 6 | 0.30 |
| 22 May 2010 | 7 | 1.40 | 12 | 0.61 |
| 14 September 2011 | 10 | 2.40 | 40 | 2.03 |
| 31 January 2016 | 11 | 2.20 | 16 | 0.81 |
| 16 February 2016 | 6 | 1.20 | 10 | 0.51 |
| 3 March 2016 | 6 | 1.20 | 7 | 0.35 |
| 29 January 2016 | 10 | 2.00 | 22 | 1.12 |
| 24 November 2016 | 13 | 2.60 | 16 | 0.81 |
| 30 November 2016 | 6 | 1.20 | 5 | 0.25 |
| 16 December 2016 | 7 | 1.40 | 12 | 0.61 |
© 2018 by the authors. Licensee MDPI, Basel, Switzerland. This article is an open access article distributed under the terms and conditions of the Creative Commons Attribution (CC BY) license (http://creativecommons.org/licenses/by/4.0/).
Share and Cite
MDPI and ACS Style
Wu, X.; Li, Z.; Gao, P.; Huang, C.; Hu, T. Response of the Downstream Braided Channel to Zhikong Reservoir on Lhasa River. Water 2018, 10, 1144. https://doi.org/10.3390/w10091144
AMA Style
Wu X, Li Z, Gao P, Huang C, Hu T. Response of the Downstream Braided Channel to Zhikong Reservoir on Lhasa River. Water. 2018; 10(9):1144. https://doi.org/10.3390/w10091144
Chicago/Turabian StyleWu, Xinyu, Zhiwei Li, Peng Gao, Cao Huang, and Tiesong Hu. 2018. "Response of the Downstream Braided Channel to Zhikong Reservoir on Lhasa River" Water 10, no. 9: 1144. https://doi.org/10.3390/w10091144
Note that from the first issue of 2016, this journal uses article numbers instead of page numbers. See further details here.