Impact of Social Factors in Agricultural Production on the Crop Water Footprint in Xinjiang, China
by
 ,
,
Pei Zhang
1 ,
,
Xiaoya Deng
1,
Aihua Long
1,2,*,
Yang Hai
1,
Yang Li
1,
Hao Wang
1 and 
Hailiang Xu
3 1
State Key Laboratory of Simulation and Regulation of Water Cycle in River Basin, China Institute of Water Resources and Hydropower Research, Beijing 100038, China
2
College of Water Conservancy and Architectural Engineering, Shihezi University, Shihezi 832003, China
3
Xinjiang Institute of Ecology and Geography, Chinese Academy of Sciences, Urumqi 830011, China
*
Author to whom correspondence should be addressed.
Water 2018, 10(9), 1145; https://doi.org/10.3390/w10091145
Submission received: 29 May 2018
/
Revised: 19 August 2018
/
Accepted: 23 August 2018
/
Published: 27 August 2018
(This article belongs to the Section Water Use and Scarcity)
Abstract
:Irrigation plays an important role in China’s agricultural production, and a reasonable assessment of water resources consumption in agricultural production will contribute to improved agricultural water management practices. The objectives of this study were to analyze variations in the magnitude of the crop water footprint (CWF) in Xinjiang and determine the major factors that influence variation in order to provide proposals for water resources management. The CWF of Xinjiang from 1988 to 2015 was calculated, and the impacts of crop-planting structures, agricultural inputs, and water conservancy projects on agricultural water use were analyzed to evaluate the suitable amount of agricultural water utilization and area of farmland in Xinjiang. Results show that the magnitude of the CWF in Xinjiang significantly increased during the study period. Construction of water conservancy projects greatly facilitated water diversion and had the closest relationship with the growth of CWF. The appropriate water volume and planting area for agriculture in Xinjiang is calculated to be 39.4 billion m3 and 4.3 million ha, respectively, which are 73% and 65% of the current water consumption and cultivated area, respectively. These results can be used as a reference for reducing agricultural water consumption and the farmland area in Xinjiang.
1. Introduction
Agriculture is the main water consumption sector in China, accounting for about 60% of the total water use in the country. Irrigation water comprises more than 90% of the agricultural water use [1]. Therefore, improving the efficiency of water resource use in agricultural production is an important way to relieve the pressure on China’s overall water resources. Reasonable assessments of the demand by crops for water resources and the utilization of water resources in the production of crops can provide a theoretical basis for improving the management and regulation of agricultural water resources [2]. Compared to the traditional water use evaluation approach, the relatively new concept of the “water footprint” provides a framework to assess the impact of human production and consumption activities on water resources from the aspects of amounts, types, and utilization efficiency [3,4,5,6]. Additionally, the quantification of the crop water footprint (CWF) in agricultural production is the basis for analyzing the water footprint of the entire social production and consumption activities in this sector and the virtual water trade [6].
Currently, international research on CWF generally focuses on three aspects. The first is examining the spatial–temporal evolution of the production water footprint of typical and staple crops [7,8,9,10], or comparing CWFs across different regions, to provide new ideas (such as the virtual water trade) for solving water shortages and innovative water resource management systems [11,12,13,14,15]. The second is evaluating the pressure on water resources and efficiency of water use based on CWF in order to optimize the agricultural planting structure [1,16,17]. The third aspect is exploring the meteorological and agricultural input factors that affect a crop’s production water footprint [5,18,19,20]. However, these studies merely focus on the water footprint of crop production, i.e., the fresh water consumption per unit of crop production (m3/tonne), which is an indicator of production level. However, the total CWF reflects agricultural water consumption in its entirety, and is of more concern to local policy makers and residents than simply the amount of water used in production.
Some research has applied fuzzy mathematics to explore the influence of various factors on CWF. For example, one function such as Y = f(C1, C2, … Cn; P1, P2, … Pn) contains all factors [5]; however, this has low accuracy because fuzzy mathematics cannot express the physical mechanism of the production process. In contrast, the Cobb–Douglas production function (i.e., Y = A(t)LαKβµ) provides a more powerful tool than fuzzy mathematics to examine the factors influencing CWF because production activities are specifically addressed by mathematical relationships. Furthermore, the Cobb–Douglas function is based on a physical process and is accurate.
Agricultural water conveyance projects, both above- and below-ground, determine whether crops can be irrigated in arid and sub-arid areas [21]. As the most controversial area for water use in China, Xinjiang has the highest agricultural water use, accounting for 96% to 98% of the region’s water consumption. Agricultural water conveyance projects guarantee the irrigation of crops. For example, the number of reservoirs is 655, with total capacity 19.8 billion m3, and the total length of irrigation ditches in Xinjiang’s irrigation districts is 188,000 km. Thus, the influence of agricultural water conveyance projects on crop production in irrigated districts cannot be ignored; yet, this aspect has not been analyzed in previous research. In addition, some previous studies only examined agricultural planting structure adjustment strategies through water footprint theory [16,22]; these studies did not explore the impact of changes in agricultural planting structure on the CWF, or examined them only in qualitative terms [23].
Agricultural production activities are a complex process that integrates nature and society. Climatic factors such as temperature and sunshine, as well as social production factors (such as agricultural inputs, agricultural planting structures, and agricultural water conservancy engineering measures) influence the increase or decrease of CWF. However, the effects of these different factors vary significantly. According to previous research, the impact of climatic conditions on the water footprint of crop production is negligible compared to that of social factors such as agricultural investment [5,18]. Therefore, quantitatively investigating the effects of social production factors on CWF, as well as their sensitivities and relative contributions, can help clarify the main driving factors that influence CWF, and provide a theoretical basis for water footprint regulation and agricultural water resources management.
The objectives of this study were to analyze variations in the magnitude of CWF in Xinjiang over time and determine the major factors that influence the variations, in order to provide proposals for water resources management. First, the long-term CWFs in Xinjiang (including Xinjiang Uygur Autonomous Region and Xinjiang Production and Construction Corps) from 1988 to 2015 were determined, and variations in the annual CWFs were analyzed. Then, the effect of crop-planting structure variation on CWFs was examined, and the impact of direct factors (such as agricultural production inputs and agricultural water conservancy projects) was assessed through sensitivity and contribution analysis. These analyses revealed the major factors that caused the magnitude of CWFs to vary. Finally, the suitable and optimal agricultural water consumption and planting area in Xinjiang were determined.
2. Materials and Methods
2.1. Physical Setting
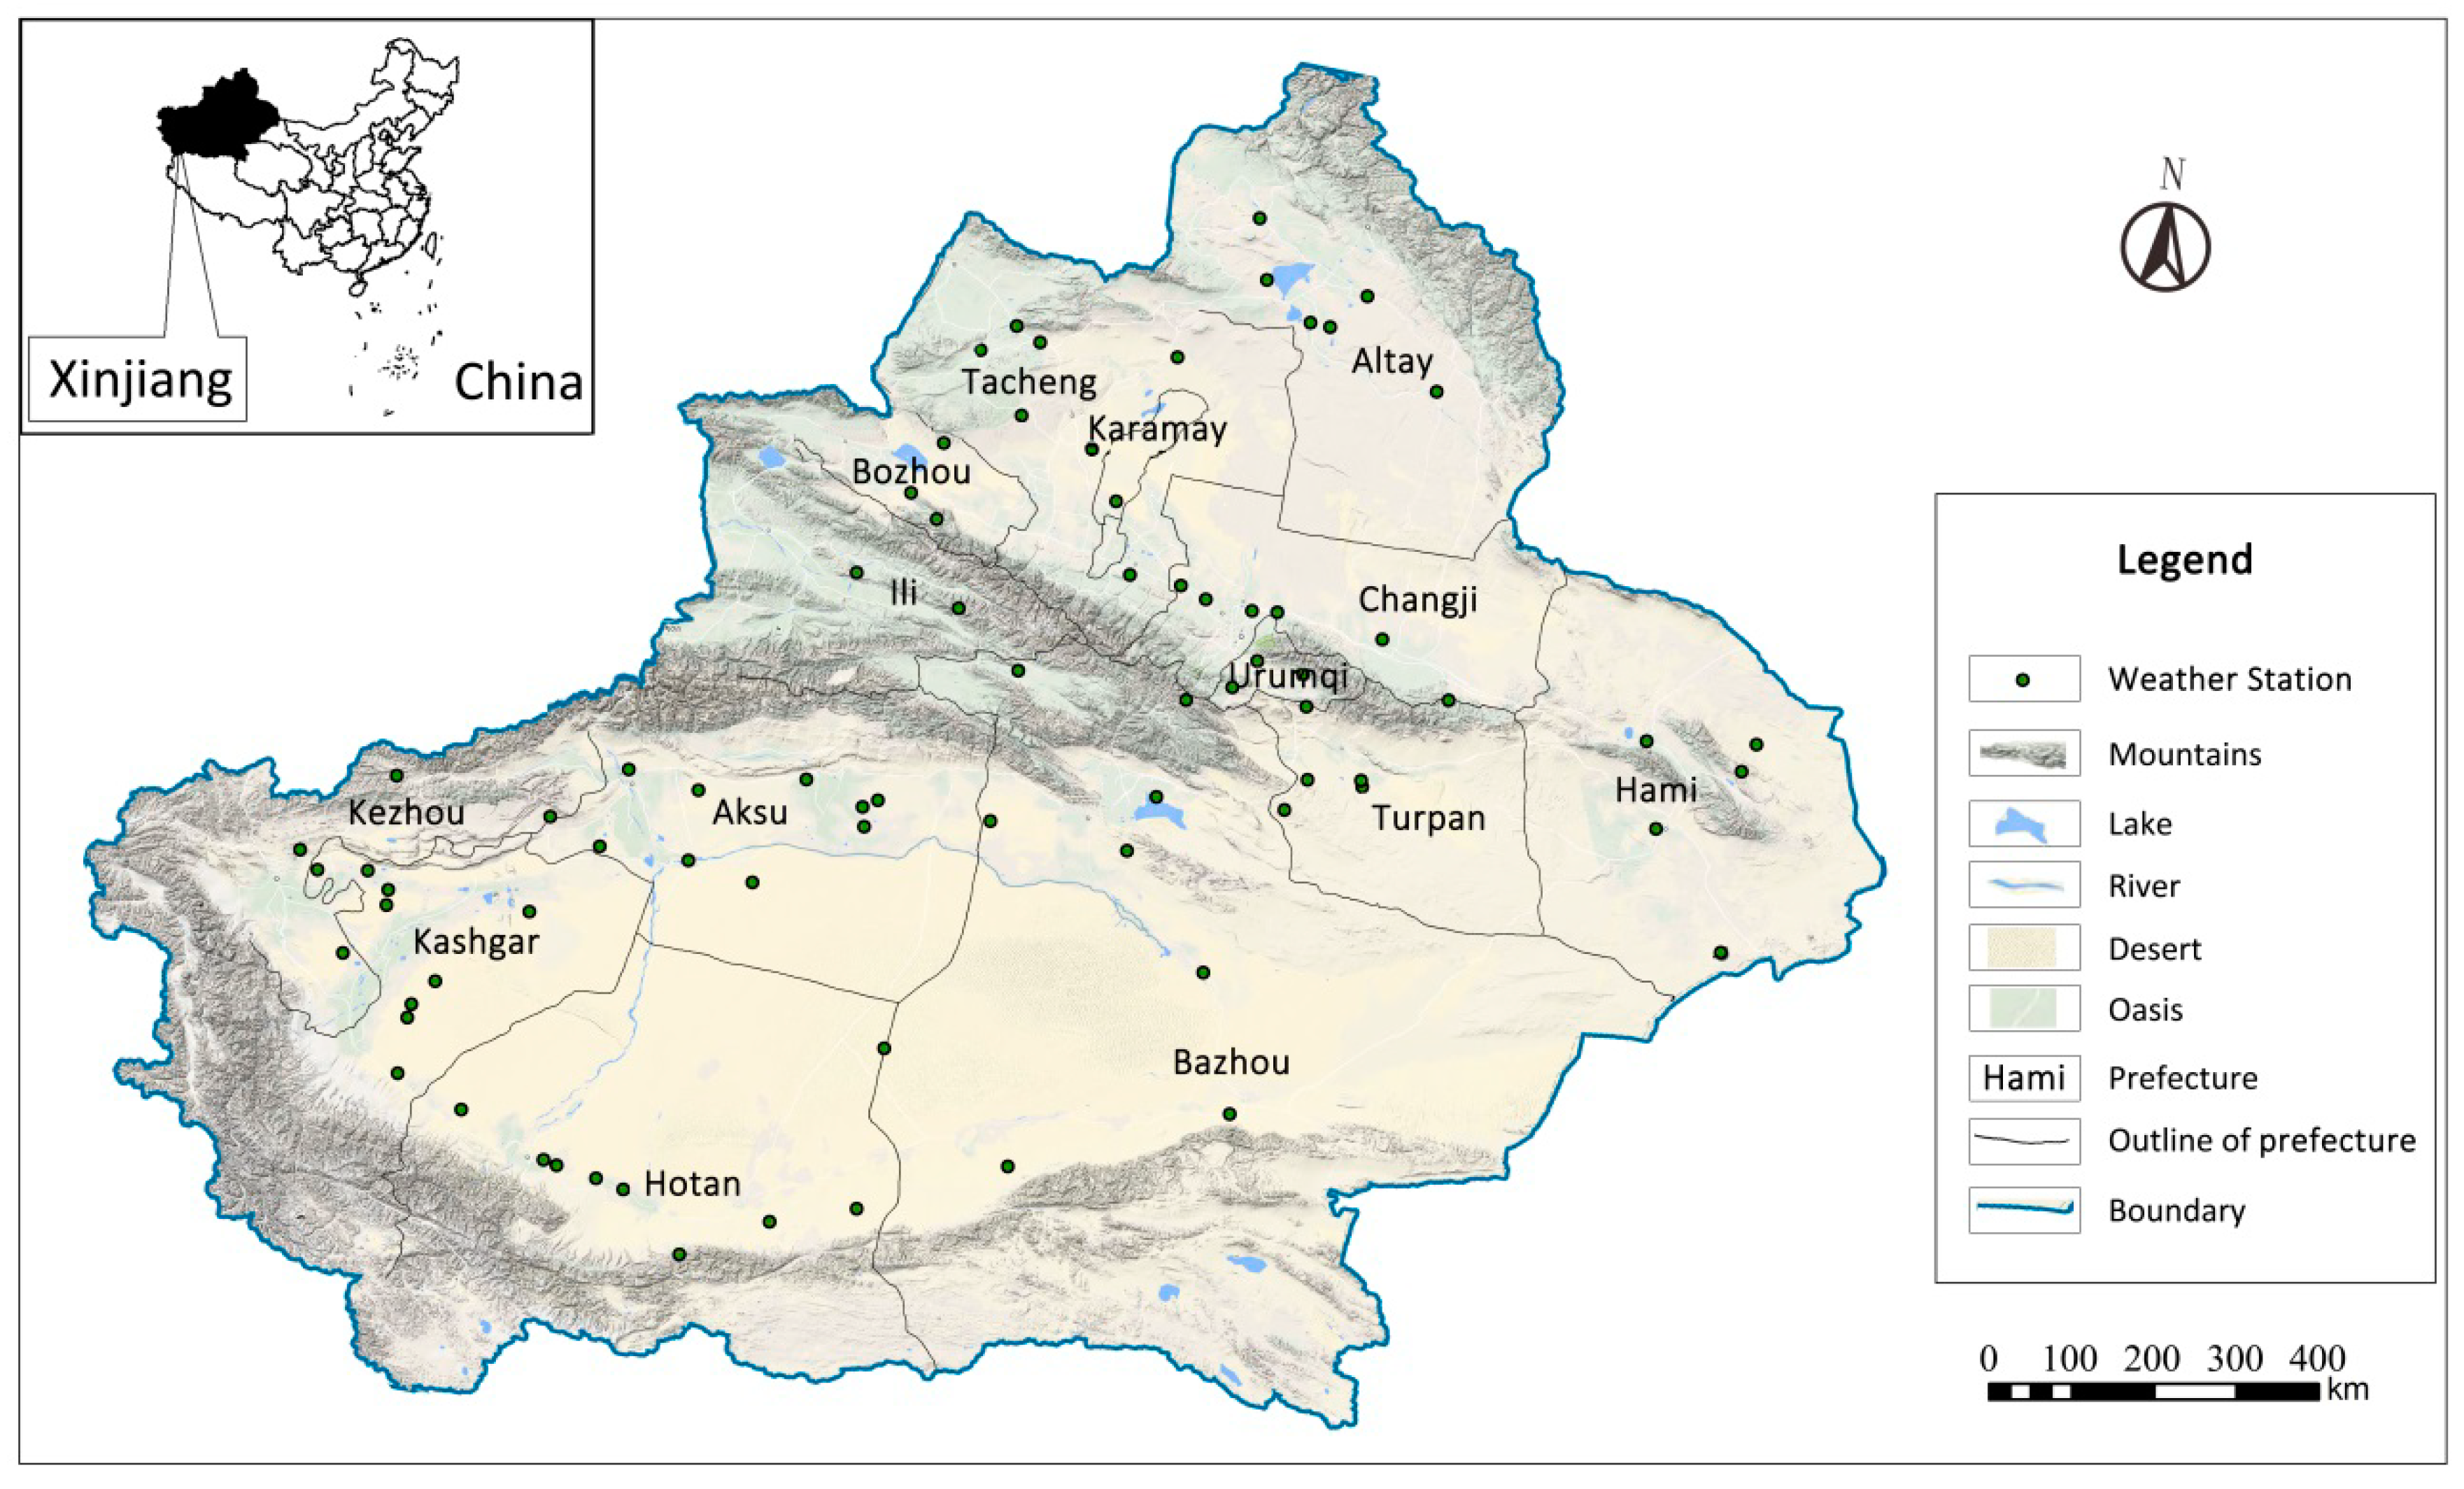
Xinjiang is an inland hinterland of the Eurasian continent (Figure 1). It is a temperate arid region and has a total area of 1.66 × 10⁶ km2, accounting for almost 17% of China’s land area. Due to the fact that Xinjiang is far from the sea, most of its prefectures experience dry climates and scarce rainfall. The average annual rainfall of Xinjiang is 146 mm, the average annual evaporation is 1600–2300 mm, and the average annual sunshine is approximately 2800 h. Because the annual and daily temperature differences are extremely large, natural resources such as daylight, heat and land are in a good condition, making Xinjiang one of China’s important agricultural production areas. Although the level of agricultural science and technology (such as animal breeding techniques, fertilizers, pesticides, agricultural machinery, plastic film, and water-saving irrigation) in Xinjiang has gradually increased [24], it has lagged far behind the national level. From 2012 to the end of 2015, the high-efficiency and water-saving irrigation area in Xinjiang increased by slightly more than 1 million ha, and the total area has reached 3.33 million ha (including that in the Xinjiang Production and Construction Corps). In addition, the high-efficiency and water-saving irrigation area accounts for 54% of the total irrigated area of Xinjiang, and accounts for 73% of China’s total micro-irrigation area. The utilization coefficient of irrigation water increased from 0.49 in 2012 to 0.52 in 2015, and the gross irrigation quota decreased from 45.33 m3/ha to 40.67 m3/ha (610 m3/mu). In 2015, Xinjiang’s gross regional product was 93.2 billion yuan ($13.68 billion), of which the agricultural added value was 16.72% (15.6 billion yuan or $2.30 billion). In the same period, the total water consumption of Xinjiang was 56.14 billion m3, including 54.06 billion m3 of agricultural irrigation. Water for agricultural irrigation comprises almost all water use in Xinjiang.
2.2. Data Description
Climate data (1988–2015) from 88 weather stations in Xinjiang (Figure 1) were used, including daily sunshine hours, average wind speed, relative humidity, rainfall and maximum and minimum temperature. The data for population, urbanization level, agricultural added value, output of crops, sowing area, yield per unit area, agricultural machinery, rural electricity consumption, fertilizer consumption, water utilization efficiency and effective irrigation area, were taken from the Xinjiang Statistical Yearbook (1989 to 2016) and the Statistical Yearbook of Xinjiang Production and Construction Group (1990 to 2016). Missing data were estimated using a time series data interpolation method.
The main crops produced in Xinjiang were evaluated in the study. These included wheat, corn, rice, potato, beans, cotton, oil, vegetables, melons, apples, pears, grapes, dates, alfalfa, hemp and medicinal crops. The agricultural added values at constant prices were obtained from the statistical yearbooks of both the Xinjiang Autonomous Region and the Xinjiang Production and Construction Group. The data for the amount of regional water resources and agricultural water consumption were obtained from the Xinjiang Water Resources Bulletin (2001 to 2015). The data about agricultural water conservancy projects included the number of irrigation reservoirs, total pond area of irrigation reservoirs, total length of irrigation ditches and the number of irrigation wells, and were obtained from the First National Water Conservancy Survey in Xinjiang Uygur Autonomous Region (2013).
2.3. Calculation of Crop Water Footprint (CWF)
CWF includes “green”, “blue” and “grey” water footprints. The blue water footprint refers to the consumption of surface water and groundwater. The green water footprint refers to the consumption of rainwater insofar as it does not become runoff. The grey water footprint refers to the volume of freshwater required to assimilate the load of pollutants to a given water quality standard [25,26]. CWF in this study was calculated using Equations (1)–(8) based on methods in The Water Footprint Assessment Manual by Hoekstra [25]. Grey water was not included because no consensus exists among researchers about the methods for calculating grey CWF; furthermore, the volume of the grey water footprint in crop production is very small in Xinjiang [27].
WFproc = WFproc,green + WFproc,blue
In Equation (1), WFproc represents the volume of CWF in a process (m3/kg), WFproc,green is the green CWF (m3/kg), and WFproc,blue represents the blue CWF (m3/kg).
Green CWF was calculated as:
where CWUgreen is the volume of green crop water usage (m3/ha), Y is the crop yield per unit area (kg/ha), ETgreen is the green crop water requirement, represented by green crop evapotranspiration (mm), d is the day number, and the multiplier 10 converts precipitation depth to water volume per unit land area (m3/ha). The summation ∑ in Equation (3) calculates CWUgreen from the date of planting (d = 1) to harvest. lgp represents the length of the growing process (d), and ETc is the crop evapotranspiration (mm), which is calculated using the software Cropwat8.0 as recommended by the United Nations Food and Agriculture Organization (FAO). Peff is the effective precipitation for crops (mm).
WFproc,green = CWUgreen/Y
ETgreen = min (ETc, Peff)
Blue CWF was calculated as:
where CWUblue is blue crop water usage (m3/ha), and ETblue is the blue crop water requirement (mm). The other quantities are the same as for Equations (2)–(4).
WFproc,blue = CWUblue/Y
ETblue = max (0, ETc − Peff)
Thus, CWF for all crops was determined using Equation (8):
where CWF is total volume of CWF (m3), i is the crop category, and Ai is the area of crop i (ha).
2.4. Factor Selection
Based on Equations (1)–(8) and previous research, production factors include agricultural machinery (expressed in terms of total power), rural electricity consumption and fertilizer consumption. Agricultural water conservancy projects were considered in this study, specifically the number of irrigation reservoirs, total pond area of irrigation reservoirs, total length of irrigation ditches, and the number of irrigation wells. It should be noted that no inevitable relationship existed between the total pond area and the number of irrigation reservoirs because, in Xinjiang, the total pond area of reservoirs is not determined by the number of irrigation reservoirs, but rather by whether the reservoirs can impound water immediately in the flood season.
2.5. Analysis of the Effects of Planting Structure and Planting Area on CWF
Both planting area and planting structure were assumed to affect CWF during the study period, but it was unclear what role the adjustment of the planting structure played. Therefore, two hypothetical experiments were used to analyze the effects of planting structures and planting area separately.
The first experiment (Exp. 1) assumed that the planting structure did not change, but the planting area did change. In other words, the control factor was the planting structure, and the change factor was the planting area. Based on the proportion of crops planted in 1988, the planting area of each crop was designated as the actual total planting area in each year of the study period multiplied by the planting proportion that existed in 1988. The resulting CWF was calculated using Equation (9):
where CWF is the crop water footprint (m3) in a given year of the study period, i indicates the crop type, PWFi indicates the production water footprint of the ith crop (m3/kg), Pi indicates the yield per unit area of crop i (kg/ha), Aact indicates the actual planted area occupied by all crops (ha), and a1988,i is the proportion of total cropped area in 1988 that was occupied by the ith crop.
The second experiment (Exp. 2) assumed that the planting area did not change, but the planting structure did change. In other words, the control factor was the planting area, and the change factor was the planting structure. Based on the total planting area of 1988 crops, the planting area of each crop was designated as the actual planting proportion in each year of the study period multiplied by the total planting area in 1988. The CWF was then calculated using Equation (10):
where i, CWF, PWFi and Pi have the same meaning as in Equation (9). A1988 denotes the total planting area in 1988 (ha), and aact,i indicates the actual planting proportion of the ith crop in a given year of the study period.
In both hypothetical experiments, actual values for the yield per unit area (Pi) and the production water footprint (PWFi) were used.
2.6. Calculation of Elasticity Coefficient and Relative Contribution
An agricultural production function (Equation (11)) was developed based on the Cobb–Douglas production function:
where C is the total water footprint of the crop (m3), A is a coefficient, Xi is the factor influencing CWP, and αi is the elasticity coefficient of Xi. Using a logarithmic transform, the function model described by Equation (11) can be converted to a linear function described as Equation (12):
Regression analysis of Equation (12) yields the factors affecting the elasticity coefficient αi. The relative contribution of each factor to a crop’s production water footprint, Vi, can be calculated using Equation (13):
3. Results
3.1. Variation of the Total CWF of Xinjiang
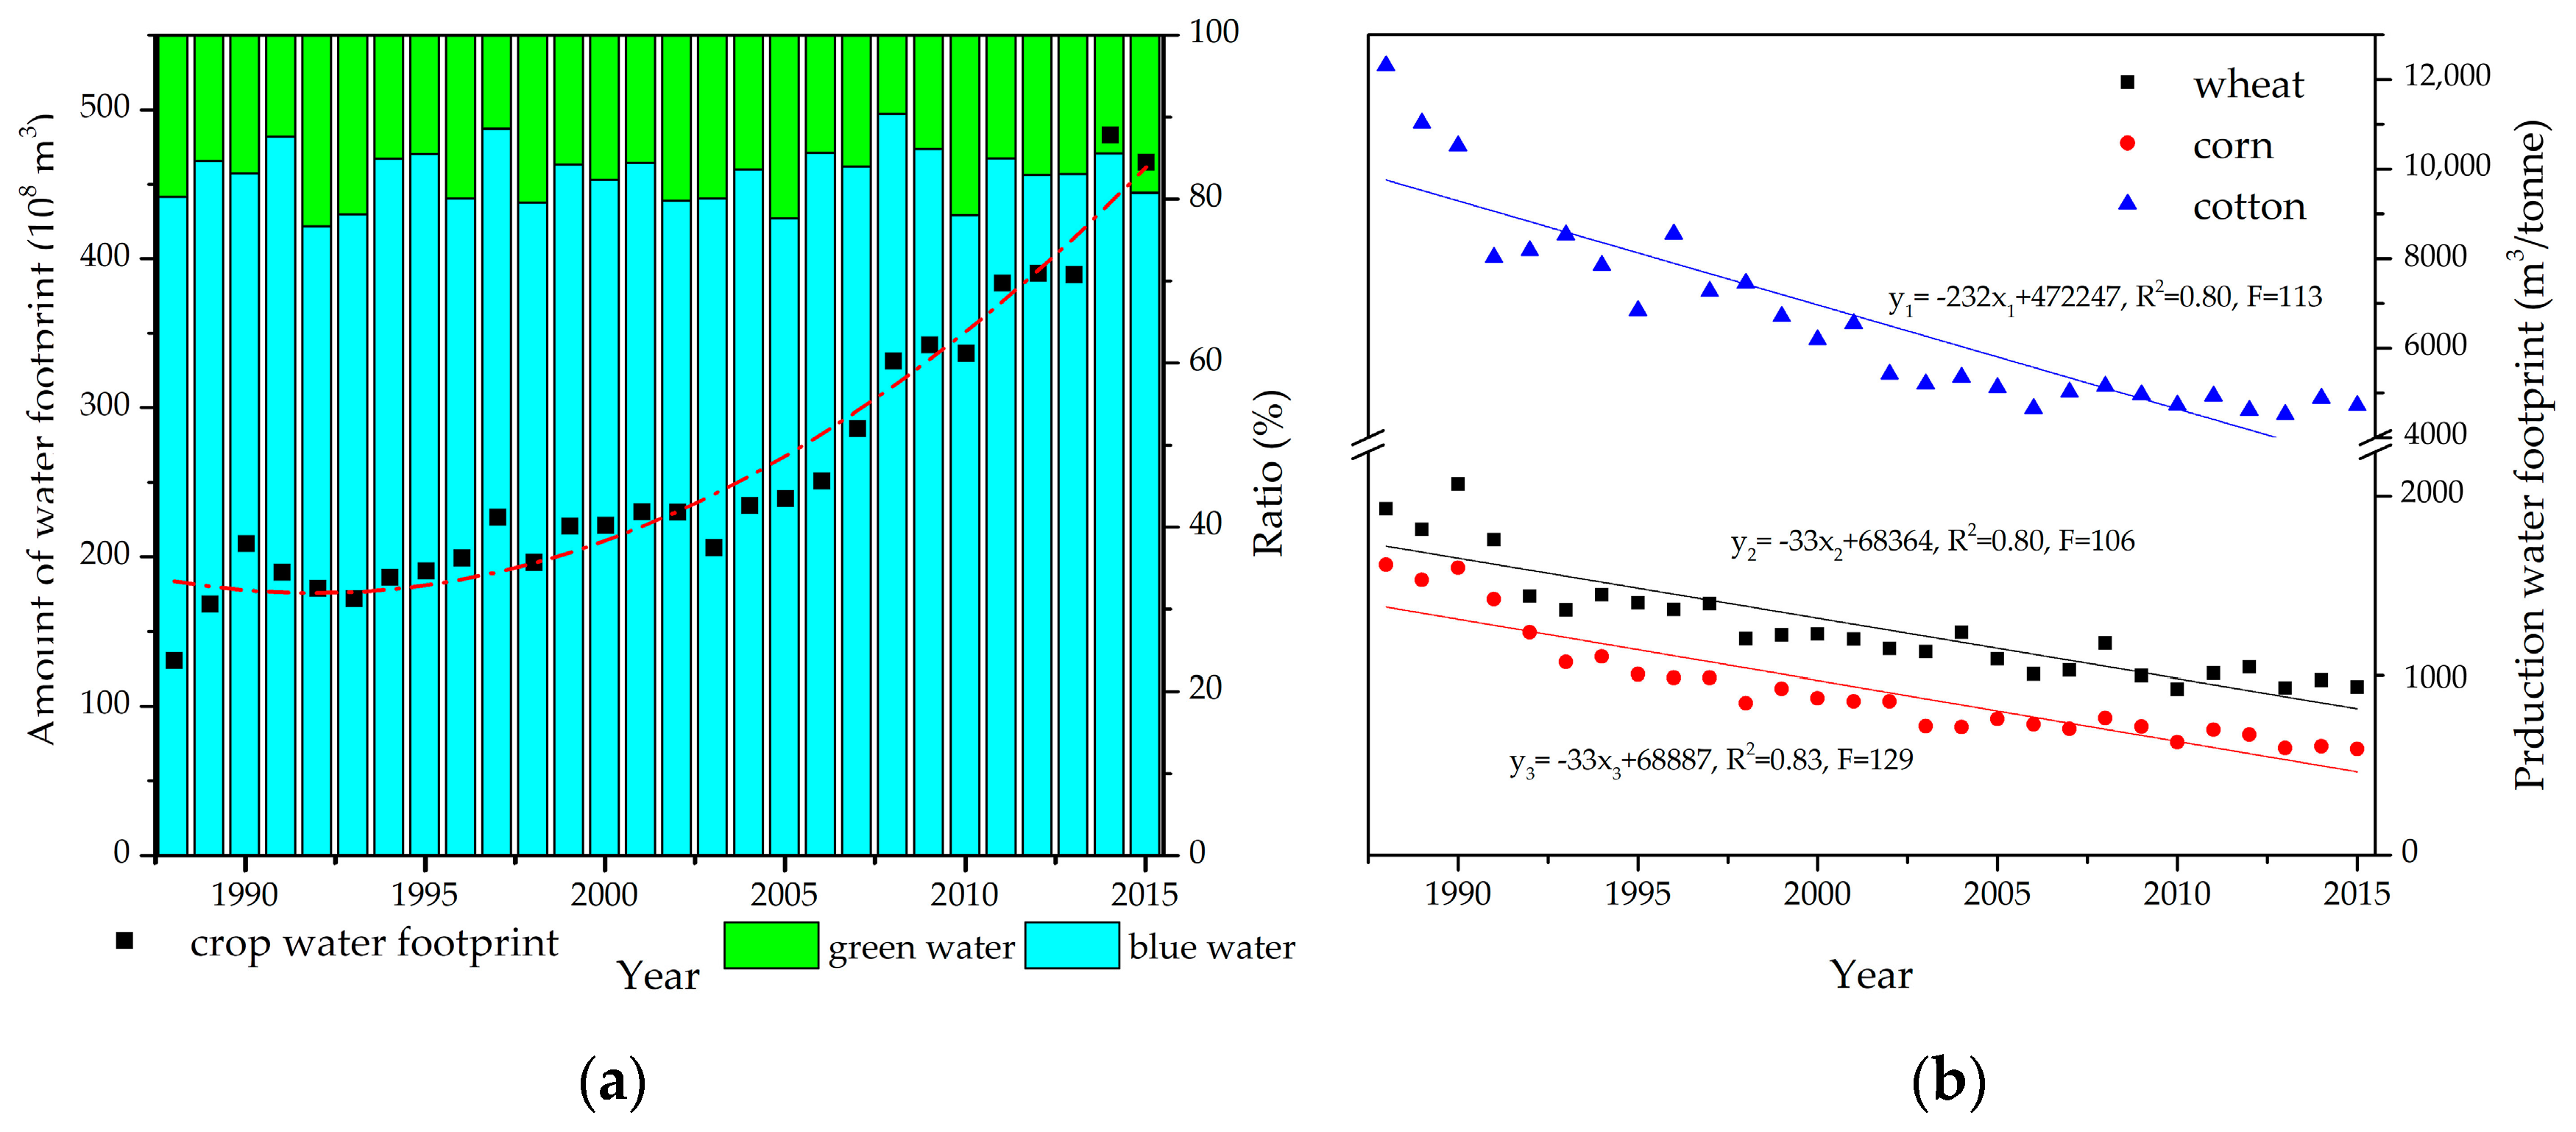
The magnitude (i.e., total volume) of the CWF in Xinjiang significantly increased (by 256%) during the 28-year study period, from 13.02 billion m3 in 1988 to 46.48 billion m3 in 2015 (Figure 2a). The trend of CWF (m3) as a function of time (x, years) was described accurately (R2 = 0.95) by the exponential relationship CWF = 155.57 + 13.52e0.11x, indicating that the growth rate of CWF was increasing. The Mann–Kendall trend test analysis showed that the change rate of the overall trend of the CWF sequence was 9.53 and statistically significant (Z = 6.50, p < 0.001).
The green water footprint of Xinjiang Province increased from 2.57 billion m3 in 1988 to 8.94 billion m3 in 2015, and the blue water footprint increased from 10.45 billion m3 in 1988 to 37.54 billion m3 in 2015. The proportions of green and blue water footprints varied inter-annually, with averages of 17.05% and 82.95%, respectively. The production water footprint (PWF, i.e., the CWF per unit yield) of staple crops in Xinjiang decreased significantly during the study period because of improvements in crops and production technology (Figure 2b).
3.2. Effect of Agricultural Planting Structure on the Total CWF
Changes in crop planting structure not only affect the sustainable development of agriculture, but also impact the amount and structure of agricultural water use. This study used the Shannon–Weiner diversity index to characterize the changes in agricultural planting structure during the study period. The results are shown in Figure 3.
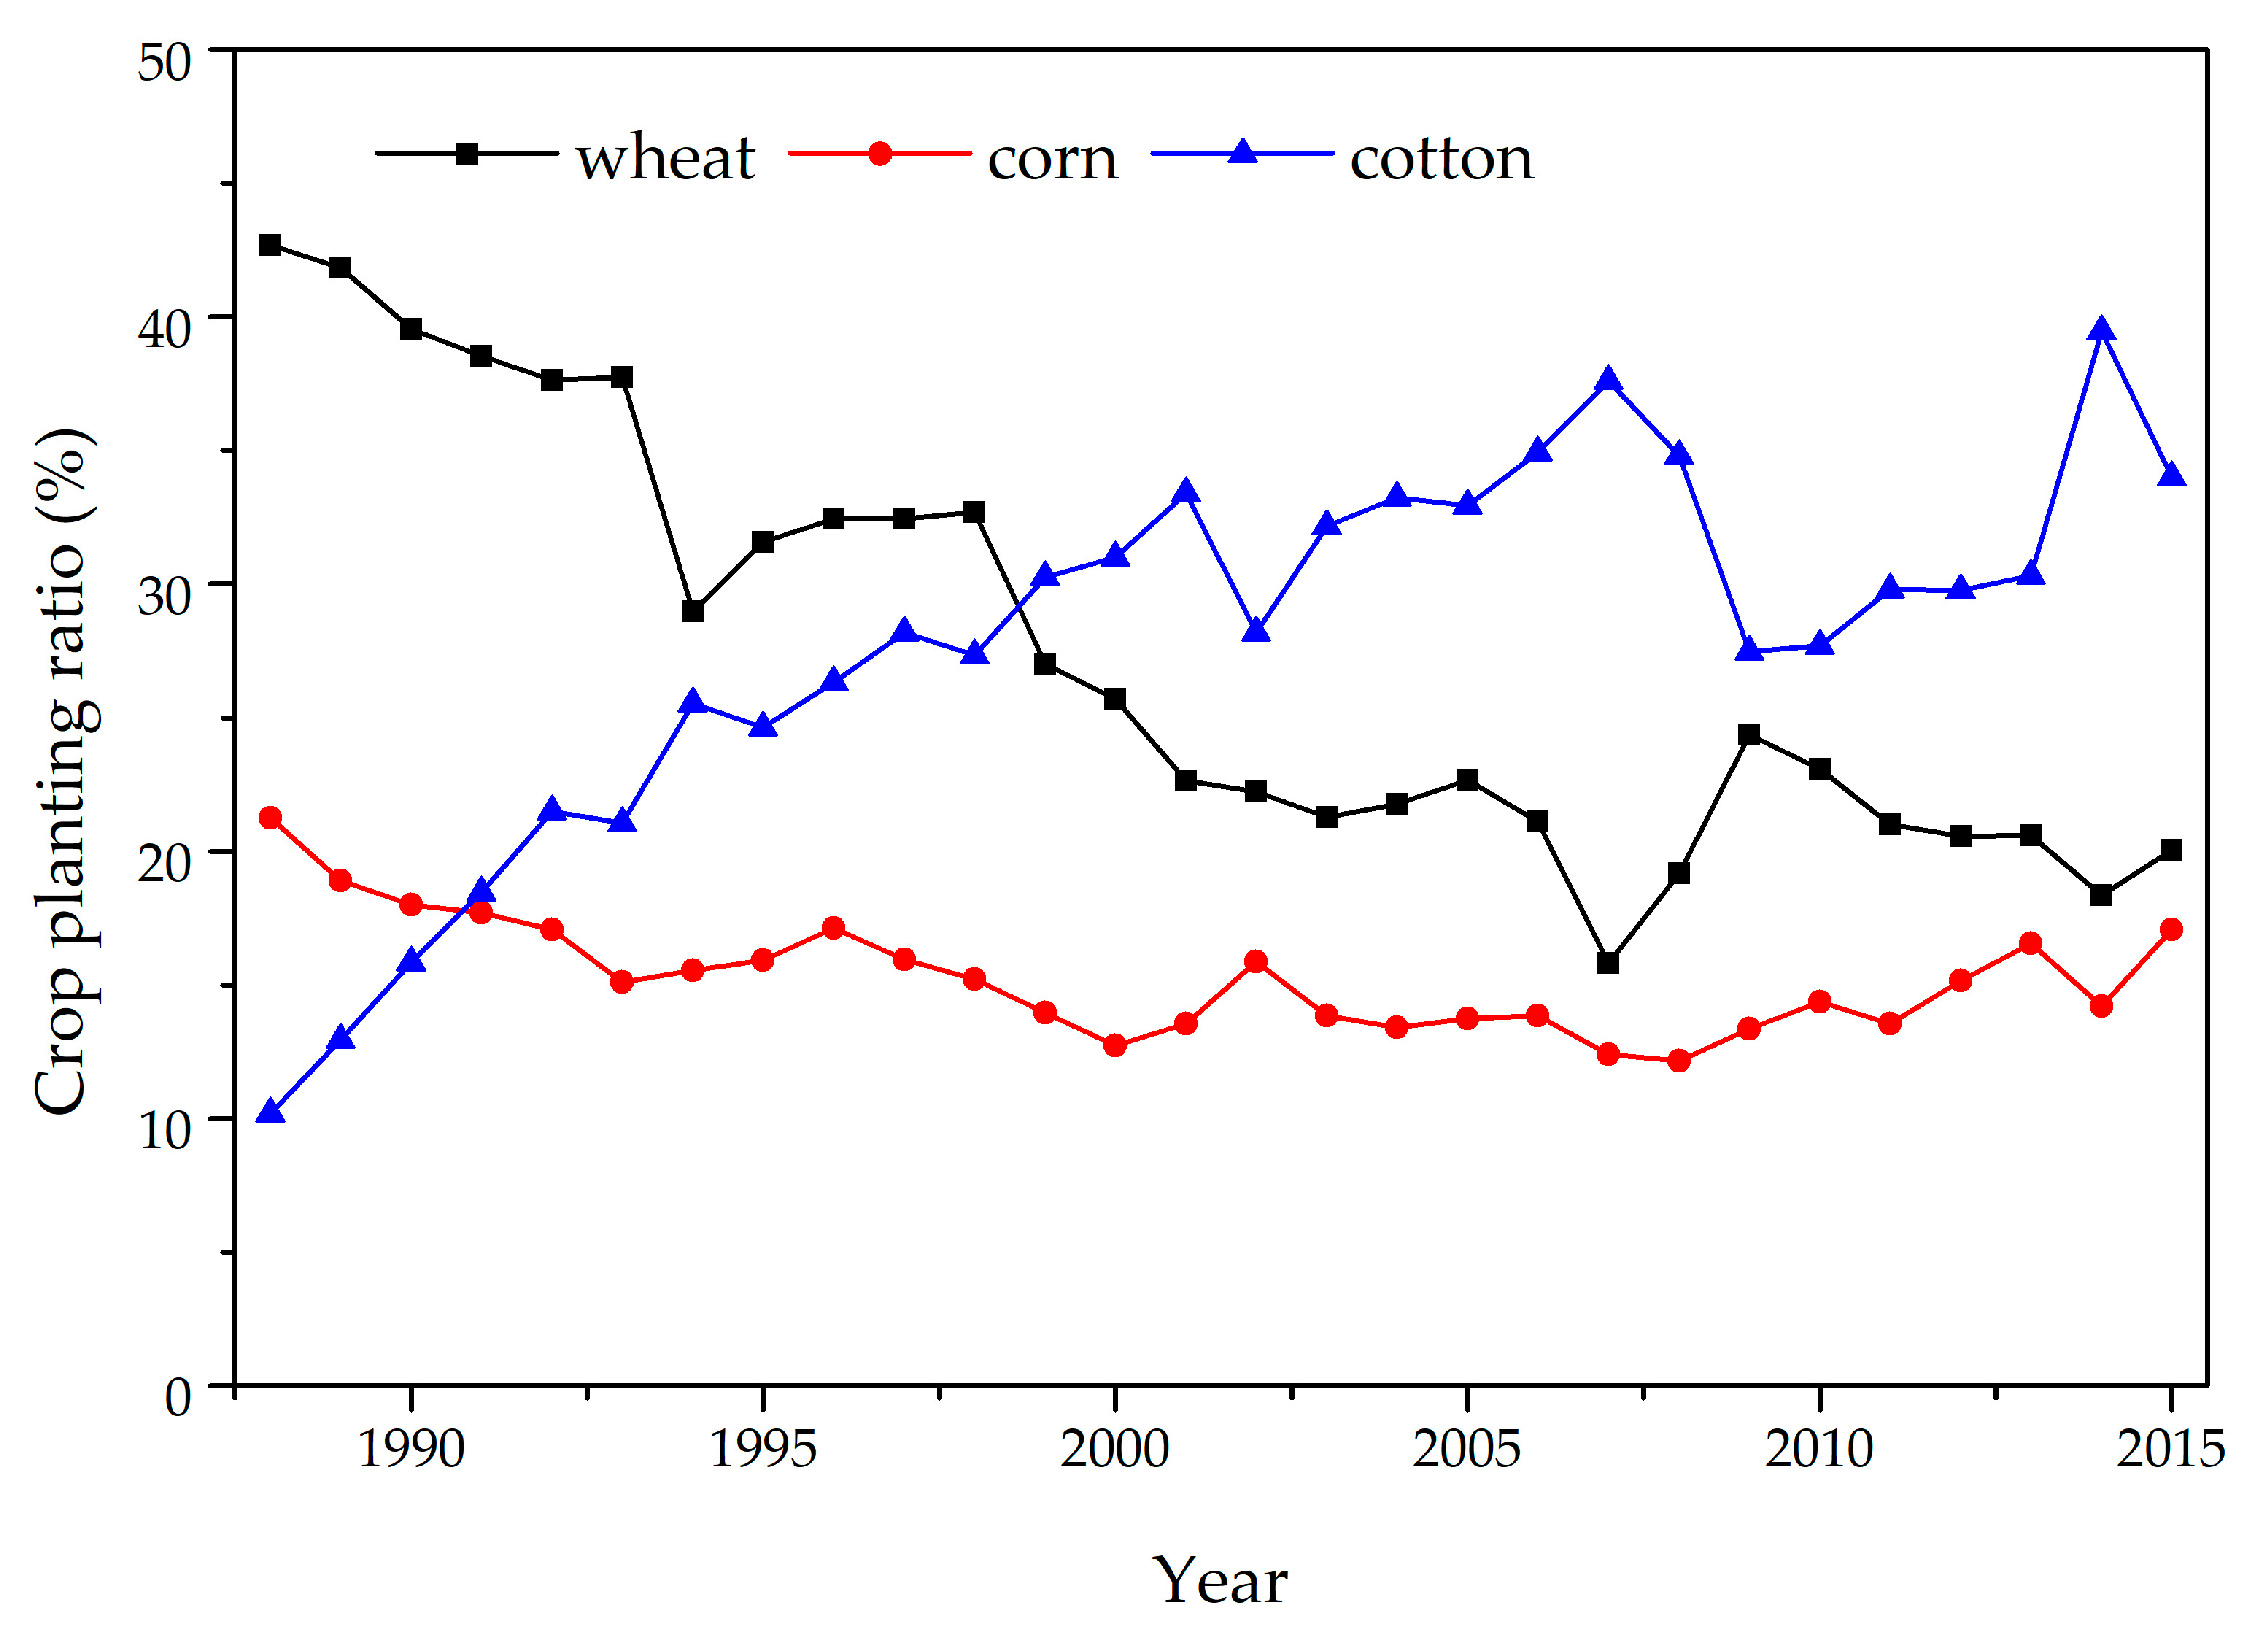
Wheat, corn and cotton have always occupied the largest areas in Xinjiang. In decreasing order of relative areas, the planting structure gradually changed from “wheat–corn–cotton” in 1988 to “cotton–wheat–corn” in 2015 (Figure 3). Cotton became the largest crop in 1999 and remained the largest due to the political guidance in Xinjiang.
To explore the influence of planting structure on the total volume of the CWF, two hypothetical experiments described in Section 2.5 were conducted. The results of Exp. 1 (assuming constant planting structure and variable cropping area) are shown in Table 1.
As the planting structure remained unchanged, the CWF showed a significant upward trend (Z test statistic was 5.67, p < 0.001) as the planting area increased, indicating that the expansion of the planting area led to an increase in the total water footprint. The calculated CWFs were slightly less than the actual CWFs, and the differences were caused by actual changes in the crop-planting structure over time. This result indicates that the CWF increased as the diversity of planting structure increased. However, the increase in CWF caused by the diversity of planting structures was much smaller than that caused by the expansion of the planting area. This can be confirmed by the fact that the net difference was much smaller than the calculated and actual CWF values.
Exp. 2 assumed that the planting area did not change and the planting structure did change during the study period. The results are shown in Table 2 and Figure 4.
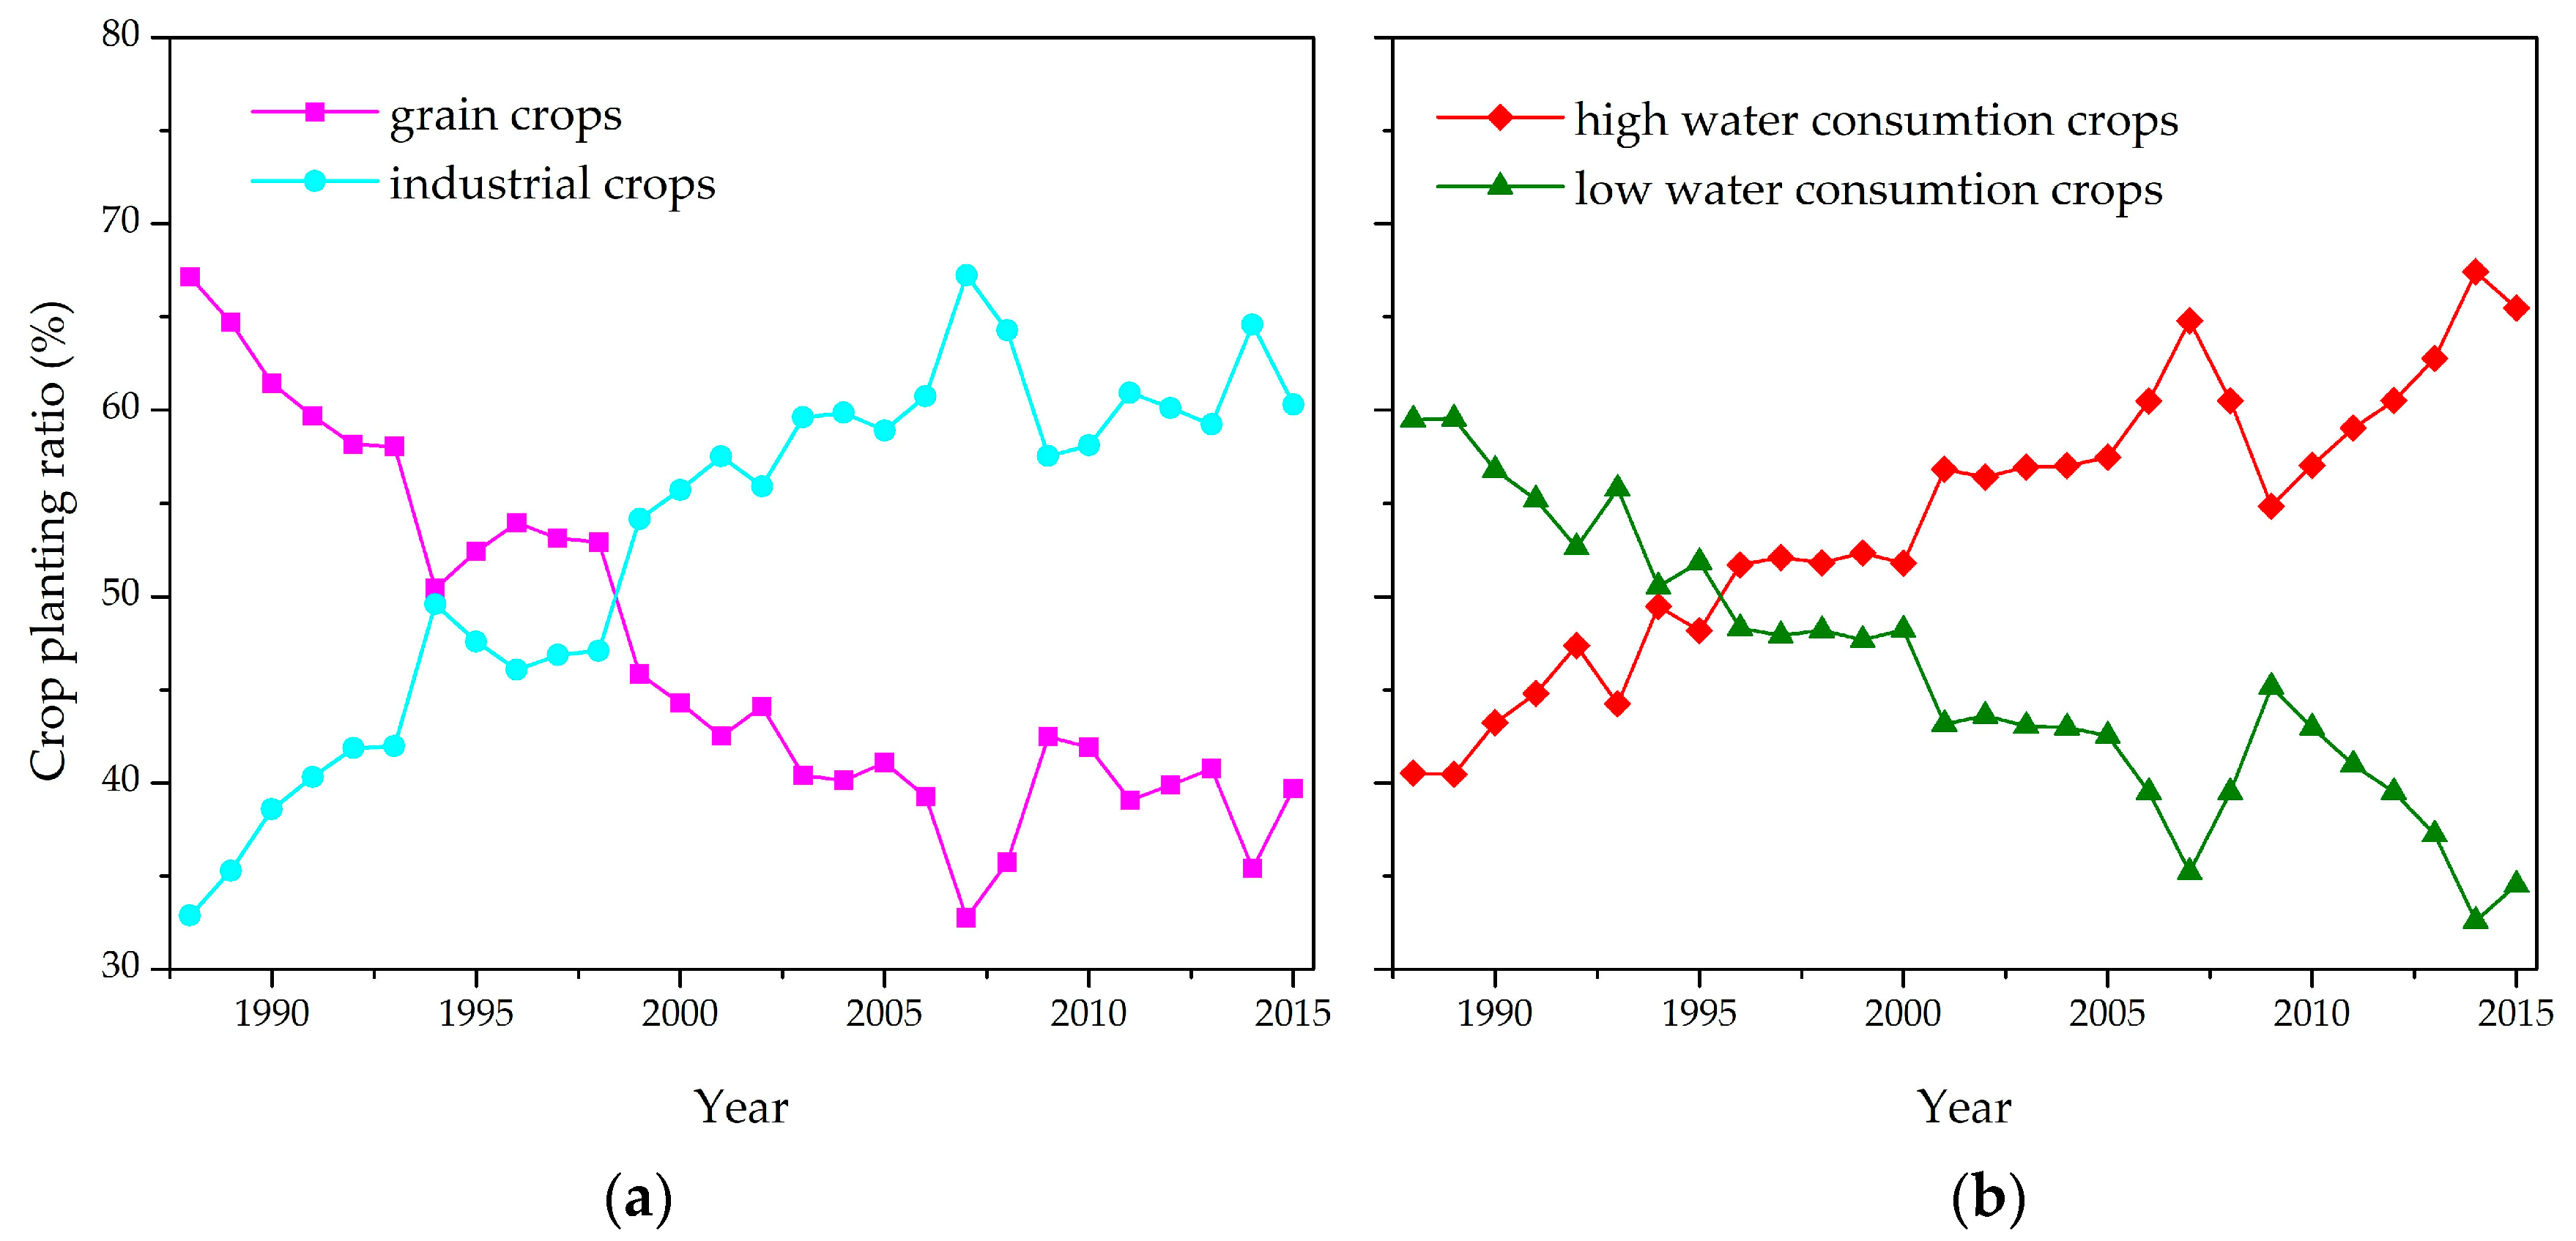
When the planting area remained constant, the CWF gradually increased (Z test statistic was 2.67, p = 0.004) as the planting structure diversity increased, indicating that the diversity of planting structure led to the increase of CWF (Figure 4). The differences between calculated and actual CWF increased over time, and exceeded the calculated values from 2008 onwards (Table 2). This result means that the effect of planting area was greater than that of planting diversity on the total volume of CWF. By further analyzing the planting area of different crops, it can be seen that the main reason for the influence of planting structure on the CWF was that the planting area proportion of high-water-consuming crops (so-called industrial crops) increased and that of the low-water-consuming crops (grain crops) decreased (Figure 5a). Furthermore, the proportion of grain crops in the total planting structure gradually decreased and that of industrial crops increased (Figure 5b). Specifically, the planting area of cotton, soybean, jujube and pear increased by more than 1000% during the study period, and the planting area of corn, sugar beets, vegetables, melons, potatoes, alfalfa, grapes and apples increased by 200–400%. However, the planting area of rice, wheat and oil crops did not change significantly during the study period.
Regarding recent changes in the planting structure of crops in Xinjiang, the increase of crop planting diversity did not reduce the CWF, but instead increased the CWF because the proportion of high water-consuming industrial crops increased. There were three main reasons for the changes in planting structure. First, the price differences among crops prompted farmers to change from producing low economic value crops to high-value crops. Second, the increase in urbanization level changed the planting type in areas surrounding cities, and the original production of grain crops changed to production of industrial crops such as fruits and vegetables. Third, increased consumption of meat accelerated the planting scale of feedstuffs for livestock.
3.3. Influence of Agricultural Investment and Agricultural Water Conservancy Project on Total CWF
According to the analysis in Section 3.2, the main cause of the increase in the CWF was the large expansion of the planting area, which has a close relationship with an increase of agricultural inputs and construction of water conservancy projects. Agricultural inputs mainly include fertilizers, agricultural machinery, and rural electricity. Rural electricity consumption reflects the scale of pumping from wells for irrigation, because most farms have combined groundwater sources (extracted from wells using electrically powered pumps) with surface water sources to ensure agricultural irrigation.
Agricultural water conservancy projects were defined by data obtained from the Xinjiang Water Conservancy Survey in 2011. By correlation analysis between CWF and factors of agricultural water conservancy projects, four factors were identified that had significant relationships with CWF: the number of irrigation reservoirs, the total pond area of irrigation reservoirs, the total length of irrigation ditches, and the number of irrigation wells. Because the data for agricultural water conservancy projects were available only for 2011, the Cobb–Douglas production function was constructed with the CWFs of 14 prefectures in 2011 and their corresponding agricultural inputs and agricultural water conservancy projects (Table 3).
Table 3 shows that all agricultural inputs and agricultural water conservancy projects had a positive elasticity coefficient and, therefore, all promoted the growth of the CWF. The total contribution of agricultural inputs to the CWF was 33.01%, and the contributions of agricultural machinery power, rural electricity consumption and fertilizer consumption were 15.95%, 10.07% and 6.99%, respectively. The contribution of agricultural machinery power was relatively greater because an increase in agricultural machinery power will increase the yield of crops on the one hand, and on the other hand, will facilitate land reclamation, which increases the planting area and the total amount of the CWF. The total contribution of agricultural water conservancy projects to the CWF was 59.98%, of which the total length of irrigation ditches and the number of irrigation wells contributed the largest proportions to the total water footprint (34.72% and 18.34%, respectively). The elasticity coefficient of the total length of irrigation ditches was also the highest among water conservancy factors, indicating that surface water irrigation has a closer relationship with CWFs than the other factors.
4. Discussion
Agriculture is currently the world’s largest freshwater consumer. Reasonable assessment of the demand and consumption of water in the crop production process has great significance in improving agricultural water management practices. From the perspective of the water footprint, agricultural water use can be assessed in terms of type and quantity [4,6]. CWF is mainly affected by local agro-climatic conditions and agricultural production levels, but agro-climatic conditions mainly affect the water footprint of crop production by affecting the crop evapotranspiration; however, this effect is far less than the impact of social production factors [5]. Moreover, an increase in the total CWF mainly arises from the expansion of the planting area resulting from the improvement of agricultural production level. Therefore, in the process of exploring the factors that influenced the CWF in Xinjiang, meteorological factors were omitted from this study, and focus was placed on the effects of planting structure, agricultural inputs, and agricultural water conservancy projects.
In Xinjiang, the convenience of agricultural water-drawing conditions directly determines the scale and technical level of agricultural production. Therefore, in exploring the factors that influence total CWF, this study introduced the elements of agricultural water conservancy projects according to local conditions. To match CWF with the factors of agricultural water conservancy projects, the relationships among agricultural inputs, agricultural water conservancy projects, and CWFs in 14 prefectures in 2011 were explored. This method of “replacing time with space” has been used in some studies [28] to compensate for the lack of data. However, there is no precedent for this approach in previous research on water footprints, and the accuracy is yet to be verified.
In addition, the development of current agricultural water-drawing projects in Xinjiang has encountered a bottleneck. The irrigation technology and system above-ground are relatively developed, but the cost of operation and maintenance is very expensive. For example, drip tape is prone to clogging in drip irrigation system because plants and manure-mixed water could block the tiny orifices in drip emitters, so farmers have to change new equipment and waste lots of money [29,30]. Many motor-pumped wells for groundwater drawing fail due to inappropriate usage and lack of government, and a lot of wells are forbidden to use for over-drawing of groundwater leading to a severe decline of the water table and ecological degradation. Therefore, with respect to political governance, the cost of critical infrastructure operations and the losses of failure [31,32], the scale of agricultural water-drawing projects will not be enlarged in the near future, and the CWF in Xinjiang will not increase with large amplitude, either.
The exploration of how agricultural inputs influence the CWF (elasticity and contribution) was based on the Cobb–Douglas production function. The function prototype was Y = A(t)LαKβµ, where Y is the total output; A(t) is the comprehensive technical level; L and K are labor and capital inputs, respectively; α and β are the output elasticity coefficients of labor and capital, respectively; and μ represents the impact of random interference. All these factors were applied to the process of crop production. Some studies have classified the effective irrigation area and irrigation water use efficiency as agricultural inputs, and used fuzzy mathematics to explore the relationship between these factors and production water footprint [5].
In this study, the use of fuzzy mathematics was considered inappropriate. According to the Cobb–Douglas function, the inputs of labor and capital all directly participate in the production activities. However, for the CWF, the effective irrigation area and irrigation water use efficiency are not direct factors involved in the production process and can be regarded only as the expression of the agricultural production level. Therefore, these factors cannot be included with other direct factors in the Cobb–Douglas production function. Furthermore, compared to fuzzy mathematics, the Cobb–Douglas function has the advantages of accuracy and a physical basis. Yet, when analyzing the indirect factors that do not participate in the production process (such as the population’s demand for food, effective irrigation area, etc.), the Cobb–Douglas function fails. In addition, in previous studies only agricultural planting structure adjustment strategies were examined through water footprint theory [16,22]; these studies did not explore the impact of changes in agricultural planting structure on the CWF, or just examined the impact qualitatively. In contrast, this study used hypothetical controlled-variable experiments to quantitatively analyze the impact of agricultural planting structure on the total CWF; this approach is a groundbreaking exploration.
The intention of building agricultural water conservancy projects in Xinjiang is to guarantee the availability of irrigation water under drought conditions. However, according to this study, these water conservancy projects, such as Wruwat, Dashixia, Xiaoshixia Reservoirs and Wushishui water canal [33,34], have greatly contributed to the increase in the magnitude of the CWF. That is to say, the construction of agricultural water conservancy projects has made it convenient for farmers to irrigate and enlarge their planting area, often in a disorderly way without planning. Although the irrigated area with highly efficient water-saving techniques accounted for 54% of the total irrigated area in Xinjiang, one of the main reasons why the average irrigation water utilization coefficient is still low (0.52) can be attributed to disordered flood irrigation. Thus, to stop the disorderly use of irrigation water and chaotic land reclamation, the water abstraction license management system must be strictly strengthened and sanctioned by law.
The variation of agricultural planting structure is characterized by the increased planting of high-water consumption crops (e.g., cotton) and the decreased planting of low-water consumption crops (e.g., corn and wheat). This fundamental change has further increased the magnitude of Xinjiang’s CWF. Naturally, farmers want the maximum economic benefits from their efforts. However, the pursuit of economic gains while neglecting the social and ecological effects of production techniques may increase the amount of money farmers earn, but at the expense of larger consumption of agricultural water, decreasing the availability of water for ecological use and leading to unsustainable development. Some previous research has examined the optimal crop structure and distribution globally, in the USA and in Central Asia, for the purpose of water conservation by reducing the CWF and promoting virtual water trade [15,17,35,36]. Such research provides new ideas through which to evaluate the optimal planting structure and distribution in Xinjiang and China in subsequent research.
In 2015, the total water consumption in Xinjiang was 57.72 billion m3, approximately 94% (54.06 billion m3) of which was agricultural irrigation water. The areas of farmland and crop planting had already exceeded 6.6 million ha by the end of 2015. In response to the current water resources problems of a declining water table and reduced surface water volume arising from the continuous increase in agricultural water consumption, the government of Xinjiang is implementing a series of countermeasures. These include the “Three Red Lines” projects, a stricter managerial system for water resources, and water rights markets, etc. However, neither government officials nor academic scholars have clear targets for water reduction in Xinjiang. How much water consumption and farmland should be reduced? What scale of farmland and agricultural water consumption should be controlled?
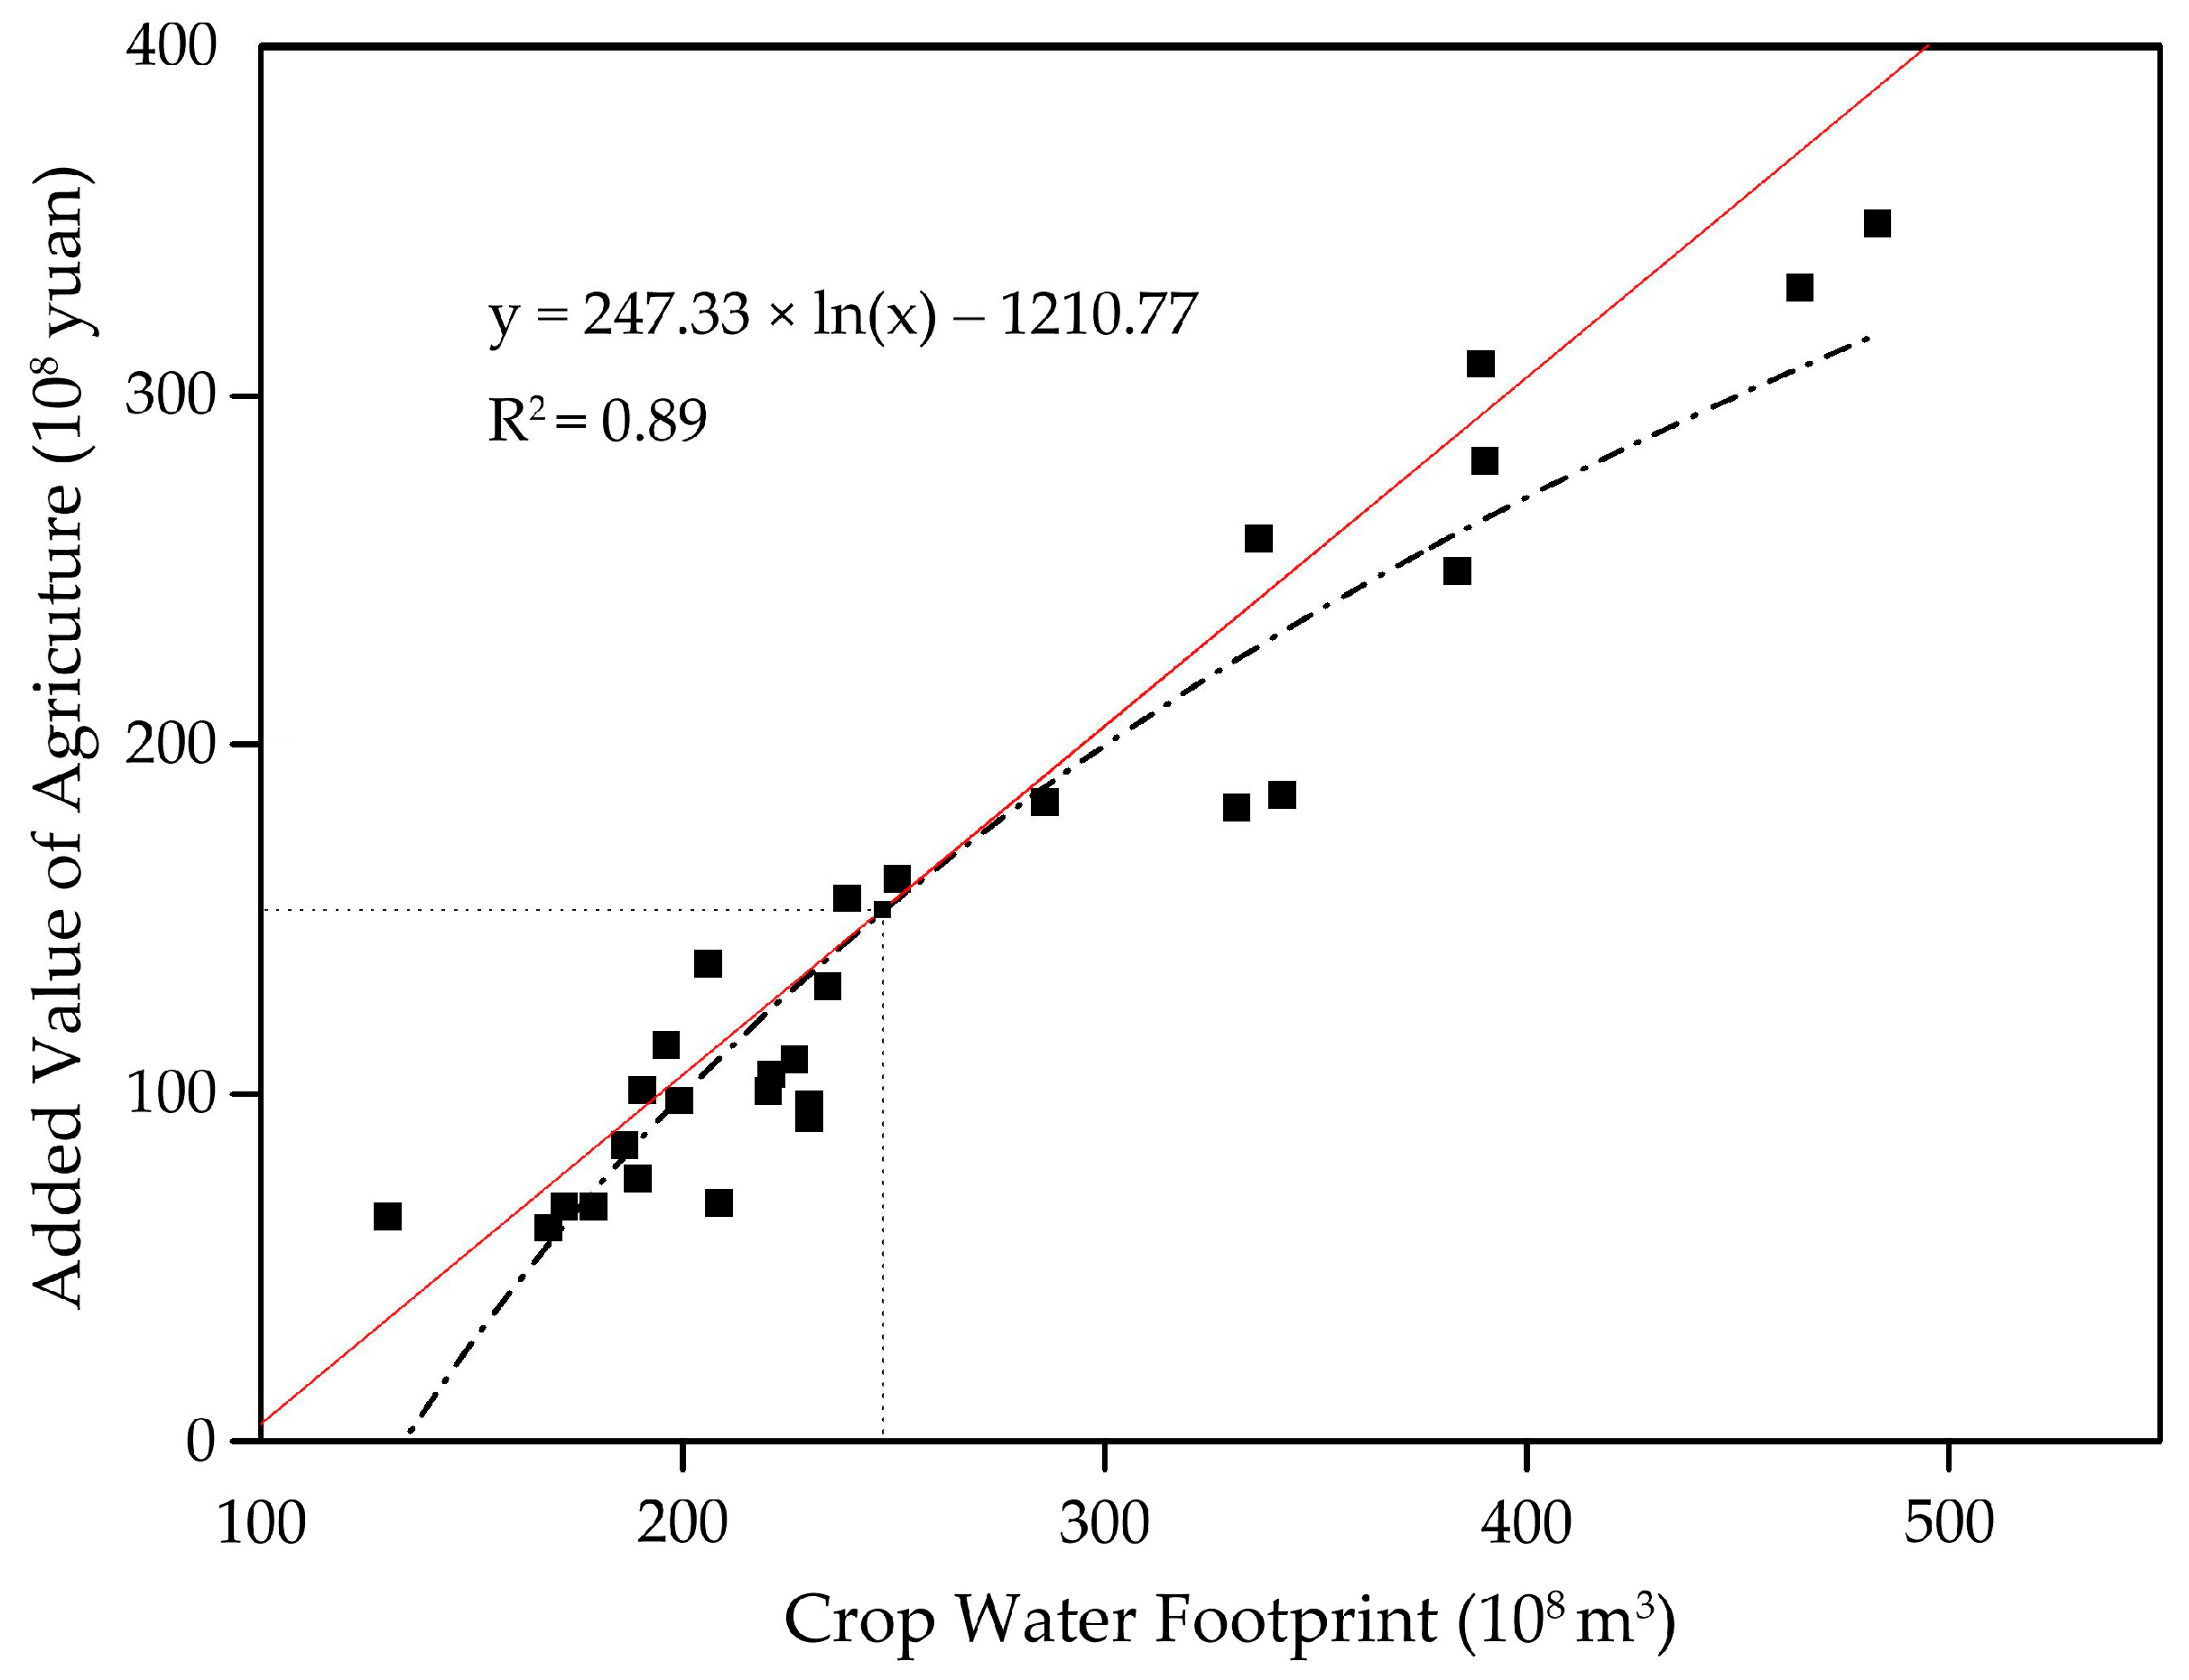
This study attempted to estimate the optimal agricultural water use and the corresponding planting area by exploring the marginal benefits of the water footprint based on the marginal benefit theory from the perspective of economics. Marginal benefit refers to the benefit obtained by selling or consuming one additional unit of a good [37,38]. In this study, the relationship between water footprint and agricultural added value was well described (R2 = 0.89) using a logarithmic function: y(x) = 247.33ln(x) − 1210.71 (Figure 6), in which x is the CWF and y(x) is the added value of agricultural products. The marginal benefit was defined by the first derivative of the function y(x), and yielded y′(x) = 247.33/x [37]. The derivative y′(x) tends to decrease gradually as the magnitude of the CWF increases, i.e., the marginal benefit of the additional CWF declines. The maximum economic benefit of the CWF is identified when the value of the derivative function is 1. When y′(x) is less than 1, the increase in agricultural added value is greater than the increase in water footprint. Conversely, when the derivative value exceeds 1, the increase of water footprint exceeds the increment of agricultural added value; specifically, if the crop water footprint increases one unit, the increase of agricultural added value is less than one unit.
When y′(x) equals 1, the CWF is 24.73 billion m3, and the benefit of the CWF is greatest. In other words, the optimal CWF in Xinjiang is 24.73 billion m3 (Figure 6). In this condition, the blue crop water footprint is 20.5 billion m3, which, if divided by the irrigation water use factor of 0.52 for Xinjiang, indicates that the optimal volume of agricultural irrigation water is 39.4 billion m3; this is 73% of the current agricultural water consumption. The “hydraulic radius” was used to calculate ecological river basal flow [39]. Currently, the rate of water resources development and utilization in Xinjiang has reached 63%, far exceeding the ecological warning line (i.e., 40%) used in international water resources development practice.
If the volume of irrigation water is reduced to 39.4 billion m3 and the associated total water consumption is decreased to 43 billion m3, the water utilization rate will be less than 50%. According to the current gross irrigation quota of 9150 m3/ha (610 m3/mu) in Xinjiang, 39.4 billion m3 of agricultural water can support 4.3 million ha (64.59 million mu) of farmland, which is only 65% of the area currently in agricultural production. With enhanced agricultural production in the future, the gross irrigation quota will be reduced further, and the amount of farmland that can be supported might be increased correspondingly.
Xinjiang has good quality agricultural production conditions such as sunshine, land resources, and large differences in day–night temperature, etc. But the relative shortage of water resources has seriously restricted the development of agriculture, and decreased local living standards. To solve the current water utility dilemma in Xinjiang, many social groups and individuals have proposed a series of water conveyance schemes, such as “Hongqi River” [40] and “Great West Line” [41], to transfer fresh water from south-west China to Xinjiang. However, the government has not endorsed these schemes; thus, whether (or when) the water conveyance projects will be implemented to transfer water resources to Xinjiang is unclear. Therefore, in the short term, the water resources in Xinjiang will not increase. Against this background, proper measures are crucially needed to reduce agricultural water consumption and the amount of cultivated land.
5. Conclusions
This study determined the annual CWF of Xinjiang from 1988 to 2015, explored the effect of agricultural planting structure on the total CWF, and analyzed the relationships among agricultural inputs, water conservancy projects and the CWF. Marginal benefit theory was introduced to examine the optimal amount of agricultural water consumption and farmland area in Xinjiang. The results support the following conclusions and perspectives.
The magnitude of the CWF in Xinjiang significantly (i.e., exponentially) increased during the 28-year study period, from 13.02 billion m3 in 1988 to 46.48 billion m3 in 2015 (a 256% increase). The expansion of the cultivated area is the main reason for the rapid increase of CWF. The crop-planting structure in Xinjiang has contributed to the increase in the total CWF. This influence is mainly due to a dramatic expansion in the planting area of high water-consumption industrial crops (such as cotton, red dates, etc.). The change to these crops has been prompted by the large revenues they generate and the consequent high incomes for farmers. Construction of agricultural water conservancy projects has greatly facilitated the diversion of irrigation water, which has promoted the expansion and reproduction of the scale of agricultural production activities. This Cobb–Douglas production function has a good accuracy for describing the effect of various production factors on the CWF; however, the function only analyzes factors that directly participate in the production process. The optimal agricultural water consumption and farmland area in Xinjiang are 39.4 billion m3 and 4.3 million ha, 73% and 65% of the current water use and planting area, respectively. Against the background of no extra-water being transferred to Xinjiang in the short term, effective measures are urgently needed to reduce agricultural water consumption and the amount of cultivated land.
Xinjiang suffers from an extreme scarcity of water resources, but still plays essential roles in agricultural production, such as its role as the cotton base in the national commodity market. Fresh water resources in Xinjiang is transferred out of the territory along with the transportation of agricultural products, and forms a pattern of “west-to-east” water transition as a type of “virtual water”. Therefore, from the perspective of ecological compensation, how much virtual water has been transported outward and to which provinces and cities has virtual water mainly been transferred will be explored in the next research work.
Author Contributions
P.Z. and A.L. wrote the main manuscript text and prepared the figures. X.D. and H.W. advised the study design and data analyses. Y.H. and Y.L. collected the data and calculated the crop water footprint. H.W. and H.X. revised the paper. All authors reviewed and agreed on the contents of the paper.
Funding
This work was supported by the National Key Technology R&D Program of China (2016YFA0601602), (2017YFC0404300) and National Natural Science Foundation of China (51479209), (51609260).
Conflicts of Interest
The authors declare no conflict of interest.
References
- Sun, S.K.; Wu, P.T.; Wang, Y.B.; Zhang, X.H. The temporal and spatial variability of water footprint of grain: A case study of an irrigation district in China from 1960 to 2008. J. Food Agric. Environ. 2012, 10, 1246–1251. [Google Scholar]
- Liu, K.K.; Li, C.H.; Cai, Y.P.; Xu, M.; Xia, X.H. Comprehensive evaluation of water resources security in the Yellow River basin based on a fuzzy multi-attribute decision analysis approach. Hydrol. Earth Syst. Sci. 2014, 11, 1605–1623. [Google Scholar] [CrossRef] [Green Version]
- Hoekestra, A.Y. Virtual water: An introduction. Virtual Water Trade. In Proceedings of the International Expert Meeting on Virtual Water Trade, Delft, The Netherlands, 12–13 December 2002. Value of Water Research Report Series No. 12. [Google Scholar]
- Berger, M.; Finkbeiner, M. Water footprinting: How to address water use in life cycle assessment? Sustainability 2010, 2, 919–944. [Google Scholar] [CrossRef]
- Sun, S.K.; Wu, P.T.; Wang, Y.B.; Zhao, X.N.; Liu, J.; Zhang, X.H. The impacts of interannual climate variability and agricultural inputs on water footprint of crop production in an irrigation district of china. Sci. Total Environ. 2013, 444, 498–507. [Google Scholar] [CrossRef] [PubMed]
- Wang, Y.B.; Wu, P.T.; Engel, B.A.; Sun, S.K. Application of water footprint combined with a unified virtual crop pattern to evaluate crop water productivity in grain production in China. Sci. Total Environ. 2014, 497–498, 1–9. [Google Scholar] [CrossRef] [PubMed]
- Chapagain, A.; Hoekstra, A.; Savenije, H.H.G.; Gautam, R. The water footprint of cotton consumption: An assessment of the impact of worldwide consumption of cotton products on the water resources in the cotton producing countries. Ecol. Econ. 2006, 60, 186–203. [Google Scholar] [CrossRef]
- Su, M.H.; Huang, C.H.; Li, W.Y.; Tso, C.T.; Lur, H.S. Water footprint analysis of bioethanol energy crops in Taiwan. J. Clean. Prod. 2014, 88, 132–138. [Google Scholar] [CrossRef]
- Zotou, I.; Tsihrintzis, V.A. The water footprint of crops in the area of Mesogeia, Attiki, Greece. Environ. Proc. 2017, 4, 63–79. [Google Scholar] [CrossRef]
- Castellanos, M.T.; Cartagena, M.C.; Requejo, M.I.; Arce, A.; Cabello, M.J.; Ribas, F.; Tarquis, A.M. Agronomic concepts in water footprint assessment: A case of study in a fertirrigated melon crop under semiarid conditions. Agric. Water Manag. 2016, 170, 81–90. [Google Scholar] [CrossRef]
- Long, A.H.; Xu, Z.M.; Zhang, Z.Q. Estimate and analysis of water footprint in Northwest China, 2000. J. Glaciol. Geocryol. 2003, 25, 692–700. (In Chinese) [Google Scholar]
- Romaguera, M.; Hoekstra, A.Y.; Su, Z.B.; Krol, M.S.; Salama, M.S. Potential of using remote sensing techniques for global assessment of water footprint of crops. Remote Sens. 2010, 2, 1177–1196. [Google Scholar] [CrossRef]
- Tuninetti, M.; Tamea, S.; D’Odorico, P.; Ridolfi, L. Global sensitivity of high-resolution estimates of crop water footprint. Water Resour. Res. 2016, 51, 8257–8272. [Google Scholar] [CrossRef]
- Wei, Y.; Tang, D.; Ding, Y.; Agoramoorthy, G. Incorporating water consumption into crop water footprint: A case study of china’s south-north water diversion project. Sci. Total Environ. 2016, 545–546, 601–608. [Google Scholar] [CrossRef] [PubMed]
- Shtull-Trauring, E.; Bernstein, N. Virtual water flows and water-footprint of agricultural crop production, import and export: A case study for Israel. Sci. Total Environ. 2018, 622, 1438–1447. [Google Scholar] [CrossRef] [PubMed]
- Xu, Y.J.; Huang, K.; Yu, Y.J.; Wang, X.M. Changes in water footprint of crop production in Beijing from 1978 to 2012: A logarithmic mean Divisia index decomposition analysis. J. Clean. Prod. 2015, 87, 180–187. [Google Scholar] [CrossRef]
- Aldaya, M.M.; Martínez-Santos, P.; Llamas, M.R. Incorporating the water footprint and virtual water into policy: Reflections from the Mancha occidental region, Spain. Water Resour. Manag. 2010, 24, 941–958. [Google Scholar] [CrossRef]
- Jin, C.; Huang, K.; Yu, Y.J.; Zhang, Y. Analysis of influencing factors of water footprint based on the STIRPAT Model: Evidence from the Beijing Agricultural Sector. Water 2016, 8, 513. [Google Scholar] [CrossRef]
- Harris, F.; Green, R.F.; Joy, E.J.M.; Kayatz, B.; Haines, A.; Dangour, A.D. The water use of Indian diets and socio-demographic factors related to dietary blue water footprint. Sci. Total Environ. 2017, 587, 128–136. [Google Scholar] [CrossRef] [PubMed]
- Tuninetti, M.; Tamea, S.; Laio, F.; Ridolfi, L. A Fast Track approach to deal with the temporal dimension of crop water footprint. Environ. Res. Lett. 2017, 12, 074010. [Google Scholar] [CrossRef] [Green Version]
- Walsh, C. Water infrastructures in the U.S./Mexico borderlands. Ecosphere 2013, 4, 1–20. [Google Scholar] [CrossRef]
- Hou, Q.F. Crop planting structure optimization analysis based on water footprint in Gansu Province. J. Desert Res. 2013, 33, 1921–1927. (In Chinese) [Google Scholar]
- Tian, Y.H.; Ruth, M.; Zhu, D.J. Using the IPAT identity and decoupling analysis to estimate water footprint variations for five major food crops in China from 1978 to 2010. Environ. Dev. Sustain. 2017, 19, 2355–2375. [Google Scholar] [CrossRef]
- Chen, C.; Shi, J. Application of Water-Saving Irrigation Technologies in Minority Areas of Xinjiang. In Proceedings of the 2nd International Conference on Economy, Management and Education Technology, Shanghai, China, 11–12 December 2016; pp. 1210–1214. [Google Scholar]
- Hoekstra, A.Y.; Chapagain, A.K.; Aldaya, M.M.; Mekonnen, M.M. The Water Footprint Assessment Manual: Setting the Global Standard; Earthscan: London, UK; Washington, DC, USA, 2011; pp. 25–39. ISBN 978-1-84971-279-8. [Google Scholar]
- Cao, X.; Wu, P.T.; Wang, Y.B.; Zhao, X.N. Water footprint of grain product in irrigated farmland of China. Water Resour. Manag. 2014, 28, 2213–2227. [Google Scholar] [CrossRef]
- Xuan, J.; Zheng, J.; Liu, Z. Calculation and analysis on water footprint of main crops in Xinjiang. Agric. Res. Arid Areas 2014, 32, 195–200. (In Chinese) [Google Scholar]
- Tinkham, W.T.; Smith, A.M.S.; Higuera, P.E.; Doerr, S.H. Replacing time with space: Using laboratory fires to explore the effects of repeated burning on black carbon degradation. Int. J. Wildland Fire 2016, 25, 242–248. [Google Scholar] [CrossRef]
- Ravina, I.; Paz, E.; Sofer, Z.; Marcu, A.; Shisha, A.; Sagi, G. Control of emitter clogging in drip irrigation with reclaimed wastewater. Irrig. Sci. 1992, 13, 129–139. [Google Scholar] [CrossRef]
- Wu, F.; Fan, Y.S.; Li, H.; Guo, Z.X.; Li, J.S.; Li, W.C. Clogging of emitter in subsurface drip irrigation system. Trans. Chin. Soc. Agric. Eng. 2004, 20, 80–83. (In Chinese) [Google Scholar]
- Pietrucha, U.K.; Żelazko, A. Approaches to assess water distribution failure. Period. Polytech. Civ. Eng. 2017, 61, 632–639. [Google Scholar]
- Pietrucha, U.K. Assessing the costs of losses incurred as a result of failure, Adv. Intell. Syst. Comput. 2016, 470, 355–362. [Google Scholar]
- Chen, Y.N.; Ye, Z.X.; Shen, Y.J. Desiccation of the Tarim River, Xinjiang, China, and mitigation strategy. Quat. Int. 2011, 244, 264–271. [Google Scholar] [CrossRef]
- Cao, X.S.; Chen, Z.N. Prevention and cure of breaking of the water canal in the winter of frigid areas—An example in Wushishui water canal, Xinjiang. J. Geol. Hazards Environ. Preserv. 2005, 4, 405–409. (In Chinese) [Google Scholar]
- Davis, K.F.; Rulli, M.C.; Seveso, A.; D’Odorico, P. Increased food production and reduced water use through optimized crop distribution. Nat. Geosci. 2017, 10, 919. [Google Scholar] [CrossRef]
- Davis, K.F.; Seveso, A.; Rulli, M.C.; D’Odorico, P. Water savings of crop redistribution in the United States. Water 2017, 9, 83. [Google Scholar] [CrossRef]
- Brander, J.; Spencer, B. Export subsidies and international market share rivalry. J. Int. Econ. 1985, 18, 83–100. [Google Scholar] [CrossRef]
- Grossman, S.; Hart, O. The Costs and Benefits of Ownership: A Theory of Vertical and Lateral Integration. J. Polit. Econ. 1986, 94, 691–719. [Google Scholar] [CrossRef] [Green Version]
- Liu, C.M.; Zhao, C.S.; Xia, J.; Liu, T. An instream ecological flow method for data-scarce regulated rivers. J. Hydrol. 2011, 398, 17–25. [Google Scholar] [CrossRef] [Green Version]
- From Hongqi River to Hongqi Channel. Available online: http://henan.people.com.cn/n2/2018/0305/c380476-31309017.html (accessed on 16 May 2018). (In Chinese).
- Plan of “Great West Line” to Ensure Sustainable Development. Available online: http://finance.people.com.cn/n1/2017/0303/c153476-29121361.html (accessed on 16 May 2018). (In Chinese).
Figure 1.
Landforms of Xinjiang and the spatial distribution of weather stations in 14 prefectures.

Figure 2.
Crop water footprints (CWFs) in Xinjiang, 1988–2015: (a) The amount and its growth trend, the composition ratio of the green and blue water footprints); (b) Production water footprints of three main crops (i.e., cotton, wheat, and corn) and their decreasing trends.
Figure 2.
Crop water footprints (CWFs) in Xinjiang, 1988–2015: (a) The amount and its growth trend, the composition ratio of the green and blue water footprints); (b) Production water footprints of three main crops (i.e., cotton, wheat, and corn) and their decreasing trends.

Figure 3.
Variation of crop planting structure (three main crops) in Xinjiang, China, 1988–2015.

Figure 4.
Amount and growth trend of calculated crop water footprint (CWF) in Exp. 2.

Figure 5.
Variation of crop planting structure in Xinjiang, China: (a) Crops are divided into grain and industrial crops according to agrotype; (b) Crops are divided into high- and low-water consumption crops according to amount of water usage.
Figure 5.
Variation of crop planting structure in Xinjiang, China: (a) Crops are divided into grain and industrial crops according to agrotype; (b) Crops are divided into high- and low-water consumption crops according to amount of water usage.

Figure 6.
Relationship between crop water footprint and crop added value in Xinjiang, China.


Table 1.
Calculated and actual crop water footprint (CWF) (106 m3) in Xinjiang, China, Exp. 1.
| Years | Calculated CWF | Actual CWF | Difference |
|---|---|---|---|
| 1988 | 1.53 | 1.53 | 0 |
| 1990 | 2.43 | 2.48 | 0.05 |
| 1992 | 1.95 | 2.06 | 0.11 |
| 1994 | 2.1 | 2.18 | 0.08 |
| 1996 | 2.15 | 2.34 | 0.19 |
| 1998 | 2.06 | 2.26 | 0.21 |
| 2000 | 2.33 | 2.51 | 0.18 |
| 2002 | 2.29 | 2.52 | 0.23 |
| 2004 | 2.35 | 2.61 | 0.26 |
| 2006 | 2.54 | 2.89 | 0.35 |
| 2008 | 3.38 | 3.76 | 0.38 |
| 2010 | 3.48 | 3.75 | 0.27 |
| 2012 | 3.96 | 4.36 | 0.4 |
| 2014 | 4.66 | 5.38 | 0.72 |
| 2015 | 4.52 | 5.09 | 0.57 |
Note: difference is calculated as actual CWF minus calculated CWF. Exp. 1 assumed planting structure remained constant and cropping area varied during the study period.
Table 2.
Calculated and actual crop water footprints (CWFs) (106 m3) in Xinjiang, China, Exp. 2.
| Years | Calculated CWF | Actual CWF | Difference |
|---|---|---|---|
| 1988 | 1.53 | 1.53 | 0 |
| 1990 | 1.64 | 2.48 | 0.84 |
| 1992 | 1.5 | 2.06 | 0.56 |
| 1994 | 1.62 | 2.18 | 0.56 |
| 1996 | 1.67 | 2.34 | 0.67 |
| 1998 | 1.66 | 2.26 | 0.6 |
| 2000 | 1.67 | 2.51 | 0.84 |
| 2002 | 1.63 | 2.52 | 0.89 |
| 2004 | 1.67 | 2.61 | 0.94 |
| 2006 | 1.71 | 2.89 | 1.18 |
| 2008 | 1.79 | 3.76 | 1.97 |
| 2010 | 1.56 | 3.75 | 2.19 |
| 2012 | 1.69 | 4.36 | 2.67 |
| 2014 | 1.73 | 5.38 | 3.65 |
| 2015 | 1.65 | 5.09 | 3.44 |
Note: difference was calculated as actual CWF minus calculated CWF. Exp. 2 assumed that the planting area did not change and the planting structure did change during the study period.
Table 3.
Relationships between crop water factor (CWF) and agricultural inputs and agricultural water conservancy projects.
Table 3.
Relationships between crop water factor (CWF) and agricultural inputs and agricultural water conservancy projects.
| Influence Factors | Correlations | Elasticity Coefficients | Contribution (%) | |
|---|---|---|---|---|
| Agricultural inputs | Agricultural machinery (as total rated power) | 0.69 ** | 0.2 | 15.95 |
| Rural electricity consumption | 0.60 * | 0.19 | 10.07 | |
| Fertilizer consumption | 0.88 ** | 0.15 | 6.99 | |
| Subtotal | 33.01 | |||
| Agricultural water conservancy projects | Number of irrigation reservoirs | 0.29 * | 0.09 | 2.88 |
| Total pond area of irrigation reservoirs | 0.62 * | 0.01 | 4.04 | |
| Total length of irrigation ditches | 0.90 ** | 0.27 | 34.72 | |
| Number of irrigation wells | 0.87 ** | 0.15 | 18.34 | |
| Subtotal | 59.98 | |||
| Others | 7.01 | |||
| Total | 100 | |||
Notes: * Significant at p < 0.05; ** Significant at p < 0.01.
© 2018 by the authors. Licensee MDPI, Basel, Switzerland. This article is an open access article distributed under the terms and conditions of the Creative Commons Attribution (CC BY) license (http://creativecommons.org/licenses/by/4.0/).
Share and Cite
MDPI and ACS Style
Zhang, P.; Deng, X.; Long, A.; Hai, Y.; Li, Y.; Wang, H.; Xu, H. Impact of Social Factors in Agricultural Production on the Crop Water Footprint in Xinjiang, China. Water 2018, 10, 1145. https://doi.org/10.3390/w10091145
AMA Style
Zhang P, Deng X, Long A, Hai Y, Li Y, Wang H, Xu H. Impact of Social Factors in Agricultural Production on the Crop Water Footprint in Xinjiang, China. Water. 2018; 10(9):1145. https://doi.org/10.3390/w10091145
Chicago/Turabian StyleZhang, Pei, Xiaoya Deng, Aihua Long, Yang Hai, Yang Li, Hao Wang, and Hailiang Xu. 2018. "Impact of Social Factors in Agricultural Production on the Crop Water Footprint in Xinjiang, China" Water 10, no. 9: 1145. https://doi.org/10.3390/w10091145
Note that from the first issue of 2016, this journal uses article numbers instead of page numbers. See further details here.