1. Introduction
Australia is a significant producer and exporter of coal, accounting for six percent of the world’s economic resources of black coal and 25 percent of brown coal. There are significant coal seam gas reserves in eastern Australia, although the commercial production of coal seam gas is more recent, starting in 1996. There have been a significant number of proposals to further develop coal seam gas and coal resources. These developments may have an impact on water resources and the environment. The Australian government’s approach to regulating coal mining and coal seam gas extraction is risk-based and deals with uncertainty through adaptive management. This is informed by expert judgement and robust and transparent scientific knowledge and information (
http://www.environment.gov.au/water/coal-and-coal-seam-gas).
To enhance scientific knowledge and to provide transparent scientific information, the Australian Commonwealth Scientific and Industrial Research Organisation, in partnership with the Department of Environment and Energy and the Bureau of Meteorology and Geoscience Australia, have undertaken a series of “Bioregional Assessments” to assess the potential impacts of coal seam gas and coal mining development on water resources and water-dependent assets such as wetlands, sociocultural assets and groundwater bores. The Bioregional Assessments have been carried out for six bioregions and sub-regions within these bioregions, spanning a total area of 861,480 km
2. The proposed coal resource developments considered in the assessments include the extraction of about 41,000 MT (megatons) of coal across 58 new mines or extensions to existing mines, and about 16,000 PJ (petajoules) of natural gas from eight new coal seam gas developments. There are five components in the Bioregional Assessments: contextual information; model-data analysis; impact analysis; risk analysis; and outcome synthesis. The Bioregional Assessments method is described in [
1] and the results for the different regions are reported in technical reports, research papers and online (
http://www.bioregionalassessments.gov.au). The Bioregional Assessments are by far the largest cumulative impact assessments on extractive resource development, costing over AUD
$60m, and have been largely completed over five years.
The influence of hydroclimate variability and climate change were not considered directly in the Bioregional Assessments, the latter partly because of the large uncertainty in the future climate projections (see
Section 3). The influence of hydroclimate variability can be important, particularly as the inter-annual variability in Australian river flows is higher than rivers in similar climate regions across the world [
2,
3].
The aim of this study is to investigate the sensitivity of the Bioregional Assessment results to climate change and hydroclimate variability, using the Gloucester sub-region as an example. Specifically, the paper quantifies (i) the relative impact of coal mining development versus impact from potential climate change; (ii) the modelled impact of additional coal mining development (relative to “baseline” development) for different plausible climate futures; and (iii) the influence of hydroclimate variability (sequencing of future hydroclimate time series, particularly when the mine footprint is large) on the modelled impact of additional coal mining development.
Section 2 describes the method used to model the impact of coal mining development on runoff. The impact of coal mining development in the context of climate change is presented and discussed in
Section 3. The impact of coal mining development in the context of hydroclimate variability is presented and discussed in
Section 4. The results and implications are then summarised in
Section 5.
2. Modelling the Impact of Coal Mining Development on Runoff
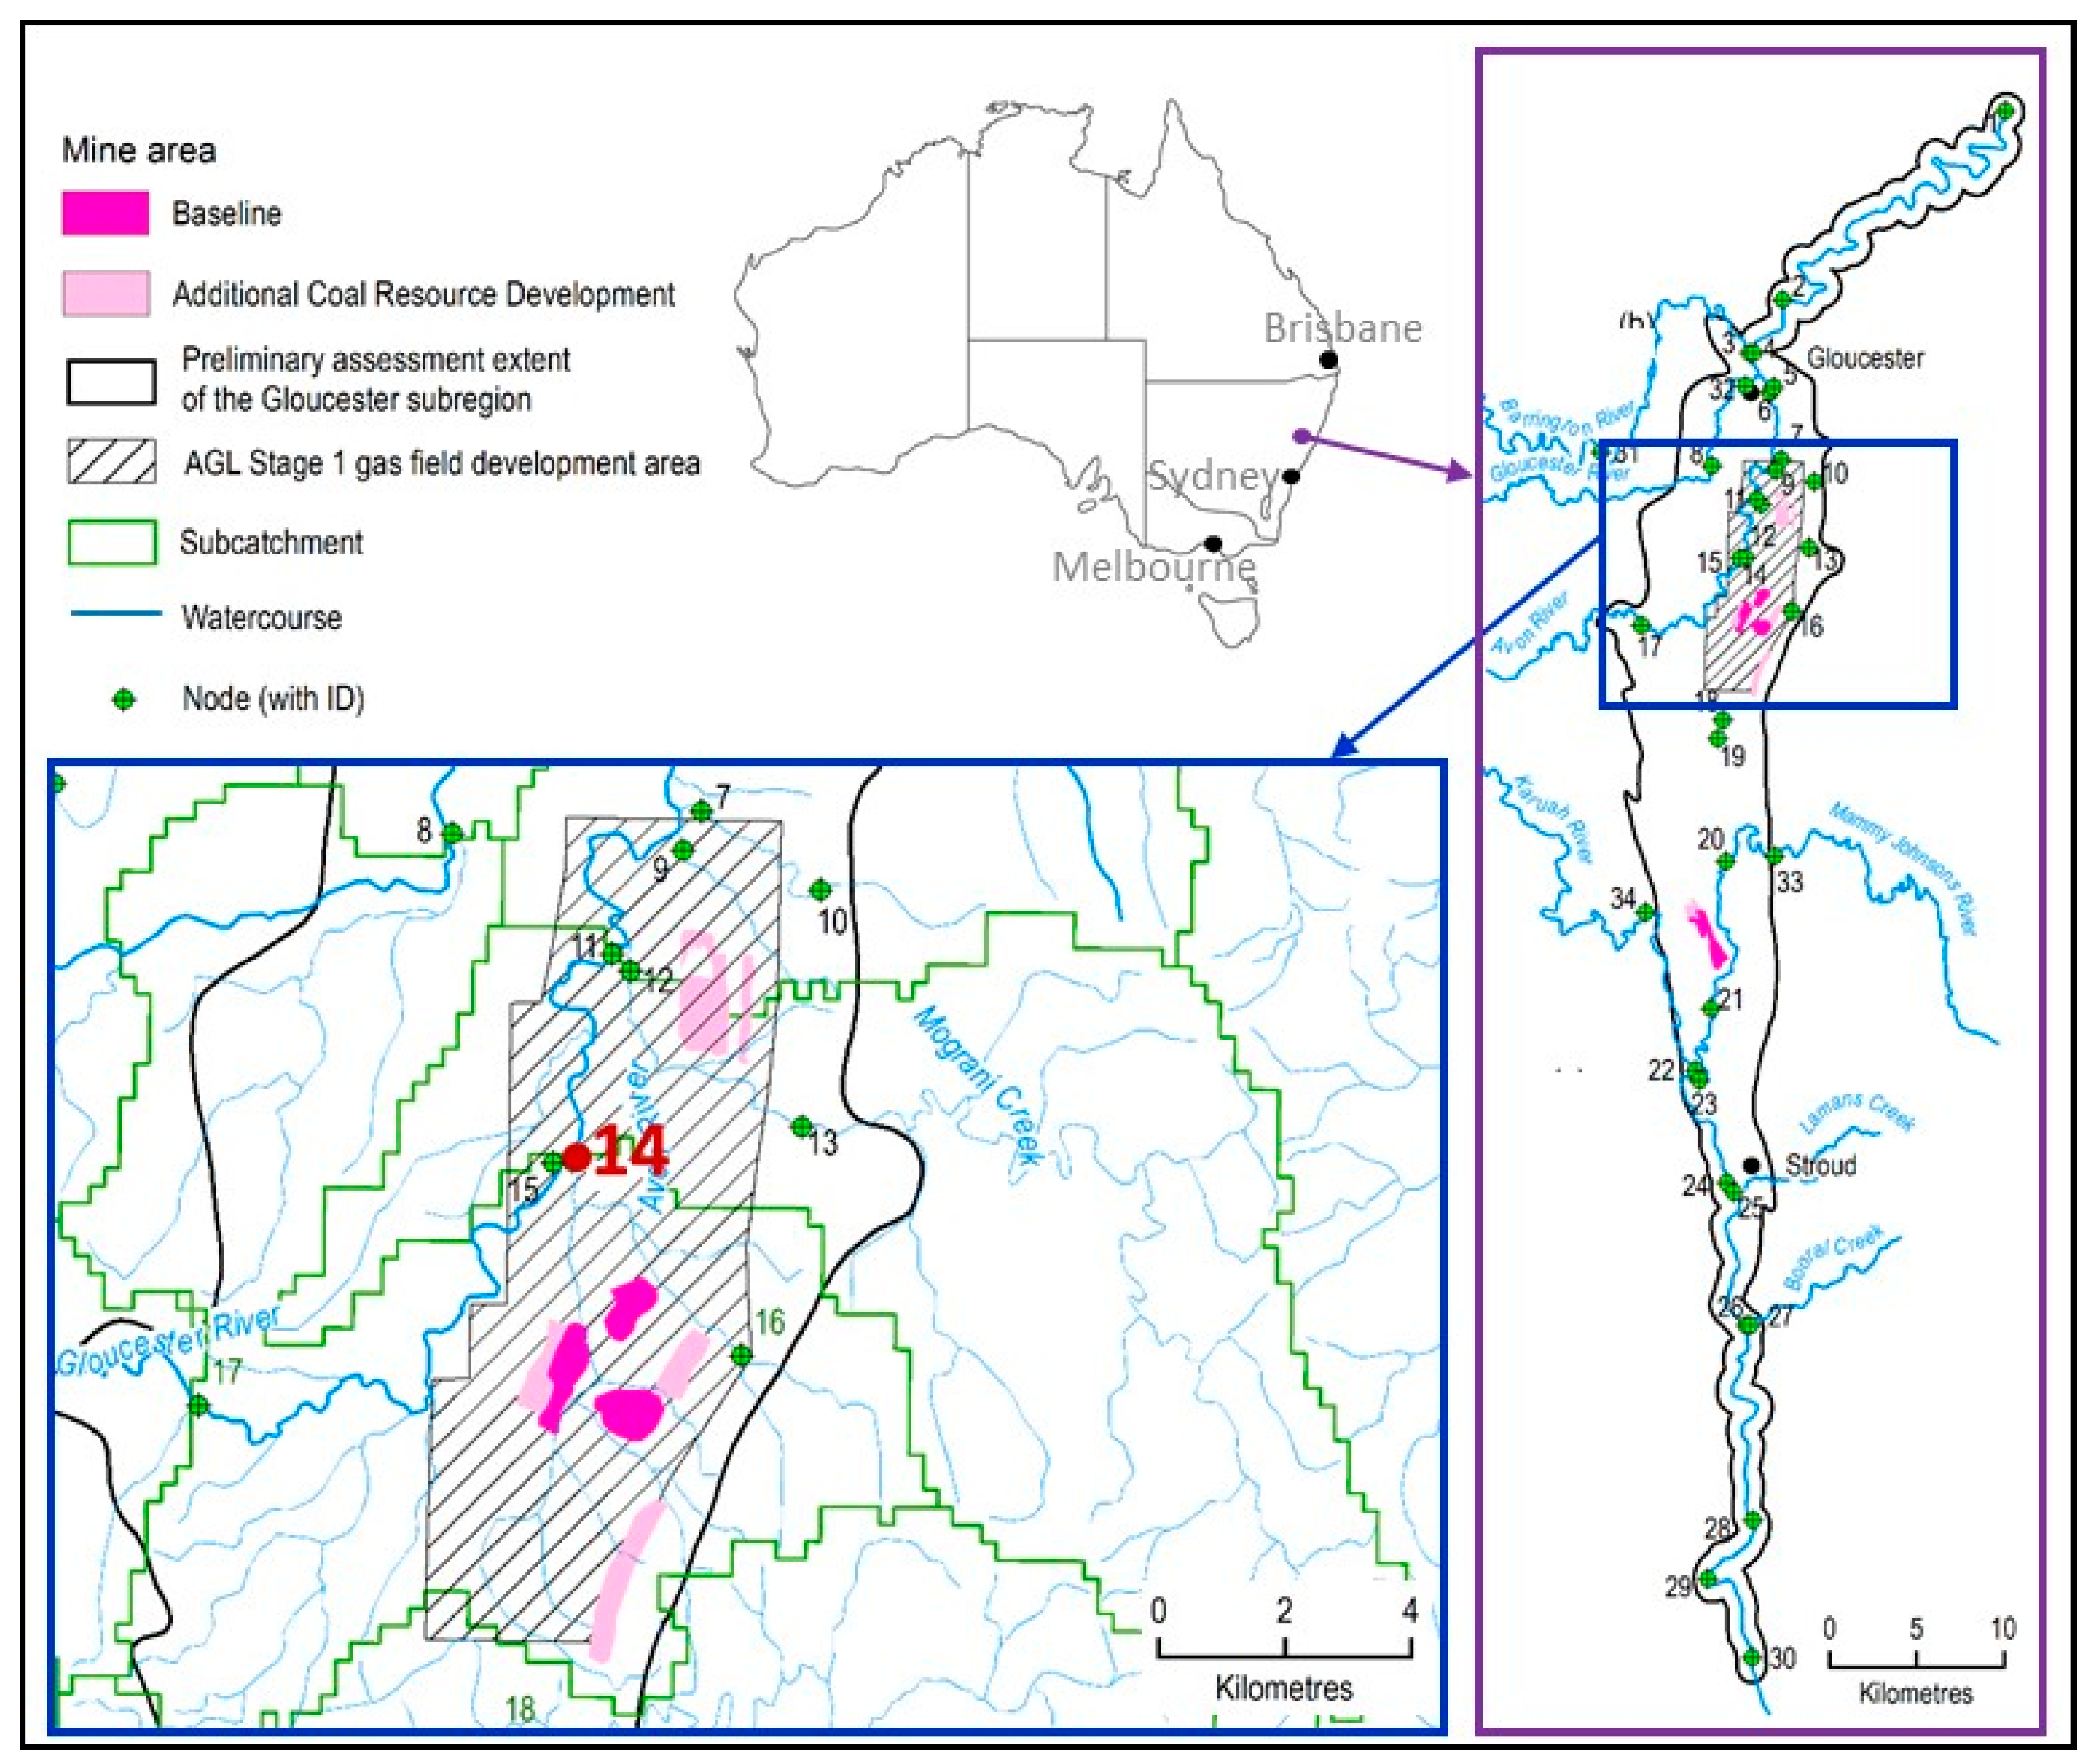
Figure 1 shows the Gloucester sub-region, located in the North Sydney Basin in south-east Australia, with the locations of the proposed coal seam gas and coal mining development and the 30 receptor or stream nodes where the modelling results are reported. The region has a temperate climate with a mean annual rainfall of about 1100 mm, dominated by summer rainfall. The elevation in the region varies from 10 m to 515 m. It is mostly undulating with some medium steep slopes at the edge of the region bordering the Great Dividing Range. The Avon, Gloucester and Barrington Rivers meet close to the township of Gloucester, and then flow north-east towards the coast.
The surface water modelling for the Gloucester sub-region is described in detail in [
4] and the impact analysis is presented in [
5]. Only a brief description is given here, focusing on the surface water modelling relevant to exploring the relative impact of coal mining development, climate change and hydroclimate variability.
The daily runoff is first modelled for 0.05° (~5 km) grid cells across the region. The modelling is carried out using the Australian Water Resources Assessment Landscape (AWRA-L) model [
6]. The same model parameter values are used to model runoff across the entire region, with the model calibrated to best reproduce the observed daily streamflows at 16 largely unimpaired locations or catchments. Specifically, an automatic optimization routine is used to find the set of parameter values that optimize the sum of the objective function or criteria from the top 75% of simulations at the 16 gauged locations. The bottom 25% of simulations are ignored to prevent sub-optimal calibration from focusing on very poor simulations that may result from poor observed data or a rainfall–runoff relationship that is very difficult to reproduce in certain catchments.
The model is calibrated separately against two objective functions. The first objective function is the NSE-Bias [
7], which combines the Nash-Sutcliffe efficiency (NSE, [
8]) that minimizes the sum of squares of the difference between the modelled and observed daily streamflows and “Bias” that minimises the difference between the total modelled and observed streamflows. The set of parameter values from this calibration is used to model most of the streamflow characteristics (or hydrological response variables) considered in the assessment. The second objective function minimizes the sum of squares of the difference between the square root of the modelled and observed daily streamflows. This is an attempt to calibrate the model to better reproduce the low flow characteristics. The set of parameter values from this calibration is used to model the low flow characteristics considered in the assessment. Like most rainfall–runoff modelling in temperate regions with reasonably plentiful gauged streamflow data, the runoff in the region is reasonably well simulated, with NSE values greater than 0.6 in most of the catchments. However, the low flow characteristic considered here (see below) is poorly simulated. There is therefore considerable uncertainty in the estimate of the low flow characteristic, but the relative change reported here still provides useful interpretation of the modelled relative change in the low flow characteristic from climate input sensitivity and coal resource development.
The daily climate data used for the modelling come from the Bureau of Meteorology 0.05° gridded climate data product (
http://www.bom.gov.au/climate/averages/climatology/gridded-data-info/gridded-climate-data.shtml). The ninety years of daily time series—climate data from 1921–2012—are used as inputs (i.e., the same daily climate sequence) to model runoff for the “future” over 2013–2102. Daily runoff at the 30 nodes is calculated as the aggregation of runoffs from all the grid cells (or part of grid cells) that contribute to the catchment area.
The modelled runoff is then reduced by the impact of the “mine footprint” in detaining surface runoff and preventing its entry to the natural stream network. The mine footprint includes the entire area disturbed by mine operations, pits, roads, spoil dumps, water storages and infrastructure. Mines in the Gloucester Basin are required to ensure that no mine water is released to nearby waterways, and as such, the impact on river water quality was not considered here (see [
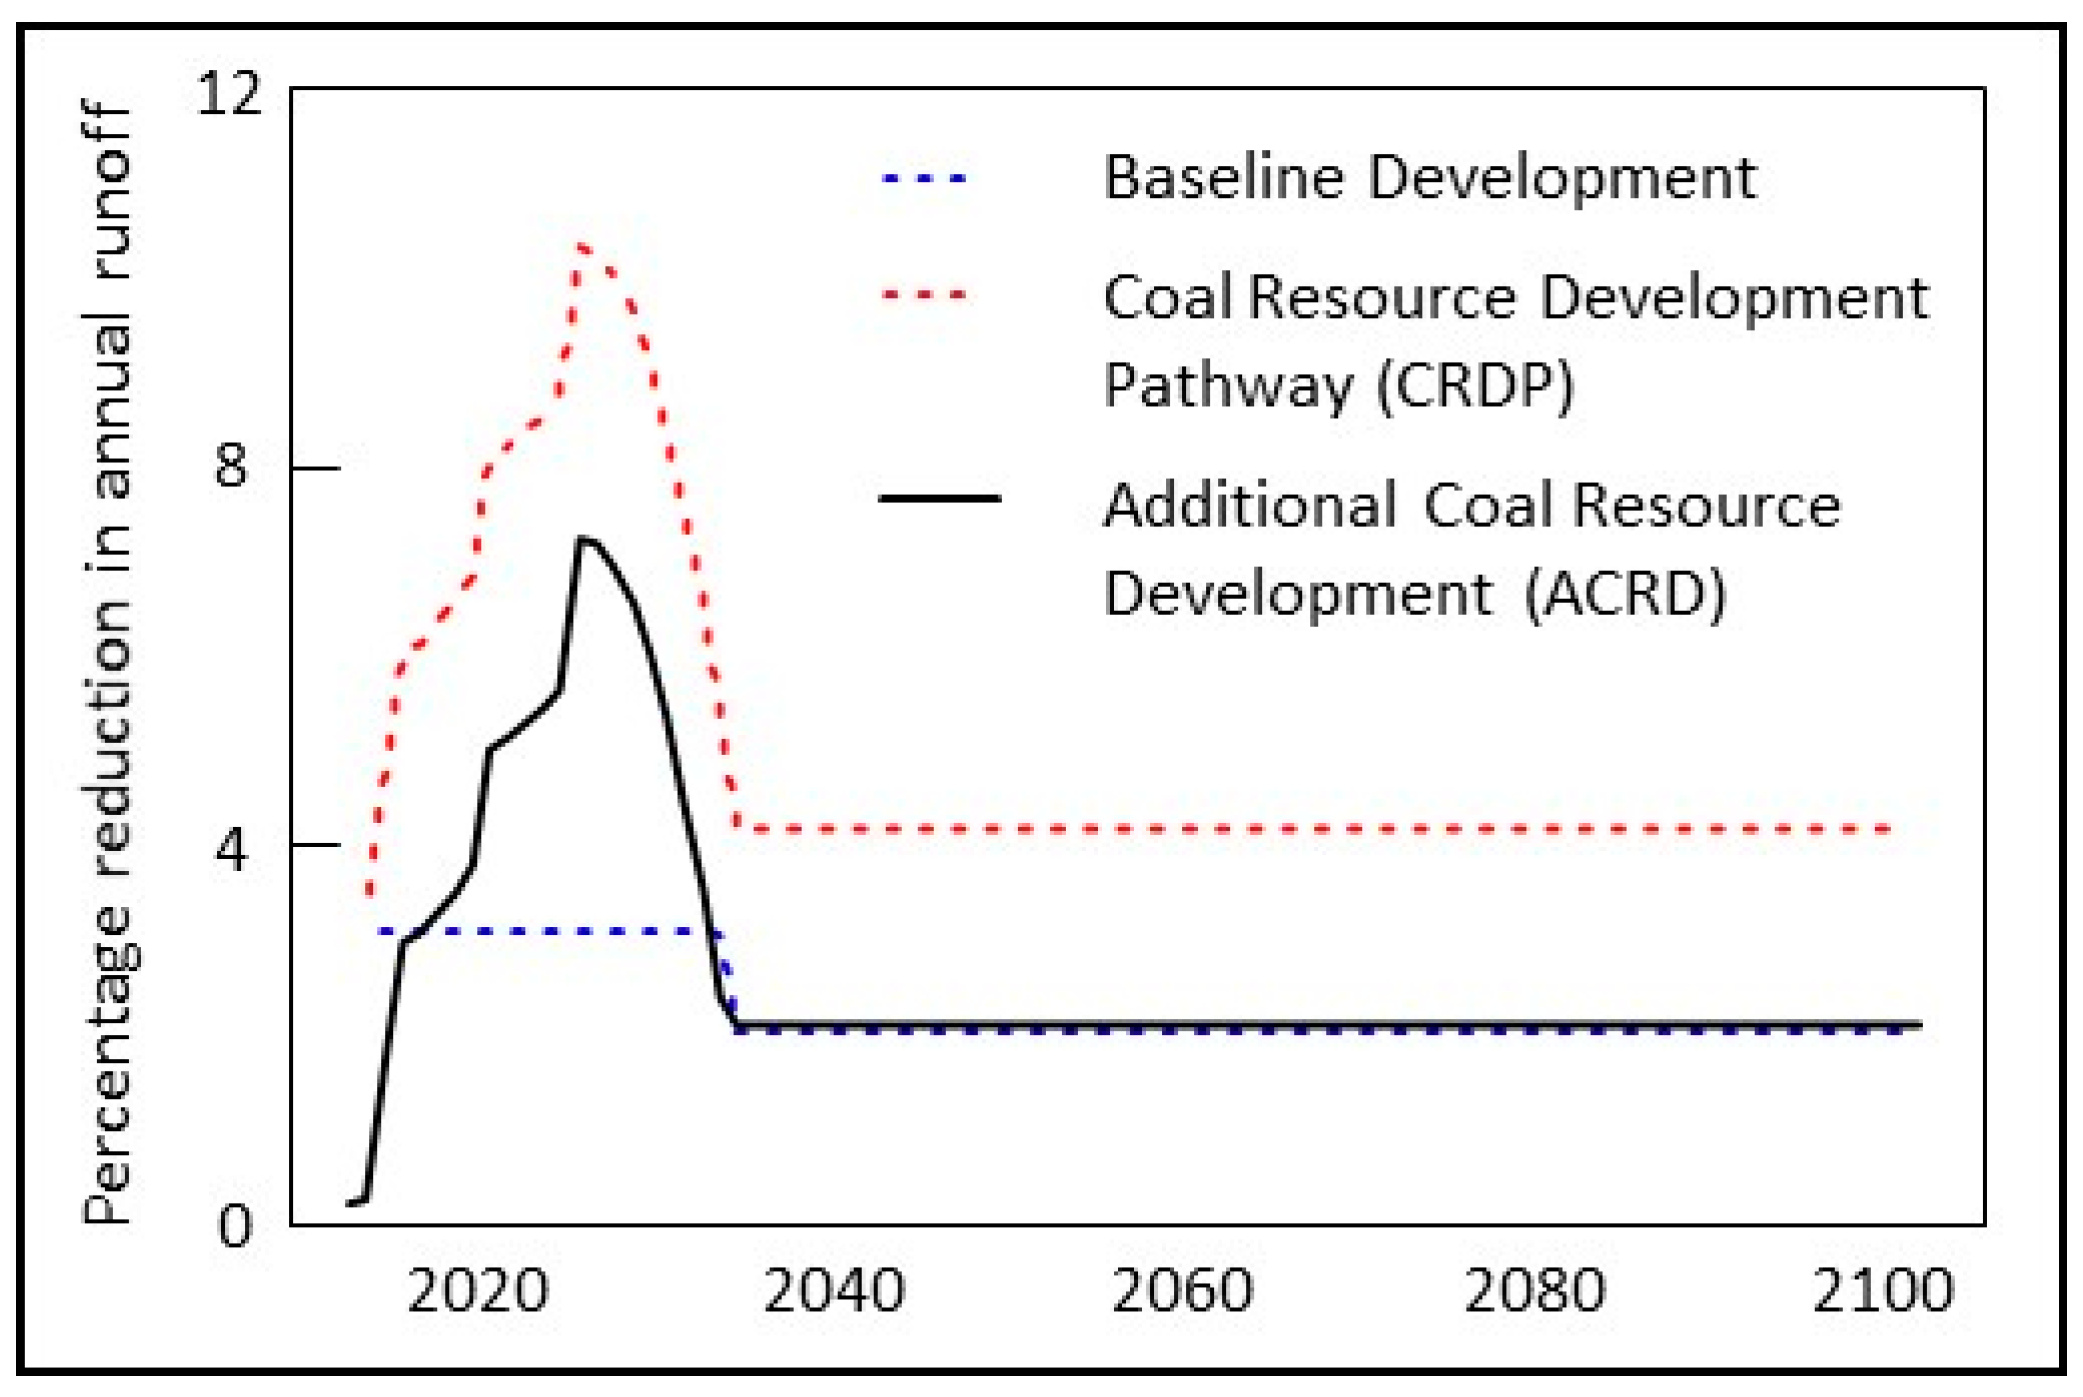
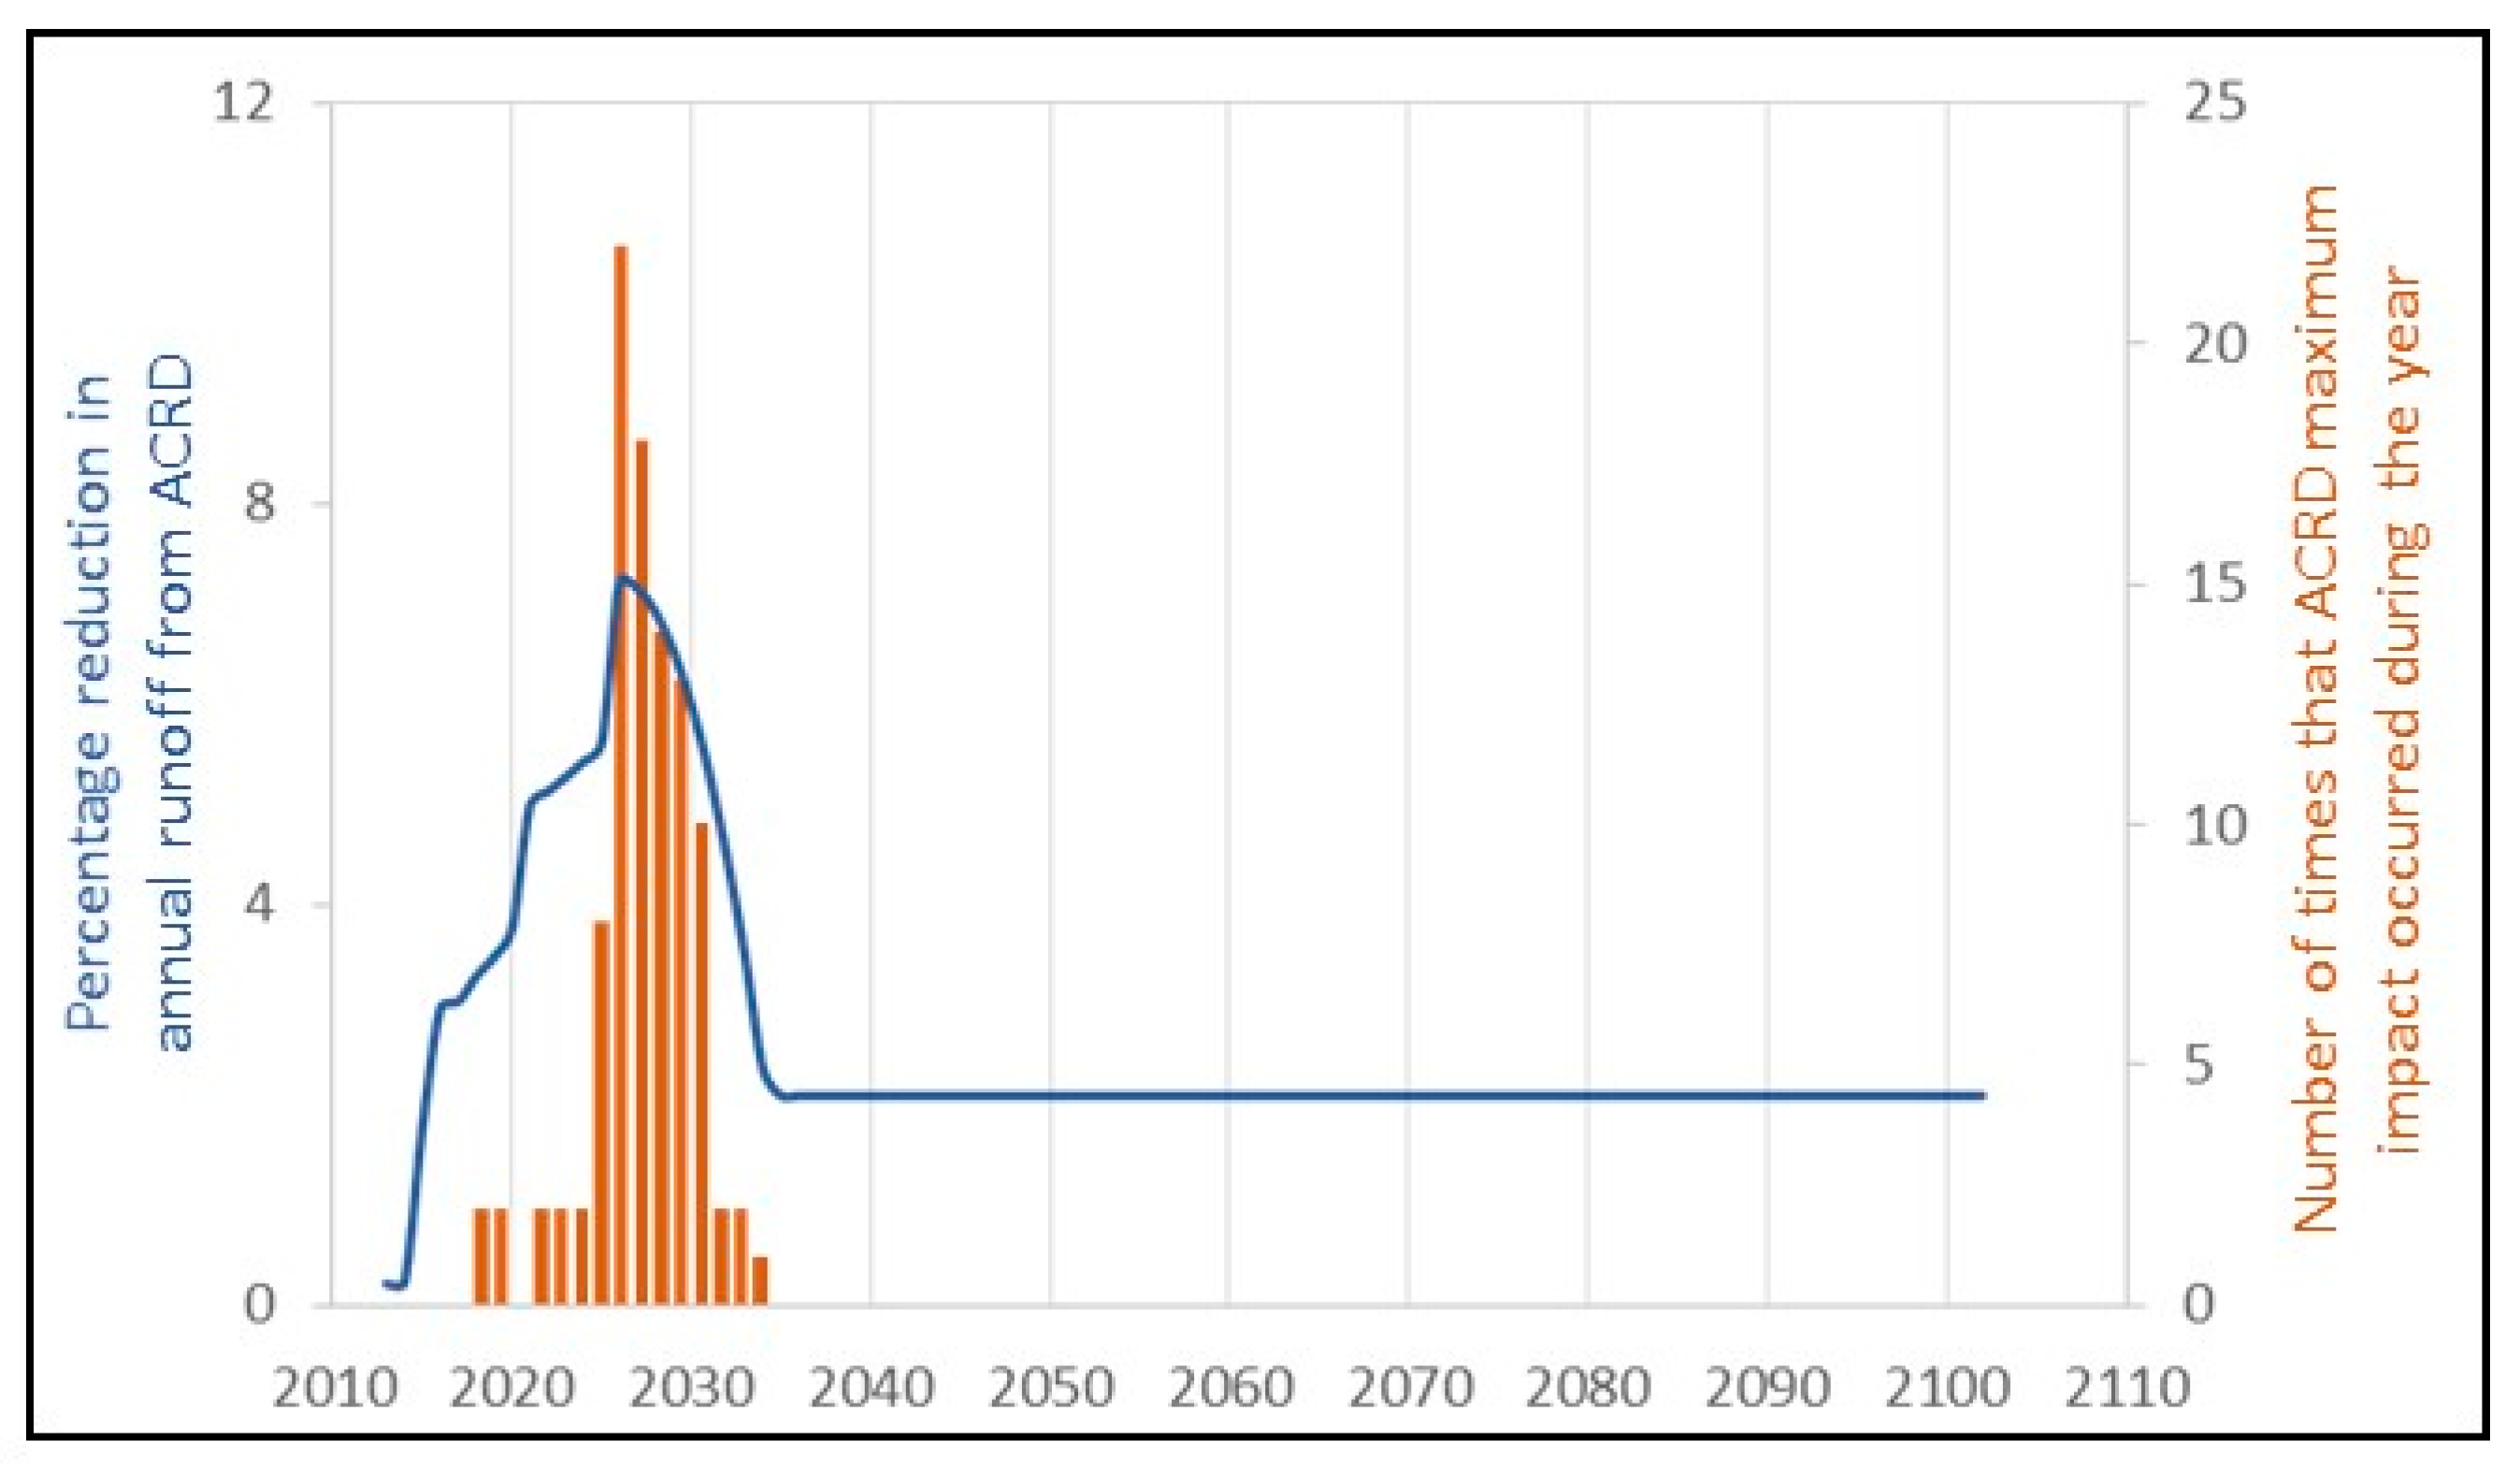
9] for discussion on the potential impact of mining on water quality). The mine footprint areas change over the lifetime of the mine operations. As new parts of the lease become active, the footprint increases. As mined parts of the lease are rehabilitated and the runoff returned to natural drainage, the footprint decreases. There are three coal mines proposed in the Gloucester sub-region and their combined impact over time, expressed as percentage reduction in daily modelled runoff at Node 14, is shown in
Figure 2. The impact is shown for Node 14 because the mine impact is largest here, and most of the subsequent discussions will focus on the impact at Node 14 (
Figure 1). The impact is largest in Node 14 as it is downstream of the additional coal resource development (pink areas just south of Node 14) before the tributary enters the Avon River (
Figure 1).
Figure 2 shows two modifications or reductions to the modelled “natural” runoff: for a baseline condition that includes all coal mines commercially producing as of December 2012; and for the coal resource development pathway (CRDP) defined as a future with coal mines in the baseline as well as those that are expected to begin commercial production after December 2012. The impact of additional coal resource development (ACRD) is defined as the impact from CRDP minus the impact from baseline. The largest mine footprint impacting Node 14 occurs in the year 2026.
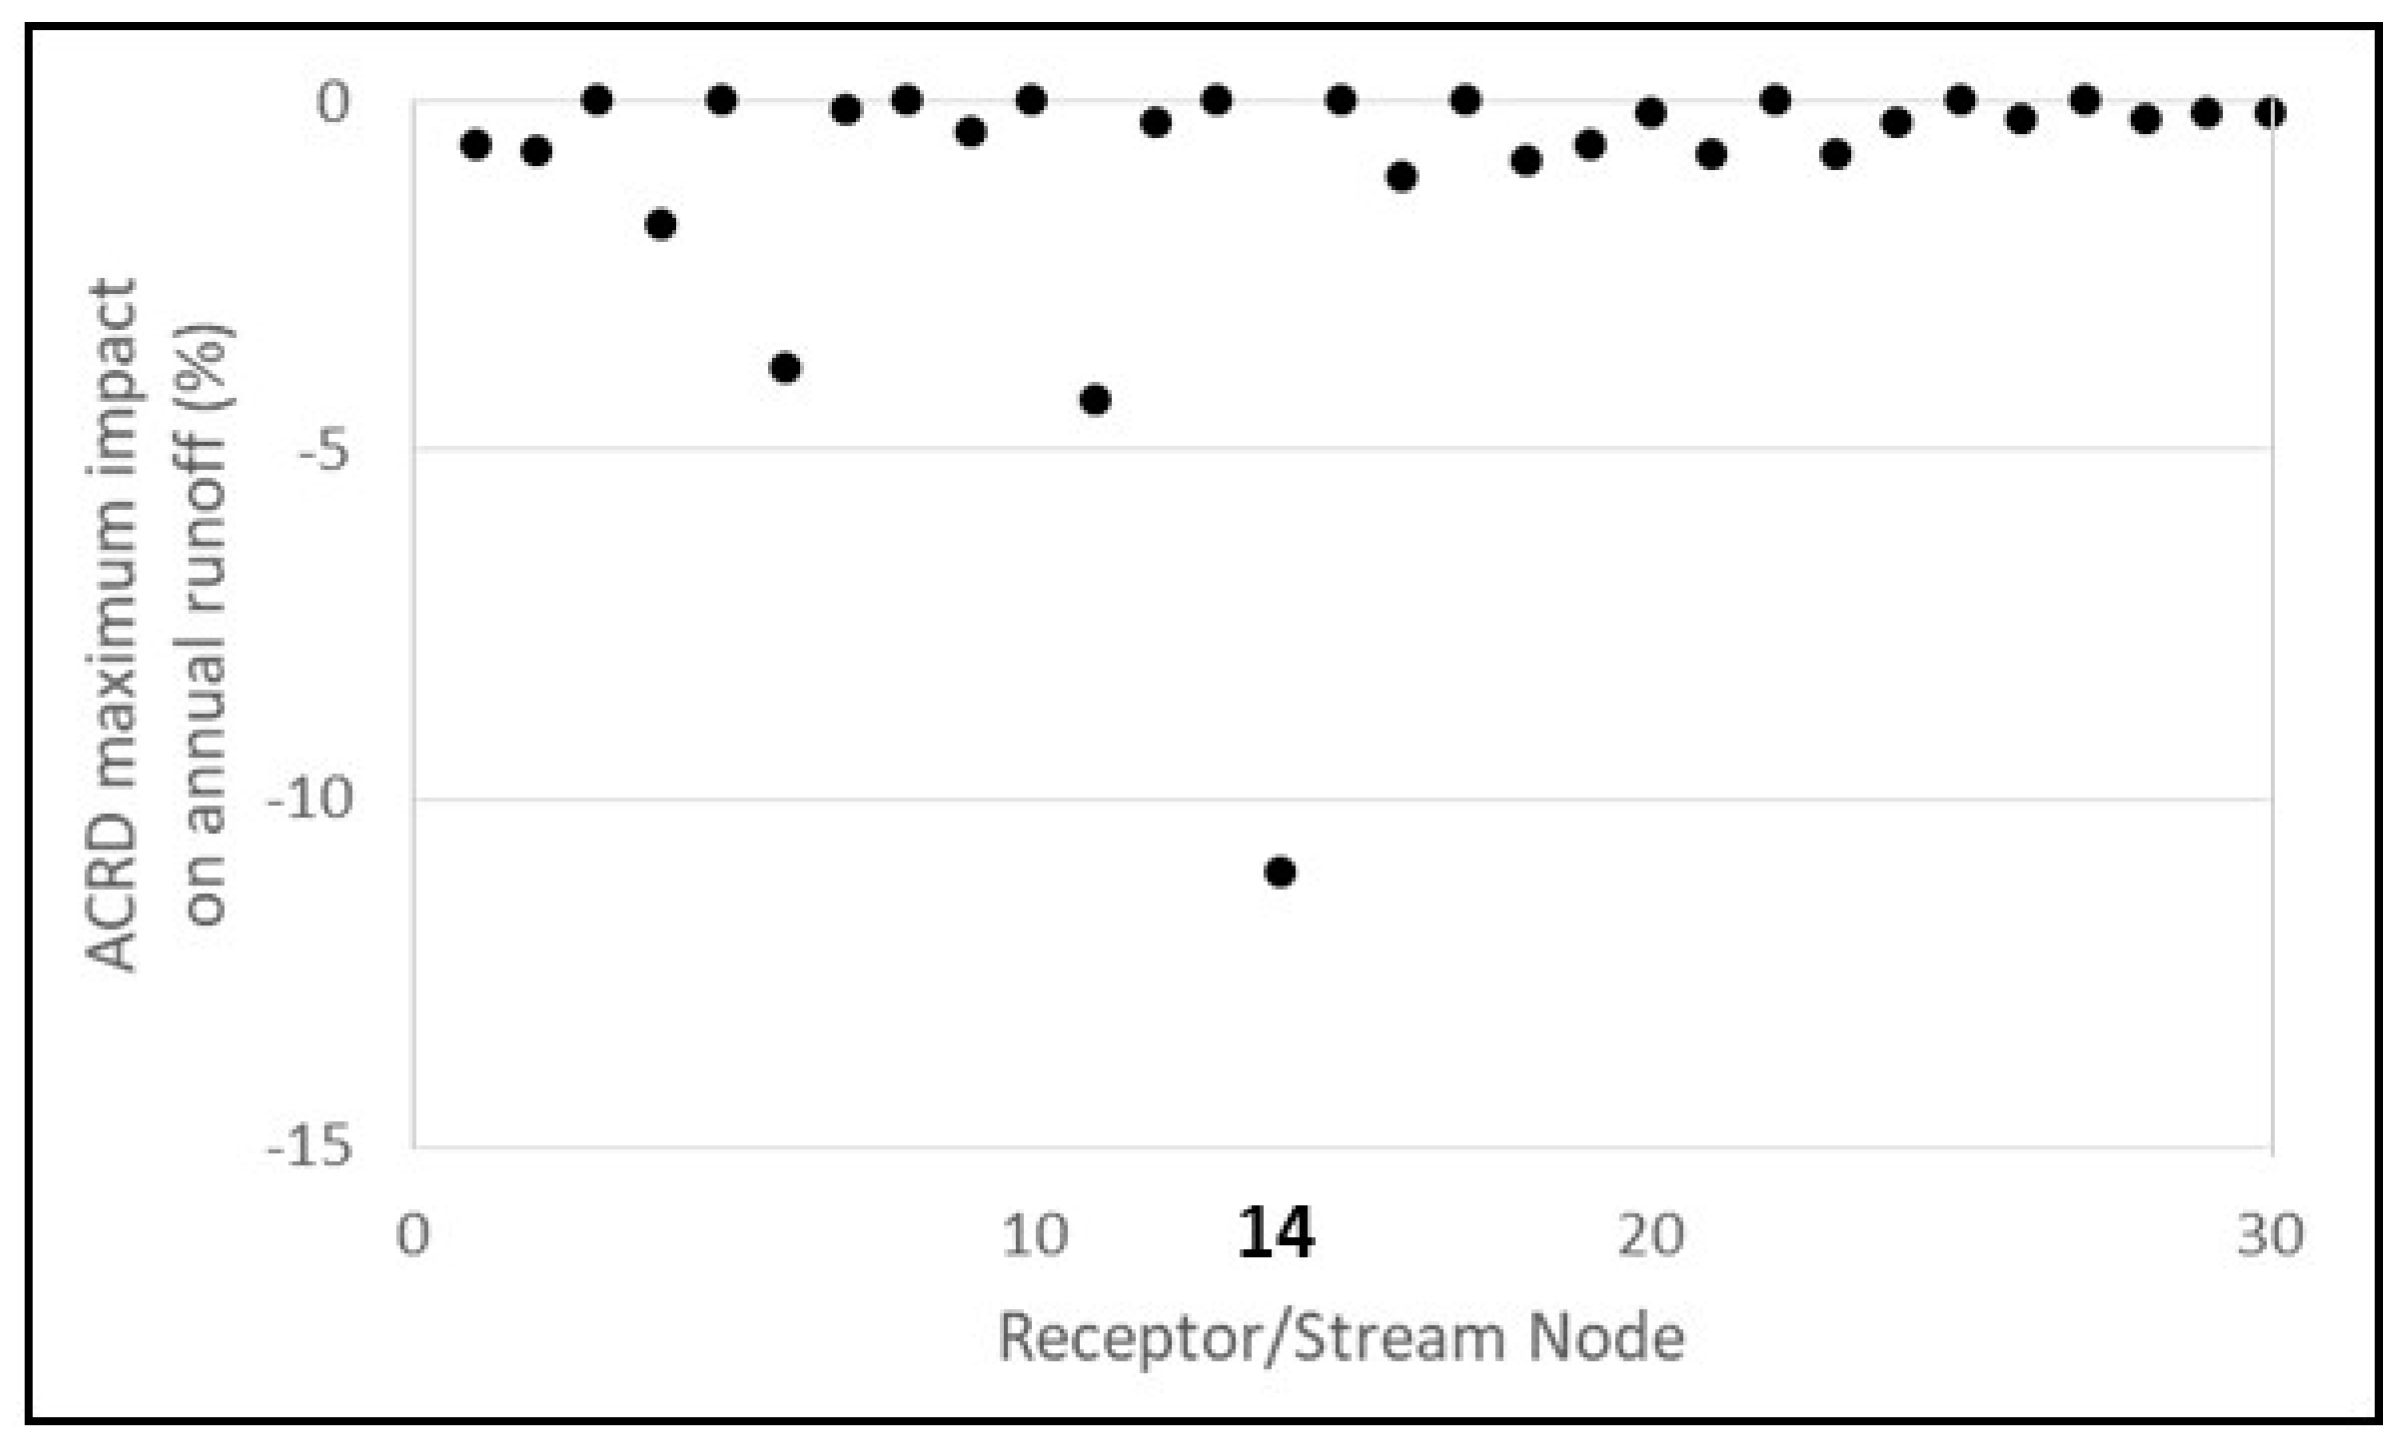
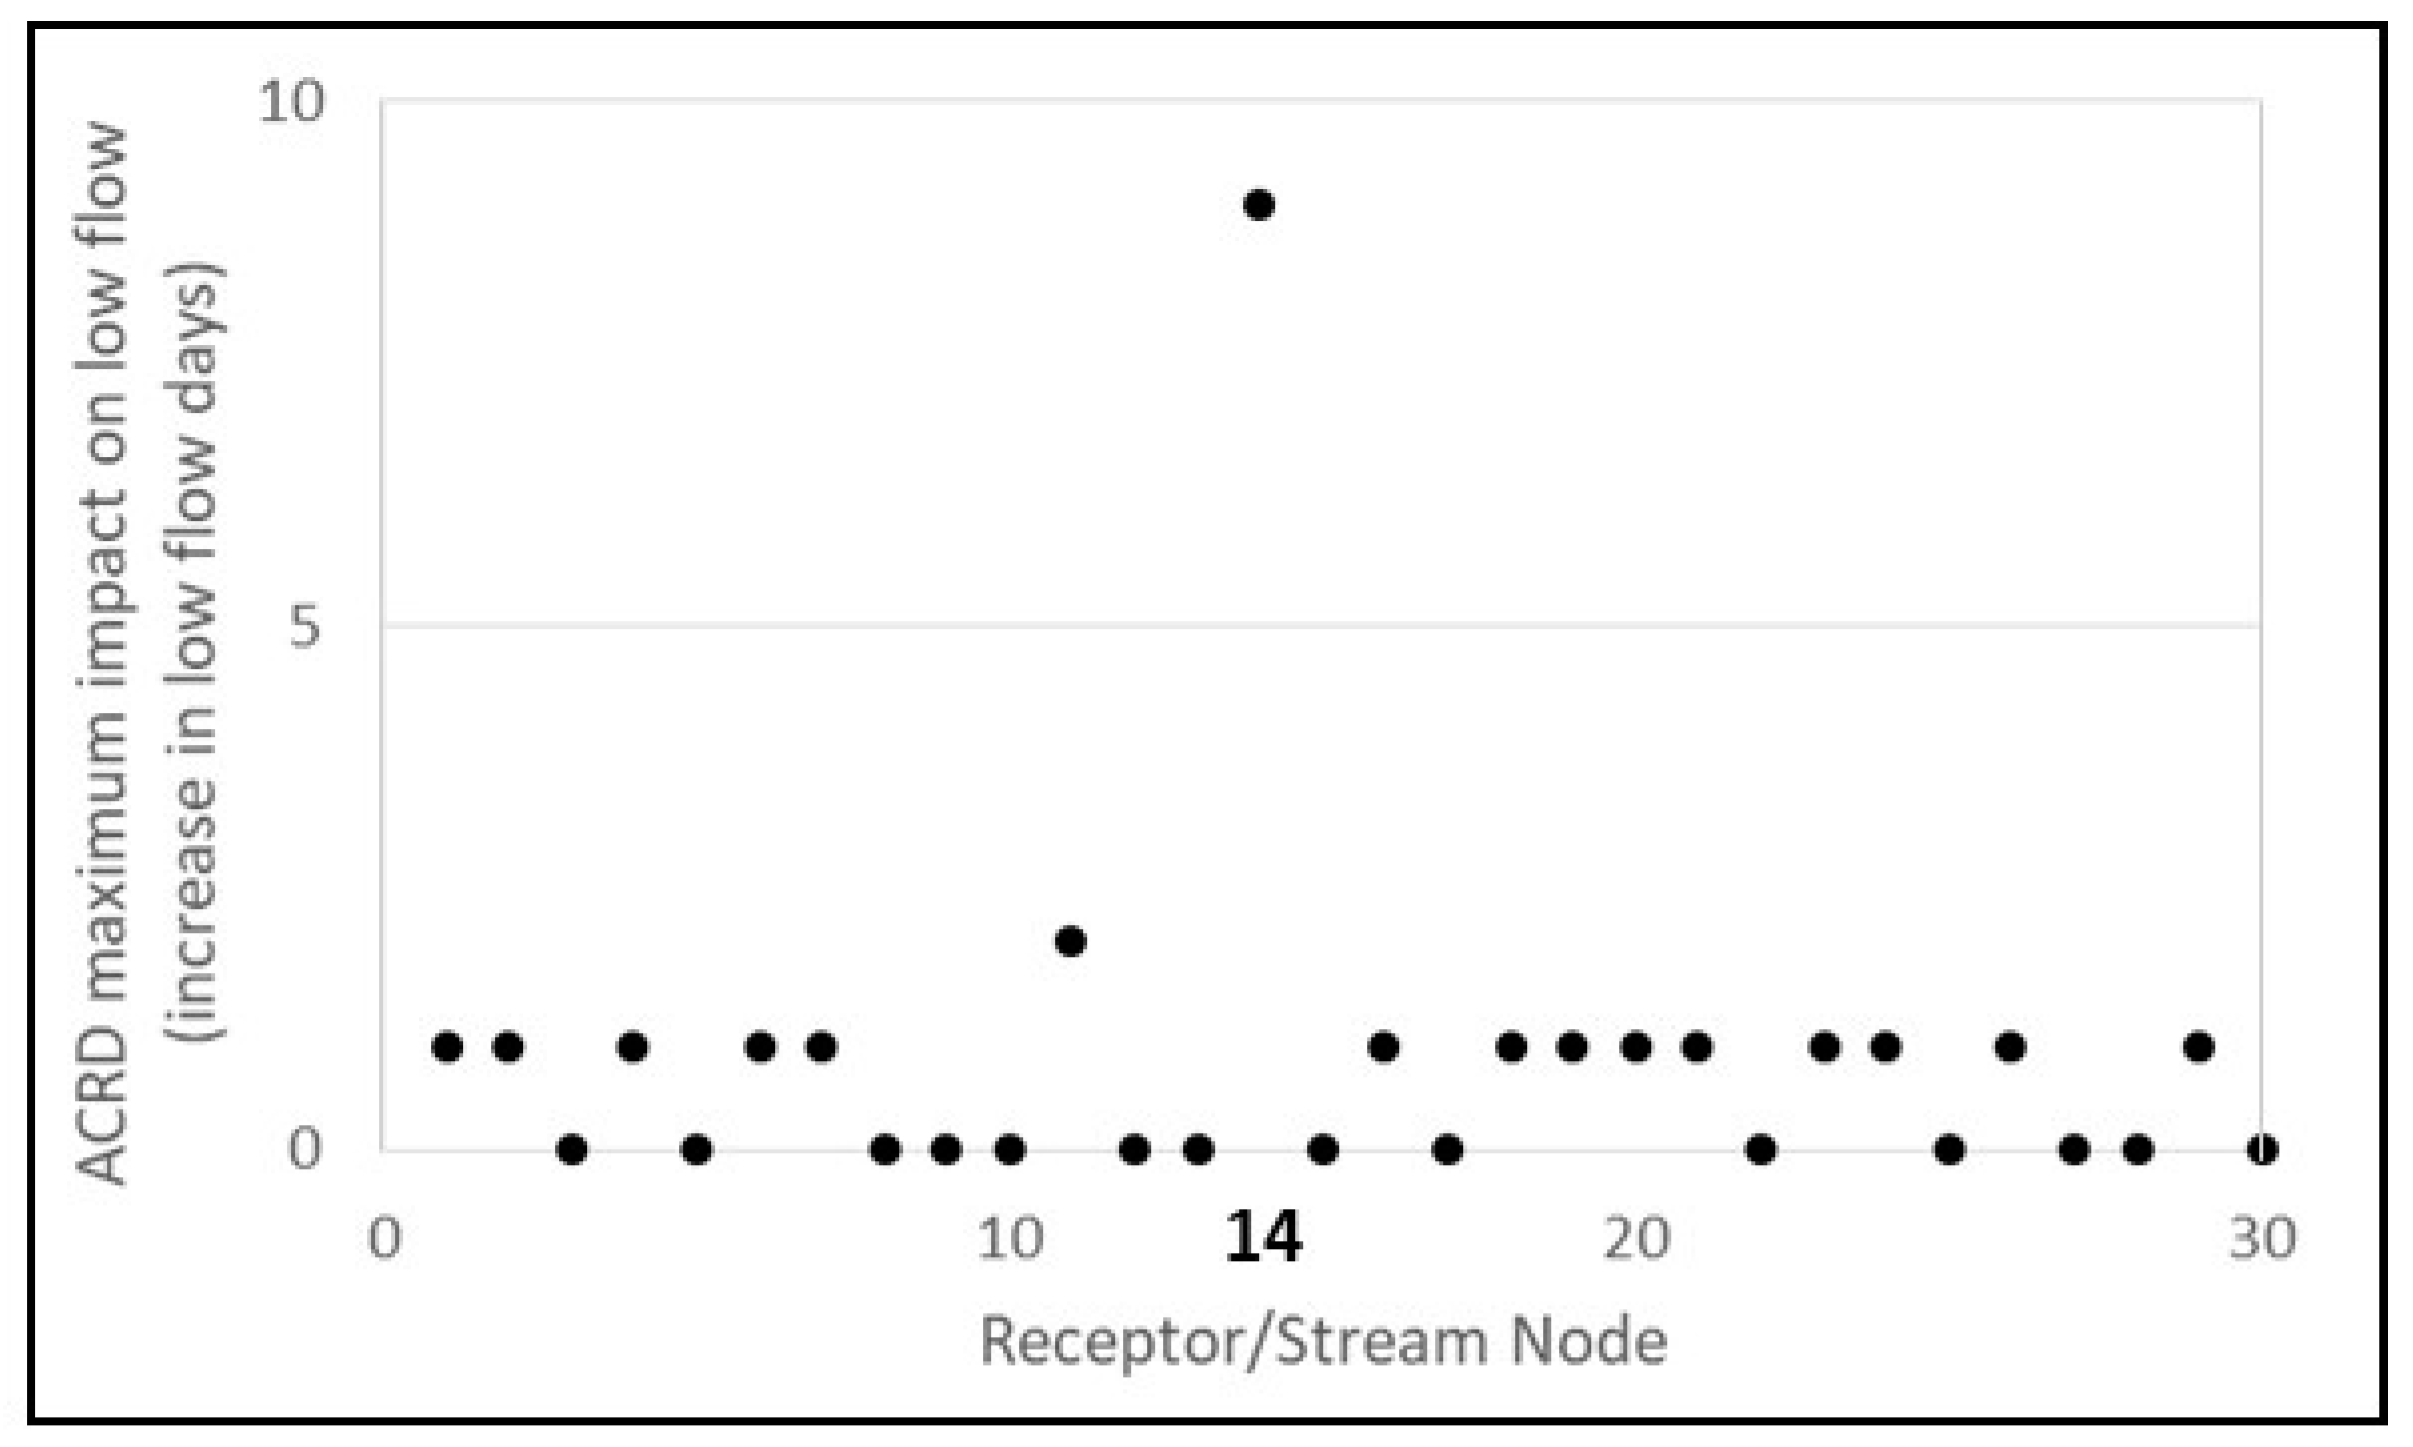
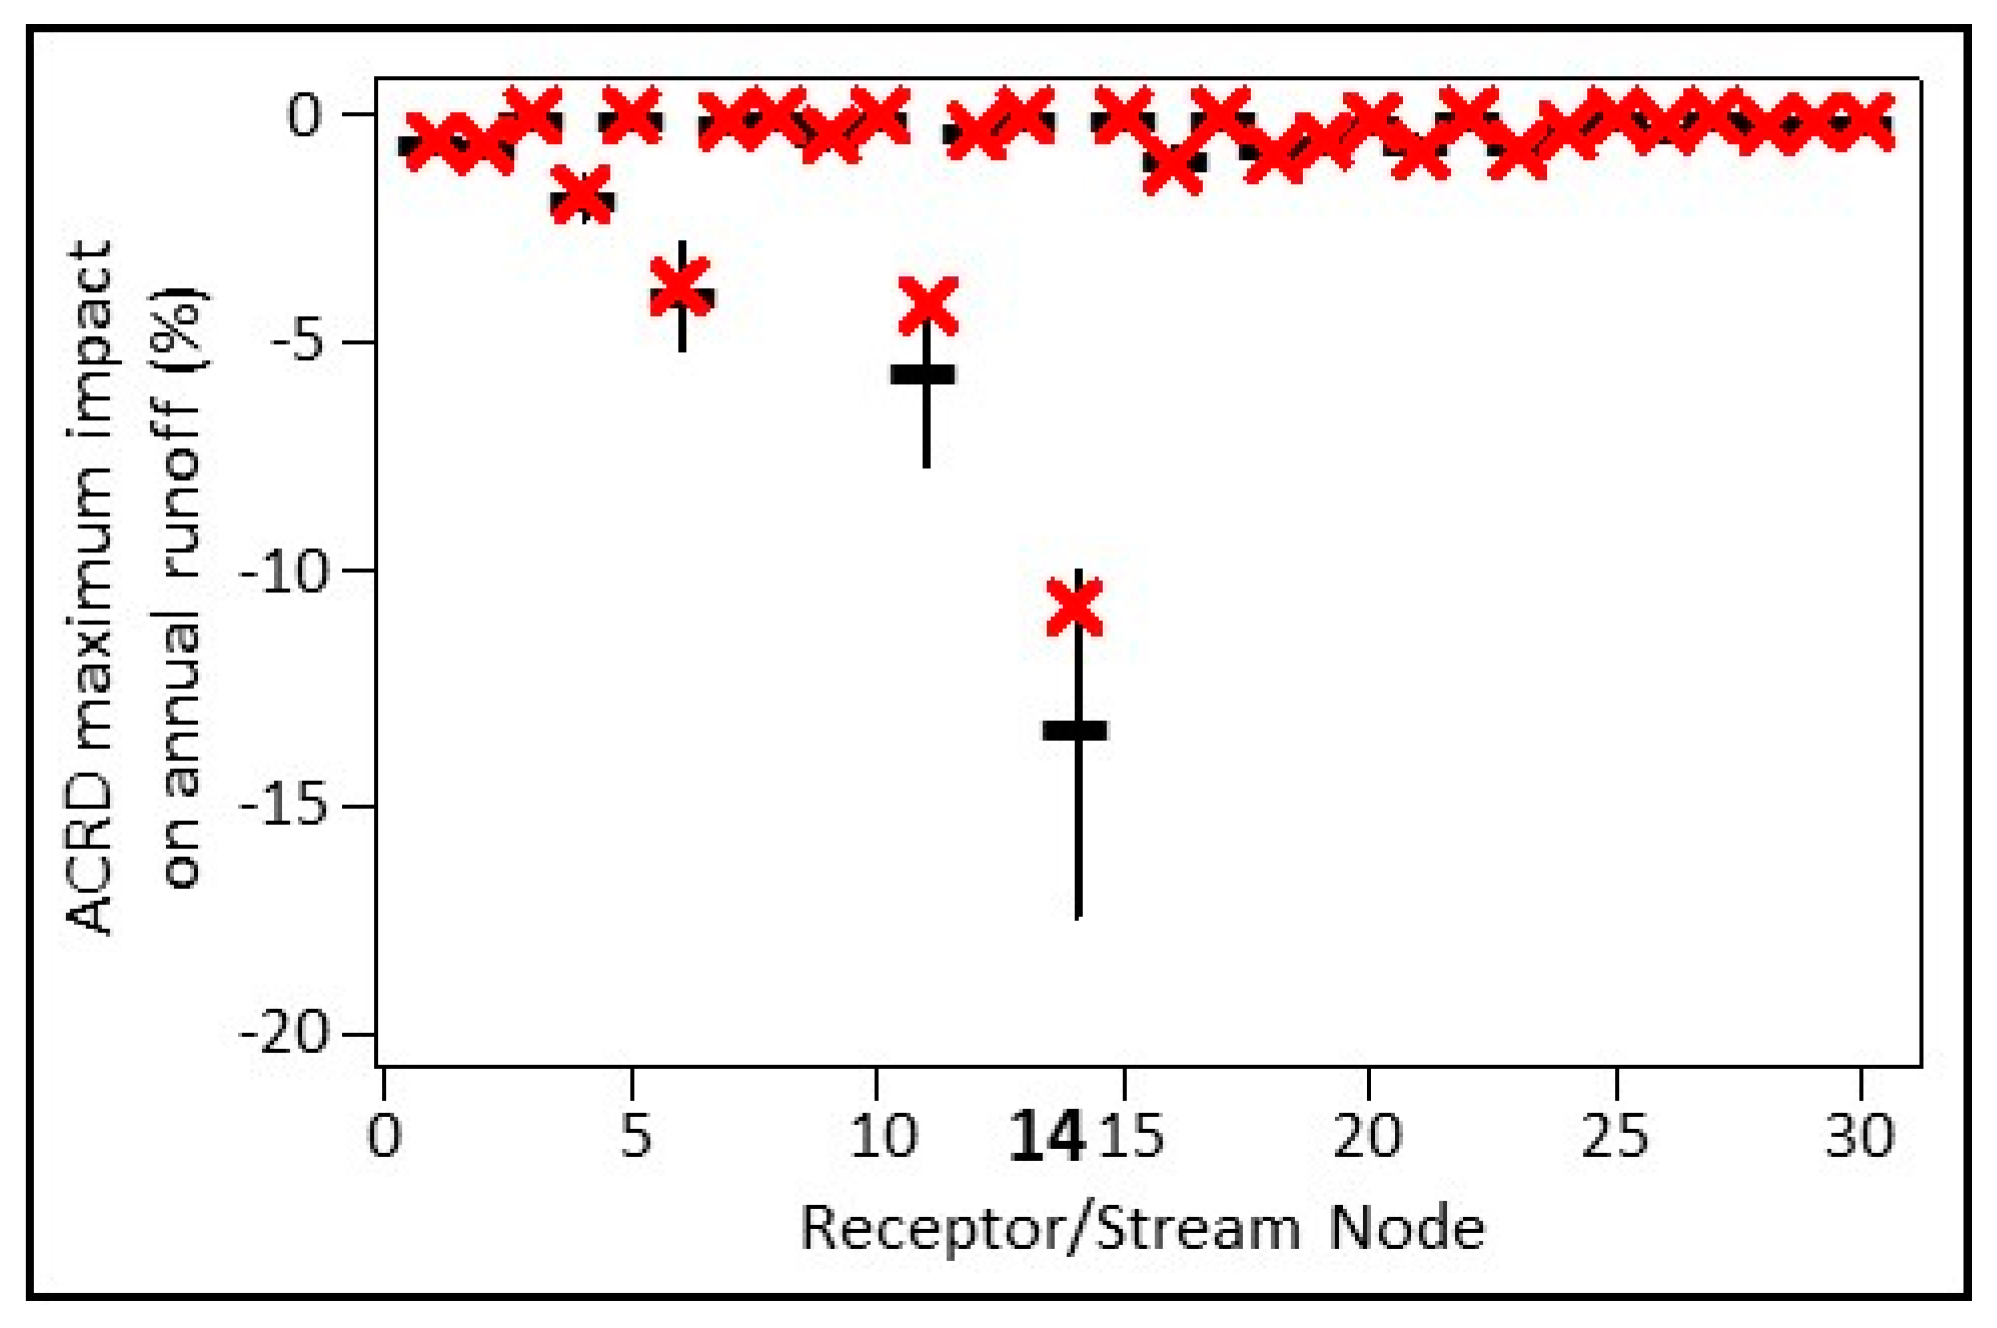
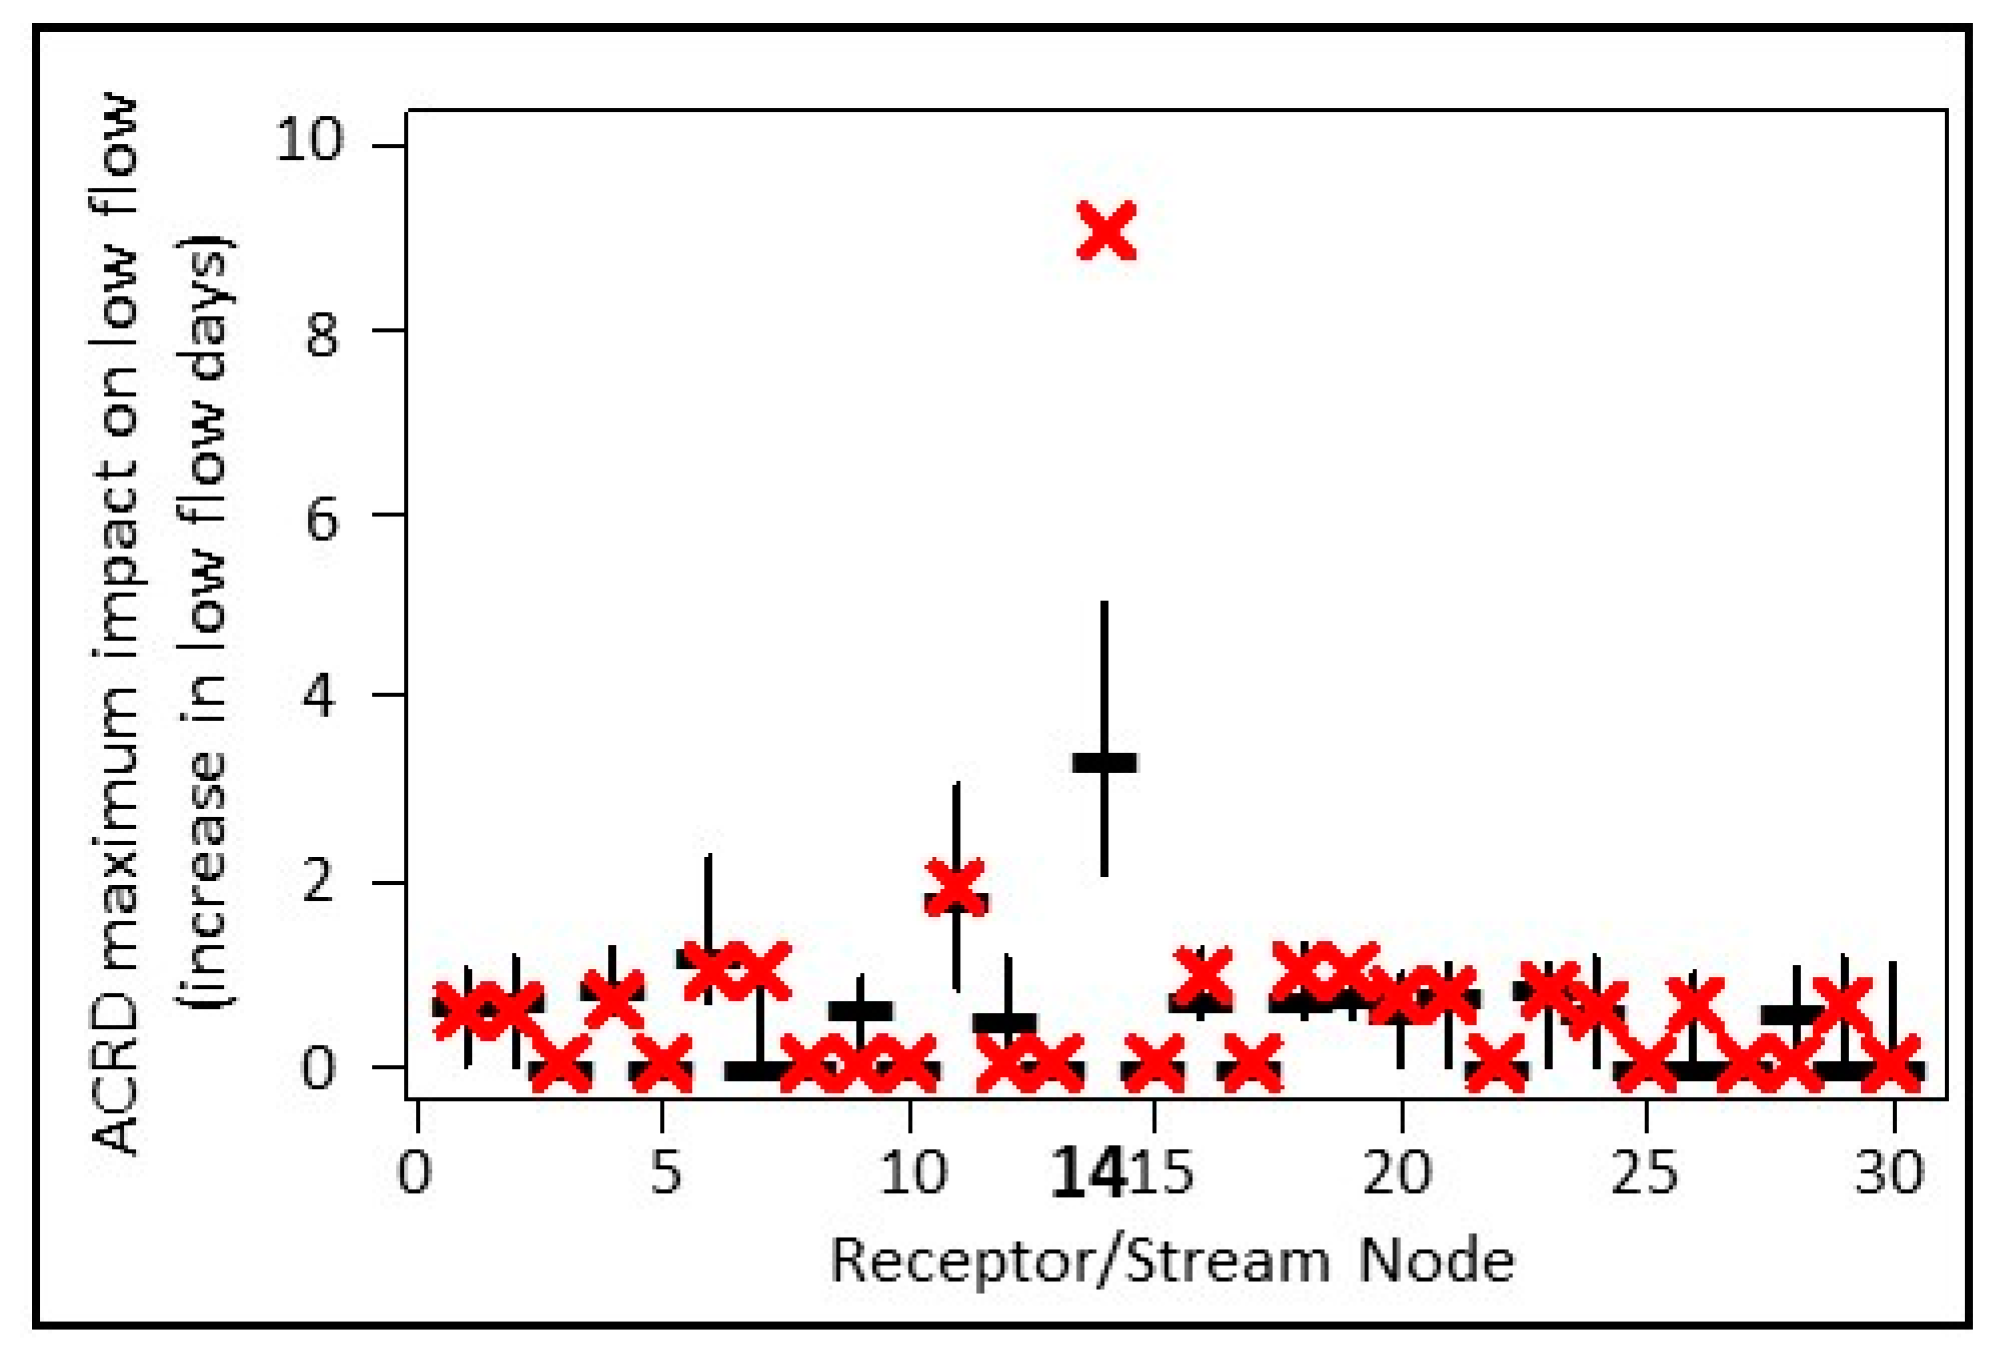
The modelling results for two hydrological variables are presented and discussed. The first variable is annual runoff, which reflects the volume of available water. The second variable reflects low flows and is defined as the number of days in the year when daily runoff is below the fifth percentile daily runoff value (this will be referred to as ‘low flow days’). The fifth percentile daily runoff is estimated from the modelled 2013–2102 runoff series (90 years) with no mining development. Analysis of the modelling results therefore gives a time series of 90 values corresponding to the 90 years of both annual runoff and low flow days. A 90-year time series of ACRD impact is then calculated as the difference between the values in the CRDP simulation and the baseline simulation. The maximum impact is then defined as the maximum absolute value in the ACRD impact time series. The maximum ACRD impact is influenced mainly by the mine footprint (this generally occurs around 2026 for Node 14 when the mine footprint in largest), and also by the runoff in the different years. The maximum annual runoff impact is presented as the reduction in annual runoff expressed as the percentage of the mean annual runoff. The maximum ‘low flow’ impact is presented as the increase in number of days with runoff below the fifth percentile. The maximum ACRD impact on annual runoff and on low flow at the 30 nodes are shown in
Figure 3 and
Figure 4, respectively. The plots show significant ACRD impact at Node 14 (maximum annual runoff impact of 11% and maximum low flow impact of nine days) and little impact elsewhere.
There are several differences in the simplified modelling here compared to the Bioregional Assessments modelling described in [
4], and the key differences are described for context and to facilitate relating the results here to the Gloucester Bioregional Assessments modelling results. First, the modelling in this study considers only runoff reduction from the footprint of coal mining development. The impact of groundwater extraction and groundwater dewatering from coal mining and coal seam gas development on baseflow is relatively small in the Gloucester sub-region [
4] (see [
10] for a description of groundwater modelling) but can be very significant (particularly on low flow characteristics) in other bioregions (e.g., the Hunter sub-region, [
11]). Second, the uncertainty in model parameterization and in the assumptions used to quantify the impact of coal mining development is not considered here. Third, the modelling here uses the 1923–2012 climate series to represent 90 years of 2013–2102 climate, whilst the Bioregional Assessments concatenate the 30-year 1983–2012 climate series to represent the 2013–2102 climate. Fourth, the Bioregional Assessments present results for a much larger number of hydrological variables. Nevertheless, the modelling here gives results that are very similar to the Bioregional Assessment modelling for the Gloucester sub-region and facilitates the exploration of the impact of coal mining development in the context of climate change and hydroclimate variability.
3. Impact of Coal Mining Development in the Context of Climate Change
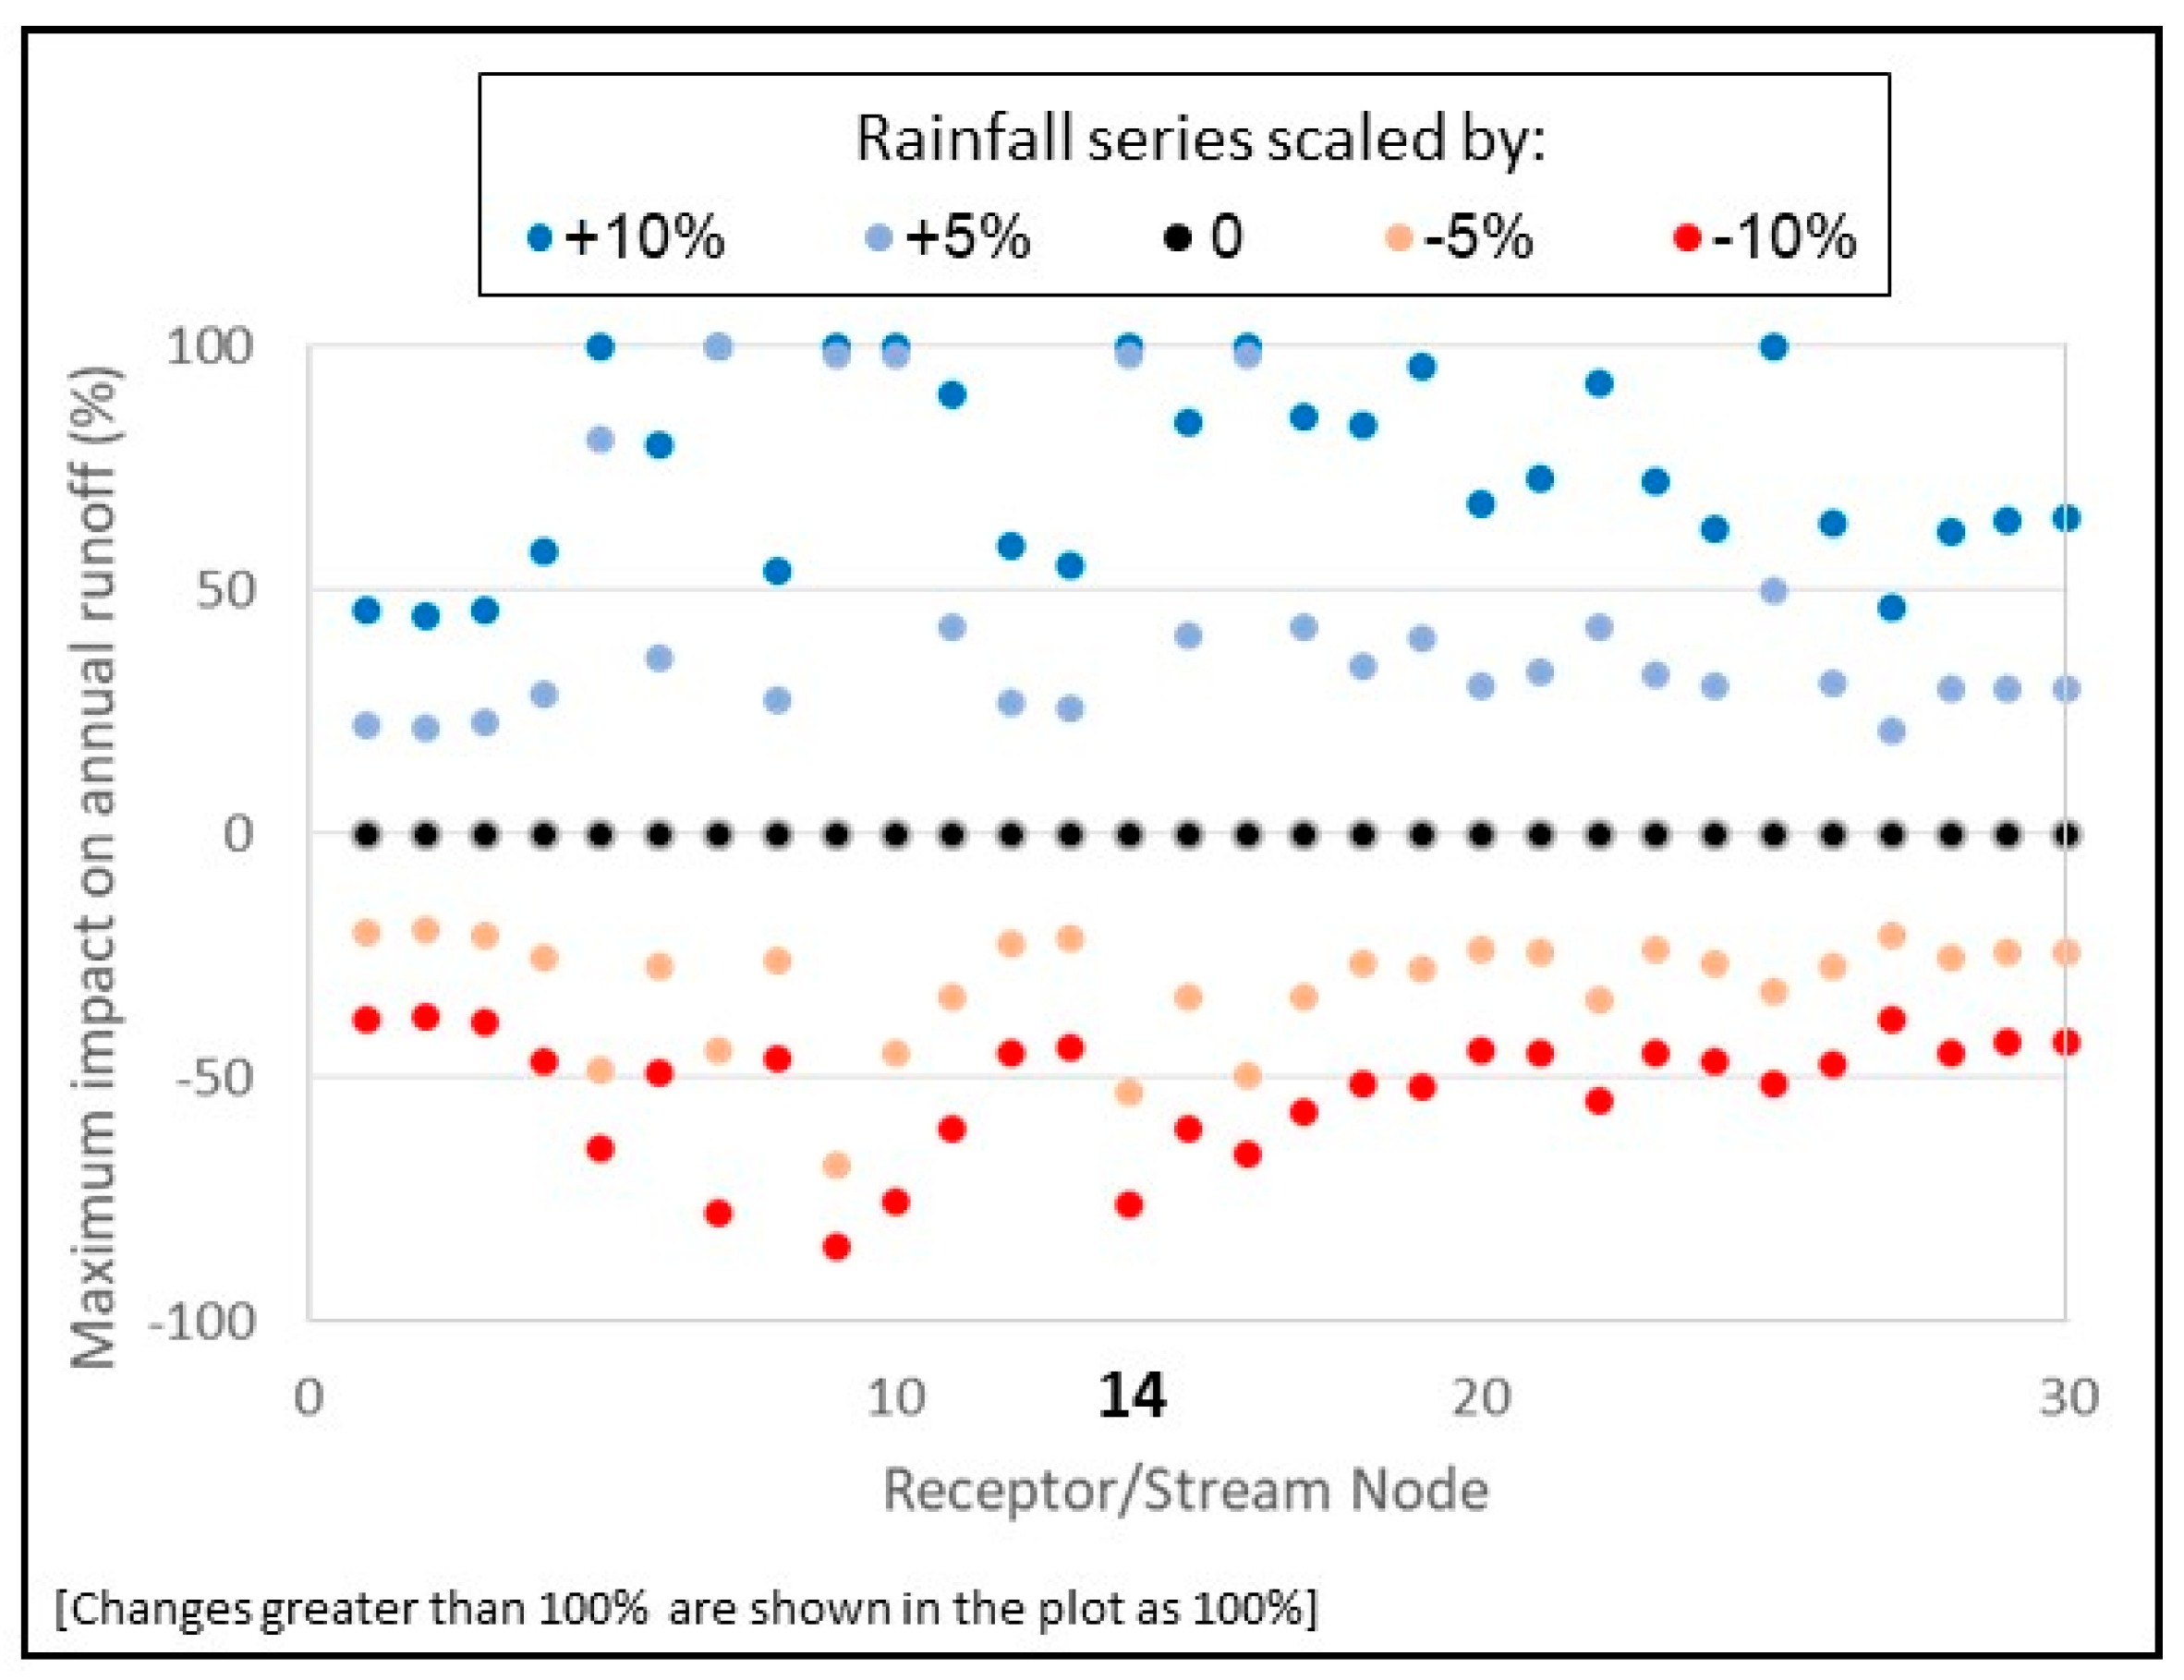
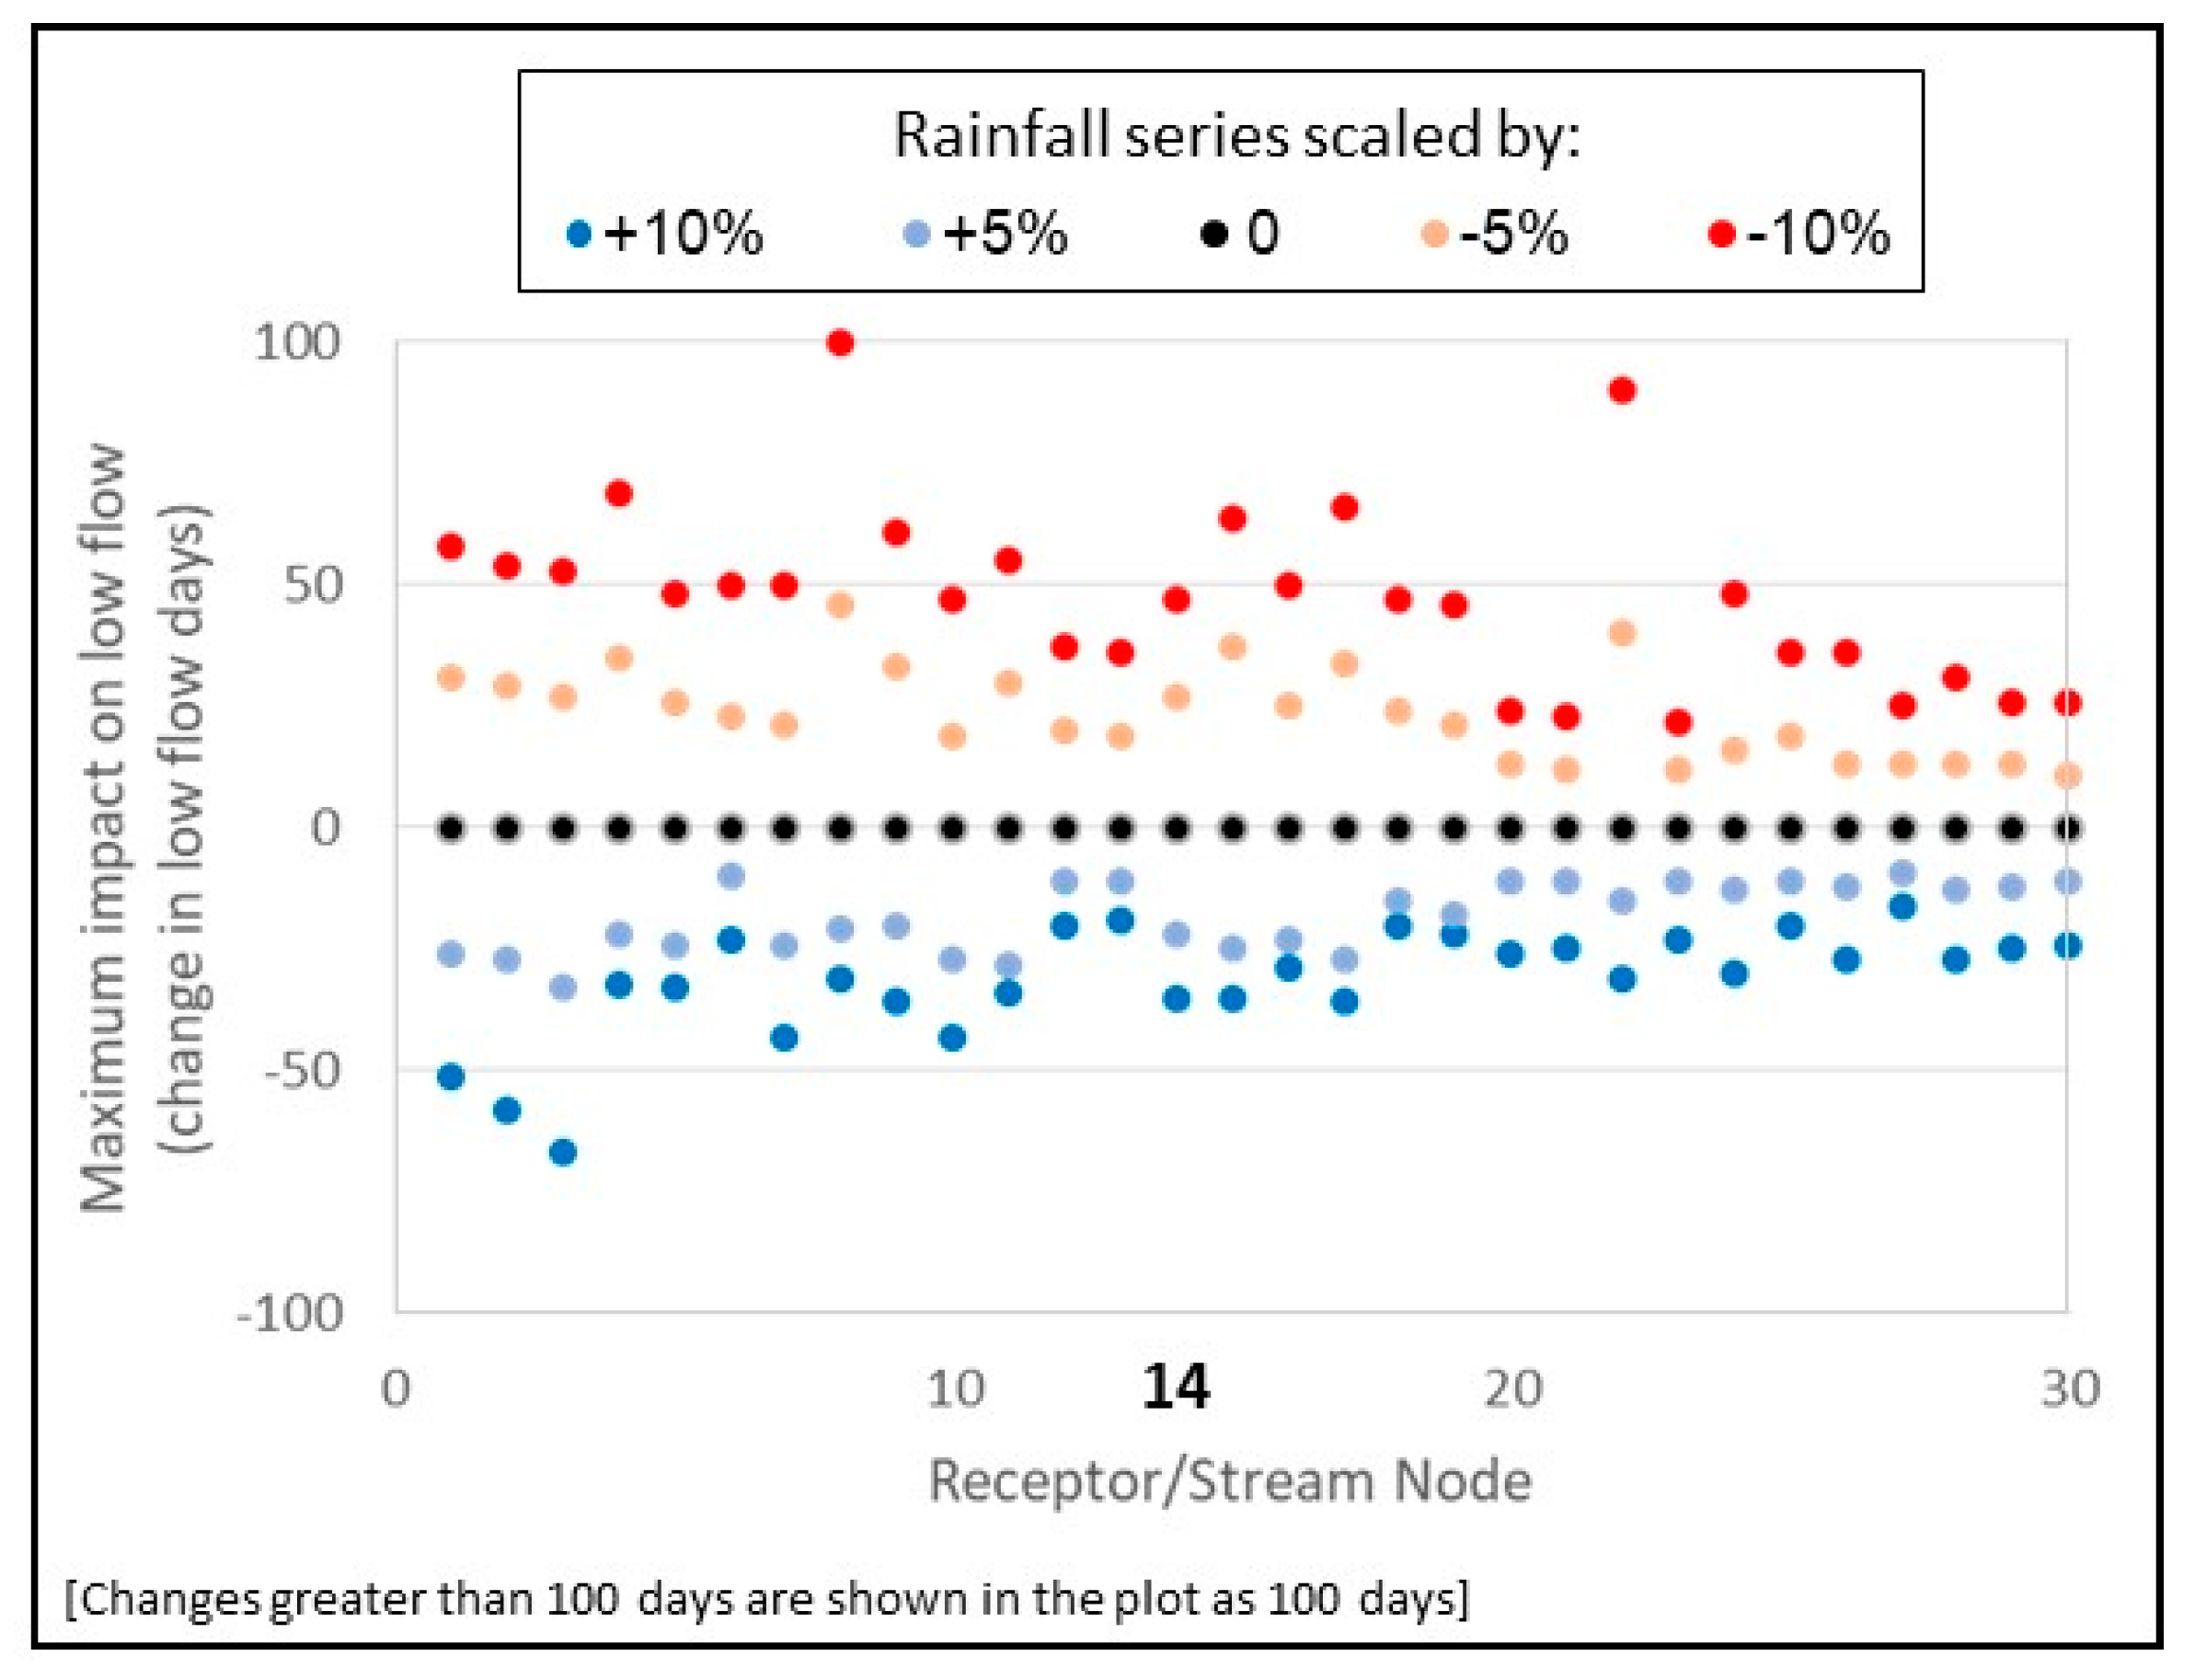
The sensitivity of runoff to future climates is simplistically explored here by scaling the 2013–2102 rainfall series used in the modelling above. The entire 90 years of daily rainfall is scaled by the same factor. Scaling factors of −10%, −5%, +5% and +10% are used. The results for annual runoff and for low flow are presented in
Figure 5 and
Figure 6, respectively. The plots show the maximum change in the streamflow characteristics (as defined above) for the scaled rainfall series (reflecting plausible changes in future mean annual rainfall) relative to the original 2013–2102 rainfall series with no mining development. As expected, the percentage change in rainfall is amplified as a bigger percentage change in runoff [
12,
13]. The 5% scaling led to a maximum annual runoff change of 20–30% at most receptor or stream nodes, and the 10% scaling led to a maximum annual runoff change of more than 50% at most nodes (
Figure 5), much greater than the ACRD (proposed coal mine development) maximum annual runoff impact of 11% at Node 14 and close to zero elsewhere (
Figure 3). For low flow, the −5% scaling led to a maximum change of 10–30 more low flow days (number of days when daily runoff is below the fifth percentile value) at most nodes, and the −10% scaling led to a maximum change of 30–50 more low flow days at most nodes (
Figure 6), also significantly greater than the ACRD maximum low flow impact of nine days at Node 14 and close to zero elsewhere (
Figure 4).
The impact on the streamflow characteristics under moderate and high climate change projections will therefore be greater than the impact from the coal mining development, particularly in regions like the Gloucester with a relatively small proposed development. However, there is considerable uncertainty in the future climate projections, and the impact from coal mining development relative to climate change will be more significant where large mining development is proposed and relatively small climate change impact is realised.
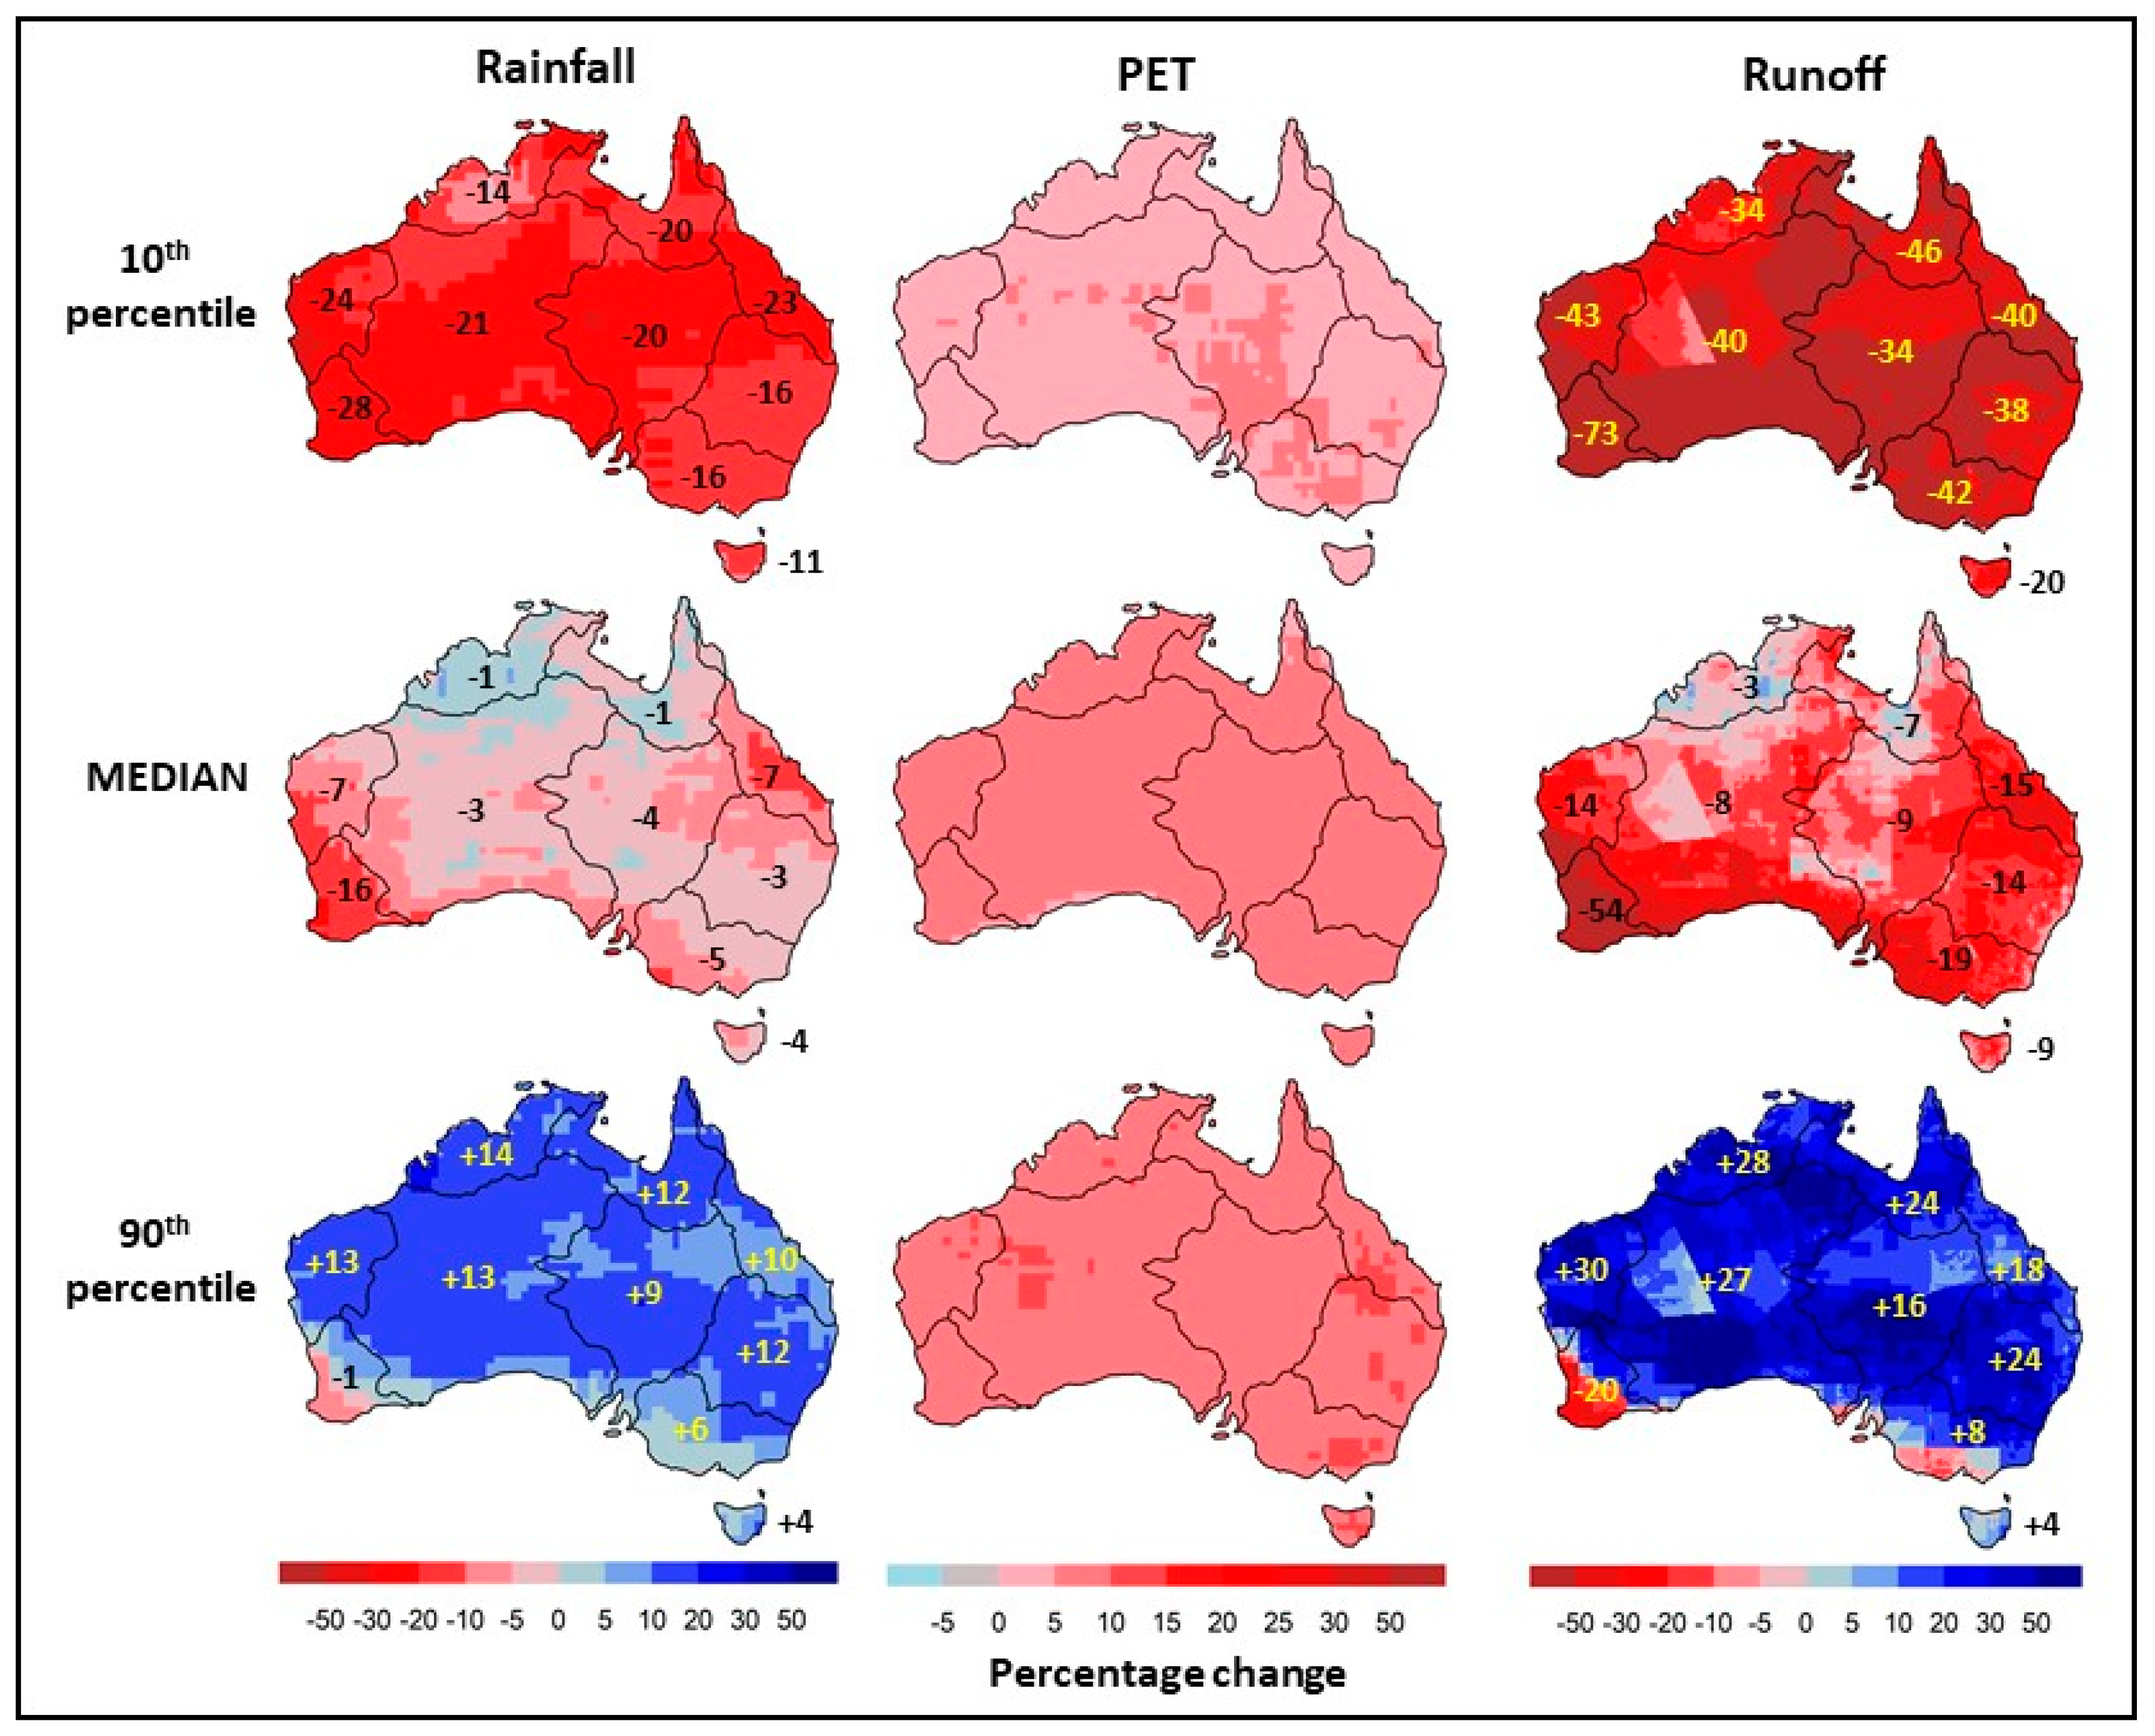
Figure 7 shows, for context, the most recent projections of future rainfall, potential evapotranspiration and runoff across Australia. The plots show projected changes for 2046–2075 relative to 1976–2005 for RCP8.5 (highest Representative greenhouse gas Concentration Pathway). The range of projections (shown as 10th percentile, median, and 90th percentile values) are informed by the 42 CMIP5 (Coupled Model Intercomparison Project Phase 5) global climate models used in the Intergovernmental Panel on Climate Change Fifth Assessment Report (IPCC AR5). These projections for Australia come from [
14], which also discusses the challenges and opportunities in modelling climate change impact on hydrological fluxes and stores. The projections indicate that southern Australia is likely to be drier under climate change, whilst the direction of rainfall and runoff change is less certain elsewhere. However, there is considerable uncertainty in the projections, and the 10th and 90th projected change in future mean annual runoff can differ by more than 50%. The median projected change of annual rainfall in
Figure 7 for the Gloucester sub-region is −2%, with a 10th and 90th percentile range of −13% to +12%.
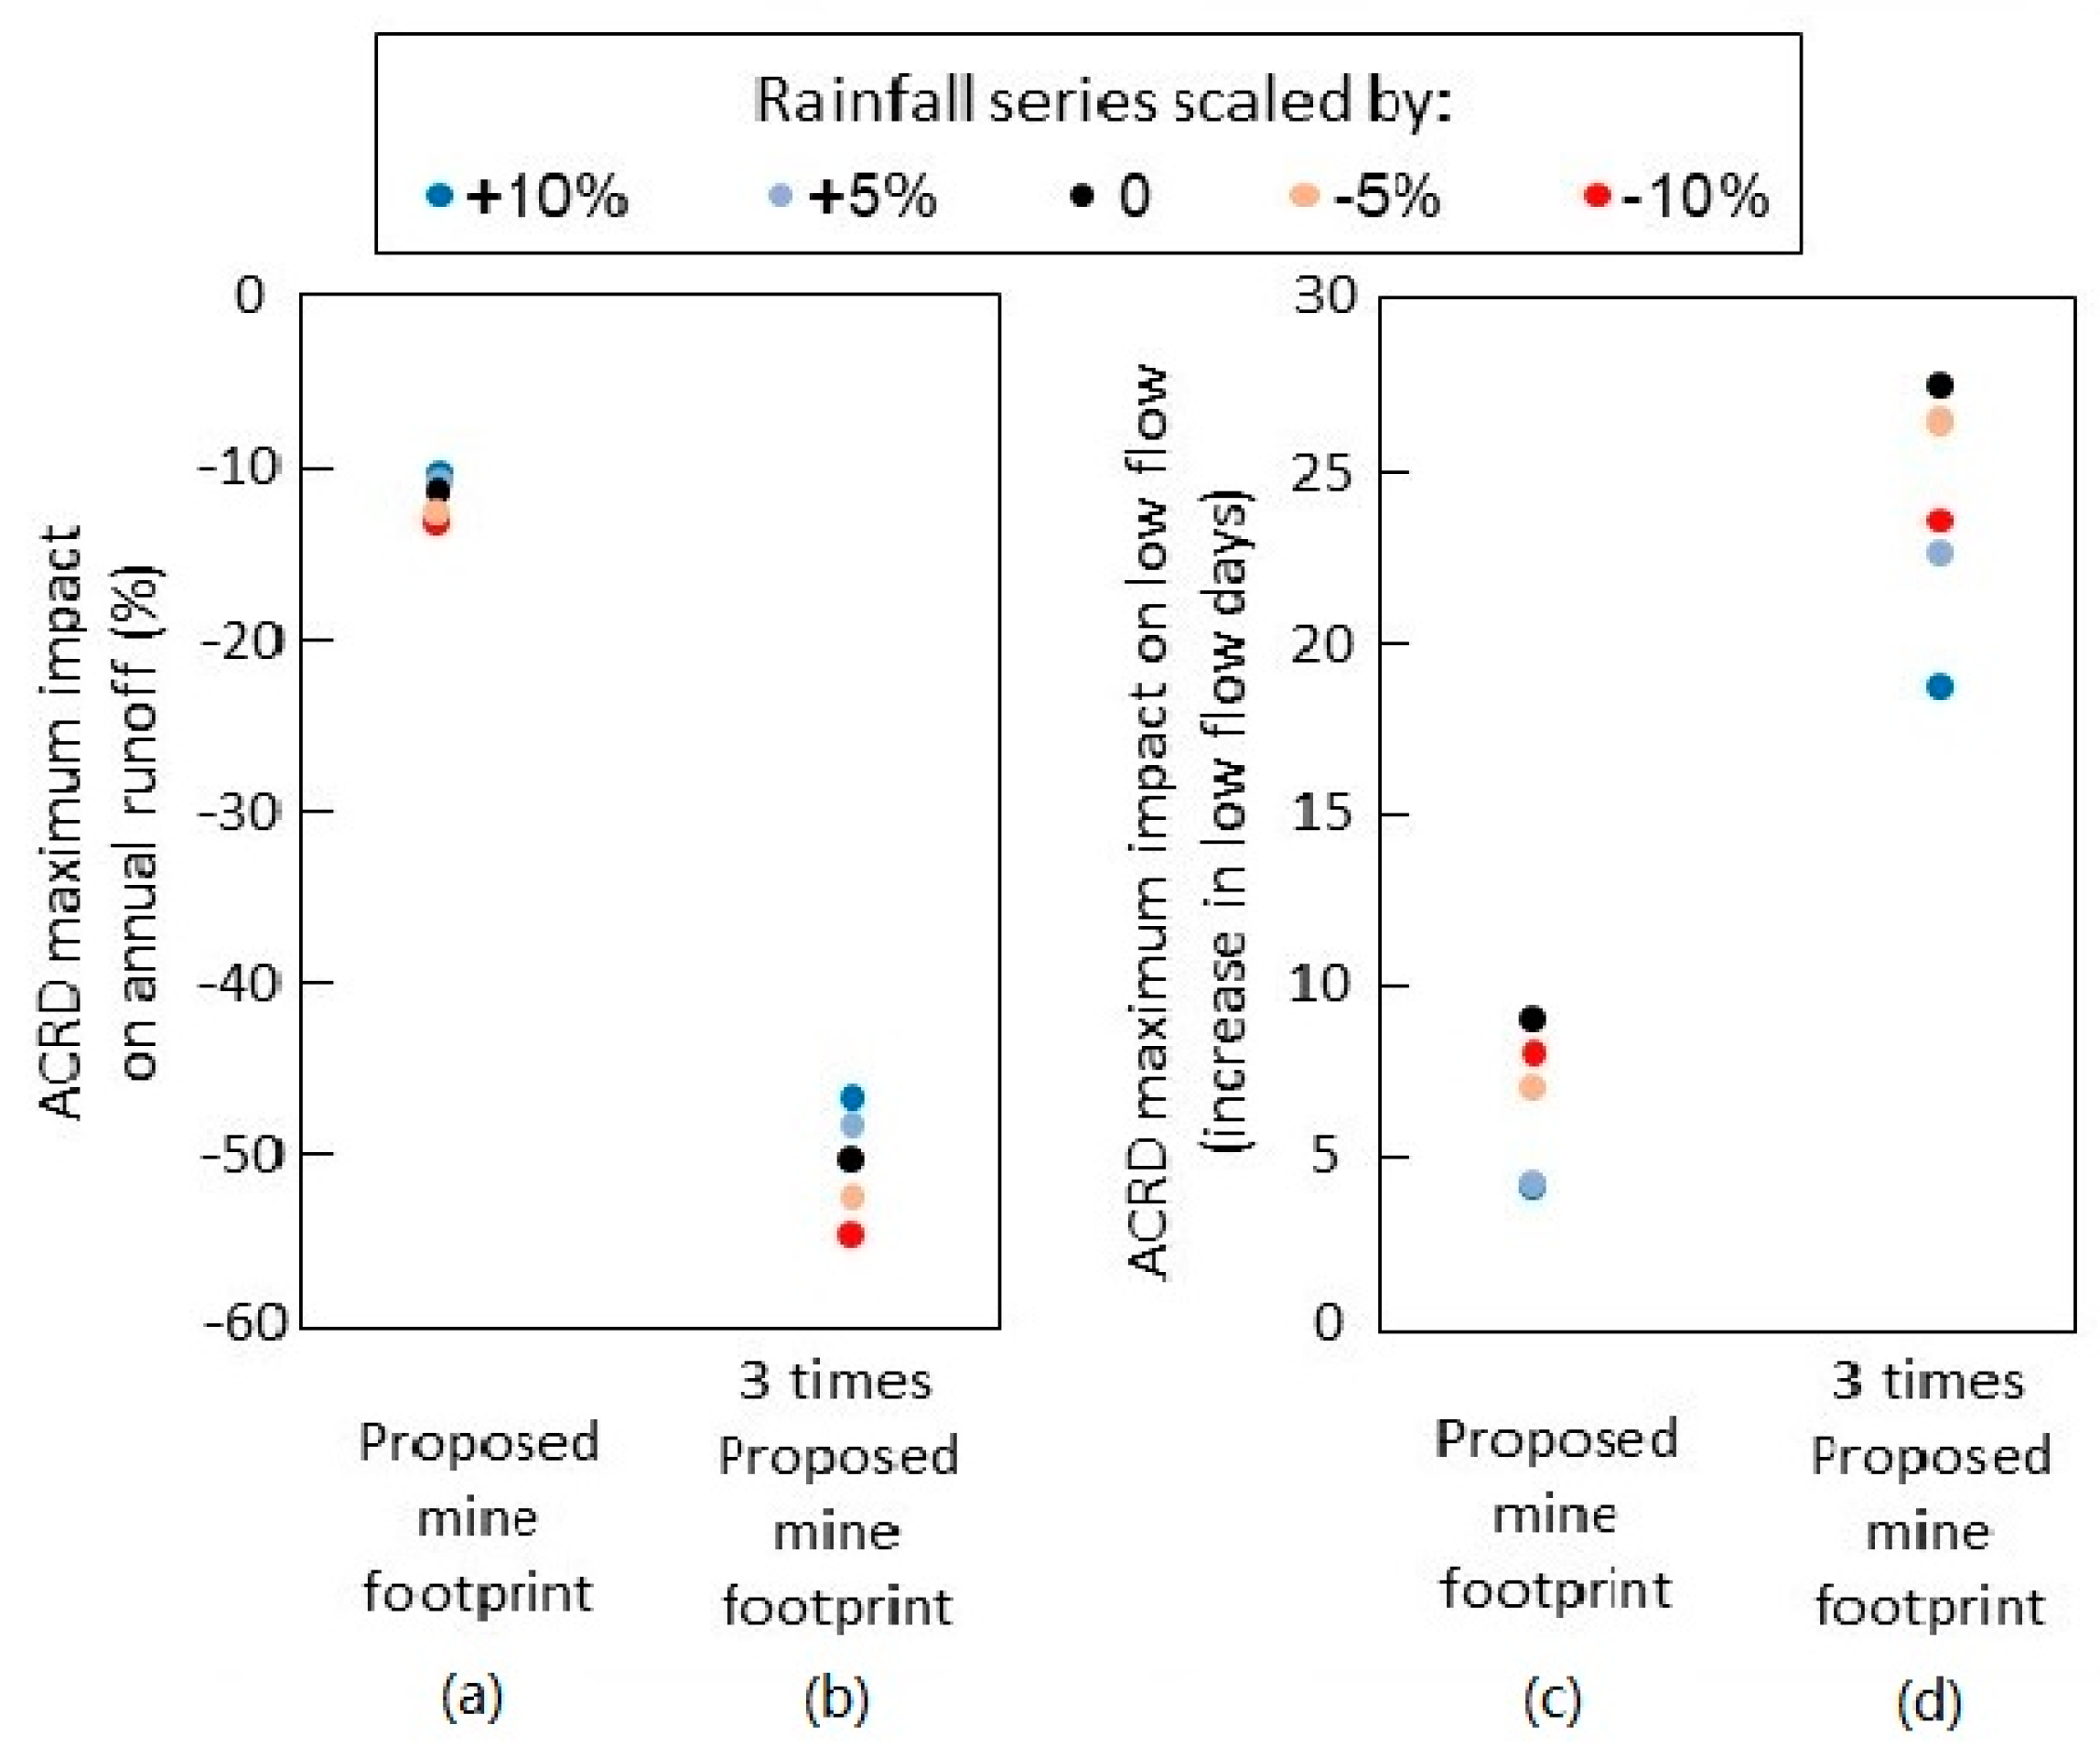
Figure 8 shows the results from the modelling carried out to quantify the maximum ACRD impact on Node 14 (proposed coal mining development relative to baseline development) under the different future climate baselines. The modelling is carried out for the proposed mine footprint as well as for a three times larger mine footprint, the latter to explore outcomes from larger developments. The results for annual runoff indicate that the maximum ACRD impact is slightly greater for a drier future climate series compared to a wetter future climate series (
Figure 8a). However, this difference in the ACRD maximum annual runoff impact is relatively small for the different climate futures, with a difference of less than 2% for a 10% wetter future versus 10% drier future, and much smaller than the potential impact from climate change alone (
Figure 5).
Figure 8b shows that for a three times larger mine footprint, the ACRD maximum annual runoff impact is comparable with the impact from a 10% reduction in future mean annual rainfall. The difference between ACRD impact evaluated using different rainfall futures also becomes larger, with a difference in ACRD impact of about 10% for a 10% wetter future versus a 10% drier future.
Figure 8c,d show that, for the analysis here, the ACRD impact on low flow is smaller when evaluated for both wetter and drier futures. The ACRD maximum low flow impact for simulations with climate futures of –10% wetter to 10% drier ranges from four to nine more low flow days for the proposed mine footprint (
Figure 8c), and 19 to 27 more low flow days for three times larger mine footprint (
Figure 8d).
4. Impact of Coal Mining Development in the Context of Hydroclimate Variability
The influence of hydroclimate variability on the maximum ACRD impact, particularly the rainfall series when the mine footprint is largest, is investigated using a stochastic rainfall series. One hundred stochastic replicates of 90 years of daily rainfall are generated to represent the 2013–2102 rainfall. The Stochastic Climate Library (SCL) method (
https://toolkit.ewater.org.au/Tools/SCL) is used to generate multi-site daily rainfall. To reduce computational time and to realistically model the spatial rainfall correlations, stochastic daily rainfall is generated for 21 points, which is then interpolated to provide stochastic rainfall data for the 156 grid cells for hydrological modelling. The stochastic model is parameterized to reproduce the characteristics of the 1923–2012 rainfall series. The stochastic data generation is described in detail in [
15], which compared several stochastic climate models and shows that the SCL can reproduce the observed rainfall characteristics, especially the annual and monthly rainfalls.
Figure 9 and
Figure 10 show the range of maximum ACRD impact on annual runoff and on low flow respectively, modelled using the 100 stochastic rainfall series. The plots indicate that the sequence of future rainfall can significantly influence the maximum ACRD impact. The maximum ACRD impact on annual runoff at Node 14 ranges from 10% to 18% (10th percentile and 90th percentile values) (
Figure 9) and the maximum ACRD impact on low flow at Node 14 ranges from two to five more days with runoff less than the fifth percentile value (
Figure 10). The difference in the modelled maximum ACRD impact on annual runoff using different future stochastic rainfall series is therefore greater than the difference in modelled maximum ACRD impact for a given sequence with different mean annual rainfalls (
Figure 8a).
As the ACRD impact is modelled as a reduction in the simulated runoff, the maximum ACRD impact on annual runoff will be greater if the annual runoff is high when the mine footprint is large. This is illustrated for Node 14 in
Figure 11, which shows that the maximum ACRD impact generally occurs when the mine footprint is large, and in
Figure 12 which shows a strong correlation between maximum ACRD impact on annual runoff versus the annual rainfall or runoff in the year of maximum impact.
The simulations here also show that the modelled maximum ACRD impact on annual runoff at Node 14 using the 1923–2012 data sequence to represent the 2013–2102 future climate is at the low end (20th percentile value) of the distribution of modelled ACRD impact with the stochastic future climate series (
Figure 9). The maximum ACRD impact on low flow shows an opposite result, with the modelled maximum ACRD impact using the 1923–2012 data sequence being at the high end (greater than the 90th percentile value) of the distribution of modelled ACRD impact with the stochastic future climate series (
Figure 10). This is because the annual rainfall and runoff in the 1923–2012 series when the mine footprint is large are in the drier part of the stochastic runoff distribution, resulting in a smaller ACRD impact on annual runoff and a larger ACRD impact on low flow because there are more low flow days when runoff is low. It is not possible to formulate the exact relationship because the maximum ACRD impact is dependent on both the rainfall or runoff and the mine footprint in the different years. It is also more difficult to model and interpret the impact on low flow (compared to flow volumes) because it is influenced by low runoff thresholds and non-linear rainfall-runoff and subsurface storage lag relationships.
5. Discussion and Conclusions
The relative impact of climate change and coal mining development on streamflow characteristics will depend on the magnitude of the climate change and the size of the coal mining development. The change in streamflow under moderate and high climate change projections is likely to be greater than the impact from the coal mining development, particularly in regions like Gloucester with a relatively small proposed development. However, there is considerable uncertainty in the future climate change projections where the 10th and 90th percentile range of projected changes in future runoff can differ by up to 50%. The projections indicate that far south-west and south-east Australia are likely to be drier in the future, but the direction of rainfall and runoff change is less certain elsewhere. Under the lower end of future runoff projections, the impact from coal resource development will be relatively larger, particularly in regions with more significant developments, and in local areas immediately downstream of large mine footprints.
The consideration of different future rainfall averages to represent different plausible future climate baselines can give different results in the modelled ACRD impact. The differences in the modelled ACRD impact, for different given future rainfall averages, are relatively small but not insignificant. In the Gloucester sub-region, the difference in the modelled ACRD impact at Node 14 (where the impact is greatest) is less than 2% for a 10% wetter future versus a 10% drier future, but this difference will be greater in bioregions where the mine footprint is larger. The ACRD impact is higher when modelled using a drier future compared to a wetter future.
The sequencing of hydroclimate time series (hydroclimate variability), particularly the rainfall when the mine footprint is large, significantly influences the modelled maximum ACRD impact. If the rainfall is high in the period when the mine footprint is largest, the modelled maximum impact on volumetric and high flow hydrological variables will be higher, and the modelled maximum impact on low flow hydrological variables will be lower, and vice-versa. For the Gloucester sub-region, the maximum ACRD impact on annual runoff at Node 14 ranges from 10% to 18% (10th to 90th percentile value) and the maximum ACRD impact on low flow ranges from two to five more days with runoff less than the fifth percentile value, for simulations using 100 stochastic rainfall series.
In summary, (i) climate change impact can be greater than the ACRD impact, particularly under moderate and high climate change projections and where proposed mine development is small; (ii) the difference in maximum ACRD impact modelled using future rainfall series with different long-term means (climate change) is relatively small, but can be significant where mine footprints are large; and (iii) the rainfall sequence or amount in the period when the mine footprint is large (hydroclimate variability) can significantly influence the modelled maximum ACRD impact. The results from this study indicate that detailed analysis of ACRD impact where proposed development is large should take into account climate change and hydroclimate variability, particularly the relative and combined impact from climate change and coal resource development, and the rainfall sequencing when the mine footprint is large.

 ,
, 


