Article

Water Footprint Accounting Along the Wheat-Bread Value Chain: Implications for Sustainable and Productive Water Use Benchmarks

by
Pascalina Matohlang Mohlotsane
1,
Enoch Owusu-Sekyere
1,*,
Henry Jordaan
1,
Jonannes Hendrikus Barnard
2 and
Leon Daniel Van Rensburg
2
1
Department of Agricultural Economics, University of the Free State, Posbus 339, Bloemfontein 9300, South Africa
2
Department of Soil- and Crop- and Climate Sciences, University of the Free State, Posbus 339, Bloemfontein 9300, South Africa
*
Author to whom correspondence should be addressed.
Water 2018, 10(9), 1167; https://doi.org/10.3390/w10091167
Submission received: 2 July 2018 / Revised: 27 August 2018 / Accepted: 28 August 2018 / Published: 31 August 2018
(This article belongs to the Special Issue Progress in Water Footprint Assessment)

Abstract

:
Efficient and wise management of freshwater resources in South Africa has become critical because of the alarming freshwater scarceness. The situation requires a thorough examination of how water is utilized across various departments that use water. This paper reports on an examination of the water footprint and economic water productivities of the wheat-bread value chain. The assessment methodology of the Water Footprint Network was employed. The findings reveal that 954.07 m3 and 1026.07 m3 of water are utilized in the production of a ton of wheat flour in Bainsvlei and Clovelly in South Africa. The average water footprint for wheat bread was 954.53 m3 per ton in Bainsvlei and 1026.53 m3 per ton in Clovelly. More than 99% of the water is used in producing the grain at the farm level. The processing stage of the value chain uses less than 1% of the total water footprint. About 80% of all the water utilised along the wheat bread value chain is attributed to blue water. The findings revealed a significant shift from green water consumption to higher blue water use, and this is a major concern for water users and stakeholders along the wheat-bread value chain, given that blue water is becoming scarce in South Africa. The groundwater contributes about 34% and 42% of the average total water footprint of wheat at the farm level in Clovelly and Bainsvlei, respectively, suggesting the need to have an idea of the contribution of groundwater in water footprint evaluation and water management decision of farmers. This insight will aid in minimizing irrigation water use and pressure on groundwater resources. A total of ZAR 4.27 is obtained for every m3 of water utilized along the wheat-bread value chain. Water footprint assessment has moved away from sole indicator assessment, as a deeper awareness of and insight into the productive use of water at different stages has become vital for policy. To make a correct judgment and to assess the efficient and wise use of water, there is a need for catchment- or region-specific water footprint benchmarks, given that water footprint estimates and economic water productivities vary from one geographical area to another.

1. Introduction

Freshwater is a renewable resource, but, when considering its availability regarding unit per time per region, the limitations of this resource cannot be ignored [1,2]. In global terms, agriculture accounts for 99% of freshwater consumption [3] and is therefore considered as the single largest freshwater user globally. Hoekstra and Chapagain [4] show that visualizing the amount of water used in producing products can further increase our understanding of the global picture of freshwater utilization—a concept that is explored by the Global Water Footprint Network Standard approach (GWFNS). The GWFNS approach has become apparent as an important sustainability indicator in the agricultural sector, as well as in the agri-food-processing industry [5,6,7]. This assessment includes both the indirect and direct use of freshwater by a consumer or a product along with its value chain [8].
South Africa is deemed as water scarce and water limited country [9]. Irrigated agriculture uses about 60% of South Africa’s available surface and freshwater resources [10]. Nonetheless, 30% to 40% of this water is lost through leaks and evaporation, which gives the impression that water use in this sector is inefficient [10]. According to the Department of Agriculture Forestry and Fisheries (DAFF) [11], South Africa’s agricultural sector is the least direct contributor to the gross domestic product (GDP) measured in per million cubic meters of freshwater use and is also the least direct employer per million cubic meters of freshwater [11,12]. This is in contrast with the commitment of the National Water Research aim of achieving sustainable and efficient use of freshwater by all South Africans, especially among producers of key food crops.
Wheat is the largest cultivated commercial crop globally [13]. In South Africa, wheat is the largest winter cereal grain with a total requirement of 2.7 million metric tons per year [11]. Most of the wheat used for bread production is produced locally. Wheat production is spread among 32 of the 36 crop-production regions, with an estimated 3200 to 4000 producers. South Africa’s wheat production is estimated at 1.88 million metric tons for the 2016/17 production year [11]. About 69.63% of South Africa’s total wheat demand is produced locally, and 30.37% is imported. About 60% of the wheat flour is used to produce bread. In South Africa, existing statistics indicate that 2.8 billion loaves of bread are consumed per year. This indicates that, in a year, sixty-two loaves of bread, with an average weight of 700 g are consumed per person per year, with a noticeable difference in preference and consumption amongst the provinces [11]. Given the relative importance of the crop and the water scarcity situation in the country, potential strategies that will reduce and identify large water uses along the value chain water use will be deduced.
Two well-known concepts are applied in the assessment of water footprint. These are the Life Cycle Assessment (LCA) approach and the Water Footprint Assessment Manual (WFAM). Recently, some developments in the Water Footprint framework have taken place within the framework of Life Cycle Assessment [14]. The LCA approach proposed to weight the original volumetric water footprint by the water scarcity in the catchment where the water footprint is situated (ISO, 2014), with the aim of attaining a water-scarcity weighted water footprint that portrays the possible local environmental impact of water usage [14]. This proposal has received some critique in recent years [15]. The critique as elaborated by Hoekstra [15] is that there will be confusion about water scarcity if volumes of water use are counted differently based on the level of local water scarcity [15]. This relates to allocation of water resources to opposing uses and reduction at a global scale. Secondly, the LCA approach ignores green water usage, and this neglect suggests that the LCA does not accept the fact that green water is scarce amidst changing climates. The third critique is that since water scarcity in a given geographical area increases with increasing total water consumption in the area, multiplying the consumptive water use of a given process with water scarcity suggests that the subsequent weighted water footprint of a process will be impacted by the water footprints of other processes [15]. The fourth critique is that the manner in which the LCA approach treats the water footprint is inconsistent with definitions of other environmental footprints. Finally, the Water Stress Index as described by the LCA approach lacks relevant physical understanding [15].
In terms of the water footprint of wheat, the latter approach (WFAM) has been employed by some authors in recent years. For instance, Mekonnen and Hoekstra [16] gave an overview of the green, blue and grey water footprint of several crops and derived crop products worldwide, including for South Africa. Mekonnen and Hoekstra [13] estimated the water footprint of wheat. Aldaya and Hoekstra [5] calculated the water footprint of pasta and pizza margarita in Italy. Ahmed and Ribbe [17] explored the green and blue water footprints of rain-fed and irrigated wheat in Sudan. Neubauer [18] calculated the water footprint required to produce 1 kg of bread in Hungary. Sundberg [19] conducted a water footprint assessment of winter wheat and derived wheat products in Sweden. Ababaei and Etedali [20] calculated the water footprint of wheat produced without irrigation in Iran.
None of these studies considered an assessment of the water footprint along the entire wheat value chain in South Africa. For instance, Le Roux et al. [21] evaluated the water footprint of wheat in South Africa, but they only focused on quantifying the water footprint at the farm level, without considering water utilization along the entire wheat-bread value chain. Nonetheless, Mekonnen and Hoekstra [3] quantified the water footprint of wheat for several countries not excluding South Africa. Additionally, Mekonnen and Hoekstra [16] evaluated the water footprint of several crops and derived crop products worldwide, including South Africa. Their estimates were reported at the national and provincial levels, and, as such, there is no current information on the water footprint of wheat at the catchment- specific level in South Africa. Catchment- or regional-specific estimates are needed to better inform water managers and policy makers about water management policies across different regions. Also, it has been found that catchment- or region-specific water footprints vary from national footprint estimates [22,23].
Furthermore, no current studies examined the economic water productivity of bread along its respective value chain, which include farm level, milling, and bakery stages, in South Africa. Aldaya et al. [5] estimated the economic water productivity of wheat in Central Asia. Similarly, Chouchane et al. [24] and Zoumides et al. [25] added water productivities evaluation when assessing the water footprint of crops in Tunisia and Cyprus, respectively. The main objective of this study was to account for the water footprint and economic productivity of water along the wheat-bread value chain. The present study contributes to the existing literature on water footprints and economic water productivities of crops. The water footprint estimates calculated from this study can act as benchmarks for the catchment area considered in this study. The findings of this study can potentially advise policymakers and water users on economically efficient and sustainable water management strategies.

2. Methodology

2.1. Choice of Theoretical Framework and Models

This study followed the water footprint concept of Hoekstra et al. [8]. The definition of blue, green and grey water footprints followed that of Hoekstra et al. [8] in the Water Footprint Assessment Manual. The study employed this method because it involves several dimensions, showing the sources of water utilization in quantities [
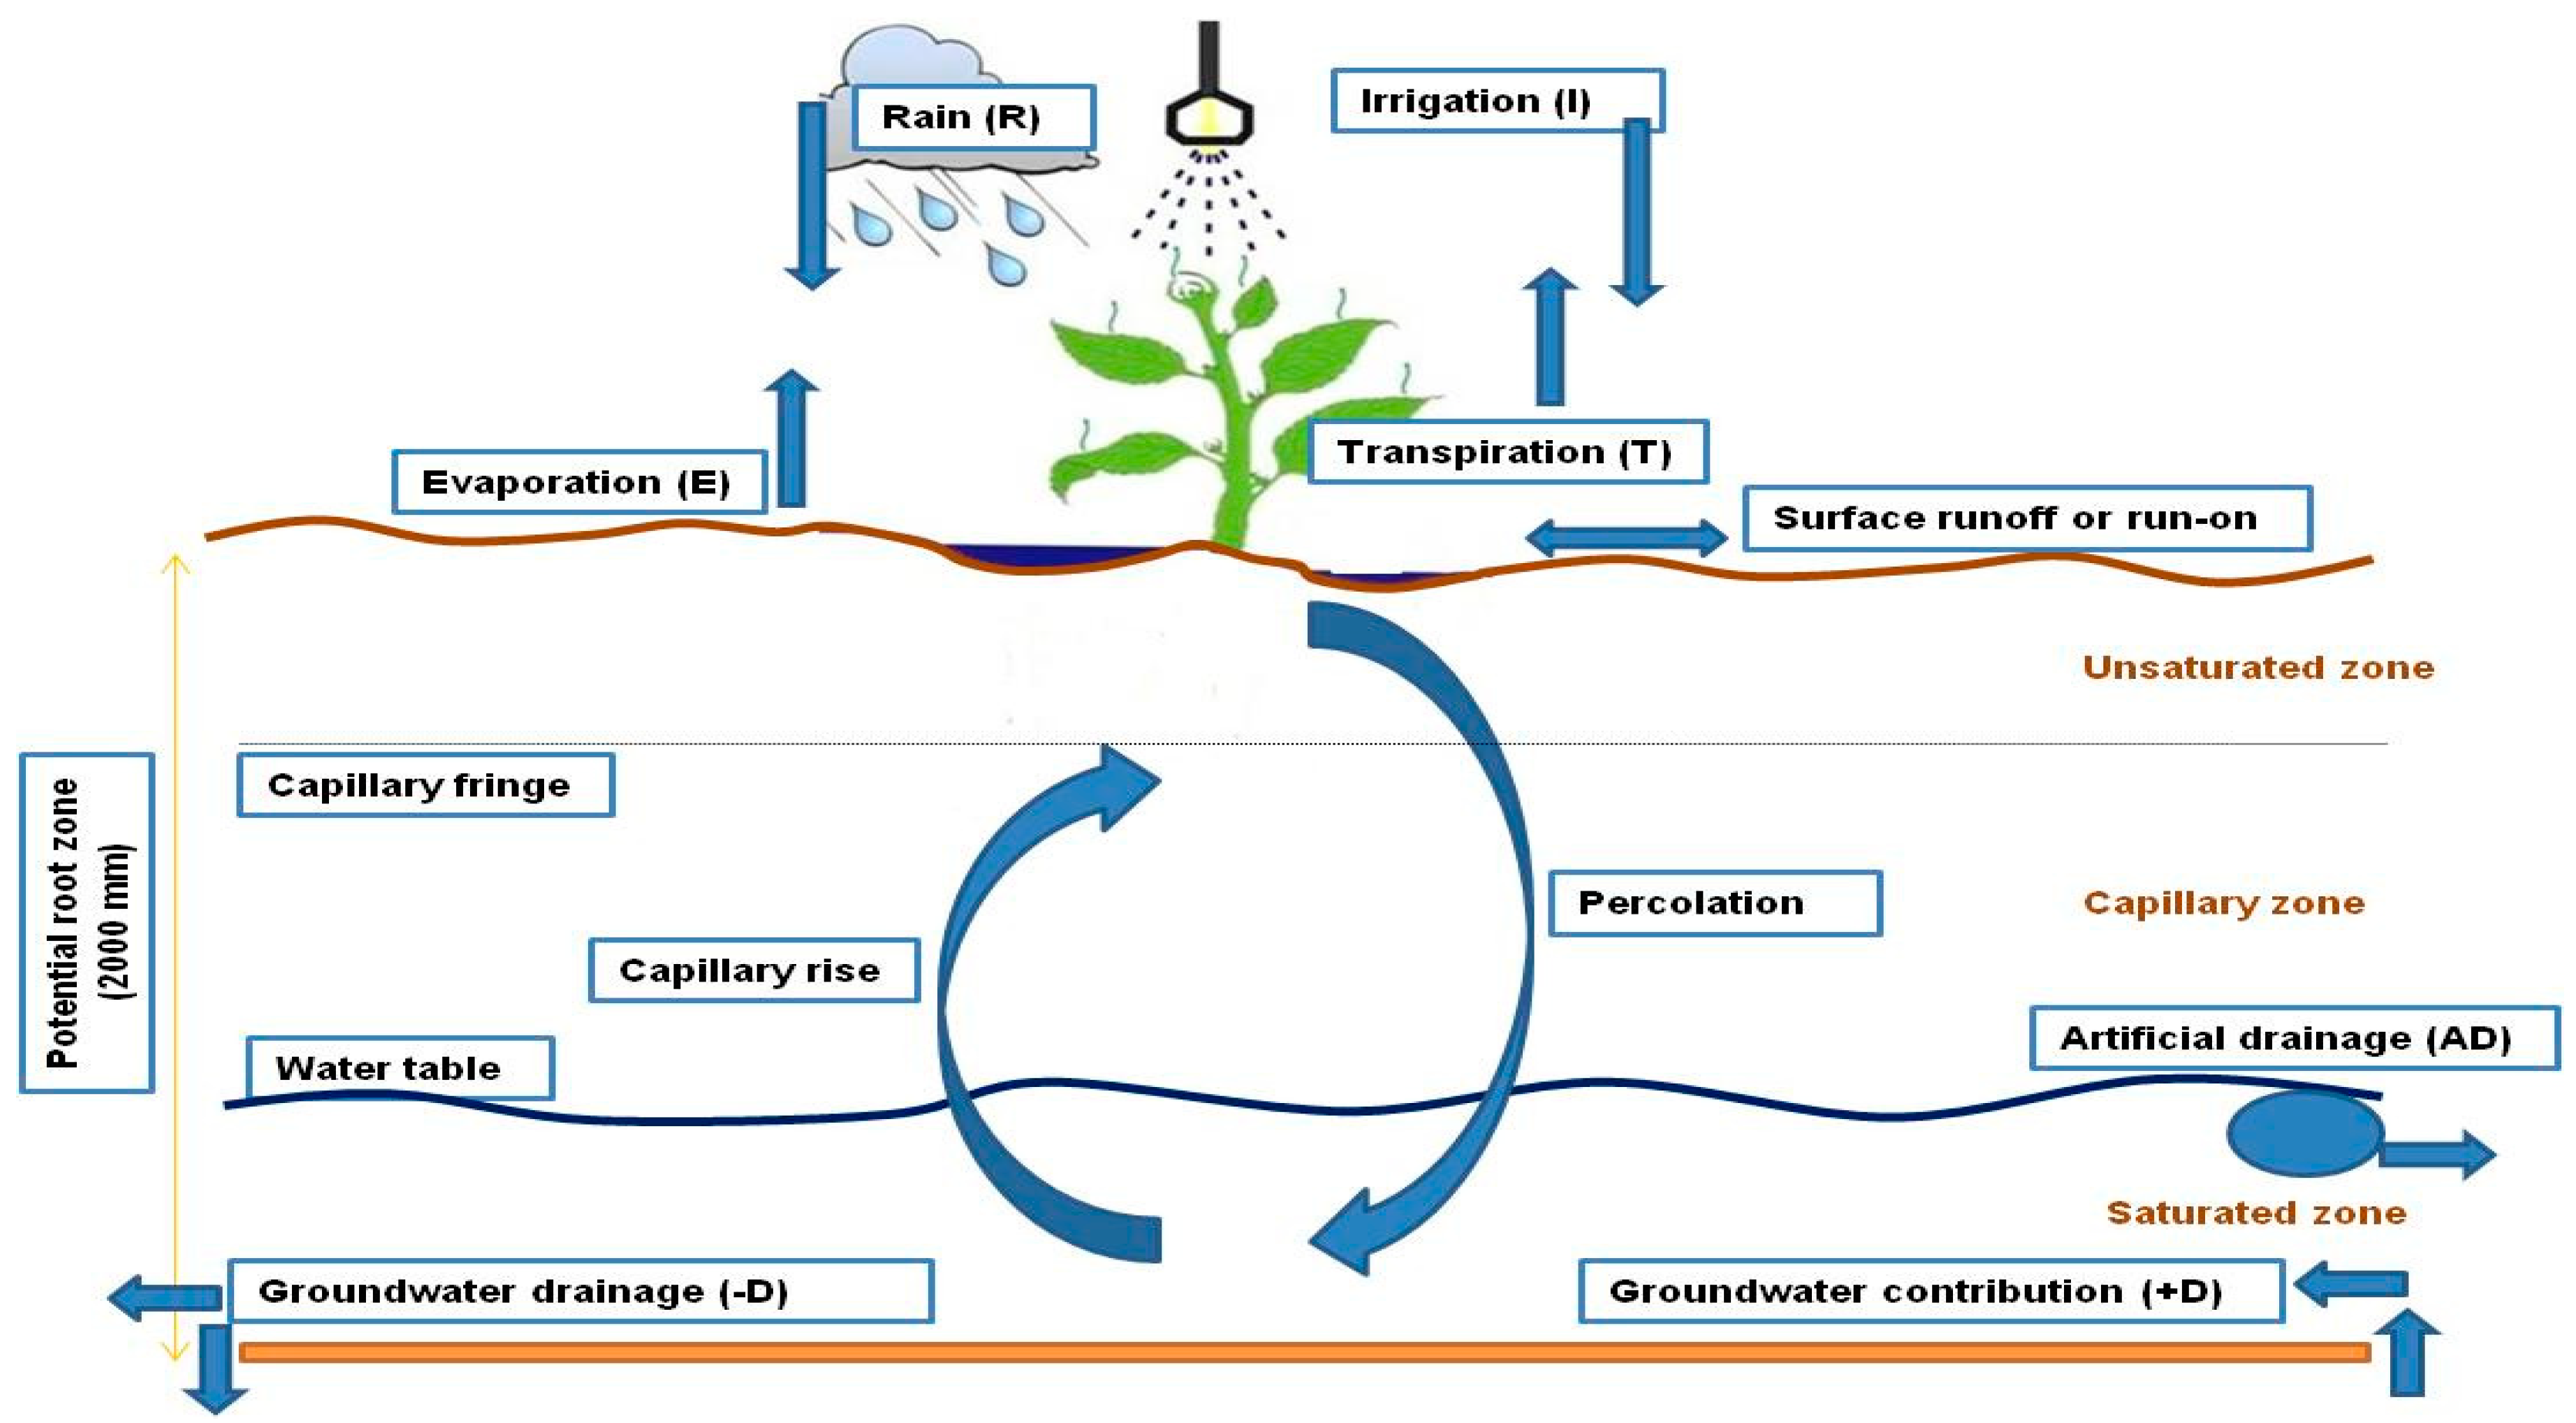
26]. The conceptualization procedure of the study is presented in Figure 1.
According to the water footprint concept adopted in this study, the water footprint can be calculated in four phases, namely, goal setting, water footprint accounting, sustainability assessment and formulation of response [8]. However, in this study, our third phase focuses on water productivity assessment. In the first phase of this study, the step-wise accumulation approach was followed because, along the wheat value chain, each output product serves as an input for the next product. The total water footprint will include proportional water footprints of the various inputs within the value chain [8]. The analysis was for a single production year.
The step-wise accumulation approach is expressed empirically in Equation (1). By this approach, the water footprint of wheat bread (W), which the main output product, is stated to be made from z inputs (e.g., wheat, flour, etc.). We denote the z inputs to range from j = 1… z. Given that z inputs are utilized to produce w wheat products, we denote the different wheat output products as W = 1…w. The wheat products’ (W) water footprints are specified as:
W F p r o d [ W ] = ( W F p r o c [ W ] + i = 1 z W F p r o d [ j ] f w [ W , j ] ) * f v [ W ] ,
W F p r o d [ W ] represents the total water used in producing W. W F p r o d [ j ] denotes the water footprint of input j. The water utilized in the processing z inputs to W outputs is represented by W F p r o c [ W ] (Hoekstra et al., 2011). f w [ W , j ] and f v [ W ] are the product and value fractions, respectively [8]. Thus, the water footprint of wheat along the product cycle at the farm level is the sum of a process water footprint of the different sources of water used in production according to Aldaya and Hoekstra [6] and Ababaei and Etedalie [20]. The process water footprint is specified as:
W F p r o c , b l u e , g r e e n , g r e y [ W ] = ( C W U b l u e Y t ) + ( C W U g r e e n Y t ) + ( ( α × A R ) / ( c max c n a t ) Y t ) ,
The blue, green, and grey water footprints of wheat at the farm level are denoted as W F p r o c , b l u e , g r e e n , g r e y [ W ] . The blue component of the water footprint is represented by C W U b l u e Y t , where C W U b l u e represent the blue water used in producing wheat and Y t is wheat yield [8]. In this paper, blue water use was categorized into surface and groundwater sources. This will give an idea about the proportion of water extracted from the ground and surface according to Hoekstra et al. [8].
W F b l u e = C W U s u r f a c e Y t + C W U g r o u n d Y t ,
The green component of the water footprint is represented as C W U g r e e n Y t and C W U g r e e n indicates the green water used in producing wheat [8]. The crop water use components in Equation (2) summed the daily evapotranspiration over the complete growing period of the wheat crop [8] and are stated empirically as:
C W U b l u e , g r e e n = 10 × d = 1 lgp E T b l u e , g r e e n ,
E T b l u e , g r e e n characterizes the blue and green water evapotranspiration. The water depths are changed from millimetres to volume per area by using the factor 10 [8]. The last part of Equation (2) is the grey water footprint component. This is calculated by taking the chemical application rate for the field per hectare (AR, kg/ha) and multiplying by the leaching-run-off fraction (α). The product is divided by the difference between the maximum acceptable concentration (cmax, kg/m3) and the natural concentration of the pollutant considered (cnat, kg/m3) [8]. It is worth mentioning that grey water was not used at the processing stage. Grey water was only used at the farm level and the pollutant considered is nitrogen.
At the milling stage, the water footprint of flour is specified as in Equation (5):
W F m i l l i n g [ f l o u r ] = T W U m i l l Q f l o u r ,
where TWU mill is the total water used to produce a given quantity of flour ( Q flour ) and at the water utilized at the bakery ( TWU bakery ) for a given quantity of bread ( Q bread ) is specified as in Equation (6).
W F b a k i n g [ b r e a d ] = T W U b a ker y Q b r e a d ,
The total water footprint of bread along the wheat- bred value chain is a combination of all the footprints in this value chain. After calculating the water footprint ( W F p r o d [ W ] ), we estimated physical water productivity (PWP) of the output products (W) in kilograms per cubic meter, expressed as:
P W P ( k g / m 3 ) = 1 W F p r o d [ W ] ( m 3 / t o n n e ) × 1000 ,
Subsequently, we estimated the economic water productivities for the different outputs at different stages by multiplying the physical water productivity by the monetary value added to each w output per kilogram. The value added to the output products along the value chain is calculated by subtracting the cost per kilogram of w from the sales revenue obtained from selling one kilogram of w at each stage of the value chain [27,28]. Consequently, the value added to the output product (w) becomes the total revenue of the output product minus the cost of all intermediate inputs (z) used to produce it. Let the value added to w at a specific stage of the value chain be represented by V A D j v c [ W ] and specified as:
V A D j v c [ W ] = Re v J v c ( W ) C o s t j v c ( W )   ,
where Re v j v c ( W ) represents sales revenue attained from one kilogram of w and C o s t j v c ( W ) denotes all intermediate inputs costs, including the cost of water usage, capital, land, labour, feed, taxes, conveyance, packing, fuel, repairs and maintenance, etc. The sum of the value added at each stage of the product cycle became the total value added ( TVAD [ W ] v c ), stated as:
T V A D v c [ W ] = j = 1 3 V A D j v c   ,
Value added to water along the wheat-bread value chain is quantified as the ratio of the value added to the output product (w) at a given stage over the volume of water used at that stage [27,28]. From this, we calculated the marginal value of water MVAD [ water ] as the partial derivative of total value added ( T V A D j v c ) with respect to water use ( W U j v c ):
M V A D [ w a t e r ] v c = T V A D j v c W U j v c ,
The marginal value added to water is then multiplied by physical water productivity to attain the economic water productivity according to Chouchane et al. [24] and Owusu-Sekyere et al. [28]:
E W P ( Z A R / m 3 ) = P W P ( k g / m 3 ) × V A D ( Z A R / k g ) ,

2.2. Data Description

This paper employed primary data that cover the wheat-bread value chain. Data on water usage for wheat production were sourced from Van Rensburg et al. [
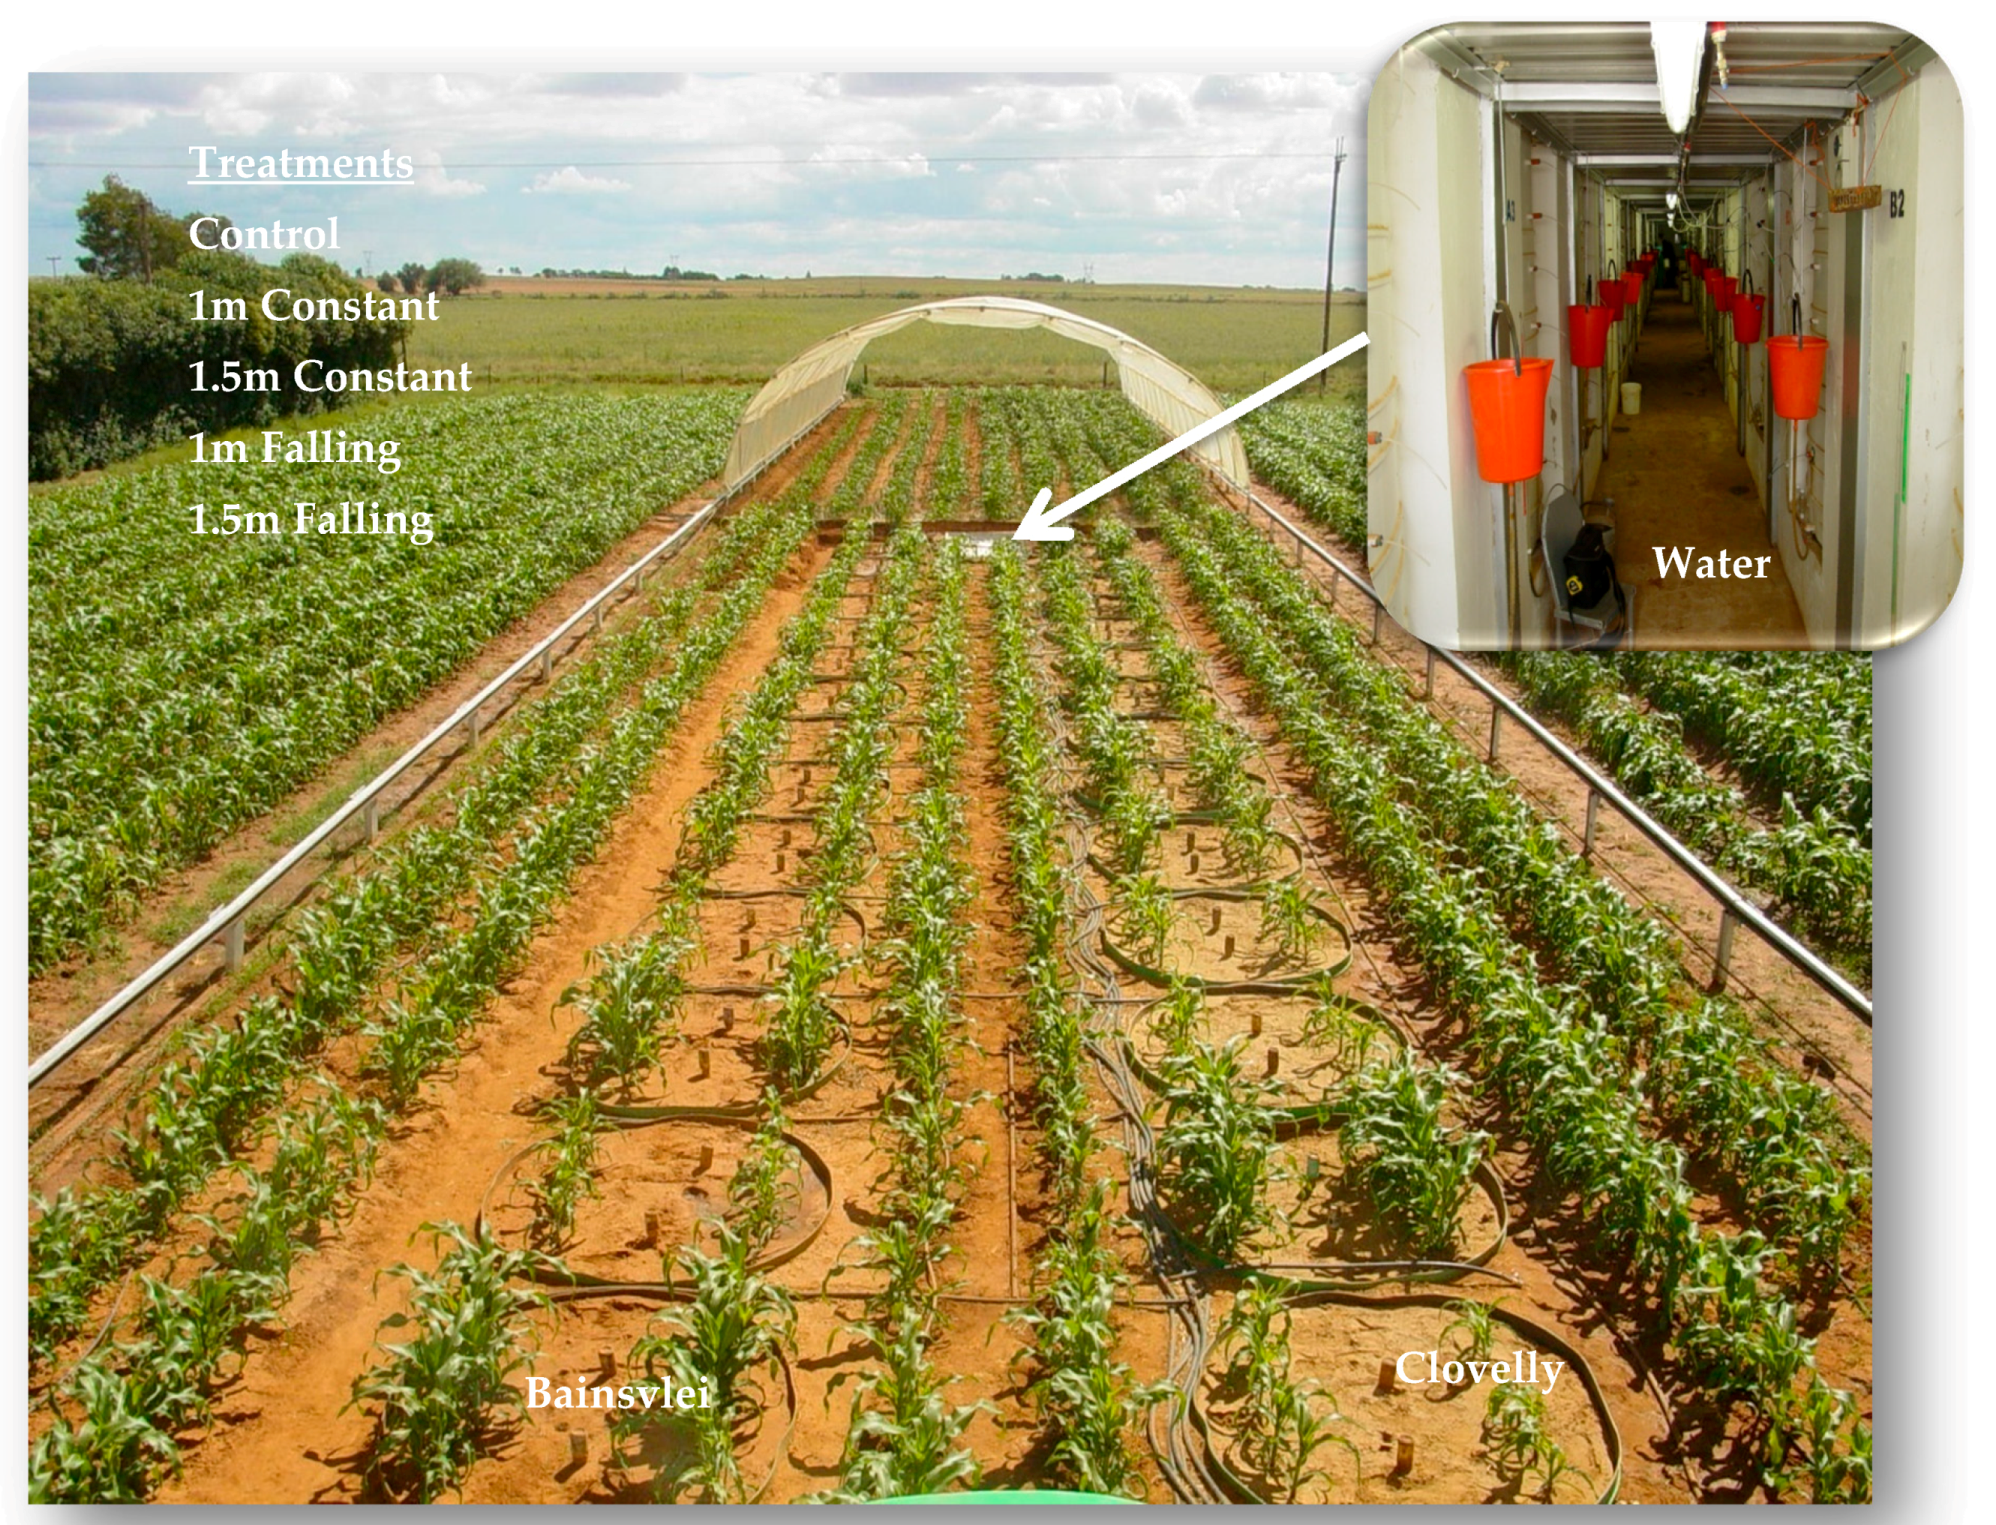
29], who conducted a lysimeter experiment to solicit spatiotemporal data from the Vaalharts and Orange-Riet regions. This study made use of actual measurements through a lysimeter trial to avoid any assumptions that come with water use models. The experiment consisted of five treatments replicated three times, and an average was taken to represent each sample. The cultivars used were selected by their wide use in all the central parts of South Africa. Aboveground biomass was harvested when the crops were dry by cutting it just above the soil surface. The lysimeter trial evaluation procedure for the different treatments employed in the two study areas captured data on groundwater levels, irrigation, drainage and changes in soil moisture content.
The lysimeter procedure consisted of five treatments for groundwater levels, namely, no groundwater considered (control), one meter to constant, 1.5 m to constant, one meter to falling, and 1.5 m to falling. The results are presented in Table 1. Table 1 presents the recorded data used in the estimation of the blue and green water footprints.
The data used in the estimation of grey water footprints are presented in Table 2. The nitrogen (Kg N/ha) and phosphorus fertilization (Kg P/ha) were based on targeted yields under irrigation. The wheat farmers usually apply nitrogen and phosphorus fertilizers. Some farmers apply potassium fertilizers. However, in this trial, only nitrogen and phosphorus fertilizers were considered. The leaching runoff coefficients of nitrogen for the two areas are 0.074 and 0.138 whereas those of phosphorus were 0.080 and 0.280. The nitrogen application rates were presented for different potential yields. The target yields range from 2–5 tons per hectare to above 8 tons per hectare, with corresponding nitrogen application rates ranging from 80-130 kg N/ha to 200+ kg N/ha. Prior to the phosphorus application, the soil phosphorus status was examined to know the quantity of phosphorus to apply. The quantities of phosphorus already in the soil were categorized into less than 5 mg/kg, 5–18 mg/kg, 19–30 mg/kg and above 30 mg/kg. The application rates of phosphorus varied depending on the amount that is already available in the soil. Soils with less than 5 mg/kg received a higher amount of phosphorus, followed by 5–18 mg/kg with soils containing above 30 mg/kg receiving the least amount of phosphorus applied.
The field trial captured data on evapotranspiration (ET), rainfall, irrigation, ground and surface water consumed by the crop, as well as yield in Bainsvlei and Clovelly. From Table 1, it can be seen that the yield of wheat from the different trials varied depending on the scale of measurement, ranging from 9881 to 10,458 per hectare in Bainsvlei, and between 8375 to 9161 kg per hectare in Clovelly. The cumulative ET, crop total evapotranspiration, indicates the crop water requirement. Bluewater is further distinguished as either surface or groundwater. The average crop water requirement (Cum. ET) is between 880 mm and 954 mm in Bainsvlei and between 824 mm and 869 mm in Clovelly. Effective rainfall in this period was only 183 mm per annum. 
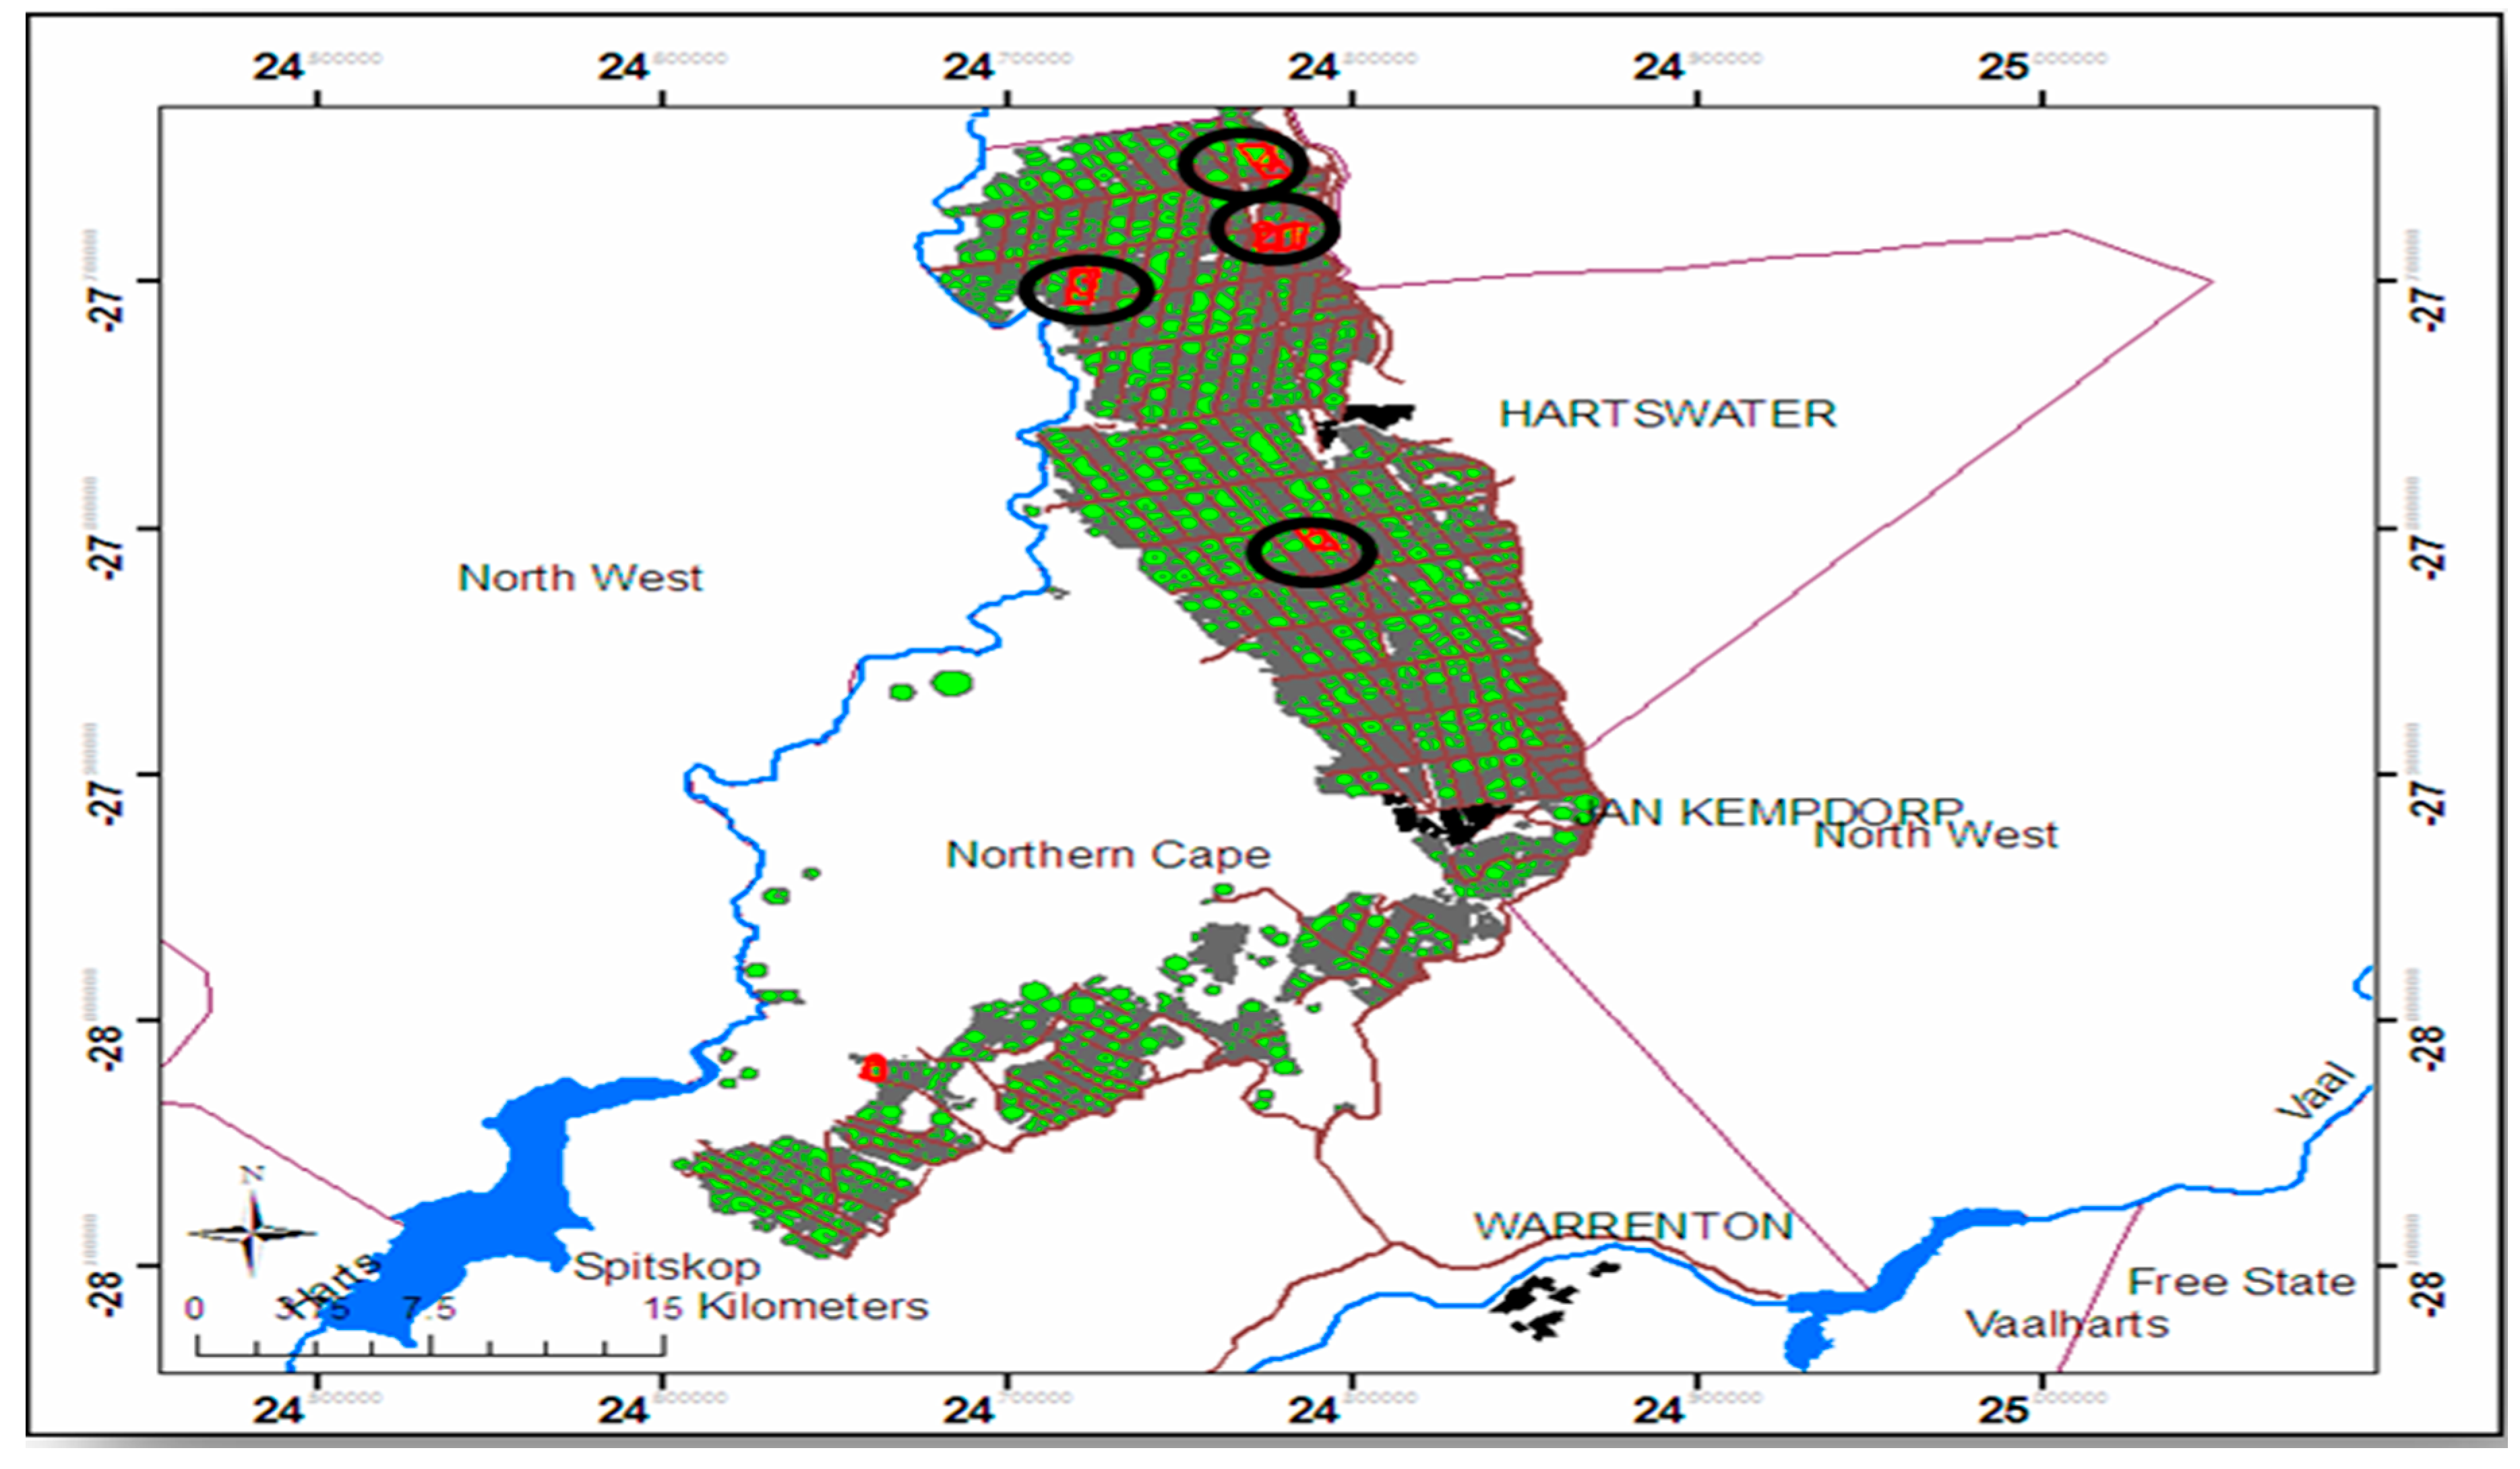
Figure 2 shows the map of the catchment area where the study took place.
At the processing level, primary data were acquired through a questionnaire from a bread milling company that has a total of five mills and 15 commercial bakeries across South Africa. Data collected from this source included the quantities of wheat milled, quantities of flour used, volumes of water used to produce a specified quantity of flour and bread, as well as total water used at the mill and bakery. Also, the cost of water and the prices of wheat, flour and bread were obtained. Thus, production costs and income received along the flour-bread supply chain were known. In the case of wheat, the producer prices were obtained from GrainSA [31].

3. Results and Discussion

3.1. Water Footprint of Wheat Production at the Farm Level in Bainsvlei and Clovelly

The estimated water footprint of the two areas is presented in Table 3. The results show that, for all the trials and the control, wheat production uses more blue water relative to green water. In Bainsvlei, blue water ranged from 7200 m3 to 7930 m3, whereas that of Clovelly ranged from 6490 m3 to 7100 m3. This shows that the crop water use in Bainsvlei is higher than that of Clovelly. For both study areas, the blue water use for the control group was lower than the trial estimates. In addition, the blue water use for the control group in Bainsvlei was 6810 m3 per hectare, and that of Clovelly was 6510 m3 per hectare.
Regarding the water footprint, the results show that the blue water footprint was higher than the green water footprint. This implies that wheat farmers in the two areas rely mostly on blue water resources. The green water footprint in Bainsvlei ranged from 174 m3 per ton to 185 m3 per ton. The blue water footprint from the surface fluctuated from 179 m3 per ton to 272 m3 per ton in Bainsvlei for the treatment group, while the blue water footprint from the groundwater ranged from 432 m3 per ton to 576 m3 per ton for the treated group in Bainsvlei. This suggests that much of the blue water footprint arises from groundwater resources. Regarding percentage usage, the results show that the proportion of groundwater used is about 37% to 69% of the total blue water footprint in Bainsvlei. The grey water footprint in Bainsvlei ranged from 52 to 55 cubic meters per ton, suggesting that about 52 to 55 cubic meters are required to reduce nitrogen and phosphorus pollutants to ambient levels. The total water footprint in Bainsvlei ranges from 928 to 983 m3 per ton. The total water footprint for the control is lower than that of the treated groups. These water footprint estimates are lower relative to the global average water footprint of 1827 m3 per ton reported for wheat by Mekonnen and Hoekstra [16]. At the national level, the water footprint of wheat in South Africa was found to be 1363 m3 per ton for the period of 1996–2005 [16], whereas our findings revealed a range of 928 to 983 m3 per ton.
In Clovelly, the green water footprint ranged from 199 to 218 m3 per ton. In terms of blue water footprint, the results indicate that the blue water footprint from the surface ranges from 273 to 388 m3 per ton for the treated group, while the blue water footprint from the ground ranges from 370 to 471 m3 per ton for the treated group. The volume of water utilized to reduce the nitrogen and phosphorus pollutants to ambient levels ranged from 54 to 60 cubic meters. The total water footprint in Clovelly ranges from 993 to 1053 m3 per ton. For the surface blue water footprint, we observed that the water footprint for the control group was higher than for the treated group. Furthermore, it is clear from the results that the total water footprints vary in the two areas and for the different treatments. Further, the total water footprint estimates for wheat in Clovelly are lower than the global and South African averages reported by Mekonnen and Hoekstra [16].
From the results, it was found that the water footprint estimates for the control and treatment groups in Clovelly were higher than those of Bainsvlei. The high water footprint in Clovelly may be attributed to the low wheat yield compared with the Bainsvlei yield per hectare. The high water footprint can also be attributed to the high surface water (irrigation) utilization in Clovelly relative to the irrigation water usage in Bainsvlei. Also, more groundwater was used in Bainsvlei relative to Clovelly. This may be attributed to the high water-holding capacity of the soil in Bainsvlei. The average water footprint of wheat in Bainsvlei was 954 m3 per ton, and that of Clovelly was 1026 m3 per ton.
In Bainsvlei, the average green water footprint was found to be 180 m3 ton−1, and this accounted for only 19% of the total average water footprint in this region. The average blue water from the surface (323 m3 per ton) accounted for about 34%, and that from the groundwater (398 m3 per ton) accounted for about 42% of the average total water footprint in Bainsvlei. In Clovelly, the average green water footprint was found to be 208 m3 per ton, and this accounted for about 20% of the average total water footprint. The average blue water footprint from the surface (irrigation) and ground was 418 m3 per ton and 344 m3 per ton, respectively. These estimates accounted for 41% and 34% of surface and groundwater, respectively. Generally, the average blue water footprints in Bainvlei and Clovelly are 721 m3 per ton and 762 m3 per ton, respectively.

3.2. Blue Water Footprint Benchmarks and Economic Water Productivities at the Farm Level

Table 4 presents the blue water footprint benchmarks for wheat production at different groundwater levels in the Vaalharts and Orange-Riet regions. In this section, we estimated water footprints for a control group where irrigation was done without considering the water from the ground. Secondly, four treatments for different groundwater levels were considered. Figure 3 presents the different ground water levels considered in this study.
The results indicate that the yield of wheat varies depending on the level of groundwater available to the crop and this impacts on the water footprint estimates. The blue water footprints calculated for the two areas can act as a benchmark for water utilization in wheat production in Bainsvlei and Clovelly soils. In Bainsvlei, the results indicate that without considering the groundwater, 688 m3 per ton of blue water from the surface is required. However, with the consideration of blue water from the ground, the results indicate that farmers will require between 179 to 272 cubic meters of water from the surface (irrigation) to produce a ton of wheat in the study area. This is because about 434 to 576 m3 per ton is contributed by groundwater. In Bainsvlei, the optimal blue water footprints for 1 m—Constant, 1.5 m—Constant, 1 m—Falling and 1.5 m—Falling groundwater levels are 755 m3 per ton, 743 m3 per ton, 714 m3 per ton and 706 m3 per ton, respectively. About 61% to 76% of the total blue water footprint is from groundwater. This provides the rationale for the consideration of available groundwater contribution to crop water requirement. This gives an understanding of how the groundwater is depleted.
Similarly, in Clovelly, the results indicate that 775 cubic meters of blue water from the surface (irrigation) are required to produce a ton of wheat, without accounting for water from the ground. When the groundwater levels were considered, it was revealed that the total blue water footprint for the different groundwater levels ranges from 731 to 789 m3 per ton. Nonetheless, about 370 to 471 m3 per ton of the total blue water footprint originated from the groundwater source, emphasizing the significant contribution of water from the ground to total water footprint. In Bainsvlei, the optimal blue water footprints for 1 m—Constant, 1.5 m—Constant, 1 m—Falling and 1.5 m—Falling groundwater levels are 789 m3 per ton, 758 m3 per ton, 731 m3 per ton and 755 m3 per ton, respectively. The results from the two areas imply that without considering the groundwater and the volume of water it provides to the root zones of crops, water will be utilized inefficiently.
We calculated economic water productivities for both surface and groundwater utilization to understand the how much can be saved in monetary terms of if the contribution of water from the ground is taking into consideration. The results indicate that in Bainsvlei, only 5.81 ZAR is attained per cubic meter of water used without considering contribution from the ground (controlled). When the contribution of the ground was accounted for, about 14.71 to 22.35 ZAR m3 can be attained due to the reduced surface irrigation requirement and cost of irrigation. The water from the ground can contribute about 12.31 to 13.78 ZAR m3 as indicated in Table 4. In Clovelly, an amount of 5.16 ZAR is attained per cubic meter of water used for the control group. When the contribution from the ground was considered, about 10.31 to 14.65 ZAR was attained per cubic meter of blue water (surface) used. The increase in economic water productivities was as a result of reduced irrigation cost due to water contribution from the ground. Economic water productivities from the ground range from 11.18 to 12.80 ZAR. The results imply that it is economical to account for water contribution from the ground when taking water management decisions at the farm level.
Given that blue water from the surface (irrigation) contributes to the production cost, it can be said that adoption of objective irrigation which takes into account volume of water available to the crop from the ground before irrigating is more efficient and economical. Thus, objective irrigation scheduling conserves water (better utilization of rainfall and shallow groundwater as water sources) relative to subjective irrigation scheduling.

3.3. Water Footprint at the Processing Stage of the Wheat-Bread Value Chain

In this section, water footprint estimates are calculated for wheat flour and bread. The results are presented in Table 5. Water utilization at the processing level of the value chain consisted of the volume of water utilized at the milling and bakery units. Given the volume of water used in the milling process and the mass of flour produced, the water footprint of wheat flour at the milling stage was found to be 0.07 m3 per ton. At the bakery stage, 0.46 m3 of water was utilized to produce a ton of bread. Summing the water footprint of the milling and bakery stages resulted in 0.53 m3 per ton.
The physical and economic water productivity of the individual products involved in this value chain is presented in Table 6. We found that wheat is considerably high in terms of physical and economic productivities. Therefore, more value is created per m3 of water utilized to produce the grain than for other products, such as wheat flour and bread, along the wheat-bread value chain. The physical water productivity estimates show that 1.037 kg of wheat is gained per cubic meter of water utilized.
Also, 0.014 kg of flour and 0.022 kg of bread are gained per cubic meter of water utilized at the milling and bakery stages, respectively. In the case of value addition, results indicated that the total value added to wheat along the wheat-bread value chain is ZAR11.43 per kilogram. Of this amount, the highest value was added in the milling stage, followed by the farm-level and bakery stages. Regarding percentage contribution to the total value added, the results indicate that about 65% of the value is from the processing level and only 35% is from the farm level (see Table 7). Economically, more value is obtained per cubic meter of water used at the farm gate, followed by the milling stage and bakery stage.
Summing the water footprint of the different stages resulted in an average total water footprint of 954.07 m3 per ton and 954.53 m3 per ton for wheat flour and bread, respectively, in Bainsvlei. In Clovelly, the average water footprint for wheat flour and bread are found to be 1026.07 and 1026.53 m3 per ton, respectively.

4. Conclusions and Implications

The efficient and sustainable management of freshwater resources in South Africa has become a critical policy issue in recent years because water scarcity in the country is becoming alarming. The situation requires a thorough examination of water utilization. One of the sectors that is gaining particular attention is the agricultural sector because it is known to utilize more freshwater, globally. This paper examined the water footprint of the wheat-bread value chain, with a particular emphasis on the contribution of groundwater.
From the findings of the study, it is concluded that it takes 991 m3 of water to produce one ton of bread in the Vaalharts and Orange-Riet regions of South Africa. The water footprint estimates obtained for wheat flour and bread in this study are lower than the global and national averages reported by Mekonnen and Hoekstra [16]. In Bainvlei and Clovelly, the total water footprint estimates for wheat flour are 31% and 26% lower than the South African average reported from 1996 to 2005 [16]. For bread, the total water footprint estimates for Bainvlei and Clovelly are 21% and 15% lower than the national average reported for South Africa. The water footprint of wheat in the study areas is lower than the global average. This may be attributable to the high yields. Higher yields result in low water footprint estimates. Blue water footprint accounted for about 80% of the total water footprint of bread.
Although the total water footprints in these areas are significantly lower, what is crucial for policy concerns is the share of the blue WF which is much larger than in the study of Mekonnen and Hoekstra [16] from 1996 to 2005. For instance, the current blue water footprint estimates for wheat in Bainvlei and Clovelly are about 68% and 69% higher than the blue water footprint for estimated for the period of 1996–2005. From 1996 to 2005, much of the water used in wheat production was green water, suggesting that there has been a significant shift from green water usage to higher blue water consumption over the years. This might be as a result of changes in climate and rainfall patterns over the years. The significant differences support the rationale for area-specific estimates and seasonal evaluation of water footprints to understand the dynamics of water consumption.
The shift to higher blue water consumption is a major concern for water users and stakeholders along the wheat-bread value chain, given that blue water is becoming scarcer in South Africa. Therefore, it is important that wheat farmers adopt good farm management practices that will continue to improve wheat yields. Such practices can include the adoption and breeding of high-yielding wheat cultivars which are drought resistant.
The water utilized in the processing stage is insignificant, as it accounts for less than 1% of the total water footprint and as such, much attention should be paid to water consumption at the farm or production level. We conclude that the water footprint of wheat varies from one production area to another and from season to season.
Of further importance is the conclusion that groundwater contributes about 34% and 42% of the average total water footprint in Clovelly and Bainsvlei, respectively. This provides the rationale for the consideration of the contribution of water from the ground to total water footprint. Previous studies aggregated blue water footprint without an indication of the proportion contributed by the ground water source [6,17,19]. Meanwhile, an understanding of this contribution to ET can help minimize irrigation water usage and also reduces the cost of production since blue water is a constituent of production cost. Our findings support the idea that the adoption of objective irrigation scheduling conserves water through the better utilization of rainfall and shallow groundwater available to the root zone of crops. This approach is also proven to be economically efficient regarding water usage. The depth of the groundwater has a significant influence on the contribution of groundwater to the total blue water footprint and, as such, the depth of the groundwater should be examined. Furthermore, it is revealed that the total water footprint varies in the two areas and for different groundwater levels. It is worth concluding that, by not accounting for the water available to the crop (controlled) from the ground, more blue water will be applied and this leads to an upsurge in the blue water footprint (surface).
More value is gained at the farm gate, followed by the milling stage and the bakery stage for every m3 of water utilized. Also, we conclude that more value is added to wheat at the milling stage, followed by the farm gate and bakery stages. The study recommends that to minimize blue water utilization, wheat farmers should investigate the groundwater levels and to know the water available to the crop before irrigation. In other words, accounting for the water contribution of groundwater to the total water footprint will provide a better understanding of water utilization in crop production and how it influences the surface water needed. Secondly, objective irrigation scheduling can be adopted to reduce irrigation water usage. Wheat farmers and breeders can rely on drought-resistant wheat varieties or cultivars that can depend on the available rainfall and available water from the ground. Generally, water footprint assessment has moved away from sole indicator assessment, and a deeper awareness of the productive usage of different sources of water has become vital for policy.
Given the absence of benchmarks or metrics for different catchment areas in South Africa, our findings can potentially act as blue water footprint benchmarks for wheat production in Bainsvlei and Clovelly, particularly for the same ground water levels in Bainvlei and Clovelly. A similar assessment should be conducted in other regions or catchment areas to make a correct judgment and to assess the efficiency and wise use of water, given that water footprint estimates and economic water, productivities vary from one geographical area to another. This will help in achieving the objective of the National Water Research bodies, which seeks to achieve sustainable and efficient water use for the benefit of all users. Finally, we recommend the inclusion of economic water productivities as well as value addition to a water footprint assessment along a given production chain.

Author Contributions

P.M.M. and E.O.-S. performed the analysis and wrote the paper, H.J. conceptualized the project idea and secured the funding as well as project administration; J.H.B. and L.D.v.R. performed the field experiment. E.O.-S. and H.J. supervised the study.

Funding

This research and the APC were funded by the Water Research Commission (WRC) of South Africa as part of a research project, “Determining the water footprints of selected field and forage crops towards sustainable use of fresh water, grant number “K5/2397//4”.

Acknowledgments

Financial and other assistance by the WRC is gratefully acknowledged. Financial assistance by the University of the Free State through the Interdisciplinary Research Grant is gratefully acknowledged.

Conflicts of Interest

The authors declare no conflict of interest.

References

  1. Jefferies, D.; Munoz, I.; Hodges, J.; King, V.J.; Aldaya, M.; Eric, A.E.; Canals, L.M.; Hoekstra, A.Y. Water footprint and the life cycle assessment as approaches to assess potential impacts of products on water consumption: Key learning points from pilot studies on tea and margarine. J. Clean. Prod. 2012, 33, 155–166. [Google Scholar] [CrossRef]
  2. Agudelo-Vera, C.M.; Mels, A.R.; Keesman, K.J.; Rijnaarts, H.H.M. Resource management as a key factor for sustainable urban planning. J. Environ. Manag. 2011, 92, 2295–2303. [Google Scholar] [CrossRef] [PubMed]
  3. Mekonnen, M.; Hoekstra, A.Y. National Water Footprint Accounts: The Green, Blue and Grey Water Footprint of Production and Consumption; Value of Water Research Report No. 50; UNESCO-IHE Institute for Water Education: Delft, The Netherlands, 2011. [Google Scholar]
  4. Hoekstra, A.Y.; Chapagain, A.K. The water footprint of Morocco and the Netherlands: Global water use as a result of domestic consumption of agricultural commodities. Ecol. Econ. 2007, 65, 143–151. [Google Scholar] [CrossRef]
  5. Aldaya, M.M.; Munoz, G.; Hoekstra, A.Y. Water Footprint of Cotton, Wheat and Rice Production in Central Asia; Value of Water Research Report Series No. 56; UNESCO-IHE Institute for Water Education: Delft, The Netherlands, 2010; Available online: http://doc.utwente.nl/77193/1/Report41-CentralAsia.pdf (accessed on 20 September 2015).
  6. Aldaya, M.M.; Hoekstra, A.Y. The water needed for Italians to eat pasta and pizza. Agric. Syst. 2010, 103, 401–415. [Google Scholar] [CrossRef]
  7. Bulsink, F.; Hoekstra, A.Y.; Booij, M. The Water Footprint of Indonesia, Provinces Related to the Consumption of Crop Products; Value of Water Research Report Series No. 37; UNESCO-IHE Institute for Water Education: Delft, The Netherlands, 2009; Available online: http://doc.utwente.nl/77199/1/Report37-WaterFootprint-Indonesia.pdf (accessed on 9 October 2015).
  8. Hoekstra, A.Y.; Chapagain, A.K.; Aldaya, M.M.; Mekonnen, M.M. The Water Footprint Assessment Manual, 1st ed.; Earthscan: London, UK, 2011; Available online: http://www.waterfootprint.org/downloads/TheWaterFootprintAssessmentManual.pdf (accessed on 30 January 2015).
  9. Mukheibir, P. Local water resource management strategies for adapting to climate induced impact in South Africa. In Rural Development and the Role of Food, Water and Biomass; University of Cape Town: Cape Town, South Africa, 2005. [Google Scholar]
  10. Department of Water Affairs (DWA). Proposed National Water Resource Strategy 2: Summary, Managing Water for an Equitable and Sustainable Future; DWA: Pretoria, South Africa, 2013. Available online: http://www.gov.za/sites/www.gov.za/files/Final_Water.pdf (accessed on 20 August 2015).
  11. Department of Agriculture Forestry and Fisheries (DAFF). Market Value Chain Profile; DAFF: Pretoria, South Africa, 2012. Available online: http://www.nda.agric.za/docs/AMCP/Wheat2012.pdf (accessed on 15 August 2015).
  12. World Wide Fund (WWF). Innovation in the South African Water Sector; Danish Investment into Water Management in South Africa; WWF: Pretoria, South Africa, 2015. Available online: http://www.wwf.org.za/media_room/publications/?15461/Innovations-in-the-SA-water-sector (accessed on 17 October 2016).
  13. Mekonnen, M.M.; Hoekstra, A.Y. A Global and High Resolution Assessment of the Green, Blue and Grey Water Footprint of Wheat; Value of Water Research Report Series, No. 42; UNESCO-IHE Institute for Water Education: Delft, The Netherlands, 2010; Available online: http://doc.utwente.nl/76916/1/Report42-WaterFootprintWheat.pdf (accessed on 15 August 2015).
  14. ISO. ISO 14046: Environmental Management—Water Footprint—Principles, Requirements and Guidelines; International Organization for Standardization: Geneva, Switzerland, 2014. [Google Scholar]
  15. Hoekstra, A.Y. A critique on the water-scarcity weighted water footprint in LCA. Ecol. Indic. 2016, 66, 564–573. [Google Scholar] [CrossRef]
  16. Mekonnen, M.M.; Hoekstra, A.Y. The Green, Blue and Grey Water Footprint of Crops and Derived Crop Products Volume 1: Main Report; Value of Water Research Report Series; UNESCO-IHE: Delft, The Netherlands, 2010; Available online: http://www.waterfootprint.org/Reports/Report47-WaterFootprintCrops-Vol1.pdf (accessed on 16 February 2015).
  17. Ahmed, S.M.; Ribbe, L. Analysis of water footprints of rainfed and irrigated crops in Sudan. J. Natl. Resour. Dev. 2011, 1, 1–9. [Google Scholar]
  18. Neubauer, E. Water footprint in Hungary. APSTRACT 2012, 6, 83–91. [Google Scholar] [CrossRef] [PubMed]
  19. Sundberg, H. The Water Footprint of Winter Wheat in Sweden. In Human Development Report: The Rise of the South Human Progress in a Diverse World; Technical Notes; University of Lund: Lund, Sweden, 2012. [Google Scholar]
  20. Ababaei, B.; Etedali, H.R. Estimation of water footprint components of Iran’s wheat production: Comparison of global and national scale estimates. Environ. Sci. Process. 2014, 1, 193–205. [Google Scholar] [CrossRef]
  21. Le Roux, B.; van de Laan, M.; Vahrmeijer, T.; Annamdale, J.G.; Bristow, K.L. Estimating Water Footprint of Vegetable Crops: Influence of Growing Season, Solar Radiation Data and Functional Unit. Water 2016, 10, 473. [Google Scholar] [CrossRef]
  22. Owusu-Sekyere, E.; Scheepers, M.E.; Jordaan, H. Water footprint of milk produced and processed in South Africa: Implications for policy-makers and stakeholders along the dairy value chain. Water 2016, 8, 322. [Google Scholar] [CrossRef]
  23. Dong, H.; Yong, G.J.S.; Tsuyoshi, F.; Tomohiro, O.; Bing, X. Regional water footprint evaluation in China: A case of Liaoning. Sci. Total Environ. 2013, 442, 215–224. [Google Scholar] [CrossRef] [PubMed]
  24. Chouchane, H.; Hoekstra, A.Y.; Krol, M.S.; Mekonnen, M.M. The water footprint of Tunisia from an economic perspective. Ecol. Indic. 2015, 55, 311–319. [Google Scholar] [CrossRef]
  25. Zoumides, C.; Bruggeman, A.; Hadjikakou, M.; Theodoros, Z. Policy-related indicators for semi-arid nations: The water footprint of crop production and supply utilization of Cyprus. Ecol. Indic. 2014, 43, 205–214. [Google Scholar] [CrossRef]
  26. Berger, M.; Finkbeiner, M. Water footprinting: How to address water use in life cycle assessment. Sustainability 2010, 2, 919–944. [Google Scholar] [CrossRef]
  27. Crafford, J.; Hassan, R.M.; King, N.A.; Damon, M.C.; de Wit, M.P.; Bekker, S.; Rapholo, B.M.; Olbrich, B.W. An Analysis of the Social, Economic, and Environmental Direct and Indirect Costs and Benefits of Water Use in Irrigated Agriculture and Forestry: A Case Study of the Crocodile River Catchment, Mpumalanga Province; Water Research Commission (WRC): Pretoria, South Africa, 2004. [Google Scholar]
  28. Owusu-Sekyere, E.; Scheepers, M.E.; Jordaan, H. Economic water productivities along the dairy value chain in South Africa: Implications for sustainable and economically efficient water-use policies in the dairy industry. Ecol. Econ. 2017, 134, 22–28. [Google Scholar] [CrossRef]
  29. Van Rensburg, L.; Barnard, J.H.; Bennie, A.T.P.; Sparrow, J.B.; du Preez, C.C. Managing Salinity Associated with Irrigation at Orange-Riet at Vaalharts Irrigation Schemes; Water Research Commission (WRC): Pretoria, South Africa, 2012. [Google Scholar]
  30. Department of Agriculture, Forestry and Fisheries (DAFF). Production Guideline for Wheat; DAFF: Pretoria, 2016. Available online: https://www.google.com/url?sa=t&rct=j&q=&esrc=s&source=web&cd=1&cad=rja&uact=8&ved=2ahUKEwiMleuIjYjdAhXMFsAKHWZICSsQFjAAegQIAxAC&url=http%3A%2F%2Fwww.daff.gov.za%2FDaffweb3%2FPortals%2F0%2FBrochures%2520and%2520Production%2520guidelines%2FWheat%2520-%2520Production%2520Guideline.pdf&usg=AOvVaw1o5TQs9FRfAMttcN9HeQMn (accessed on 20 August 2017).
  31. Grain SA. Producer Price Framework for Irrigation Wheat. 2016. Available online: http://www.grainsa.co.za/pages/industry-reports/production-reports (accessed on 17 October 2016).
Figure 1. Procedure conceptualization of the field experiment.
Water 10 01167 g001
Figure 2. Map of the study area. Source: Van Rensburg et al. [29].
Water 10 01167 g002
Figure 3. Lysimeter trial for evaluation of different groundwater levels.
Water 10 01167 g003
Table 1. Collective data for wheat production.
TreatmentsCum. ETRWUEI + RIGDMYield
BAINSVLEI
Control88018311.23864681015,9999881
1 m—Constant95418311.0037118860516,12310,475
1.5 m—Constant91418310.8748129846716,3199921
1 m—Falling90618311.5740021753216,77610,458
1.5 m—Falling88118311.6346027744315,57810,230
CLOVELLY
Control8251839.83834651014,7088375
1 m—Constant86918310.4046928642413,9959010
1.5 m—Constant86018310.6354035733015,1859161
1 m—Falling83018310.7742624340815,2308937
1.5 m—Falling82418310.4747228936014,8988620
Cum. ET = cumulative evapotranspiration; R = effective rain; I + R = irrigation and rain; I = irrigation; G = groundwater; DM = dry matter. Source: Authors’ calculations.
Table 2. Nitrogen (Kg N/ha) and phosphorus fertilization (Kg P/ha) based on targeted yield under irrigation.
Nitrogen Application Rates
Target Yield (ton/ha)Nitrogen (kg N/ha)
4–580–130
5–6130–160
6–7160–180
7–8180–200
8+200+
Phosphorus Application Rates (Kg P/ha)
Target Yield (ton/ha)Soil Phosphorus Status (mg/kg)
>5 *5–1819–30>30
4–536281812
5–644342215
6–752402618
7+>56>42>2821
* Minimum quantity that should be applied at the low soil phosphorus level. Source: DAFF [30].
Table 3. Summary of the blue and green water footprint of wheat at the Vaalharts and Orange-Riet sites.
SAMPLEET Crop (mm)ET Green (mm)ET Blue S (mm)ET Blue G (mm)CWU (m3)CWU Green (m3 ha)CWU Blue (m3 ha)Yield (ton ha)WF Green (m3 ton)WFblue Surface (m3 ton)WFblue Ground (m3 ton)WF Grey (m3 ton)Total WF (m3 ton)
BAINSVLEI
Control88018368108800183068109.9185688055928
1 m—Constant95418318860595401830793010.517417957652981
1.5 m—Constant9141832684679140183073509.918527147255983
1 m—Falling90618321753290601830749010.517420750752940
1.5 m—Falling88118327744388101830720010.217927243454939
CLOVELLY
Control82518365108250183065108.42187750601053
1 m—Constant8691832864248690183071009.0203318471561048
1.5 m—Constant8601833573408600183069709.2199388370541011
1 m—Falling8301832434088300183065108.920627345856993
1.5 m—Falling8241832893608240183064908.6213336419581026
S = Surface water; G = Groundwater.
Table 4. Blue water footprint benchmarks for different groundwater levels at the Vaalharts and Orange-Riet regions.
SAMPLEYield (ton ha)WFblue Surface (m3 ton)WFblue Ground (m3 ton)Total Blue WF (m3 ton)PWP Surface (kg m3)PWP Ground (kg m3)Total PWP (kg m3)EWP Surface (ZAR m3)EWP Ground (ZAR m3)
BAINSVLEI
Control9.968806881.45-1.455.81-
1 m—Constant10.51795767555.591.747.3222.3512.71
1.5 m—Constant9.92714727433.692.125.8114.7612.31
1 m—Falling10.52075077144.831.976.8019.3213.42
1.5 m—Falling10.22724347063.682.305.9814.7113.78
CLOVELLY
Control8.477507751.29-1.295.16-
1 m—Constant9.03184717893.142.125.2712.5811.18
1.5 m—Constant9.23883707582.582.705.2810.3114.27
1 m—Falling8.92734587313.662.185.8514.6512.77
1.5 m—Falling8.63364197552.982.395.3611.9012.80
S = Surface water; G = Groundwater; PWP = Physical water productivity; EWP = Economic water productivity.
Table 5. Water use at the processing stage of the value chain (milling and bakery).
ParameterUnitQuantity
Milling stage
Quantity of wheatton767,545
Volume of water usedm346,053
Quantity of flourton632,348
Water footprint (flour)m3 ton0.07
Bakery stage
Quantity of bread producedton379,803
Volume of water usedm3174,452
Water footprint (bread)m3 ton0.46
Total water footprint processingm3 ton0.53
Source: Authors’ calculations.
Table 6. Physical and economic water productivity of wheat, flour and bread along the wheat-bread value chain.
ParametersWheatFlourBread
Physical and Economic Water Productivities
Yield9.010 ton ha632,348 ton379,803 ton
Total water use8690 m3 ha46,053 m317,447 m3
Physical water productivity1.037 kg m30.014 kg m30.022 kg m3
Value added4.0 ZAR kg5.7 ZAR kg1.7 ZAR kg
Economic water productivities4.15 ZAR m30.08 ZAR m30.04 ZAR m3
Source: Authors’ calculations.
Table 7. Summary of the value added to wheat along the wheat-bread value chain.
Production StageValue Added% Share of Value Added
Farm level4.0 ZAR kg35.1
Processing level
Milling5.7 ZAR kg50.0
Bakery1.7 ZAR kg14.9
Sub-total7.4 ZAR kg64.9
Total value added11.4 ZAR kg100
Average exchange rate for December 2016: US$1 = 14.62ZAR.

