Contribution of Moisture from Mediterranean Sea to Extreme Precipitation Events over Danube River Basin


1
EPhysLab (Environmental Physics Laboratory), Facultade de Ciencias, Universidade de Vigo, 32004 Ourense, Spain
2
Instituto Dom Luiz, Universidade de Lisboa, 1749-016 Lisboa, Portugal
*
Authors to whom correspondence should be addressed.
Water 2018, 10(9), 1182; https://doi.org/10.3390/w10091182
Submission received: 3 August 2018
/
Revised: 24 August 2018
/
Accepted: 1 September 2018
/
Published: 4 September 2018
(This article belongs to the Special Issue Selected Papers from the 1st International Electronic Conference on the Hydrological Cycle (ChyCle-2017))
Abstract
:In the most recent decades, central Europe and the Danube River Basin area have been affected by an increase in the frequency and intensity of extreme daily rainfall, which has resulted in the more frequent occurrence of significant flood events. This study characterised the link between moisture from the Mediterranean Sea and extreme precipitation events, with varying lengths that were recorded over the Danube River basin between 1981 and 2015, and ranked the events with respect to the different time scales. The contribution of the Mediterranean Sea to the detected extreme precipitation events was then estimated using the Lagrangian FLEXPART dispersion model. Experiments were modelled in its forward mode, and particles leaving the Mediterranean Sea were tracked for a period of time determined with respect to the length of the extreme event. The top 100 extreme events in the ranking with durations of 1, 3, 5, 7, and 10 days were analysed, and it was revealed that most of these events occurred in the winter. For extreme precipitation, positive anomalies of moisture support from the Mediterranean were found to be in the order of 80% or more, but this support reached 100% in summer and spring. The results show that extreme precipitation events with longer durations are more influenced by the extreme Mediterranean anomalous moisture supply than those with shorter lengths. However, it is during shorter events when the Mediterranean Sea contributes higher amounts of moisture compared with its climatological mean values; for longer events, this contribution decreases progressively (but still doubles the climatological moisture contribution from the Mediterranean Sea). Finally, this analysis provides evidence that the optimum time period for accumulated moisture to be modelled by the Lagrangian model is that for which the extreme event is estimated. In future studies, this fine characterisation could assist in modelling moisture contributions from sources in relation to individual extreme events.
1. Introduction
There has been a rise in the number of extreme multi-day precipitation events occurring across Europe (including the Danube region), even in areas characterised as being drier on average [1]. These findings are consolidated by the results of other studies, which show that climate change and the presence of a warmer climate result in higher heavy rainfall events with varying durations but a reduction in summer precipitation throughout most parts of Europe [2,3].
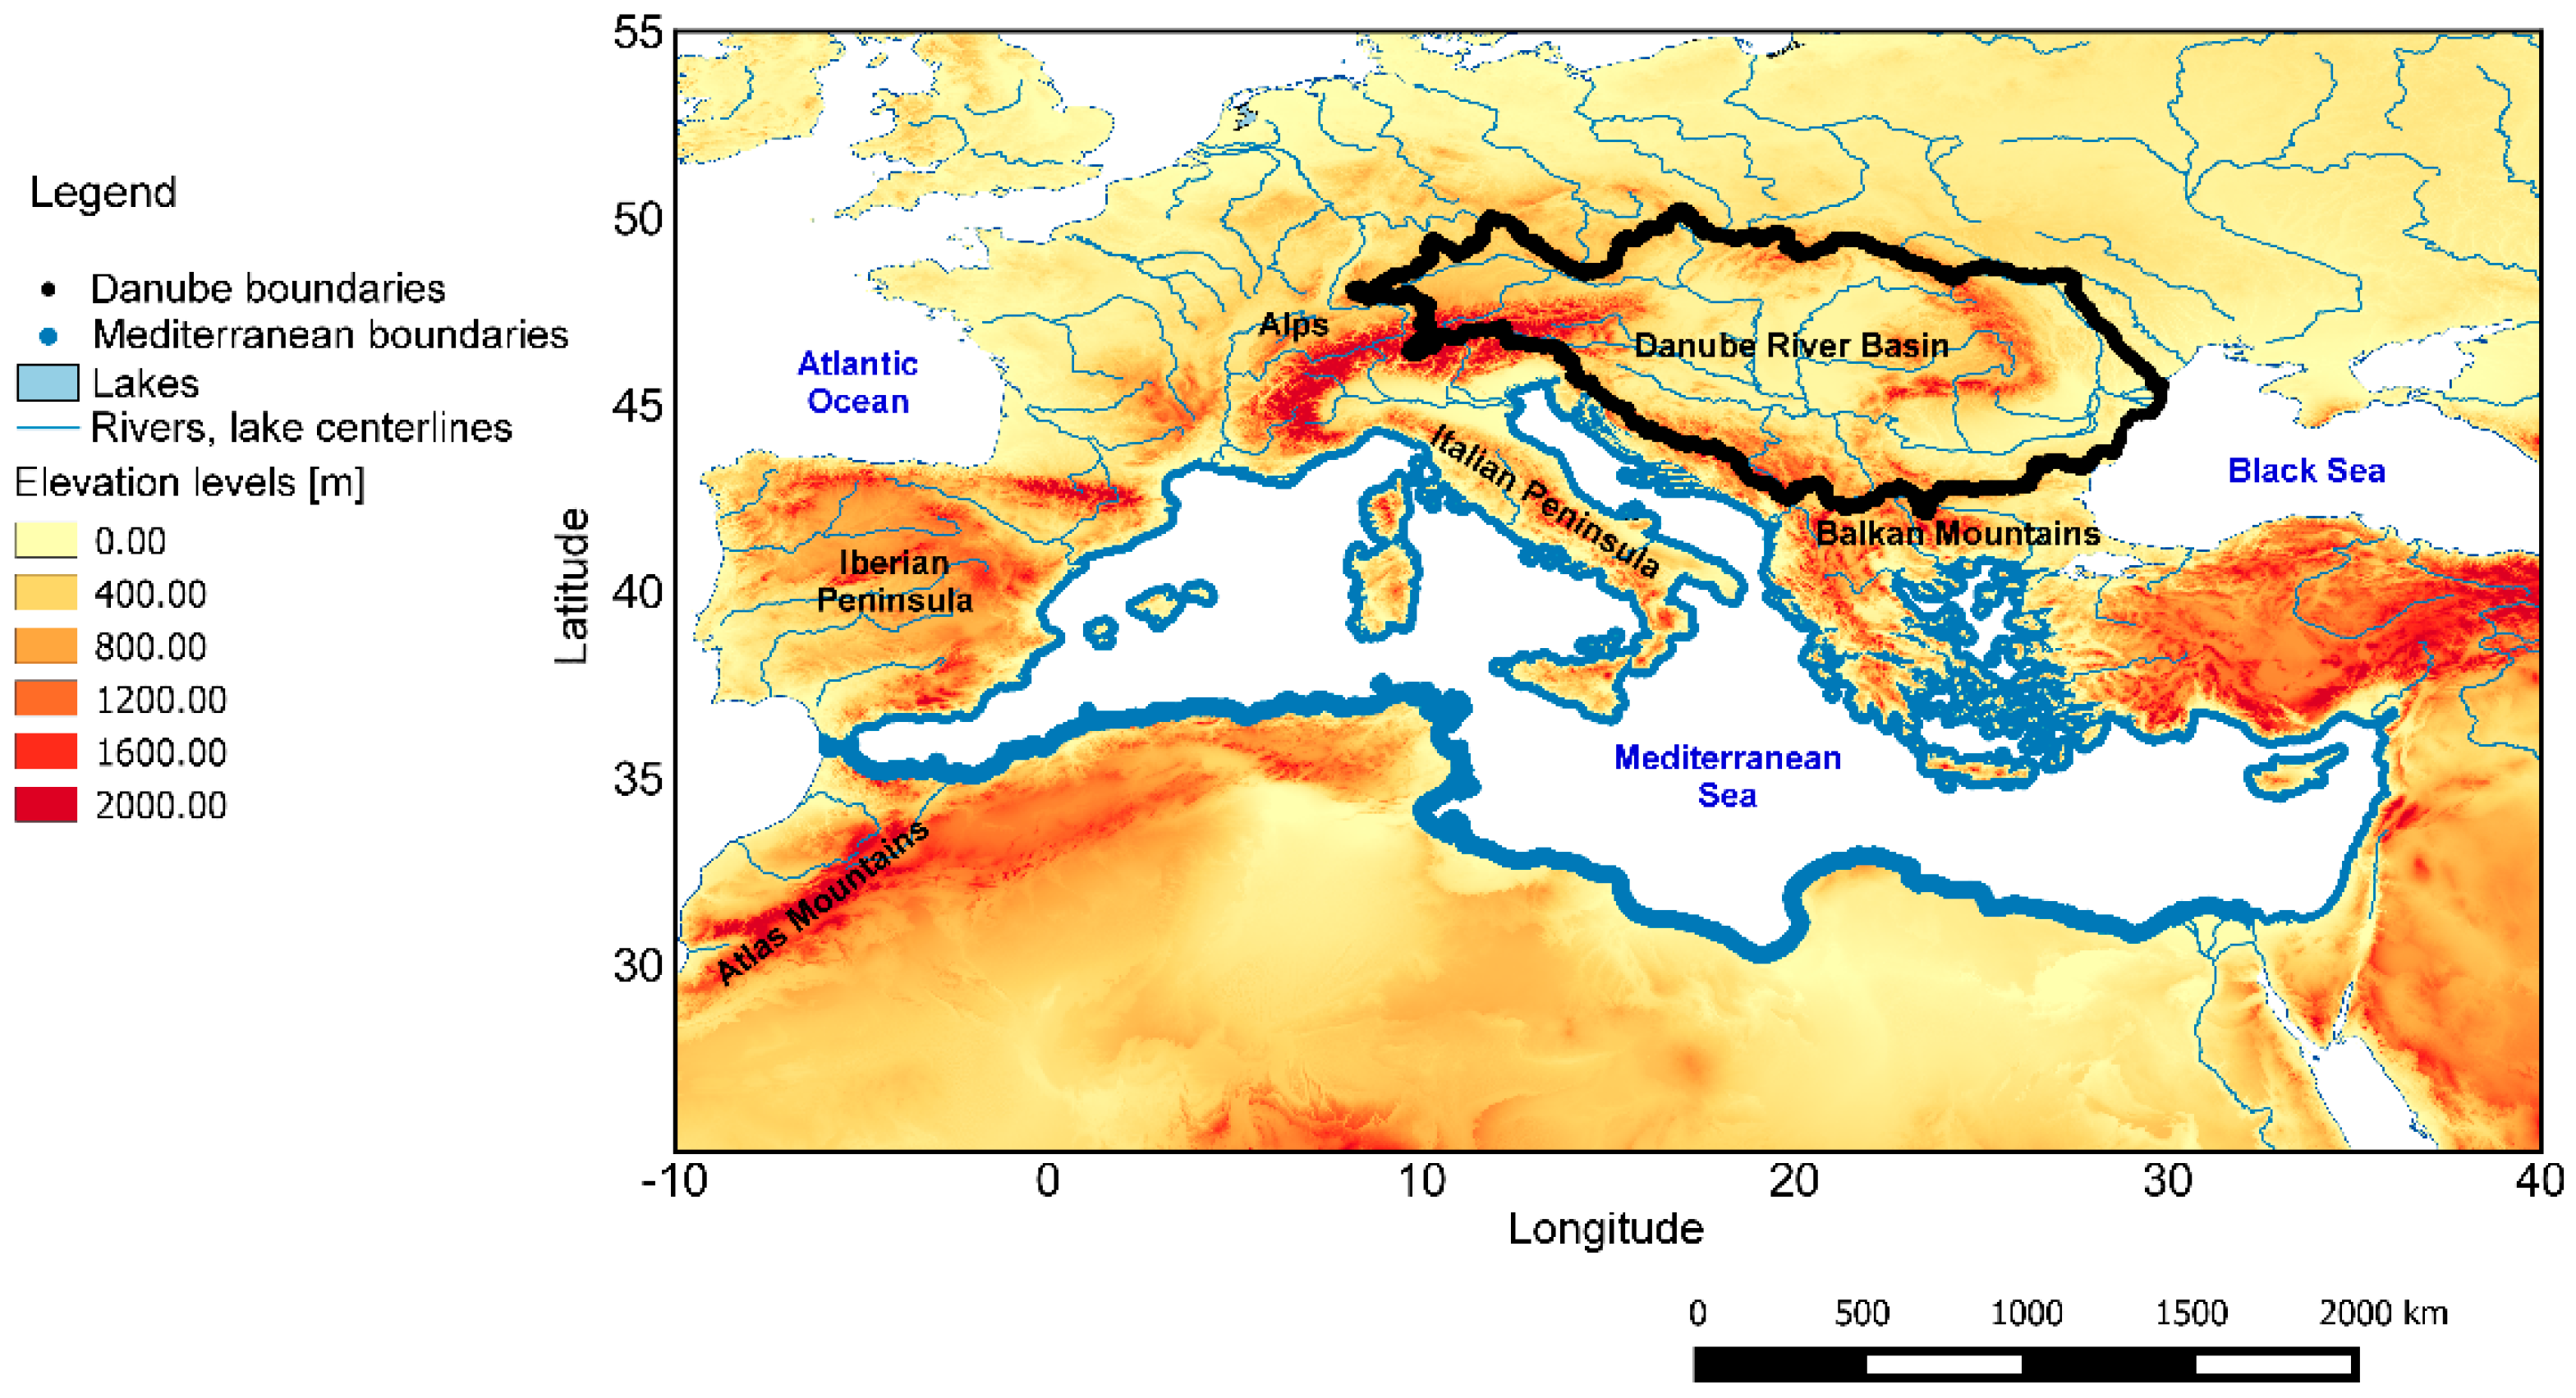
The Danube River Basin is an important international basin. It has a length of 2780 km from Central to South-eastern Europe (Figure 1), and is the second-largest catchment area in Europe (approximately 817,000 km2). It is characterised by diverse topography (including the Alps region) and by the high amount of precipitation received throughout the year, which is due to significant influences from the Mediterranean, Black Sea, the Atlantic Ocean, and the basin itself [4].
Average annual precipitation is estimated in a range between 2300 mm in the high mountain regions and 400 mm in the Danube Delta [4]. Highest precipitation values of over 2000 mm have been recorded on the southern-oriented mountain chains of the Julian Alps and the Dinaric system, where the effects of humid and warm air masses originating from the Mediterranean and the associated orographic ascent result in convective precipitation [4,5]. In the Danube region, maximum mean climatological precipitation is recorded in the western part of the basin in July (mid-summer) and the minimum is recorded in April (spring) [6], but June and September are also defined as extremely wet months [7]. Wet and dry periods in the area are not temporally and spatially homogeneous and are strongly dependent on cyclone (anticyclone) circulation, convergence (divergence), advection of moist (dry) air and an increase (reduction) in the number of rain days [8].
Extreme hydrological events in the Danube River Basin, such as extreme precipitation and drought events, have become more frequent and more intensive as a consequence of changes in precipitation and temperature [9,10]. In particular, precipitation in the Mediterranean region has shown intra-annual irregularities over the most recent years, and a huge amount of rain has been recorded as falling within a short time frame [11]. Changes in daily precipitation could be related to an above average increase in the intensity and frequency of wet-days and wet-spell lengths [12]. The extreme hydrological events occurring in the Danube River Basin result in abnormal rainfall quantities falling in the region and are one of the main causes of floods in the area [13]. With respect to the three main parts of the Danube region, flood occurrences have mainly been recorded during June–August in the Upper Danube River Basin, in April in the Central part, and during April–May in the Lower Danube River [5]. As an example, and to highlight the importance of the extreme rainfall, a historical flood was recorded in August 2002 in the region, when heavy rain occurred in the southern and eastern parts of Germany, Austria, the Czech Republic and Slovakia, and resulted in devastating inundations that caused billions of euros worth of damage [14]. This extreme rainfall was caused by a V-b cyclone that had been created in the northern Mediterranean and then moved toward Austria, the Czech Republic, and Germany, while also affecting some parts of Poland and Slovakia. The largest precipitation quantities were recorded in Austria; the total rainfall amount for a few days in August exceeded the monthly climatological value by three to four times and provided 40–50% more than the annual average precipitation. In the mountain region between the Czech Republic and Austria, the amount of precipitation recorded was 350% that of the monthly climatological mean [15].
Part of the Danube River Basin is situated in the Mediterranean area, which is a region determined as being one of the most vulnerable to future climate change affects [16], and is considered a “hot-spot” region with respect to future negative climate projections. An analysis of the impact of climate change on extreme precipitation and floods in Slovakia found that climate change will cause an increase in short-term extreme rainfall events with accompanying floods. An increased maximum daily mean flood discharge of up to 43–55% is expected by 2025, up to 94–115% by 2050 and up to 115–166% by 2075 [17]. Another study also confirmed that future intensification of extreme precipitation events can be expected in the Mediterranean region as a consequence of depth-duration-frequency (DDF) curve changes, which may lead to floods with increased severity and intensity [18].
Many studies have investigated extreme precipitation events in the Danube basin region [19,20,21,22]. Ciric et al. [22] ranked extreme precipitation events with different durations in the Danube River basin by considering all days within the period 1981–2015. Their study analysed the most extreme precipitation event (23 September 1996), investigated the moisture sources and synoptic conditions leading to this extreme precipitation, and determined that the Mediterranean Sea is one of the most important moisture sources in the region [4,22] and for certain adjacent areas, such as the Balkan Peninsula [23,24] and the Southern Alpine region [25]. It is important to note the importance of the Mediterranean Sea as a source of moisture at a global scale, being one of the major oceanic sources to continental precipitation [26]. However, its impact differs on a seasonal scale over the Danube River Basin; it is the most important in winter whereas the Danube River Basin itself is dominant in summer [4].
In this paper, we use the ranking of extreme precipitation events developed by Ciric et al. [22] to analyse the contribution from the Mediterranean Sea (as a source of moisture) to the 100 most intense precipitation events recorded over the Danube River basin and obtained from the Climate Hazards Group Infra-Red Precipitation with Station dataset (CHIRPS) [27], which have different durations of 1, 3, 5, 7, and 10 days. Using the outputs of the Lagrangian dispersion model FLEXPART V9.0, which was initially developed by Stohl and James [28,29], and was fed with ERA-Interim reanalysis dataset from the ECMWF (European Centre for Medium-Range Weather Forecast) [30]. This dataset is accessible in 1° spatial resolution on 60 vertical levels from 1000 to 0.1 hPa and is available at 6-h time intervals. We forward tracked all particles that initially resided over the Mediterranean Sea and then reached the Danube River basin during all selected events. We then computed the available moisture from the Mediterranean Sea that generated precipitation over the basin as (E − P) < 0 (herein, PFLEX) for each event. Comparing anomalies calculated from these PFLEX values with anomalies from CHIRPS precipitation data for each event in the Danube region, the contribution to total precipitation from moisture from the Mediterranean was calculated, and a link between both variables was obtained.
2. Materials and Methods
2.1. Ranking of Extreme Precipitation Events
Following the ranking method developed by Ramos et al. [31,32] and using the daily high resolution (0.05°) CHIRPS, we used the ranking of extreme precipitation events with different durations (1, 3, 5, 7, and 10 days) over the Danube River Basin presented in Ciric et al. [22] to analyse only the most intense wet-spell events (in terms of moisture availability and their associated synoptic configurations).
CHIRPS data are obtained from a quasi-global precipitation database and are available on daily to seasonal time-scales at a high resolution (0.05°). The database is comprised of three main components: High-resolution climatology, time-varying cold cloud duration precipitation estimates, and in situ rain gauge data. The high resolution and 6-h to 3-month aggregates make it suitable for determining extreme precipitation events in certain areas with high precision. The temporal period 1981 until 2015 was used to calculate extreme precipitation events with different durations in the Danube region.
The method developed by Ramos et al. [31,32] assigns a magnitude to each individual extreme precipitation event prior to determining its ranking. The index of the ranking (R) is given daily after multiplying two variables: (i) The area (A) where the precipitation anomaly is above two standard deviations (SDs) (expressed as percentages), and (ii) the mean value of precipitation anomalies (M), where only those grid points in A that have precipitation amounts higher than 1 mm are considered. The ranking index (R) can be expressed using the following equation,
R = A × M.
Ranking based on this R index is computed over multi-day periods as the sum of normalised precipitation anomalies for different durations (in our case for lengths of 1, 3, 5, 7, and 10 days). For example, the accumulated precipitation anomalies for an event with a duration of three days corresponds to the sum of the normalised precipitation anomalies of the analysed day and the two previous days, which totals three days. Explanation of this ranking methodology for extreme precipitation events is available in Ramos et al. [31,32] and Ciric et al. [22].
The R index was calculated for all days in the study period 1981–2015, which is a total of 12,775 days. We studied only the top 100 most extreme precipitation events occurring over the Danube River Basin with accumulated durations of 1, 3, 5, 7, and 10 days. The R magnitude for these 100 cases represents, for all durations, the ~0.99 percentile; therefore, we considered events that had the highest intensities. Table 1 provides an example of dates for the first 10 ranked cases, but the complete 100 extreme events for each duration are available in Tables S1–S5 in the Supplementary Material.
For each event, we computed the daily mean and daily anomalies of the precipitation values from CHIRPS data for the specific day/days of each event over the Danube River Basin.
2.2. Lagrangian Analysis of Mediterranean Moisture Contribution to Extreme Precipitation Events in Danube River Basin
In the present study, we analysed the contribution of moisture originating from the Mediterranean Sea and falling in the Danube River Basin during extreme precipitation events with different durations (Table 1). To enable this, we used a Lagrangian dispersion model FLEXPART V9.0, which was initially developed by Stohl and James [28,29], and was fed with ERA-Interim reanalysis data from the ECMWF [30]. This dataset is accessible in 1° spatial resolution on 60 vertical levels from 1000 to 0.1 hPa and is available at 6-h time intervals.
This Lagrangian approach consists in the division of the atmosphere in a large number of particles, for which it is assumed that the mass (m) remains constant. Basically, the Lagrangian model consists in calculation of surface freshwater flux (E − P) using the information on the particle’s trajectories. To produce trajectories, the input velocity data are interpolated on the present particle position (Lagrangian grid) to advect the particle. Approximately 2 million particles are modelled every 6-h, and the motion of these particles occurs through a 3-D (two horizontal and one vertical dimension) wind field, as well as superimposed stochastic turbulent and convective motions, horizontal and vertical wind components, temperature and specific humidity. Since all three wind components are used to trace the particle path, the trajectories are three dimensional. The trajectory calculation in FLEXPART is based on the simple trajectory equation [33,34]:
where, t is time, is the vector position and is the wind vector.
Changes in specific humidity (q) and of each element (particle) with time, (e − p = m dq/dt), where m is the mass of particle, enables identification of particles that decrease in moisture through precipitation (p) or evaporation (e) over each particle trajectory. By adding the (e − p) of all the tracked particles in the atmosphere over the area of interest, it is possible to obtain the total surface freshwater flux (E − P), where (E) is the evaporation rate and (P) the precipitation rate per unit area, through the equation,
for all K particles that reside inner the area A [28,29].
Along individual particle trajectories (as on a regular grid) can be identified the surfaces where the particles obtain and loss moisture, using only the particles’ information. On this way the source and sinks regions for a selected area can be identified and connected using the trajectory information. Particles are moved by the wind during the assumed average residence time in water vapour within the atmosphere, which is approximately 10 days [35]. A detailed explanation of many physical and dynamical parameters of the model may be found in the technical note by Stohl et al. [36] and in the official FLEXPART webpage (https://www.flexpart.eu/wiki).
This method can be applied in a backward or forward mode to compute the (E − P) budget and analyse main moisture sources for an area of interest and sinks for a defined source, respectively. When running the program backwards, it is possible to determine the sources of moisture and the areas where particles gain humidity as (E − P > 0); and running the program forward enables identification of sink regions where particles lose humidity (E − P < 0). A more detailed explanation of backward and forward analyses can be found in several works recently published that relate to areas near our target region (the Mediterranean basin [37], the Fertile Crescent [38], and the Iberian Peninsula [39]) and areas further north [40,41]. A more complete review can be found in the study of Gimeno et al. [42], which provides a comparison with other approaches used to detect moisture sources and sinks regions (as box and/or isotopes models) and emphasizes that the Lagrangian approach is one of the most suitable for use with these types of calculations. However, although there are many advantages of the Langrangian approach, it has two main associated limitations [42]: (1) The method is not able to calculate E and P separately, and (2) when input data have a limited resolution, the final results are also not as sharp. Nevertheless, the developers of the FLEXPART model, Stohl and James [36], pointed out that the large number of air particles considered in the experiment may cancel out such error types with respect to the given number of particles found in each atmospheric column. A more detailed explanation of the model’s advantages and disadvantages can also be found in Gimeno et al. [42].
In this study, to calculate the moisture contribution from the Mediterranean Sea to extreme precipitation events occurring over the Danube River Basin, we computed (E − P) < 0 using the forward mode for each of the top 100 events (which were individually detected by the ranking method and lasted for either 1-day, 3-days, 5-days, 7-days, or 10-days). We selected the specific number of days relating to each precipitation event to compute the mean daily values of E − P < 0 (namely, PFLEX-EVENT) and the mean climatological values for the same days within the 35-years climatology period 1981–2015 (PFLEX-CLI). This enabled us to compute the moisture anomalies supported from the Mediterranean Sea for each event (PFLEX-ANOM), and determine the anomalous moisture contribution from the Mediterranean Sea to each extreme precipitation event. To make a comparison between the percentage moisture contribution from the Mediterranean for each event modelled by FLEXPART (PFLEX-%) and climatology (PFLEX-CLI), the relationship was computed using Equation (4),
3. Results
For each extreme precipitation event, we calculated the precipitation characteristics using CHIRPS data and the information obtained from the FLEXPART model (derived from E − P < 0) to improve our knowledge of the relationship between precipitation events occurring over the Danube River Basin and moisture from the Mediterranean Sea. In addition, the percentage moisture from the Mediterranean Sea (PFLEX-%) relating to each event was computed and compared using PFLEX-CLI. All variables for the 100 events analysed are transcribed in the Supplementary Material (Tables S1–S5 for events with lengths of 1-day, 3-days, 5-days, 7-days and 10-days), and the R-index value of the ranking for each event is provided. Table 2 presents the top 10 extreme precipitation events of the total 100 ranked for the 5 different period lengths (1-, 3-, 5-, 7-, and 10-days). The date of an extreme ranked event denotes the last day of each event for a different duration. According to this, the moisture supply (E − P < 0) from the Mediterranean Basin into the Danube River Basin obtained via the FLEXPART outputs (PFLEX values) was computed for the same period length of the ranking. Thus, the integrated days of each event to compute PFLEX in different duration correspond to the same days of the length of the event. Therefore, for events with lengths of 1-day, we forward-integrated the PFLEX values for one day; for those with lengths of 3-days, the integration was performed for three days; and this continued until all durations were integrated.
The Mediterranean Sea is known to be one of the main sources of moisture for its surrounding continental areas (including the Danube region), and this is clear when analysing Table 2 (and Tables S1–S5). Although the amount of precipitations is greater than climatological mean values during extreme events, there are occasions when the moisture transport is not higher than the climatological value, and PFLEX-ANOM takes negative values. However, for the cases used in this analysis, positive PFLEX-ANOM values denote that for extreme precipitation events the Mediterranean is an effective source of moisture that provides greater than mean climatological values. Table 3 presents the percentage of these positive contributions on an annual and seasonal scale (winter, spring, summer and autumn), and the total of the events during each season. Although the Mediterranean always acts as a moisture source, it provides higher than mean amounts for between 84% and 93% of events (it contributes less to events of 5-days and more to events of 10-days in length). On a seasonal scale, the Mediterranean Sea has an extra support of moisture to extreme events with all duration lengths during summer (only showing lower percentages for events with lengths of 3-days). It is also evident from Table 3 evidences that the highest number of extreme precipitation events occurred during winter and the lowest number occurred during summer.
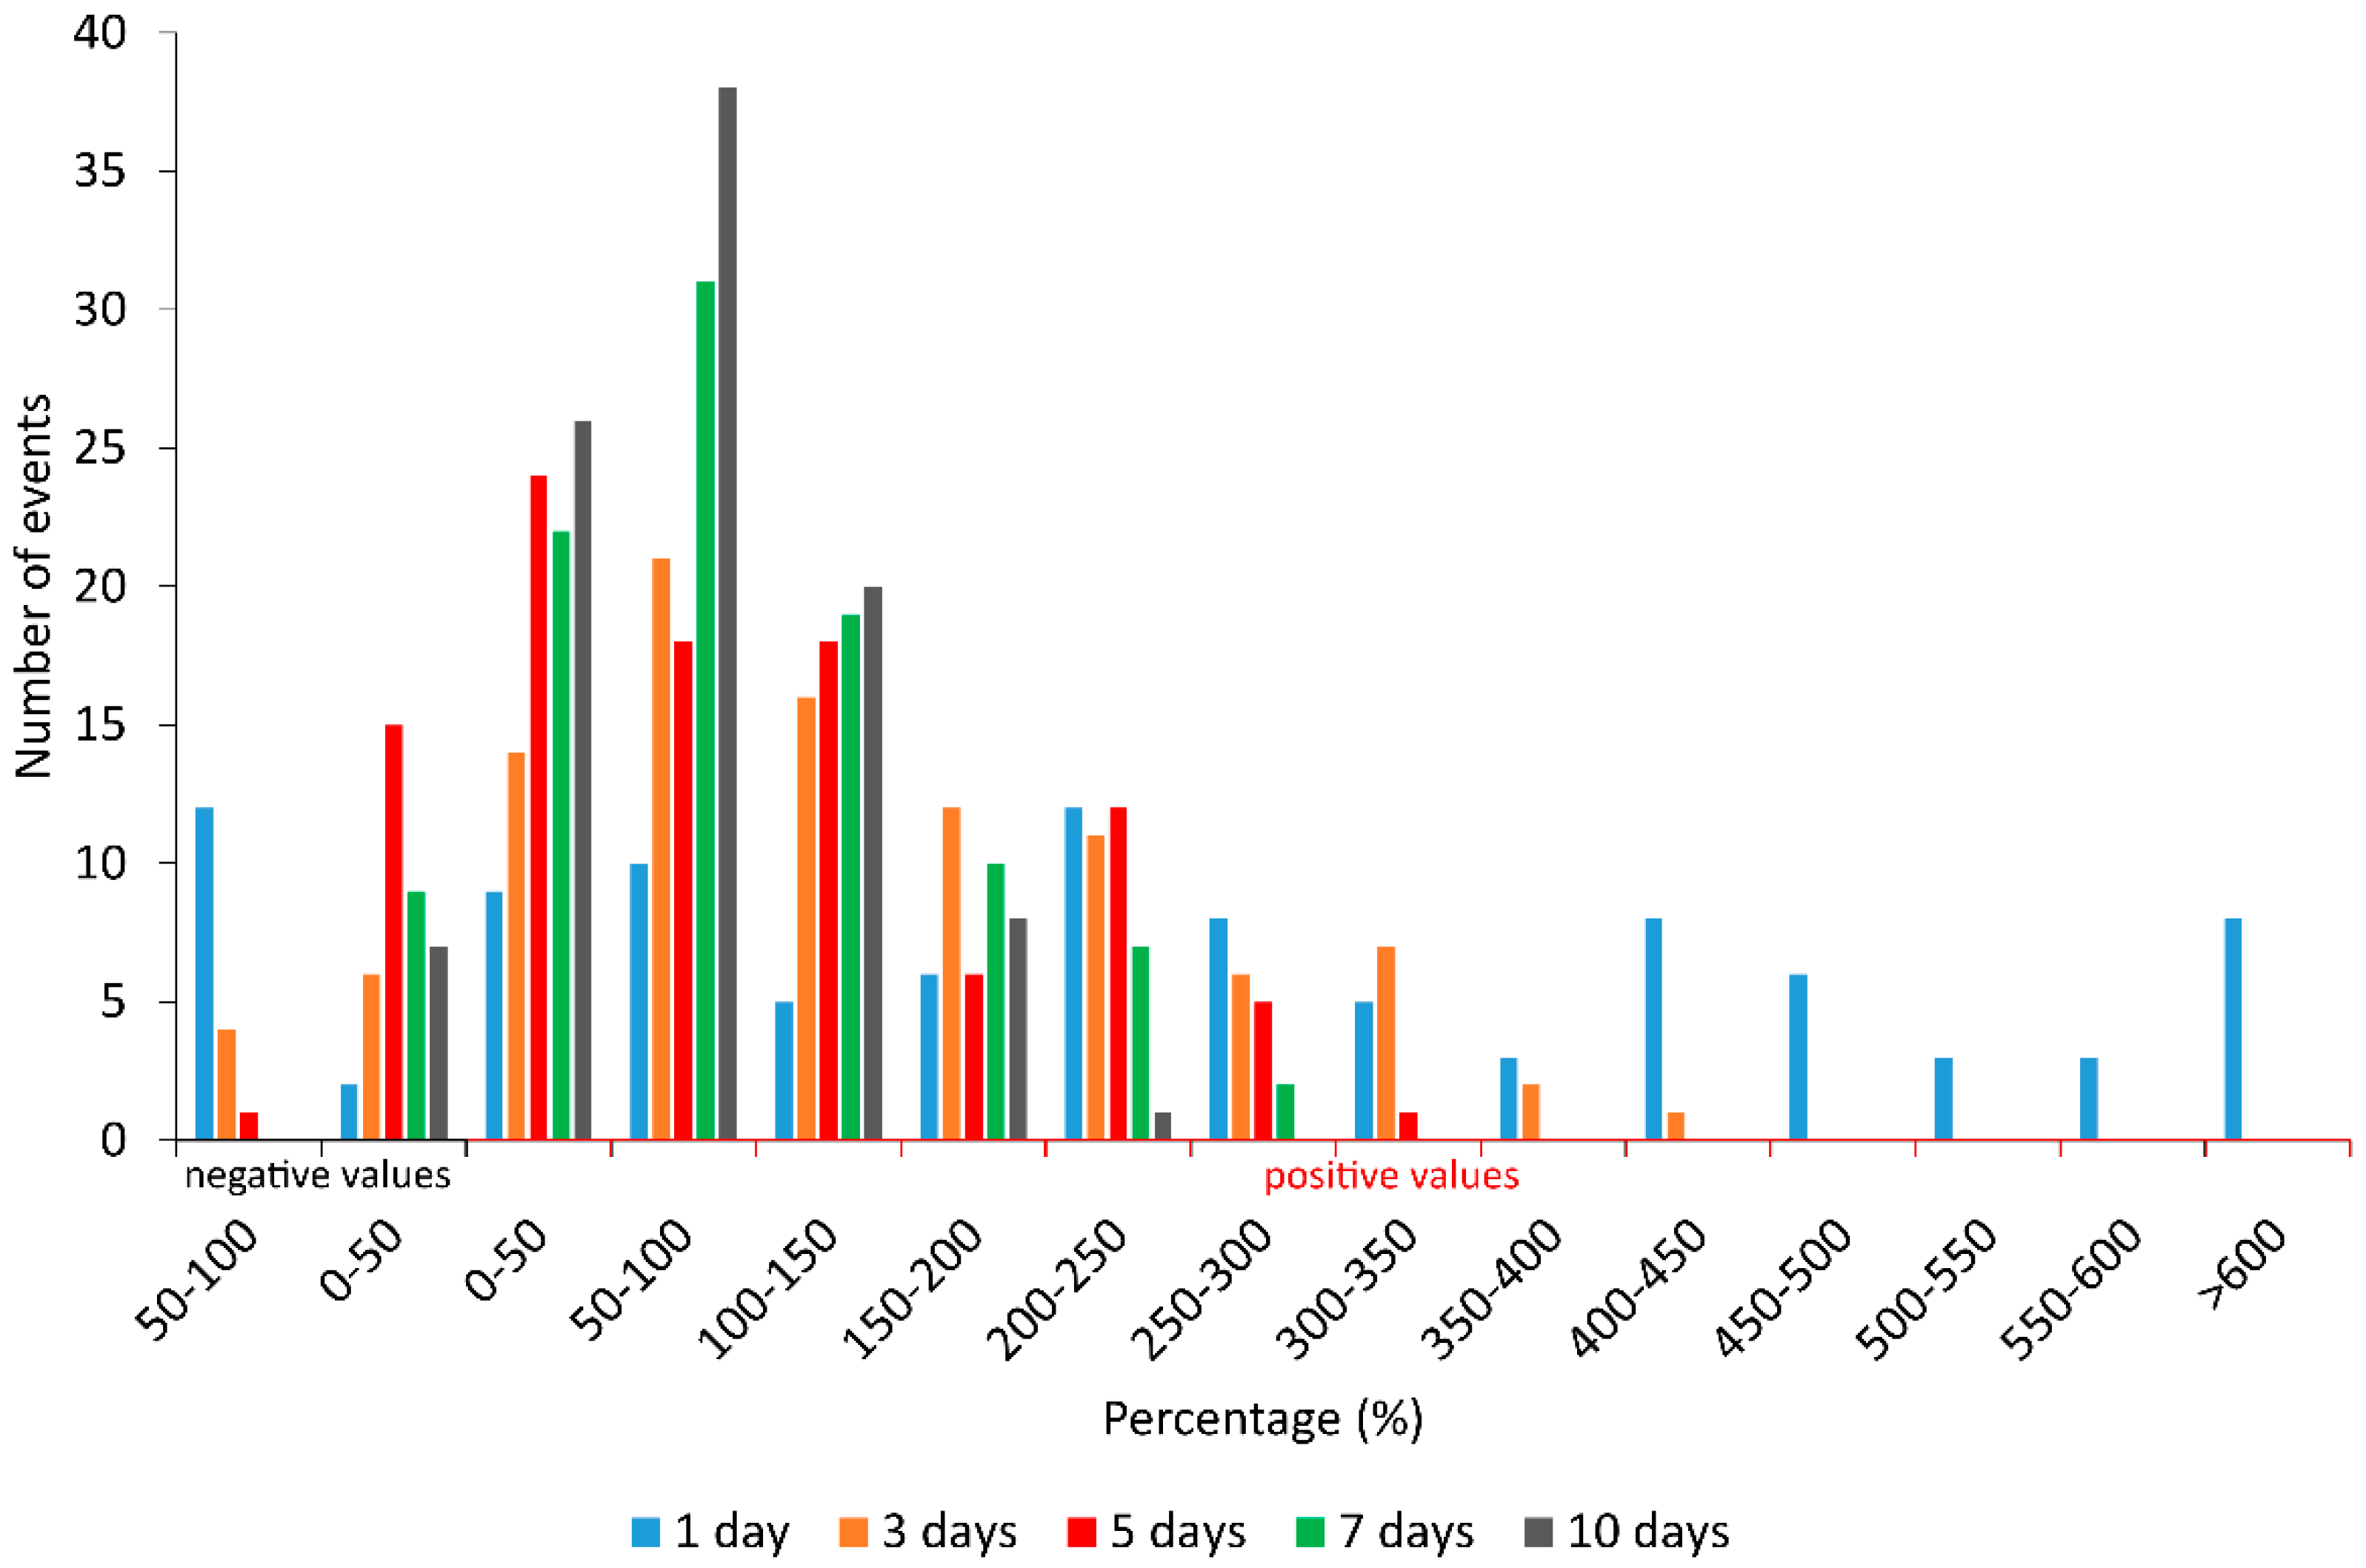
Table 2 shows the calculated intensity of the Mediterranean contribution in each ranked extreme precipitation event that is expressed by the variable PFLEX-%. As explained above, this variable denotes how many more times the Mediterranean moisture contributes to each event than during climatological contributions: A contribution of 100% means that this event was fed by twice the amount of moisture derived from the Mediterranean Sea than during climatological contributions. Figure 2 shows the occurrence distribution of this percentage on an annual scale for all extreme event durations. Positive values represent all the cases presented in Table 3. Our results show that the contribution from the Mediterranean was much higher (reaching values over 400%) for events lasting 1-day than for events with other durations. The contribution decreased for precipitation events with longer durations, although it was usually above 50%.
The computation was repeated to determine results on a seasonal scale (winter, spring, summer and autumn) for all durations, and these results are presented in the Supplementary Material (Figure S1 for 1-day duration, Figure S2 for 3-days duration, Figure S3 for 5-days duration, Figure S4 for 7-days duration, and Figure S5 for 10-days duration).
One of the main goals of this paper is to determine how much moisture is provided by the Mediterranean Sea to fuel extreme precipitation events over the Danube River Basin. To determine the existence of this relationship, a regression analysis was conducted (Table 4) between precipitation anomalies (Anomalies CHIRPS) and the anomalous contribution from the Mediterranean Sea (PFLEX-ANOM). As stated in the methodology, PFLEX-ANOM was calculated for the same different periods used in the ranking and lasting for 1, 3, 5, 7, and 10 days. This enabled us to understand the effect of the moisture supply to each event during the period of the event or/and during the previous days. Table 4 shows the results of linear regression slope values, and significant values (at a level of 90%) are highlighted.
On an annual scale and according to the Student’s t-test (see Table 4), events lasting 1 day, 3 days, and 7 days were more extreme when they had a higher moisture contribution from the Mediterranean Sea. It is remarkable the importance of the time period for the PFLEX integration, being the relationship significant for the same length of calculation (with the exception for events with 7 days of length). The results show a significant relationship in all seasons for extreme events lasting 7 days; for events of 10 days the relationship is only no significant during summer; but for short-duration events of 1 day, the relationship is significant during spring (accounting the moisture supply for 1 and 3 days) and summer (for all the time periods of moisture integration), and for events lasting 3 days, the relationship is significant during spring and autumn (but only integrating the moisture support for the same time period, 3 days).
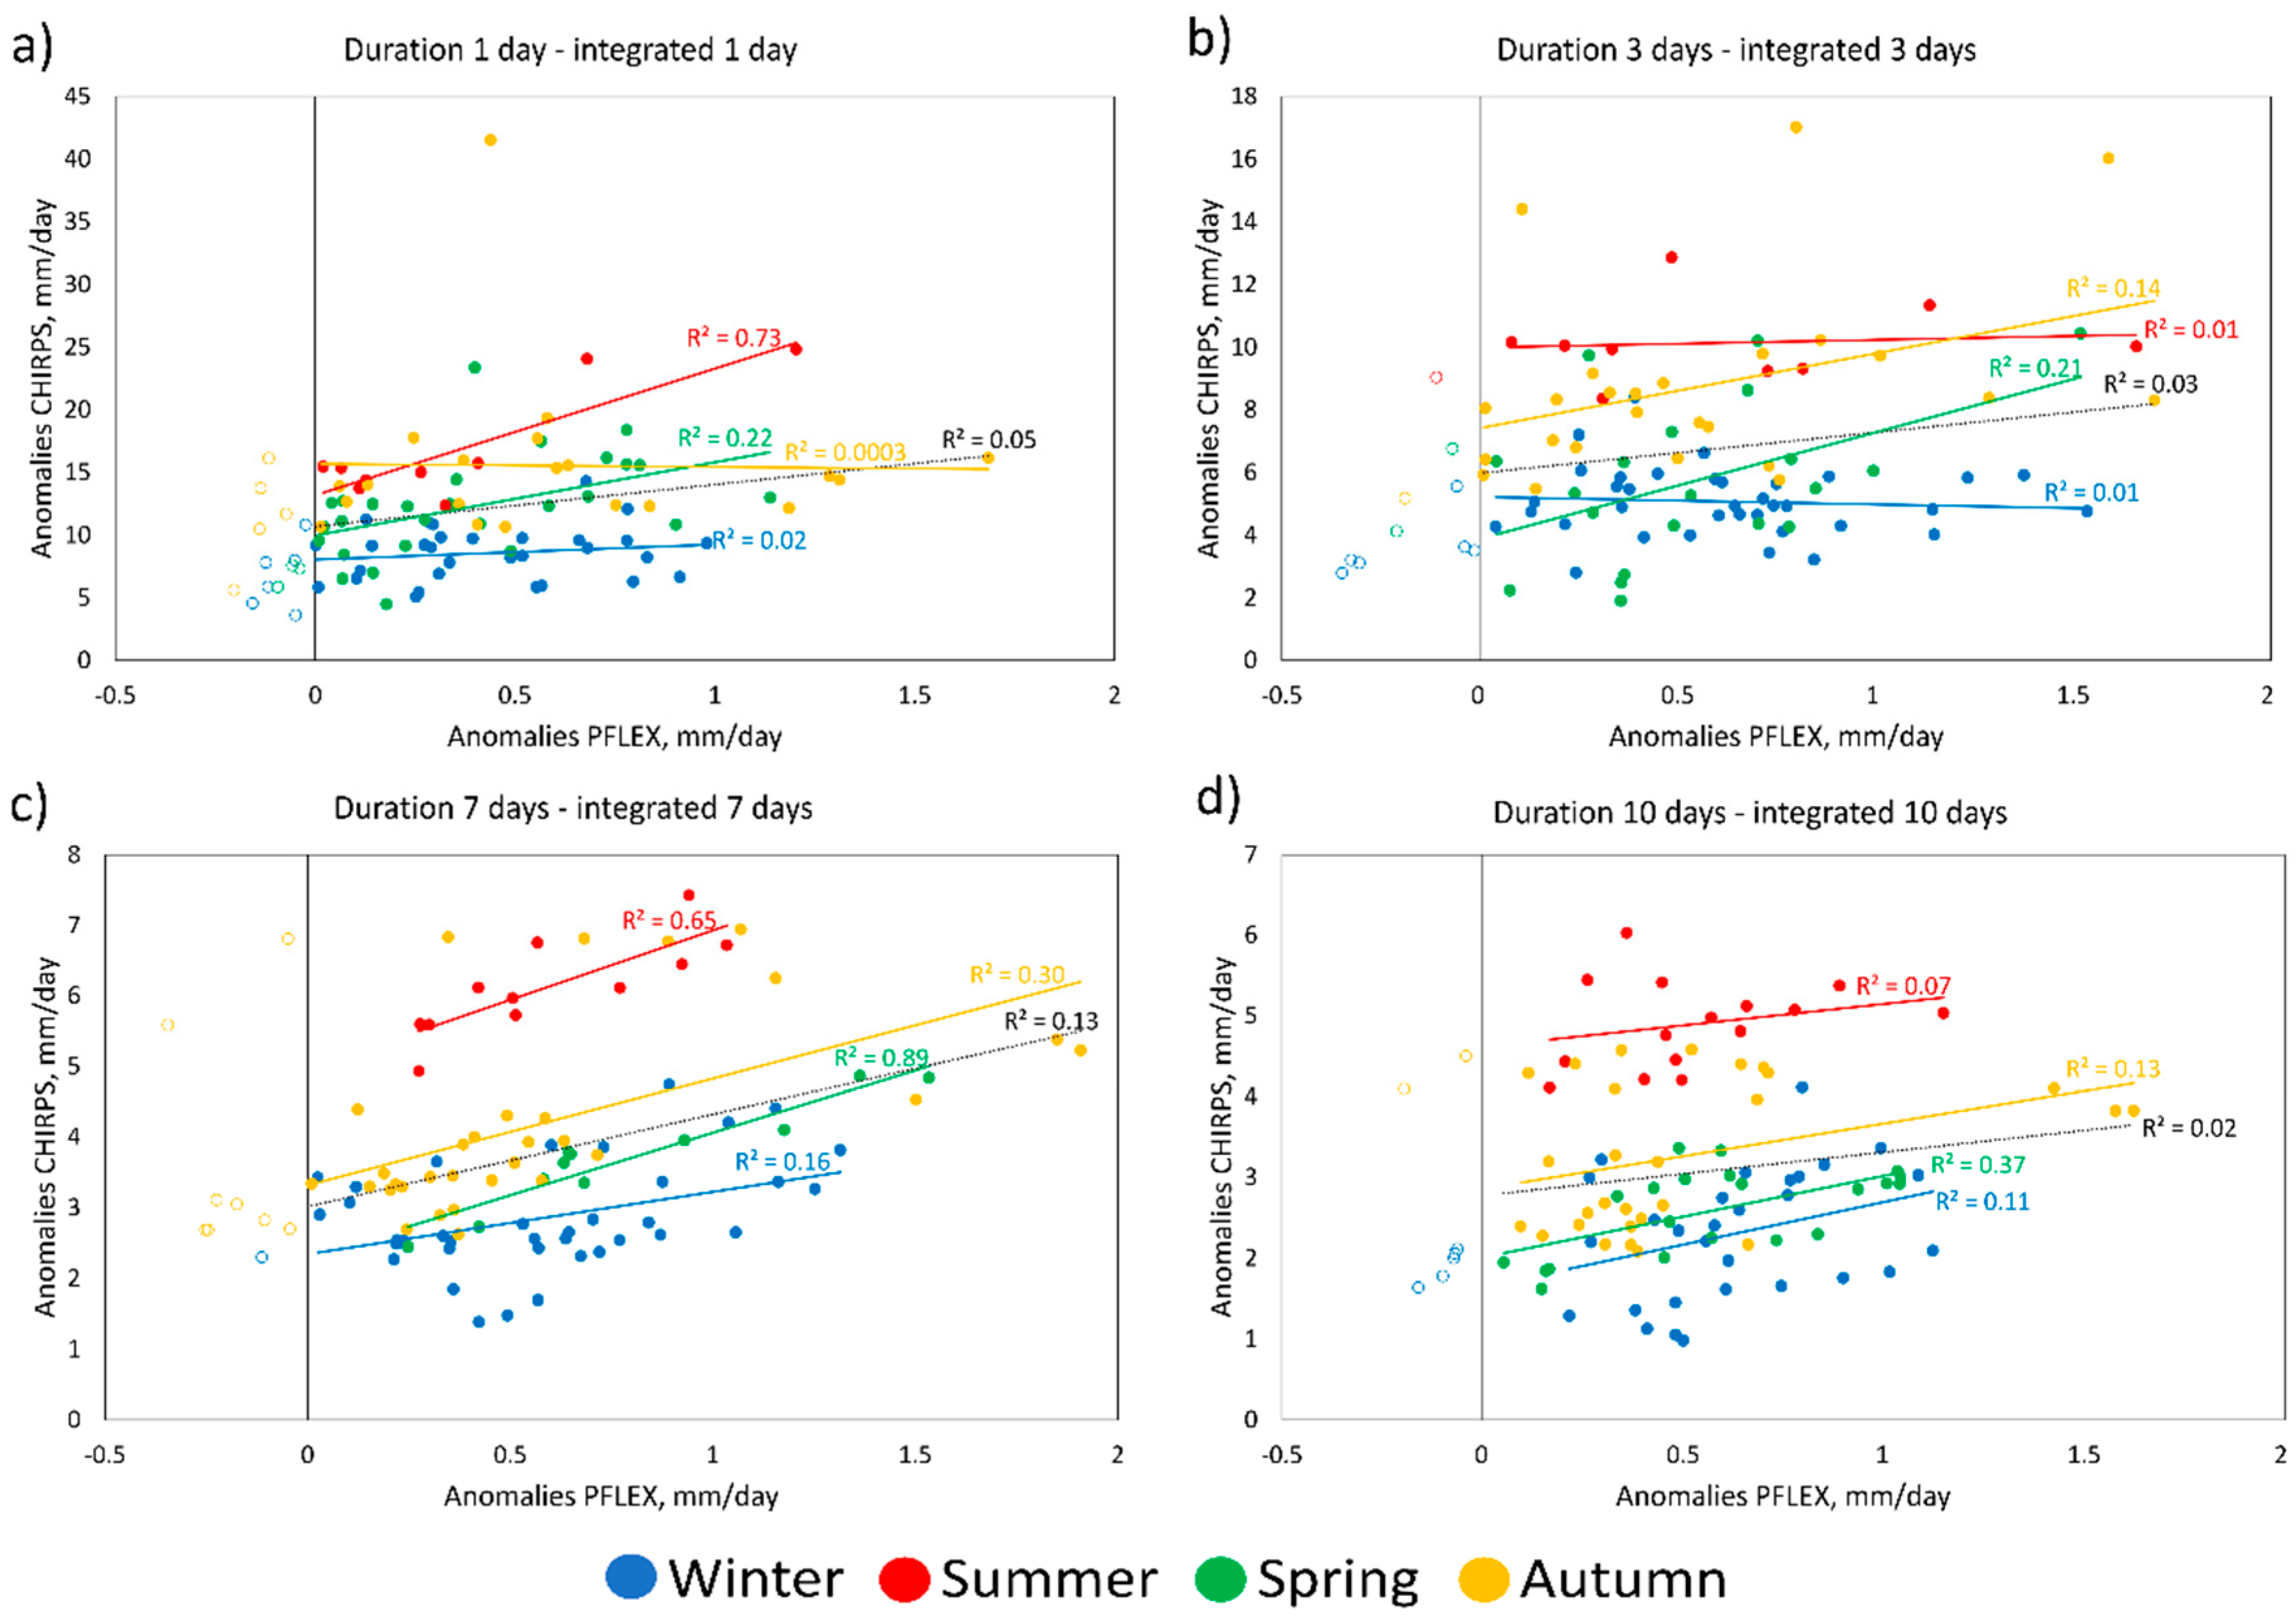
Calculated coefficient of determination values (R2) between Anomalies CHIRPS and PFLEX-ANOM for extreme events are indicated next to the corresponding regression line in Figure 3. The greatest R2 value (0.73) relate to events with duration of 1-day (Figure 3a) can be observed during summer, and means that 73% of the variability of precipitation anomalies during these events can be explained by positive anomalous moisture support from the Mediterranean Sea (PFLEX-ANOM). For other durations of 3-days (Figure 3b), 5-days (Figure 3c) and 10-days (Figure 3d), the highest values are observed during spring (R2 = 0.21, R2 = 0.89 and R2 = 0.37, respectively). These results mean that during spring and summer (for extreme precipitation events lasting 1-day) the highest precipitation anomalies over the Danube River Basin are highly associated with a strong moisture supply anomaly from the Mediterranean Sea that occurs during the event period. However, the positive moisture supply from the Mediterranean does not always correspond with extreme precipitation events, where cases with low R2 relate to 1-day events in autumn and 3-day events in winter, for example.
4. Discussion and Conclusions
In this study, we investigated the relationship between the anomalous moisture supply from the Mediterranean Sea during extreme precipitation events occurring in the Danube River Basin during the period 1981–2015.
Extreme precipitation events with different durations (1, 3, 5, 7, and 10 days) were ranked using CHIRPS data and by applying the method developed by Ramos et al. [31,32]. The ranked events included all extreme events that occurred during the 35-years period. However, we selected only the top 100 events, which had differing duration lengths (the highest 100 extreme precipitation events). Daily precipitation anomalies were then calculated for each extreme precipitation event.
To investigate the moisture contribution from the Mediterranean Sea to the Danube River Basin during these ranked extreme precipitation events of all durations, a Lagrangian forward analysis was conducted for the same 35-years period using the FLEXPART model, and the accumulated daily anomalous moisture supplies from the Mediterranean Sea for each event were calculated (PFLEX-ANOM) by integrating the moisture contribution during 1, 3, 5, 7, and 10 days.
Some of the results obtained in this study corroborate those of previous studies that were conducted using other methodologies and introduces new methods for exploring the relationship between moisture support from the Mediterranean Sea and extreme rainfall occurring within the Danube River Basin.
According to the ranking results, we can conclude that most extreme precipitation events occurred during winter in the Danube River Basin region (36 events with durations of 1-day; 42 events with durations of 3-days; 46 events with durations of 5-days; 39 events with durations of 7-days; and 43 events with durations of 10-days), when the Mediterranean Sea was found the dominant moisture source [4]. The variation in the Mediterranean moisture contribution to precipitation throughout the year has been observed in many studies, and clear seasonal differences in the moisture contribution have been shown [4,24]. However, in general, the anomalous contribution percentage from the Mediterranean Sea was positive during summer and spring (reaching 100% for several of the duration lengths) when major precipitation and floods where recorded over the region [5,15], and confirms the results of other studies that have characterised these seasons being a favourable period for extreme precipitation in the central Mediterranean region [43,44]. This behaviour, occurring in winter the maxima occurrence of extremes and being summer and spring when the Mediterranean Sea act as the major positive source of moisture is a consequence of the Mediterranean Sea is not the unique climatological source of moisture for the region (for instance, the Danube River Basin itself or the continental surrounding areas [4]), and many extreme events are generated by moisture that has another origin (all those that show negative values in Table 2 and Tables S1—S5), or to the fact that during winter the region is affected by the transition of synoptic systems that enhance the amount of precipitation during longer periods that during summer when the convective and shorter event are more common [45,46].
This study aims to analyse the contribution from the Mediterranean Sea. Therefore, we computed the number of extreme precipitation events (in percentage) that had a higher support from Mediterranean moisture than from the climatological contribution. The highest contribution related to extreme events with durations of 1 day, when the major part of the events, at least, duplicated the support from the Mediterranean (8 of these events received a percentage contribution of more than 600%). The Mediterranean moisture contribution decreased progressively for longer precipitation events, but it generally reached above 50%.
To determine the existence of a significant relationship between the precipitation anomalies of ranked extreme events for all durations and Mediterranean moisture supply anomalies, a simple linear regression analysis and a Student’s t-test (with a 90% confidence level) were conducted. The results showed that extreme precipitation events with longer durations were more influenced by the Mediterranean anomalous moisture supply than those with shorter lengths, showing higher R2 values. The significance was greater for extreme precipitation events with lengths of 7-days on an annual and season scale (at more than 90%), with the highest influence from extreme precipitation by the Mediterranean moisture supply occurring in spring (89%) followed by summer (65%). During both seasons, extreme precipitation events with longer durations in the Danube River Basin were usually related to high precipitation quantities that accumulated over a few days in the Danube River Basin location [47]. Our results provide evidence that these events were related to a high anomalous support of moisture from the Mediterranean Sea, and that events were more intense when this contribution was greater. This same effect occurred for shorter length events of 1-day and 3-days on an annual scale, but the effect differed seasonally. For events with lengths of 1-day, the relationship was significant during spring and summer, and for durations of 3-days, the relationship was significant in spring and autumn. However, extreme precipitation events lasting 5 days showed no significant relationship on any scale. Although the results obtained at a 1- or 3-days are significant for a pair of season, they could improve if a subdivision of the Mediterranean could be performed, since it is known that the central part of the basin has a great influence on local convective rainfall, e.g., References [24,48].
The low R2 values or the lack of significance in the remaining cases indicate that the moisture contribution from the Mediterranean Sea is not the key to modulate, or to produce, the extreme precipitations. The Danube River Basin has another source of moisture (see Introduction and Ciric et al. [4]) that could contribute with higher amounts of moisture than that from the whole Mediterranean Sea; and even having a higher support of moisture from the Mediterranean it is needed some dynamical factor to start the convection to produce rainfall and to maintain the instability [49].
It is important to note that the integration times used to compute moisture from the Mediterranean Sea from FLEXPART outputs were conducted during different periods (1, 3, 5, 7, and 10 days), showing that for extreme precipitation the common 10 days (the mean life time for the water vapour in the atmosphere [35]), which have been used in several studies (e.g., References [4,9,22,23,24,25,30]), does not provide the best results, and it is preferable to use the same time period for which the extreme event has been calculated. Only during 1-day length events in summer, and for those lasting 7-days in all seasons, does moisture from the Mediterranean reach significant values for 1 to 10 days of the trajectories.
It is also of note that extreme events with temporal scales of 1 and 7 days correspond with typical synoptic rainfall occurring in the region. The shorter duration of 1 day is a typical duration for precipitation in the Danube River Basin and is related to slow-spreading convective systems [50] that produce extreme rainfall throughout the entire year. However, the main cause of the formation of longer-length extreme precipitation events (7 days) is a slow-evolving synoptic environment, which is typical of extratropical cyclone transitions and the effects of orographic barriers [51,52] that are associated with advection of warm and moist air from the Mediterranean Sea to the surrounding continental areas (includes the Danube River Basin) and are caused by the formation of marine low-level jets at specific locations in the presence of specific synoptic-scale circulation conditions that produce extreme precipitation [53]. The results of our study also show that the methodology applied capture the typical synoptic conditions in the northern Mediterranean Basin, and our methodology could therefore be applied to other areas of interest to provide an enhanced analysis of individual extreme precipitation events.
Supplementary Materials
The following are available online at https://www.mdpi.com/2073-4441/10/9/1182/s1. Table S1: As Table 2 but for all 100 events, Table S2: As Table 2 but for all events of 3-days duration, Table S3: As Table 2 but for all events of 5-days duration; Table S4: As Table 2 but for all events of 7-days duration, Table S5: As Table 2 but for all events of 10-days duration. Figure S1: PFLEX-% on a seasonal scale for 1-day events duration, Figure S2: PFLEX-% on a seasonal scale for 3-days events duration, Figure S3: PFLEX-% on a seasonal scale for 5-days events duration, Figure S4: PFLEX-% on a seasonal scale for 7-days events duration, Figure S5: PFLEX-% on a seasonal scale for 10-days events duration.
Author Contributions
D.C., R.N., and L.G. conceived and designed the experiments. D.C. performed the experiments. A.M.R. done the precipitation ranking. A.D. reviewed the computations. D.C., R.N. and L.G. analysed the data. R.N. and D.C. wrote the paper.
Funding
This research received no external funding.
Acknowledgments
Danica Ciric is supported by the European Commission under the Erasmus Mundus Project Green-Tech-WB: Smart and Green Technologies for Innovative and Sustainable Societies in the Western Balkans (551984-EM-1-2014-1-ES-ERA Mundus-EMA2). This research was partially supported by Xunta de Galicia under project ED413C 2017/64 “Programa de Consolidacion e Estructuracion de Unidades de Investigacion Competitivas (Grupos de ReferenciaCompetitiva)” co-funded by the European Regional Development Fund (FEDER). Also we want to thanks for support to IMDROFLOOD financed by the Water Works 2014 co-funded call of the European Commission. A.M. Ramos was supported through a postdoctoral grant (SFRH/BPD/84328/2012) from the Fundação para a Ciência e a Tecnologia (FCT, Portuguese Science Foundation).
Conflicts of Interest
The authors declare no conflict of interest. The founding sponsors had no role in the design of the study, in the collection, analyses, or interpretation of data, in the writing of the manuscript, and in the decision to publish the results.
Abbreviations
The following abbreviations are used in this manuscript
| ∑CHIRPS | Daily mean precipitation value from CHIRPS precipitation dataset |
| Anom. CHIRPS | Daily precipitation anomaly value from CHIRPS precipitation dataset |
| CHIRPS | Climate Hazards Group Infra-Red Precipitation with Station data dataset |
| Clim. CHIRPS | Daily climatological precipitation value from CHIRPS precipitation dataset |
| ECMWF | European Centre for Medium-Range Weather Forecast |
| ERA | European Centre for Medium-Range Weather Forecasting Re-Analysis |
| FLEXPART | FLEXiblePARTicle dispersion model |
| HydroSHEDS | Hydrological data and maps based on Shuttle elevation derivatives at multiple scales |
| PFLEX | Available moisture from the Mediterranean Sea (E − P < 0 values) obtained via Lagrangian experiment |
| PFLEX-% | The percentage of the Mediterranean contribution for each event calculated by FLEXPART |
| PFLEX-ANOM | Daily anomalous (E − P) < 0 value obtained via Lagrangian experiment |
| PFLEX-CLI | Daily climatological (E − P) < 0 value obtained via Lagrangian experiment |
| PFLEX-EVENT | (E − P) < 0 mean values from the Mediterranean Sea into the Danube River Basin the day/days of extreme precipitation event obtained via Lagrangian experiment |
References
- Dankers, R.; Hiederer, R. Extreme Temperatures and Precipitation in Europe: Analysis of a High-Resolution Climate Change Scenario; JRC Scientific and Technical Reports; European Communities: Luxemburg, 2008; Available online: http://citeseerx.ist.psu.edu/viewdoc/download?doi=10.1.1.397.1054&rep=rep1&type=pdf (accessed on 25 July 2018).
- Christensen, J.H.; Christensen, O.B. Severe summertime flooding in Europe. Nature 2003, 421, 805–806. [Google Scholar] [CrossRef] [PubMed]
- Christensen, O.B.; Christensen, J.H. Intensification of extreme European summer precipitation in a warmer climate. Glob. Planet. Chang. 2004, 44, 107–117. [Google Scholar] [CrossRef]
- Ciric, D.; Stojanovic, M.; Drumond, A.; Nieto, R.; Gimeno, L. Tracking the Origin of Moisture over the Danube River Basin Using a Lagrangian Approach. Atmosphere 2016, 7, 162. [Google Scholar] [CrossRef]
- Pekárová, P.; Miklánek, P.; Melo, M.; Halmová, D.; Pekár, J.; Mitková, V. Flood Marks along the Danube River between Passau and Bratislava; VEDA: Bratislava, Slovakia, 2014; Available online: http://147.213.100.3:81/danubeflood/PDF/kniha9VEDA%20small.pdf (accessed on 24 July 2018).
- Brilly, M. Hydrological Processes of the Danube River Basin; Springer: New York, NY, USA, 2010. [Google Scholar]
- Loczy, D. Geomorphological Impacts of Extreme Weather: Case Studies from Central and Eastern Europe; Springer Science & Business Media: New York, NY, USA, 2013; pp. 141–146. ISBN 978-94-007-6300-5. [Google Scholar]
- Ionita, M.; Scholz, P.; Chelcea, S. Spatio-temporal variability of dryness/wetness in the Danube River Basin. Hydrol. Process. 2015, 29, 4483–4497. [Google Scholar] [CrossRef]
- Stojanovic, M.; Drumond, A.; Nieto, R.; Gimeno, L. Moisture Transport Anomalies over the Danube River Basin during Two Drought Events: A Lagrangian Analysis. Atmosphere 2017, 8, 193. [Google Scholar] [CrossRef]
- Dosio, A. Climate Change Projections for the Danube River Basin; European Comission, Join Research Centre (JRC): Vienna, Austria, 2014; Available online: http://drdsi.jrc.ec.europa.eu/data/userstories/ReqNo_JRC92778_reqno_jrc92778_climate_change_projections_for_the_danube_area_final.pdf (accessed on 3 June 2018).
- Olcina, J.; Pérez Morales, A.; Gil Guirado, S.; López, F.; Rico Amorós, A.M. The significance of vulnerability and exposure in increased flood risk on the mediterranean coast. In Consorseguros Revista Digital; Consorcio de Compensación de Seguros (CCS): Madrid, Spain, 2017; Available online: http://www.consorsegurosdigital.com/almacen/pdf/the-significance-of-vulnerability-and-exposure-in-increased-flood-risk-on-the-mediterranean-coast.pdf (accessed on 4 June 2018).
- Schmidli, J.; Frei, C. Trends of Heavy Precipitation and Wet and Dr y Spells in Switzerland during the 20th Centry. Int. J. Climatol. 2005, 25, 753–771. [Google Scholar] [CrossRef]
- Mikhailova, M. Recent Extreme Floods and Their Transformation along the Danube River. J. Environ. Res. Eng. Manag. 2017, 73, 20–32. [Google Scholar] [CrossRef]
- Petrow, T.; Thieken, A.H.; Kreibich, H.; Bahlburg, C.H.; Merz, B. Improvements on Flood Alleviation in Germany: Lessons Learned from the Elbe Flood in August 2002. Environ. Manag. 2006, 38, 717–732. [Google Scholar] [CrossRef] [PubMed]
- Vasiliev, O.F.; van Gelder, P.H.A.J.M.; Plate, E.J.; Bolgov, M.V. Extreme Hydrological Events: New Concepts for Security; Springer: Berlin, Germany, 2007; pp. 418–420. ISBN 1-4020-5741-5. [Google Scholar]
- Giorgi, F. Climate change hot-spots. Geophys. Res. Lett. 2006, 33, L08707. [Google Scholar] [CrossRef]
- Hlačova, K.; Lapin, M.; Valent, P.; Szolgay, J.; Kohnova, S.; Rončak, P. Estimation of the impact of climate change-induced extreme precipitation events on floods. Contrib. Geophys. Geod. 2015, 45, 173–192. [Google Scholar] [CrossRef] [Green Version]
- Forestieri, A.; Arnone, E.; Blenkinsop, S.; Candela, A.; Fowler, H.; Noto, L.V. The impact of climate change on extreme precipitation in Sicily, Italy. Hydrol. Process. 2018, 32, 332–348. [Google Scholar] [CrossRef] [Green Version]
- Łupikasza, E.B.; Hanselb, S.; Matschullat, J. Regional and seasonal variability of extreme precipitationtrends in southern Poland and central-eastern Germany 1951–2006. Int. J. Clim. 2011, 31, 2249–2271. [Google Scholar] [CrossRef]
- Scherrer, S.C.; Fischer, E.M.; Posselt, R.; Liniger, M.A.; Croci-Maspoli, M.; Knutti, R. Emerging trends in heavy precipitation and hot temperature extremes in Switzerland. J. Geophys. Res. Atmos. 2016, 121. [Google Scholar] [CrossRef]
- Bocheva, L.; Marinova, T.; Simeonov, P.; Gospodinov, I. Variability and trends of extreme precipitation events over Bulgaria (1961–2005). Atmos. Res. 2009, 93, 490–497. [Google Scholar] [CrossRef]
- Ciric, D.; Nieto, R.; Ramos, A.M.; Drumond, A.; Gimeno, L. Wet Spells and Associated Moisture Sources Anomalies across Danube River Basin. Water 2017, 9, 615. [Google Scholar] [CrossRef]
- Drumond, A.; Nieto, R.; Hernández, E.; Gimeno, L. A Lagrangian analysis of the variation in moisture sources related to drier and wetter conditions in regions around the Mediterranean basin. Nat. Hazards Earth Syst. Sci. 2011, 11, 2307–2320. [Google Scholar] [CrossRef] [Green Version]
- Gómez-Hernández, M.; Drumond, A.; Gimeno, L.; Garcia-Herrera, R. Variability of moisture sources in the Mediterranean region during the period 1980–2000. Water Resour. Res. 2013, 49, 6781–6794. [Google Scholar] [CrossRef] [Green Version]
- Sodemann, H.; Zubler, E. Seasonal and inter-annual variability of the moisture sources for Alpine precipitation during 1995–2002. Int. J. Clim. 2010, 30, 947–961. [Google Scholar] [CrossRef]
- Gimeno, L.; Drumond, A.; Nieto, R.; Trigo, R.M.; Stohl, A. On the origin of continental precipitation. Geophys. Res. Lett. 2010, 37, L13804. [Google Scholar] [CrossRef]
- Funk, C.; Peterson, P.; Landsfeld, M.; Pedreros, D.; Verdin, J.; Shukla, S.; Husak, G.; Rowland, J.; Harrison, L.; Hoell, A.; et al. The climate hazards infrared precipitation with stations—A new environmental record for monitoring extremes. Sci. Data 2015, 2, 150066. [Google Scholar] [CrossRef] [PubMed]
- Stohl, A.; James, P. A Lagrangian analysis of the atmospheric branch of the global water cycle. Part I: Method description, validation, and demonstration for the August 2002 flooding in central Europe. J. Hydrometeorol. 2004, 5, 656–678. [Google Scholar] [CrossRef]
- Stohl, A.; James, P. A Lagrangian analysis of the atmospheric branch of the global water cycle: Part II: Moisture transports between Earth’s ocean basins and river catchments. J. Hydrometeorol. 2005, 6, 961–984. [Google Scholar] [CrossRef]
- Dee, D.P.; Uppala, S.M.; Simmons, A.J.; Berrisford, P.; Poli, P.; Kobayashi, S.; Andrae, U.; Balmaseda, M.A.; Balsamo, G.; Bauer, P.; et al. The ERA-Interim reanalysis: Configuration and performance of the data assimilation system. Q. J. R. Meteorol. Soc. 2011, 137, 553–597. [Google Scholar] [CrossRef]
- Ramos, A.M.; Trigo, R.M.; Liberato, M.L.R. A ranking of high-resolution daily precipitation extreme events for the Iberian Peninsula. Atmos. Sci. Lett. 2014, 15, 328–334. [Google Scholar] [CrossRef]
- Ramos, A.M.; Trigo, R.M.; Liberato, M.L.R. Ranking of multi-day extreme precipitation events over the Iberian Peninsula. Int. J. Clim. 2017, 37, 607–620. [Google Scholar] [CrossRef]
- Gittu, S. A study on Atmospheric Dispersion Using the Transport Model FLEXPART. University of Oslo, Department of Geosciences—Meteorology and Oceanography Section, 2011. Available online: https://www.duo.uio.no/bitstream/handle/10852/12594/guttu-master.pdf?sequence=1 (accessed on 21 August 2018).
- An, X.; Yao, B.; Li, Y.; Li, N.; Zhou, L. Tracking source area of Shangdianzi station using Lagrangian particle dispersion model of FLEXPART. Met. Apps 2014, 21, 466–473. [Google Scholar] [CrossRef]
- Numaguti, A. Origin and recycling processes of precipitating water over the Eurasian continent: Experiments using an atmospheric general circulation model. J. Geophys. Res. Atmos. 1999, 104, 1957–1972. [Google Scholar] [CrossRef] [Green Version]
- Stohl, A.; Forster, C.; Frank, A.; Seibert, P.; Wotawa, G. Technical note: The Lagrangian particle dispersion model FLEXPART version 6.2. Atmos. Chem. Phys. 2005, 5, 2461–2474. [Google Scholar] [CrossRef]
- Nieto, R.; Gimeno, L.; Drumond, A.; Hernandez, E. A Lagrangian identification of the main moisture sources and sinks affecting the Mediterranean area. WSEAS Trans. Environ. Dev. 2010, 5, 365–374. [Google Scholar]
- Salah, Z.; Nieto, R.; Drumond, A.; Gimeno, L.; Vicente-Serrano, S.M. A Lagrangian analysis of the moisture budget over the Fertile Crescent during two intense drought episodes. J. Hydrol. 2018, 560, 382–395. [Google Scholar] [CrossRef]
- Gimeno, L.; Nieto, R.; Trigo, R.M.; Vicente-Serrano, S.M.; Lopez-Moreno, J.I. Where Does the Iberian Peninsula Moisture Come from? An Answer Based on a Lagrangian Approach. J. Hydrometeorol. 2010, 11, 421–436. [Google Scholar] [CrossRef]
- Nieto, R.; Gimeno, L.; Gallego, D.; Trigo, R.M. Contributions to the moisture budget of airmasses over Iceland. Meteorol. Z. 2007, 16, 037–044. [Google Scholar] [CrossRef]
- Vázquez, M.; Nieto, R.; Drumond, A.; Gimeno, L. Extreme Sea Ice Loss over the Arctic: An Analysis Based on Anomalous Moisture Transport. Atmosphere 2017, 8, 32. [Google Scholar] [CrossRef]
- Gimeno, L.; Stohl, A.; Trigo, R.M.; Domínguez, F.; Yoshimura, K.; Yu, L.; Drumond, A.; Durán-Quesada, A.M.; Nieto, R. Oceanic and Terrestrial Sources of Continental Precipitation. Rev. Geophys. 2012, 50, RG4003. [Google Scholar] [CrossRef]
- Ivatek-Šahdan, S.; Stanešić, A.; Tudor, M.; Odak Plenković, I.; Janeković, I. Impact of SST on heavy rainfall events on eastern Adriatic during SOP1 of HyMeX. Atmos. Res. 2010, 200, 36–59. [Google Scholar] [CrossRef]
- Cavicchia, L.; Scoccimarro, E.; Gualdi, S.; Marson, P.; Ahrens, B.; Berthou, S.; Dubois, C. Mediterranean extreme precipitation: A multi-model assessment. Clim. Dyn. 2016, 1–13. [Google Scholar] [CrossRef]
- Toreti, A.; Xoplaki, E.; Maraun, D.; Kuglitsch, F.G.; Wanner, H.; Luterbacher, J. Characterisation of extreme winter precipitation in the Mediterranean and associated anomalous atmospheric circulation patterns. Nat. Hazard Earth Syst. 2010, 10, 1037–1050. [Google Scholar] [CrossRef] [Green Version]
- Schaller, N.; Otto, F.E.L.; van Oldenborgh, G.J.; Massey, N.R.; Sparrow, S.; Allan, M.R. The heavy precipitation event of May-June 2013 in the upper Danube and Elbe basins. Bull. Am. Meteorol. Soc. 2014, 95, S69–S72. Available online: https://pdfs.semanticscholar.org/b7f3/90dab80a8363a3ef415e601df5a63800b6ac.pdf (accessed on 21 August 2018).
- Thévenot, O.; Bouin, M.-N.; Ducrocq, V.; Lebeaupin Brossier, C.; Nuissier, O.; Pianezze, J.; Duffourg, F. Influence of the sea state on Mediterranean heavy precipitation: A case-study from HyMeX SOP1. Q. J. R. Meteorol. Soc. 2014, 142, 377–389. [Google Scholar] [CrossRef]
- Schicker, I.; Radanovics, S.; Seibert, P. Origin and transport of Mediterranean moisture and air. Atmos. Chem. Phys. 2010, 10, 5089–5105. [Google Scholar] [CrossRef]
- Toreti, A.; Giannakaki, P.; Martius, O. Precipitation extremes in the Mediterranean region and associated upper-level synoptic-scale flow structures. Clim. Dyn. 2016, 47, 1925–1947. [Google Scholar] [CrossRef] [Green Version]
- Romanescu, G.; Stoleriu, C.C. Exceptional floods in the Prut basin, Romania, in the context of heavy rains in the summer of 2010. Nat. Hazards Earth Syst. Sci. 2017, 17, 381–396. [Google Scholar] [CrossRef] [Green Version]
- Ricard, D.; Ducrocq, V.; Auger, L. A climatology of mesoscale environment associated with Mediterranean heavy precipitating events over a Northwestern Mediterranean area. J. Appl. Meteorol. Clim. 2012, 51, 468–488. [Google Scholar] [CrossRef]
- Mariani, L.; Prisi, S.G. Extreme Rainfalls in the Mediterranean Area. In Storminess and Environmental Change: Climate Forcing and Responses in the Mediterranean Region; Diodato, N., Bellocchi, G., Eds.; Springer: New York, NY, USA, 2014; pp. 17–39. ISBN 978-94-007-7947-1. [Google Scholar]
- Pfahl, S. Characterising the relationship between weather extremes in Europe and synoptic circulation features. Nat. Hazards Earth Syst. Sci. 2014, 14, 1461–1475. [Google Scholar] [CrossRef] [Green Version]
Figure 1.
Map of Danube River Basin (black line) and Mediterranean Sea (blue line) as provided by the HydroSHEDS project (hydrological data and maps on shuttle elevation derivatives at multiple scale available online at https://hydrosheds.cr.usygs.gov).
Figure 1.
Map of Danube River Basin (black line) and Mediterranean Sea (blue line) as provided by the HydroSHEDS project (hydrological data and maps on shuttle elevation derivatives at multiple scale available online at https://hydrosheds.cr.usygs.gov).

Figure 2.
Percentage moisture supply from the Mediterranean Sea relating to each extreme event (PFLEX-%) on an annual scale for the 100 events analysed and all ranked durations: Blue bars represent number of events with 1-day duration; orange bars represent 3-days duration; red bars represent 5-days duration; green bars represent 7-days duration; and grey bars represent 10-days duration.

Figure 3.
Scatterplot for moisture supply anomalies from Mediterranean Sea (PFLEX-ANOM) (x-axe, mm/day) and precipitation anomalies from CHIRPS database (Anomalies CHIRPS, y-axe, mm/days) over the Danube River Basin for 100 ranked extreme precipitation events separated on seasonal scales (winter—blue circles; summer—red circles; spring—green circles; autumn—yellow circles). The filled circles represent events with positive PFLEX-ANOM values and empty circles represent negative values. The corresponding regression line and coefficient of determination (R2) are also shown for each season (blue, red, green, and yellow lines) and on an annual scale (dashed black line) for events with positive PFLEX-ANOM values.


Table 1.
List of 10 top extreme precipitation events out of 100 total ranked cases with different durations over the Danube River Basin. The complete list of 100 detected events for all wet-spell durations is shown in the Supplementary Material (Tables S1–S5).
Table 1.
List of 10 top extreme precipitation events out of 100 total ranked cases with different durations over the Danube River Basin. The complete list of 100 detected events for all wet-spell durations is shown in the Supplementary Material (Tables S1–S5).
| Position of the Ranking | 1 Day | 3 Days | 5 Days | 7 Days | 10 Days |
|---|---|---|---|---|---|
| 1 | 23 Sep 1996 | 24 Sep 1996 | 24 Sep 1996 | 1 Jan 1996 | 23 Aug 2005 |
| 2 | 28 Dec 2014 | 23 Sep 1996 | 25 Sep1996 | 15 Dec 1990 | 18 Dec 1990 |
| 3 | 6 Nov 1985 | 25 Sep 1996 | 26 Sep 1996 | 2 Jan 1996 | 24 Aug 2005 |
| 4 | 1 Mar 2008 | 11 Feb 1984 | 14 Dec 1990 | 14 Dec 1990 | 4 Jan 1996 |
| 5 | 18 Feb 1994 | 6 Nov 1985 | 23 Jan 1998 | 7 May 1987 | 15 Dec 1990 |
| 6 | 27 Nov 1983 | 8 Jan 2010 | 27 Sep 1996 | 27 Sep 1996 | 17 Dec 1990 |
| 7 | 6 May 1987 | 6 May 1987 | 23 Sep 1996 | 24 Sep 1996 | 16 Dec 1990 |
| 8 | 14 Mar 2013 | 10 Feb 1984 | 22 Jan 1998 | 16 Dec 1990 | 14 Dec 1990 |
| 9 | 2 Mar 2014 | 29 Oct 1990 | 30 Oct 1990 | 28 Sep 1996 | 22 Aug 2005 |
| 10 | 27 Mar 1993 | 31 Oct 1994 | 31 Oct 1990 | 25 Sep 1996 | 12 May 1991 |
Table 2.
List of the top 10 extreme precipitation events out of a total of 100 cases with different durations ranked for the Danube River Basin. The columns for each event show: The position of the ranking, the date of the event, the daily mean precipitation value (Mean ∑CHIRPS), daily climatological precipitation value (Clim. CHIRPS), daily precipitation Anomaly (Anom. CHIRPS), value of ranking index (R), mean E − P < 0 values from the Mediterranean Sea into the Danube River Basin for day/days of the extreme precipitation event (PFLEX-EVENT), daily climatological E − P < 0 value (PFLEX-CLI), daily anomaly of E − P < 0 values (PFLEX-ANOM), and percentage of Mediterranean contribution for each event calculated by FLEXPART (PFLEX-%). Units of calculations with CHIRPS and PFLEX are in mm/day; R has no units; and the last column is expressed in %. CHRIPS, Climate Hazards Group Infra-Red Precipitation with Station dataset; PFLEX, available moisture from the Mediterranean Sea (E − P < 0 values) obtained via Lagrangian experiment.
| Position of the Ranking | Date Event | Mean ∑CHIRPS | Clim. CHIRPS | Anom. CHIRPS | R | PFLEX-EVENT | PFLEX-CLI | PFLEX-ANOM | PFLEX-% |
|---|---|---|---|---|---|---|---|---|---|
| 1 day | |||||||||
| 1 | 23 Sep 1996 | 45.66 | 4.13 | 41.53 | 198.65 | 0.59 | 0.15 | 0.44 | 285.69 |
| 2 | 28 Dec 2014 | 17.76 | 3.45 | 14.31 | 168.81 | 0.82 | 0.14 | 0.68 | 457.93 |
| 3 | 6 Nov 1985 | 19.74 | 1.96 | 17.79 | 156.70 | 0.45 | 0.21 | 0.25 | 118.89 |
| 4 | 1 Mar 2008 | 13.09 | 2.42 | 10.68 | 155.58 | 0.20 | 0.18 | 0.02 | 11.87 |
| 5 | 18 Feb 1994 | 12.05 | 1.18 | 10.87 | 142.60 | 0.40 | 0.10 | 0.30 | 285.92 |
| 6 | 27 Nov 1983 | 16.94 | 1.57 | 15.38 | 140.42 | 0.76 | 0.16 | 0.60 | 383.90 |
| 7 | 6 May 1987 | 26.90 | 3.53 | 23.37 | 138.02 | 0.58 | 0.18 | 0.40 | 224.24 |
| 8 | 14 Mar 2013 | 14.18 | 1.17 | 13.01 | 137.91 | 1.21 | 0.07 | 1.14 | 1657.75 |
| 9 | 2 Mar 2014 | 9.67 | 2.07 | 7.60 | 136.17 | 0.08 | 0.14 | −0.06 | −41.29 |
| 10 | 27 Mar 1993 | 13.32 | 2.47 | 10.86 | 131.77 | 1.12 | 0.21 | 0.90 | 424.33 |
| 3 days | |||||||||
| 1 | 24 Sep 1996 | 19.61 | 2.59 | 17.02 | 249.95 | 1.37 | 0.57 | 0.80 | 140.94 |
| 2 | 23 Sep 1996 | 18.54 | 2.51 | 16.03 | 228.27 | 2.10 | 0.51 | 1.59 | 312.59 |
| 3 | 25 Sep 1996 | 16.90 | 2.49 | 14.41 | 224.59 | 0.70 | 0.59 | 0.11 | 18.07 |
| 4 | 11 Feb 1984 | 6.77 | 1.70 | 5.07 | 206.04 | 0.54 | 0.40 | 0.14 | 34.63 |
| 5 | 6 Nov 1985 | 9.50 | 2.03 | 7.46 | 204.39 | 1.12 | 0.54 | 0.58 | 107.29 |
| 6 | 8 Jan 2010 | 6.12 | 1.46 | 4.67 | 198.54 | 0.96 | 0.30 | 0.66 | 217.26 |
| 7 | 6 May 1987 | 13.52 | 3.08 | 10.44 | 198.36 | 2.05 | 0.53 | 1.52 | 284.32 |
| 8 | 10 Feb 1984 | 6.54 | 1.61 | 4.93 | 195.88 | 1.03 | 0.38 | 0.64 | 169.23 |
| 9 | 29 Oct 1990 | 11.82 | 2.03 | 9.79 | 195.15 | 1.07 | 0.35 | 0.71 | 202.75 |
| 10 | 31 Oct 1994 | 10.10 | 2.05 | 8.06 | 193.43 | 0.38 | 0.37 | 0.01 | 3.85 |
| 5 days | |||||||||
| 1 | 24 Sep 1996 | 19.61 | 2.59 | 17.02 | 254.85 | 1.92 | 0.74 | 1.18 | 160.01 |
| 2 | 25 Sep1996 | 18.54 | 2.51 | 16.03 | 254.22 | 1.62 | 0.77 | 0.85 | 110.97 |
| 3 | 26 Sep 1996 | 16.90 | 2.49 | 14.41 | 251.71 | 1.14 | 0.79 | 0.36 | 45.42 |
| 4 | 14 Dec 1990 | 6.77 | 1.70 | 5.07 | 237.58 | 1.40 | 0.43 | 0.96 | 222.56 |
| 5 | 23 Jan 1998 | 9.50 | 2.03 | 7.46 | 234.92 | 1.17 | 0.48 | 0.69 | 145.60 |
| 6 | 27 Sep 1996 | 6.12 | 1.46 | 4.67 | 231.42 | 0.60 | 0.79 | −0.20 | −24.68 |
| 7 | 23 Sep 1996 | 13.52 | 3.08 | 10.44 | 230.92 | 2.13 | 0.70 | 1.42 | 201.84 |
| 8 | 22 Jan 1998 | 6.54 | 1.61 | 4.93 | 227.95 | 1.57 | 0.46 | 1.11 | 243.75 |
| 9 | 30 Oct 1990 | 11.82 | 2.03 | 9.79 | 222.08 | 1.14 | 0.47 | 0.67 | 142.65 |
| 10 | 31 Oct 1990 | 10.10 | 2.05 | 8.06 | 221.67 | 1.13 | 0.47 | 0.65 | 138.03 |
| 7 days | |||||||||
| 1 | 1 Jan 1996 | 6.52 | 2.12 | 4.40 | 298.19 | 1.67 | 0.51 | 1.16 | 225.99 |
| 2 | 15 Dec 1990 | 6.41 | 1.67 | 4.74 | 290.71 | 1.41 | 0.51 | 0.89 | 173.84 |
| 3 | 2 Jan 1996 | 5.33 | 1.96 | 3.37 | 277.60 | 1.36 | 0.49 | 0.88 | 180.10 |
| 4 | 14 Dec 1990 | 5.84 | 1.64 | 4.21 | 273.79 | 1.55 | 0.51 | 1.04 | 205.09 |
| 5 | 7 May 1987 | 7.53 | 2.67 | 4.86 | 260.72 | 2.16 | 0.80 | 1.36 | 171.43 |
| 6 | 27 Sep 1996 | 9.15 | 2.32 | 6.83 | 260.69 | 1.24 | 0.89 | 0.35 | 38.74 |
| 7 | 24 Sep 1996 | 9.28 | 2.34 | 6.94 | 258.47 | 1.92 | 0.86 | 1.07 | 124.99 |
| 8 | 16 Dec 1990 | 5.47 | 1.62 | 3.86 | 257.33 | 1.26 | 0.53 | 0.73 | 138.16 |
| 9 | 28 Sep 1996 | 9.07 | 2.26 | 6.81 | 256.91 | 0.86 | 0.90 | −0.05 | −5.41 |
| 10 | 25 Sep 1996 | 9.08 | 2.31 | 6.77 | 256.87 | 1.76 | 0.86 | 0.89 | 102.92 |
| 10 days | |||||||||
| 1 | 23 Aug 2005 | 8.05 | 2.02 | 6.03 | 325.98 | 1.15 | 0.79 | 0.36 | 45.52 |
| 2 | 18 Dec 1990 | 4.82 | 1.76 | 3.06 | 317.66 | 1.22 | 0.56 | 0.66 | 116.23 |
| 3 | 24 Aug 2005 | 7.49 | 2.04 | 5.45 | 315.91 | 1.08 | 0.82 | 0.26 | 31.93 |
| 4 | 4 Jan 1996 | 4.68 | 1.90 | 2.78 | 313.98 | 1.28 | 0.51 | 0.76 | 147.99 |
| 5 | 15 Dec 1990 | 4.99 | 1.63 | 3.36 | 313.50 | 1.55 | 0.55 | 0.99 | 179.03 |
| 6 | 17 Dec 1990 | 4.68 | 1.72 | 2.97 | 301.29 | 1.33 | 0.56 | 0.77 | 136.24 |
| 7 | 16 Dec 1990 | 4.78 | 1.62 | 3.16 | 300.85 | 1.41 | 0.56 | 0.85 | 152.19 |
| 8 | 14 Dec 1990 | 4.69 | 1.66 | 3.03 | 298.32 | 1.64 | 0.55 | 1.09 | 195.89 |
| 9 | 22 Aug 2005 | 7.45 | 2.03 | 5.42 | 298.17 | 1.21 | 0.76 | 0.45 | 58.65 |
| 10 | 12 May 1991 | 6.03 | 2.67 | 3.36 | 290.89 | 1.44 | 0.95 | 0.49 | 51.64 |
Table 3.
Numbers of extreme events on annual and seasonal scales (within brackets) and percentages of extreme precipitation events with a higher Mediterranean Sea contribution than the mean annual and seasonal climatological value for all rainy length periods of 1, 3, 5, 7, and 10 days. Results are presented with respect to Mediterranean PFLEX anomalies into the Danube River Basin.
| Duration | 1 day | 3 days | 5 days | 7 days | 10 days |
|---|---|---|---|---|---|
| Annual | 86% (100) | 90% (100) | 84% (100) | 91% (100) | 93% (100) |
| Winter | 83.33% (36) | 85.71% (42) | 86.96% (46) | 97.44% (39) | 85.29% (43) |
| Spring | 90% (30) | 90.91% (22) | 100% (7) | 100% (11) | 100% (21) |
| Summer | 100% (9) | 90% (10) | 100% (9) | 100% (11) | 100% (15) |
| Autumn | 80% (25) | 96.15% (26) | 73.68% (38) | 79.49% (39) | 93.33% (30) |
Table 4.
Slope values of simple linear regression analysis between CHIRPS anomaly values of extreme precipitation for events with different durations (1, 3, 5, 7, and 10 days) with respect to PFLEX-ANOM values (for 1, 3, 5, 7, and 10 integrated days) on annual, winter, spring, summer, and autumn scales. Highlighted numbers represent those values that are significant at 90% when applying Student’s t-test, and the asterisk denotes 99% significance.
| Duration of Extreme Event | 1 Day | 3 Days | 5 Days | 7 Days | 10 Days | ||||||||||
|---|---|---|---|---|---|---|---|---|---|---|---|---|---|---|---|
| Period of integration used for PFLEX-ANOM values | 1 day | 3 days | 5 days | 7 days | 10 days | 3 days | 5 days | 7 days | 10 days | 5 days | 7 days | 10 days | 7 days | 10 days | 10 days |
| Annual | 3.34 * | 1.42 | 0.23 | 1.13 | −0.10 | 1.30 | 0.28 | 0.30 | 0.00 | 1.05 | 0.78 | 0.01 | 1.30 * | 0.09 * | 0.04 |
| Winter | 1.21 | −0.15 | −0.05 | −0.27 | −0.39 | −0.24 | −0.25 | −0.30 | −0.37 | 1.19 | 1.13 | 1.17 | 0.88 * | 1.07 * | 1.05 |
| Spring | 5.83 * | 4.77 * | 1.07 | 0.69 | −0.53 | 3.40 * | 1.72 | 0.10 | 0.83 | 1.22 | 1.29 | 1.29 | 1.77 * | 1.87 * | 1.01 * |
| Summer | 10.10 * | 6.14 | 6.83 | 7.90 * | 7.87 | 0.25 | 0.24 | 0.16 | 0.27 | −0.42 | −0.64 | −0.85 | 1.97 * | 2.07 * | 0.53 |
| Autumn | −0.25 | −3.18 | −3.27 | −0.31 | −0.87 | 2.38 | 1.04 | 1.48 | 1.53 | 2.15 | 1.36 | 0.86 | 1.51 * | 1.33 * | 0.81 |
© 2018 by the authors. Licensee MDPI, Basel, Switzerland. This article is an open access article distributed under the terms and conditions of the Creative Commons Attribution (CC BY) license (http://creativecommons.org/licenses/by/4.0/).
Share and Cite
MDPI and ACS Style
Ciric, D.; Nieto, R.; Ramos, A.M.; Drumond, A.; Gimeno, L. Contribution of Moisture from Mediterranean Sea to Extreme Precipitation Events over Danube River Basin. Water 2018, 10, 1182. https://doi.org/10.3390/w10091182
AMA Style
Ciric D, Nieto R, Ramos AM, Drumond A, Gimeno L. Contribution of Moisture from Mediterranean Sea to Extreme Precipitation Events over Danube River Basin. Water. 2018; 10(9):1182. https://doi.org/10.3390/w10091182
Chicago/Turabian StyleCiric, Danica, Raquel Nieto, Alexandre M. Ramos, Anita Drumond, and Luis Gimeno. 2018. "Contribution of Moisture from Mediterranean Sea to Extreme Precipitation Events over Danube River Basin" Water 10, no. 9: 1182. https://doi.org/10.3390/w10091182
Note that from the first issue of 2016, this journal uses article numbers instead of page numbers. See further details here.