A Method for Detecting Abrupt Change of Sediment Discharge in the Loess Plateau, China


College of Hydrology and Water Resources, Hohai University, Nanjing 210098, China
*
Author to whom correspondence should be addressed.
Water 2018, 10(9), 1183; https://doi.org/10.3390/w10091183
Submission received: 12 August 2018
/
Revised: 30 August 2018
/
Accepted: 1 September 2018
/
Published: 4 September 2018
(This article belongs to the Section Hydrology)
Abstract
:In recent decades, the streamflow and sediment of the Yellow River has decreased sharply, especially the sediment discharge. The factors that lead to this phenomenon have become a widely concerned problem of the whole society. The analysis of abrupt change points of hydrological series is the key to divide datum period, so it is an important work in the research of streamflow and sediment reduction cause. So far, many methods have been proposed to detect abrupt change. However, most methods have great uncertainty due to the deficiencies of irrational structure of test statistics, ideal hypothesis or subjectivity. In this paper, a new method called moving average difference method for abrupt change points detection is proposed. It is proved to be effective through comparison with four commonly used methods via both synthetic series and real data case study. The results show that the proposed method has four distinct advantages: (1) The test statistic structure of the method has physical significance and is intuitive to understand; (2) It is more accurate in abrupt change detection; (3) It can detect all of the abrupt change points at one time; (4) It can detect the abrupt changes and calculate the corresponding mutation intensity simultaneously.
1. Introduction
The Catastrophe Theory can be traced back to the late 1960s. It was first proposed by French mathematician R. Thom [1], and was developed and improved rapidly in the following decade in both theory and practical application due to its practicability. Then, the Catastrophe Theory has been applied extensively in the fields of mathematics, biology, astronomy, meteorology, social sciences, etc. The Catastrophe Theory is based on ordinary differential equations. The essence of the theory is the singularity, and the main point of it is to examine the mutation of a system or a process from a stable state to another stable state [2]. Statistically speaking, abrupt change in hydro-climate can be defined as a significant change in a statistical characteristic, e.g., in the mean, variance or trend of a time series. Currently, in hydrology and meteorology, researches are mostly focus on the abrupt change of the mean of a series [3].
So far, many methods for abrupt change detection have been developed in the case of mean mutation [4,5,6,7], including the filter test method, moving t-test, the Cramer method, the Yamamot method and order cluster analysis [8,9]. In 1945, H.B. Mann and M.G. Kendall proposed a nonparametric test method [10]. Initially, it was only used to analyze the trend of time series. Later, Gerstengarbe and Werner [11] developed this method to the widely used Mann–Kendall test, which can analyze the trend of a series as well as detect the abrupt change points. The Pettitt method is a nonparametric test method firstly proposed and used by A.N. Pettitt [12] to test abrupt change points in 1979. The method is similar to Mann–Kendall test and is also extensively used in change point test for the time being [13]. In view of the characteristics of nonstationary time series, which make it even harder to detect the abrupt change, Bernaola-Galvan in Boston University proposed a heuristic segmentation algorithm (BG), and introduced it to probe the temporal organization and heterogeneities of human heart rate interval time series [14]. Feng [15] verified the validity of the algorithm through ideal time series, and applied BG algorithm to detect and analyze the mutation points in different scales of the tree annual ring width sequence in the northern hemisphere. Methods, such as moving t-test, Cramer method and Yamamot method, are often considered to have great uncertainty, because the division and length of subsequences in the algorithms are determined arbitrarily by people. Additionally, the random selection of subsequence length will cause the drift of detected change point. Although the other prevalent methods, such as ordered clustering analysis (OC), Mann–Kendall test [3,16], Pettitt and BG segmentation method, are not affected by human factors in calculation, the rationality of those methods’ statistical structure needs to be discussed [3,17]. Furthermore, most of prevalent methods for abrupt change analysis are based on an implicit hypothesis that the series has only one change point. However, either climate or hydrologic sequence is a multi-scale system, and the size and fluctuation (anomaly) has the characteristics of periodic changes. Therefore, these methods are difficult to find all change points on different scales and levels, which is contrary to the analysis of the inducers of abrupt change [18,19].
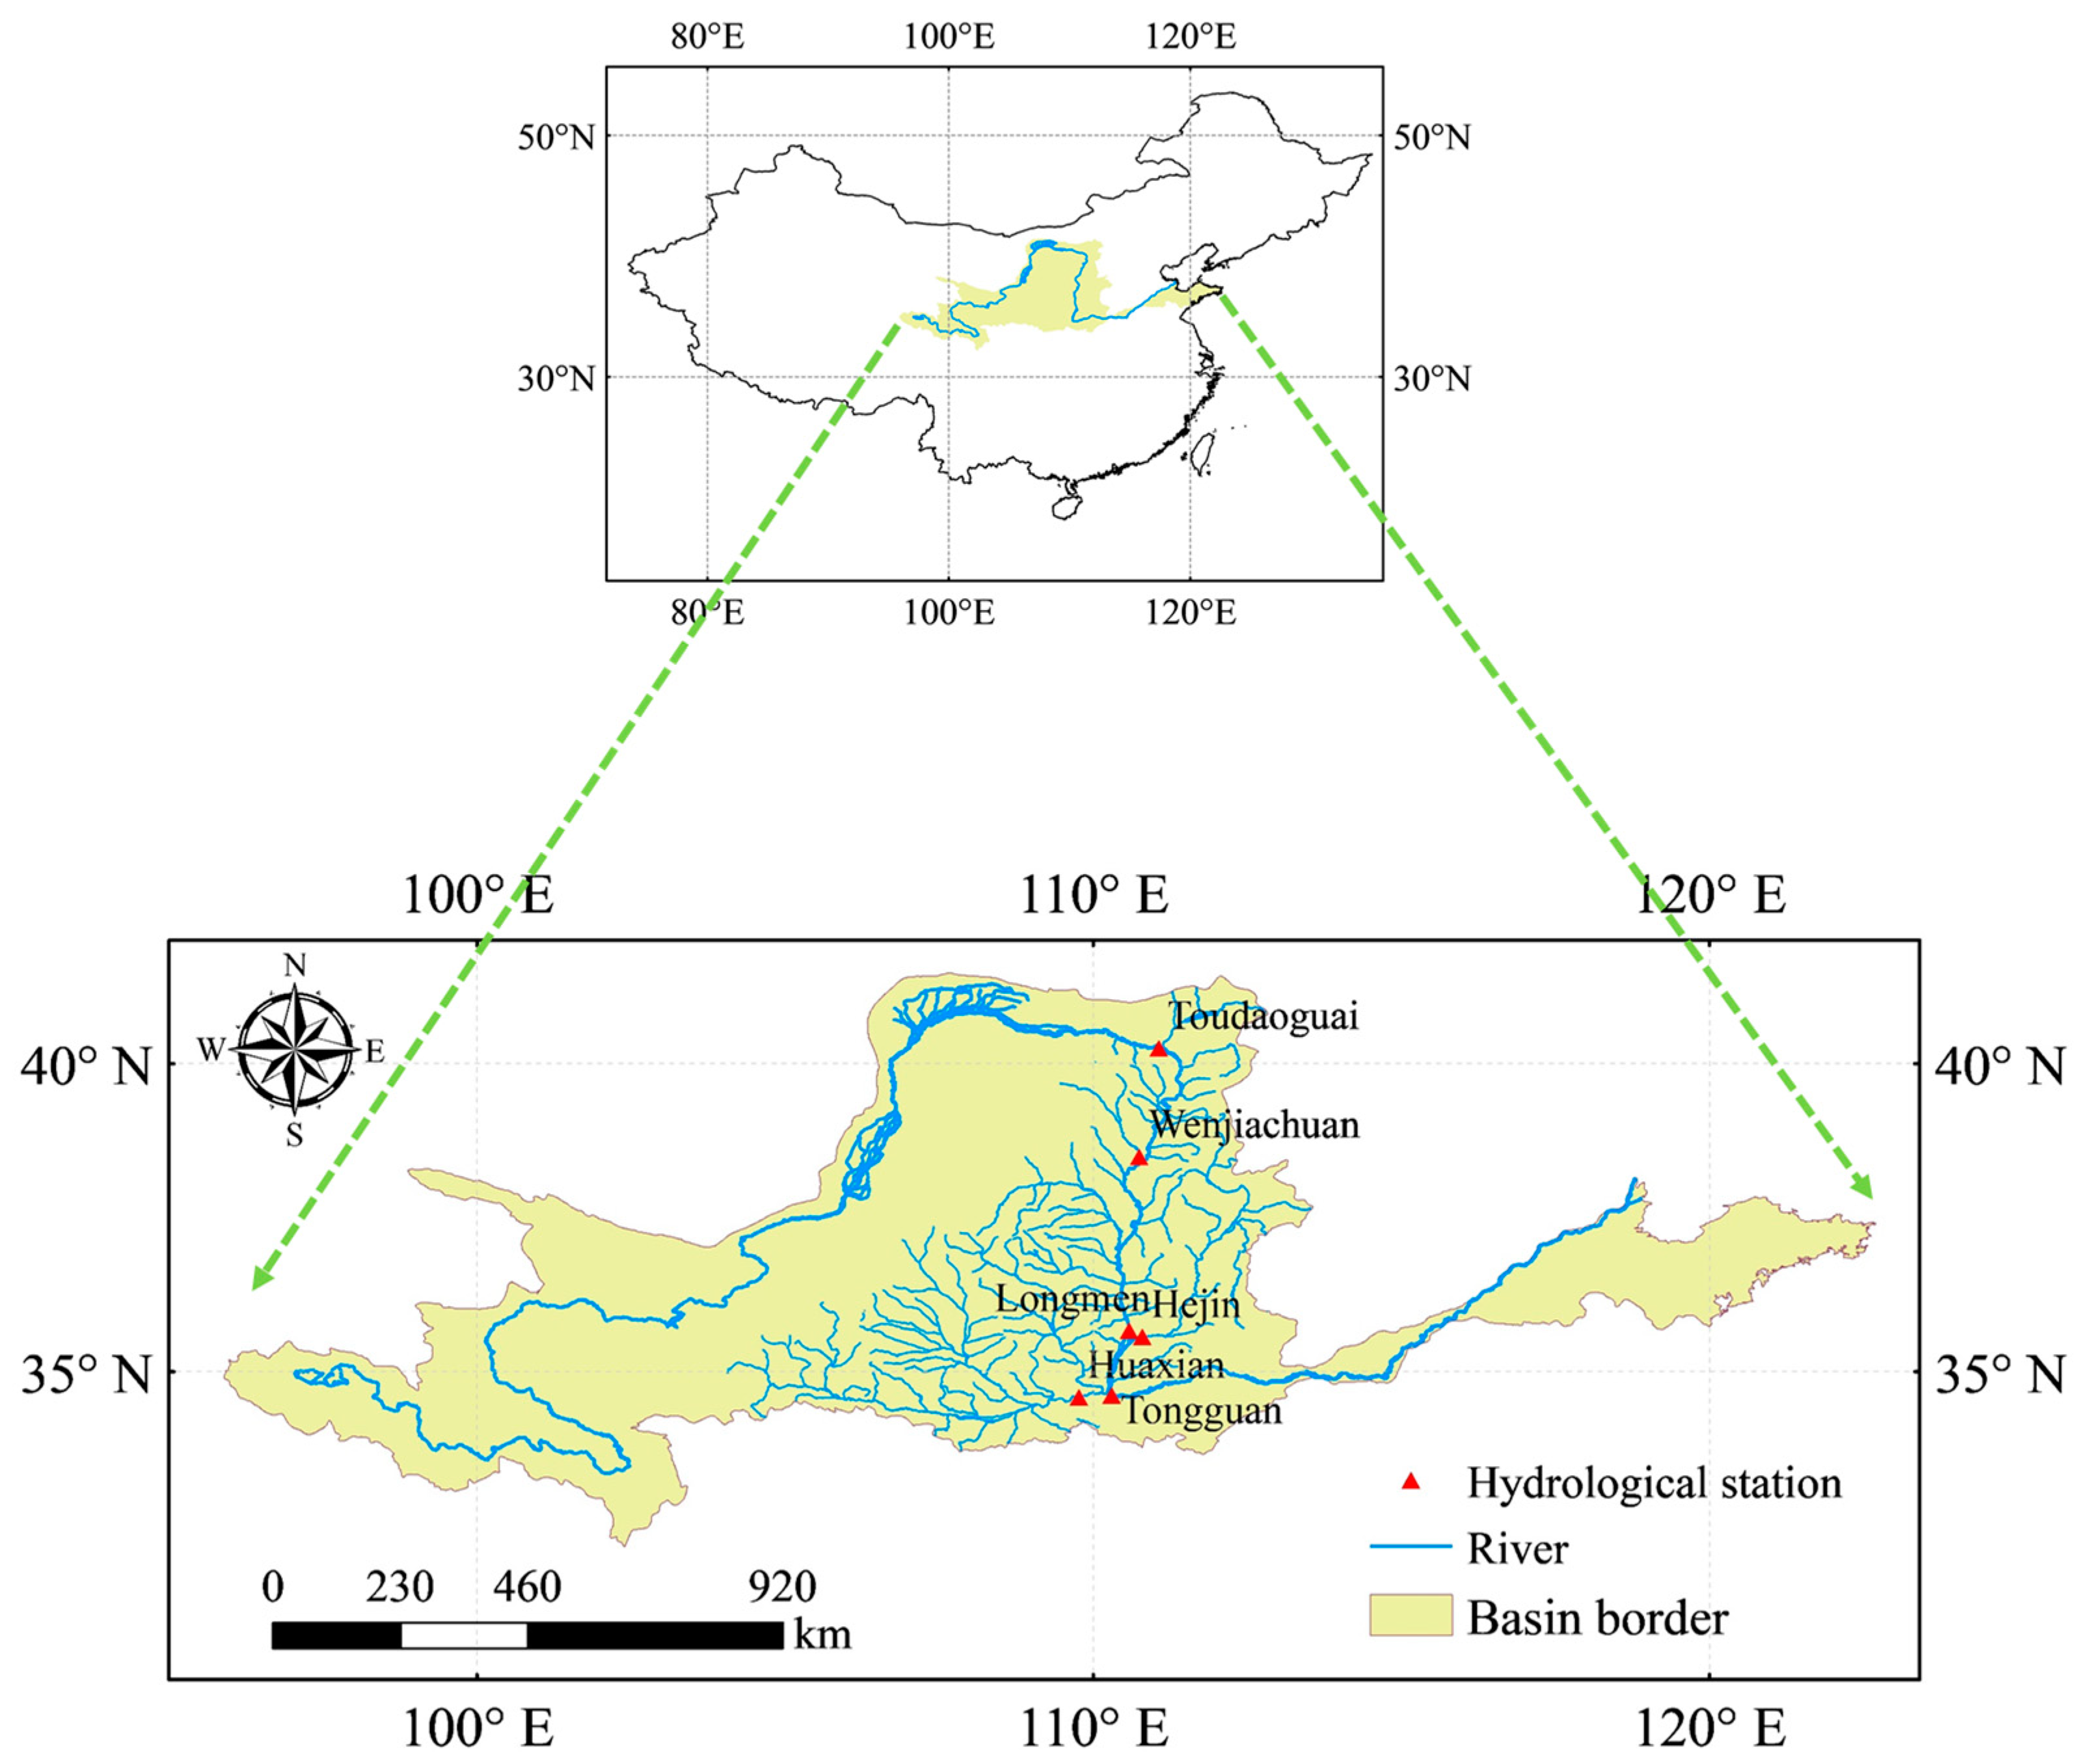
The Yellow River is the second largest river in China, with a total length of 5464 km. It is also well-known as the sandiest river in the world, because it runs across the Loess Plateau of North China, which is characterized by broken terrain, deep soil, heavy rain, sparse vegetation and serious soil erosion. The Loess Plateau contributes about 80% of the sediment of the Yellow River (Figure 1). The construction of landscape projects, terraces, dams and reservoirs from 1970s to 1990s, and comprehensive soil and water conservations since 1990s have made great changes in the erosion environment of the underlying surface of the Loess Plateau, which lead to a dramatic decrease in runoff and sediment in the Yellow River [20,21,22,23,24,25,26]. According to statistics, the annual sediment discharge of Tongguan gauging station is reduced from 1.6 billion tons to 260 million tons, and even reduced to less than 1 million tons by 2014. At the same time, the annual runoff of Tongguan gauging station decreased from 56 billion m3 to 44 billion m3. The sharp decrease of water and sediment in the Yellow River has aroused wide attention from government and all walks of life [27]. For a long time, many scholars and research institutes have carried out researches on this issue and have obtained many achievements [18,19,28,29,30,31,32,33,34,35]. The analysis of the abrupt points of water and sediment series is the key to divide the datum period of the water and sediment problem research, which is an important content of the research of water and sediment influence factors. However, the methods used to analyze and predict the change of water and sediment are limited and uncertain, and the data adopted are not uniform. The results obtained from the same data by different methods are not exactly the same.
For this problem, a new method for detecting abrupt change of time series was proposed in this paper. It was investigated via both synthetic and real-data cases. Furthermore, the advantages and effectiveness of the new method were validated through comparison with ordered clustering analysis (OC), Mann–Kendall test, Pettitt test and BG segmentation methods. Then, this method is applied to analyze the data of runoff and sediment discharge in the Loess Plateau of the Yellow River, and investigate the influence factors of the abrupt change of runoff and sediment.
2. Materials and Methods
2.1. Moving Average Difference Method Combined with Wavelet Analysis
The detection of time series abrupt change points is to calculate the detection statistics by observed sample sequence. The process is usually based on some certain statistical hypothesis, and would be affected by three factors. The first one refers to the random error, which generally displays a zero mean and constant variance distribution, including observation error of basic sample sequence, sample selection error and so on. The second factor refers to the variation of the periodicity of sample. The variation is driven by the physical properties of the time series, which is fluctuant around a constant. When one or more physical driving factors of the time variable mutate, leading to a significant change in the mean value of the periodicity, it is the abrupt change point to be detected in the time series. The third one is effects of multiple change points. It is difficult to accurately and effectively detect all the change points, when time series has continuous multiple mutations.
Considering the three factors talked above, we should minimize or counteracting the influence of observation errors and interannual periodicity variation on abrupt changes detecting. An effective approach to eliminate the influence of random error is average calculation, and the effective means to solve the second and third problems is to take the average periodicity as an investigation variable. Taking all the above into account, it is desirable to select the physical periodicity of time series as the moving average period. Therefore, the selection of the moving average period is crucial. If the period is too short, it cannot offset observation error and interannual fluctuation error, which will increase the uncertainty of the results. Conversely, if the period is too long, it can lead to the excessive smoothing of the sequence, which will submerge the catastrophe point. In this study, the physical periodicity of time series analyzed by Wavelet Analysis is selected as the befitting moving average period.
Wavelet analysis was proposed by Molet in the early 1980s [36]. It can reveal the variety of periodicity in time series and forecast the developing tendency of the system in different time scales. The wavelet analysis has been widely applied to characterize the frequency, intensity, time position and duration of the variations for hydro-climatic time series. The wavelet analysis is to approximate a signal or function with a series of wavelet function [37]. In this study, a Morlet wavelet function , with a mean value of zero and localized in time and frequency space is defined as:
where denotes the dimensionless frequency, and t is the non-dimensional time frequency. The continuous wavelet transform of a discrete sequence Xi is defined as the convolution of Xi with a scaled and translated version of :
where the represents the complex conjugate of , a is the wavelet scale, and b is the time index. is the time interval, which is one year in our study.
The wavelet variance is defined as:
The wavelet variance reflects the distribution of periodicity on the wavelet scale. The main time scale of a hydrological sequence, namely the primary periodicity, can be determined by the wavelet variance graph.
If the physical periodicity of time series is P, then the forward moving average sequence can be constructed as:
Similarly, the reverse moving average sequence can be described as:
MUi and MDi denote the two subsequences before and after the sample point Xi.
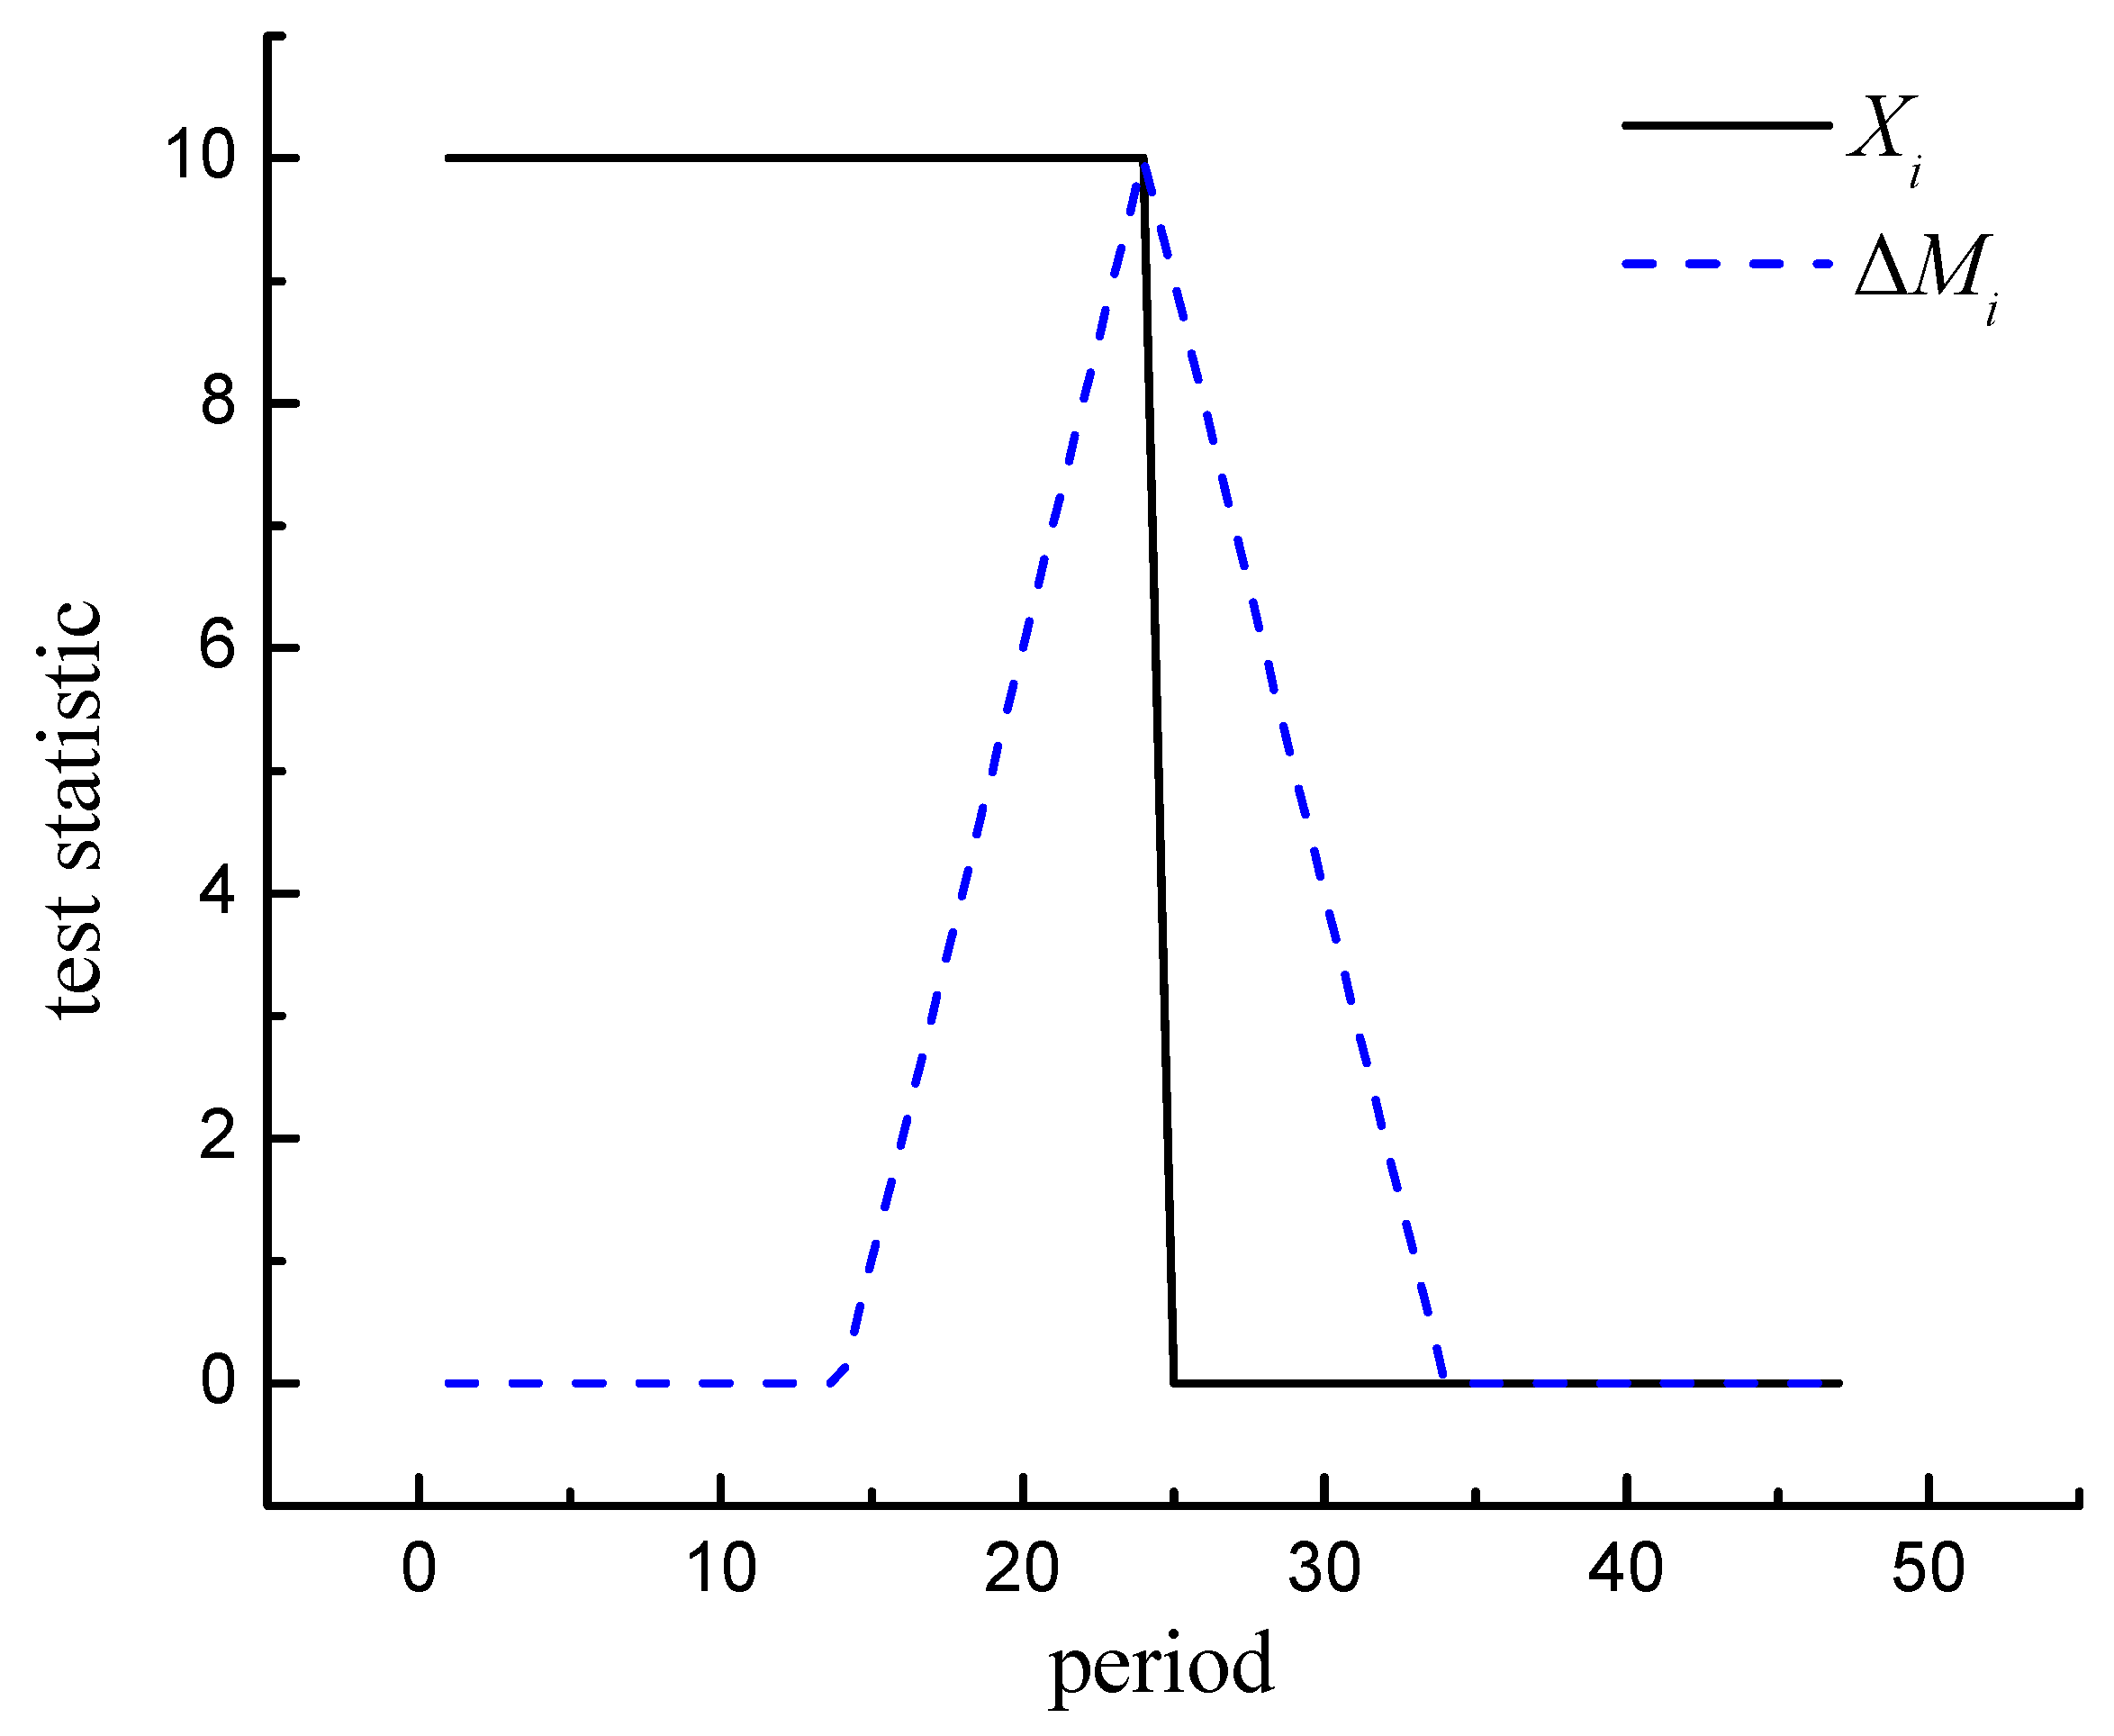
We can investigate the simplest ideal time series with one abrupt change point (without observation errors and the value before and after the mutation point is constant), for instance,
The forward and reverse moving average sequence of it is:
Thus, the moving average difference of MUi and MDi is:
Series (6) and (8) are drawn in Figure 2. It is found that the point of the maximum moving average difference is exactly the mutation point, which means that the difference between the mean value of the subsequences before and after the point reaches the maximum. Furthermore, the maximum difference is the mutation intensity of the change point. Therefore, the maximum points of statistics indicate an abrupt change in the mean value of the subsequence of the sample, that is, the maximum points may be points of abrupt change. Thus, we proposed the detection index of the moving average difference method:
and the intensity index of it is:
2.2. Other Methods Adopted in the Study
2.2.1. The Ordered Clustering Analysis (OC)
The ordered clustering analysis is a method to estimate the most likely abrupt point of hydrological time series by statistical analysis. The basic idea of this method is to find a point to divide the series to make the sum of deviation squared of the subsequences minimum, and the sum of deviation squared between subsequences maximum.
If the possible abrupt change point of the sample Xi is τ, the deviation squared sum before and after the mutation can be respectively described as
where and are the mean values of the two subsequences.
The total deviation squared sum of the time series is
When , τ is the optimal bipartition point, which is concluded as the most likely abrupt change point.
Generally, if there is only one abrupt change in the series, the series of total deviation squared sum presents single minimum. If there are two or more change points, then the time series change of total deviation squared sum has two or more local minima. In this way, we can detect change points according to local minima in the series of test statistic .
2.2.2. Mann–Kendall Test
In this study, the Mann–Kendall test procedure follows Gerstengarbe and Werner [11] who developed the method to test an assumption about the beginning of the development of trend within a sample Xi of the random variable X. The null hypothesis is formulated as follows: the sample under investigation shows no beginning of a developing trend, and a rank series Sk of the progressive and retrograde rows of this sample is constructed as:
where
The test statistic is defined as
where is given, and are respectively the mean and variance of the rank series Sk, which can be calculated by Formulae (17) and (18).
UFi is a statistic sequence calculated by time series . Arrange the time series Xi in reverse order, repeat the above calculation process and make
If the two sequences of UFi and UBi have intersection points and the points are within the significance level interval, the intersection points are significant abrupt change points.
2.2.3. Pettitt
This method is a non-parametric approach developed by Pettitt [12] to detect significant changes in the mean of a time series. The test uses a version of the Mann–Whitney statistic Ut,n, which is given by:
The test statistic counts the number of times a member of the first sample exceeds a member of the second sample. The null hypothesis of the Pettitt test is the absence of a change point. The test statistic KN and the associated probability (P) used in the test are given as:
t0 is concluded as a significant change point when .
2.2.4. Bernaola-Galvan Segmentation Method
The BG segmentation method is proposed by Bernaola-Galvan et al. [14] to detect abrupt changes in non-stationary time series. It regards the abrupt change detection problem of non-stationary time series as a segmentation procedure, that is, the non-stationary time series is composed of multiple subsequences with different mean values, and the purpose of this method is to find the position where the mean value difference between each subsequences reaches maximum. The test statistic SBG is defined as Formulae (24) and (25).
where and are respectively the mean values of the left and right subsequences of the segmentation point. and are the standard deviations of the left and right subsequences. and are the number of sample of the left and right subsequences.
Calculate the statistic for each sample point of the time series Xi successively. The larger the is, the greater the difference of mean values of the left and right subsequences. The following relationships are applied:
where is the degree of freedom, , , which can be simulated by Monte Carlo simulation. is incomplete β function.
A critical value of P0 is set. If , then the time series Xi can be divided into two subsequences with significant differences in the mean values at sample point ; otherwise, no segmentation is conducted.
Repeat the above algorithm for the two newly segmented subsequences. This is repeated until the subsequence is no longer separable.
2.3. Study Area and Data Set
The structure of the proposed moving average difference method is very intuitive and easy to understand. We have demonstrated the validity of the method in theoretical deduction. In order to investigate the rationality and accuracy of the method, three synthetic series were designed as the ideal validation model in which the value, periodicity and abrupt change points were specified. The three synthetic cases are single mutation point series without errors, multi-mutation points series without errors and multi-mutation points series with errors.
2.3.1. Synthetic Series
Single Mutation Point Series without Errors
First, we consider the simplest situation, single mutation point series without errors, which is constructed as Formula (6).
Multi-Mutation Points Series without Errors
The second synthetic series is designed with five abrupt change points, the values before and after each mutation point is constant without any error, which can be described as:
Multi-Mutation Points Series with Errors
The former two ideal cases are synthetic series consisting of constant subsequences without any error. In order to investigate the validity of the method in the case with error, we added random error to the second synthetic series to form the multi-mutation points series with errors, which is the third synthetic case we studied.
2.3.2. Real Cases
The Yellow River originates from the Qinghai–Tibetan Plateau in western China, flows eastward through the Loess Plateau and drains into the Bohai Sea, with a drainage area of 795,000 km2. The river can be divided into three segments according to the geographic feature and river characteristics: the upper, middle and lower reaches. The upper reaches extend from the river source to the Toudaoguai hydrological station in Togtoh County, Inner Mongolia. The middle reaches are located between Toudaoguai hydrological station and Taohuayu in Zhenzhou, and flows over 1206 km through the highly erodible Loess Plateau with an area of 34.46104 km2. The Loess Plateau, containing more than 30 tributaries with a catchment area larger than 1000 km2, contributes more than 80% of the sediment to the Yellow River.
A data set of annual sediment discharge from six key hydrological stations in the Loess Plateau (Toudaoguai, Longmen and Tongguan in the Yellow River mainstream, Wenjiachuan, Hejin and Huaxian in the primary tributary of the Yellow River) was selected in this study to verify the validity and advantages of the moving average difference method through comparison with the other four methods. The annual sediment discharge of the six stations were provided by the Yellow River Conservancy Commission (YRCC).
3. Results
The moving average difference method was compared with the ordered clustering analysis (OC), Mann–Kendall test, Pettitt and BG segmentation method via synthetic cases and real cases to examine its effectiveness and advantages.
3.1. Synthetic Case
3.1.1. Synthetic Case 1
The detecting results of the single mutation point series without errors by the five methods chosen for comparative study are shown in Table 2.
The results in Table 2 show that the moving average difference method, the OC method, Pettitt test and BG segmentation method all have detected the abrupt change points exactly. The detection statistic value of moving average difference method is precisely equal to the mutation intensity of the tested series, while the detection statistic values of the other three methods vary greatly. This illustrate that the moving average difference method has physical significance of mean value abrupt change, while other methods are only statistical.
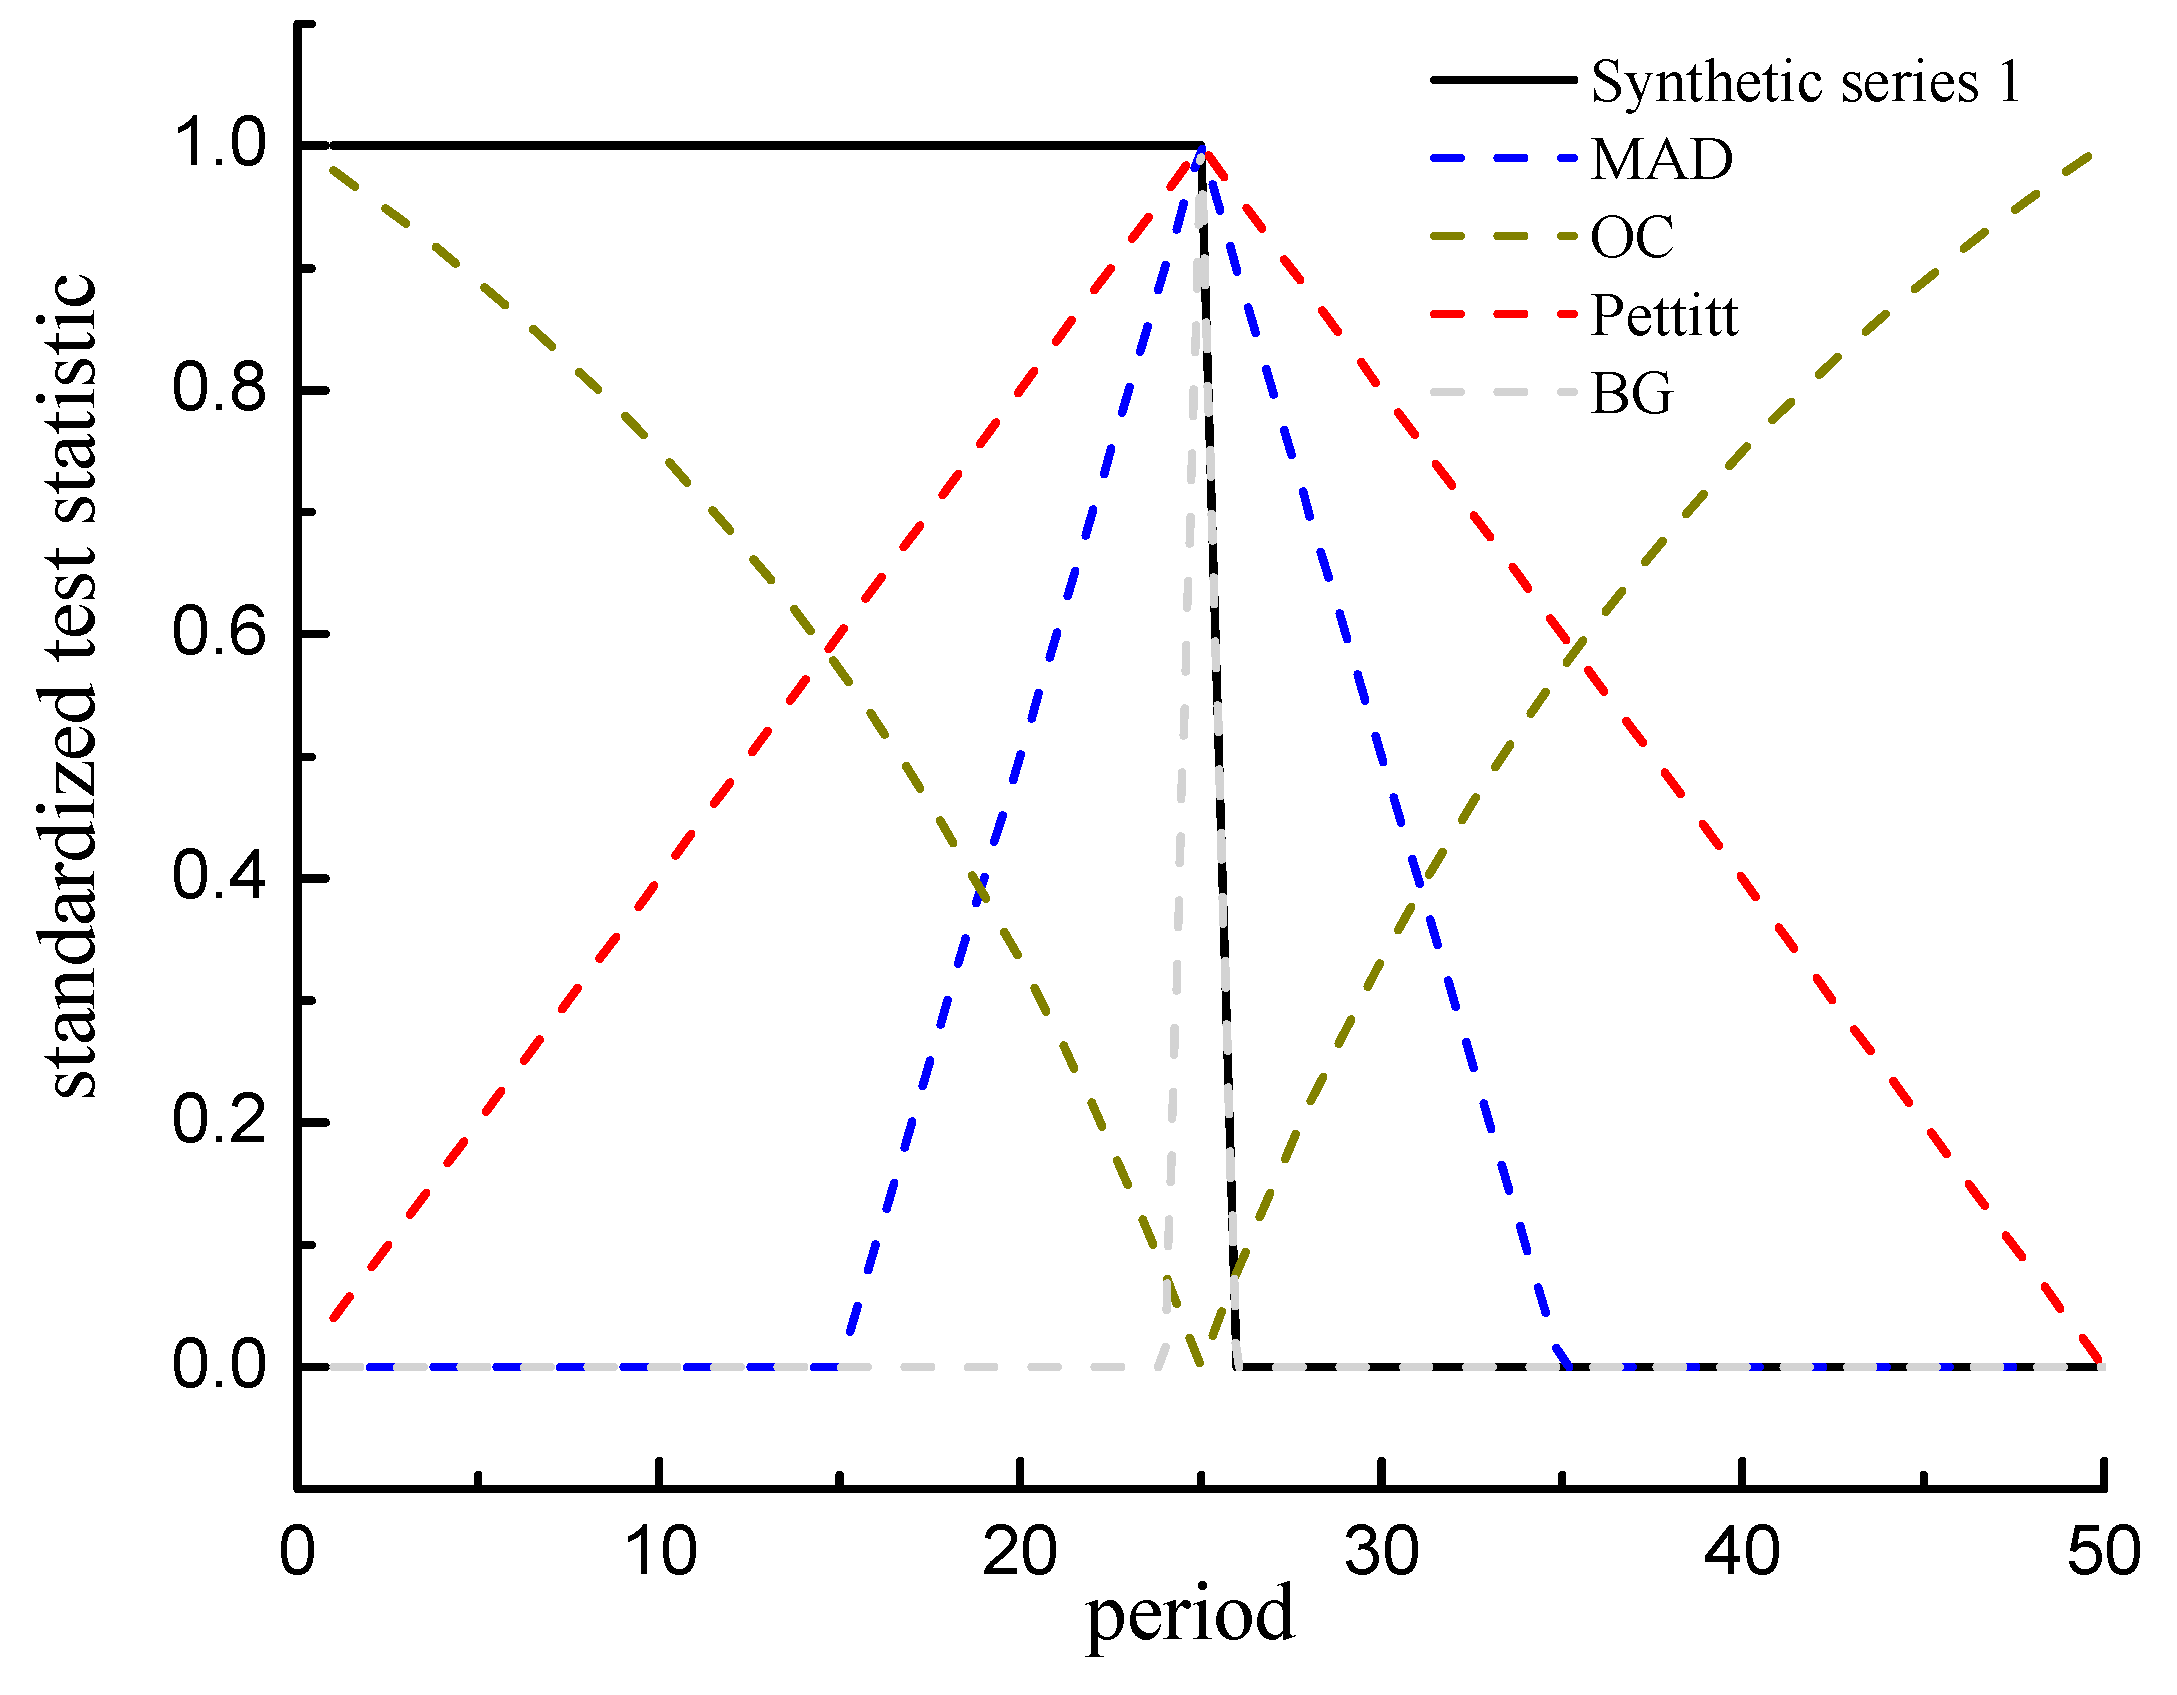
The sequence of test statistics of the five methods is depicted in Figure 3 and Figure 4. In order to display the sequence of different detection indexes in one figure, the sample series and the detection statistics sequences of the methods (except Mann–Kendall test) are standardized by the following formula,
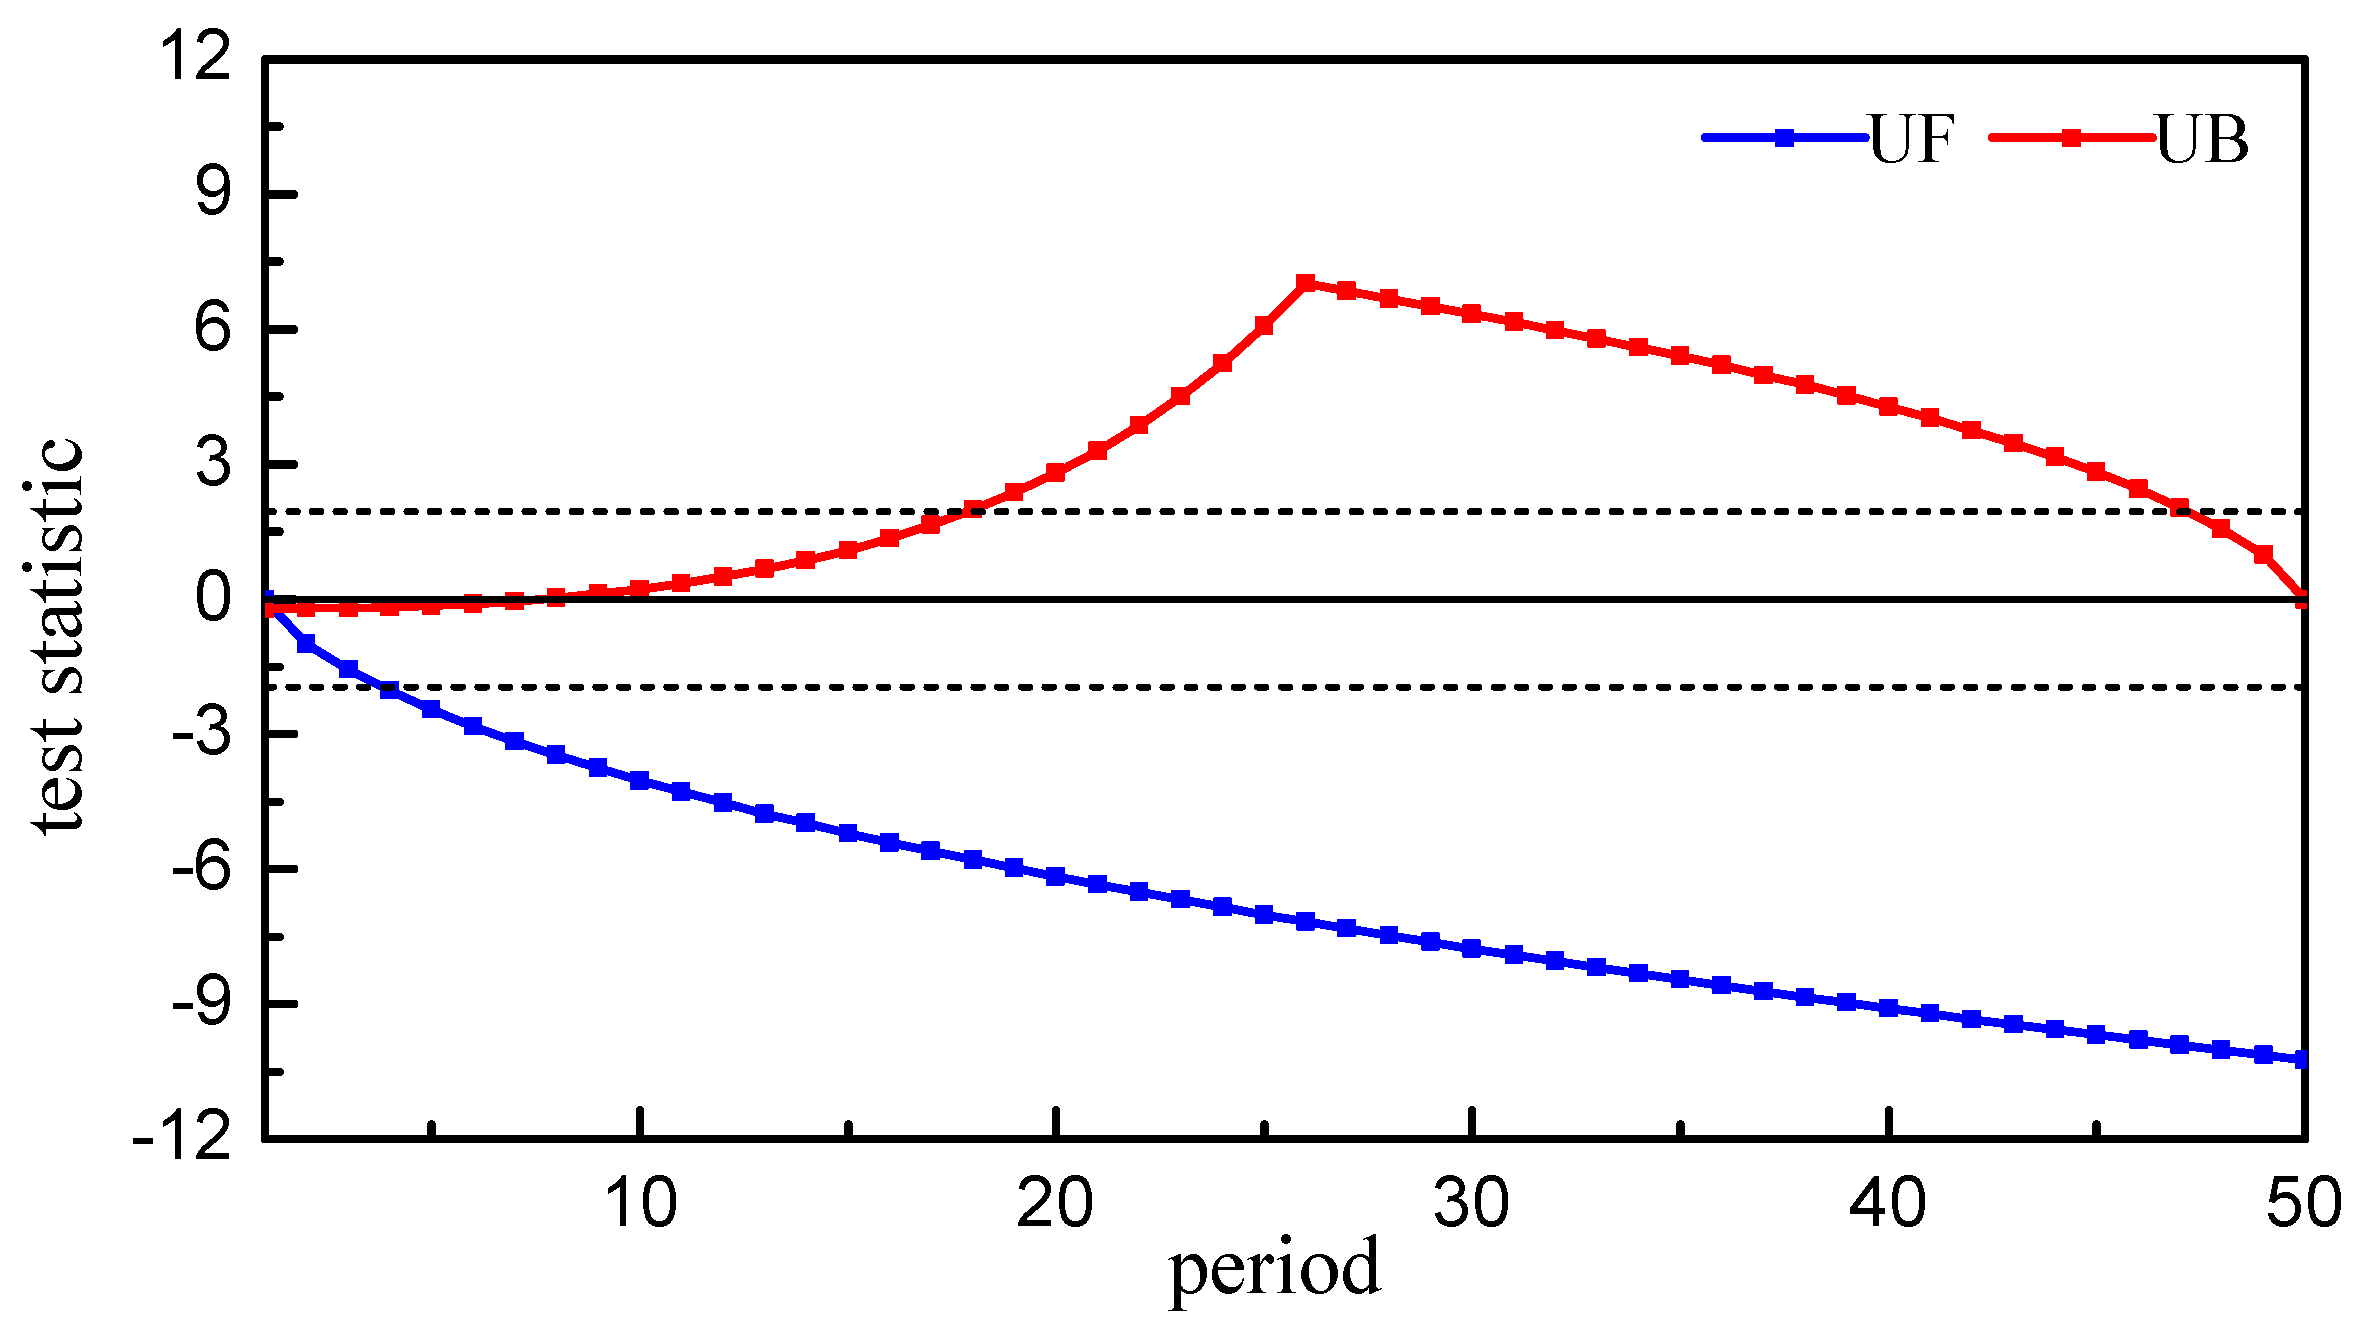
As shown in Figure 3, there is an obvious identical turning point in the detection statistics sequences of the methods adopted (except Mann–Kendall test), which is the same as the abrupt change point of the tested series. Figure 4 shows that the two sequences of Mann–Kendall test have no intersection point at all, so Mann–Kendall test failed to detect the abrupt change point of the sequence in this case.
3.1.2. Synthetic Case 2
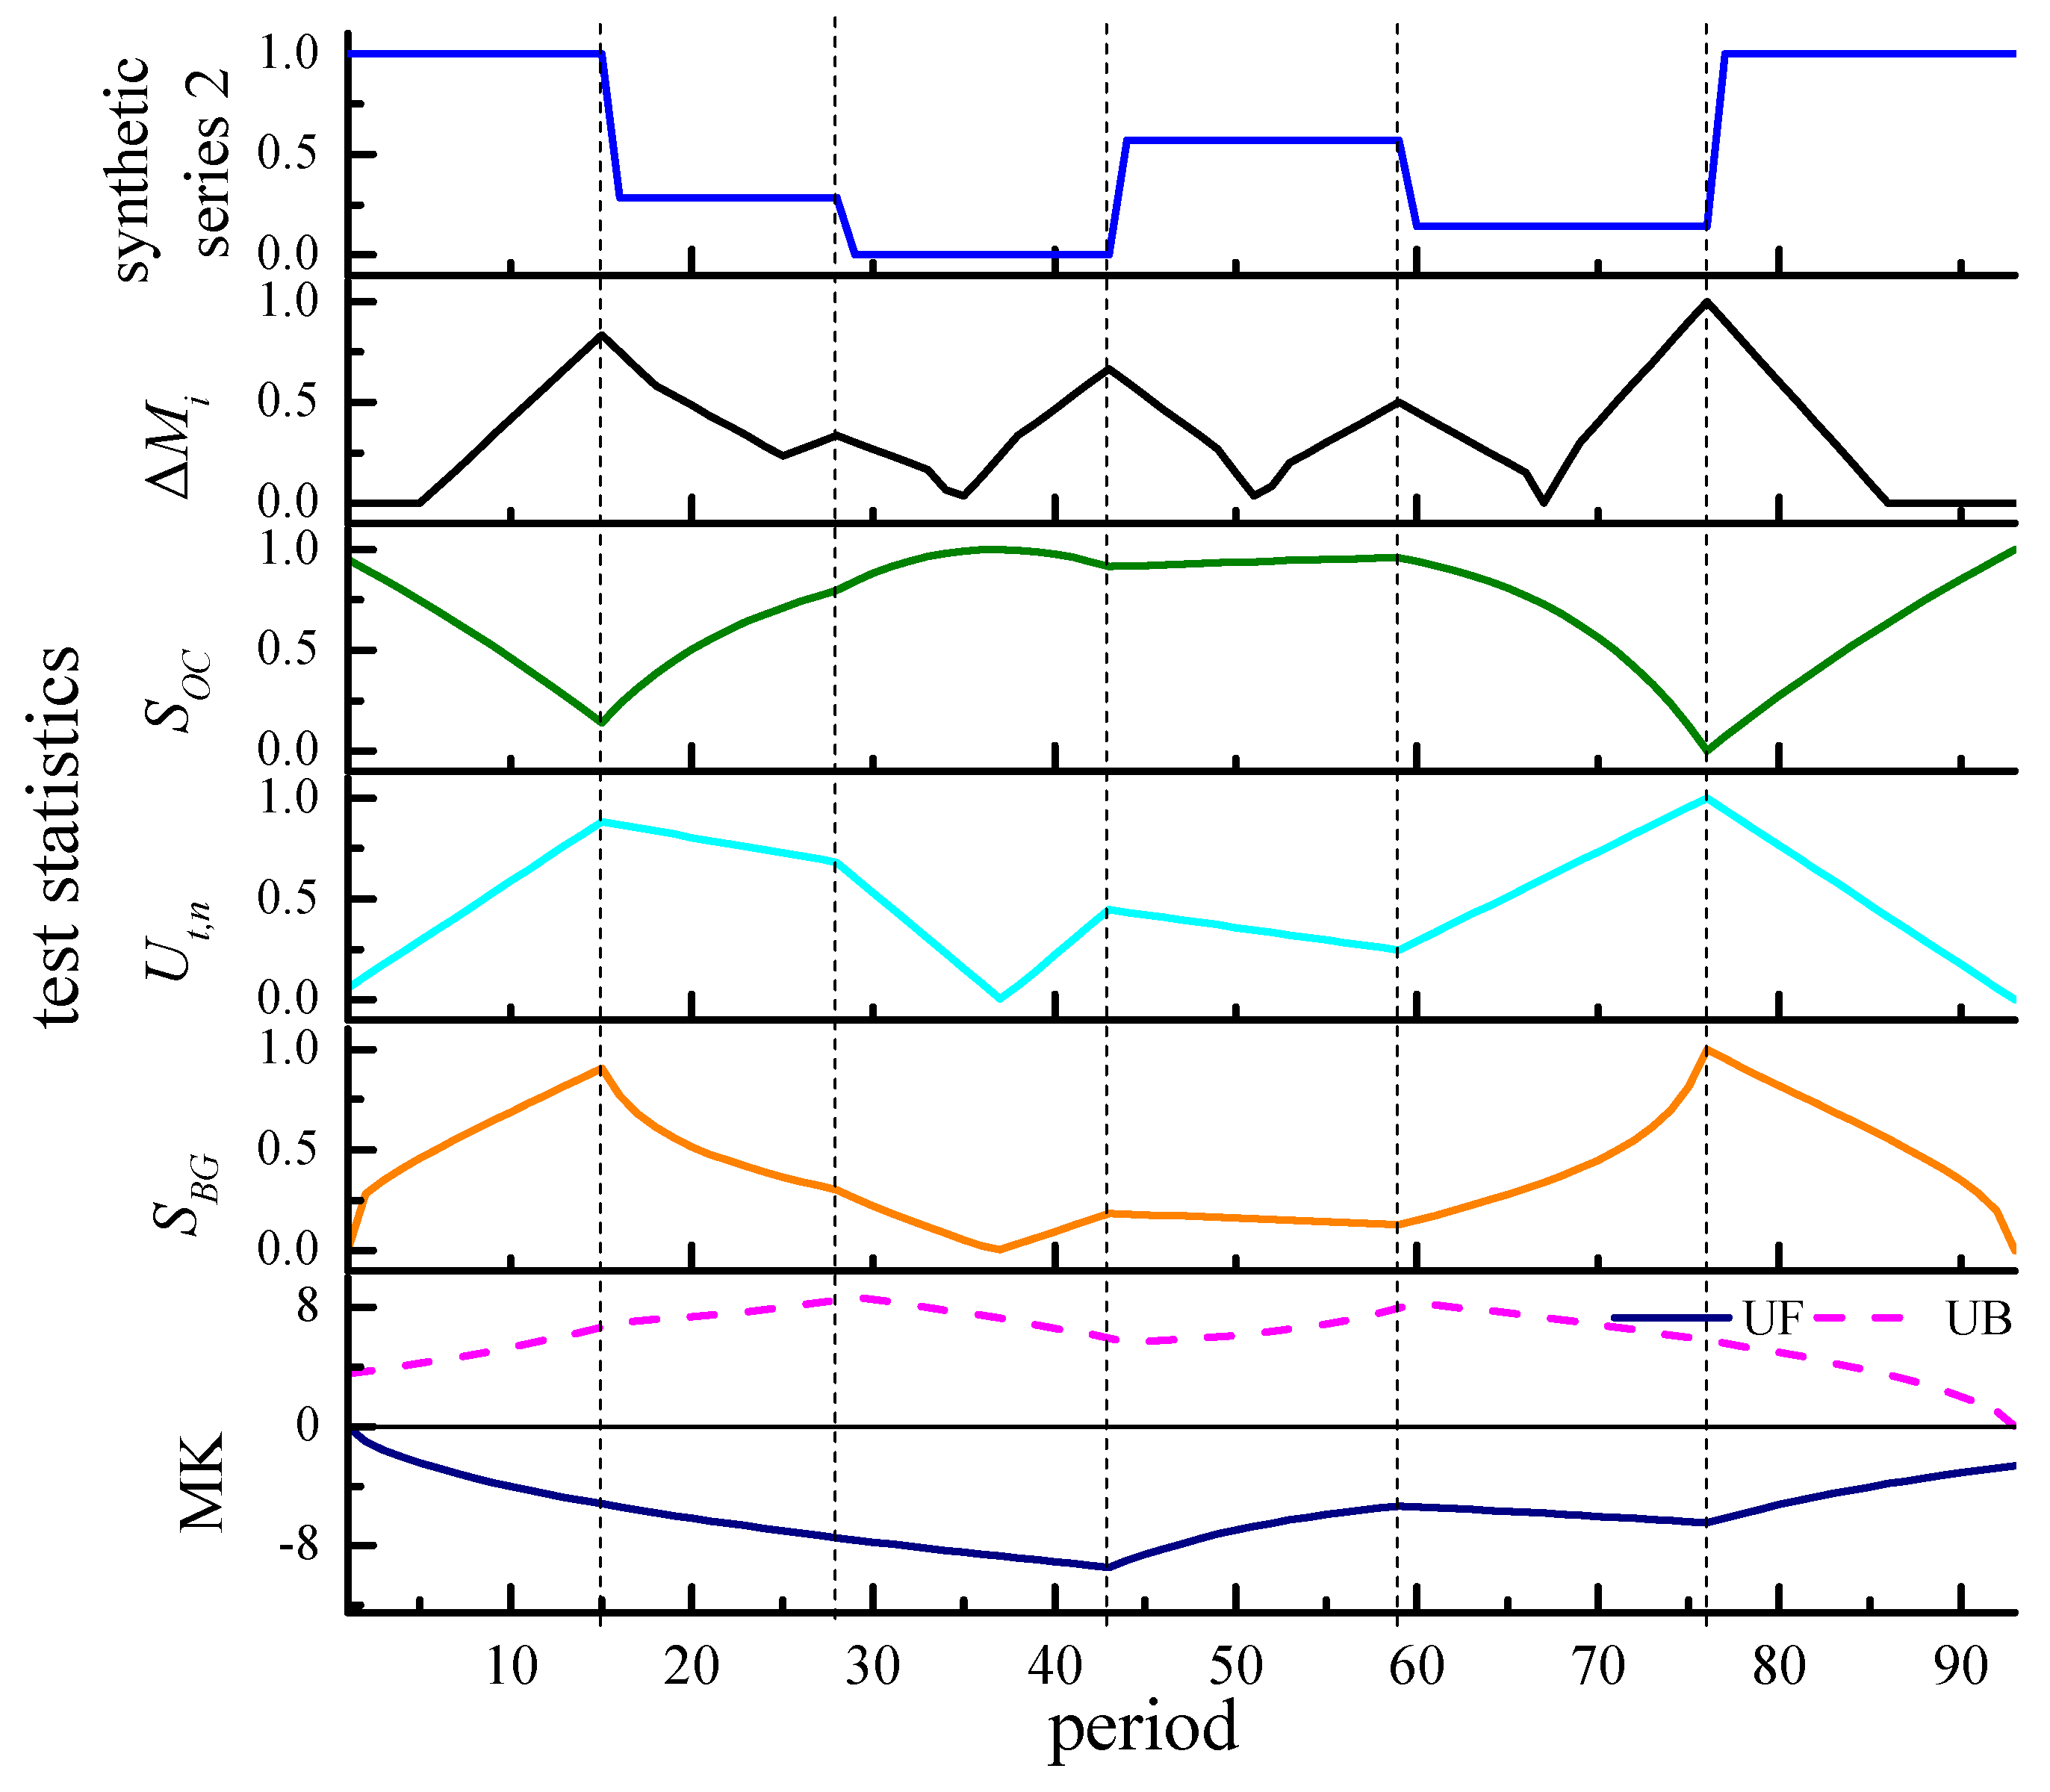
The detecting results of multi-mutation points series without errors are listed in Table 3. The results show that only the moving average difference method has accurately detected all the abrupt change points and calculated their mutation intensity at one time without any deviation. The BG algorithm, OC method and Pettitt test have detected the first and the fifth abrupt change points, while the second, third and fourth mutation points are not detected. According to these methods’ algorithm, the remaining abrupt change points can be detected when the subsequence of detected abrupt points is removed successively. The Mann–Kendall test has detected none of the five abrupt change points in this case.
The sequences of the test statistics of the five methods in this case are plotted in Figure 5. As indicated in Figure 5, the sequence of the test statistics of the moving average difference method has five local maximum points, which are exactly the locations of five abrupt change points of the synthetic series. From the sequence of the detecting statistics of the BG algorithm and OC method, we can see two local extremum points, corresponding to the first and the fifth mutation points respectively. The sequence of the test statistics of Pettitt test showed three local extremum points of point 1, point 3 and point 5, but the third mutation point did not reach the significant level. Therefore, the Pettitt test also has only detected two abrupt change points of point 1 and point 5. For Mann–Kendall test, similar to the result in the first synthetic case, the two sequences of UF and UB have no intersection point at all, none of the five abrupt change points is detected.
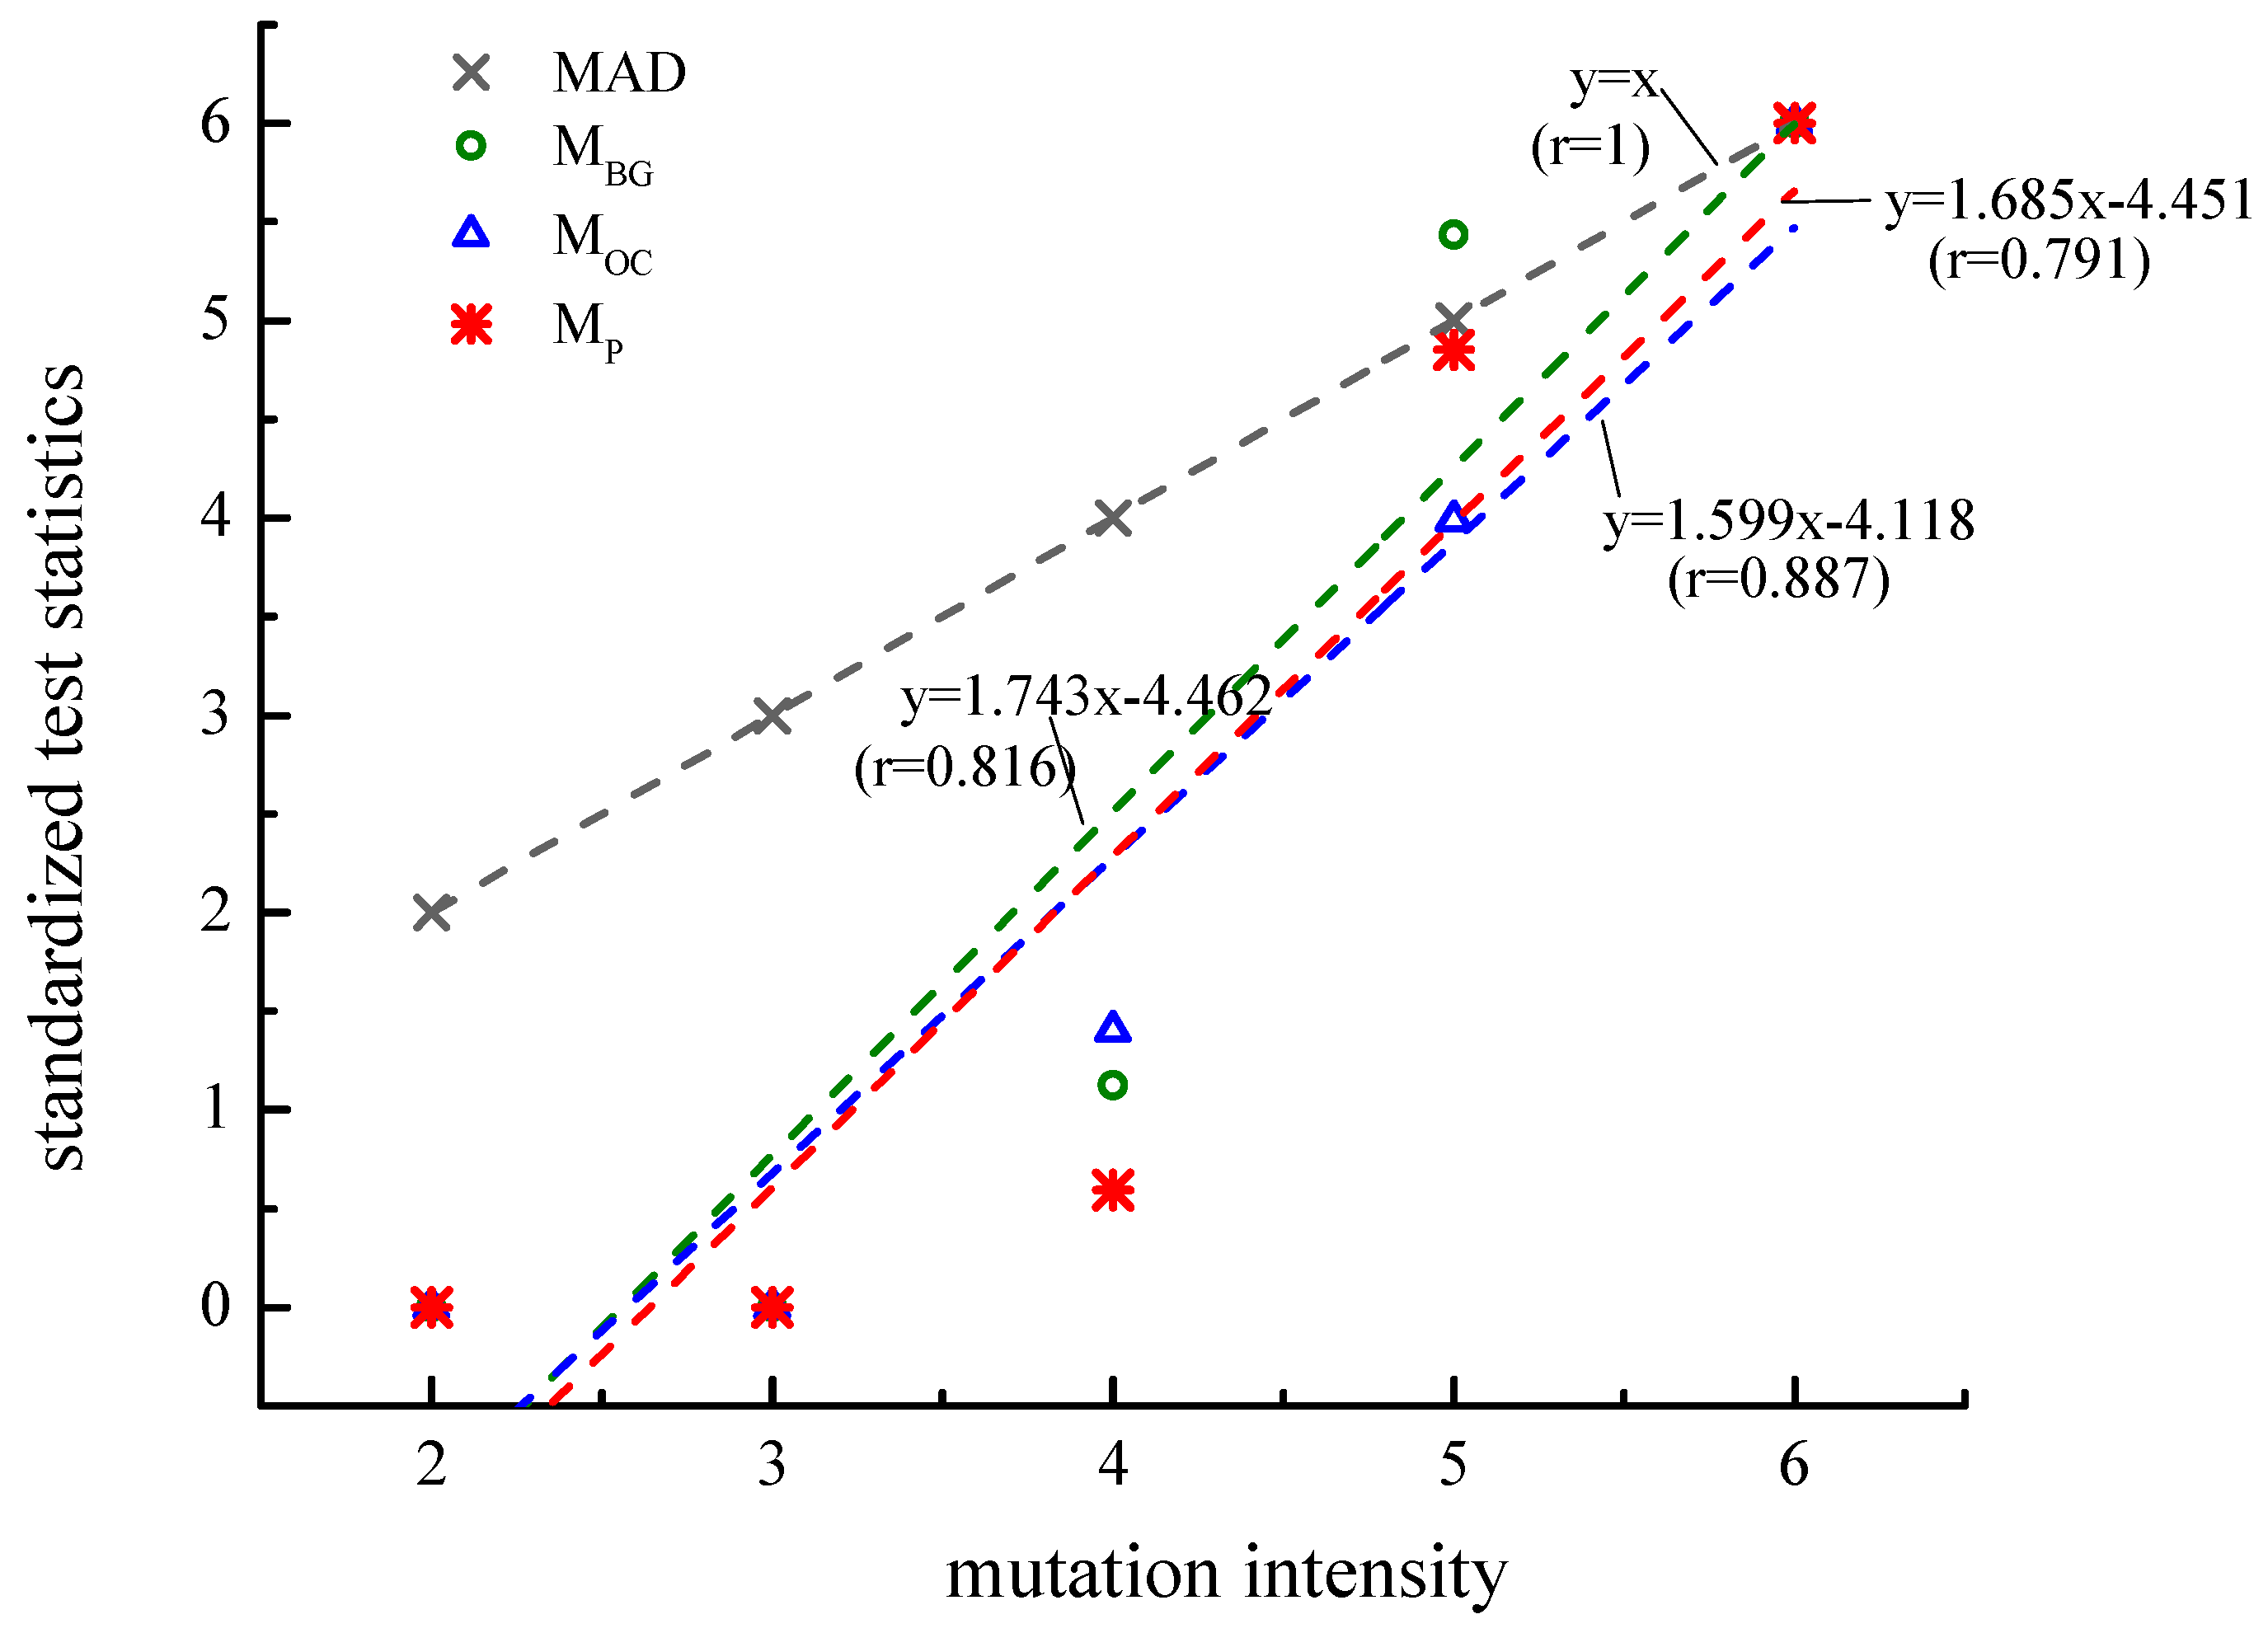
Comparing the test statistic value of each method with the mutation intensity at each point in Table 3, it is found that the test statistic value of each method is in direct proportion to the mutation intensity of each change point. The relationship between the test statistic value of each method and the mutation intensity at each change point are plotted in Figure 6. In order to display the sequence of test statistic values of different methods in one figure, the test statistics values of the methods (except Mann–Kendall test) are transformed by the following formulas,
where SBG, SOC and Ut,n are the test statistic values of the BG algorithm, OC method and Pettitt test, respectively. MBG, MOC and MP refer to the transformation of SBG, SOC and Ut,n.
As shown in Figure 6, the test statistic value of the moving average difference method is equal to the actual mutation intensity of each change point. The moving average difference method can detect all the change points and calculate their mutation intensity accurately at one time because the structure of the test statistic of this method does not lose effective information of the sample in the calculation process. However, the test statistics of the other three methods will inevitably lose effective information of the sample during the algorithm. The lower the mutation intensity is, the greater the loss. As we can see in Figure 5, the mutation intensity of change points 2 and 4 is lower than the others. Hence, the three methods failed to detect the two change points due to the information loss. This is a common shortcoming of the three methods.
3.1.3. Synthetic Case 3
The detection results of multi-mutation points series with errors are presented in Table 4.
Again, as shown in Table 4, the detection results are similar to that of the second case. Only the moving average difference method succeed to detect all the five abrupt change points. However, there is a small deviation in the calculation of mutation intensity due to the random error of the series. The BG algorithm, OC method and Pettitt test have detected the change point 1 and point 5, while the point 2, point 3 and point 4 are not detected. The results of Mann–Kendall test differ greatly. This method detects the abrupt change point of the sequence at the sample points 85–86, but the point is obviously not the actual abrupt change point of the series.
3.2. Real Case
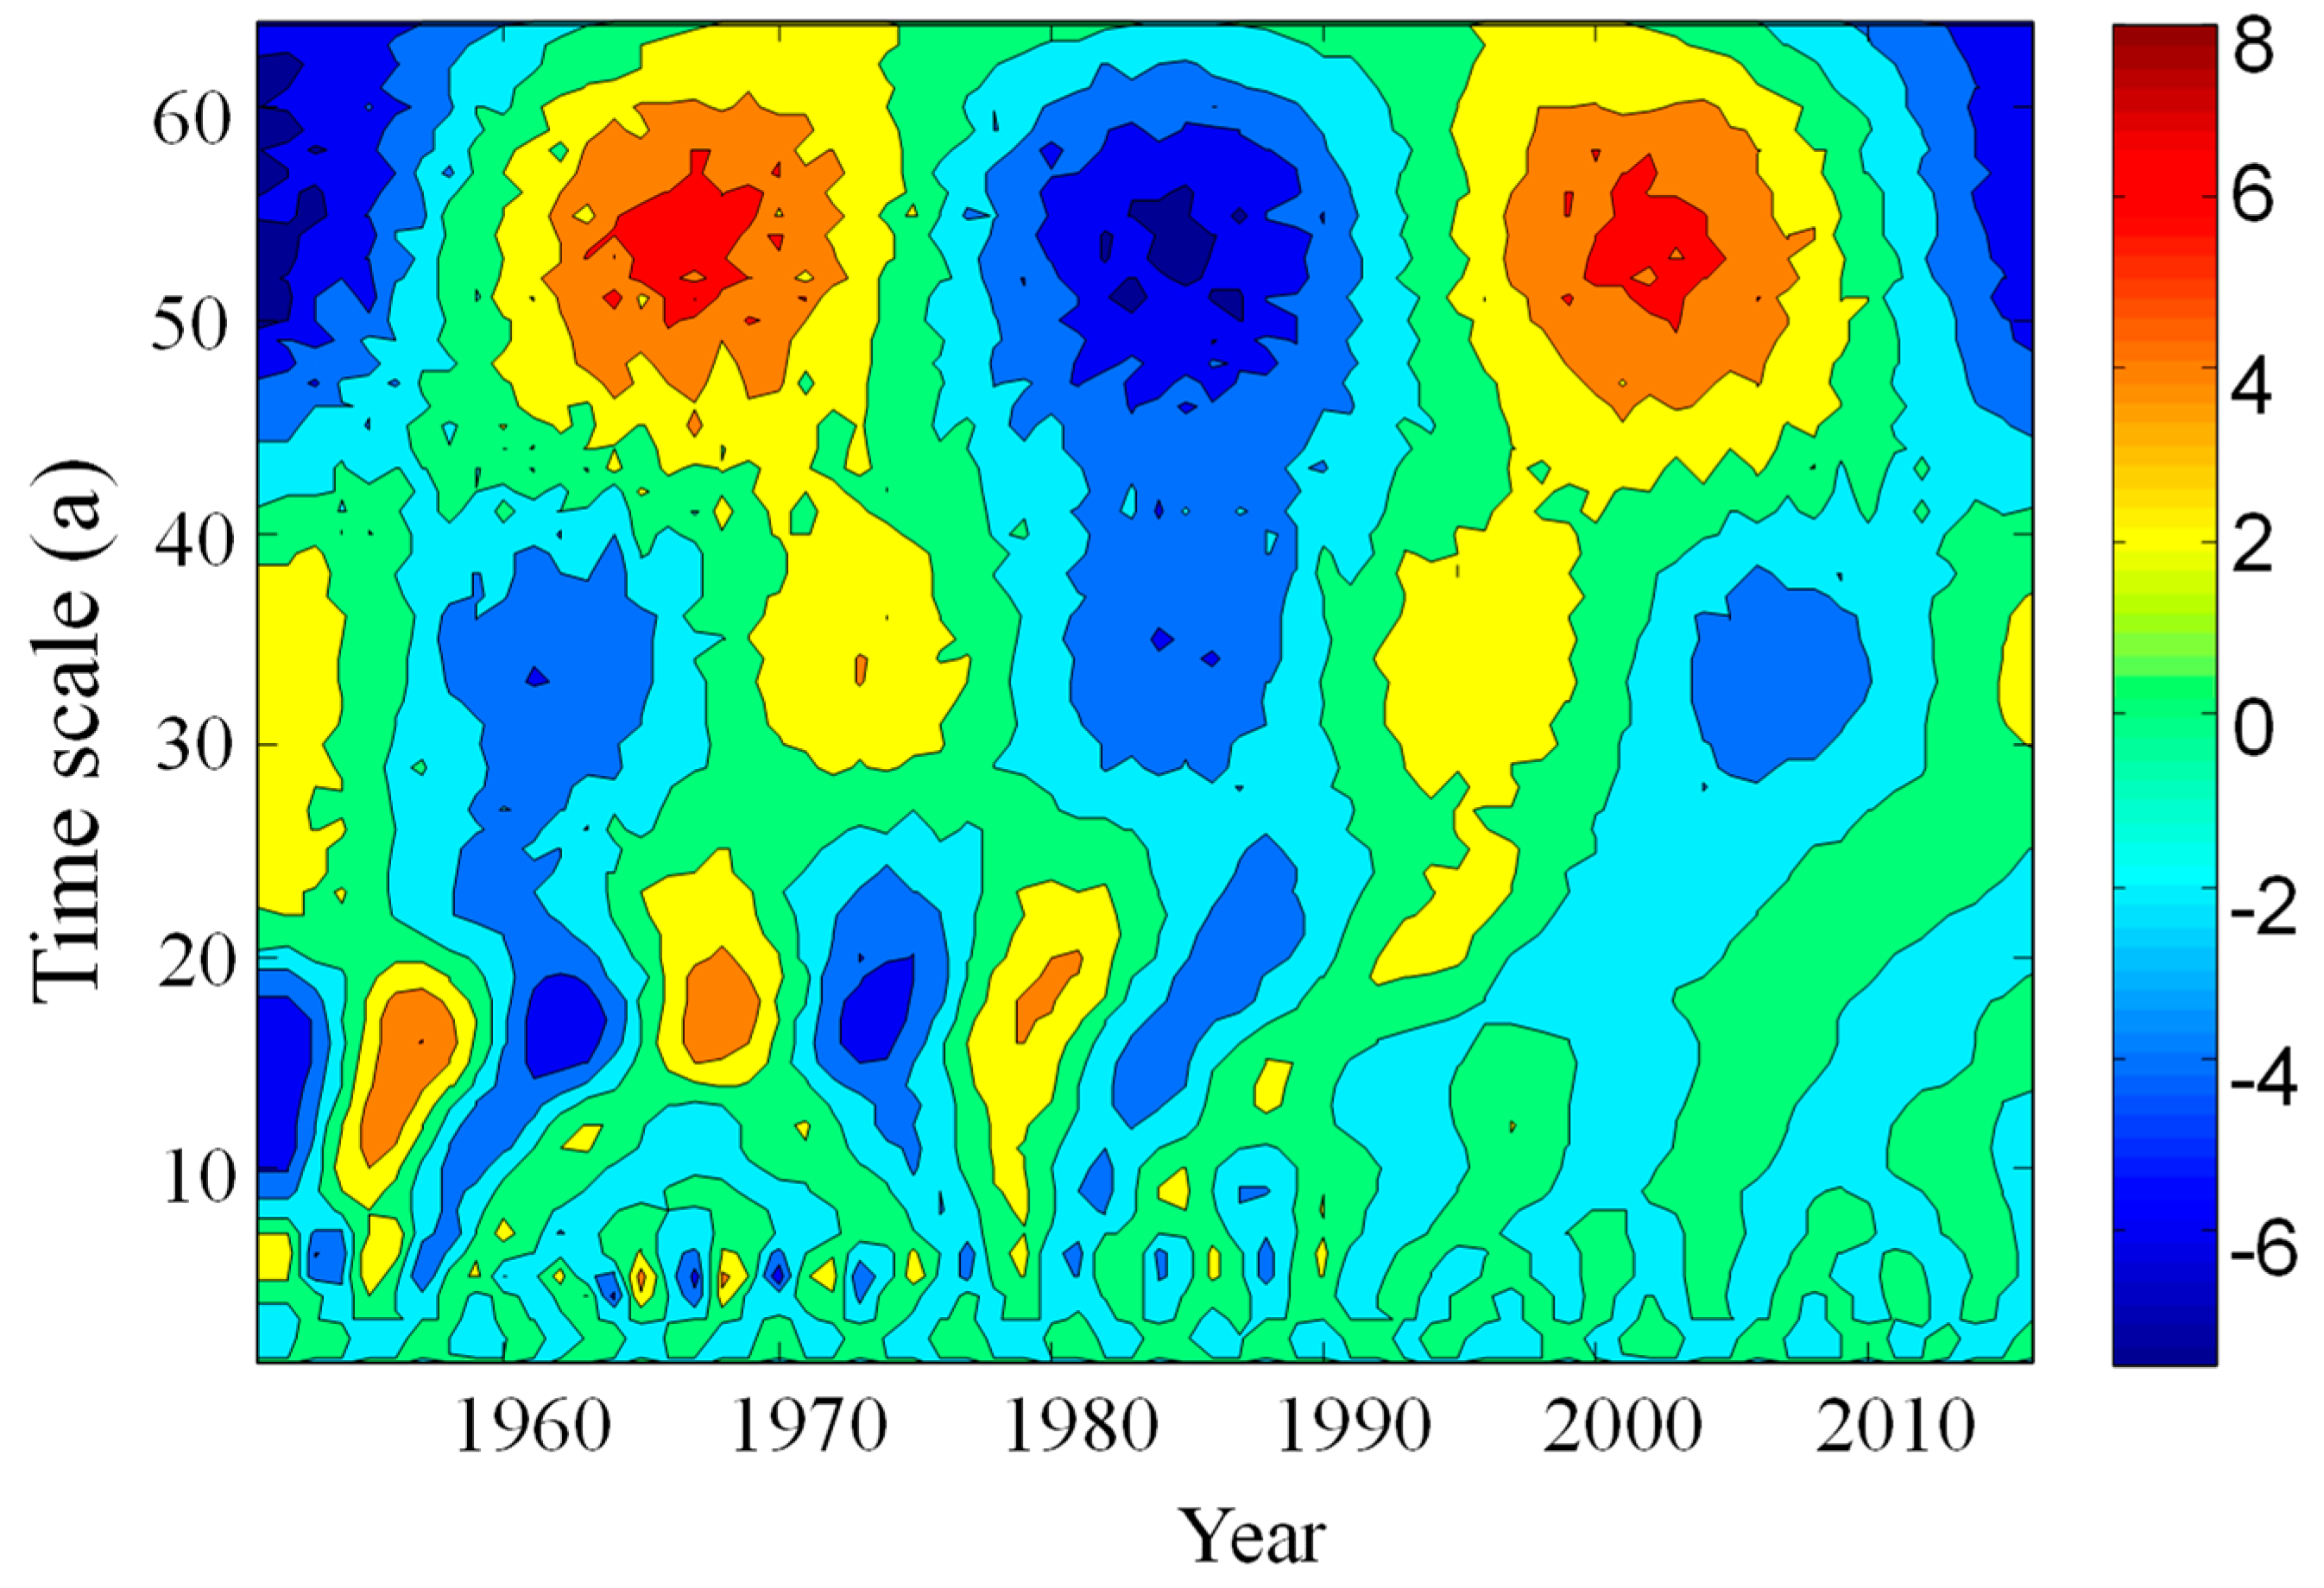
The wavelet transform was applied to analyze the periodicities in annual sediment discharge at the six hydrological stations. Figure 7 and Figure 8 illustrate the wavelet analysis of the annual sediment discharge at Tongguan station. As indicated in Figure 7, there are multi-time scales in the annual sediment discharge at Tongguan station. In general, there are four types of time scales, namely, 45~60 years, 30~40 years, 10~20 years and 3~7 years. The former two periodicity scales are stable during the whole analysis period. But the later two periodicity scales are not full-scale. They weakened or even disappeared after 1990, because of the intensive comprehensive soil and water conservations.
There are four distinct peaks in the curves of wavelet variance of sediment discharge at Tongguan station (Figure 8), which are 54 years, 16 years, 35 years and 5 years, respectively. The maximum peak corresponds to the time scale of 54 years, indicating that the periodicity around 54 years is the strongest, which is the primary periodicity of the sediment discharge at Tongguan station. By parity of reasoning, the second peak, which corresponds to 16 years, is the second major periodicity of the series. Since the moving period p < n, p = 16 was selected in this study.
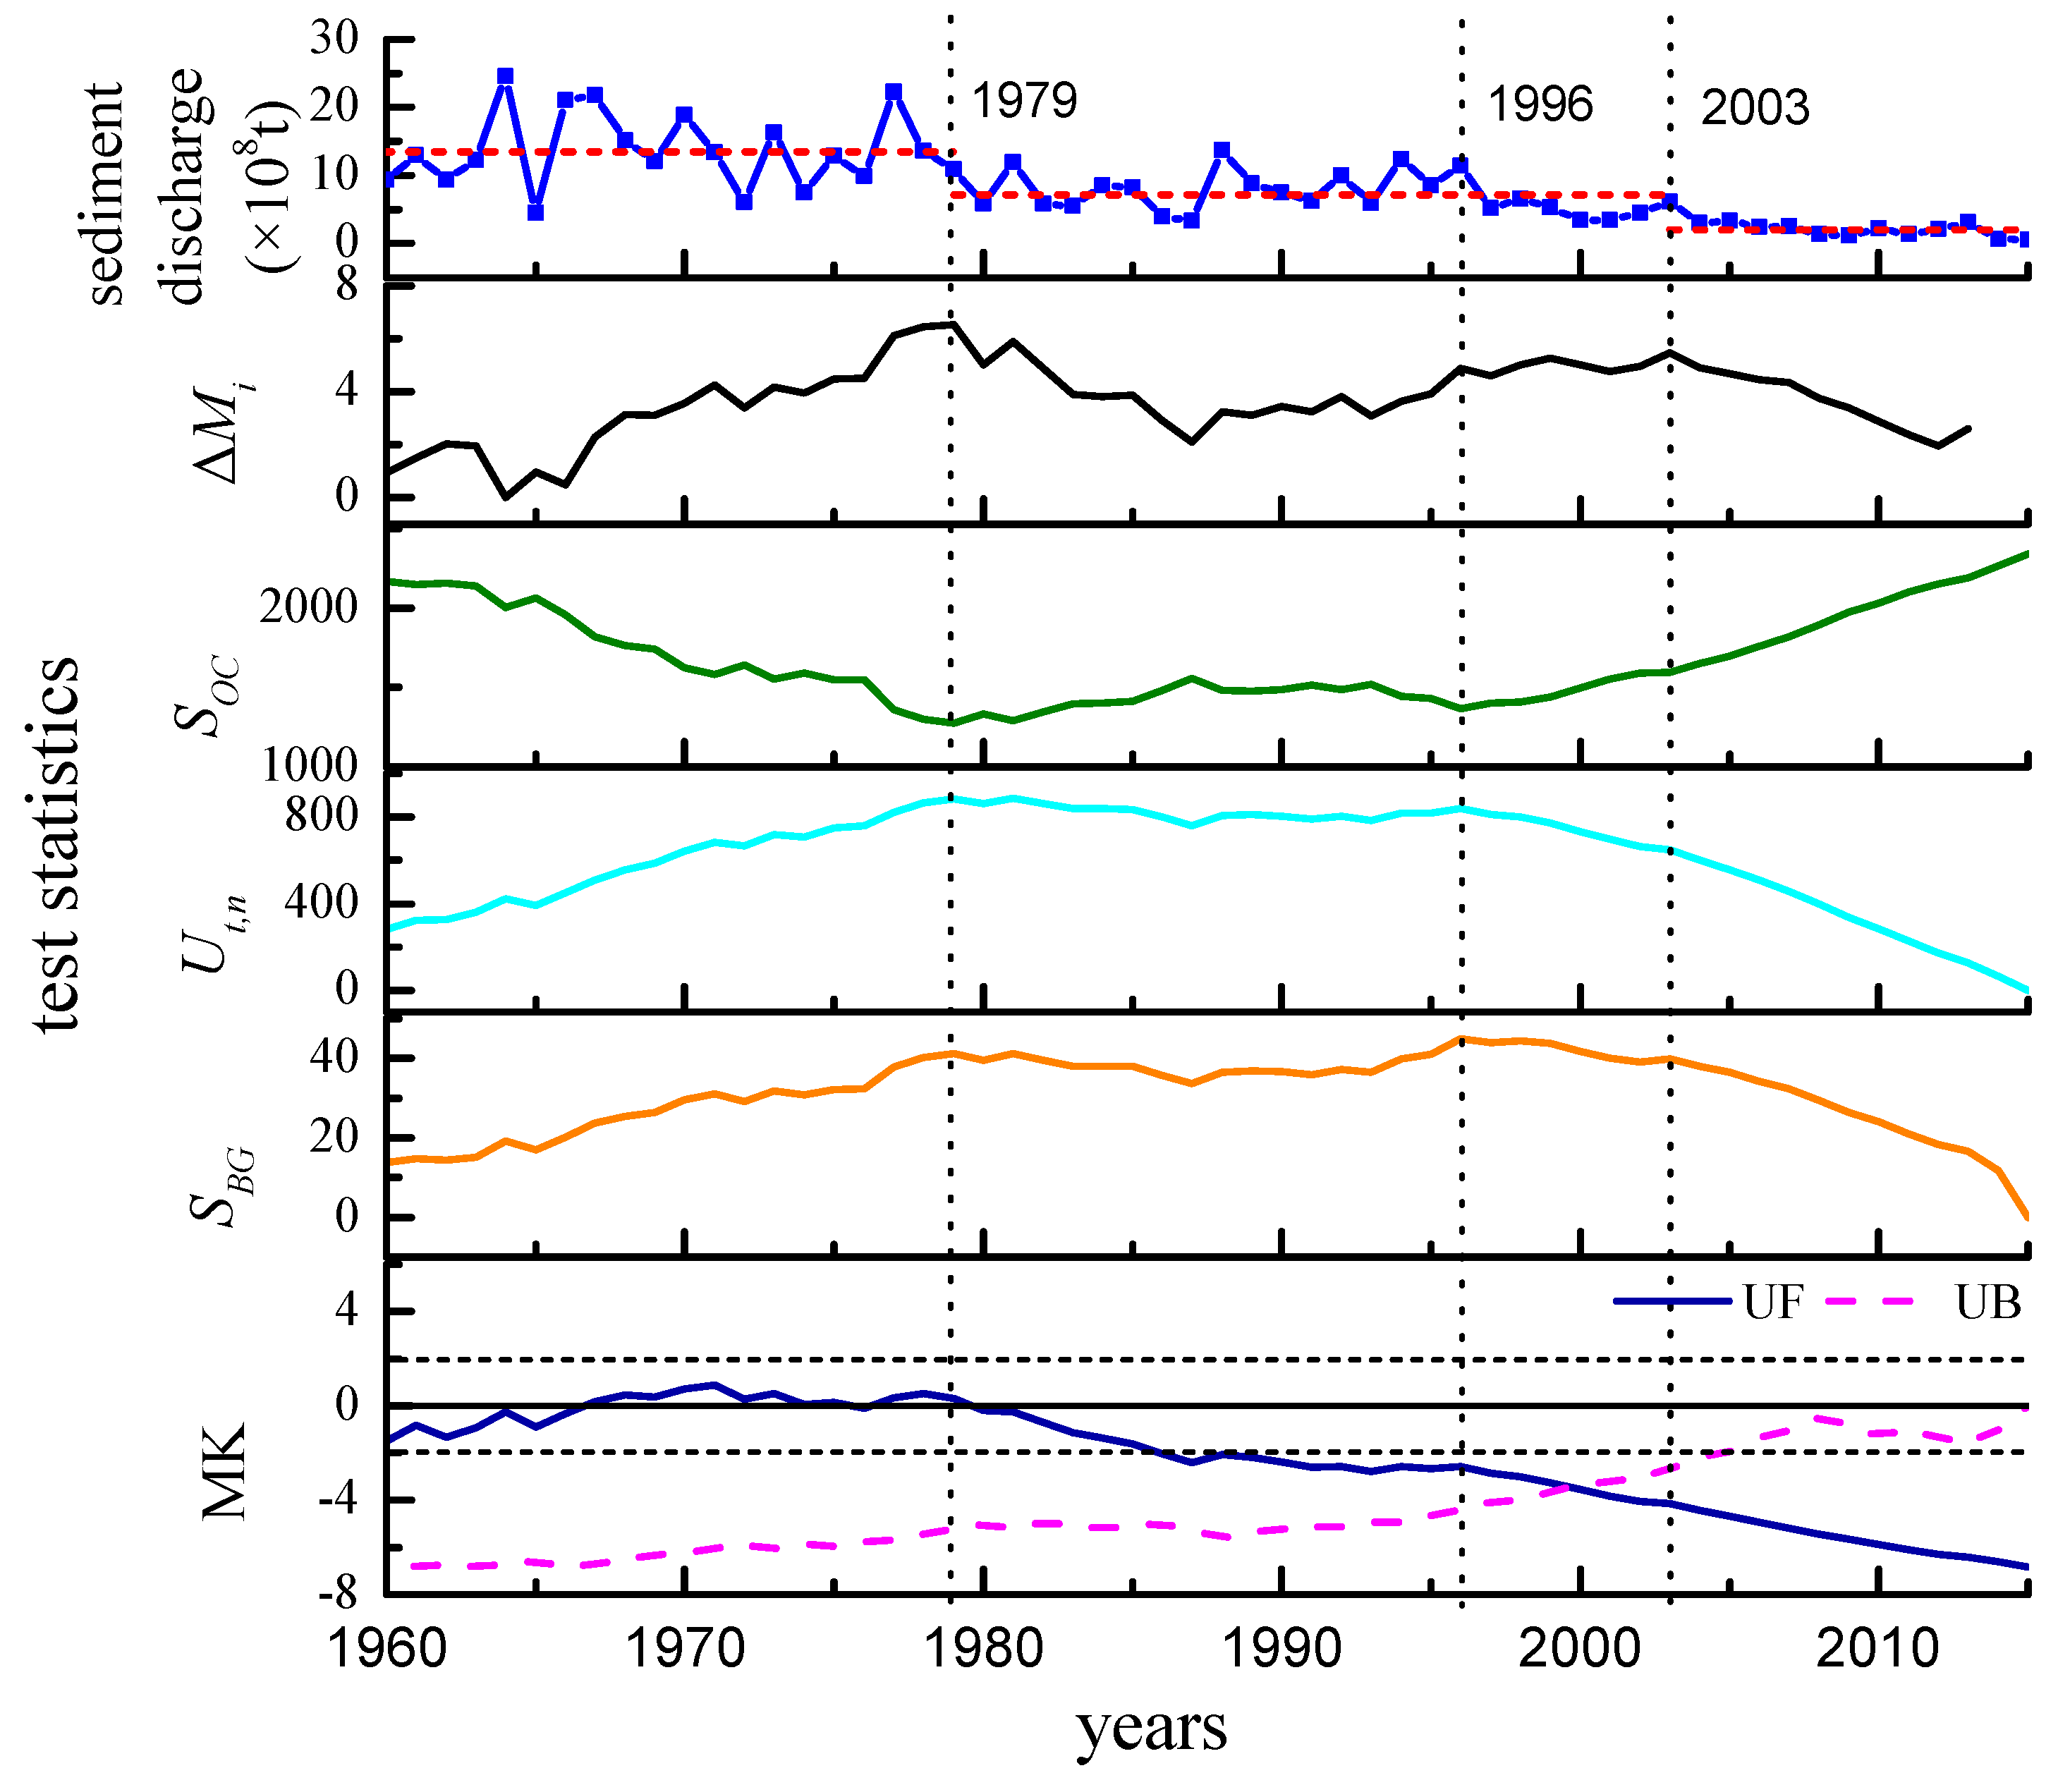
The detecting results by five methods at Tongguan station are presented in Figure 9. As shown in Figure 9, two significant abrupt change points were detected by the moving average method and the corresponding mutation intensities of year 1979 and 2003 were 6.528 and 5.467, respectively. The OC method and the Pettitt test detected the abrupt change in 1979 and the abrupt change detected by the BG algorithm is in 1996. For Mann–Kendall test, the two test statistics UF and UB have an intersection in 2000, but the intersection point is not within the α = 0.05 confidence interval (u0.05 = ±1.96), so the intersection is not a significant abrupt change. It can be clearly seen that the test statistics sequence of the BG algorithm, OC method and Pettitt test all have two obvious local extremum points in the curve. The first local extremum point is in 1979. According to the analysis series and the test results of the moving average difference method, the mutation intensity in 1979 is the largest, so 1979 is a significant abrupt change point of the analysis series. The second local extremum point is in 1996. It can be seen from the test statistics sequence curve of the moving average difference method that 1996 is indeed a change point. However, the mutation intensity of year 1996 is 4.868, which is comparatively smaller than 1979 and 2003. The abrupt change detected by the BG algorithm is not in 1979, when the mutation intensity is the strongest, but in 1996, when the mutation intensity is comparatively weak. Furthermore, in 2003, the mutation intensity should be second only to the abrupt change in 1979. But the BG algorithm, OC method and Pettitt test have not detected this abrupt change. This is caused by the implicit assumption in these methods that there is only one abrupt change point in the sequence. In summary, there are two significant abrupt change points in the annual sediment discharge at Tongguan station, which occurred in 1979 and 2003 respectively.
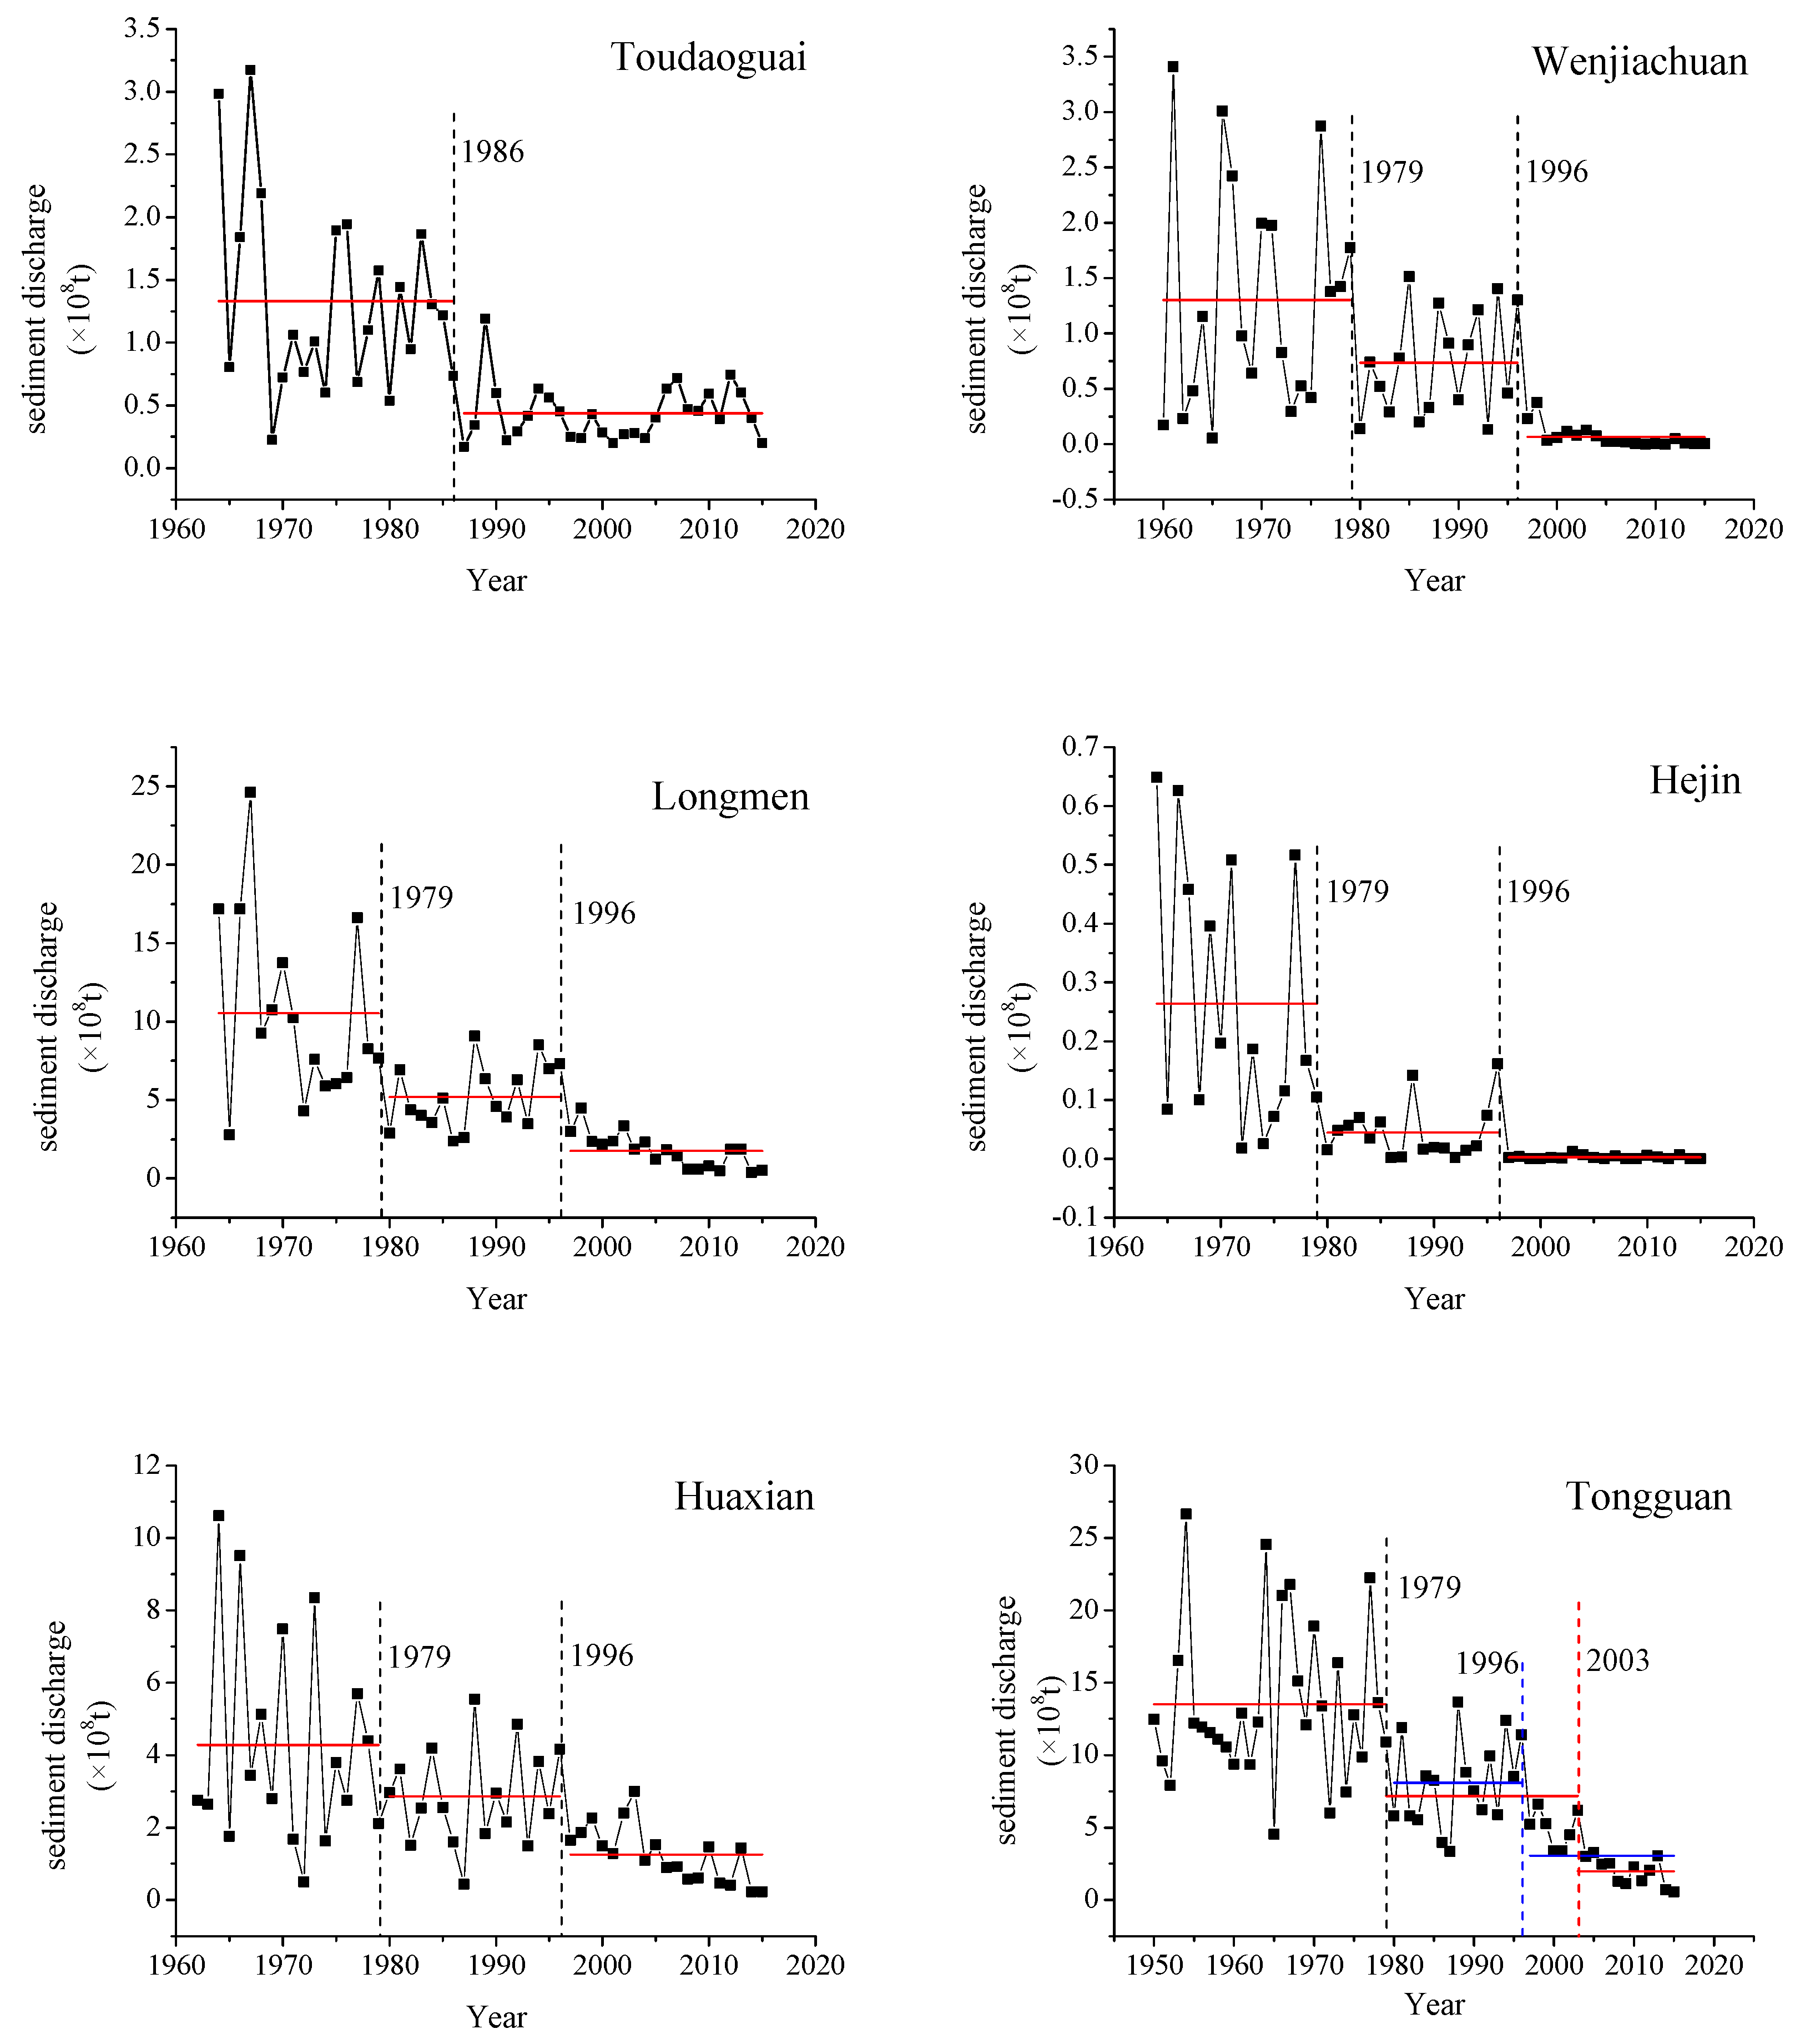
The detecting results by different methods of the annual sediment sequences at the other five hydrological stations (Toudaoguai, Longmen, Wen Jiachuan, Hejin and Huaxian) are shown in Table 5 and Figure 10.
(1) When there is only one significant abrupt change point in the hydrological series (for example, the annual sediment discharge sequence at Toudaoguai station), all the five methods we investigate can detect the abrupt change, and the results are nearly the same.
(2) When there are two or more than two abrupt change points in the hydrological series, only the moving average difference method can accurately detect all abrupt change points and calculate the corresponding mutation intensity at one time. The abrupt change point detected by the BG algorithm, OC method and Pettitt test is one of the change points detected by the moving average difference method. But it is not necessarily the point of the maximum mutation intensity, and even may be the weakest mutation point among the abrupt change points. This illustrates that there is a problem of catastrophe points drift in the three methods.
(3) In many situations, the Mann–Kendall test cannot detect the abrupt change in the time series or the detecting result is wrong.
(4) The sediment discharge in the upper reaches of the Yellow River changed abruptly in 1986 (annual sediment discharge at Toudaoguai station). The water used for production and living in the upper reaches of the Yellow River increased greatly since 1980s, about 52 percent more than in the 1950s [27]. Besides, the construction of water conservancy projects in the upper reaches of the Yellow River after 1970s has greatly changed the annual and interannual distribution of water and sediment in the basin. For example, after the completion of Longyangxia reservoir in 1986, it was jointly operated with Liujiaxia reservoir, which impounded a large amount of runoff and sediment, greatly reducing the sediment discharge in the upstream [38]. The sediment discharge in the middle reaches of the Yellow River mainly has two abrupt changes, in 1979 and 1996, respectively. The middle reaches of the Yellow River run across the Loess Plateau of North China. Large-scale soil and water conservation measures in the Loess Plateau since 1970s have greatly accelerated the reduction of water and sand sediment in this region [35,39]. In the early 1990s, the second stage water and soil conservation management project was carried out, leading to the further increase of vegetation coverage and further decline in runoff and sediment. Therefore, there are two abrupt change points, respectively in 1979 and 1996, in the annual sediment discharge sequences at Longmen, Wenjiachuan and Hejin stations. There are many influence factors in the middle reaches, and the further downstream, the more complex the factors are. The Huaxian station is the control gauging station of the Weihe River, near the Tongguan station. Abrupt changes of the annual sediment discharge at the Huaxian station occurred in 1979, 2003 and 1996, which were consistent with the results of the Tongguan station. Heavy coal exploitation after 2000 and the increase of social water use in the middle reaches of the Yellow River are the dominating factors causing the abrupt change in 2003.
4. Discussion
The authors consider that the main reason for the effective information loss of the three methods (the BG algorithm, OC method and Pettitt) is the unreasonable statistical structure of the methods. There is an implied hypothesis in the algorithm of the three methods that there is only one abrupt change point and the subsequences before and after the change point are stationary sequences with different mean values. Therefore, when there are multiple abrupt change points, the points of low mutation intensity are concealed by those of high mutation intensity.
Such as the BG segmentation algorithm, as we can deduce from the Formulas (24) and (25), the value of the structure consequentially reaches the maximum at the two tails of the sequence (where nleft·nright reaches the minimum) and reaches the minimum in the middle of the sequence (where nleft·nright reaches the maximum). Therefore, this section in the formula has no relation with the abrupt change. It cannot excavate the effective information of the sample, on the contrary, it provides harmful information that interferes with the detection of catastrophe points.
As for Mann–Kendall test, this non-parametric test is based on the fact that, under the hypothesis of a stationary time series [1,10], which has no systematic change in mean value, variance and periodicity, the succession of climatological values must be independent and the probability distribution must remain always the same. Therefore, it is inapplicable for non-stationary series. In recent decades, large-scale human activities have led to the abrupt change in annual runoff and sediment discharge in the Yellow River, especially in mean value. Consequently, the sediment discharge series in the Yellow River basin is not a stationary sequence. Hence, the Mann–Kendall test is not applicable in such problems.
5. Conclusions
(1) A new method named moving average difference method for detecting abrupt change is proposed in this paper. It can detect the multiple abrupt change points of time series and calculate the corresponding mutation intensity at the same time. The method was investigated via both synthetic data and real data, showing that the method works as theoretically expected. Furthermore, it was also applied to validating the advantages and effectiveness through comparison with four widely used methods (the clustering analysis method, Mann–Kendall test, Pettitt test and BG segmentation method). It is found that the traditional four methods have the following deficiencies: First, there is an implied hypothesis in the algorithm of the four methods that there is only one abrupt change point in the series. When the real data does not conform to this assumption, the algorithm will lead to the loss of effective information, so that the abrupt change point with low mutation intensity cannot be detected. Second, the test statistics structure of the BG segmentation method is unreasonable and remains to be improved. In summary, the moving average difference method has four advantages: Firstly, the test statistic structure of the method has physical significance and is intuitive and simple to understand. Secondly, abrupt change detection is more accurate than other methods. Thirdly, it can detect all of the abrupt change points at one time. In addition, it can simultaneously detect the abrupt changes and calculate the corresponding mutation intensity. Therefore, the method proposed is worthy of being popularized.
(2) The annual sediment discharge series at six key hydrological stations in the Yellow River are analyzed. The results show that the sediment discharge in the upper reaches of the Yellow River changes abruptly in 1986. The sediment discharges in the middle reaches of the Yellow River (Longmen station), the Kuyehe River (Wenjiachuan station) and the Fenhe River (Hejin station) change abruptly in 1979 and 1996. Furthermore, 1979 was the most significant catastrophe point. There are three abrupt change points in the annual sediment discharge series at Huaxian station and Tongguan station, respectively in 1979, 2003 and 1996, with diminishing mutation intensities. Human activities, including the construction of water conservancy projects, large-scale soil and water conservation measures and coal mining are the primary factors that lead to the abrupt change of sediment discharge in the Yellow River.
(3) Little attention is paid to the variation of streamflow in the Yellow River as well as in other regions in this paper [40,41,42]. More work is needed to investigate the effectiveness and superiority of the proposed method. Therefore, we will apply the method to runoff discharge in the Yellow River as well as in other regions in the following research.
Author Contributions
Conceptualization, W.B. and D.S.; Methodology, W.B. and D.S.; Software, W.B. and D.S.; Validation, W.B. and D.S.; Formal Analysis, D.S. and P.N.; Investigation, D.S.; Resources, D.S. and P.N.; Data Curation, D.S. and P.N.; Writing-Original Draft Preparation, D.S.; Writing-Review & Editing, D.S.; Visualization, D.S. and P.N.; Funding Acquisition, W.B.
Funding
This research was funded by the National Key R&D Program of China (Grant No. 2016YFC0402703), the fundamental research funds for central public welfare research institutes (Grant No. HKY-JBYW-2017-12), the National Natural Science Foundation of China (Grant No. 51709077, 41371048, 51479062 and 51709076) and the Fundamental Research Funds for the Central Universities (No. 2017B10914, 2015B14314 and 2017B15414).
Conflicts of Interest
The authors declare no conflict of interest.
References
- Goossens, C.; Berger, A. How to Recognize an Abrupt Climatic Change? Springer: Amsterdam, The Netherlands, 1987. [Google Scholar]
- Peng, G.; Zhang, X.C.; Mu, X.M.; Fei, W.; Rui, L.; Zhang, X.P. Trend and change-point analyses of streamflow and sediment discharge in the Yellow River during 1950–2005. Int. Assoc. Sci. Hydrol. Bull. 2010, 55, 275–285. [Google Scholar] [Green Version]
- Gocic, M.; Trajkovic, S. Analysis of changes in meteorological variables using Mann-Kendall and Sen’s slope estimator statistical tests in Serbia. Glob. Planet. Chang. 2013, 100, 172–182. [Google Scholar] [CrossRef]
- Zhang, X.P.; Zhang, L.; Mcvicar, T.R.; Niel, T.G.V.; Li, L.T.; Li, R.; Yang, Q.K.; Wei, L. Modelling the impact of afforestation on average annual streamflow in the Loess Plateau, China. Hydrol. Process. 2008, 22, 1996–2004. [Google Scholar] [CrossRef]
- Gain, A.K.; Mondal, M.S.; Rahman, R. From Flood Control to Water Management: A Journey of Bangladesh towards Integrated Water Resources Management. Water 2017, 9, 55. [Google Scholar] [CrossRef]
- Xu, F.; Jia, Y.; Niu, C.; Liu, J.; Hao, C. Changes in Annual, Seasonal and Monthly Climate and Its Impacts on Runoff in the Hutuo River Basin, China. Water 2018, 10, 278. [Google Scholar] [CrossRef]
- Bian, H.; Lü, H.; Sadeghi, A.M.; Zhu, Y.; Yu, Z.; Ouyang, F.; Su, J.; Chen, R. Assessment on the Effect of Climate Change on Streamflow in the Source Region of the Yangtze River, China. Water 2017, 9, 70. [Google Scholar] [CrossRef]
- Liu, Q.Q.; He, W.P.; Gu, B. Application of nonlinear dynamical methods in abrupt climate change detection. Acta Phys. Sin. 2015, 64, 179201. [Google Scholar] [CrossRef]
- Rustomji, P.; Zhang, X.P.; Hairsine, P.B.; Zhang, L.; Zhao, J. River sediment load and concentration responses to changes in hydrology and catchment management in the Loess Plateau region of China. Water Resour. Res. 2008, 44, 148–152. [Google Scholar] [CrossRef]
- Mann, H.B. Nonparametric test against trend. Econometrica 1945, 13, 245–259. [Google Scholar] [CrossRef]
- Gerstengarbe, F.; Werner, P. Estimation of the beginning and end of recurrent events within a climate regime. Clim. Res. 1999, 11, 97–107. [Google Scholar] [CrossRef] [Green Version]
- Pettitt, A.N. A Non-Parametric Approach to the Change-Point Problem. J. R. Stat. Soc. Ser. C (Appl. Stat.) 1979, 28, 126–135. [Google Scholar] [CrossRef]
- Wang, S.; Yan, Y.; Li, Y. Spatial and temporal variations of suspended sediment deposition in the alluvial reach of the upper Yellow River from 1952 to 2007. CATENA 2012, 92, 30–37. [Google Scholar] [CrossRef]
- Bernaola-Galvan, P.; Ivanov, P.C.; Amaral, L.A.N.; Stanley, H.E. Scale invariance in the nonstationarity of human heart rate. Phys. Rev. Lett. 2001, 87, 168105. [Google Scholar] [CrossRef] [PubMed]
- GuoLing, F.; ZhiQiang, G.; WenJie, D.; Jianpin, L. Abrupt climate change detection based on heuristic segmentation algorithm. Acta Phys. Sin. 2005, 54, 5494–5499. [Google Scholar]
- Hamed, K.H.; Rao, A.R. A modified Mann-Kendall trend test for autocorrelated data. J. Hydrol. 1998, 204, 182–196. [Google Scholar] [CrossRef]
- Li, L.J.; Zhang, L.; Wang, H.; Wang, J.; Yang, J.W.; Jiang, D.J.; Li, J.Y.; Qin, D.Y. Assessing the impact of climate variability and human activities on streamflow from the Wuding River basin in China. Hydrol. Process. 2007, 21, 3485–3491. [Google Scholar] [CrossRef] [Green Version]
- Jiao, J.Y.; Wang, Z.J.; Zhao, G.J.; Wang, W.Z.; Mu, X.M. Changes in sediment discharge in a sediment-rich region of the Yellow River from 1955 to 2010: Implications for further soil erosion control. J. Arid Land 2014, 6, 540–549. [Google Scholar] [CrossRef]
- Zhai, R.; Tao, F. Contributions of climate change and human activities to runoff change in seven typical catchments across China. Sci. Total. Environ. 2017, 605, 219–229. [Google Scholar] [CrossRef] [PubMed]
- Guo, S.L.; Sun, D.P.; Jiang, E.H.; Li, P. Equilibrium sediment transport in lower Yellow River during later sediment-retaining period of Xiaolangdi Reservoir. Water Sci. Eng. 2015, 8, 78–84. [Google Scholar] [CrossRef]
- Li, J. Effects of urban grass coverage on rainfall-induced runoff in Xi’an loess region in China. Water Sci. Eng. 2017, 10, 320–325. [Google Scholar] [CrossRef]
- Khosravinia, P.; Malekpour, A.; Hosseinzadehdalir, A.; Farsadizadeh, D. Effect of trapezoidal collars as a scour countermeasure around wing-wall abutments. Water Sci. Eng. 2018, 11, 53–60. [Google Scholar] [CrossRef]
- Yang, H.B.; Li, E.C.; Zhao, Y.; Liang, Q.H. Effect of water-sediment regulation and its impact on coastline and suspended sediment concentration in Yellow River Estuary. Water Sci. Eng. 2017, 10, 311–319. [Google Scholar] [CrossRef]
- Xu, Z.X.; Li, L.; Zhao, J. A distributed eco-hydrological model and its application. Water Sci. Eng. 2017, 10, 257–264. [Google Scholar] [CrossRef]
- Li, N.; Wang, L.; Zeng, C.; Wang, D.; Liu, D.; Wu, X. Variations of Runoff and Sediment Load in the Middle and Lower Reaches of the Yangtze River, China (1950–2013). PLoS ONE 2016, 11, e0160154. [Google Scholar] [CrossRef] [PubMed]
- Tian, P.; Mu, X.; Liu, J.; Hu, J.; Gu, C. Impacts of Climate Variability and Human Activities on the Changes of Runoff and Sediment Load in a Catchment of the Loess Plateau, China. Adv. Meteorol. 2016, 2016, 4724067. [Google Scholar] [CrossRef]
- Piao, S.; Ciais, P.; Huang, Y.; Shen, Z.; Peng, S.; Li, J.; Zhou, L.; Liu, H.; Ma, Y.; Ding, Y. The impacts of climate change on water resources and agriculture in China. Nature 2010, 467, 43–51. [Google Scholar] [CrossRef] [PubMed]
- Gao, P.; Mu, X.M.; Wang, F.; Li, R. Changes in streamflow and sediment discharge and the response to human activities in the middle reaches of the Yellow River. Hydrol. Earth Syst. Sci. Discuss. 2010, 7, 347–350. [Google Scholar] [CrossRef]
- Horowitz, A.J. A quarter century of declining suspended sediment fluxes in the Mississippi River and the effect of the 1993 flood. Hydrol. Process. 2010, 24, 13–34. [Google Scholar] [CrossRef]
- Huang, M.; Zhang, L. Hydrological responses to conservation practices in a catchment of the Loess Plateau, China. Hydrol. Process. 2004, 18, 1885–1898. [Google Scholar] [CrossRef]
- Miao, C.; Ni, J.; Borthwick, A.G.L.; Yang, L. A preliminary estimate of human and natural contributions to the changes in water discharge and sediment load in the Yellow River. Glob. Planet. Chang. 2011, 76, 196–205. [Google Scholar] [CrossRef] [Green Version]
- Wang, H.J.; Bi, N.S.; Saito, Y.; Yan, W.; Sun, X.X.; Jia, Z.; Yang, Z.S. Recent changes in sediment delivery by the Huanghe (Yellow River) to the sea: Causes and environmental implications in its estuary. J. Hydrol. 2010, 391, 302–313. [Google Scholar] [CrossRef]
- Wang, S.; Yan, M.; Yan, Y.; Shi, C.; Li, H. Contributions of climate change and human activities to the changes in runoff increment in different sections of the Yellow River. Quat. Int. 2012, 282, 66–77. [Google Scholar] [CrossRef]
- Wang, S.; Fu, B.; Piao, S.; Lü, Y.; Ciais, P.; Feng, X.; Wang, Y. Reduced sediment transport in the Yellow River due to anthropogenic changes. Nat. Geosci. 2015, 9, 38–41. [Google Scholar] [CrossRef] [Green Version]
- Zhang, X.; Li, P.; Li, D. Spatiotemporal Variations of Precipitation in the Southern Part of the Heihe River Basin (China), 1984–2014. Water 2018, 10, 410. [Google Scholar] [CrossRef]
- Fletcher, P.; Sangwine, S.J. The development of the quaternion wavelet transform. Signal Process. 2017, 136, 2–15. [Google Scholar] [CrossRef] [Green Version]
- He, B.; Miao, C.; Wen, S. Trend, abrupt change, and periodicity of streamflow in the mainstream of Yellow River. Environ. Monit. Assess. 2013, 185, 6187–6199. [Google Scholar] [CrossRef] [PubMed]
- Zheng, M.; Yang, J.; Qi, D.; Sun, L.; Cai, Q. Flow–sediment relationship as functions of spatial and temporal scales in hilly areas of the Chinese Loess Plateau. CATENA 2012, 98, 29–40. [Google Scholar] [CrossRef]
- Zuo, D.; Xu, Z.; Yao, W.; Jin, S.; Xiao, P.; Ran, D. Assessing the effects of changes in land use and climate on runoff and sediment yields from a watershed in the Loess Plateau of China. Sci. Total. Environ. 2016, 544, 238–250. [Google Scholar] [CrossRef] [PubMed]
- Yeniguen, K.; Guemues, V.; Bulut, H. Trends in streamflow of the Euphrates basin, Turkey. Proc. Inst. Civ. Eng. Water Manag. 2008, 161, 189–198. [Google Scholar] [CrossRef]
- Banasik, K.; Hejduk, L. Long-term Changes in Runoff from a Small Agricultural Catchment. Soil Water Res. 2012, 7, 64–72. [Google Scholar] [CrossRef]
- Walling, D.E. Human impact on land-ocean sediment transfer by the world’s rivers. Geomorphology 2006, 79, 192–216. [Google Scholar] [CrossRef]
Figure 1.
Study region and location of the hydrological stations.

Figure 2.
Single mutation point series without errors and moving average difference sequence.

Figure 3.
Detection results of different methods on single mutation point series without errors.

Figure 4.
Detection result of Mann–Kendall test on single mutation point series without errors.

Figure 5.
Detection results of different methods on multi-mutation points series without errors.

Figure 6.
The relationship between the test statistic value of each method and the mutation intensity of each change point.
Figure 6.
The relationship between the test statistic value of each method and the mutation intensity of each change point.

Figure 7.
Real part contour map of wavelet coefficients of sediment discharge at Tongguan station.

Figure 8.
The curves of wavelet variance of sediment discharge at Tongguan station.

Figure 9.
Detecting results of sediment discharge at Tongguan station.

Figure 10.
Abrupt change analysis for annual sediment discharge of six hydrological stations.


Table 1.
Information of the hydrological stations.
| Stations | Drainage | Longitude (E) | Latitude (N) | Controlled Area (km2) | Length of Data |
|---|---|---|---|---|---|
| Toudaoguai | mainstream of the Yellow River | 111°04′ | 40°15′ | 367,898 | 1964–2015 |
| Wenjiachuan | Kuye River | 110°45′ | 38°29′ | 8515 | 1960–2015 |
| Longmen | mainstream of the Yellow River | 110°35′ | 35°40′ | 497,552 | 1964–2015 |
| Hejin | Fenhe River | 110°48′ | 35°34′ | 39,728 | 1964–2015 |
| Huaxian | Weihe River | 109°46′ | 34°35′ | 106,498 | 1962–2015 |
| Tongguan | mainstream of the Yellow River | 110°18′ | 34°37′ | 682,166 | 1950–2015 |
Table 2.
Detection results of single mutation point series without errors.
| Methods | Tested Series | MAD | BG | OC | Pettitt | Mann–Kendall |
|---|---|---|---|---|---|---|
| Change points | 25 | 25 | 25 | 25 | 25 | No |
| Statistic value | 10 | 10 | 1.64 × 10⁹ | 5.55 × 10⁻¹³ | 625 | / |
Table 3.
Detecting results of multi-mutation points series without errors.
| Methods | Test Series | MAD | BG | OC | Pettitt | Mann–Kendall |
|---|---|---|---|---|---|---|
| Change point 1 | 15 | 15 | 15 | 15 | 15 | No |
| Statistic value 1 | 5 | 5 | 54.6 | 503.2 | 915 | / |
| Change point 2 | 28 | 28 | no | no | no | No |
| Statistic value 2 | 2 | 2 | / | / | / | / |
| Change point 3 | 43 | 43 | no | no | no | No |
| Statistic value 3 | 4 | 4 | / | / | / | / |
| Change point 4 | 59 | 59 | no | no | no | No |
| Statistic value 4 | 3 | 3 | / | / | / | / |
| Change point 5 | 76 | 76 | 76 | 76 | 76 | No |
| Statistic value 5 | 6 | 6 | 60.3 | 468.6 | 1037 | / |
Table 4.
Detection results of multi-mutation points series with errors.
| Methods | Tested Series | MAD | BG | OC | Pettitt | Mann–Kendall |
|---|---|---|---|---|---|---|
| Change point 1 | 15–16 | 15–16 | 15–16 | 15–16 | 17–18 | no |
| Statistic value 1 | 5 | 4.97 | 45 | 663 | 938 | / |
| Change point 2 | 28–29 | 28–29 | no | no | no | no |
| Statistic value 2 | 2 | 1.83 | / | / | / | / |
| Change point 3 | 43–44 | 45–46 | no | no | no | no |
| Statistic value 3 | 4 | 3.2 | / | / | / | / |
| Change point 4 | 59–60 | 59–60 | no | no | no | no |
| Statistic value 4 | 3 | 2.9 | / | / | / | / |
| Change point 5 | 76–77 | 76–77 | 76–77 | 76–77 | 76–77 | 85–86 |
| Statistic value 5 | 6 | 6.3 | 49.2 | 600 | 1006 | / |
Table 5.
Detecting results of sediment discharge of other stations.
| Stations | Abrupt Change | MAD | OC | Pettitt | BG | Mann–Kendall |
|---|---|---|---|---|---|---|
| Toudaoguai | Change point | 1986 | 1985 | 1986 | 1985 | 1985 |
| Statistic value | 0.76 | 13.77 | 561 | 29.44 | / | |
| Longmen | Change point 1 | 1979 | 1979 | 1979 | 1979 | No |
| Statistic value | 5.76 | 711.68 | 468 | 27.44 | / | |
| Change point 2 | 1996 | 1996 | 1996 | 1996 | No | |
| Statistic value | 4.31 | 840.43 | 591 | 29.05 | / | |
| Wenjiachuan | Change point 1 | 1979 | 1979 | 1979 | 1979 | No |
| Statistic value | 0.66 | 27.86 | 460 | 21.94 | / | |
| Change point 2 | 1996 | 1996 | 1996 | 1996 | No | |
| Statistic value | 0.69 | 26.76 | 663 | 29.83 | / | |
| Hejin | Change point 1 | 1979 | 1979 | No | 1979 | No |
| Statistic value | 0.24 | 0.77 | / | 26.08 | / | |
| Change point 2 | 1996 | No | 1996 | No | No | |
| Statistic value | 0.044 | / | 585 | / | / | |
| Huaxian | Change point 1 | 1979 | 1979 | No | No | No |
| Statistic value | 1.75 | 204.85 | / | / | / | |
| Change point 2 | 1996 | 1996 | 1996 | 1996 | No | |
| Statistic value | 1.48 | 204.34 | 503 | 23.96 | / | |
| Change point 3 | 2003 | No | No | 2003 | No | |
| Statistic value | 1.87 | / | / | 24.14 | / |
© 2018 by the authors. Licensee MDPI, Basel, Switzerland. This article is an open access article distributed under the terms and conditions of the Creative Commons Attribution (CC BY) license (http://creativecommons.org/licenses/by/4.0/).
Share and Cite
MDPI and ACS Style
Shen, D.; Bao, W.; Ni, P. A Method for Detecting Abrupt Change of Sediment Discharge in the Loess Plateau, China. Water 2018, 10, 1183. https://doi.org/10.3390/w10091183
AMA Style
Shen D, Bao W, Ni P. A Method for Detecting Abrupt Change of Sediment Discharge in the Loess Plateau, China. Water. 2018; 10(9):1183. https://doi.org/10.3390/w10091183
Chicago/Turabian StyleShen, Dandan, Weimin Bao, and Peng Ni. 2018. "A Method for Detecting Abrupt Change of Sediment Discharge in the Loess Plateau, China" Water 10, no. 9: 1183. https://doi.org/10.3390/w10091183
Note that from the first issue of 2016, this journal uses article numbers instead of page numbers. See further details here.