Hydrological Performance and Runoff Water Quality of Experimental Green Roofs
by
Grzegorz Pęczkowski
*, 
Tomasz Kowalczyk
,
Katarzyna Szawernoga
,
Wojciech Orzepowski
,
Romuald Żmuda
and
Ryszard Pokładek
Institute of Environmental Protection and Management, Wrocław University of Environmental and Life Sciences, Pl. Grunwaldzki 24, 50-363 Wrocław, Poland
*
Author to whom correspondence should be addressed.
Water 2018, 10(9), 1185; https://doi.org/10.3390/w10091185
Submission received: 30 July 2018
/
Revised: 29 August 2018
/
Accepted: 30 August 2018
/
Published: 4 September 2018
(This article belongs to the Special Issue Freshwater Quality as a Driver of Aquatic Ecosystem Health)
Abstract
:Within the scope of the conducted experiment the authors analysed the efficiency of runoff reduction by the system of extensive type green roofs. The observations were based on storm events in the area of Lower Silesia at the Agro and Hydrometeorology Station Wrocław-Swojec. The authors analysed the thickness of plant substrate, and also estimated the quality of runoff waters under the conditions of periodic atmospheric deposition. Also considered were such indicators as electrolytic conductivity, N, NO3−, NO2−, NH4+, P, PO43−. The experiment included roof substrates designed in two variants, with known hydraulic and physical properties of the soil material. The analysis was performed for models with vegetation layer based on pumice and zelolite, covered with five plant species from the sedum family. The modelling of the hydraulic properties was conducted with variably saturated medium, using the Hydrus 1D software. The performance of systems with primary layer thickness of 11 cm and 9, 8, 7, 6 and 5 cm was estimated. The designed models reduced the average peak flows to 89%, and in addition they caused a delay in the initiation of the runoff which was dependent on the intensity and distribution of rainfalls in time, and on the initial moisture of the profiles. Simulations, performed for variable substrate thickness, permit the conclusion that in the case of thin-layer profiles (5 cm), the relative retention index was decidedly lower and amounted to 35.9% for the substrate with zeolite (originally 60.6%) and 41% for the substrate with pumice (originally 65.7%). In the case of total nitrogen and phosphates, statistical analysis revealed significant differences (p < 0.05) in relation to specific concentrations in the rainwater and in the control surface. The total nitrogen in the runoff from the green roof was nearly twice as high as that in the rainwater and amounted to, on average, 8.3 mg L−1.
1. Introduction
The change of natural hydrological conditions due to the rapid urbanisation may have a strong impact on the amount and quality of outflows to systems. The fundamental problem in this case will be a multiple increase of runoff from impermeable surfaces compared to the biological surface, and hence the control of storm water runoff is of key importance for the limitation of the effect of urbanisation on water cycle in these conditions, and it will also be one of the adaptation strategies of cities to climate change [1,2,3,4,5]. Various practices are known, consisting in the management of the runoff of rain waters, including all forms of recreation of green areas, restoring to a varying degree the hydrological properties of areas [6,7,8]. The design of green roofs and the use of the unique abilities for e.g., reduction of runoff are of special importance in addressing the problems of progressing urbanisation, as their use is not restricted by the availability of space, and their construction on newly designed, and existing buildings may mean the utilisation of as much as 40% of non-permeable surfaces in urban areas [9,10,11,12,13,14].
Due to their buffering properties, green roof systems, compared to conventional roofs, allow significant attenuation and delay of peak flows, and depending on the hydraulic properties and the thickness of the vegetation layer, such delays may be 10 min and more [9]. Numerous studies have been devoted to the estimation of the effect of the individual components of the system, such as the vegetation layer, plant species or the drainage layer, on the effectiveness of green roofs in the reduction of total rainfall volume and flow intensity. The values obtained, at the level of 40–90% depending on layer depth, type of system or the moisture of the substrate, confirm the high effectiveness of systems of this type [11,15,16,17,18,19,20,21,22,23,24,25].
The construction of green roofs of the extensive type, the design of which includes small thickness of the vegetation layer, on the one hand allows their use on existing buildings, the structure of which does not provide sufficient load carrying capacity, but on the other such roofs are characterised by a lower effectiveness in terms of their ability of water retention and reduction of flow rates. Studies conducted in Germany showed that the intensive and extensive systems reduced the runoff in a broad range, of 65–85% and 27–81% of the annual flow, respectively [26]. Those results find support in other studies, conducted by e.g., Berndtsson [9], Wang et al. [23], Speak et al. [27]. It should be emphasised that the degree of the reduction is varied and depends on the conditions occurring in a given experiment.
The effect of the depth of the substrate on the delay and reduction of rainwater outflow can be estimated on the basis of model solutions for the same soil and meteorological conditions. Currently, mathematic models are available that permit the estimation of the hydrological properties of green roof systems, taking into account the volume and reduction of runoff, such as the EPA (Environmental Protection Agency), Storm Management Model SWMM, SWMS-2D, Hydrus-1D. SWMM EPA with LID (Low Impact Development Systems) module can be used to simulate a hydrological response on a small scale as well as the municipal catchment. Modeling results confirm the role of LID solutions in restoring the critical components of the natural flow regime at the urban catchment scale—the peak flow reduction, the volume reduction and the delay [28,29,30]. Literature studies showed very promising results, such as that HYDRUS 1D allows modelling of the hydrolics of green roofs by assumption that water flow through the substrate profile is one dimensional (vertical). Furthermore, has also been used in studies investigating many other similar hydrological cases [16]. Considering progress of urbanisation, green roof systems allow managing not only the quantity but also the quality of the outflow, which may in many cases improve the quality indicators of runoff [31]. In this study, the authors analysed the efficiency of green roof systems based on experimental green roofs models. The experiment included roof substrates designed in two variants. The first was on based on pumice, the second one was based on zeolite. The main assumption of the work was to calibrate the model of the Hydrus 1D for the experimental solutions adopted. The calibrated model revealed the effectiveness of the models—outflow and range of reduction the peak of runoff rate at the assumed thickness of the substrate layers 11, 9, 8, 7, 6, 5 cm.
2. Material and Methods
2.1. Experimental Model
The experiment included two models of green roofs of the extensive type, with different composition of the substrate layer. The functionality of the applied solutions was tested on experimental green roofs, under the local climate conditions of the city of Wrocław (51°11’ N, 17°14’ E), Poland, Europe. The designed models, based on a metal structure with dimensions of 1000 × 2000 mm, were situated at a height of 1 m above ground level and the roof slope was 3°. At the same height, and in the immediate vicinity of the models, an automatic pluviometer and a laser disdrometer (Laser Precipitation Monitor, model 5.4110.10.xxx, Thies Clima, Adolf Thies GmbH, Göttingen, Germany) were also installed. The experimental green roof model (Figure 1), with total thickness of the layers amounting to 12 cm, was composed of a vegetation layer and a geotextile layer preventing the migration of soil particles into the receiver. Its structure included also a drainage layer of gravel of 1 cm fraction and an absorptive-protective geotextile layer (Optigreen Separation Protection and Storage Fleece, model RMS 300, synthetic fibre—produced by Optigrün International AG, material PP/PES/regenerated acrylic fibers, Krauchenwies-Göggingen, Germany). The protection mat was able to retain 2 L m−2 water. In both cases the thickness of the drainage layer was 2 cm. The substrate material was prepared on the basis of horticultural soil (65% v/v) with pH 6.5–7, fraction of fine and medium sand (15% v/v), zeolite of fraction of 3–5 mm (20% v/v). The second model, based on pumice contains 68% v/v horticultural soil, fraction fine and medium sand (20% v/v) and pumice fraction 3–6 mm (12% v/v). To ensure thermal insulation of the profiles, in the lower horizontal plane of the structure, a layer of polystyrene foam was installed, with 5 cm thickness (extruded polystyrene XPS, Austrotherm Uniplatte model, Austrotherm GmbH, Oswiecim, Poland). It should be emphasised that, depending on the region and available components, it can be modified within a rather broad range. The vegetation layer should be characterised by parameters related with an improvement of the retention properties, but also of the hydrological function of the system and stability of the layer layout, preventing scaling.
Basic physical and water properties of experimental surfaces are included in Table 1. The retention properties of the substrates, based on zeolite and pumice, were determined on the basis of characterisation of water retention. Measurements of soil water retention in the range from pF 0 to pF 2.0 were made in the laboratory (pF = ), using a system equipped with a multi-channel gauge type TDR/mux (Institute of Agrophysics PAS, Lublin) and a probe for the measurement of pressure and moisture. In the range above pF 2.0, by means of the membrane apparatus Eikelkamp.
The retention of the experimental areas was determined by means of retention (RPI) and index in relation to precipitation (RPIratio). In Equations (1) and (2), runoff GR is determined—runoff from the experimental area and P—atmospheric precipitation.
The vegetation layer was sown with species of Sedum, from the family Crassulaceae: Sedum spurium ‘Fuldaglut’, Sedum sexangulare, Sedum telephium, Sedum floriferum ‘Weihenstephaner Gold’. The choice of the plant species resulted from the thickness of layers of the extensive-type model and the type of care, in particular maintenance-free roof. In addition, in periods of long-lasting atmospheric drought, plants from the species Sedum usually do not require additional treatments such as irrigation [32].
2.2. Data Collection-Runoff and Water Quality
The period of the experiment started on 1 April and ended on 31 October 2017; in this time all rainfall events were recorded. Throughout the cycle, the humidity and the runoff from the discussed areas were measured in real time. The humidity measurement was performed with a multi-channel TDR/mux meter which allowed data acquisition with an interval of 30 s. The accuracy of water content measurement in the sensor substrate was ±0.02 cm3·cm−3 and ±0.03 cm3·cm−3. Measurements of runoff volume were made using a system based on a tipping trough and Hobo UX120 pulse loggers (Hobo UX120-006M Analog Data Logger model, Onset Computer Corporation, Bourne, MA, USA). One measurement impulse in the case of two experimental green roofs corresponded to a runoff to 0.01 mm·min−1. The installed laser precipitation enabled continuous rainfall measurements with a minimum intensity of 0.005 mm·h−1 and a minimum particle size of 0.16 mm (Laser Precipitation Monitor, model 5.4110.10.xxx, Thies Clima, Adolf Thies GmbH, Göttingen, Germany). In this case, the LNM View software was used to collect data. The paper presents data related to events where the total precipitation was higher than 10 mm.
In the analysis of the concentration indicators the following methodology was adopted: Nitrate nitrogen, nitrite nitrogen, and ammonium nitrogen were assayed with a spectrophotometric method (PN-82C-04576-4, PN-EN 26777:1999, PN-ISO 7150:2002), and phosphates T-P and PO43− with the molybdate method with tin chloride (PN-EN 1189-2000). The data concerning water quality were based on an analysis of rainfall events for the analysed objects. It is a frequently encountered assumption to indicate an improvement of the quality of waters discharged from green roofs due to the retention of rain waters with the participation of plants, and thus reducing the outflow, and in consequence a reduction of the load of potential contaminants accumulated via the wet and dry atmospheric deposition. For selected rainfall events 6 independent attempts were taken. Samples of the runoff were collected from the experimental surfaces and the control surface, as well as from the precipitation. Data were compared with t-tests. Statistical t-tests were carried out for independent samples, comparing quality indicators in runoff coming from green areas, and also in rainwater and the control surface. Two hypotheses were put forward, null hypothesis H0: That average values of quality indicators in waters from green areas were the same as in rainwater or control area. The second hypothesis was H1: The average values of quality indicators from waters from runoff vary between the green area and the rainwater or the control surface. The significance level of 5% was assumed. The conclusion about equality of averages was preceded by Lavene’s tests about homogeneity of variance.
2.3. Modelling of the Runoff
Simulation of the processes of water movement in the profiles of the green roof was conducted using the software Hydrus 1D, based on the Richards equation, both in the saturated and unsaturated zone, in mono-dimensional Equation (3). Hydrus 1D allows simplified simulation assuming one-dimensional flow direction. Its use can be considered acceptable in the case of thin-layer green roof profiles. The van Genuchten-Mualem model with homogeneous pore size distribution was adopted, with the assumption of conceptualisation of the physical profile of flow as a single region. The hysteresis effect was ignored, because in this case the variant without hysteresis gives the expected results [33].
where: θ means volumetric water content [L3·L−3], K is unsaturated hydraulic conductivity [L·T−1] and S is unit uptake of water by the plants [L3·L−3·T−1]. In addition, it was assumed that the gaseous phase plays a negligible role in the flow of fluid, and the effect of temperature gradients on the flow in a porous medium was also neglected. The analytical description of the retention capacity and hydraulic properties of the soil was made with the use of the van Genuchten-Mualem Equation (4), in the following form [34,35].
where: θr and θs are the residual and saturated moisture [L3·L−3], Se effective saturation (5), parameter in the function of saturation [L−1], m—parameter in the soil water retention function, n—exponent in the soil water retention function, Ks—hydraulic conductivity of soil at the state of full saturation [L·T−1].
The modelled vertical profiles are discretised using 100 elements, taking into account the unsaturated function of hydraulic conductivity (6). The boundary conditions at the boundary of the soil and the atmosphere can change from an unsaturated value to full soil saturation, and depend on hydrological processes (infiltration and evapotranspiration, and atmospheric precipitation, and in consequence) on the moisture and the soil substrate (7). Evapotranspiration was included because in some cases the simulation was started before rainfall, with initial humidity.
In the model, the evapotranspiration was calculated by means of the Penman-Monteith formula (recommended by FAO).
where is the matrix suction of the soil [L], while on the lower boundary the boundary conditions change from the state of zero flux for unsaturated soil conditions to the state of zero pressure for saturated soil conditions and in consequence free outflow is realized (8).
Solving Equations (4) and (6) requires the determination of the parameters θr, θs, α, n, that depend primarily on the kind of substrate. In this case the values of the parameters were determined in laboratory conditions (Ks, θs), or adopted and calculated (θr, α, n) [34]. Ks was measured in several replicates in laboratory conditions. Parameters used in the model are given in Table 2.
The common set of parameters, α, n, Ks ensures acceptable performance for all identified events. The experimental model of green roof was calibrated and validated by comparison the predicted and measured runoff. The model was calibrated for 28 July 2017 data. Initially substrates were tested to determine the moisture content, which was very important to obtain the correct stability of the model. The initial water content before the occurrence of subsequent events was determined by means of humidity sensors and TDR technique (time domain reflectometry—details are included in Methods part of this section), with a measurement interval of 30 s. In each analysed case, the vegetation cover factor of the experimental models was included. The model’s performance was evaluated statistically based on Nash and Sutcliffe (NSE) performance and also mean error (ME). Calculated Nash-Sutcliffe performance could be from −∞ to 1. NSE = 1 corresponds to a perfect match, when NSE = 0 model predictions was as accurate as the average observed. Mean error (ME) was applied to define the maximum differences between the observed and calculated values. Using the described and validated model, runoff simulations were conducted, with varying depth of the substrate layers thicknesses of 9, 8, 7, 6 and 5 cm.
3. Results and Discussion
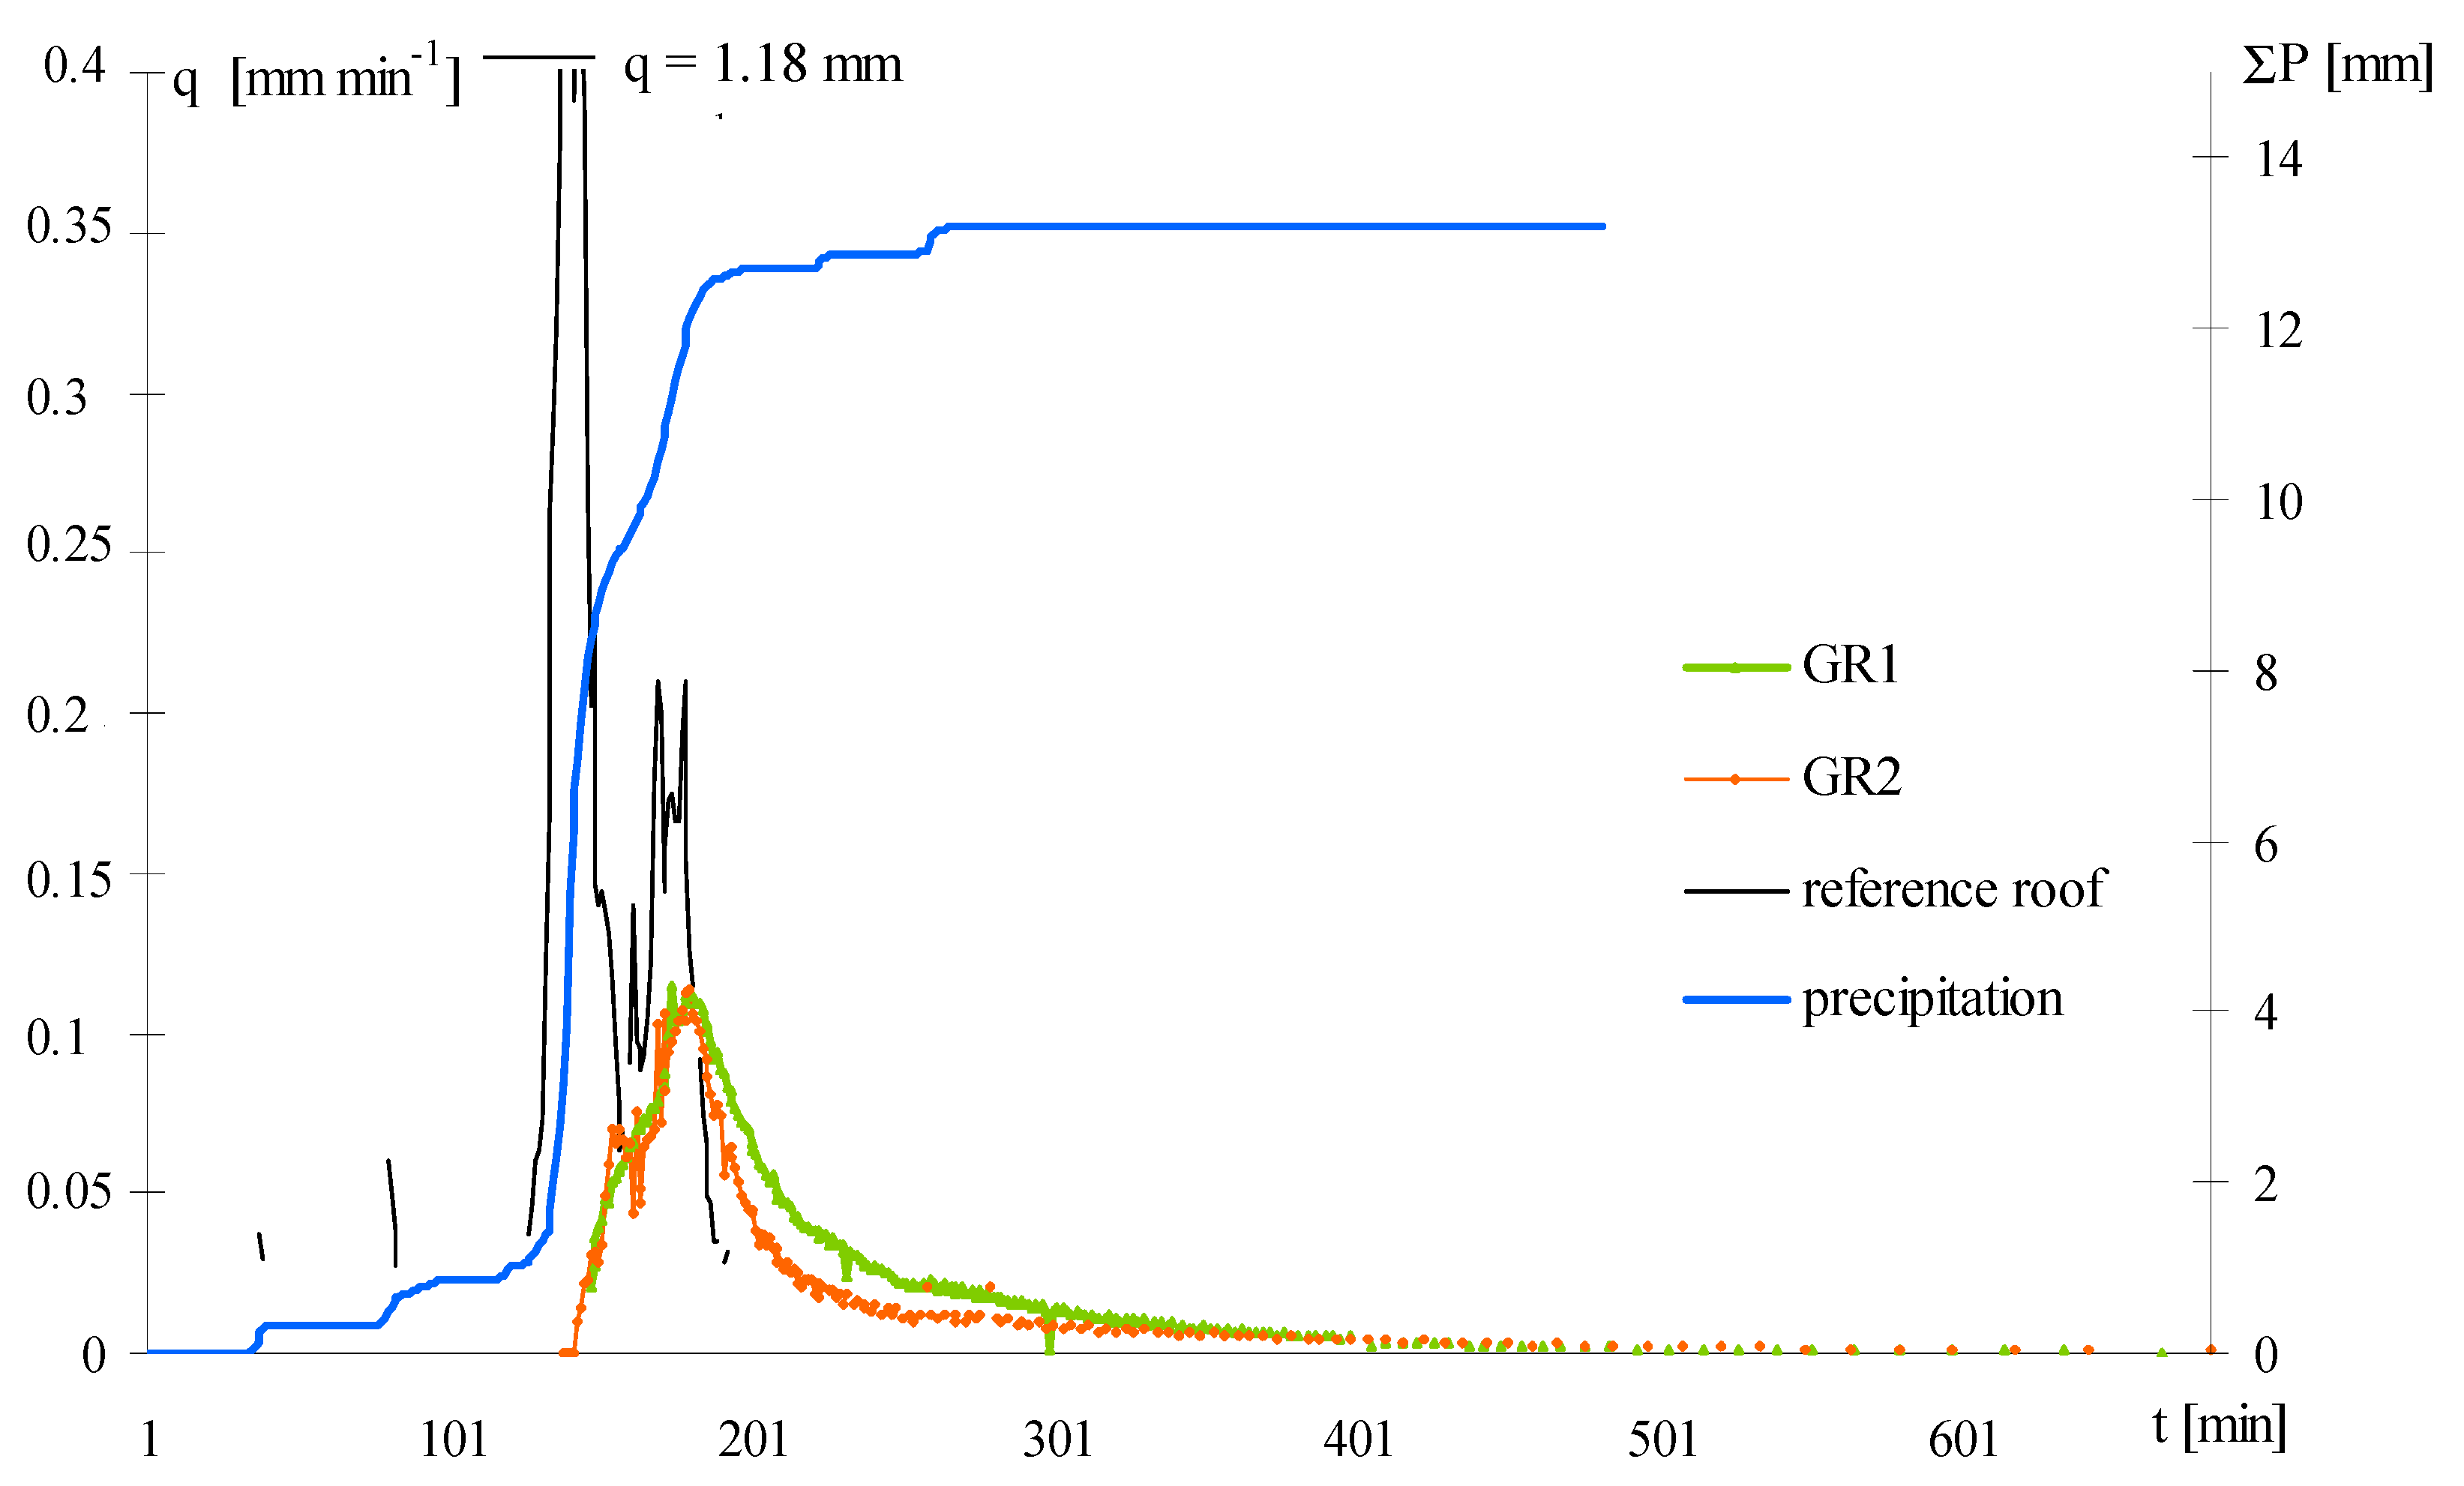
For the analysis of properties of the green roof systems, 17 rainfall events from 2017 were selected, with amounts greater than 10 mm and intensity varying from 0.12 to 5.7 mm·min−1. In relation to the conducted study, the analysis revealed that in both cases the discharge was initiated every time, but the delay period and the retention of runoff in the profiles depended significantly on the initial moisture of the vegetation layer and on the rainfall intensity. For example, for a total rainfall of 11 mm and with intensity not exceeding 0.19 mm·min−1 the green roofs designed on the base of zeolite and pumice retained 81 and 89.6%, respectively, while a similar event but with a considerable intensity, attaining up to 4.97 mm·min−1 but short-lasting (46 min), in the amount of 31 mm, caused runoff retention at the level of 74.6 and 89.7%, respectively. In the remaining period, the initial substrate moisture at the level of 36% and above and an event with intensity of 1.55 mm·min−1 caused a reduction of the retention performance indicator relative to rainfall to 32.8% (Table 3). In every case the models reduced the mean peak discharge performance indicator values to even 89%. Apart from the relatively significant runoff retention, the analysed surfaces delayed the start of discharge. Detailed analysis of the event of the 28 July 2017, showed that discharge was initiated in the 144th and 142nd minute, respectively. Such a considerable delay was caused by a mean rainfall intensity at the level of 0.02 mm·min−1 during the initial 120 min (Figure 2).
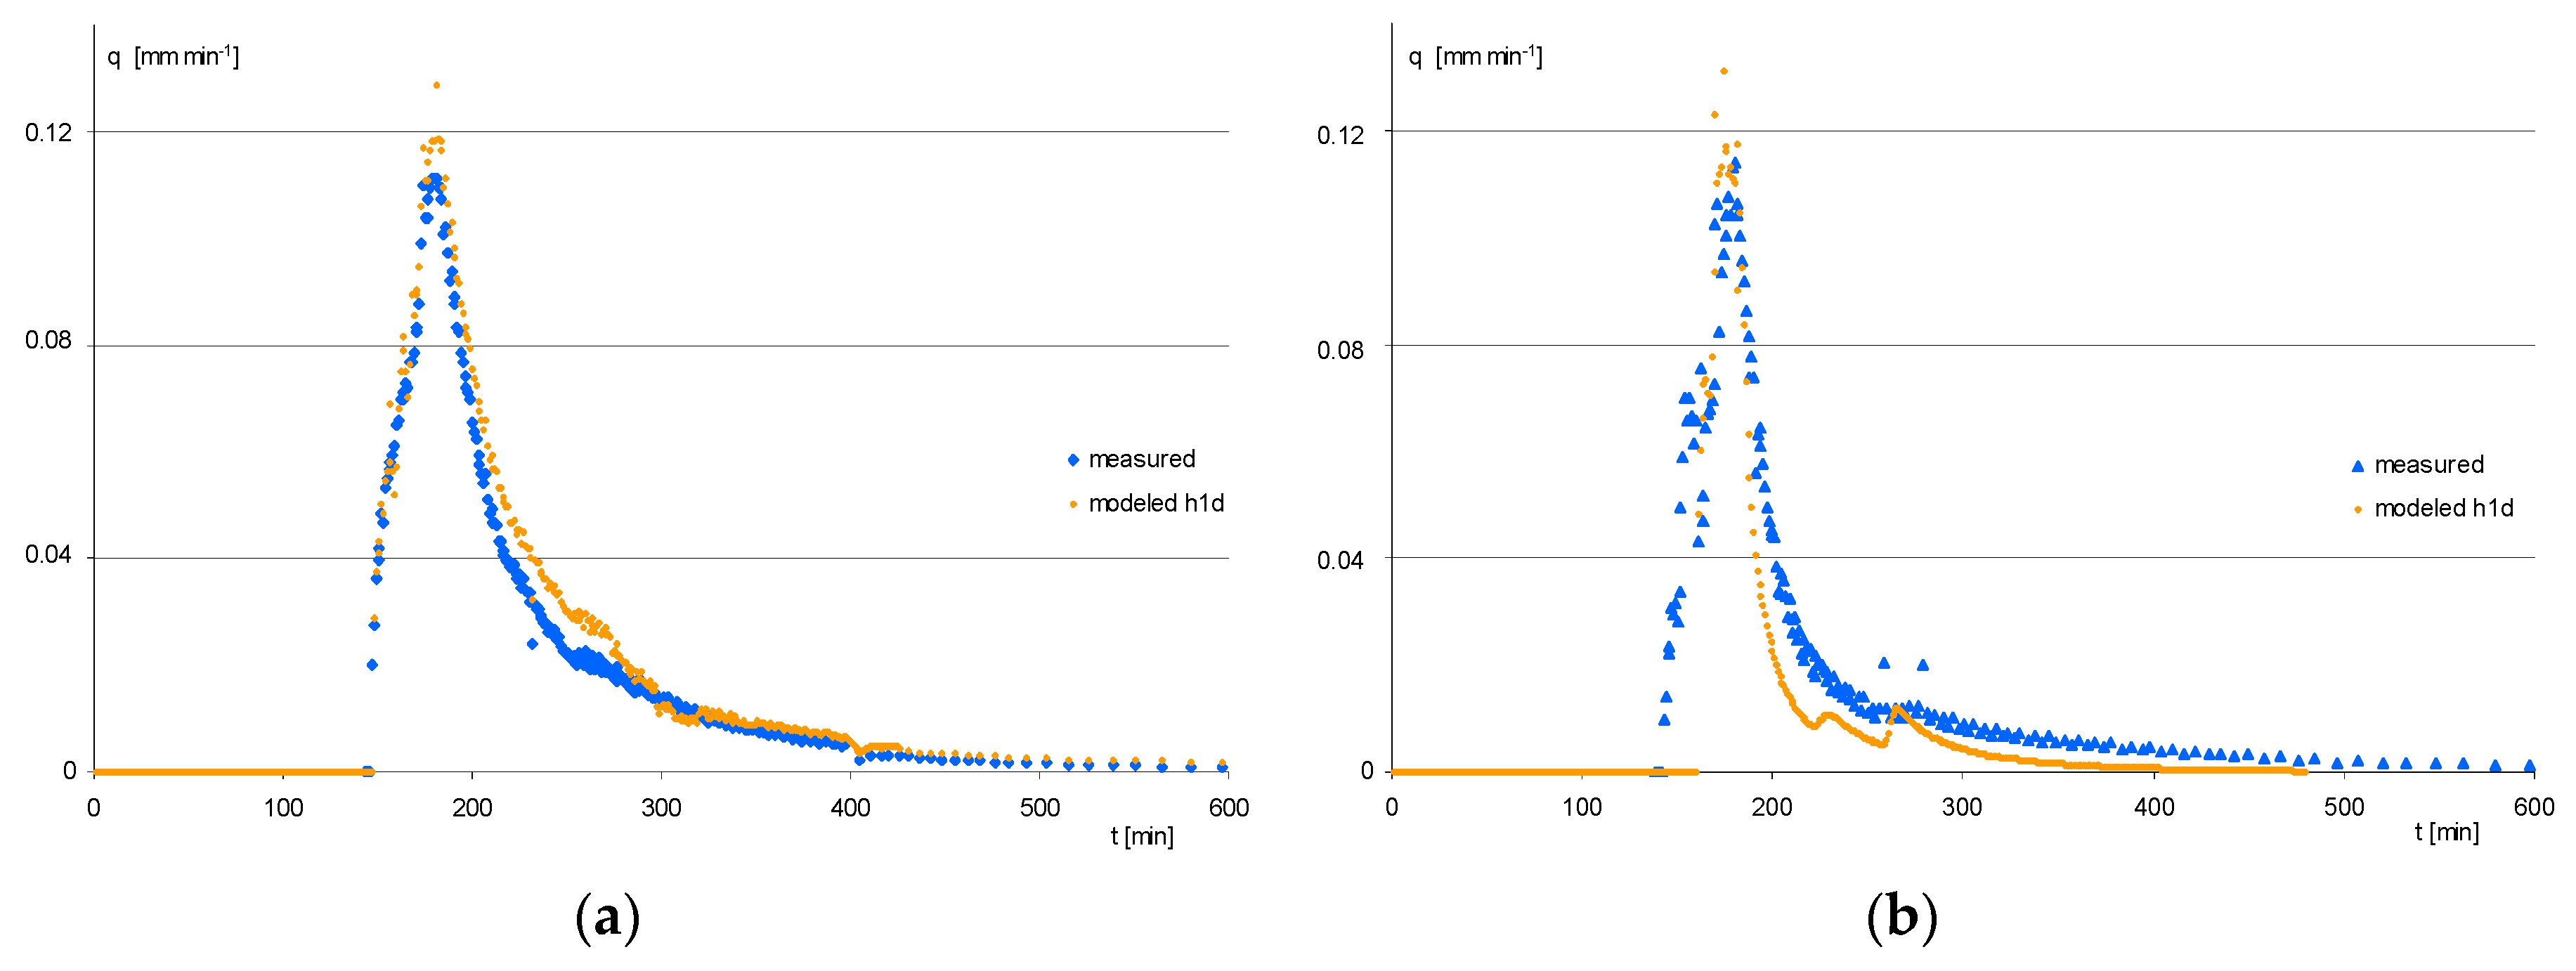
Taking into account the necessary parameters allowing (e.g., the calculation of evapotranspiration and actual precipitation), and the values characterising the hydraulic properties of the soil substrates, the program Hydrus 1D was used for the simulation of runoff intensity and moisture for all analysed events. For example, on the basis of the simulation of runoff intensity for the event of the 28 July 2017 (Figure 3), a fairly good fit of the data from observations to the modelled data was obtained.
For the event of the 28th of July used to calibrate the model, the maximum error (ME) was 0.18 mm·min−1 (GR1) and 0.07 (GR2), while the calculated statistics describing the relative value of residual variance, the Nash-Sutcliffe efficiency (NSE), assumed values at the level from 0.93 (GR1) to 0.58 (GR2). A simulation can be accepted as satisfactory when NSE > 0.5 (higher model accuracy for NSE values close to 1) [36]. The calculated NSE and ME values for validation are presented in the Table 4. During the validation, the models designed as zeolite and pumice-based displayed good representation of flow volume and intensity, accurately simulating events observed in other periods. It can, therefore, be concluded that in both cases the level of matching achieved was close to good [37].
The program has a slight tendency to overestimate the values of simulated runoff, and we can suppose that this is related with the simulation being based on hydraulic parameters of unnatural formations, substrates that are a mixture of the basic component—horticultural soil, and additives with an effect on the retention characteristics. However, in the case of the experiment presented here that overestimation mentioned above was small. In the case of analysis of events monitored in the same hydrological conditions with runoff intensity above 1 mm·min-1 the simulation results obtained indicated good fit to measured data.
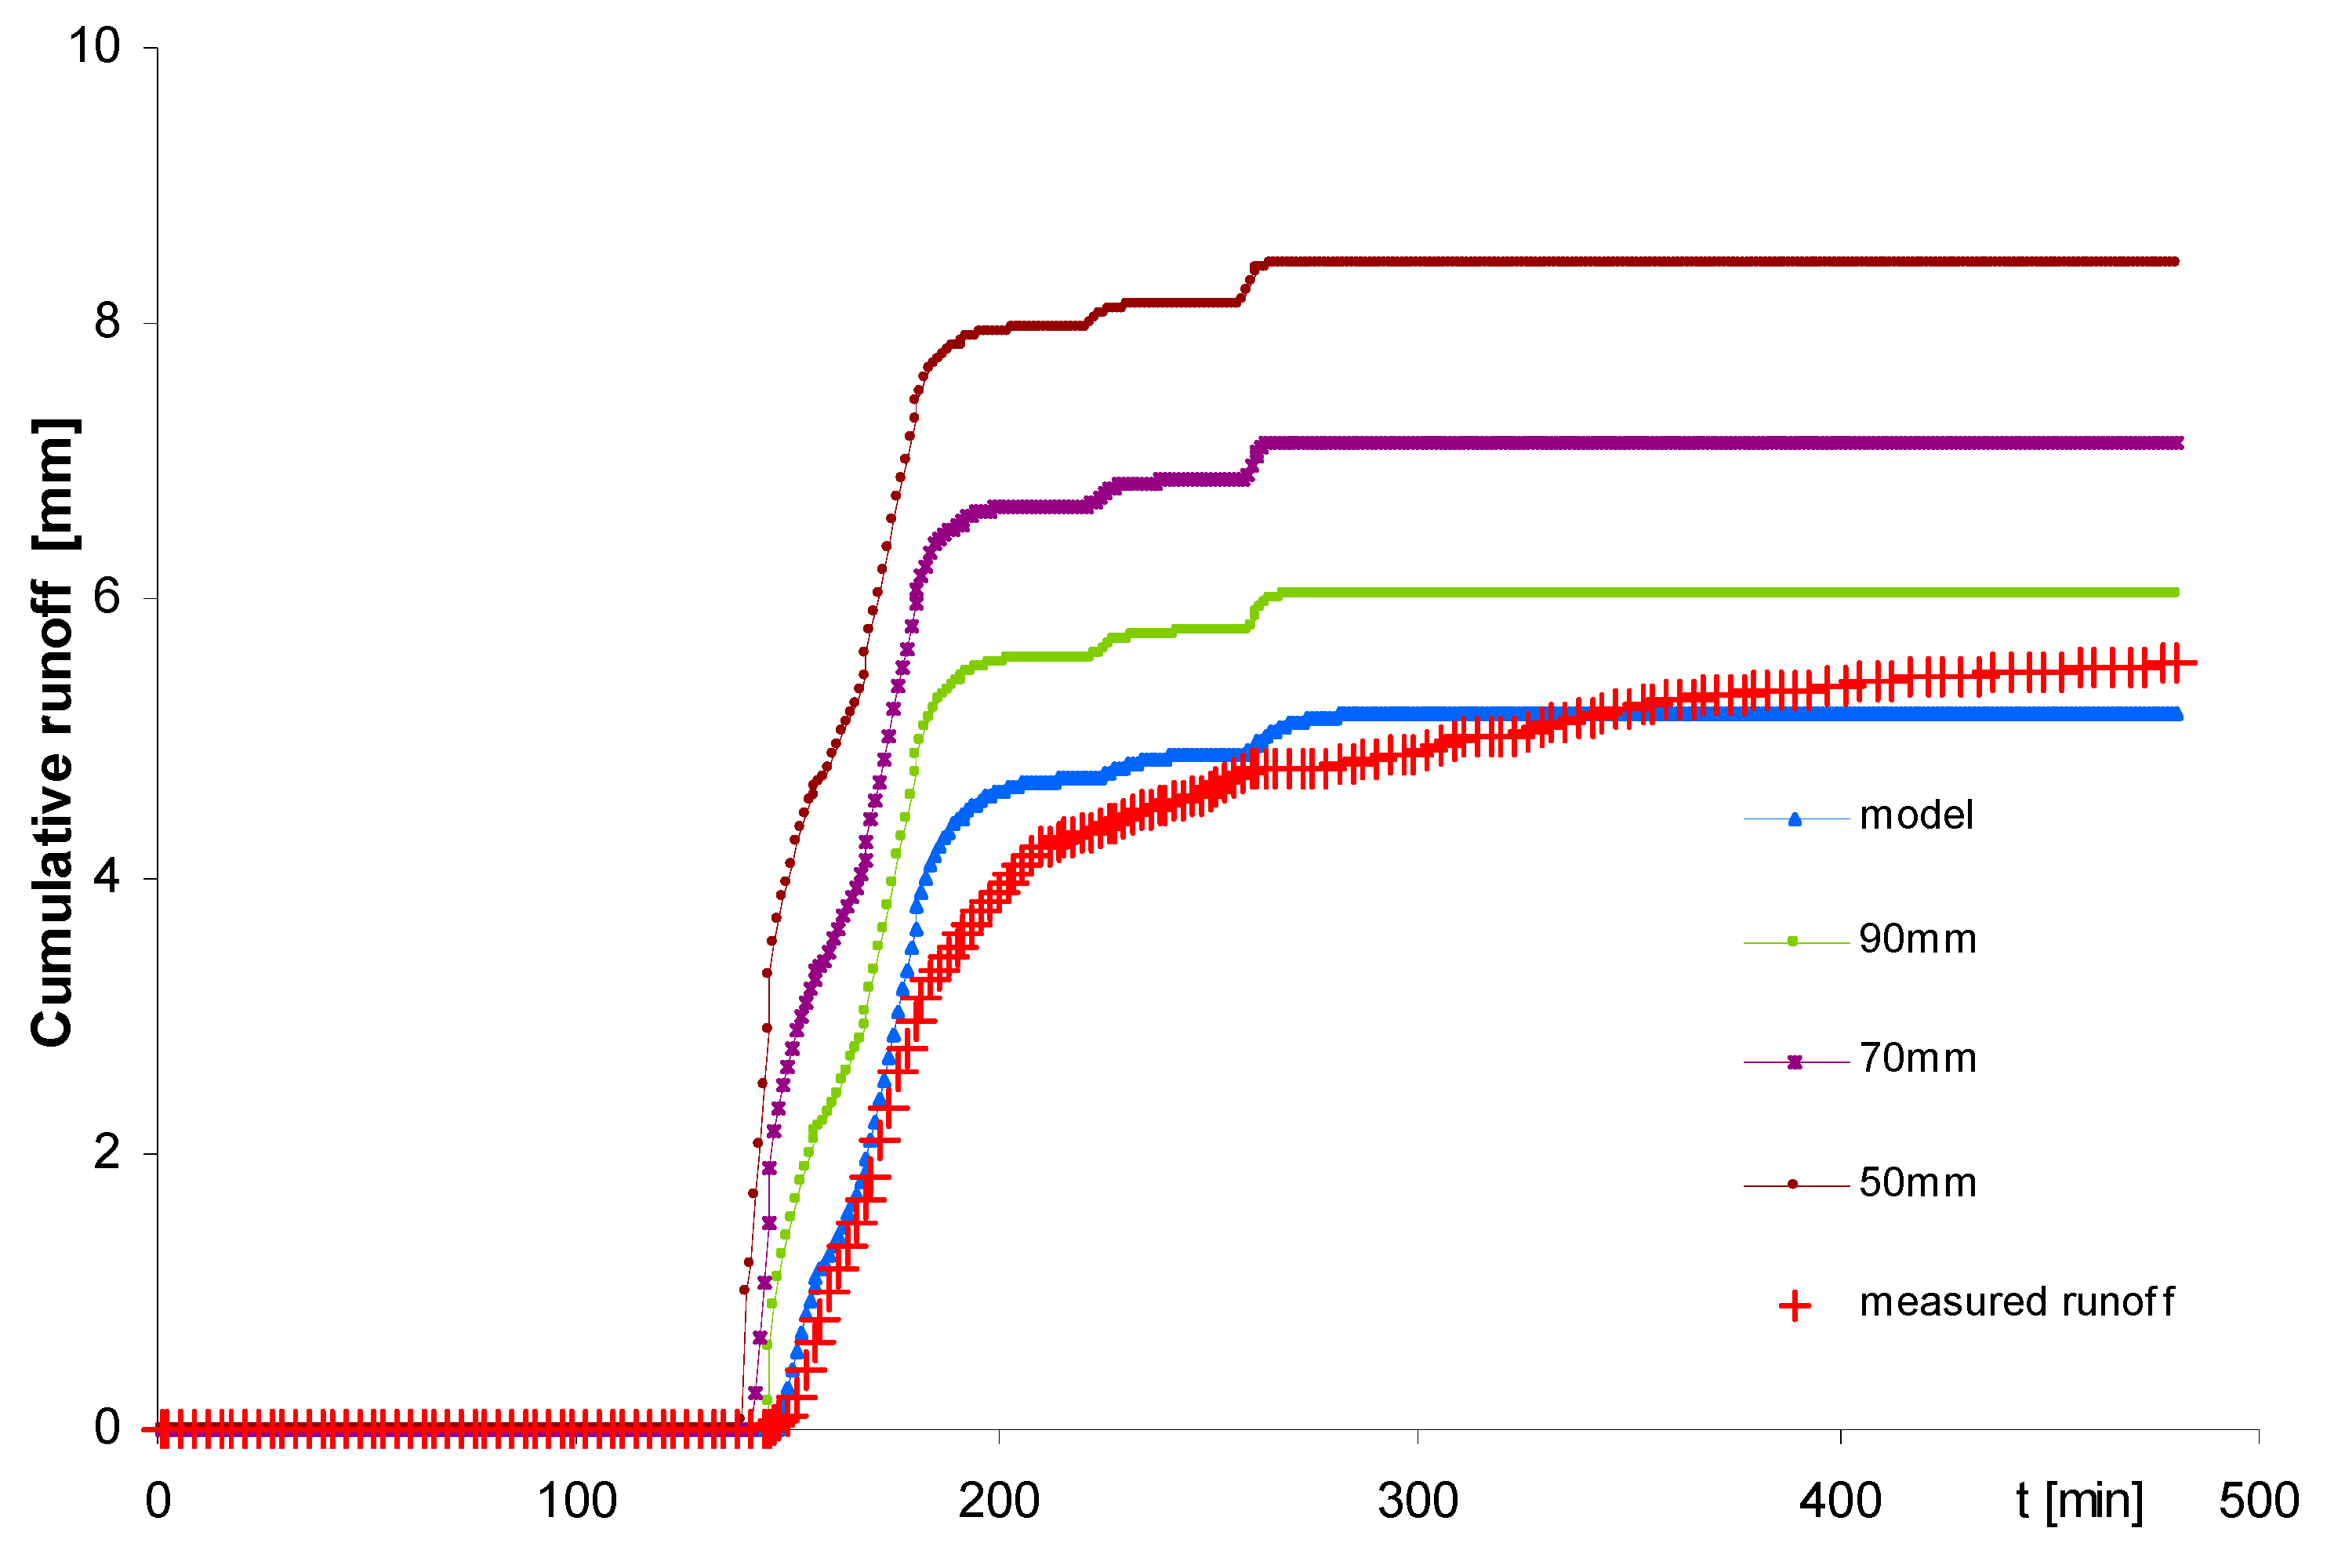
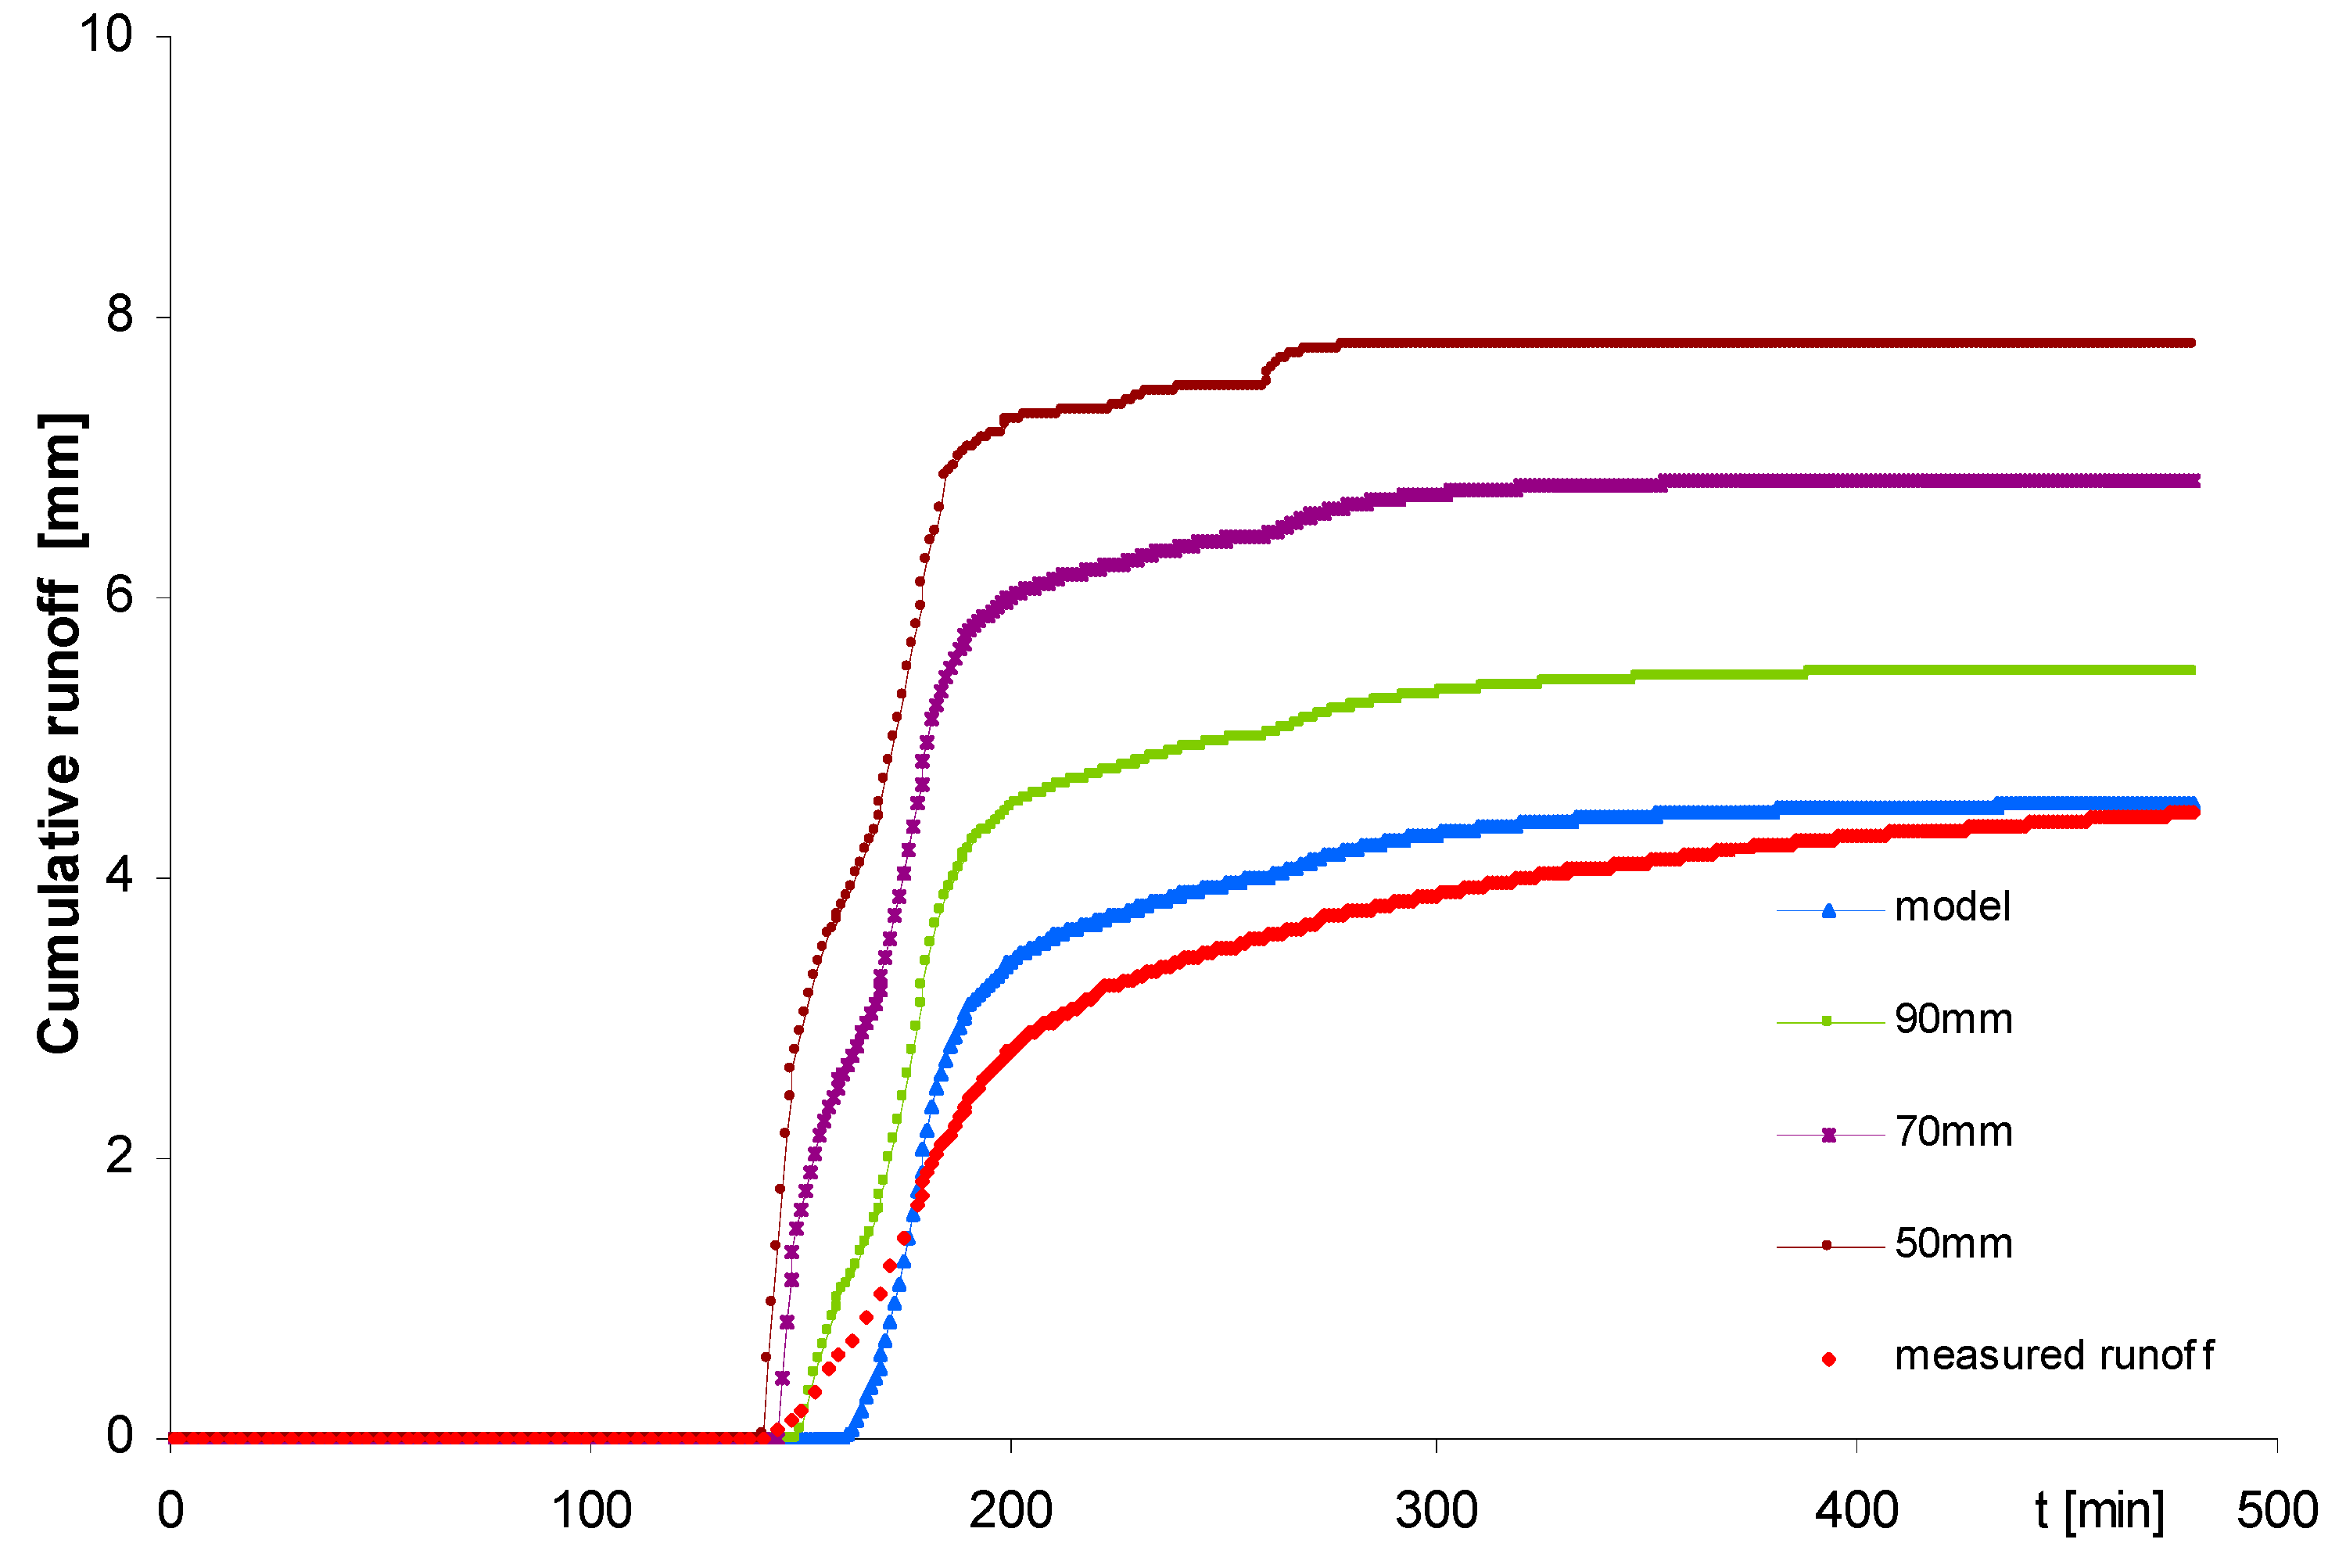
The results of the validation procedure for all rainfall events using calculated NSE and ME confirm the suitability of the model for runoff simulation. Using the described and validated model, runoff simulations were conducted for the same hydraulic conditions, but with varying depths of the substrate layers. For the modelled surfaces GR1 and GR2 the observed and modelled cumulative runoff on 28 July 2017 was obtained at levels of 5.5 mm and 5.1 mm (GR1), and 4.4 mm and 4.5 mm (GR2), respectively. In the case of simulations for layers with thickness of 9, 7 and 5 cm, the value of the runoff was higher by respectively 17%, 34%, and 42%, compared to the experimental model with a layer of 11 cm (Figure 4 and Figure 5)
At the same time, the analysis showed that the range of reduction of the peak of runoff intensity in the case of the modelled layers (9, 7 and 5 cm) was the smallest for the 5 cm layer for the surface with zeolite (GR1), amounting to 0.83 mm·min−1 and for that with pumice (GR2)—to 0.67 mm·min−1, the reference flow being 1.18 mm·min−1. In this case, the relative retention performance indicator to atmospheric precipitation (RPIratio) calculated from Equation (2) for the analysed surfaces was initially 60.6 and 65.7%, and the RPI retention effectiveness was 8.0 and 8.7 mm (1), while for the reduced layers of the systems with zeolite and pumice—359 and 41%, and 4.7 and 5.4 mm (RPI).
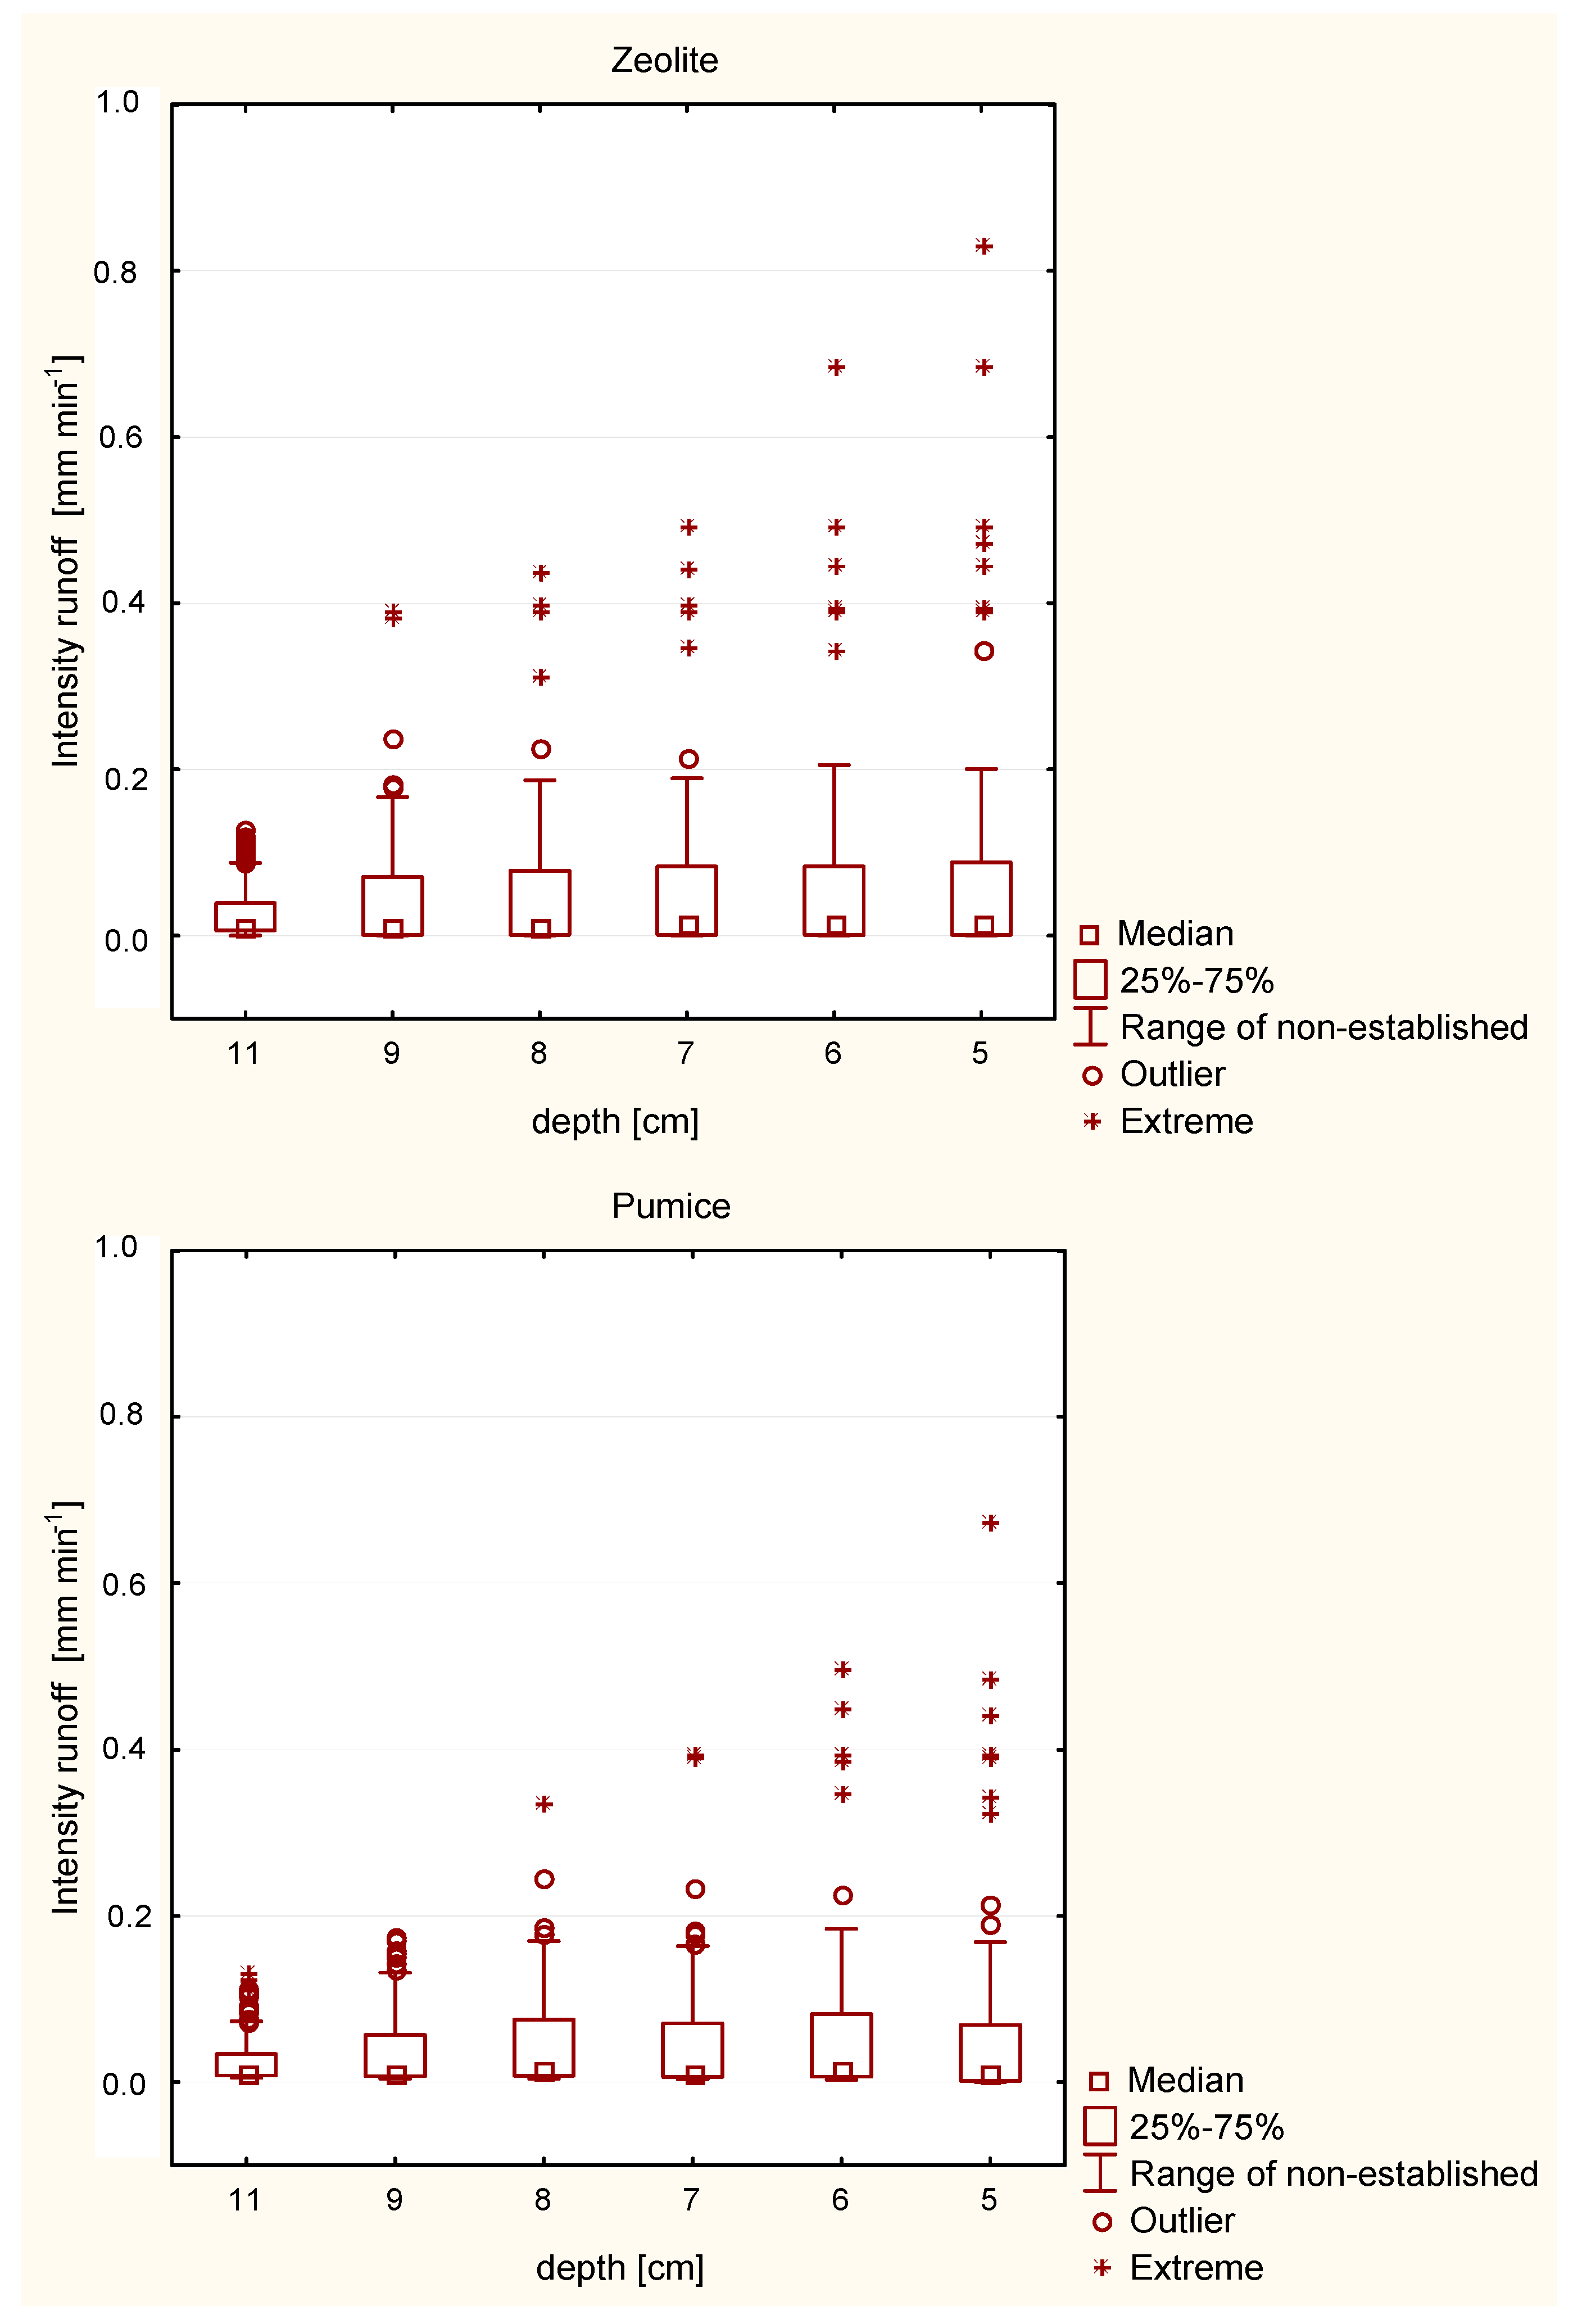
On the basis of the literature of the subject one can state that the retention capacity of systems increases with increase of the thickness of substrate layers. A study by Liesecke demonstrated that with substrate thickness of 4 cm a green roof retained up to 45% of the annual runoff, while with substrate thickness increase to 10–15 cm a relatively small increase of retention took place, up to about 60% [38]. Scholz demonstrated that with a 6 cm substrate layer is it possible to retain 50% of rainwater, and with 11 cm nearly 92% [39]. Whereas, Fassman and Voyde, on the basis of measurements in profiles of 50 and 70 mm, did not find any significant differences in the retention of precipitation waters [22,40]. Other studies, that considered not only the thickness of substrates, but also the physical properties of the substrates, showed a significant effect of the latter on increasing the capacity for water retention [16,27]. Generally, with increase of substrate thickness there was an increase in the retention capacity of profiles [17,41]. Additionally, statistical analysis for the designed models revealed that in both cases we are dealing with an asymmetrical distribution of runoffs, and for each of them the small thicknesses of the substrate generated extreme intensity runoff, beyond the range of mean values. They are therefore characterised by a larger spread of data. For example, on 28 July 2017, for the 5 cm thickness of zeolite based substrate, the maximum modelled values of runoff intensity were 0.83 mm min−1, and for an experimental roof with a thickness of 11 cm only 0.13 mm min−1. Respectfully, for the pumice based surface 0.67 and 0.13 mm, min−1. In both cases, for the minimum substrate thickness, six extreme values were observed, calculated as the sum of the third quartile, and the product of the quartile range and the number 3, were observed. For each observed event, similar results were obtained using the model (Figure 6).
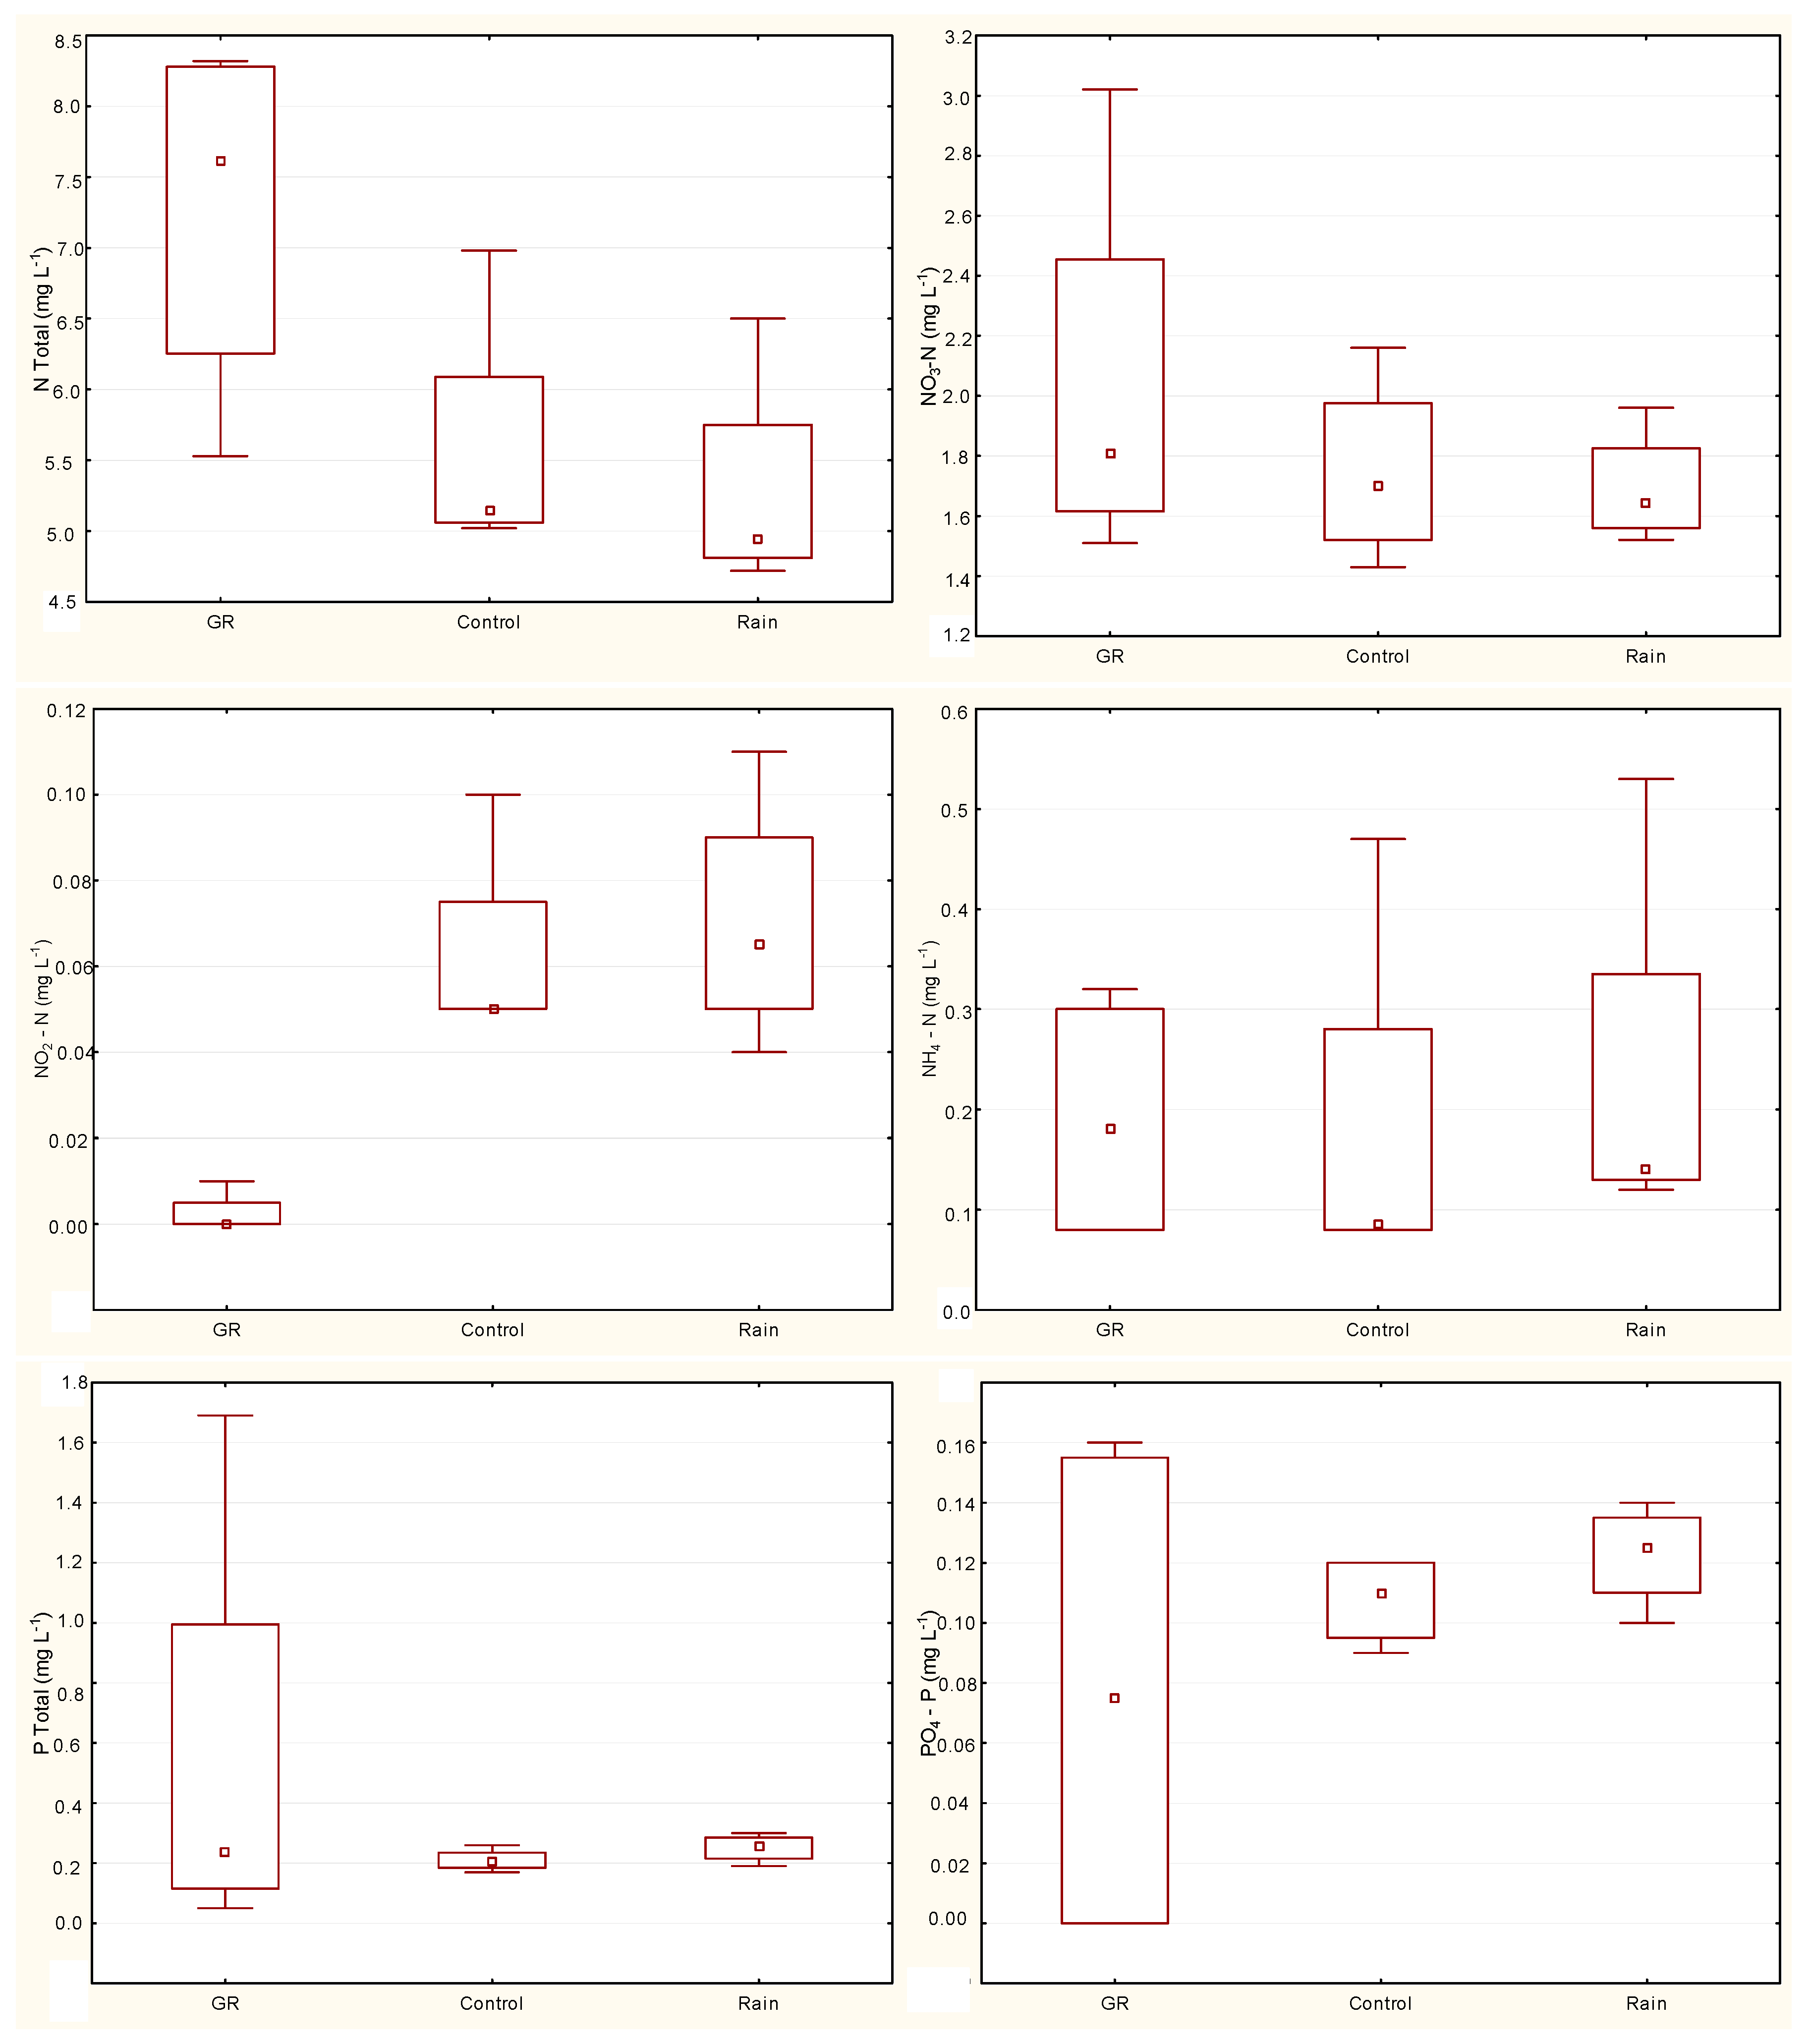
Initially, the hypothesis that the green roofs improve the quality of rain water was posed. In the samples from the green roof surfaces a significant increase was noted in the level of concentration of nutrients, and of total nitrogen in particular. The data pertaining to water quality were compared with the use of the t-tests. The significance level of 5% was assumed. The tests were carried out assuming a null hypothesis H0: Average values of quality indicators in waters from green areas were the same as in rainwater or control area, and the second one H1: That the average values of quality indicators from waters from runoff differ between the green roof and the rainwater or the control surface. While the concentration of total nitrogen in the runoff from the green roof was higher than the values of concentrations in atmospheric precipitation and amounted to, on average, 8.3 mg∙L−1, statistically significant differences (p < 0.05) were observed at the same time, relative to the concentrations in the rain water and in the runoff from the control surface. The composition of the prepared substrate could have had a direct effect on the higher values of that indicator. In the case of other forms of nitrogen—NO3− and NO2−—in the first case no statistically significant differences (p < 0.05) were noted for the analysed GR models relative to the loads in rain water and in the runoff from the control surface. NO2− concentrations were recorded in trace amounts. The content of total nitrogen was the lowest in the rain water (minimum of 2.92 mg∙L−1). In the case of the concentration of PO43− statistically significant differences at the expected level (p < 0.5) were noted in relation to the control surface and to rain waters (Figure 7).
It should be emphasised that phosphorus compounds in an environment that is already slightly alkaline can be bound by calcium (Ca) and sometimes by manganese (Mn), and additionally by the sorptive complex of the soil, which in that last case is dependent on the reaction (pH) of the substrate, its moisture and temperature, and also on oxygen content. This indicates the degree of binding of phosphates and a notable variation of the discharge concentrations during the vegetation season and the winter period. Therefore, atmospheric precipitations will be one of the main causes of improved solubility of phosphorus and increased concentrations.
In the opinion of the authors, the release of total nitrogen and phosphates from the surface of green roofs can be related to additional fertilisation, as the application of conventional fertilisers contributes to increased concentration of various forms of nitrogen and phosphorus in the runoff waters. Therefore, care should be taken to use fertilisers with controlled rate of nutrient release [42]. In an experiment conducted within the scope of a study on the chemistry of rain waters, MacAvoy [4] demonstrated, for 9 rainfall events, the occurrence of higher concentrations of NO3− and NH4+ in relation to the control surface, and during the entire cycle of 16-month study the level of nitrates was reduced to 32%. A study conducted by Harper [43] demonstrated a significant load of phosphates and nitrates in the initial period of operation, followed by, in a 9-month cycle, a decrease in the content of phosphates by 5 mg∙L−1 and nitrates by 10 mg∙L−1. In the case of organic carbon, Carpenter and Kuoppamaiki observed a significant decrease, from 500 to 50 mg∙L−1 [1,44].
4. Conclusions
The hydrological properties of the experimental green roof surfaces, in the conditions of Lower Silesia, city of Wrocław, were analysed on the basis of rainfall events that took place in the summer months of 2017. In the study the authors applied the numerical model of water flow in porous media, Hydrus 1D, that allowed the analysis of the hydrological parameters of the system. The adopted and calculated initial hydraulic conditions, runoff and discharge intensity, and the conditions of flow within the system simulated by the numerical model, conform to the experimental data. Using the model based on the Richards equation, flow-related parameters were identified, that are usually determined empirically on the basis of field experiments, including those that determine the flow regime—intensity and runoff, and the amount of atmospheric precipitation, its duration and intensity, processes related with evapotranspiration in the presence of plants and characteristics of the substrate, and the hydraulic conductivity and initial moisture of the substrate. The level of prediction accuracy determined on the basis of the model by means of the Nash–Sutcliffe statistics is high, but it should be emphasised that, as the analysis has shown, determined by the hydraulic and retention properties of the substrate.
In the case of the systems analysed in the aspect of estimation of benefits for the environment and ecological solutions, efficiency characterised by runoff retention effectiveness at levels of up to 65.7% is satisfactory. Due to the number of runoffs analysed, the proper level of efficiency of the systems can be determined on the basis of longer period of observation.
1. The designed models of green roofs based on zeolite and pumice reduced the mean peak discharge from 10.5% to 90%, and in addition caused a significant delay of the initiation of the discharge that depended on the intensity of rainfalls and their distribution in time.
2. Runoff simulation by means of Hydrus 1D allows to confirm definitely the applicability of the model used in the experiment. The calculated Nash-Sutcliffe statistics for flow rates at the level of between 0.43 and 0.88 support the good representation of simulated and measured values for all analyses events.
3. The simulations of cumulative amounts and intensity of runoff for varying thicknesses of substrate layers permit the conclusion that, due to reduction of layer thickness to 50 mm the values of the retention index RPI for the analysed surfaces, were lower and amounted to 35.9% (initial value 60.6-zeolite) and 41% (initial value 65.7-pumice).
4. In the case of total nitrogen and phosphates, statistical analysis revealed significant differences (p < 0.05) (RPI for analysed surface GR1 and GR2), in relation to their determined concentrations in rain waters and in the runoff from the control surface. In particular, total nitrogen in the runoff from the green roof was nearly twice as high as that in the rain water, and amounted to, on average, 8.3 mg∙L−1.
Author Contributions
G.P. designed the conceptualization, methodology and supervision the paper; T.K., K.S., W.O., R.Ż. and R.P. the contributed to the analyses of the results; K.S. and W.O. they wrote article. R.Ż. funding acquisition and supervision.
Funding
This research received no external funding.
Conflicts of Interest
The authors declare no conflict of interest.
References
- Carpenter, C.M.G.; Todorov, D.; Driscoll, C.T.; Montesdeoca, M. Water quantity and quality response of a green roof to storm events: Experimental and monitoring observations. Environ. Pollut. 2016, 218, 664–672. [Google Scholar] [CrossRef] [PubMed]
- Castigla, R.; Wilkinson, S. Modelling green roof stormwater response for different soil depths. Landsc. Urban Plan. 2016, 153, 170–179. [Google Scholar] [CrossRef]
- Claessens, L.; Hopkinson, C.; Rastetter, E.; Vallino, J. Effect of historical changes in land use and climate on the water budget of an urbanizing watershed. Water Resour. Res. 2006, 42, W03426. [Google Scholar] [CrossRef]
- MacAvoy, S.E.; Plank, K.; Mucha, S.; Williamson, G. Effectiveness of foam-based green surfaces in reducing nitrogen and suspended solids in an urban installation. Ecol. Eng. 2016, 91, 257–264. [Google Scholar] [CrossRef]
- Razzaghmanesh, M.; Beecham, S.; Kazemi, F. Impact of green roofs on stormwater quality in a South Australian urban environment. Sci. Total Environ. 2014, 470–471, 651–659. [Google Scholar] [CrossRef] [PubMed]
- Zhang, B.; Li, N.; Wang, S. Effect of urban green space changes on the role of rainwater runoff reduction in Beijing, China. Landsc. Urban Plan. 2015, 140, 8–16. [Google Scholar] [CrossRef] [Green Version]
- Zhang, Q.; Miao, L.; Wang, X.; Liu, D.; Zhu, L.; Zhou, B.; Sun, J.; Liu, J. The capacity of greening roof to reduce storm water runoff and pollution. Landsc. Urban Plan. 2015, 144, 142–150. [Google Scholar] [CrossRef]
- Jurik, L.; Huska, D.; Halaszova, K.; Bandlerova, A. Small water reservoirs—Sources of water or problems? J. Ecol. Eng. 2015, 16, 22–28. [Google Scholar] [CrossRef]
- Berndtsson, J.C. Green roof performance towards management of run-off water quantity and quality: A review. Ecol. Eng. 2010, 36, 351–360. [Google Scholar] [CrossRef]
- Dunnet, N.; Kingsbury, N. Planting Green Roofs and Living Walls; Timber Press: Portland, OR, USA, 2004. [Google Scholar]
- Fassman-Beck, E.; Voyde, E.; Simcock, R.; Hong, Y.S. 4 Living roofs in 3locations: Does configuration affect runoff mitigation? J. Hydrol. 2013, 490, 11–20. [Google Scholar] [CrossRef]
- Zhang, Z.; Szota, K.; Fletcher, T.D.; Williams, N.S.G.; Werdin, J.; Farrell, C. Influence of plant composition and water use strategies on green roof stormwater retention. Sci. Total Environ. 2018, 625, 775–781. [Google Scholar] [CrossRef] [PubMed]
- Stovin, V.; Vesuviano, G.; Kasmin, H. The hydrological performance of a green roof test bed under UK climatic conditions. J. Hydrol. 2012, 414–415, 148–161. [Google Scholar] [CrossRef]
- Versini, P.A.; Ramier, D.; Berthier, E.; de Gouvello, B. Assessment of the hydrological impacts of green roof: From building scale to basin scale. J. Hydrol. 2015, 524, 562–575. [Google Scholar] [CrossRef] [Green Version]
- Buccola, N.; Spolek, G. A pilot-scale evaluation of green roof runoff retention, detention, and quality. Water Air Soil Pollut. 2011, 216, 83–92. [Google Scholar] [CrossRef]
- Hilten, R.N.; Lawrence, T.M.; Tollner, E.W. Modeling stormwater run-off from green roofs with HYDRUS-1D. J. Hydrol. 2008, 358, 288–293. [Google Scholar] [CrossRef]
- Nardini, A.; Andri, S.; Crasso, M. Influence of substrate depth and vegetation type on temperature and water runoff mitigation by extensive green roofs: Shrubs versus herbaceous plants. Urban Ecosyst. 2012, 15, 697–708. [Google Scholar] [CrossRef]
- Palla, A.; Gnecco, I.; Lanza, L.G. Unsaturated 2D modelling of subsurface water flow in the coarse-grained porous matrix of a green roof. J. Hydrol. 2009, 379, 193–204. [Google Scholar] [CrossRef]
- She, N.A.; Pang, J. Physically based green roof model. J. Hydrol. Eng. 2010, 15, 458–464. [Google Scholar] [CrossRef]
- Herrera, J.; Flamant, G.; Gironás, J.; Vera, S.; Bonilla, C.A.; Bustamante, W.; Suárez, F. Using a Hydrological Model to Simulate the Performance and Estimate the Runoff Coefficient of Green Roofs in Semiarid Climates. Water 2018, 10, 198. [Google Scholar] [CrossRef]
- Soulis, K.; Valiantzas, J.; Ntoulas, N.; Kargas, G.; Nektarios, P. Simulation of green roof runoff under different substrate depths and vegetation covers by coupling a simple conceptual and a physically based hydrological model. J. Environ. Manag. 2017, 200, 434–445. [Google Scholar] [CrossRef] [PubMed]
- Voyde, E.; Fassman, E.; Simcock, R. Hydrology of an extensive living roof under sub-tropical climate conditions in Auckland, New Zealand. J. Hydrol. 2010, 394, 384–395. [Google Scholar] [CrossRef]
- Wang, X.; Tian, Y.; Zhao, X. The influence of dual-substrate-layer extensive green roofs on rainwater runoff quantity and quality. Sci. Total Environ. 2017, 592, 465–476. [Google Scholar] [CrossRef] [PubMed]
- Wong, G.K.; Jim, C. Quantitative hydrologic performance of extensive green roof under humid-tropical rainfall regime. Ecol. Eng. 2014, 70, 366–378. [Google Scholar] [CrossRef]
- Yio, M.H.N.; Stovin, V.; Werdin, J.; Vesuviano, G. Experimental analysis of green roof substrate detention characteristics. Water Sci. Technol. 2013, 68, 1477–1486. [Google Scholar] [CrossRef] [PubMed] [Green Version]
- Mentens, J.; Raes, D.; Hermy, M. Green roofs as a tool for solving the rainwater runoff problem in the urbanized 21st century? Landsc. Urban Plan. 2006, 77, 217–226. [Google Scholar] [CrossRef]
- Speak, A.F.; Rothwell, J.J.; Lindley, S.J.; Smith, C.L. Rainwater runoff retention on an aged intensive green roof. Sci. Total Environ. 2013, 461, 28–38. [Google Scholar] [CrossRef] [PubMed]
- Burszta-Adamiak, E.; Mrowiec, M. Modeling of green roofs hydrologic performance using EPA’s SWMM. Water Sci. Technol. 2013, 68, 36–42. [Google Scholar] [CrossRef] [PubMed]
- Simunek, J.; Sejna, M.; Saito, H.; Sakai, M.; van Genuchten, M.T. The HYDRUS-1D Software Package for Simulating the One-Dimensional Movement of Water, Heat, and Multiple Solutes in Variably Saturated Media; Version 4.16; Department of Environmental Sciences, University of California Riverside: Riverside, CA, USA, 2013. [Google Scholar]
- Palla, A.; Gneco, I. Hydrologic modeling of low impact development system at the urban catchment scale. J. Hydrol. 2015, 528, 361–368. [Google Scholar] [CrossRef]
- Karczmarczyk, A.; Bus, A.; Baryła, A. Phosphate Leaching from Green Roof Substrates—Can Green Roofs Pollute Urban Water Bodies? Water 2018, 10, 199. [Google Scholar] [CrossRef]
- Pęczkowski, G.; Orzepowski, W.; Pokładek, R.; Kowalczyk, T.; Żmuda, R.; Wójcik, R. Właściwości retencyjne zielonych dachów typu ekstensywnego na przykładzie badań modelowych. Acta Sci. Pol. Formatio Circumiectus 2016, 15, 113–120. [Google Scholar] [CrossRef]
- Šimůnek, J.; van Genuchten, M.T. Modeling Nonequilibrium Flow and Transport Processes Using HYDRUS. Vadose Zone J. 2008, 7, 782–797. [Google Scholar] [CrossRef]
- Wosten, J.H.M.; Van Genuchten, M.T. Using texture and other soil properties to predict the unsaturated soil hydraulic conductivity. Soil Sci. Soc. Am. J. 1988, 52, 1762–1770. [Google Scholar] [CrossRef]
- Mualem, Y. A new model for predicting the hydraulic conductivity of unsaturated porous media. Water Resour. Res. 1976, 12, 513–522. [Google Scholar] [CrossRef]
- Moriasi, D.N.; Arnold, J.G.; Van Liew, M.W.; Bingner, R.L.; Harmel, R.D.; Veith, T.L. Model evaluation guidelines for systematic quantification of accuracy in watershed simulations. Am. Soc. Agric. Biol. Eng. 2007, 50, 885–900. [Google Scholar] [CrossRef]
- Nash, J.E.; Sutcliffe, J.V. River flow forecasting through conceptual models part I—A discussion of principles. J. Hydrol. 1970, 10, 282–290. [Google Scholar] [CrossRef]
- Liesecke, H.J. Extensive begrunung bei 50 dachneigung. Stadt und Grun 1999, 48, 337–346. [Google Scholar]
- Scholz-Barth, K. Green Roofs: Stormwater Management from the Top Down; Environmental Design & Construction: Washington, DC, USA, 2001. [Google Scholar]
- Fassman, E.A.; Simcock, R.; Voyde, E. Extensive Green (Living) Roofs for Stormwater Mitigation. Part 1: Design and Construction; Techincal Report, TR2010/017; Auckland Regional Council: Auckland, New Zealand, 2010.
- Metselaar, K. Water retention and evapotranspiration of green roofs and possible natural vegetation types. Resour. Conserv. Recycl. 2012, 64, 49–55. [Google Scholar] [CrossRef]
- Teemusk, A.; Mander, Ü. The Influence of Green Roofs on Runoff Water Quality: A Case Study from Estonia. Water Res. Manag. 2011, 25, 3699–3713. [Google Scholar] [CrossRef]
- Harper, G.E.; Limmer, M.A.; Showalter, W.E.; Burken, J.G. Nine-month evaluation of runoff quality and quantity from an experiential green roof in Missouri, USA. Ecol. Eng. 2015, 78, 127–133. [Google Scholar] [CrossRef]
- Kuoppamäki, K.; Hagner, M.; Lehvävirta, S.; Setälä, H. Biochar amendment in the green roof substrate affects runoff quality and quantity. Ecol. Eng. 2016, 88, 1–9. [Google Scholar] [CrossRef]
Figure 1.
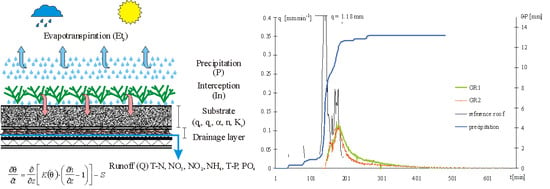
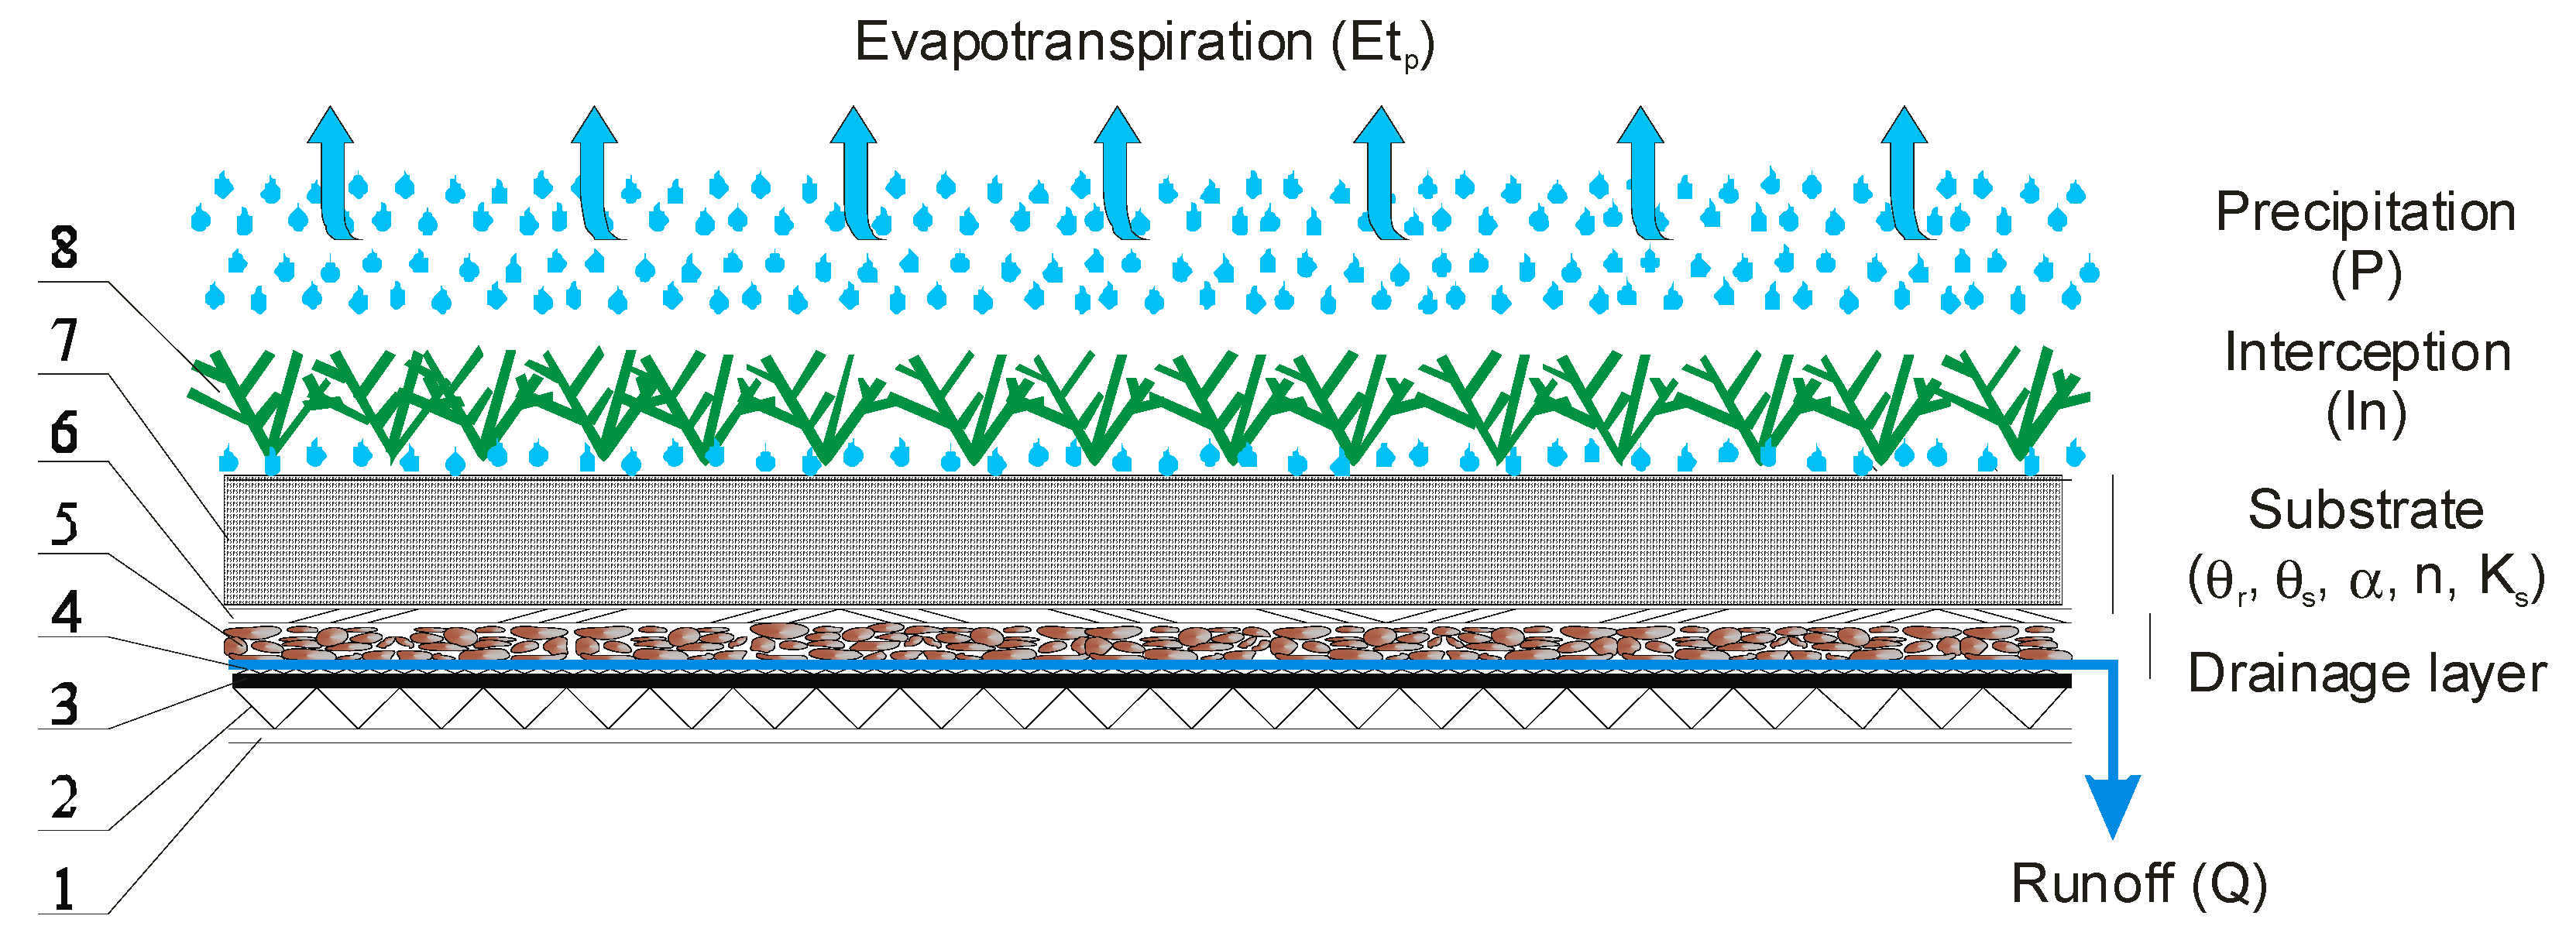
Construction details of extensive type green roof, substrate with pumice or zeolite, physically based model. 1—model support structure, 2—thermal insulation—extruded polystyrene (XPS), 3—water proofing membrane, 4—geotextile type RMS 300 (absorptive-protective), 5—gravel layer, granulation from 1 to 2 cm, 6—filtration geotextile, 7—substrate with pumice or zeolite, 8—vegetation on the substrate layer—Sedum sexangulare, Sedum telephium, Sedum spurium, Sedum floriferum, Sedum album.
Figure 1.
Construction details of extensive type green roof, substrate with pumice or zeolite, physically based model. 1—model support structure, 2—thermal insulation—extruded polystyrene (XPS), 3—water proofing membrane, 4—geotextile type RMS 300 (absorptive-protective), 5—gravel layer, granulation from 1 to 2 cm, 6—filtration geotextile, 7—substrate with pumice or zeolite, 8—vegetation on the substrate layer—Sedum sexangulare, Sedum telephium, Sedum spurium, Sedum floriferum, Sedum album.

Figure 2.
Hydrograph and accumulated rainfall for a storm on the green roof surface with a vegetation layer based on zeolite (GR1) and pumice (GR2) with reference to the control surface in 28 July 2017.
Figure 2.
Hydrograph and accumulated rainfall for a storm on the green roof surface with a vegetation layer based on zeolite (GR1) and pumice (GR2) with reference to the control surface in 28 July 2017.

Figure 3.
Comparison of green roofs with zeolite (a) and pumice (b)—hydrographs for measured values and simulated with the model Hydrus 1D on 28 June 2017.
Figure 3.
Comparison of green roofs with zeolite (a) and pumice (b)—hydrographs for measured values and simulated with the model Hydrus 1D on 28 June 2017.

Figure 4.
Comparison of measured and simulated cumulative runoff. The effect of increasing the outflow depending on the depth of the zeolite-based vegetation layer (GR1) on 28 July 2017.
Figure 4.
Comparison of measured and simulated cumulative runoff. The effect of increasing the outflow depending on the depth of the zeolite-based vegetation layer (GR1) on 28 July 2017.

Figure 5.
Comparison of measured and simulated cumulative runoff. The effect of increasing the outflow depending on the depth of the pumice-based vegetation layer (GR2) on 28 July 2017.
Figure 5.
Comparison of measured and simulated cumulative runoff. The effect of increasing the outflow depending on the depth of the pumice-based vegetation layer (GR2) on 28 July 2017.

Figure 6.
Range of flow rate values at layer depths of 11, 9, 8, 7, 6 and 5 cm in extensive roof models on 28 July 2017 at Wrocław Swojec.
Figure 6.
Range of flow rate values at layer depths of 11, 9, 8, 7, 6 and 5 cm in extensive roof models on 28 July 2017 at Wrocław Swojec.

Figure 7.
Ranges and mean values of contamination indicators in runoff waters for experimental area surface GR1 and GR2.
Figure 7.
Ranges and mean values of contamination indicators in runoff waters for experimental area surface GR1 and GR2.


Table 1.
Physical properties of the substrate comprised of zeolite and pumice. Values represent the mean values of three replications.
Table 1.
Physical properties of the substrate comprised of zeolite and pumice. Values represent the mean values of three replications.
| Measurement | Unit | Substrate of Zeolite GR1 | Substrate of Pumice GR2 |
|---|---|---|---|
| Bulk density | g·cm−3 | 0.97 | 0.69 |
| Specific Density | g·cm−3 | 1.85 | 1.28 |
| Water drainage of soil | mm | 19.5 | 20.7 |
| Coefficient water drainage | % | 17.7 | 18.8 |
| Water holding capacity | mm | ||
| pF 0 | 52.7 | 50.7 | |
| pF 2.0 | 32.0 | 31.2 | |
| pF 3.0 | 27.6 | 27.2 | |
| pF 4.2 | 15.1 | 14.0 |
Table 2.
Soil hydraulic parameters used in Hydrus 1D.
| Substrate | θr | θs | α (m·m−1) | n (−) | Ks (mm·min−1) |
|---|---|---|---|---|---|
| substrate with zeolite | 0.04 | 0.479 | 0.0038 | 1.529 | 8.1 |
| substrate with pumice | 0.02 | 0.461 | 0.0045 | 1.553 | 12.2 |
Table 3.
Rainfall and runoff characteristics of the studied events. Substrate depth 11 cm zeolite and pumice.
Table 3.
Rainfall and runoff characteristics of the studied events. Substrate depth 11 cm zeolite and pumice.
| Rainfall Event | Rain Depth (mm) | Peak of Rain Intensity (mm·min−1) | Rain Duration (min) | Retained Volume (%) | Flow Peak (mm·min−1) | Peak Reduction (%) | Initial Moisture (% v/v) | ||||
|---|---|---|---|---|---|---|---|---|---|---|---|
| GR1 | GR2 | GR1 | GR2 | GR1 | GR2 | GR1 | GR2 | ||||
| 28.04 | 20.7 | 0.12 | 676 | 68.2 | 76.3 | 0.09 | 0.08 | 25.0 | 33.3 | 14.1 | 8.9 |
| 30.05 | 18.5 | 1.8 | 248 | 17.9 | 28.3 | 0.9 | 0.86 | 50.0 | 52.2 | 16.3 | 10.8 |
| 6.06 | 14.8 | 0.22 | 523 | 73.4 | 82.1 | 0.1 | 0.11 | 54.5 | 50.0 | 14.7 | 8.3 |
| 27.06 | 15.3 | 0.48 | 371 | 63.5 | 72.3 | 0.37 | 0.35 | 22.9 | 27.1 | 17.1 | 11.1 |
| 28.06 | 16.7 | 2.25 | 190 | 57.0 | 59.8 | 1.01 | 0.96 | 55.1 | 57.3 | 14.3 | 6.7 |
| 29.06 | 11.0 | 0.19 | 420 | 81.0 | 89.6 | 0.12 | 0.11 | 36.8 | 42.1 | 29.0 | 26.6 |
| 10.07 | 50.1 | 2.36 | 97 | 33.2 | 65.4 | 1.12 | 1.05 | 52.5 | 55.5 | 23.0 | 13.9 |
| 23.07 | 16.4 | 1.44 | 194 | 16.9 | 27.6 | 0.99 | 1.0 | 31.2 | 30.5 | 25.0 | 14.7 |
| 24.07 | 39.5 | 5.7 | 613 | 9.8 | 11.2 | 5.10 | 2.90 | 10.5 | 49.1 | 37.6 | 34.1 |
| 25.07 | 16.2 | 0.56 | 425 | 27.5 | 32.7 | 0.47 | 0.39 | 16.1 | 30.3 | 28.1 | 19.8 |
| 28.07 | 26.6 | 2.4 | 144 | 79.1 | 84.1 | 0.114 | 0.113 | 90.0 | 90.0 | 36.0 | 32.1 |
| 11.08 | 13.5 31.0 | 2.47 4.97 | 94 46 | 67.1 74.6 | 93.8 89.7 | 2.20 1.35 | 0.77 0.83 | 11.9 72.8 | 68.8 82.3 | 18.9 21.9 | 11.8 19.1 |
| 1.09 | 47.2 | 0.52 | 1145 | 91.4 | 95.6 | 0.26 | 0.22 | 50.0 | 57.6 | 17.1 | 9.7 |
| 11.09 | 10.9 | 0.16 | 429 | 72.3 | 77.1 | 0.11 | 0.09 | 31.2 | 43.7 | 30.0 | 23.1 |
| 23.09 | 15.1 | 0.21 | 711 | 69.9 | 98.1 | 0.17 | 0.15 | 19.0 | 28.6 | 33.1 | 26.4 |
| 22.10 | 13.3 | 0.22 | 183 | 66.9 | 71.5 | 0.15 | 0.13 | 31.8 | 40.9 | 34.3 | 32.8 |
| 29.10 | 21.1 | 1.55 | 651 | 7.3 | 32.8 | 1.30 | 0.86 | 16.2 | 44.5 | 36.0 | 30.8 |
Table 4.
Nash–Sutcliffe efficiency (NSE) index and maximum error (ME) of the total runoff volume for the observed rainfall events used for the validation.
Table 4.
Nash–Sutcliffe efficiency (NSE) index and maximum error (ME) of the total runoff volume for the observed rainfall events used for the validation.
| Event Date (dd/mm) | GR1 | GR2 | ||
|---|---|---|---|---|
| NSE (−) | ME (mm·min−1) | NSE (−) | ME (mm·min−1) | |
| 28/04 | 0.77 | 0.11 | 0.70 | 0.09 |
| 30/05 | 0.75 | 0.18 | 0.71 | 0.11 |
| 6/06 | 0.80 | 0.21 | 0.77 | 0.18 |
| 27/06 | 0.78 | 0.22 | 0.70 | 0.20 |
| 28/06 | 0.81 | 0.10 | 0.69 | 0.093 |
| 29/06 | 0.77 | 0.09 | 0.61 | 0.06 |
| 10/07 | 0.85 | 0.23 | 0.43 | 0.1 |
| 23/07 | 0.79 | 0.14 | 0.72 | 0.12 |
| 24/07 | 0.70 | 0.17 | 0.65 | 0.15 |
| 25/07 | 0.70 | 0.17 | 0.68 | 0.15 |
| 11/08 | 0.83 | 0.12 | 0.80 | 0.11 |
| 1/09 | 0.84 | 0.08 | 0.80 | 0.06 |
| 11/09 | 0.88 | 0.092 | 0.77 | 0.05 |
| 23/09 | 0.82 | 0.10 | 0.79 | 0.09 |
| 22/10 | 0.77 | 0.11 | 0.75 | 0.10 |
| 29/10 | 0.73 | 0.05 | 0.55 | 0.12 |
© 2018 by the authors. Licensee MDPI, Basel, Switzerland. This article is an open access article distributed under the terms and conditions of the Creative Commons Attribution (CC BY) license (http://creativecommons.org/licenses/by/4.0/).
Share and Cite
MDPI and ACS Style
Pęczkowski, G.; Kowalczyk, T.; Szawernoga, K.; Orzepowski, W.; Żmuda, R.; Pokładek, R. Hydrological Performance and Runoff Water Quality of Experimental Green Roofs. Water 2018, 10, 1185. https://doi.org/10.3390/w10091185
AMA Style
Pęczkowski G, Kowalczyk T, Szawernoga K, Orzepowski W, Żmuda R, Pokładek R. Hydrological Performance and Runoff Water Quality of Experimental Green Roofs. Water. 2018; 10(9):1185. https://doi.org/10.3390/w10091185
Chicago/Turabian StylePęczkowski, Grzegorz, Tomasz Kowalczyk, Katarzyna Szawernoga, Wojciech Orzepowski, Romuald Żmuda, and Ryszard Pokładek. 2018. "Hydrological Performance and Runoff Water Quality of Experimental Green Roofs" Water 10, no. 9: 1185. https://doi.org/10.3390/w10091185
Note that from the first issue of 2016, this journal uses article numbers instead of page numbers. See further details here.