Quantification of Daily Water Requirements of Container-Grown Calathea and Stromanthe Produced in a Shaded Greenhouse


Department of Environmental Horticulture, Institute of Food and Agricultural Sciences, University of Florida, Apopka, FL 32703, USA
*
Author to whom correspondence should be addressed.
Water 2018, 10(9), 1194; https://doi.org/10.3390/w10091194
Submission received: 30 July 2018
/
Revised: 28 August 2018
/
Accepted: 3 September 2018
/
Published: 5 September 2018
(This article belongs to the Special Issue Modelling and Management of Irrigation System)
Abstract
:Irrigating plants based on their water requirements enhances water use efficiency and conservation; however, current irrigation practices for container-grown greenhouse plants largely relies on growers’ experiences, resulting in leaching and/or runoff of a large amount of water. To address water requirements of greenhouse-grown plants, this study adapted a canopy closure model and investigated actual evapotranspiration (ETA) of Calathea G. Mey. ‘Silhouette’ and Stromanthe sanguinea Sond. from transplanting to marketable sizes in a shaded greenhouse. The daily ETA per Calathea plant ranged from 3.55 mL to 59.39 mL with a mean cumulative ETA of 4.84 L during a 224 day growth period. The daily ETA of S. sanguinea varied from 7.87 mL to 97.27 mL per plant with a mean cumulative ETA of 6.81 L over a 231 day production period. The best fit models for predicting daily ETA of Calathea and Stromanthe were developed, which had correlation coefficients (r2) of 0.82 and 0.73, respectively. The success in modelling ETA of the two species suggested that the canopy closure model was suitable for quantifying water use of container-grown greenhouse plants. Applying the research-based ETA information in production could reduce water use and improve irrigation efficiency during Calathea and Stromanthe production.
1. Introduction
Freshwater is one of our most precious natural resources. Agricultural use of freshwater has been under rigorous scrutiny since irrigation withdrawals represent over 70% of all freshwater use worldwide [1,2]. In the United States (U.S.), irrigation accounts for 68% of groundwater and 29% of surface water withdrawals, encompassing up to 62% of all freshwater use [3]. Container plant production is an important sector of agriculture, which refers to growing plants from seedlings, liners, rooted cuttings, or grafted plants in containers or pots filled with substrates to marketable sizes or harvestable stages [4]. Growing media or substrates consist of a mix of soil, peat, vermiculate, perlite, or other organic components in different proportions. Container production is a widely-utilized method for growing a variety of plants including fruit, vegetable, nursery, and floriculture crops. Floriculture and nursery crops comprise almost 30% of the specialty crops grown in the U.S. with a total of $11.7 billion in sales in 2009 [5]. Container production in the U.S. currently accounts for approximately 90% of greenhouse, nursery, and floriculture crops [6]. Since plants are grown in artificial substrates confined by limited volumes (containers), they have to be frequently irrigated ranging from daily to weekly to avoid drought stress. Current irrigation practices have been largely based on growers’ intuition or experience, and as a result, plants are often overirrigated [7]. Overirrigation has been reported to result in 25% to 90% of irrigated water to be leached and/or runoff [8,9,10,11]. Overirrigation not only reduces substrate aeration but also results in irrigation leaching and/or runoff, which is accompanied with nutrient elements, primarily nitrogen (N) and phosphorus (P). The movement of N and P in waterways could potentially contaminate ground and/or surface water [8]. Thus, irrigation based on plant growth requirements is becoming increasingly important for sustainable production of container-grown plants.
Plant water use is mainly a function of transpiration through leaves. When evaporation from soil or other substrates is included, water use is termed actual evapotranspiration (ETA, mL day−1). Transpiration accounts for the majority of actual ETA, but it can be affected by local weather conditions, cropping system, plant species, and growth stages [12]. As a result, ETA is estimated by multiplying reference ET (ET0, mL day−1) with a corresponding crop coefficient (Kc, dimensionless) [12]. The Penman–Monteith equation has been recommended as the sole method of estimating ET0 [12], which is calculated by multiplying weather-based estimates of ET from a reference crop, such as grass or alfalfa. There are several modifications to the Penman–Monteith model that provide the same values for ET0. One is the grass reference option established by the American Society of Civil Engineering (ASCE) [13]. Another is the program provided by Campbell Scientific Inc. (Logan, UT, USA) for its weather stations [14] that uses the full ASCE Penman–Monteith equation [15]. Kc is a function of fraction of ground cover and crop height, and Kc values have been reported for a wide range of agronomic crops [12,16]. However, accurate Kc values are difficult and expensive to develop [17]. Using precision weighing lysimeters is the most accurate way of estimating crop water usage and developing Kc. Weighing lysimeters have generally been regarded as the standard measuring device for estimating ET; they do so by measuring changes in mass of a soil container with plants positioned on a scale or other weight device. Weighing lysimeters measure ETA as volumes, rather than depths.
Quantification of daily water use of container-grown plants dates back to the 1980s. The Thorn thwaite equation [18] was the original method used [19,20] to calculate ET0. Other researchers used the top diameter of container [21] for calculating the surface area to convert ETA to a depth for 22 woody ornamental species, and Kc values ranging from 1.1 to 5.1 were reported. In agronomic crops, however, Kc values rarely exceed 1.3 [22]. This represents a major discrepancy between agronomic and container plants. Agronomic crops are produced in the field, and ETA and Kc are estimated in reference to an irrigated area or a ground area, which includes ground cover and canopy. In container-grown plants, ETA is mostly measured by weight loss from a container initially near 100% container capacity; as such, ETA is a measure in volume. However, ET0 is calculated as a depth (mL). In container plant production, projected canopy areas (PCA) generally exceed container surfaces by several times. Evapotranspiration, mainly transpiration, takes place throughout the canopy. Since the measure of ETA is in volume, it has to be normalized by an area to be the same units as ET0 for the calculation of Kc. An approach to normalized ETA is to calculate it based on PCA. When ETA was normalized by both ET0 and PCA, Kc declined as PCA approached canopy closure and became relatively constant after canopy closure [23]. Thus, it was proposed that the calculation of Kc of container-grown plants was based on canopy closure [24]. When using this model, researchers determine average canopy area and calculates percent canopy closure (%CC) based on distance between adjacent containers and the canopies of similar plants. Based on the ETA, ET0, and PCA, a water needs index (WNI) is calculated, which is a function of canopy closure of a group of plants, relating individual plant actual evapotranspiration (ETA) to plant size and canopy ventilation and radiation [25]. Daily ET0 was calculated from a meteorological measurement on site, with ETA determined by an autonomous weighing lysimeter system [10]. The model has been used to quantify daily ETA of several woody ornamental plants to market size including Ligustrum japonicum Thunb. [24], Viburnum odoratissimum Ker Gawl. [26,27], Rhaphiolepis indica (L.) Lindl. ex Her Gawl. [28] as well as foliage plants of Asplenium nidus L. and Chamaedorea elegans Mart. [29]. The irrigation of container plants based on daily water use has been documented to reduce nursery runoff volume and nutrient load without reducing plant growth [30,31].
The objectives of the present study were to determine ETA of two important container-grown ornamental foliage plants, Calathea G. Mey. ‘Silhouette’ and Stromanthe sanguinea Sond., in a shaded greenhouse from tissue-cultured liners grown in 15 cm containers to marketable sizes, and to develop models to predict daily ETA rates using the PCA model developed for container-grown woody ornamental plants. Foliage plants are those produced in shaded greenhouses and used primarily for interior decoration [32]. Florida is the leading state in the production of foliage plants, accounting for 72% of wholesale value in the U.S. in 2015 [33]. Quantification of their daily water use could provide research-based information for improving irrigation efficiency during foliage plant production in greenhouse conditions.
2. Materials and Methods
2.1. Experimental Location
The experiment was conducted in a shaded greenhouse at the University of Florida’s Mid-Florida Research and Education Center (MREC) in Apopka where a Florida Automated Weather Network (FAWN) station was 46 m east of the shaded greenhouse. The station provided readings of air temperatures at three elevations (0.6, 1.8, and 9.1 m), dew point, rainfall, soil temperature, relative humidity, wet bulb temperature, barometric pressure, and wind speed every 15 min daily as well as daily evapotranspiration (ET).
2.2. Experimental Setup
An automated Weatherhawk weather station (Campbell Scientific Inc., Logan, UT, USA) was installed inside the shaded greenhouse where a miniature weighing lysimeter system was built for this study [10]. In brief, the system consisted of a control/data collection apparatus connected to mini lysimeters where a SDM-AM16-32 multiplexer (Campbell Scientific Inc., Logan, UT, USA), a CR10X data logger (Campbell Scientific Inc., Logan, UT, USA), and SDM-CD16AC relay control module (Campbell Scientific Inc., Logan, UT, USA) were used for receiving and storing data from the mini-lysimeters. Each mini-lysimeter was installed with a load cell (SSM-50-AJ, Interface Inc., Scottsdale, AZ, USA) that was suspended from a miniature tripod with a plant support. All load cells were calibrated with a seven-point curve using known masses. Every half hour, the data logger program recorded the mass of each lysimeter and stored it for later retrieval. At midnight, actual evapotranspiration (ETA) for each lysimeter was determined as the difference in mass between 0500 h and midnight. There was no transpiration between midnight and 0500 h.
2.3. Plant Materials and Their Growth
Tissue-cultured liners (plantlets grown in plugs of 72 cell trays) of Calathea ‘Silhouette’ and S. sanguinea were transplanted singly into a peat-based substrate composed of 60% Canadian peat, 20% vermiculite, and 20% perlite in 15 cm containers. Stromanthe plants were transplanted on 8 September 2008 and harvested on 23 April 2009; and Calathea plants were transplanted on 7 July 2009 and harvested on 18 February 2010. Plants were fertilized by top dressing 5 g of a controlled-released fertilizer (CRF) (Osmocote 19–5–9, 8–9 month, The Scotts Co., Marysville, OH, USA) per container three weeks after potting. The experiment was arranged as a completely randomized block design with four replications. Each block had 15 plants per species, they were spaced in three rows, five containers along the length of benches, 30 cm apart. The center plant was placed in a suspension-weighing lysimeter, and the four closest plants to the lysimeter plant were designated as the interior plants for repeated canopy measurements. Plants were produced in the aforementioned shaded greenhouse under a maximum photosynthetic active radiation (PAR) of 200 µmol m−2 s−1.
Plants were irrigated between 0800 h and 0900 h and allowed to have about 10% leachate fraction. Irrigation was supplied through self-fashioned rings of pressure-compensated drip tubing (Netafilm, Fresno, CA, USA). Pressure-compensating emitters were made in 30.5 cm intervals along the length of the tubing. There were four emitters that were cut and rolled to form two loops joined by a T-barb. Each container had a joined loop which was connected to 19 mm polyethylene tubing using equal lengths of 6 mm tubing. Water application for 15 loops (15 plants) was calculated by Christensen’s coefficients of uniformity on each bench. The mean coefficient was 0.94 and ranged from 0.93 to 0.96. Typical application rates per bench were 187 mL per minute.
2.4. Data Collection
Greenhouse air temperature, relative humidity, wind speed, and solar radiation required for calculation of reference evapotranspiration (ET0) was collected from the automated Weatherhawk weather station. The algorithm used for calculating reference evapotranspiration (ET0) was based on the Campbell Scientific program.
Plant growth data were collected a week after potting. The widest width, width perpendicular to the widest width, and average height of the canopy were measured every three weeks on the lysimeter plants and adjacent four interior plants of each replication. The two widths were multiplied to estimate the two-dimensional PCA. When PCA was multiplied by the average height, canopy volume or growth index (GI) was estimated [34,35], assuming the three-dimensional canopy resembled a rectangular form. Plant water-use efficiency was calculated as total dry matter produced (g) by actual amount of water used (ETA) [36].
2.5. Modelling Plant Water Use
The %CC, ETA, ET0, and PCA [24,26,27] were utilized for modelling the daily water use of two plant species. The %CC at each measurement was calculated by adding half the PCA of each of the four border plants to the PCA of the lysimeter plant and dividing the sum by allocated bench space for each plant (929 cm2). This was the squared distance, at the center, between each plant. Since the containers were not respaced, canopies could become overlapped as shoots per plant expanded outward and up. The overlapping could result in calculation of %CC greater than 100% since it was determined on a fixed allocated bed area.
Daily ETA (cm3) of each lysimeter plant was converted to a depth by dividing with its PCA (cm2). ETA depth (cm) was then divided by the corresponding ET0 (cm) and averaged over the seven days to calculate WNI [WNI = (ETA/PCA)/ET0] [28] for each lysimeter plant at each measurement date. Obtained WNI values of the four lysimeter replicates for each date were plotted against their corresponding %CC values. The plot was fitted to a three-parameter exponential decay curve using SigmaPlot (Version10; SPSS Inc., Chicago, IL, USA). The plot was also fitted to a third-order inverse polynomial equation also using SigmaPlot. An equation for the nonlinear line was derived using a three-level inverse polynomial equation (Version10; SPSS Inc., Chicago, IL, USA).
3. Results
3.1. Reference Evapotranspiration
The ET derived from FAWN from September 2008 to April 2009 ranged from 1.02 to 4.83 mm with a mean of 2.36 mm. The ET from July 2009 to February 2010 varied from 1.02 to 5.58 mm with a mean of 2.75 mm. The ET0 values in the shaded greenhouse were about 12% of that outside the shaded greenhouse as measured by the FAWN station during the mentioned time. Relative humidity was normally higher, more than 75% inside the greenhouse. Air movement happened during most afternoons from early-Spring until late Fall due to the operation of evaporative cooling fans, although there was no measurable wind movement. Temperatures in the shaded greenhouse were also more moderate than outside conditions, with minimums set at 18.3 °C for heating and 32.2 °C for evaporative cooling. ET0 was highest in April and May (days 90 to 150), then declined the rest of the period with the onset of summer rains, then shorter days.
3.2. Plant Growth
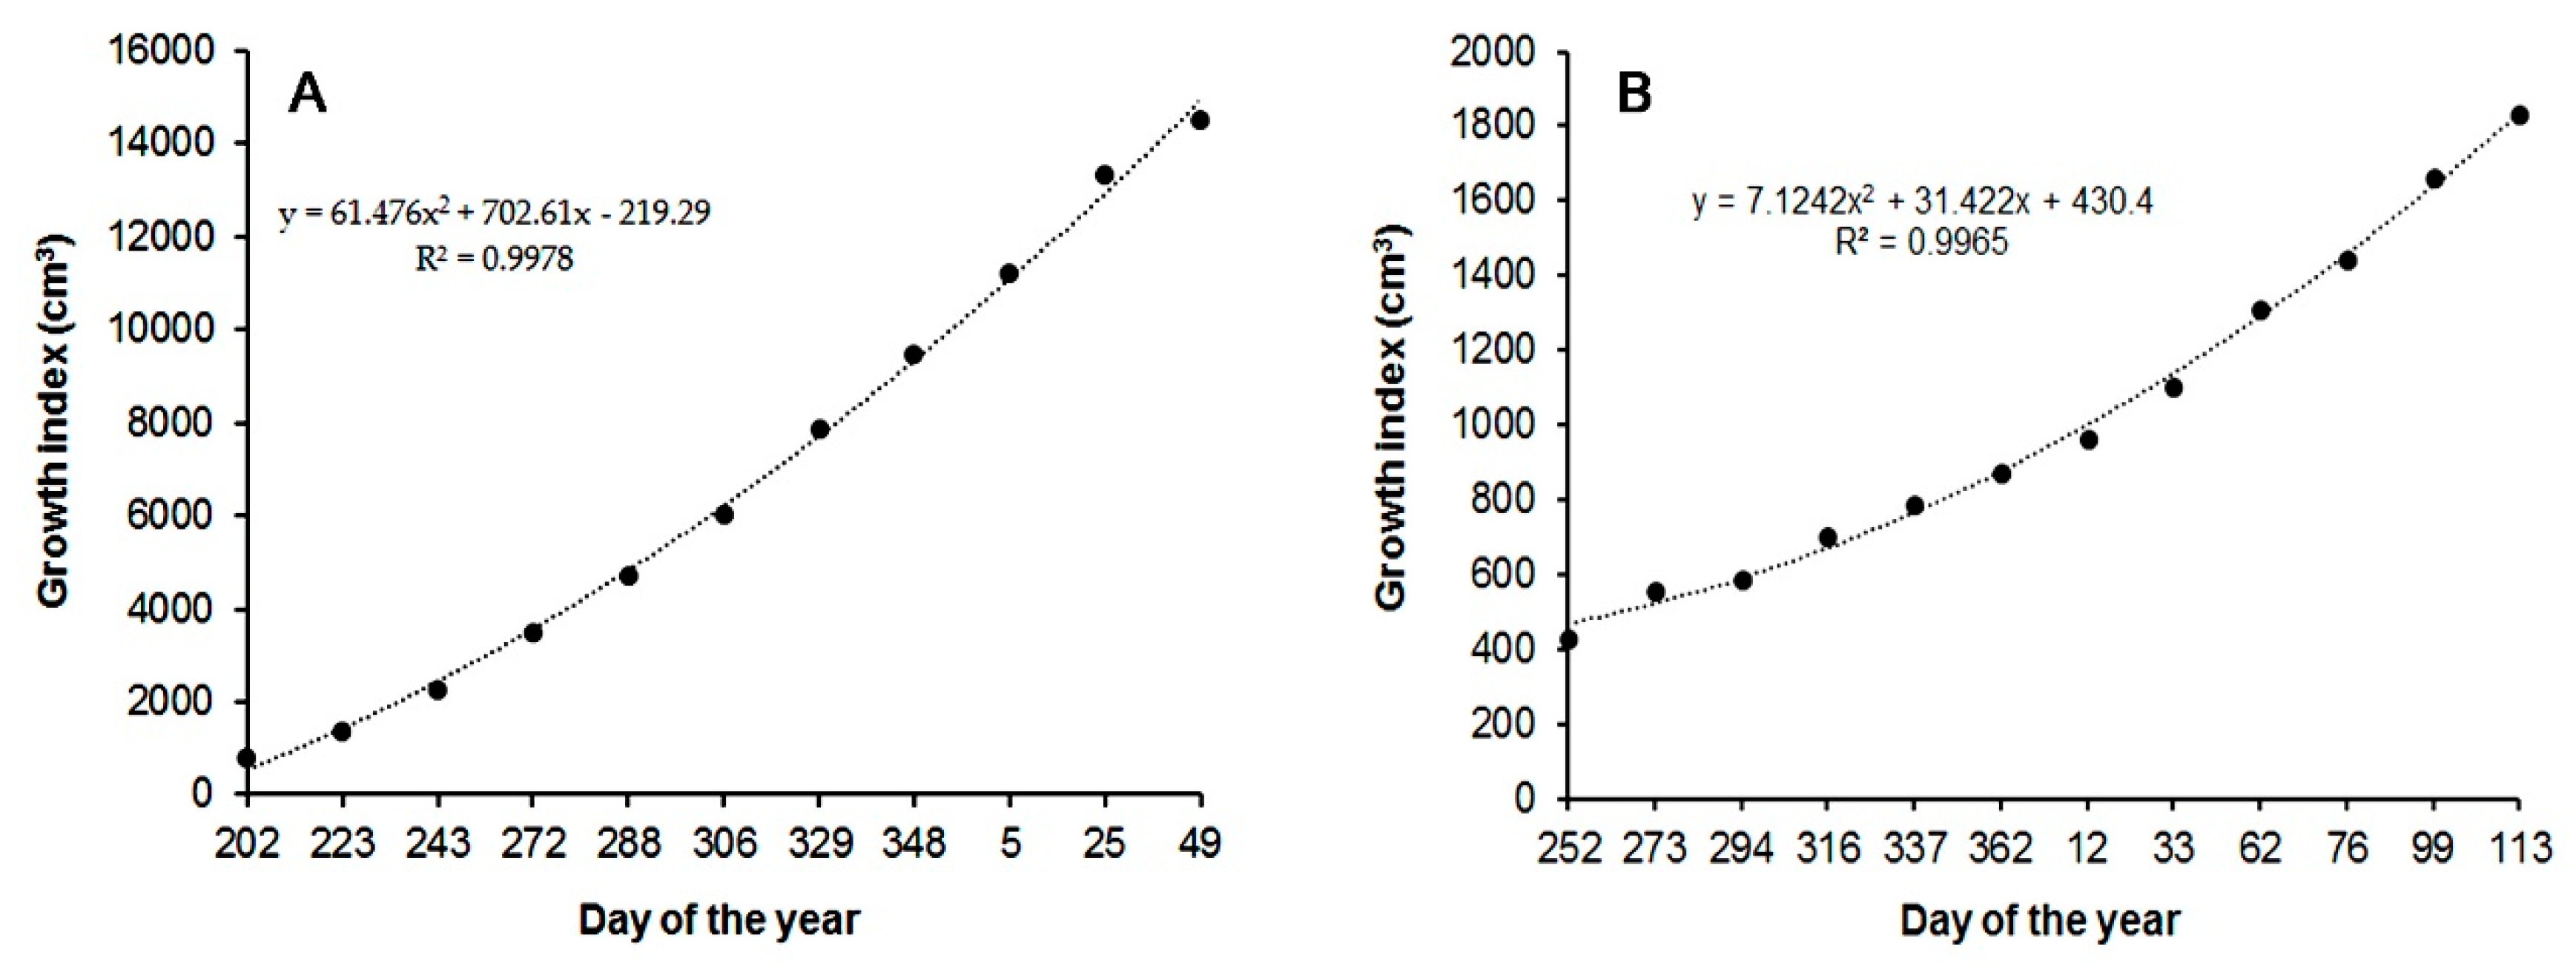
Canopy height and widths of Calathea ‘Silhouette’ increased in a polynomial fashion (data not shown). Growth index also increased polynomially (Figure 1A). Calathea ‘Silhouette’ at the time of harvest produced 19.4 leaves with a total leaf area of 852 cm2. Shoot and root fresh weights were 33.8 and 5.6 g; and shoot and root dry weights were 3.7 and 0.5 g, respectively (Table 1).
Canopy heights and widths of S. sanguinea increased linearly over the production time (data not shown), but canopy width and growth index increased polynomially (Figure 1B). At harvest, the mean number of leaves was 84 with a total leaf area of 2729.2 cm2. Shoot and root fresh weights were 110.7 and 42.2 g, and corresponding dry weights were 14.4 and 3.0 g, respectively (Table 1).
3.3. Plant Actual Evapotranspiration (ETA)
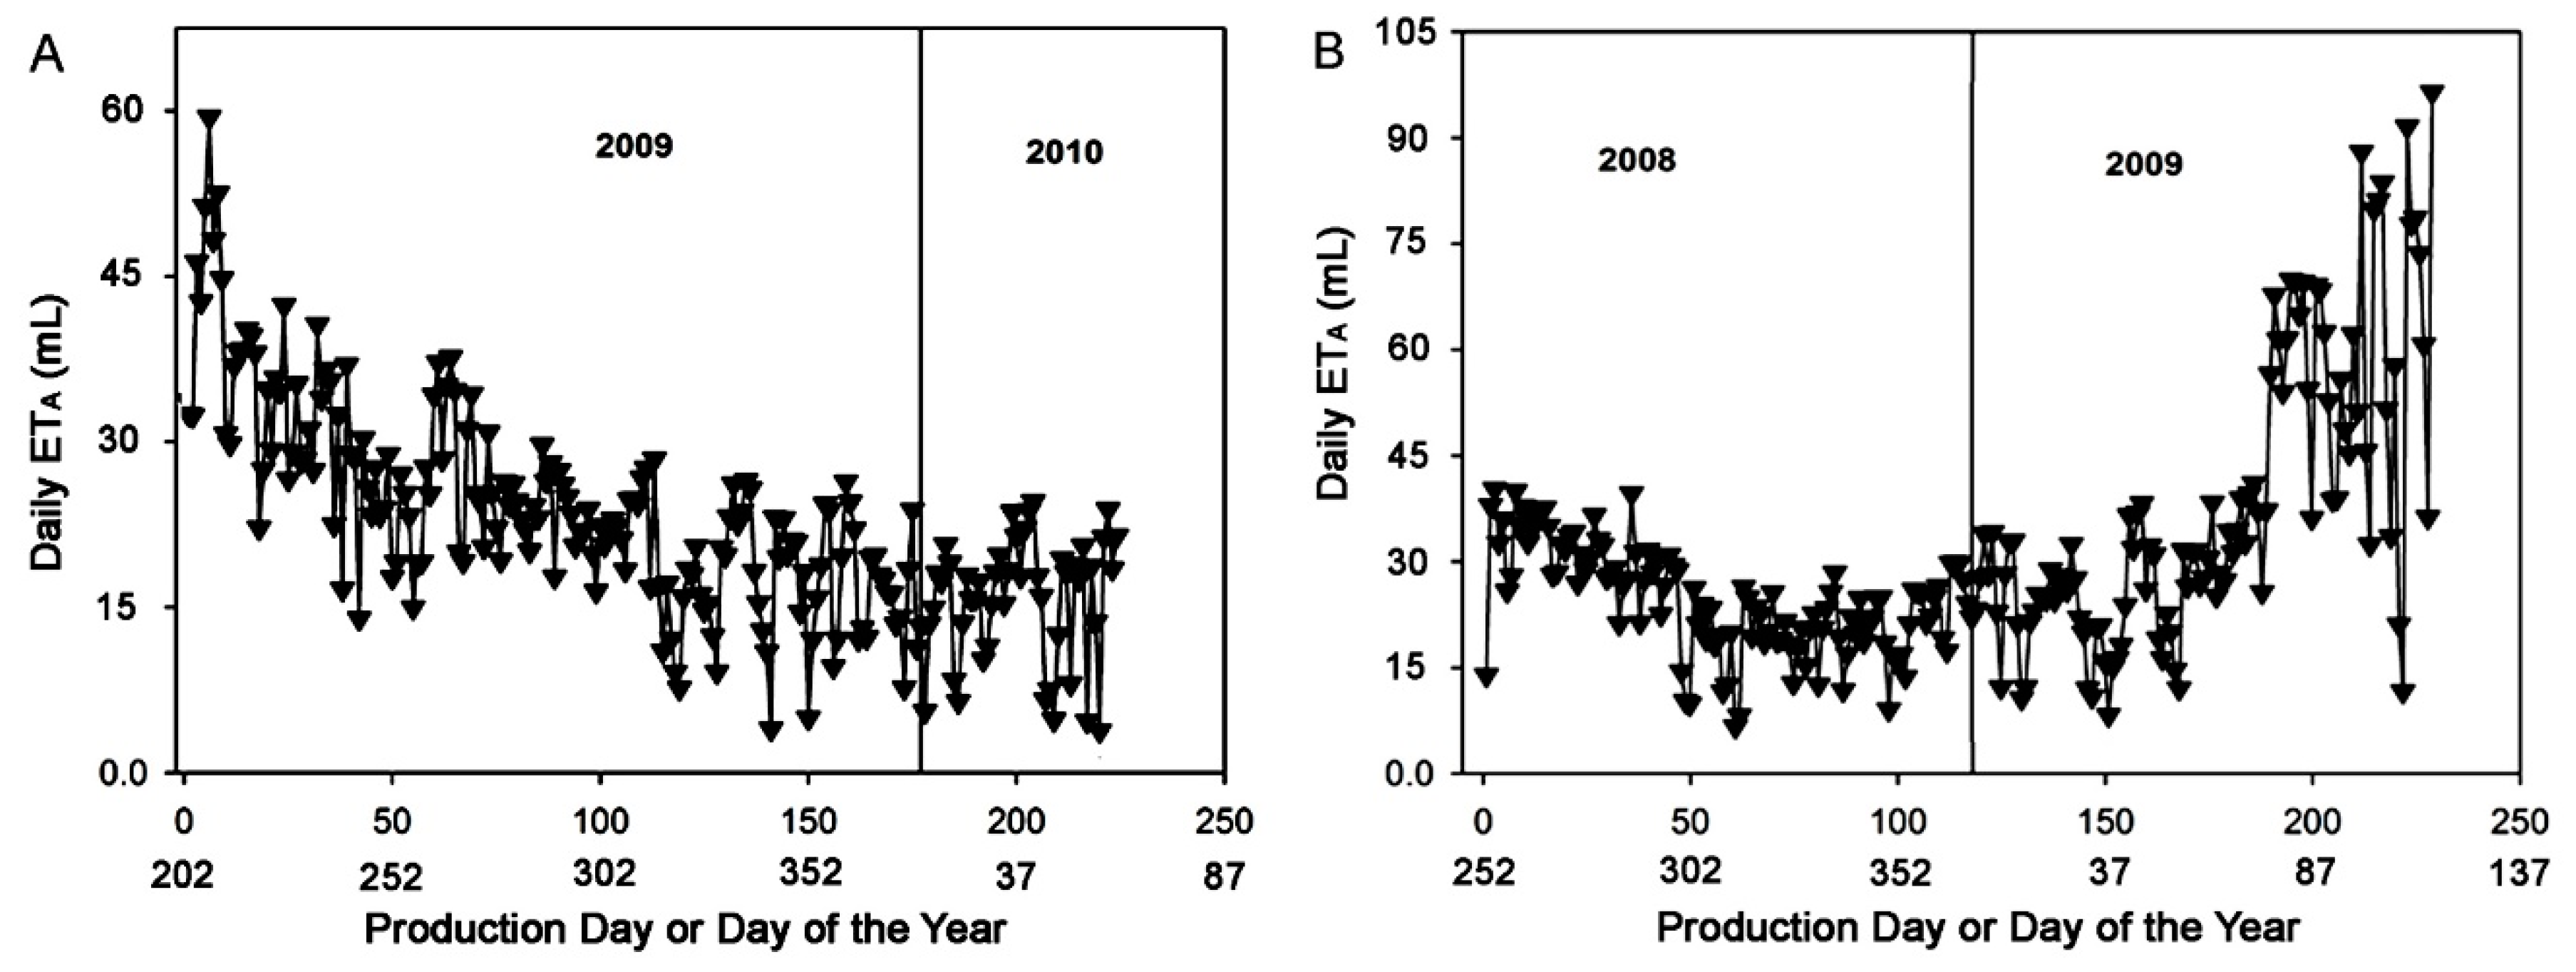
Daily ETA per Calathea ‘Silhouette’ plant ranged from 3.55 mL to 59.39 mL (Figure 2A) with an overall mean of 21.6 mL a day per plant. The mean cumulative ETA was 4.84 L over a 224 day production period that span mid-summer 2009 to mid-February 2010. Corresponding to the beginning of production in mid-summer and finishing in late winter, mean ETA was initially higher, up to 59.39 mL, then declined through the production period. By late October (day 120), mean ETA stopped declining, ranging generally from 11.83 to 23.66 mL per day until harvest.
Daily ETA for producing S. sanguinea ranged from 7.87 to 97.27 mL with a mean of 29.5 mL (Figure 2B). The mean cumulative ETA value was 6.81 L per plant during the entire production period. Mean daily ETA declined from transplanting through the end of the year. Mean ETA during this period decreased from 36.97 mL to 17.74 mL per day. Increases in mean ETA were slow to occur until early March 2009, when daily ETA increased from around 29.57 mL per day to a median of 73.93 mL per day over a 20 day period. The increase in mean daily ETA occurred due to large increases in daily variability. With the weeks before harvest, mean daily ETA ranged from 14.79 mL to nearly 97.27 mL per day.
3.4. Data Analysis and Modeling
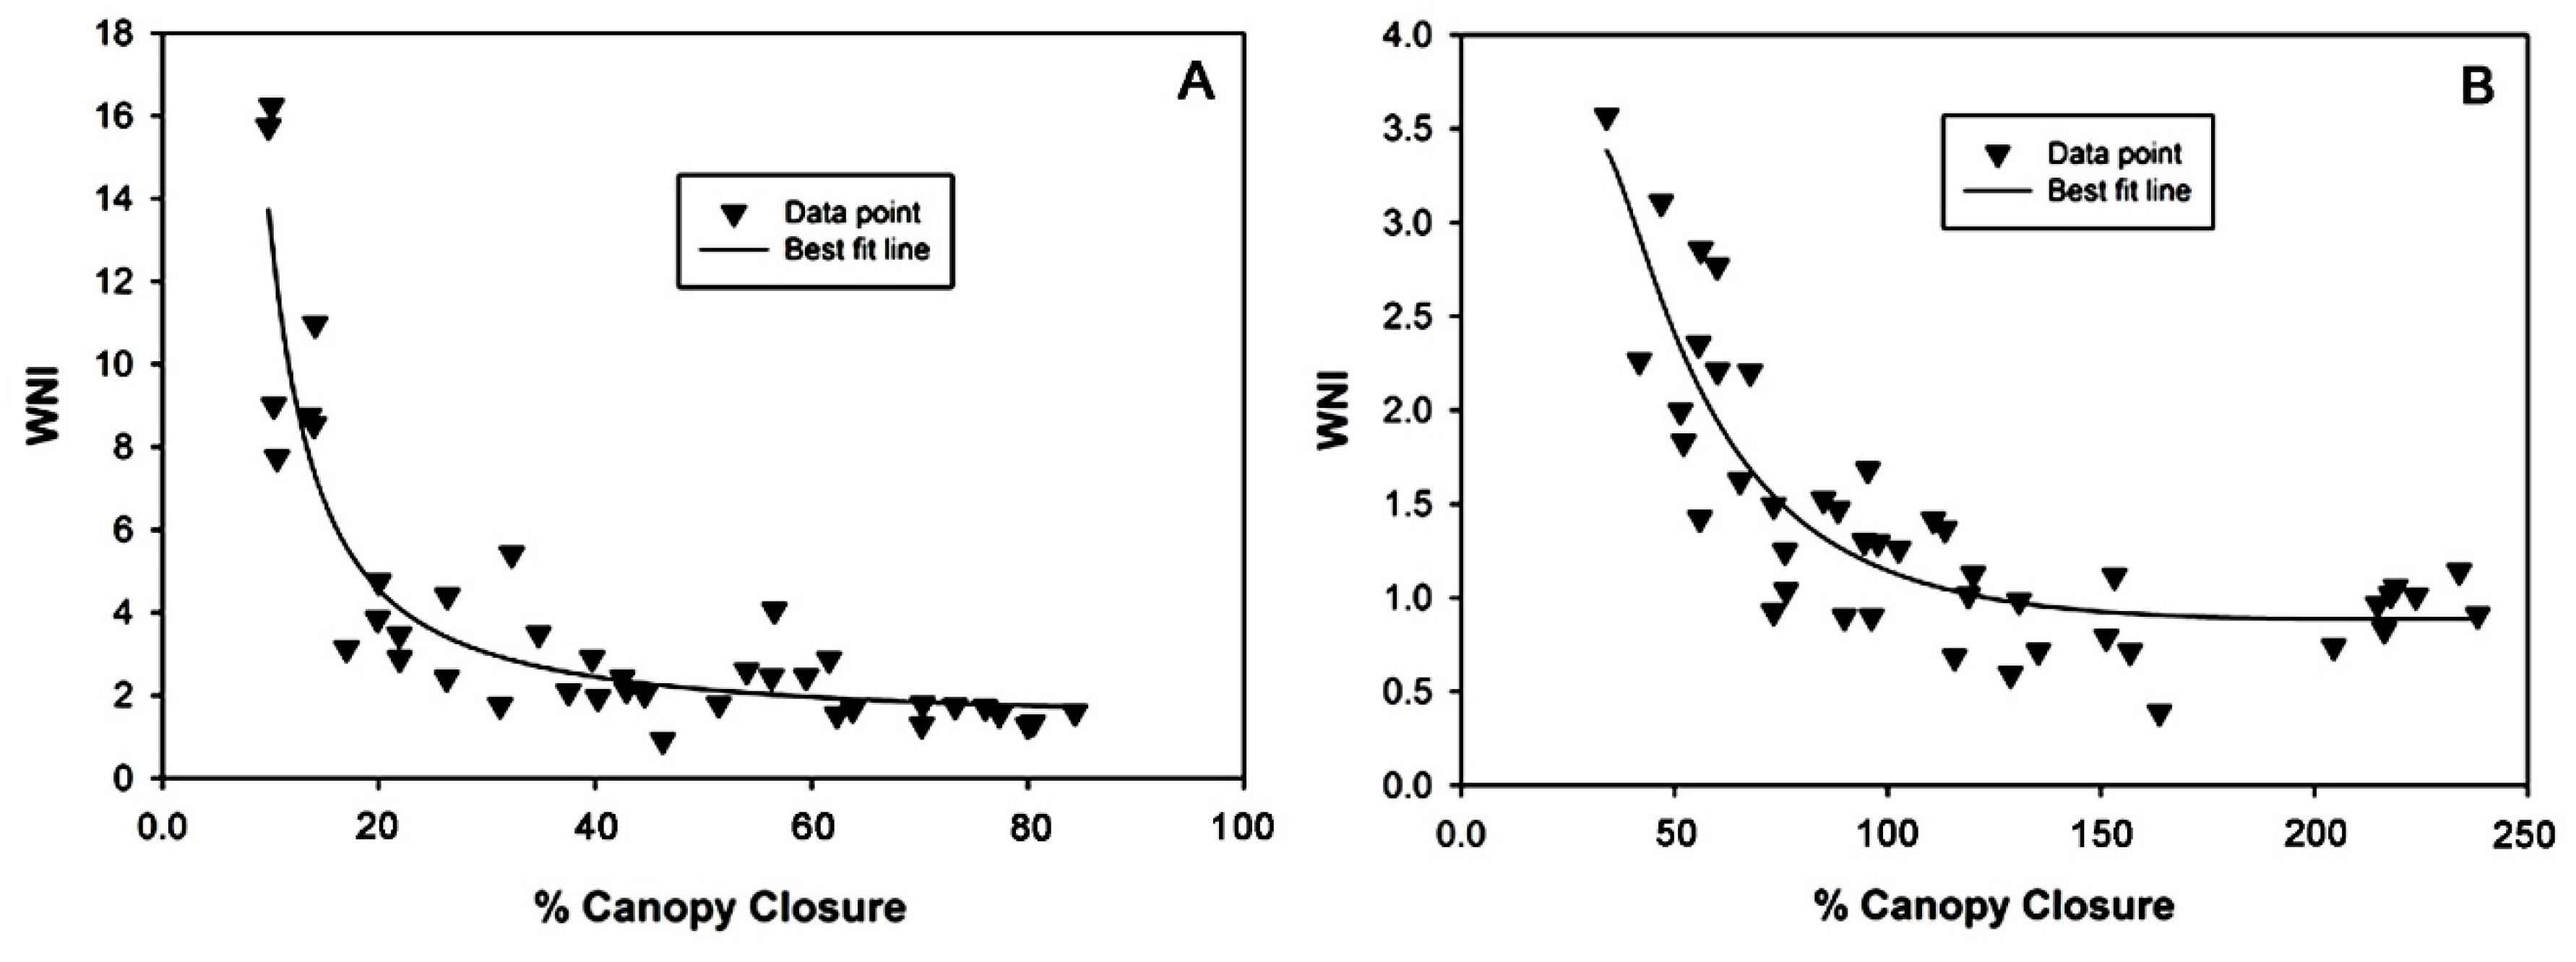
Application of the %CC model [26] was successful for both Calathea and Stromanthe with the best fit model presented in Table 2. The r2 values were 0.82 and 0.73 for Calathea and Stromanthe, respectively, suggesting that strong correlations occurred between WNI and %CC for the two species. The equations predicted the water use of individual plants. If means could have been derived from these individual plant measurements, such that the relationships were derived for populations of plants, the r2 would be even higher and predictions of overall crop water use would be more certain. The WNI coefficients declined as both plants’ growth increased, which was illustrated by the increase in %CC (Figure 3A,B). The decline in WNI was due to the increase in canopy boundary layer resistance as plant foliage expanded and filled in the gaps between containers. When reaching near 100% CC, transpiration of all but the upper leaves become decoupled from the air above the canopy, resulting in 40% deceases in whole plant transpiration outdoors [26]. Conversely, random removal of approximately 33% plant canopy coverage has been shown to increase individual plant transpiration by 40% [26].
4. Discussion
The present study investigated daily ETA of two important container-grown ornamental foliage plants, Calathea ‘Silhouette’ and S. sanguinea, from tissue-cultured liners to marketable sizes in a shaded greenhouse. Results showed that daily water requirements of Calathea varied from 3.55 mL to 59.39 mL over a 224 day production period, and the cumulative ETA for producing this plant was 4.84 L. The daily water requirements of S. sanguinea ranged from 7.87 mL to 97.27 mL and its cumulative ETA was 6.81 L. The cumulative ETA values were comparable to two other container-grown foliage plants, A. nidus and C. elegans [29], in which both were grown in 15 cm containers with cumulative ETA values of 7.95 L for A. nidus during a 294 day growth and 6.43 L for C. elegans during a 280 day production period. Although there has been little ETA information available about container plants produced in greenhouse conditions, we believe that the cumulative ETA data were valid. Researchers have produced foliage plants Codiaeum variegaturm ‘Petra’, Dieffenbachia maculate ‘Camelle’, and Spathiphyllum ‘Petite’ in 15 cm containers in an ebb-and-flow system from cuttings or tissue-cultured liners to marketable size [37]. Ebb-and-flow is a system where container plants on ebb-and-flow trays are subirrigated with recirculated nutrient solution. There is no irrigation water runoff, and the amount of water lost during the production can be quantified. The authors reported that the total amount of water used by the plants ranged from 6.8 L to 7.9 L depending on nitrogen rates. The same ebb-and-flow system has been used to produce 18 foliage plants across 15 genera in 15 cm containers in a shaded greenhouse and it has been found that the average amount of water required for producing these plants from cuttings or tissue culture liners to marketable sizes was 10.22 L [9]. The calculated amount of water loss on ebb-and-flow systems could be greater than those produced in the present study. This is because each ebb-and-flow tray has a surface area of 2.4 m2, and water or nutrient solution are flooded in the trays to a depth of 2.5 cm for 10 min one to three times a week, during which a certain amount of water was lost due to evaporation.
Results from this study showed that the canopy closure model and WNI developed for woody ornamental plants are suitable for modelling daily water requirements of container-grown foliage plants in greenhouse conditions. In the present study, canopy widths and height were recorded every three weeks, and PCA and %CC were calculated based on container size and spacing. Using %CC, Kc values were calculated. The Kc values were multiplied by PCA and ET0 to estimate the ETA on daily base. WNI was then calculated by the formula (ETA/PCA)/ET0 [28]. The plots of WNI as a function of %CC for both Calathea and Stromanthe (Figure 3A,B) were fitted to the equations presented in Table 2 with the correlation coefficients (r2) 0.82 and 0.73 for Calathea and Stromanthe, respectively. The modelling ETA based on the aforementioned method has several advantages [25]. Kc calculation is based on canopy closure, it should be independent from container size. It also should avoid the need to use Fourier curve transformations to account for changes in ETA or growth with season. Development of models based on canopy components should be easier to convert to predictive irrigation models than those that require complex transformation or provide Kc range only. On the other hand, if the %CC or PCA does not change, neither should the relationship of ETA to ET0, suggesting a period of canopy dormancy.
As far as is known, this is the first report on daily water use for Calathea and Stromanthe. This information along with ETA values estimated in another two foliage plants, Asplenium and Chamaedorea, showed that foliage plants have rather lower cumulative ETA values than other ornamental plants grown in greenhouses. For example, cumulative water use of two Petunia hybrida cultivars were 2.71 L and 4.08 L, respectively, when they were produced in 15 cm containers for 46 days [38]. The lower ETA is likely related to the natural habits of their origin. Foliage plants were predominantly understory plants [39]; their leaves have thicker cuticles; the plants require lower light levels and lower nutrient input for growth. As a result, their net photosynthetic and transpiration rates are lower [40]. Commercial production of foliage plants, however, has not fully considered these characteristics. Traditional overhead irrigation resulted in the runoff of 90% of irrigation water. Subsequent improvement on irrigation with a capillary mat used 19 L to 23 L of irrigation water per plant, and drip irrigation used 10 L to 12 L of water [41]. Compared to the cumulative ETA values ranging from 4.82 L to 7.95 L with those from either drip or capillary mat irrigation, irrigation of plants based ETA could substantially save freshwater in container-grown foliage plant production. Plants from more than 1000 species across more than 100 genera are grown as ornamental foliage plants [32], and water requirements and water use efficiency could vary among species. For example, the water use efficiency of Stromanthe is three times greater than that of Calathea (Table 1). To irrigate container-grown foliage plants based on their requirements, the ETA of each genus should be determined. The methodologies presented in this study provide an easy and affordable way to quantify daily water use, and the application of ETA information into irrigation practices should significantly improve irrigation efficiency and conserve freshwater resources.
5. Conclusions
The daily ETA established for Calathea and Stromanthe as well as those previously established for A. nidus and C. elegans suggest that the canopy closure model and WNI developed for woody ornamental plants are suitable for modelling daily water requirements of container-grown foliage plants produced in greenhouse conditions. The daily ETA established for Calathea and Stromanthe could be used as reference guidelines for improving irrigation practices in commercial production of foliage plants. The application of ETA should significantly reduce irrigation water runoff and leaching and conserve freshwater resources.
Author Contributions
Both authors conceptualized the present work, conducted in the experiments, analyzed the data, and drafted the manuscript.
Funding
This project was supported in part by the Southwest Florida Water Management District, Florida, USA.
Acknowledgments
The authors would like to thank Russell Caldwell for assistance in completion of the experiments and Caroline Roper for revising and editing the manuscript.
Conflicts of Interest
The authors declare no conflict of interest.
References
- Doll, P.; Fiedler, K.; Zhang, J. Global-scale analysis of river flow alterations due to water withdrawals and reservoirs. Hydrol. Earth Syst. Sci. 2009, 13, 2413–2432. [Google Scholar] [CrossRef] [Green Version]
- Food and Agricultural Organization of the United Nations. AQUASTAT—FAO’s Global Information System on Water and Agriculture; FAO: Rome, Italy, 2010. [Google Scholar]
- Kenny, J.F.; Barber, N.L.; Hutson, S.S.; Linsey, K.S.; Lovelace, J.K.; Maupin, M.A. Estimated Water Use in the United States in 2005; U.S. Geological Survey Circular: Reston, VA, USA, 2009.
- Chen, J.; Wei, X. Controlled-released fertilizers as a means to reduce nitrogen leaching and runoff in container-grown plant production. In Nitrogen in Agriculture-Updates; Khan, A., Fahad, S., Eds.; InTech Open: Rijeka, Croatia, 2018. [Google Scholar]
- Parrella, M.P.; Wagner, A.; Fujino, D.W. The floriculture and nursery industry’s struggle with invasive species. Am. Entomol. 2015, 61, 39–50. [Google Scholar] [CrossRef]
- CENSUS of Agriculture, United States Summary and State Data. 2007. Available online: http://www.agcensus.usda.gov/Publications/2007/Full_Report/usv1.pdf (accessed on 28 July 2018).
- Belayneh, B.E.; Lea-Cox, J.D.; Lichtenberg, E. Costs and benefits of implementing sensor-controlled irrigation in a commercial pot-in-pot container nursery. HortTechnology 2013, 23, 760–769. [Google Scholar]
- Chen, J.; Huang, Y.; Caldwell, R.D. Best management practices for minimizing nitrate leaching from container-grown nurseries. Sci. World J. 2001, 1, 96–102. [Google Scholar] [CrossRef] [PubMed]
- Chen, J.; Beeson, R.C., Jr.; Yeager, T.H.; Stamps, R.H.; Felter, L.A. Evaluation of captured rainwater and irrigation runoff for greenhouse foliage and bedding plant production. HortScience 2003, 38, 228–233. [Google Scholar]
- Beeson, R.C., Jr. Suspension lysimeter systems for quantifying water use and modulating water stress for crops grown in organic substrates. Agric. Water Manag. 2011, 98, 967–976. [Google Scholar] [CrossRef]
- Majsztrik, J.C.; Ristvey, A.G.; Lea-Cox, J.D. Water and nutrient management in the production of container-grown ornamentals. Hortic. Rev. 2011, 38, 253–297. [Google Scholar]
- Allen, R.G.; Pereira, L.S.; Raes, D.; Smith, M. Crop Evapotranspiration: Guidelines for Computing Crop Water Requirements—FAO Irrigation and Drainage Paper 56; Food and Agriculture Organization of the United Nations: Rome, Italy, 1998. [Google Scholar]
- Howell, T.A.; Evett, S.R. The Penman-Monteith Method. 2006. Available online: http://www.cprl.ars.usda.gov/wmru/pdfs/PM%20COLO%20Bar%202004%20cor-rected%209apr04.pdf (accessed on 4 September 2018).
- Campbell Scientific. Application Note 4-D; Campbell Scientific Ltd.: Logan, UT, USA, 1991. [Google Scholar]
- Jensen, M.E.; Burman, R.D.; Allen, R.G. Evapotranspiration and Irrigation Water Requirements. 1990. Available online: http://agris.fao.org/agris-search/search.do?recordID=US19910106366 (accessed on 28 July 2018).
- Allen, R.G.; Wright, J.L.; Pruitt, W.O.; Pereira, L.S. Water requirements. In Design and Operation of Farm Irrigation Systems; ASAE: St. Joseph, MN, USA, 2007. [Google Scholar]
- Bryla, D.R.; Trout, T.J.; Ayars, J.E. Weighing lysimeters for developing crop coefficients and efficient irrigation practices for vegetable crops. HortScience 2010, 45, 1597–1604. [Google Scholar]
- Thornthwaite, C.W. An approach toward a rational classification of climate. Geogr. Rev. 1948, 38, 55–94. [Google Scholar] [CrossRef]
- Fitzpatrick, G. Water budget determinations for container-grown ornamental plants. Proc. Fla. State Hortic. Soc. 1980, 93, 166–168. [Google Scholar]
- Fitzpatrick, G. Relative water demand in container-grown ornamental plants. HortScience 1983, 18, 760–762. [Google Scholar]
- Burger, D.W.; Hartin, J.S.; Hodel, D.R.; Lukaszewski, T.A.; Tjosvoid, S.A.; Wagner, S.A. Water use in California’s ornamental nurseries. Calif. Agric. 1987, 41, 7–8. [Google Scholar]
- Doorenbos, J.; Pruitt, W.O. Guidelines for Predicting Crop Water Requirements—FAO Irrigation and Drainage Paper 24; Food and Agriculture Organization of the United Nations: Rome, Italy, 1977. [Google Scholar]
- Beeson, R.C., Jr. Penman crop Coefficients for container growth landscape ornamentals. In Evapotranspiration and Irrigation Scheduling; Camp, C.R., Sadler, E.J., Yoder, R.E., Eds.; American Society of Agricultural Engineers: San Antonio, TX, USA, 1996. [Google Scholar]
- Beeson, R.C., Jr. Modeling actual evapotranspiration of Ligustrum japonicum from rooted cuttings to commercially marketable plants in 12 liter black polyethylene containers. Acta Hortic. 2004, 664, 71–77. [Google Scholar] [CrossRef]
- Beeson, R.C., Jr. Modeling irrigation requirements for landscape ornamentals. HortTechnology 2005, 15, 18–22. [Google Scholar]
- Beeson, R.C., Jr. Response of evapotranspiration of Viburnum odoratissimum to canopy closure and the implications for water conservation during production and in landscapes. HortScience 2010, 45, 359–364. [Google Scholar]
- Beeson, R.C., Jr. Modeling actual evapotranspiration of Viburnum odoratissimum during production from rooted cuttings to market size plants in 11.4-L containers. HortScience 2010, 45, 1260–1264. [Google Scholar]
- Beeson, R.C., Jr. Development of a simple reference evapotranspiration model for irrigation of woody ornamentals. HortScience 2012, 47, 264–268. [Google Scholar]
- Chen, J.; Beeson, R.C., Jr. Actual evapotranspiration of Asplenium nidus and Chamaedorea elegans during production from liners to marketable plants. Acta Hortic. 2013, 990, 339–344. [Google Scholar] [CrossRef]
- Hagen, E.; Mambuthiri, S.; Fulcher, A.; Geneve, R. Comparing substrate moisture-based daily water use and on-demand irrigation regimes for oakleaf hydrangea grown in two container sizes. Sci. Hortic. 2014, 179, 132–139. [Google Scholar] [CrossRef]
- Pershey, N.A.; Cregg, B.N.; Andresen, J.A.; Fernandez, R.T. Irrigating based on daily water use reduces nursery runoff volume and nutrient load without reducing growth of four conifers. HortScience 2015, 50, 1553–1561. [Google Scholar]
- Chen, J.; McConnell, D.B.; Norman, D.L.; Henny, R.J. The foliage plant industry. Hortic. Rev. 2004, 31, 47–112. [Google Scholar]
- USDA, USDA National Agricultural Statistics Service. Floriculture Crops 2015 Summary; USDA: Washington, DC, USA, 2016.
- Beeson, R.C., Jr. Relationship of plant growth and actual evapotranspiration to irrigation frequency based on managed allowable deficits for container nursery stock. J. Am. Soc. Hortic. Sci. 2006, 131, 140–148. [Google Scholar]
- Henny, R.J.; Holm, J.R.; Chen, J.; Scheiber, M. In vitro induction of tetraploids in Dieffenbachia x ‘Star Bright M-1’ by colchicine. HortScience 2009, 44, 646–650. [Google Scholar]
- Stanhill, G. Water use efficiency. Adv. Agron. 1987, 39, 53–85. [Google Scholar]
- Poole, R.T.; Conover, C.A. Fertilizers levels and medium affect foliage plant growth in an ebb and flow irrigation system. J. Environ. Hortic. 1992, 10, 81–86. [Google Scholar]
- Kim, J.; van Iersel, M.W.; Burnett, S.E. Estimating daily water use of two Petunia cultivars based on plant and environmental factors. HortScience 2011, 46, 1287–1293. [Google Scholar]
- Henny, R.J.; Chen, J. Cultivar development of ornamental foliage plants. Plant Breed. Rev. 2003, 23, 245–290. [Google Scholar]
- Wang, Q.; Chen, J. Variation in photosynthetic characteristics and leaf area contributes to Spathiphyllum cultivar differences in biomass production. Photosynthetica 2003, 41, 443–447. [Google Scholar] [CrossRef]
- Neal, C.A.; Henley, R.W. Water use and runoff comparisons of greenhouse irrigation systems. Proc. Fla. State Hortic. Soc. 1992, 105, 191–194. [Google Scholar]
Figure 1.
Growth indices (cm3) of Calathea ‘Silhouette’ (A) and Stromanthe sanguinea (B) grown in 15 cm containers from tissue-cultured liners to marketable sizes. The equations are the best fit line (dash).
Figure 1.
Growth indices (cm3) of Calathea ‘Silhouette’ (A) and Stromanthe sanguinea (B) grown in 15 cm containers from tissue-cultured liners to marketable sizes. The equations are the best fit line (dash).

Figure 2.
Mean daily actual evapotranspiration (ETA) of Calathea ‘Silhouette’ (A) and Stromanthe sanguinea (B) grown in 15 cm containers during production from tissue-cultured liners to marketable sizes. Each triangle is the mean daily ETA of four plant replicates. The vertical line separates the year.

Figure 3.
Inverse polynomial relationship between % Canopy Closure (CC) and the water need index (WNI) for Calathea ‘Silhouette’ (A) and Stromanthe sanguinea (B). Data points are four plant replicates, and the equation for the best fit line present in Table 2.
Figure 3.
Inverse polynomial relationship between % Canopy Closure (CC) and the water need index (WNI) for Calathea ‘Silhouette’ (A) and Stromanthe sanguinea (B). Data points are four plant replicates, and the equation for the best fit line present in Table 2.


Table 1.
Plant growth measurements at harvest by species. Plants were harvested when common commercial canopy sizes were attained z.
Table 1.
Plant growth measurements at harvest by species. Plants were harvested when common commercial canopy sizes were attained z.
| Plant | Mean Leaf No | Leaf Area (cm2) | Shoot Fresh Weight (g) | Root Fresh Weight (g) | Shoot Dry Weight (g) | Root Dry Weight (g) | Water Use Efficiency (g L−1) y |
|---|---|---|---|---|---|---|---|
| Calathea | 19.4 ± 0.59 | 852.0 ± 54.60 | 33.8 ± 2.40 | 5.6 ± 0.37 | 3.7 ± 0.33 | 0.5 ± 0.04 | 0.87 |
| Stromanthe | 84.0 ± 2.49 | 2729.2 ± 68.36 | 110.7 ± 3.10 | 42.2 ± 1.35 | 14.4 ± 0.17 | 3.0 ± 0.08 | 2.56 |
z Values represent the means ± standard errors of four replications. y Water use efficiency = the ratio of total dry weight (g) to total amount of water used (L).
Table 2.
Best fit models for predicting daily ETA values of Calathea ‘Silhouette’ and Stromanthe sanguinea during production from tissue-cultured liners to marketable sizes in 15 cm containers.
Table 2.
Best fit models for predicting daily ETA values of Calathea ‘Silhouette’ and Stromanthe sanguinea during production from tissue-cultured liners to marketable sizes in 15 cm containers.
| Species | Model Equation | r2 |
|---|---|---|
| Calathea | WNI = 1.213 + 0.383/%CC + 0.032/(%CC)2 + 0.005/(%CC)3 | 0.82 |
| Stromanthe | WNI = 1.136 − 1.131/%CC + 1.395/(%CC)2 − 0.255/(%CC)3 | 0.73 |
© 2018 by the authors. Licensee MDPI, Basel, Switzerland. This article is an open access article distributed under the terms and conditions of the Creative Commons Attribution (CC BY) license (http://creativecommons.org/licenses/by/4.0/).
Share and Cite
MDPI and ACS Style
Beeson, R.C., Jr.; Chen, J. Quantification of Daily Water Requirements of Container-Grown Calathea and Stromanthe Produced in a Shaded Greenhouse. Water 2018, 10, 1194. https://doi.org/10.3390/w10091194
AMA Style
Beeson RC Jr., Chen J. Quantification of Daily Water Requirements of Container-Grown Calathea and Stromanthe Produced in a Shaded Greenhouse. Water. 2018; 10(9):1194. https://doi.org/10.3390/w10091194
Chicago/Turabian StyleBeeson, Richard C., Jr., and Jianjun Chen. 2018. "Quantification of Daily Water Requirements of Container-Grown Calathea and Stromanthe Produced in a Shaded Greenhouse" Water 10, no. 9: 1194. https://doi.org/10.3390/w10091194
Note that from the first issue of 2016, this journal uses article numbers instead of page numbers. See further details here.