Threshold Responses of Macroinvertebrate Communities to Stream Velocity in Relation to Hydropower Dam: A Case Study from The Guayas River Basin (Ecuador)

 , , ,
, , ,
Abstract
:1. Introduction
2. Materials and Methods
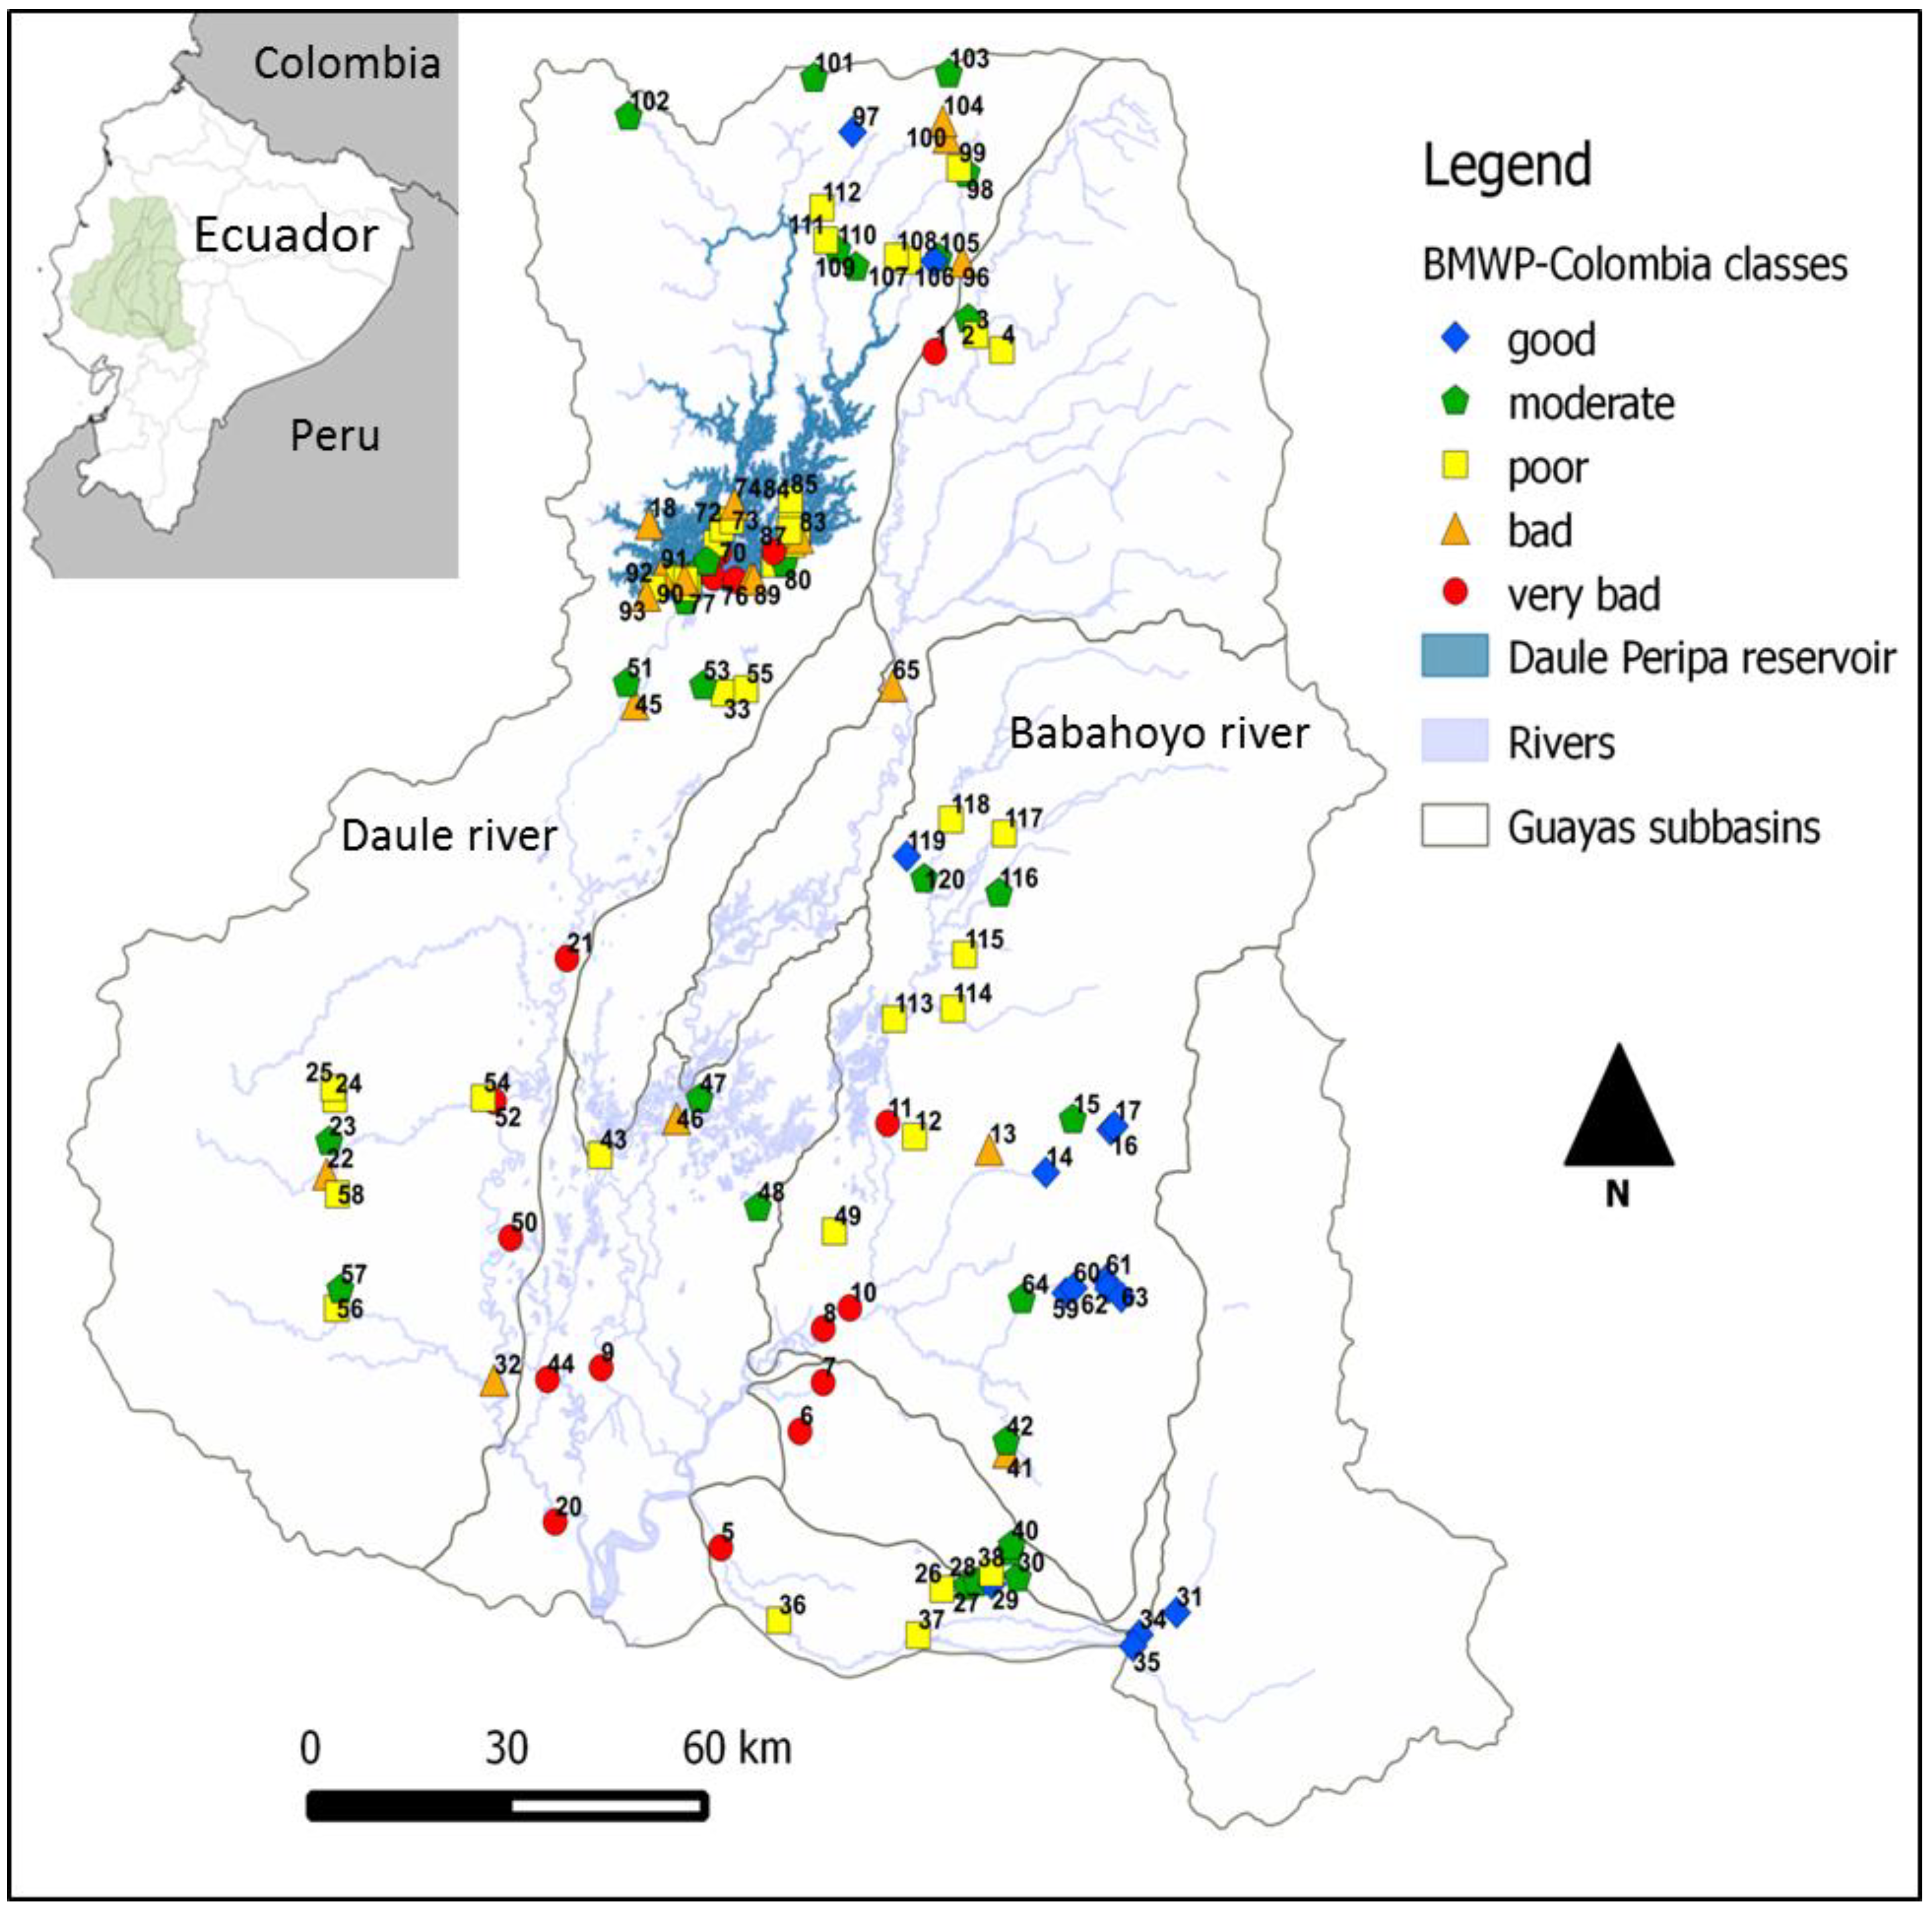
2.1. Study Area
2.2. Sampling and Assessment Methods
2.3. Data Analysis
2.3.1. Relationship between Physical–Chemical Conditions and Macroinvertebrate Communities
2.3.2. Threshold Change Points and Indicator Taxa
3. Results
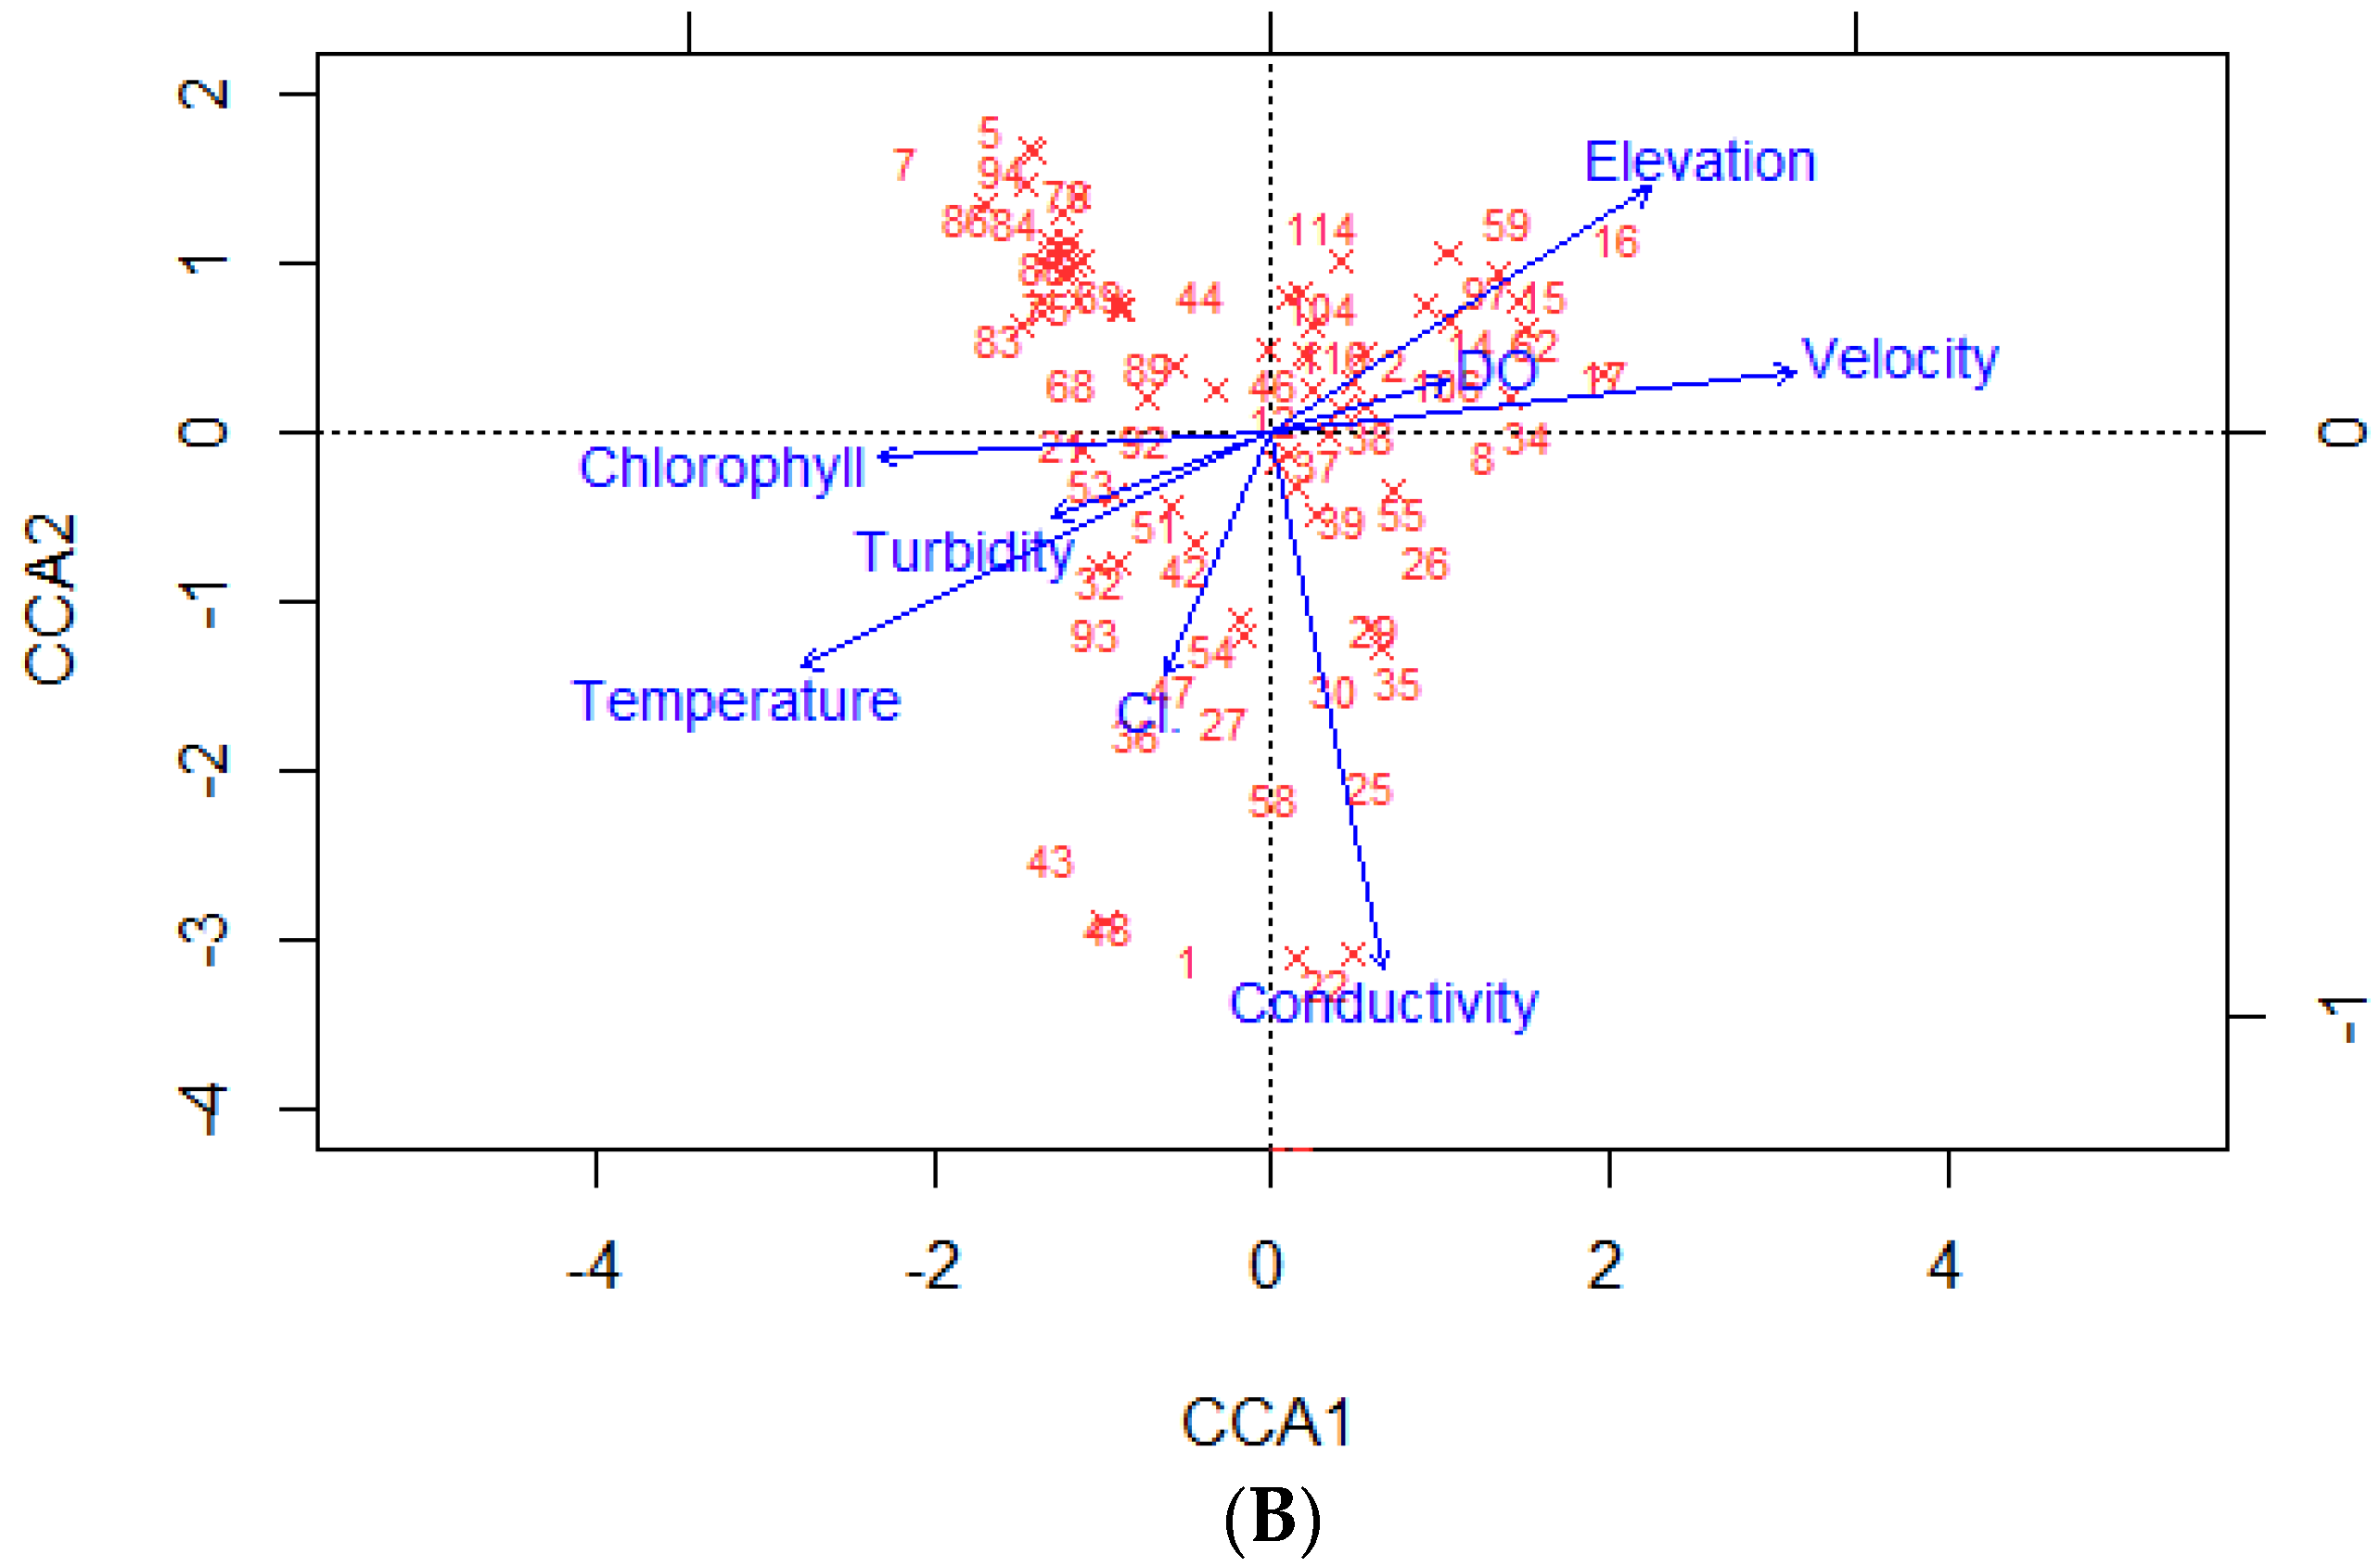
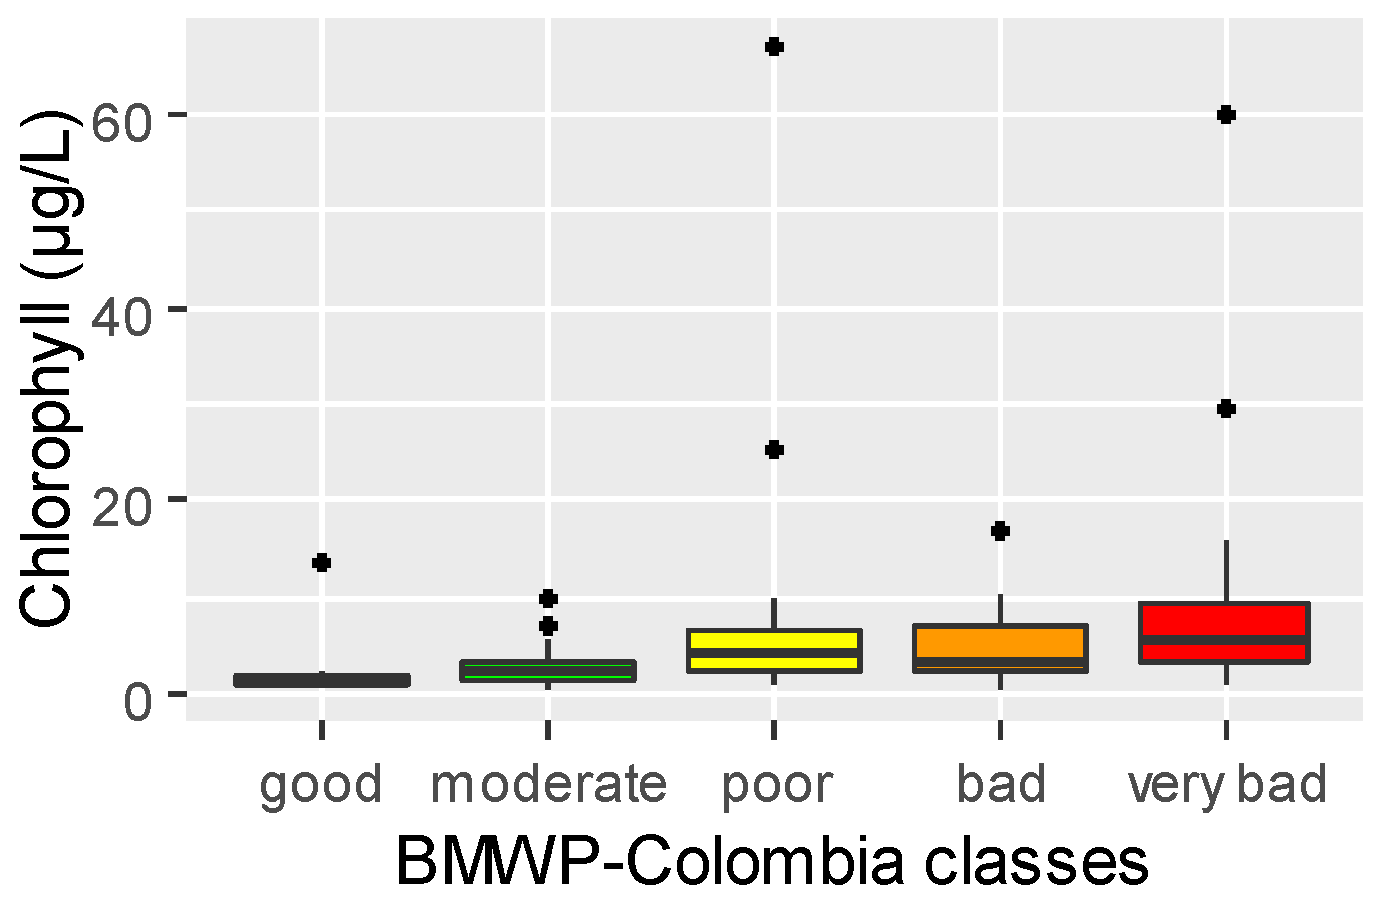
3.1. Relationship between Physical–Chemical Conditions and Macroinvertebrate Communities
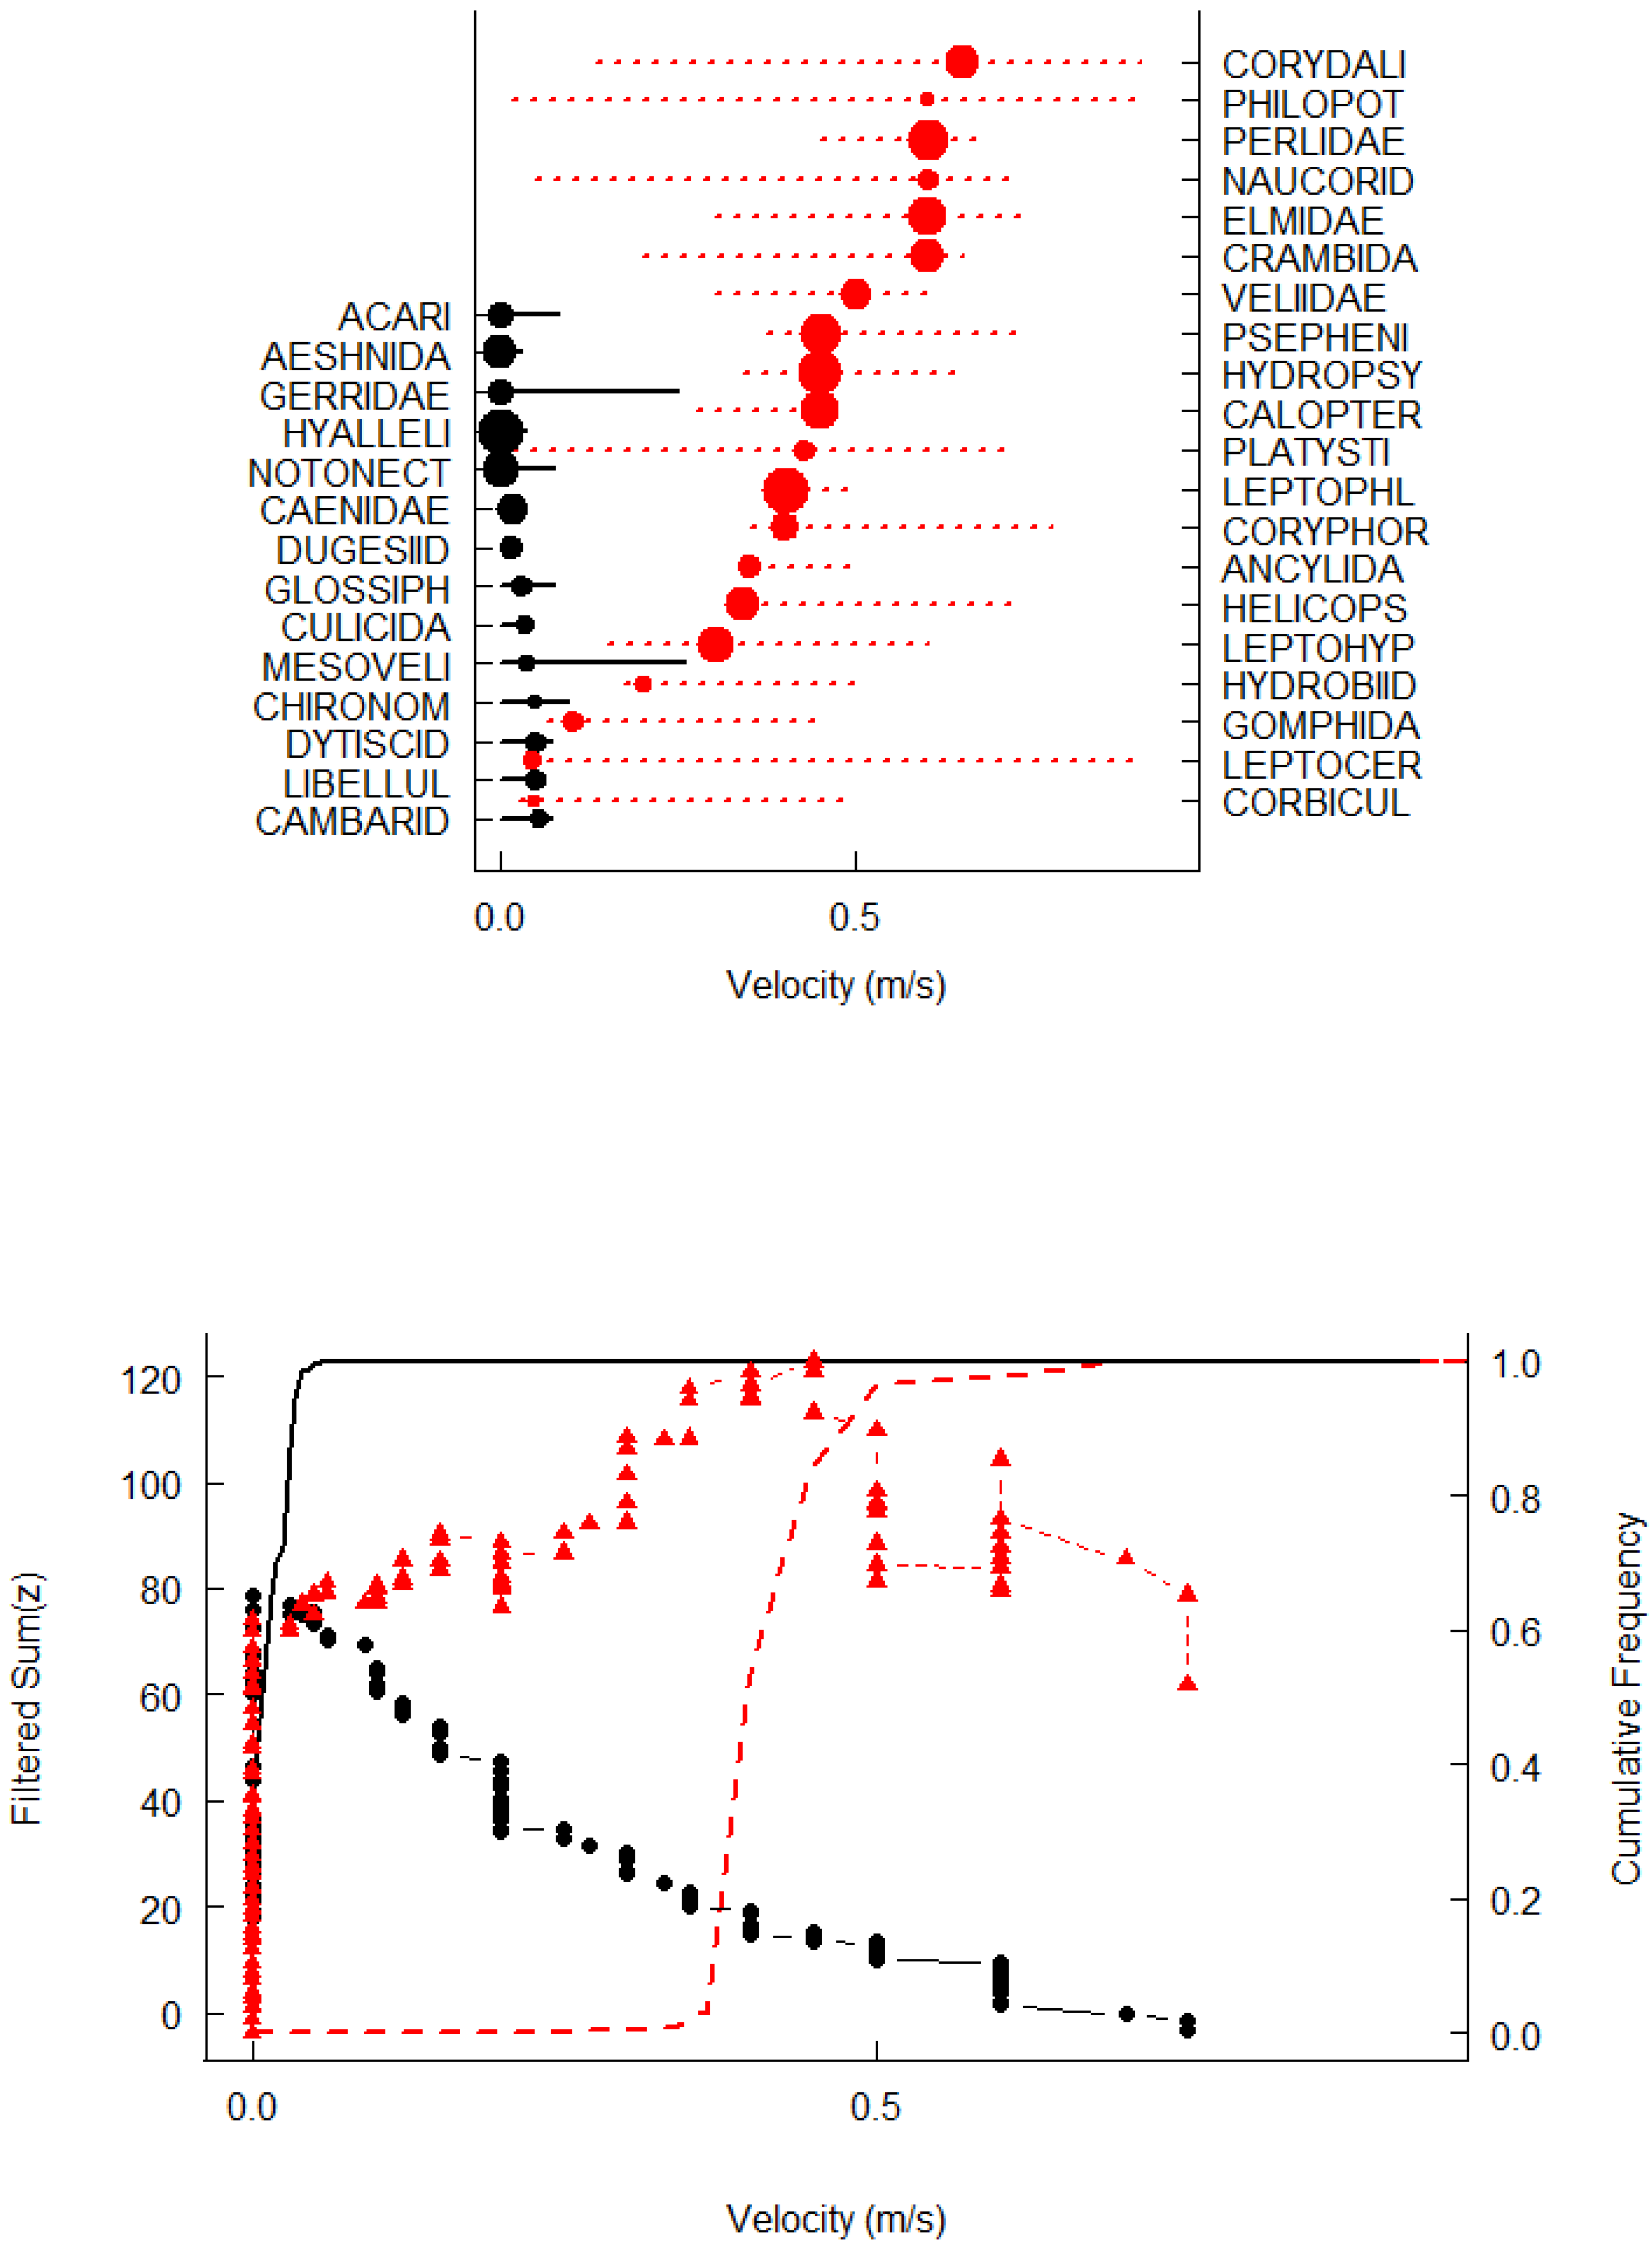
3.2. Threshold Change Points and Indicator Taxa
4. Discussions
4.1. Environmental Influences on the Macroinvertebrate Community
4.2. The Threshold Responses of the Macroinvertebrate Community to Stream Velocity
4.3. Recommendations for River Management
5. Conclusions
Supplementary Materials
Author Contributions
Funding
Acknowledgments
Conflicts of Interest
References
- Benetti, C.J.; Perez-Bilbao, A.; Garrido, J. Macroinvertebrates as indicators of water quality in running waters: 10 years of research in rivers with different degrees of anthropogenic impacts. Ecol. Water Qual. Water Treat. Reuse 2012. [Google Scholar]
- Vorosmarty, C.J.; McIntyre, P.B.; Gessner, M.O.; Dudgeon, D.; Prusevich, A.; Green, P.; Glidden, S.; Bunn, S.E.; Sullivan, C.A.; Liermann, C.R.; et al. Global threats to human water security and river biodiversity. Nature 2010, 467, 555–561. [Google Scholar] [CrossRef] [PubMed] [Green Version]
- Berger, E.; Haase, P.; Oetken, M.; Sundermann, A. Field data reveal low critical chemical concentrations for river benthic invertebrates. Sci. Total Environ. 2016, 544, 864–873. [Google Scholar] [CrossRef] [PubMed]
- Carpenter, S.R.; Stanley, E.H.; Zanden, M.J.V. State of the world’s freshwater ecosystems: Physical, chemical, and biological changes. Annu. Rev. Environ. Res. 2011, 36, 75–99. [Google Scholar] [CrossRef]
- Allan, J.D. Landscapes and riverscapes: The influence of land use on stream ecosystems. Annu. Rev. Ecol. Evol. Syst. 2004, 35, 257–284. [Google Scholar] [CrossRef]
- Richter, B.D.; Mathews, R.; Harrrison, D.L.; Wigington, R. Ecologically sustainable water management: Managing river flows for ecological integrity. Ecol. Appl. 2003, 13, 206–224. [Google Scholar] [CrossRef]
- King, R.S.; Baker, M.E. Considerations for analyzing ecological community thresholds in response to anthropogenic environmental gradients. J. N. Am. Benthol. Soc. 2010, 29, 998–1008. [Google Scholar] [CrossRef] [Green Version]
- Forio, M.A.E.; Goethals, P.L.M.; Lock, K.; Asio, V.; Bande, M.; Thas, O. Model-based analysis of the relationship between macroinvertebrate traits and environmental river conditions. Environ. Model. Softw. 2018, 106, 57–67. [Google Scholar] [CrossRef]
- Baker, M.E.; King, R.S. A new method for detecting and interpreting biodiversity and ecological community thresholds. Meth. Ecol. Evol. 2010, 1, 25–37. [Google Scholar] [CrossRef] [Green Version]
- Wallace, A.; Biastoch, R. Detecting changes in the benthic invertebrate community in response to increasing chloride in streams in Toronto, Canada. Freshw. Sci. 2016, 35, 353–363. [Google Scholar] [CrossRef]
- Schroder, M.; Sondermann, M.; Sures, B.; Hering, D. Effects of salinity gradients on benthic invertebrate and diatom communities in a German lowland river. Ecol. Indic. 2015, 57, 236–248. [Google Scholar] [CrossRef]
- Kovalenko, K.E.; Brady, V.J.; Brown, T.N.; Ciborowski, J.J.H.; Danz, N.P.; Gathman, J.P.; Host, G.E.; Howe, R.W.; Johnson, L.B.; Niemi, G.J.; et al. Congruence of community thresholds in response to anthropogenic stress in great lakes coastal wetlands. Freshw. Sci. 2014, 33, 958–971. [Google Scholar] [CrossRef]
- King, R.S.; Baker, M.E. Use, misuse, and limitations of threshold indicator taxa analysis (titan) for natural resource management. In Application of Threshold Concepts in Natural Resource Decision Making; Springer: New York, NY, USA, 2014. [Google Scholar]
- Arias-Hidalgo, M.E. A Decision Framework for Integrated Wetland-River Basin Management in a Tropical and Data Scarce Environment; Delft University of Technology: Delft, The Netherlands, 2012. [Google Scholar]
- Andres, C.B. Sedimentation Processes at the Confluence of the Daule and Babahoyo Rivers, Guayaquil, Ecuador. El Palmar Island; The University of Birmingham: Birmingham, UK, 2009. [Google Scholar]
- Waite, P.J. Competition for Water Resources of the Rio Guayas, Ecuador, Optimal Allocation of Water Resources; IAHS: Exeter, UK, 1982. [Google Scholar]
- Madonado, M.E.S. Remote Sensing Based Hydrologic Modeling in the Babahoyo River Sub-Basin for Water Balance Assessment; University of Twente: Enschede, The Netherlands, 2011. [Google Scholar]
- Alvarez-Mieles, G.; Irvine, K.; Griensven, A.V.; Arias-Hidalgo, M.; Torres, A.; Mynett, A.E. Relationships between aquatic biotic communities and water quality in a tropical river-wetland system (Ecuador). Environ. Sci. Policy 2013, 34, 115–127. [Google Scholar] [CrossRef]
- Forio, M.A.E.; Landuyt, D.; Bennetsen, E.; Lock, K.; Nguyen, T.H.T.; Ambarita, M.N.D.; Musonge, P.L.S.; Boets, P.; Everaert, G.; Dominguez-Granda, L.; et al. Bayesian belief network models to analyse and predict ecological water quality in rivers. Ecol. Model. 2015, 312, 222–238. [Google Scholar] [CrossRef]
- Damanik-Ambarita, M.N.; Lock, K.; Boets, P.; Everaert, G.; Nguyen, T.H.T.; Forio, M.A.E.; Musonge, P.L.S.; Suhareva, N.; Bennetsen, E.; Landuyt, D.; et al. Ecological water quality analysis of the Guayas river basin (Ecuador) based on macroinvertebrates indices. Limnol. Ecol. Manag. Inland Waters 2016, 57, 27–59. [Google Scholar] [CrossRef]
- Forio, M.A.E.; Mouton, A.; Lock, K.; Boets, P.; Nguyen, T.H.T.; Damanik Ambarita, M.N.; Musonge, P.L.S.; Dominguez-Granda, L.; Goethals, P.L.M. Fuzzy modelling to identify key drivers of ecological water quality to support decision and policy making. Environ. Sci. Policy 2017, 68, 58–68. [Google Scholar] [CrossRef]
- Gelati, E.; Madsen, H.; Rosbjerg, D. Stochastic reservoir optimization using el nino information: Case study of Aaule Peripa, Ecuador. Hydrol. Res. 2011, 42, 413–431. [Google Scholar] [CrossRef]
- Arriaga, L. The daule-peripe dam project, urban development of guayaquil and their impact on shrimp mariculture. In A Sustainable Shrimp Mariculture Industryfor Ecuador; The University of Rhode Island: Kingston, RI, USA, 1989. [Google Scholar]
- CELEC. Revista 25 anos de la Presa Daule-Peripa. Available online: http://www.Hidronacion.org (accessed on 25 October 2016).
- Camposano, D.E.M. Predicting River Concentrations of Pesticides from Banana Plantations under Data-Poor Conditions. Ph.D. Thesis, Ghent University, Gent, Belgium, June 2004. [Google Scholar]
- USEPA. Volunteer Stream Monitoring: A Methods Manual. Available online: http://www.water-research.net/Waterlibrary/Lake/STREAM.PDF (accessed on 19 November 2017).
- Gabriels, W.; Lock, K.; De Pauw, N.; Goethals, P.L.M. Multimetric macroinvertebrate index flanders (mmif) for biological assessment of rivers and lakes in Flanders (Belgium). Limnol. Ecol. Manag. Inland Waters 2010, 40, 199–207. [Google Scholar] [CrossRef]
- Domínguez, E.; Fernández, H.R. Macroinvertebrados Bentónicos Sudameri-Canos: Sistemática y Biología; Fundación Miguel Lillo: Tucumán, Argentina, 2009. [Google Scholar]
- Dominguez-Granda, L.; Lock, K.; Goethals, P. Using multi-target clustering trees as a tool to predict biological water quality indices based on benthic macroinvertebrates and environmental parameters in the Chaguana watershed (Ecuador). Ecol. Inform. 2011, 6, 303–308. [Google Scholar] [CrossRef]
- Mereta, S.T.; Boets, P.; Meester, L.D.; Goethals, P.L.M. Development of a multimetric index based on benthic macroinvertebrates for the assessment of natural wetlands in southwest Ethiopia. Ecol. Indic. 2013, 2013, 510–521. [Google Scholar] [CrossRef]
- Everaert, G.; Neve, J.D.; Boets, P.; Dominguez-Granda, L.; Mereta, S.T.; Ambelu, A.; Hoang, T.H.; Goethals, P.L.M.; Thas, O. Comparison of the abiotic preferences of macroinvertebrates in tropical river basins. PLoS ONE 2014, 9, e108898. [Google Scholar] [CrossRef] [PubMed]
- Forio, M.A.E.; Lock, K.; Radam, E.D.; Bande, M.; Asio, V.; Goethals, P. Assessment and analysis of ecological quality, macroinvertebrate communities and diversity in rivers of a multifunctional tropical island. Ecol. Indic. 2017, 77, 228–238. [Google Scholar] [CrossRef]
- Sharifinia, M.; Mahmoudifard, A.; Namin, J.I.; Ramezanpour, Z.; Yap, C.K. Pollution evaluation in the shahrood river: Do physico-chemical and macroinvertebrate-based indices indicate same responses to anthropogenic activities? Chemosphere 2016, 159, 584–594. [Google Scholar] [CrossRef] [PubMed]
- Zuniga, M.C.; Cardona, W. Water quality and environmental flow bioindicators. In Environmental Flow: Concepts, Experiences and Challenges; Del Valle University: Cali, Colombia, 2009. [Google Scholar]
- Zuur, A.F.; Ieno, E.N.; Elphick, C.S. A protocol for data exploration to avoid common statistical problems. Meth. Ecol. Evol. 2010, 1, 3–14. [Google Scholar] [CrossRef]
- Šmilauer, P.; Lepš, J. Multivariate Analysis of Ecological Data Using Canoco; Cambridge University Press: Cambridge, UK, 2014. [Google Scholar]
- Paliy, O.; Shankar, V. Application of multivariate statistical techniques in microbial ecology. Mol. Ecol. 2016, 25, 1032–1057. [Google Scholar] [CrossRef] [PubMed] [Green Version]
- Ter Braak, C.J.F.; Verdonschot, P.F.M. Canonical correspondence analysis and related multivariate methods in aquatic ecology. Aquat. Sci. 1995, 57, 255–289. [Google Scholar] [CrossRef]
- Oksanen, J.; Blanchet, F.G.; Kindt, R.; Legendre, P.; Minchin, P.R.; O’Hara, R.B.; Simpson, G.L.; Solymos, P.; Stevens, M.H.H.; Wagner, H. Package ‘Vegan’. Available online: https://cran.R-project.Org, https://github.Com/vegandevs/vegan (accessed on 5 January 2016).
- Zar, J.H. Biostatistical Analysis; Northern Illinois University: DeKalb, IL, USA, 2010. [Google Scholar]
- Signorell, A. Desctools: Tools for Descriptive Statistics. R Package Version 0.99.17. Available online: https://cran.r-project.org/web/packages/DescTools/index.html (accessed on 5 January 2016).
- Baker, M.; King, R.; Kahle, D. Titan2: Threshold Indicator Taxa Analysis. Available online: https://cran.R-project.Org/package=titan2 (accessed on 20 January 2016).
- Käiro, K.; Möls, T.; Timm, H.; Virro, T.; Järvekülg, R. The effect of damming on biological quality according to macroinvertebrates in some Estonian streams, Central—Baltic Europe: A pilot study. River Res. Appl. 2011, 27, 895–907. [Google Scholar] [CrossRef]
- Selvanayagam, M.; Abril, R. Water quality assessment of piatua river using macroinvertebrates in Puyo, Pastaza, Ecuador. Am. J. Life Sci. 2015, 3, 167–174. [Google Scholar] [CrossRef]
- Timm, H.; Kairo, K.; Molsa, T.; Virro, T.; Henn Timma, K.K. An index to assess hydromorphological quality of estonian surface waters based on macroinvertebrate taxonomic composition. Limnol. Ecol. Manag. Inland Waters 2011, 41, 398–410. [Google Scholar] [CrossRef]
- Theodoropoulos, C.; Aspridis, D.; Iliopoulou-Georgudaki, J. The influence of land use on freshwater macroinvertebrates in a regulated and temporary mediterranean river network. Hydrobiologia 2015, 751, 201–213. [Google Scholar] [CrossRef]
- Rawi, C.S.M.; Al-Shami, S.A.; Madrus, M.R.; Ahmad, A.H. Biological and ecological diversity of aquatic macroinvertebrates in response to hydrological and physicochemical parameters in tropical forest streams of Gunung Tebu, Malaysia: Implications for ecohydrological assessment. Ecohydrology 2013, 7, 496–507. [Google Scholar] [CrossRef]
- Nelson, S.M.; Lieberman, D.M. The influence of flow and other environmental factors on benthic invertebrates in the Sacramento river, USA. Hydrobiologia 2002, 489, 117–129. [Google Scholar] [CrossRef]
- Brooks, A.J.; Haeusler, T.; Reinfelds, I.; Williams, S. Hydraulic microhabitats and the distribution of macroinvertebrate assemblages in riffles. Freshw. Biol. 2005, 50, 331–344. [Google Scholar] [CrossRef]
- Hausmann, S.; Charles, D.F.; Gerritsen, J.; Belton, T.J. A diatom-based biological condition gradient approach for assessing impairment and developing nutrient criteria for streams. Sci. Total Environ. 2016, 562, 914–927. [Google Scholar] [CrossRef] [PubMed]
- Huanga, W.; Mukherjeea, D.; Chen, S. Assessment of Hurricane Ivan impact on chlorophyll-a in Pensacola bay by MODIS 250 m remote sensing. Mar. Pollut. Bull. 2011, 62, 490–498. [Google Scholar] [CrossRef] [PubMed]
- Porter, S.D.; Mueller, D.K.; Spahr, N.E.; Munn, M.D.; Dubrovsky, N.M. Efficacy of algal metrics for assessing nutrient and organic enrichment in flowing waters. Freshw. Biol. 2008, 53, 1036–1054. [Google Scholar] [CrossRef]
- Theodoropoulos, C.; Vourka, A.; Stamou, A.; Rutschmann, P.; Skoulikidis, N. Response of freshwater macroinvertebrates to rainfall-induced high flows: A hydroecological approach. Ecol. Indic. 2017, 73, 432–442. [Google Scholar] [CrossRef]
- Li, F.; Cai, Q.; Fu, X.; Liu, J. Construction of habitat suitability models for benthic macroinvertebrate and their applications to instream environmental flows: A case study in Xiangxi river of three gorges reservior region, China. Prog. Nat. Sci. 2009, 19, 359–367. [Google Scholar] [CrossRef]
- Wang, Z.-Y.; Xu, M. Problems and researches on eco-hydraulics and eco-sedimentation. In River Flow; Taylor & Francis Group: London, UK, 2012. [Google Scholar]
- Nolte, U.; Oliveira, M.J.D.; Stur, E. Seasonal, discharge-driven patterns of mayfly assemblages in an intermittent neotropical stream. Freshw. Biol. 1997, 37, 333–343. [Google Scholar] [CrossRef]
- Nguyen, T.H.T.; Boets, P.; Lock, K.; Ambarita, M.N.D.; Forio, M.A.E.; Musonge, P.S.L.; Dominguez-Granda, L.E.; Hoang, T.H.T.; Everaert, G.; Goethals, P. Habitat suitability of the invasive water hyacinth and its relation to water quality and macroinvertebrate diversity in a tropical reservoir. Limnologica 2015, 52, 67–74. [Google Scholar] [CrossRef]
- Gerebizza, E. The Daule Peripa Project. Available online: http://eurodad.org/uploadedfiles/whats new/reports/the%20daule%20peripa%20project crbm.pdf (accessed on 15 September 2016).
- Damanik-Ambarita, M.N.; Everaert, G.; Forio, M.A.E.; Nguyen, T.H.T.; Lock, K.; Musonge, P.L.S.; Suhareva, N.; Dominguez-Granda, L.; Bennetsen, E.; Boets, P.; et al. Generalized linear models to identify key hydromorphological and chemical variables determining the occurrence of macroinvertebrates in the Guayas river basin (Ecuador). Water 2016, 8, 297. [Google Scholar] [CrossRef] [Green Version]
- Deknock, A.; De Troyer, N.; Houbraken, M.; Dominguez-Granda, L.; Nolivos, I.; Van Echelpoel, W.; Forio, M.A.E.; Spanoghe, P.; Goethals, P. Distribution of agricultural pesticides in the freshwater environment of the Guayas river basin (Ecuador). Sci. Total Environ. 2019, 646, 996–1008. [Google Scholar] [CrossRef]
- Aude, E.; Tybirk, K.; Bruus Pedersen, M. Vegetation diversity of conventional and organic hedgerows in Denmark. Agric. Ecosyst. Environ. 2003, 99, 135–147. [Google Scholar] [CrossRef] [Green Version]
- Castillo, L.E.; Martínez, E.; Ruepert, C.; Savage, C.; Gilek, M.; Pinnock, M.; Solis, E. Water quality and macroinvertebrate community response following pesticide applications in a banana plantation, Limon, Costa Rica. Sci. Total Environ. 2006, 367, 418–432. [Google Scholar] [CrossRef] [PubMed]
- Arthington, A.H.; Bunn, S.E.; Poff, N.L.; Naiman, R.J. The challenge of providing environmental flow rules to sustain river ecosystems. Ecol. Appl. 2006, 16, 1311–1318. [Google Scholar] [CrossRef]
- Acreman, M.C.; Dunbar, M.J. Defining environmental river flow requirements—A review. Hydrol. Earth Sci. 2004, 8, 861–876. [Google Scholar] [CrossRef]
- Troyer, N.D.; Mereta, S.T.; Goethals, P.L.M.; Boets, P. Water quality assessment of streams and wetlands in a fast growing East African city. Water 2016, 8, 123. [Google Scholar] [CrossRef] [Green Version]
- Nolivos, I.; Villacis, M.; Vázquez, R.; Mora, D.E.; Domínguez-Granda, L.; Hampel, H.; Velarde, E. Challenges for a sustainable management of Ecuadorian water resources. Sustain. Water Qual. Ecol. 2015, 6, 101–106. [Google Scholar] [CrossRef]
- Wallace, J.B.; Webster, J.R. The role of macroinvertebrates in stream ecosystem function. Annu. Rev. Entomol. 1996, 41, 115–139. [Google Scholar] [CrossRef] [PubMed]
- Diehl, S. Fish predation and benthic community structure—The role of omnivory and habitat complexity. Ecology 1992, 73, 1646–1661. [Google Scholar] [CrossRef]


| Variable | Median | Mean | Max. | Min. | Std. |
|---|---|---|---|---|---|
| Temperature (°C) | 26.0 | 26.0 | 34.0 | 19.0 | 2.5 |
| pH | 7.6 | 7.7 | 8.9 | 6.6 | 0.5 |
| Dissolved Oxygen (mg/L) | 7.7 | 7.5 | 13.6 | 1.9 | 1.7 |
| Chlorophyll (µg/L) | 3.1 | 5.6 | 66.8 | 0.7 | 8.7 |
| Chloride (mg/L) | 2.5 | 7.3 | 181.7 | 0.5 | 22.8 |
| Turbidity (NTU) | 3.4 | 9.8 | 355.6 | 0.0 | 35.1 |
| Conductivity (µS/cm) | 123.3 | 199.9 | 1981.0 | 36.5 | 237.9 |
| Total Dissolved Solids (mg/L) | 0.08 | 0.12 | 1.27 | 0.05 | 0.15 |
| Elevation (m a.s.l.) | 82 | 135 | 1075 | 2 | 187 |
| Stream velocity (m/s) | 0.15 | 0.23 | 1.50 | 0.00 | 0.28 |
© 2018 by the authors. Licensee MDPI, Basel, Switzerland. This article is an open access article distributed under the terms and conditions of the Creative Commons Attribution (CC BY) license (http://creativecommons.org/licenses/by/4.0/).
Share and Cite
Nguyen, T.H.T.; Forio, M.A.E.; Boets, P.; Lock, K.; Damanik Ambarita, M.N.; Suhareva, N.; Everaert, G.; Van der heyden, C.; Dominguez-Granda, L.E.; Hoang, T.H.T.; et al. Threshold Responses of Macroinvertebrate Communities to Stream Velocity in Relation to Hydropower Dam: A Case Study from The Guayas River Basin (Ecuador). Water 2018, 10, 1195. https://doi.org/10.3390/w10091195
Nguyen THT, Forio MAE, Boets P, Lock K, Damanik Ambarita MN, Suhareva N, Everaert G, Van der heyden C, Dominguez-Granda LE, Hoang THT, et al. Threshold Responses of Macroinvertebrate Communities to Stream Velocity in Relation to Hydropower Dam: A Case Study from The Guayas River Basin (Ecuador). Water. 2018; 10(9):1195. https://doi.org/10.3390/w10091195
Chicago/Turabian StyleNguyen, Thi Hanh Tien, Marie Anne Eurie Forio, Pieter Boets, Koen Lock, Minar Naomi Damanik Ambarita, Natalija Suhareva, Gert Everaert, Christine Van der heyden, Luis Elvin Dominguez-Granda, Thu Huong Thi Hoang, and et al. 2018. "Threshold Responses of Macroinvertebrate Communities to Stream Velocity in Relation to Hydropower Dam: A Case Study from The Guayas River Basin (Ecuador)" Water 10, no. 9: 1195. https://doi.org/10.3390/w10091195