Land Use and Land Cover Changes and Their Effect on the Flow Regime in the Upstream Dong Nai River Basin, Vietnam


1
Graduate School of Science, Chiba University, Chiba 263-8522, Japan
2
Center of Water Management and Climate Change, Vietnam National University-Ho Chi Minh, Ho Chi Minh 10000, Vietnam
3
Center for Environmental Remote Sensing, Chiba University, Chiba 263-8522, Japan
*
Author to whom correspondence should be addressed.
Water 2018, 10(9), 1206; https://doi.org/10.3390/w10091206
Submission received: 19 June 2018
/
Revised: 26 August 2018
/
Accepted: 5 September 2018
/
Published: 7 September 2018
(This article belongs to the Special Issue Applications of Remote Sensing and GIS in Hydrology)
Abstract
:The upstream Dong Nai River Basin is located in the country’s key economic development region and its water resources are a key component of sustainable regional development. The objective of this study was to assess the impact of land use and land cover changes (LULCC) on the flow regime in this tropical forest basin using a flow–duration curve analysis that has been widely used in Japan. This study combined two different temporal and spatial scales of satellite data, Landsat and Global Inventory Modeling, and Mapping Studies (GIMMS) normalized difference vegetation index (NDVI) to analyze LUCC. Results from the land cover classification of five Landsat images between 1973 and 2014 indicated that the forest area decreased significantly in the period of 1994 to 2005 due to population growth, leading to land conversion for agriculture. Furthermore, secular changes in the annual GIMMS-NDVI data revealed that land cover changes occurred from 1996 and a large amount of forest was lost in 1999; however, due to the rapid regrowth of secondary forest of tropical forests and the development of the crop, the vegetation recovered shortly afterwards in 2000 before decreasing again after 2004. Following large-scale deforestation, the total discharge, maximum flow, and the plentiful, ordinary, low, and small-scale runoff increased sharply and decreased thereafter because of vegetation regrowth.
1. Introduction
Land use and land cover change (LULCC) is one of the major factors that alters the flow regime. Many studies worldwide have evaluated the impacts of LULCC on the flow regime [1,2,3,4,5,6,7,8]. Understanding the influence of LULCC on river flow regimes is important for sustainable catchment management [3]. LULCC can change flood frequency, flood severity, base flow, and annual mean discharge [6]. Deforestation and conversion to arable land or grassland are usually accompanied by an increase in surface runoff or total discharge [9,10,11,12]. In a study of the dam function of forests, Kuraji [13] collected results from experimental basins around the world and reported that forests have a positive effect on flood mitigation and a negative effect on drought mitigation. In tropical rainforest regions, forest replacement by annual crops tends to increase annual streamflow quantities and storm flow events with higher peak discharges [14]. The conversion of forest to pasture or crops in the tropics is associated with an increase in annual streamflow totals due to the lower evapotranspiration of the replacement vegetation [15].
In Vietnam, starting in the mid-1980s, the government initiated a series of economic reforms aimed at stimulating economic growth; the most remarkable policy was the New Economic Zones program. It displaced many residents to uninhabited areas and expanded the total agricultural area in the country. This led to the conversion of land use and land cover in Vietnam in the period after the mid-1980s [16]. In 2014, Vietnam had 158,452 km2 of forest, covering 47.8% of the total land area of the country [17]. However, Vietnam lost an average of 1000 km2 of forest per year in the period of 1980 to 1990 [18]. Since 1995, forest area has increased because of forest rehabilitation and plantation programs [18]; however, for each year from 2002 to 2009, an average of 620 km2 of forest cover was lost and 250 km2 of forest cover was converted to other land cover types [19]. On the other side, studies on hydrological alterations have received more attention since 2009, after “The Climate Change and Sea Level Rise Scenarios for Vietnam” was issued [20]. However, studies on regional-scale environmental assessments, especially on hydrology, are still limited. Hydro-power accounts for a large proportion of energy sources: the total installed capacity is 37.31% of 45,600 MW in 2015 and it targets 30.1% of 60,000 MW in 2020 and 21.1% of 96,500 MW in 2025 [21].
The Dong Nai River Basin, the second largest catchment in Vietnam, is in the country’s key economic development region and accounts for 23% of Vietnam’s gross domestic product (GDP) [22]. Water resources from this basin are very important to ensure that the region develops sustainably. However, water shortages in the dry season and flooding in the rainy season are the biggest challenges to the future prosperity of the region. The main objectives of this study are to quantify the LULCC and evaluate their effect on the river flow regime in Vietnam’s upstream Dong Nai River Basin. The findings of this study provide useful information for policymakers in planning future development strategies.
2. Study Area
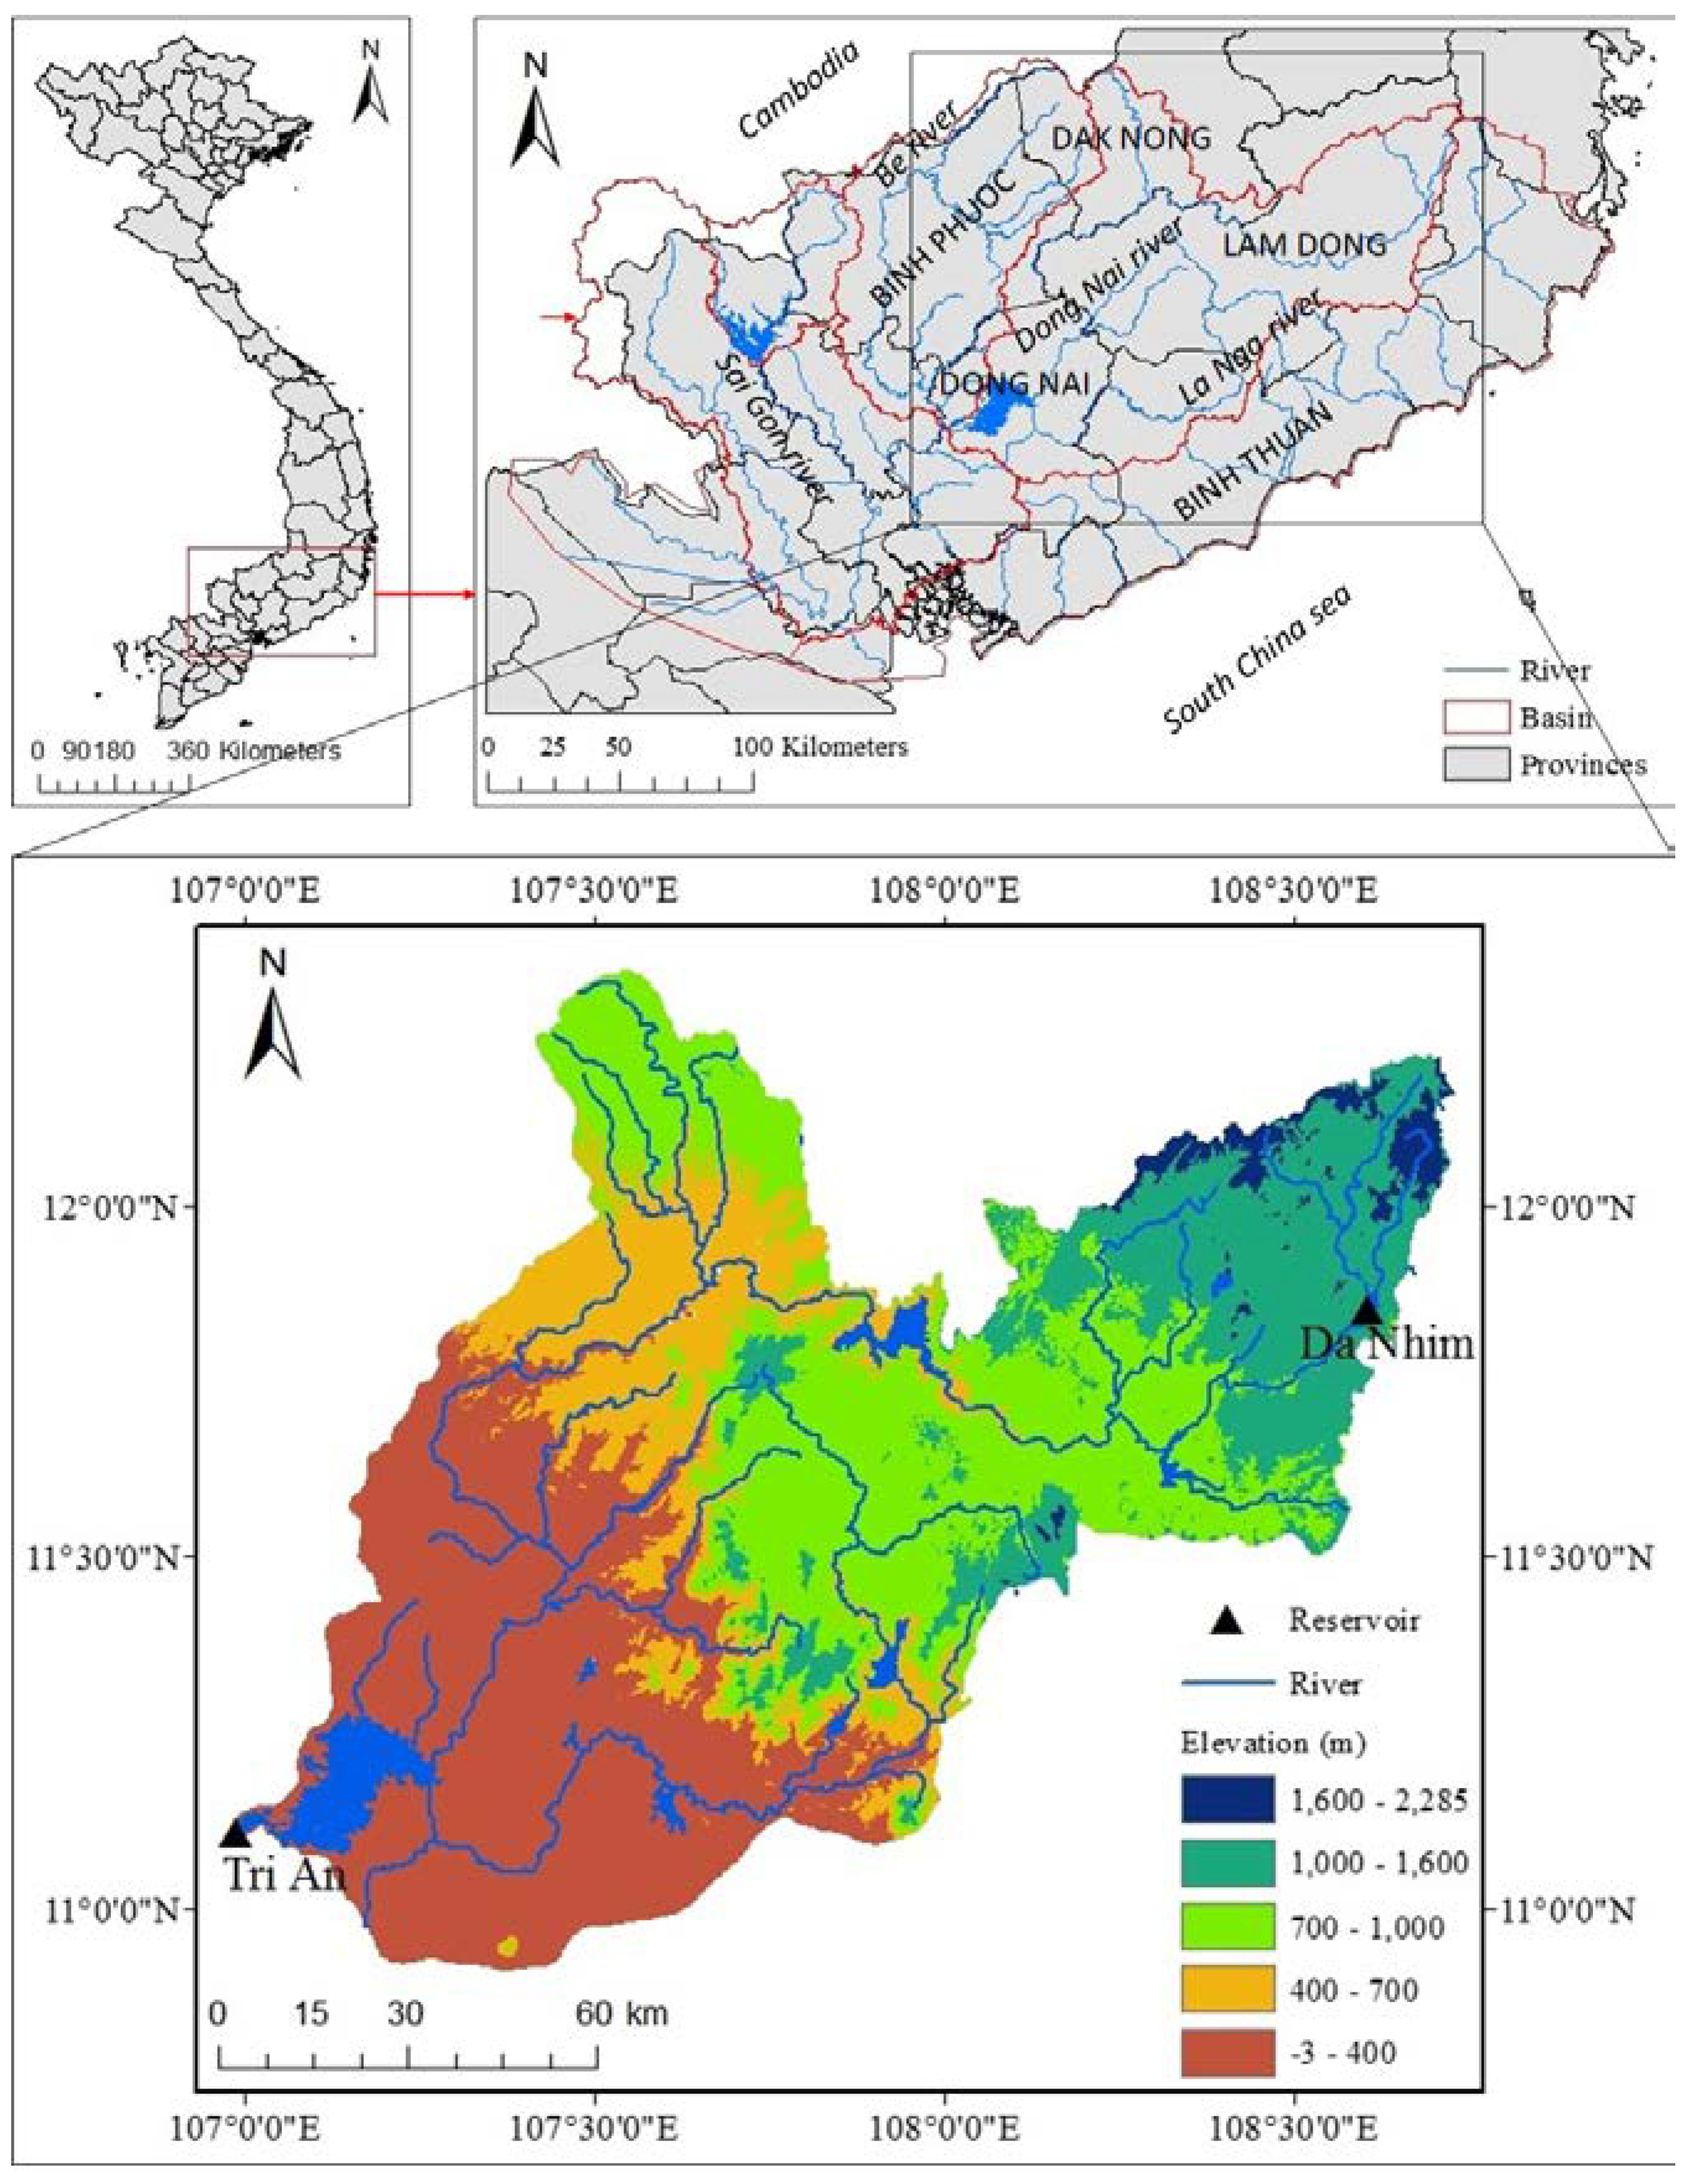
The Dong Nai River is approximately 437 km long and has a total drainage area of 37,330 km2, excluding the area in Cambodia. The main stem of Dong Nai River originates from the high hills (elevation 1000 m to 2000 m) in the northern area of Lam Dong province, initially taking the southwestward direction in its flow course, then turns its flow direction to west, forming the border between Lam Dong and Dak Nong provinces. Thereafter, Dong Nai River flows towards the southeast and crosses Dong Nai province with a southwest direction flow. The La Nga River originating from the Lam Dong province, in the south of the basin, merges into the Dong Nai River before flowing into the Tri An reservoir. Downstream of the Tri An reservoir, Dong Nai River meets the Be River and Saigon River before draining into the South China Sea [23]. Our study focuses on the upstream river basin, above the Tri An reservoir, with a catchment area of 14,706 km2, including the six provinces of Binh Thuan, Binh Phuoc, Dak Nong, Dong Nai, and Lam Dong. The basin has been highly developed and primarily consists of agricultural and forest lands (Figure 1 and Table 1). Water from the Dong Nai River is used (1) to provide drinking water for approximately 19 million people; (2) to irrigate 22,874 km2 of agricultural land; (3) to supply electricity to Southern Vietnam with a total installed capacity of 2380 MW from hydropower plants including Da Nhim, Dai Ninh, Bac Binh, Da Dang, Dong Nai 2–5, Dak R’Tih, Dambri, Bao Loc, Ham Thuan, Da Mi, and Tri An; and (4) to ensure dry season water flow of at least 275 m3/s, which is needed to reduce sea water intrusion downstream [17,24,25].
According to JICA [23], the study area is mainly composed of Mesozoic sediments, intrusive rocks, and basaltic rocks of Tertiary to Quaternary volcanic activities. These sedimentary rocks are strongly folded due to the tectonic stress, and their flooding axes and bedding plane indicate the north-easterly and north-westerly direction. Most of the faults and fractured zones also show similar trends. Diorite and granite, intruded into sedimentary beds, occur at many places while Neogen sediment rock can be recognized at the limited area along the Dong Nai River and La Nga River basins. Basalts covering Mesozoic sediments and Neogen–Quaternary basalts are distributed between the left bank of the Dong Nai River and the coastal line. Quaternary deposits that consist of sand, silt, and clayey soil with occasional organic matters are widespread on the south to the southwest of the basin.
The study area is dominated by evergreen tropical rainforest and semi-deciduous tropical humid forest ecosystems with three major forest types: evergreen closed and mixed tropical humid forests; bamboo forests and mixed timber and bamboo forest; diptercarp dominant and thin forest [26,27]. It is in a humid tropical zone with southwest monsoons; 90% of the annual rainfall (the average rainfall from 1993 to 2012 was 2415 mm/year) occurs during the rainy season (May–October) with the remainder falling during the dry season (November–April). Due to the basin stretching from the mountainous area to the lower plain area (from elevation −3 to 2285 m), the temperature varies significantly. The average temperature ranges between 18 °C and 26 °C (authors’ calculations from data from 1993 to 2012).
3. Data and Methods
3.1. Data
Rainfall—The rainfall data (mm/day), from 1 January 1993 to 31 December 2009, were provided by the Provincial Department of Natural Resources and Environment (DONRE).
Stream flows—The daily inflows (m3/s), from 1 January 1993 to 31 December 2009 at the Tri An reservoir and Da Nhim reservoir (a sub-basin area of approximately 720 km2) (Figure 2) were used as the stream flows. The inflows of the reservoir, calculated according to the designed storage curve, were provided by Tri An hydropower company (Lam Dong, Vietnam) and Da Nhim–Ham Thuan–Da Mi Hydropower joint stock company (Lam Dong, Vietnam).
Satellite data—The available high-quality (quality > 9; cloud cover < 10%) Landsat images acquired for the study area were Landsat 1 MSS (path 133 row 52, 24 February 1973), Landsat 5 TM (path 124 row 52, 9 January 1989; 7 January 1994; and 22 February 2005), Landsat 8 OLI (path 124 row 52, 15 February 2014), and the GIMMS (Global Inventory Modeling and Mapping Studies) normalized difference vegetation index (NDVI) product. The dataset was derived from imagery obtained from the advanced very-high-resolution radiometer (AVHRR) [29].
Land use—The 2010 land use maps (1:250,000) of each province were acquired from DONRE.
3.2. Methods
3.2.1. Flow–Duration Curve
The flow–duration curve (FDC) discussed by Foster [30] and others is a cumulative frequency curve that shows the percent of time, during a given period, when specified discharges were equaled or exceeded [31]. FDCs are not only useful for electricity generation, water uses such as irrigation, and the evaluation of water resource recharge, but also for the extraction of hydrological regime change information [32]. As a unified analysis of both sides of high and low water changes, they are also an effective method to consider both the flood and drought mitigation functions of forests [33,34], and to examine the runoff characteristics of catchment [35,36]. In Japan, FDCs are an indispensable source of data when planning to build a hydropower plant. By looking at the FDC, it is possible to determine the power output of a hydroelectric power plant, to grasp the number of days of operation against the flow rate, and to predict change of hydropower potential by creating a future FDC [37,38]. Vietnam has been accelerating the expansion of renewable power sources, prioritizing hydropower sources in the national power development master plan for the 2011–2020 period [21]. It increases the total capacity of hydropower sources from less than 17,000 MW at present to approx. 21,600 MW (accounting for approx. 29.5%) in 2020. The FDC can be considered for the hydropower planning (ranked at second in Vietnam) as well as for assessing flow regime in this study area.
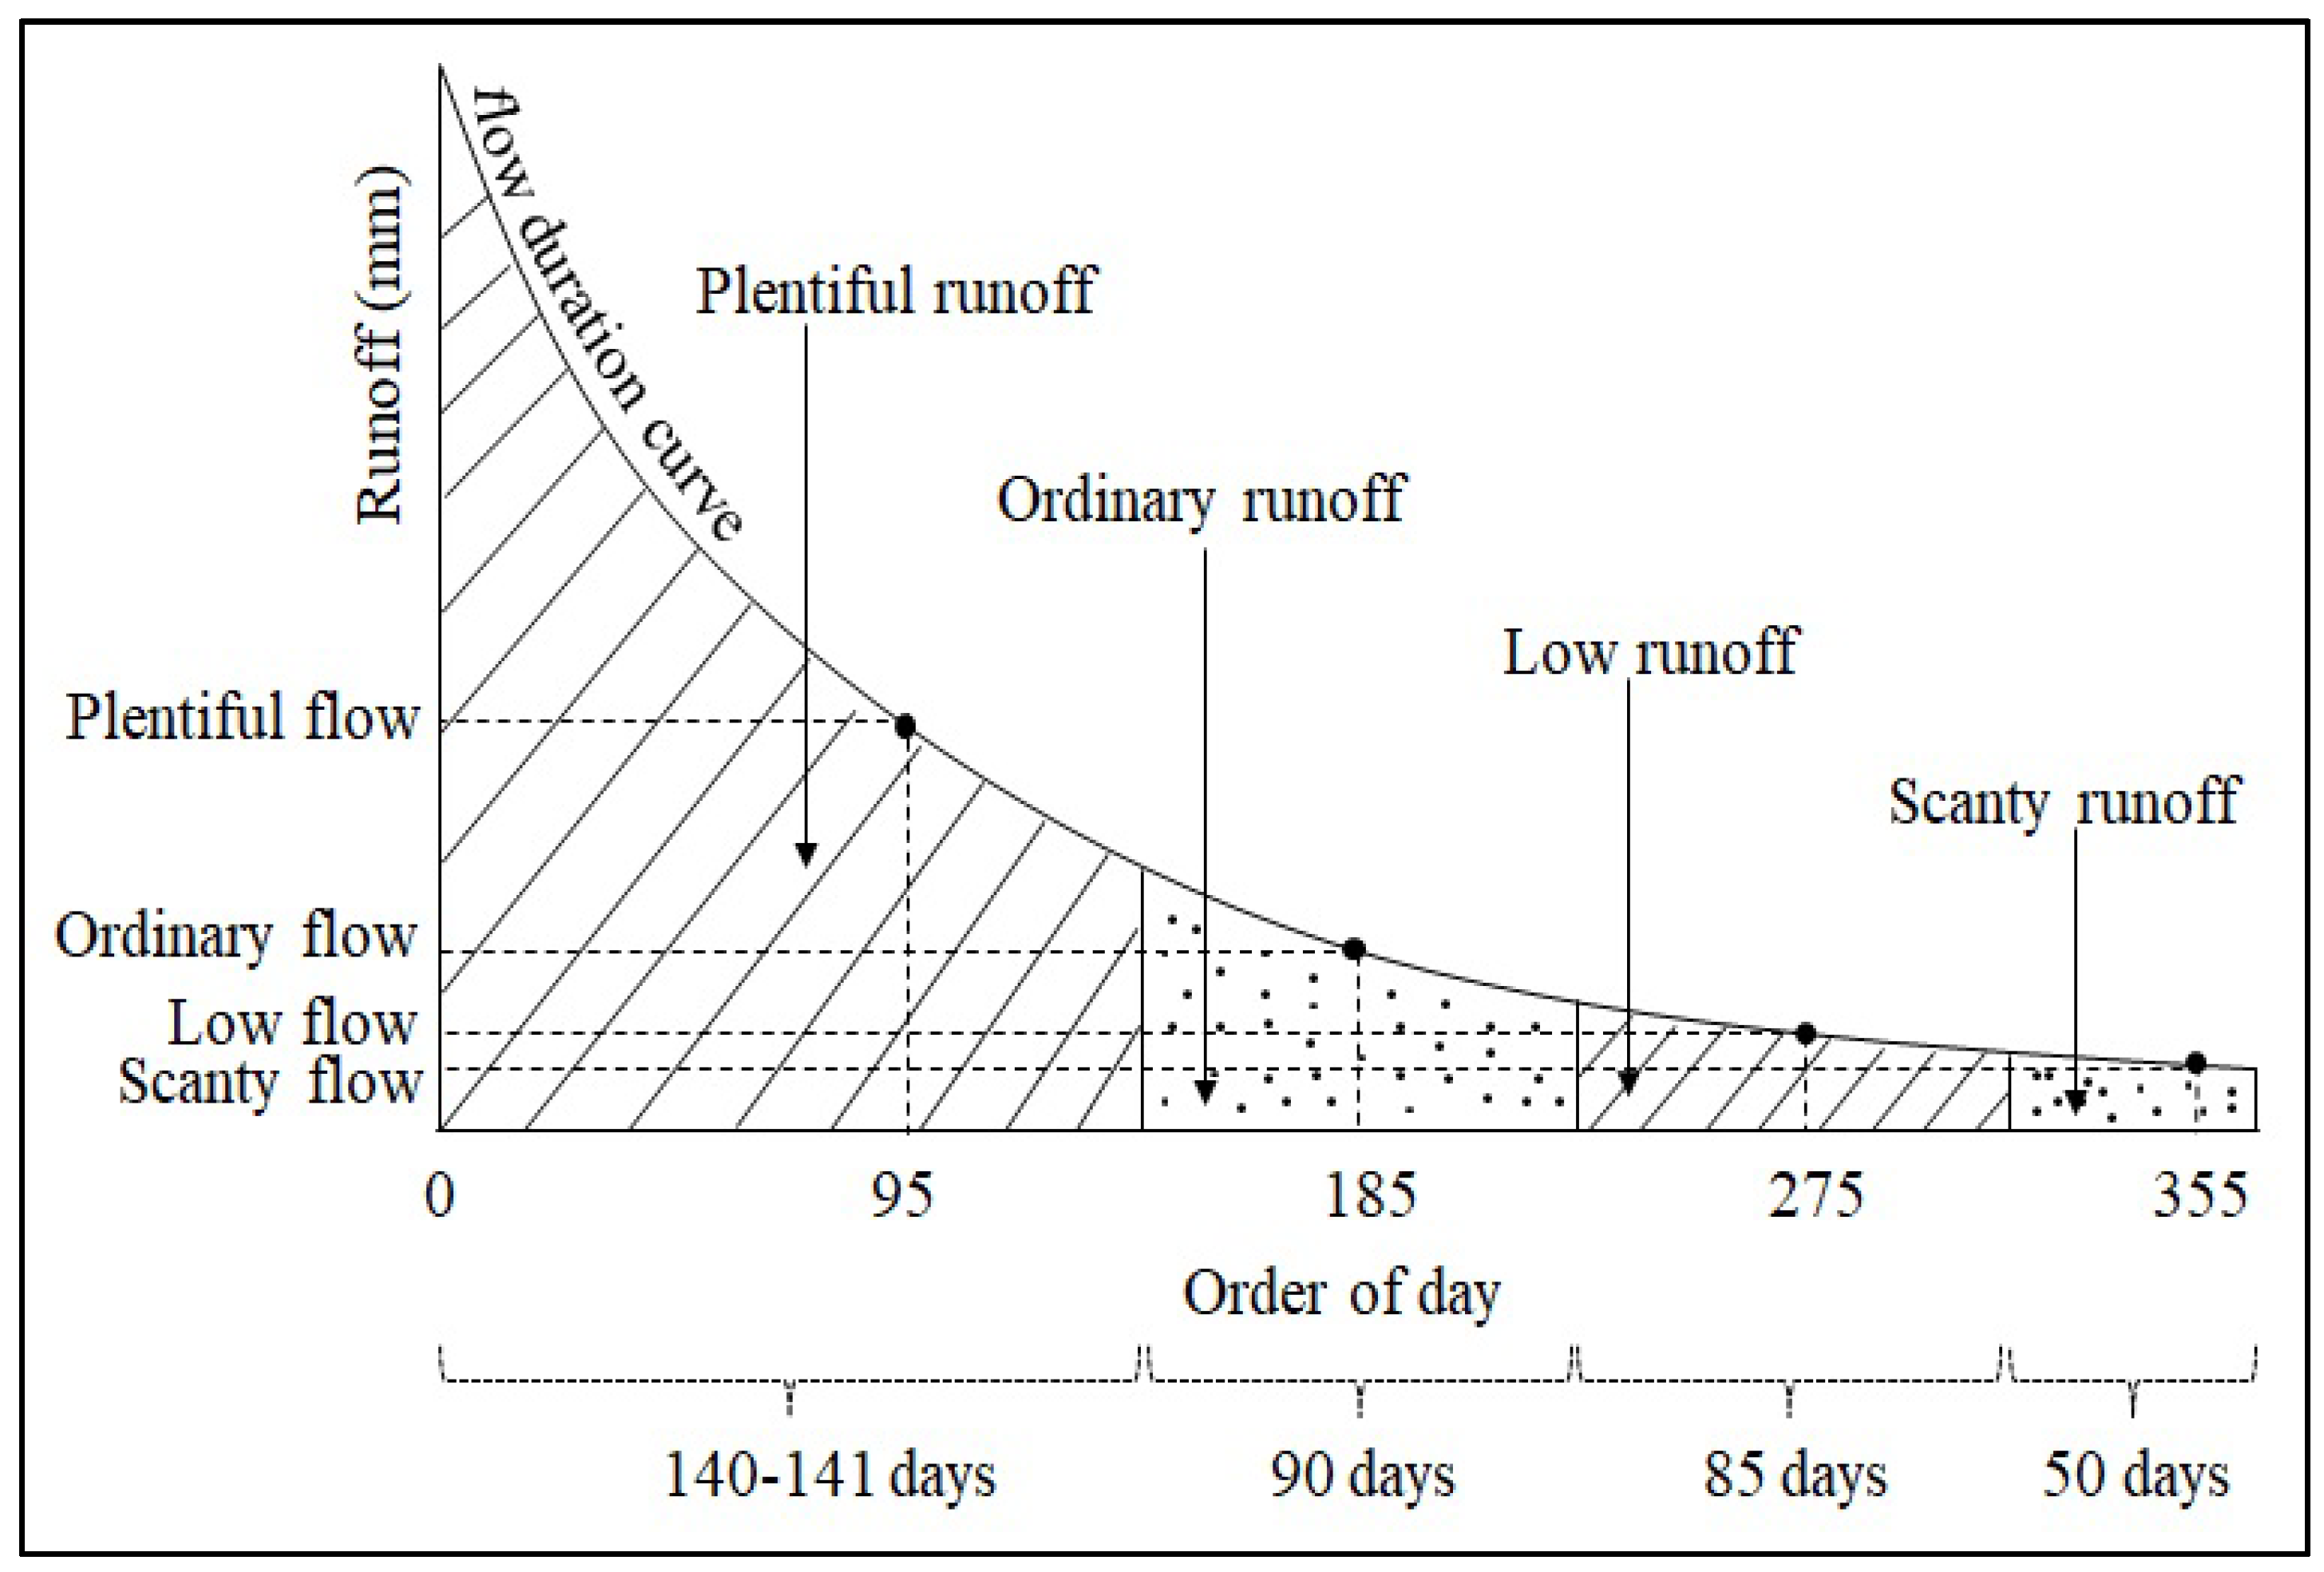
In Japan’s hydroelectric engineering, river engineering or relevant technical fields, expression of the number of days of each flow rate types was performed. Namely the FDC, plentiful flow, ordinary flow, low flow, and scanty flow were defined. FDC is a curve created by rearranging the daily streamflow from the largest to the smallest for each individual year. It is divided into four periods as shown in Figure 2, they are plentiful runoff, ordinary runoff, low runoff, and scanty runoff. In the graph, plentiful flow is the flow rate on the 95th day, ordinary flow is on the 185th day, low flow is on the 275th day, and scanty flow is on the 355th day on the duration curve. The runoff(s) can be derived by dividing the interval days of each flow types into two. For example, as showed in Figure 2, if we divide 80 days i.e., from scanty flow (day 355th) to low flow (day 275th) by two, we will have 40 days. By adding 10 days left (365 days of normal year minus 355 days of the scanty flow), we will have the scanty runoff of the first 50 days as showed in the right side of the discharge duration curve. The low runoff, ordinary runoff and plentiful runoff is the next 85 days, 90 days, and plentiful runoff and 140–141 days, respectively [39,40].
3.2.2. Land Cover Classification
Data processing—Failure of the Scan Line Corrector (SLC) caused data gaps in all Landsat 7 images collected after 31 May 2003, called SLC-off data. In this study, we used the Frame and Fill program developed by Irish [41] to fill missing pixels in the 2005 image. After creating the study area images, the NDVI was calculated from the equation
where IR is the pixel value from the infrared band, and R is the pixel value from the red band. The NDVI value varies from −1 to +1. Water typically has an NDVI value less than 0. A value close to 0 indicates no vegetation, and a value close to +1 indicates a high density of green leaves.
Based on the land use and land cover classification system developed by Anderson et al. [42] and Vietnam’s land law, the seven land cover classes—dense-forest, spare-forest/shrub, perennial/orchard, crop land, built-up/residential, marsh/grasses, and water bodies—have been identified for the upstream Dong Nai River Basin. A description of these land cover classes is shown in Table 2. Class schemes and training areas were designed and the study site description was selected based on the spectral characteristics, high-resolution data from Google Earth, land use maps, and the NDVI analysis.
Image classification—The maximum likelihood classifier for supervised classification was selected since, unlike other classifiers, it considers the spectral variation within each category and the overlap covering the different classes [43]. To improve the classification accuracy, a field survey—including interviewing the local people about past land use—was performed in 2015 throughout the study area to check the land cover map of 2014 and fix misclassifications. Based on the confusion matrix, a table was created that shows the correspondence between the classification result and a reference image; the Kappa coefficient; overall accuracy (the number of correctly identified pixels divided by the total number of pixels); producer (Pa—the number of correctly identified pixels divided by the total number of pixels in the reference image); user accuracy (Ua—the number of correctly identified pixels divided by the total number of pixels in the classified image) of individual classes in the land cover map of 2005. The values in this table were calculated by comparing the classified image to Google Earth which was built in December 2005 for accuracy assessment. The Kappa coefficient takes values from 0 to 1; 0 indicates no agreement between the classified image and the reference image, and 1 indicates that the classified image and the ground truth image are identical [44].
LULCC detection—Based on the land use and land cover maps of the individual years, a post-classification comparison was conducted to quantify the amount of land cover changes occurring since the 1970s.
4. Results and Discussion
4.1. LULCC
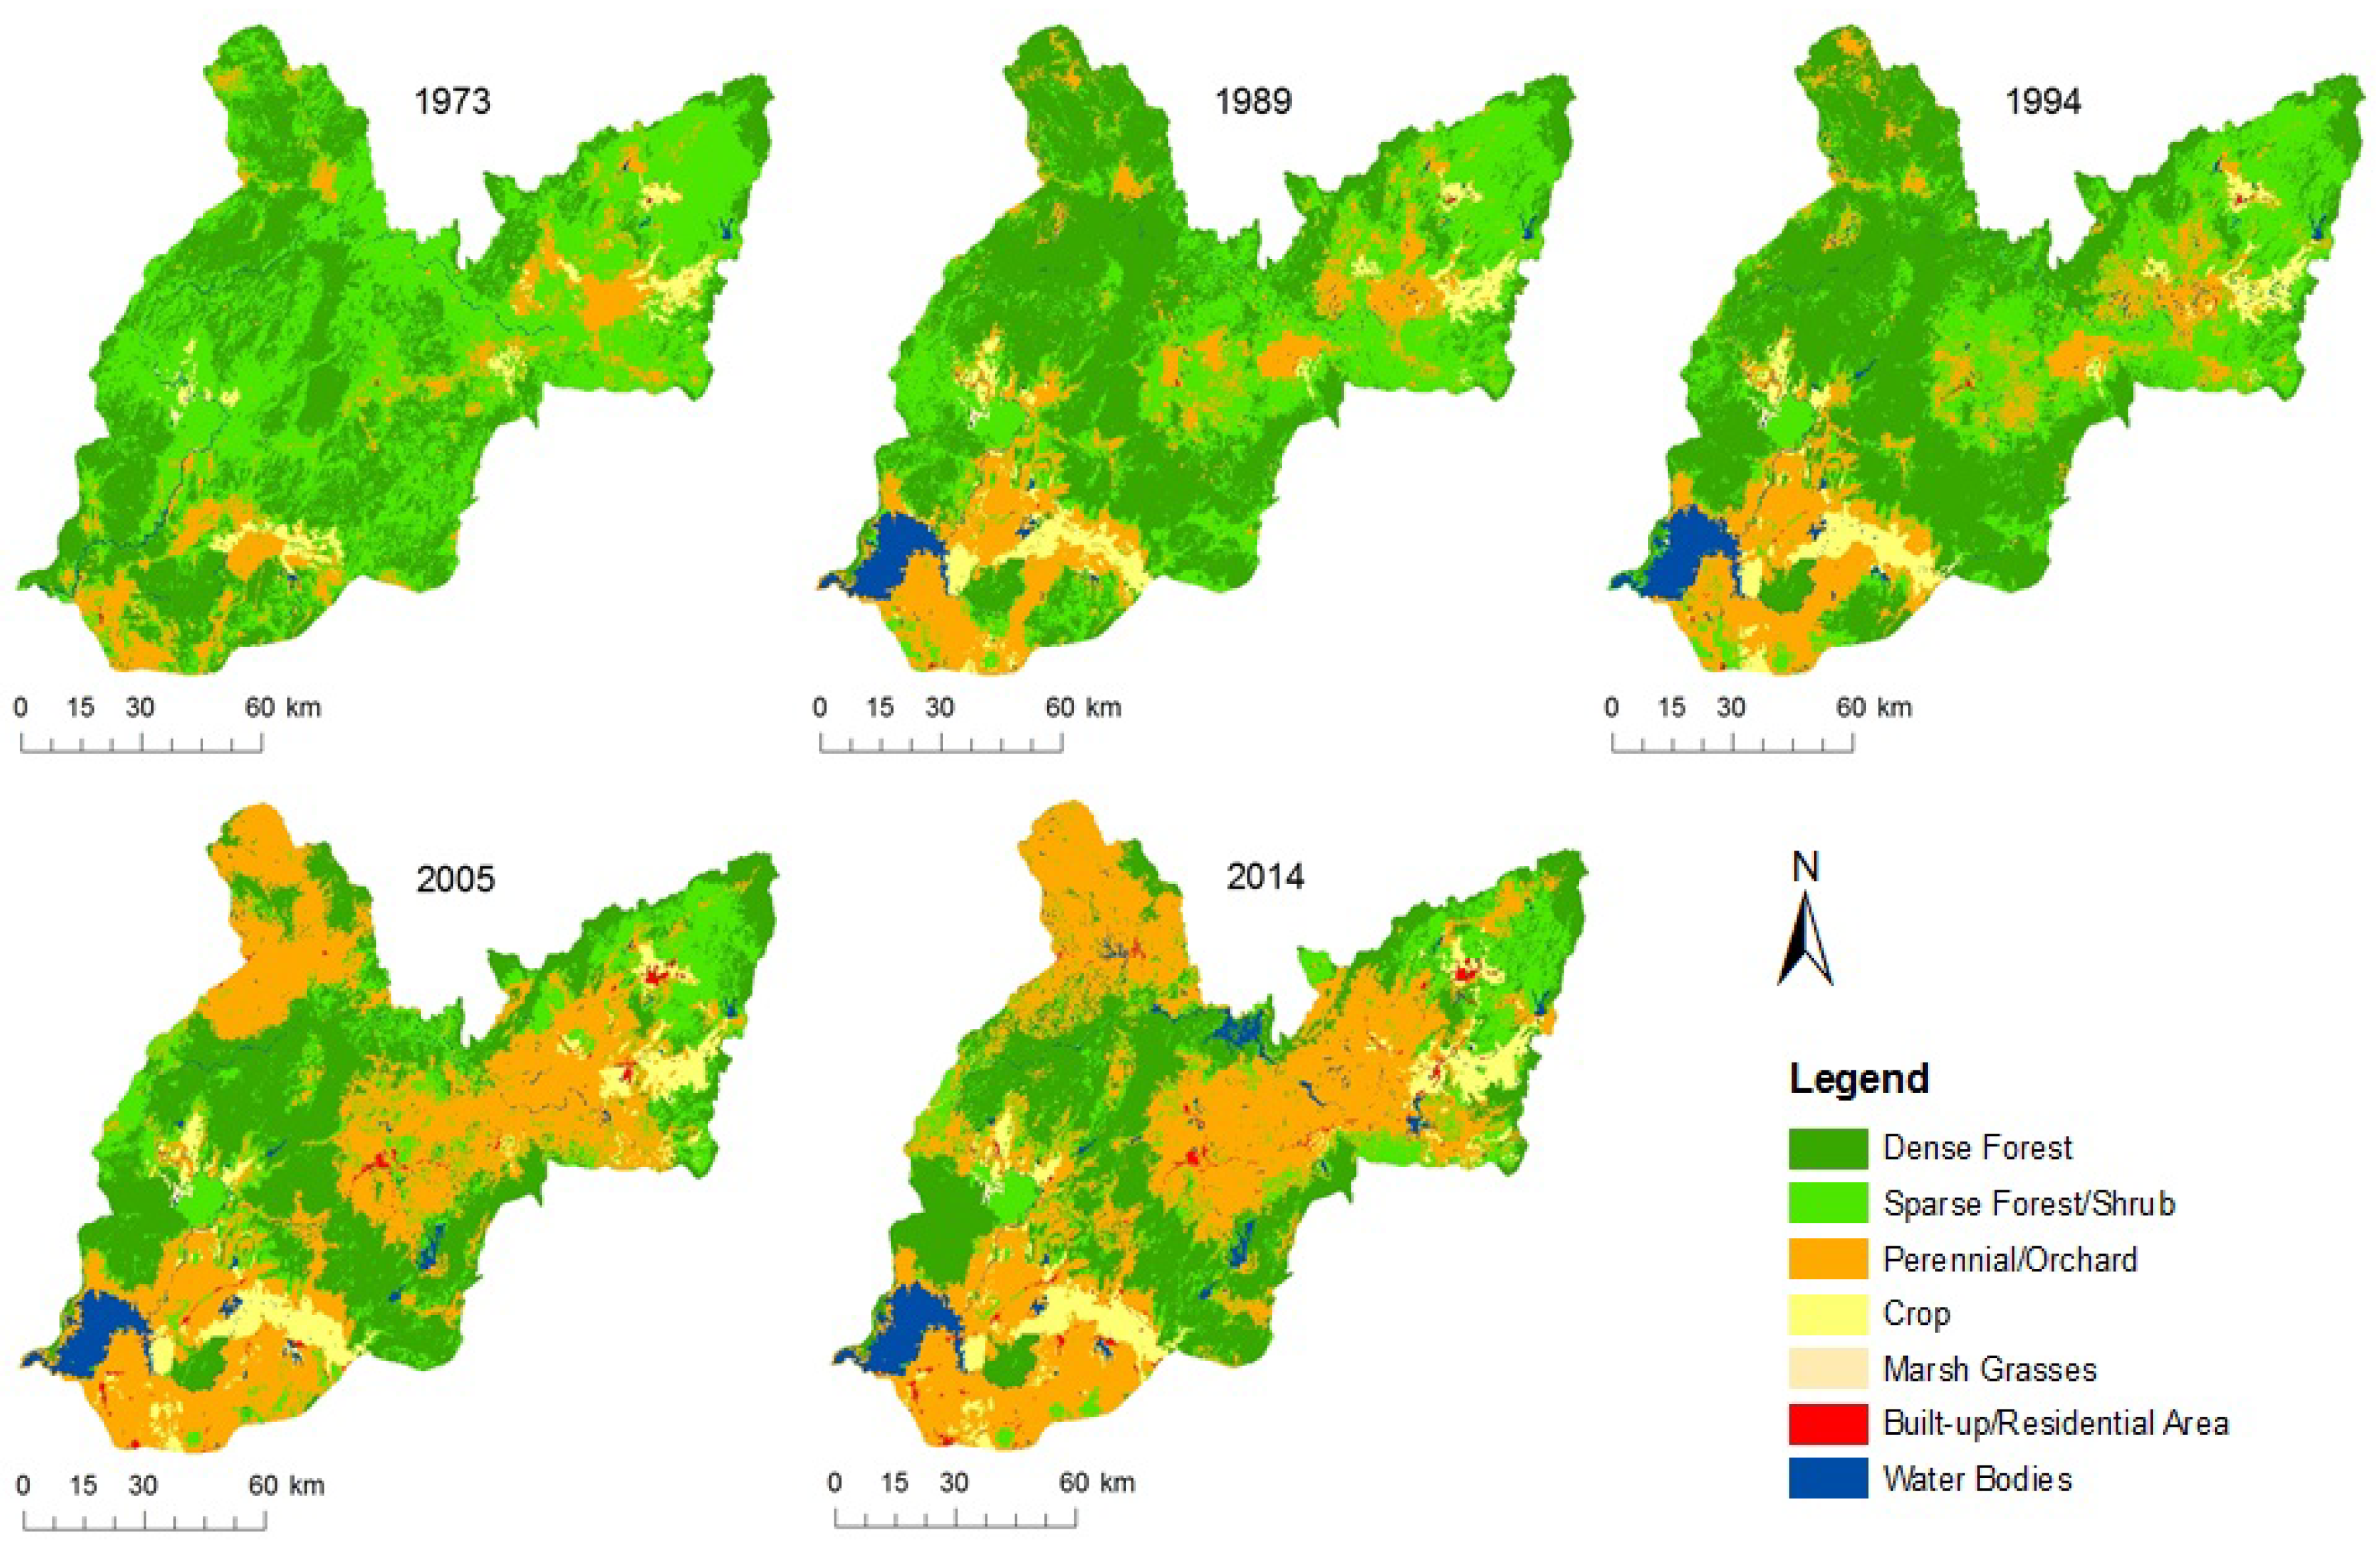
Land cover maps of the upstream Dong Nai River Basin for 1973, 1989, 1994, 2005, and 2014 are shown in Figure 3. From Table 3, we found dense-forest, spare-forest/shrub, and perennial/orchard to be more reliable by the producer and user accuracy, that is higher than the target accuracy of 85% proposed by Anderson et al. [42]. As Foody discussed in [45], this 85% target accuracy is often used without questioning its suitability. It appears to stem from early research on mapping broad land-cover classes at a small cartographic scale and may be inappropriate for some current mapping applications. Furthermore, the overall accuracy of 88.9% and Kappa coefficient of 0.85, as well as the results from the field survey, show our results to be in good agreement. In 1973, the forest area, including dense forest and sparse forest/shrub, constituted 86% of the total area, and agricultural land, including perennial orchard and crop, were 14% of the total. These proportions experienced no major changes until 1994, when they changed to 73% and 24%, respectively. In 2005, the forest area decreased significantly to 51% (7588 km2), and in contrast, the agricultural land area increased to 45%. In 2014, the proportions of forest area and agricultural land continued to drop to 45% (6565 km2) and 51%, respectively (Table 4). The land cover area change matrices for the years of 1994 and 2005 are shown in Table 5. The forest area that was converted to agricultural land during the period 1994 to 2005 was 3343 km2, whereas the reverse conversion was only 240 km2. Land use change occurred primarily in the highland and midland regions, which experienced a high influx of immigrants, with an average growth rate of 2.3% per year during the period of 1999 to 2009 [46]. Pham et al. [16] concluded that population growth was behind the expansion of cultivation and that the primary causes of deforestation were land conversions via agriculture, infrastructure, unsustainable logging, including both legal and illegal logging, and fire. DeFries [47] analyzed the factors associated with forest loss for 41 countries including Vietnam from 2000 to 2005; this analysis showed that urban population growth is the biggest cause of deforestation. Table 6 and Table 7 are population and forest loss statistical data of the provinces in the study area. The population growth rate of Dak Nong, Dong Nai, and Lam Dong—the three provinces with the largest reduction of forest area—for the period 2005–2014 were 43.72, 29.42, and 8.47%, respectively. While the annual forest loss area was insignificant compared to the total forest area. It can be concluded that population growth is also an important factor behind the decrease of forest in the study area.
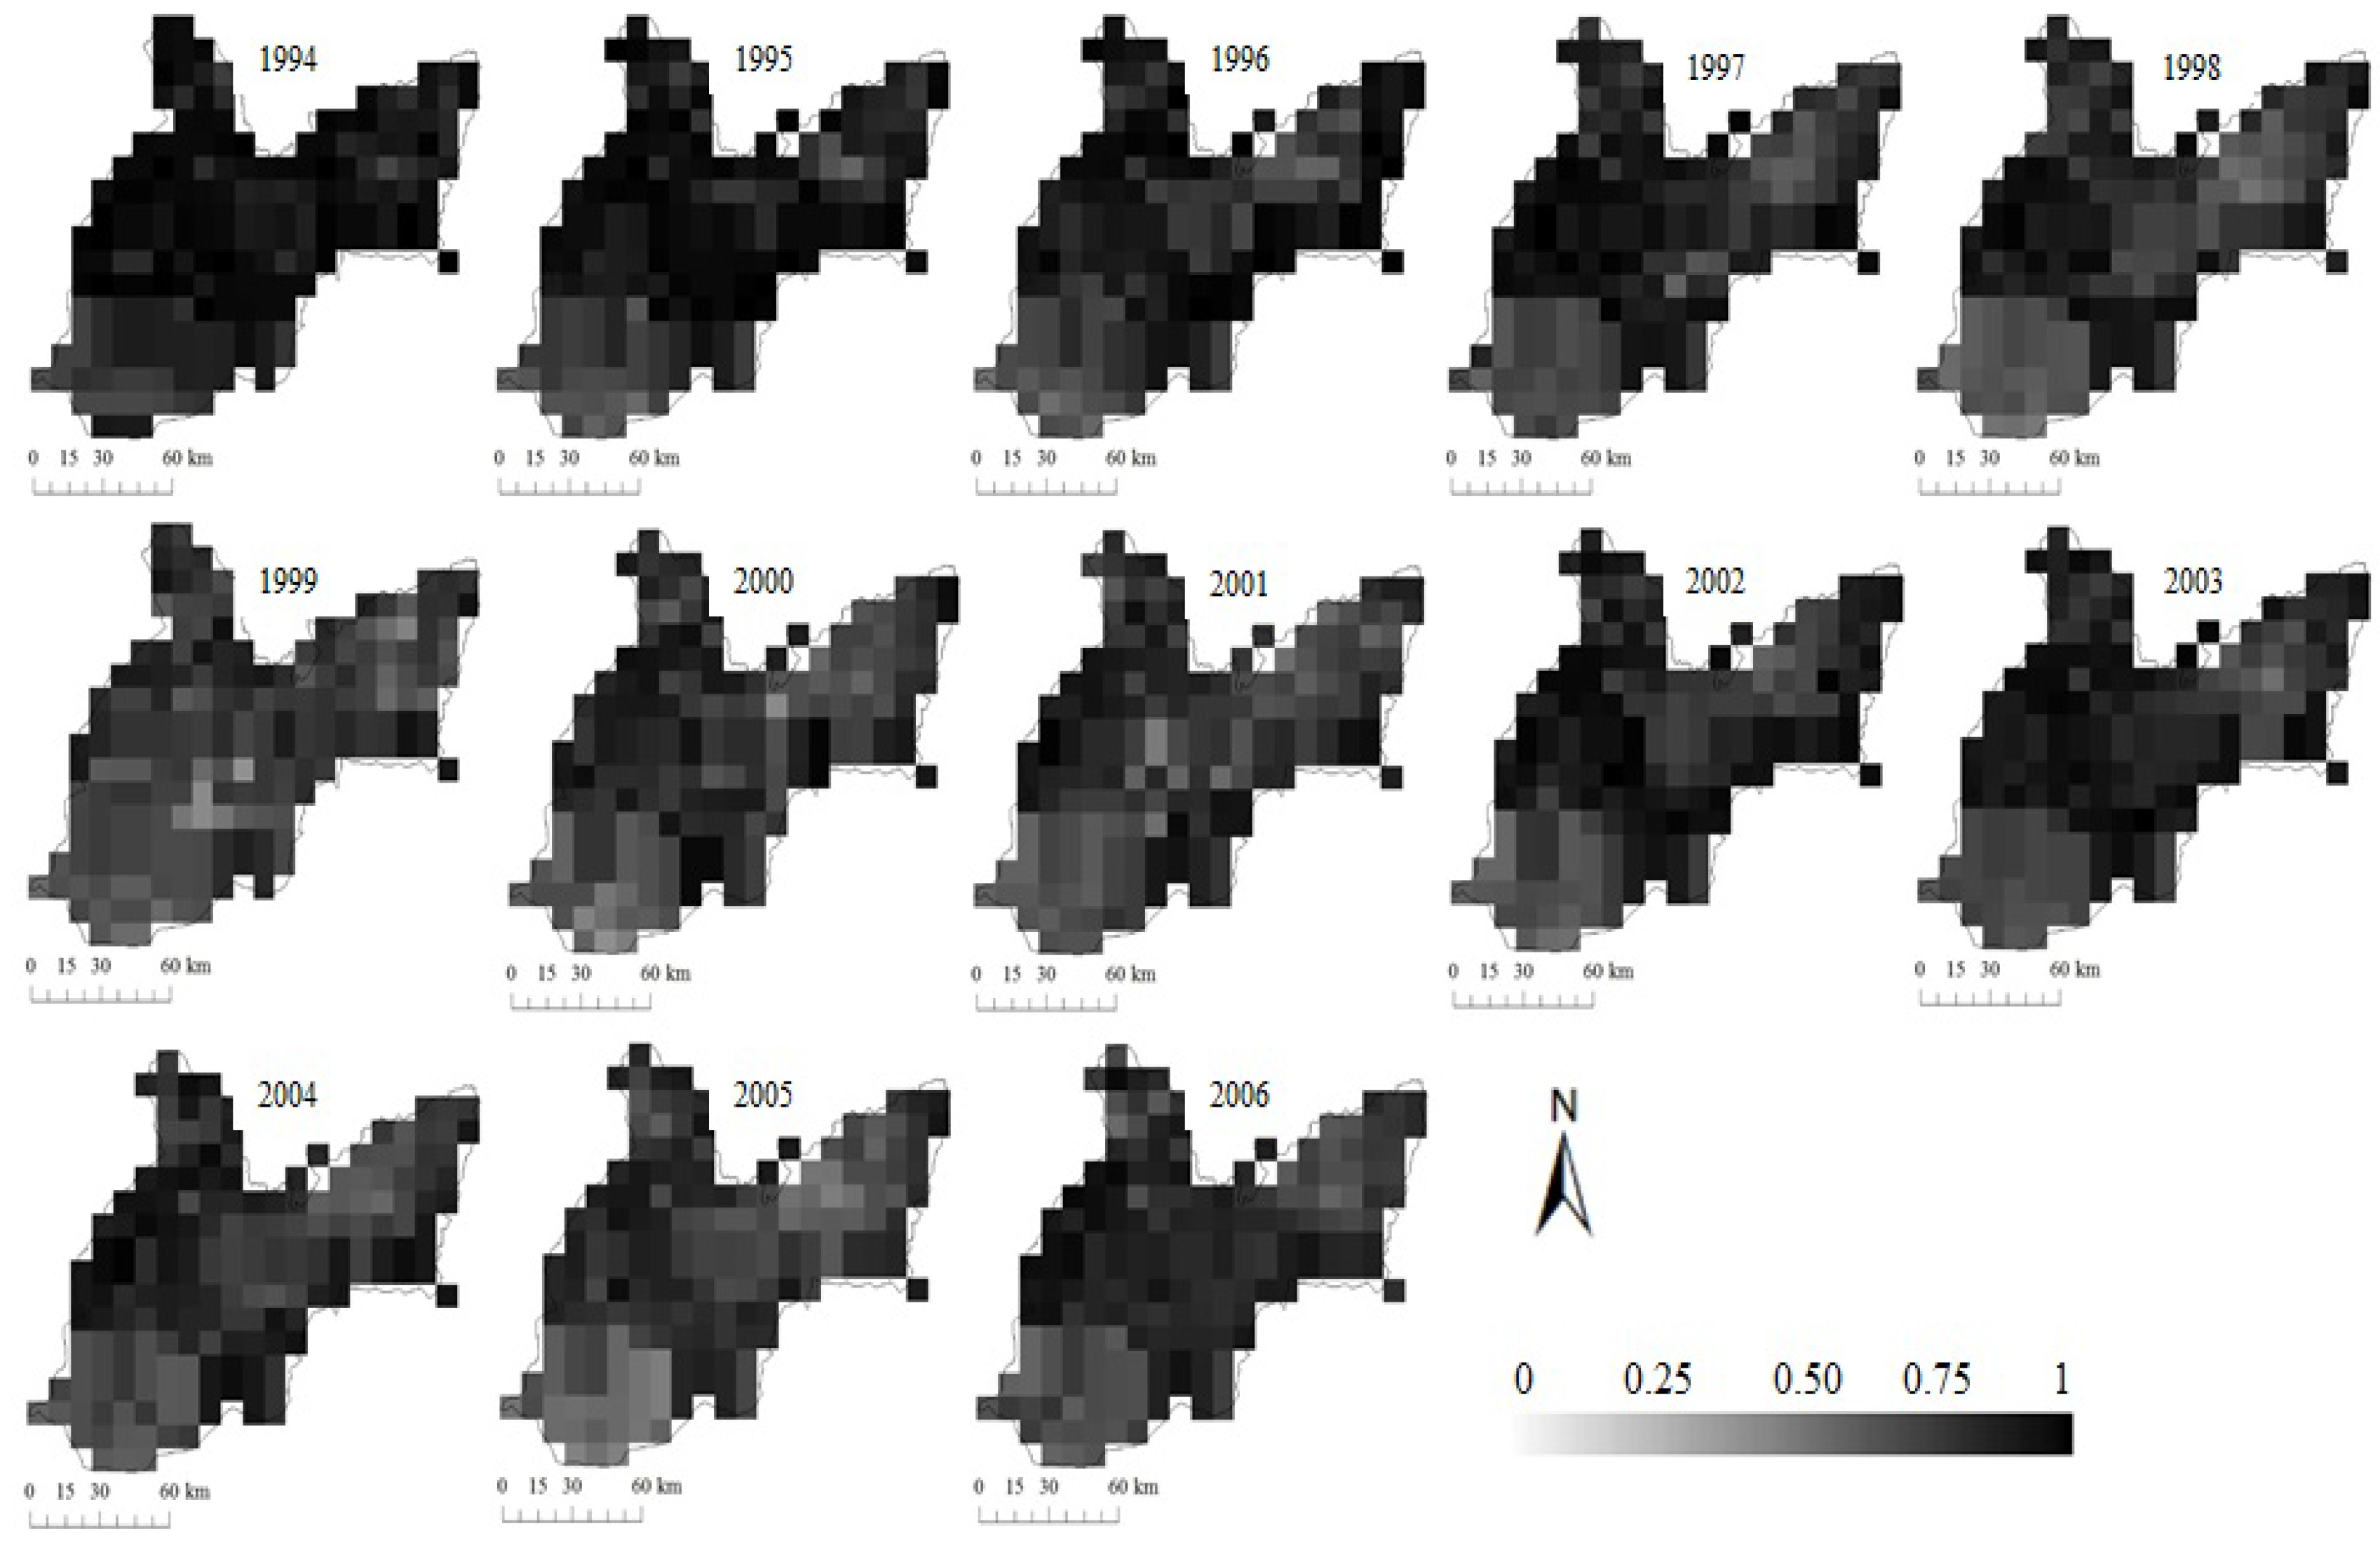
In order to complement the results between 1994 and 2005, the GIMMS-NDVI dataset was used to assess the short-term land cover change maps for the period 1994 to 2005 because there are no high-quality Landsat images available in this period. The maximum NDVI value composites from the first 15 days of January, the month when the Landsat images were taken, from 1994 to 2006, are shown in Figure 4. The NDVI decreased from 1994 onward, especially in the upper region of the basin, then started to decline in 1996 and declined the most in 1998. The NDVI of the entire area dropped substantially in 1999 before showing an increase again from 2000 to 2003, followed by a slight decrease. Moreover, the results indicated that during the period of 1994 to 2005, the majority of deforestation occurred since 1998 and that the largest area of forest cover was lost in 1999.
4.2. LULCC Effect on the Flow Regime
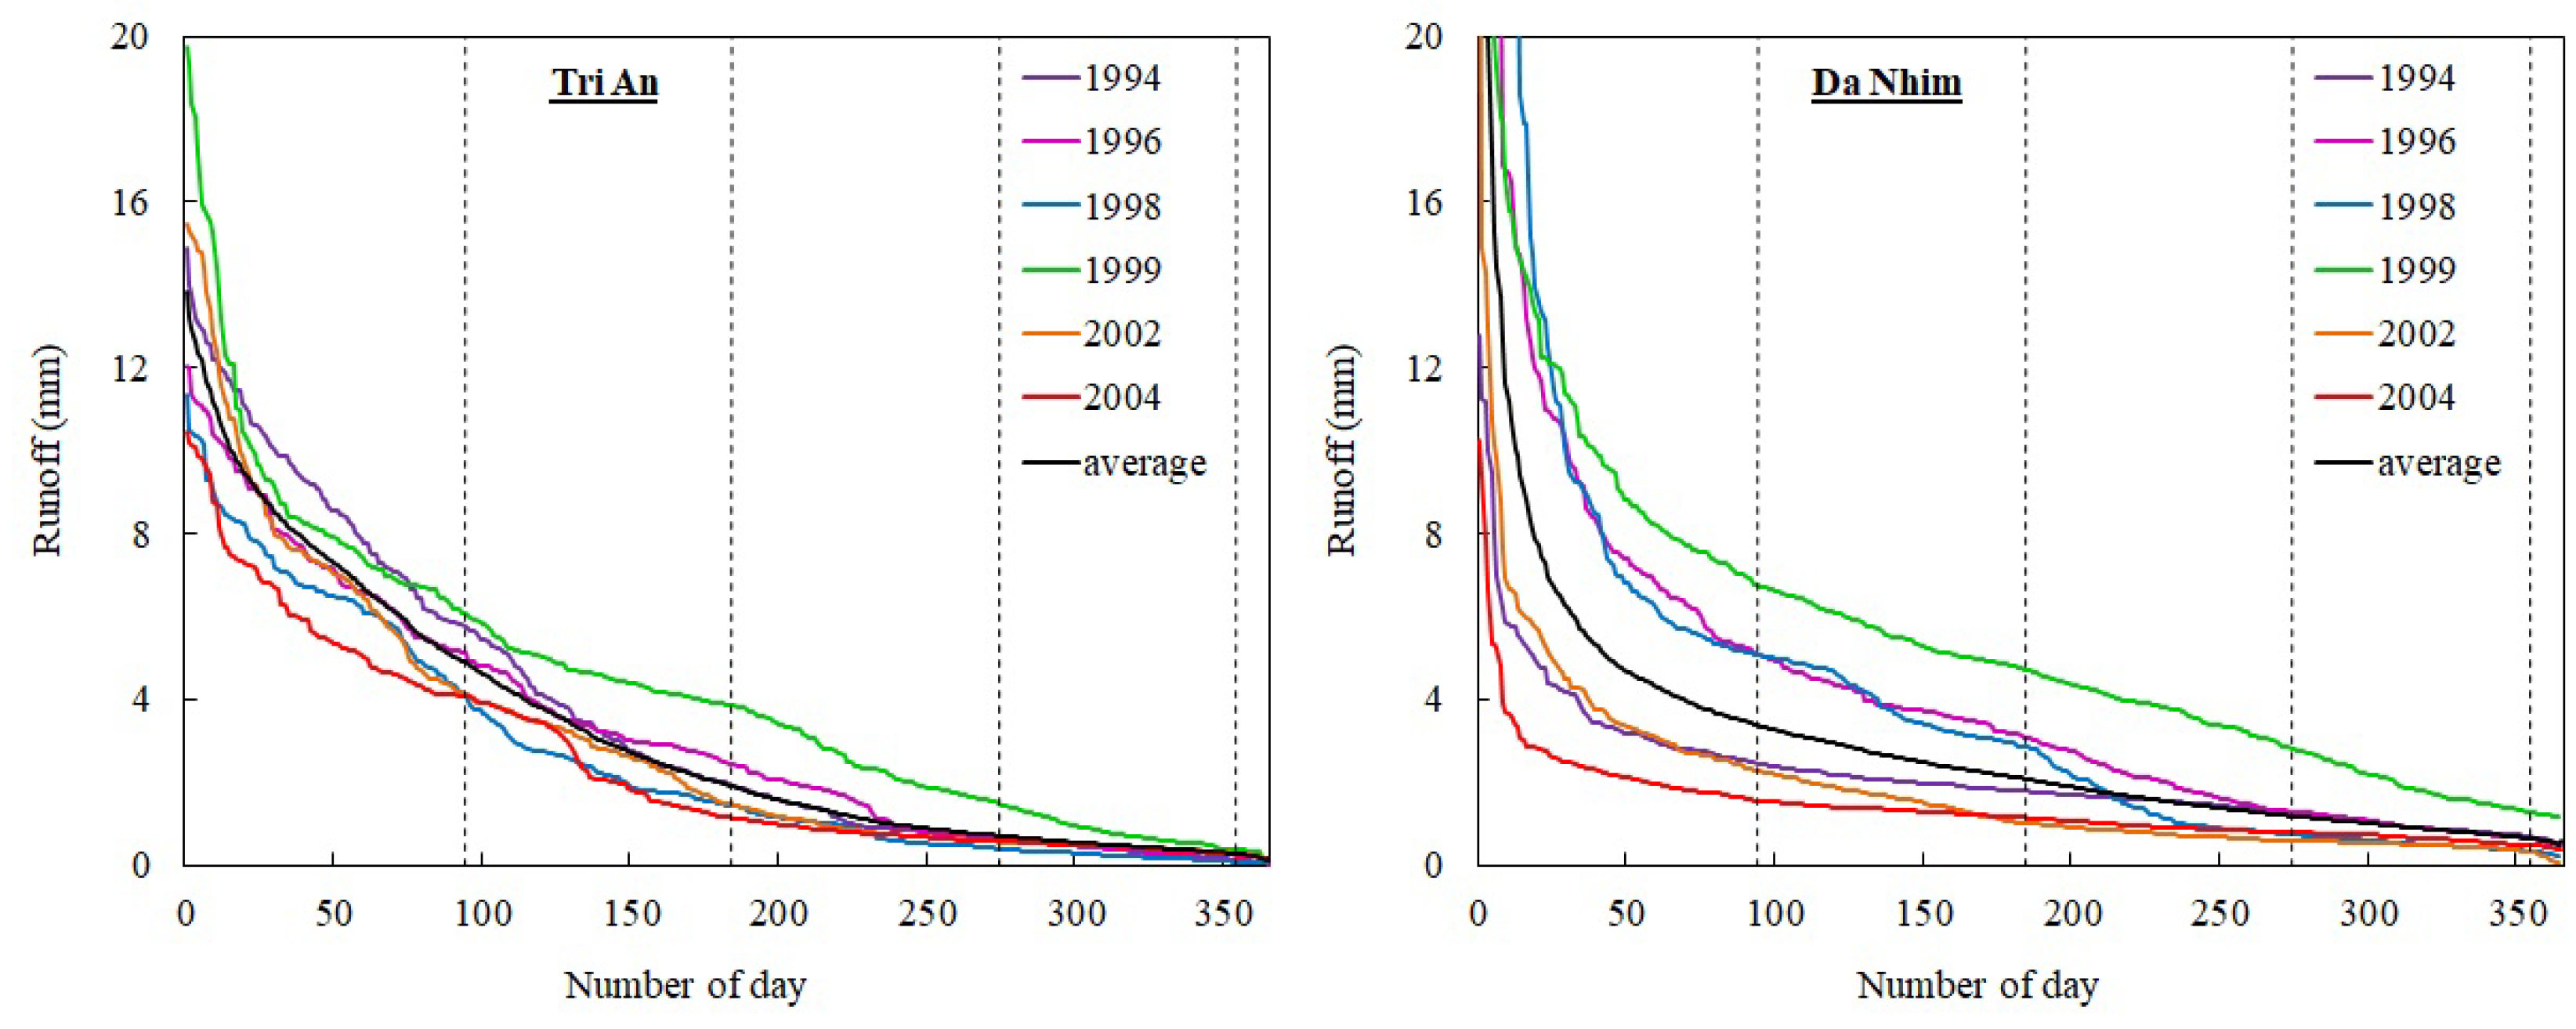
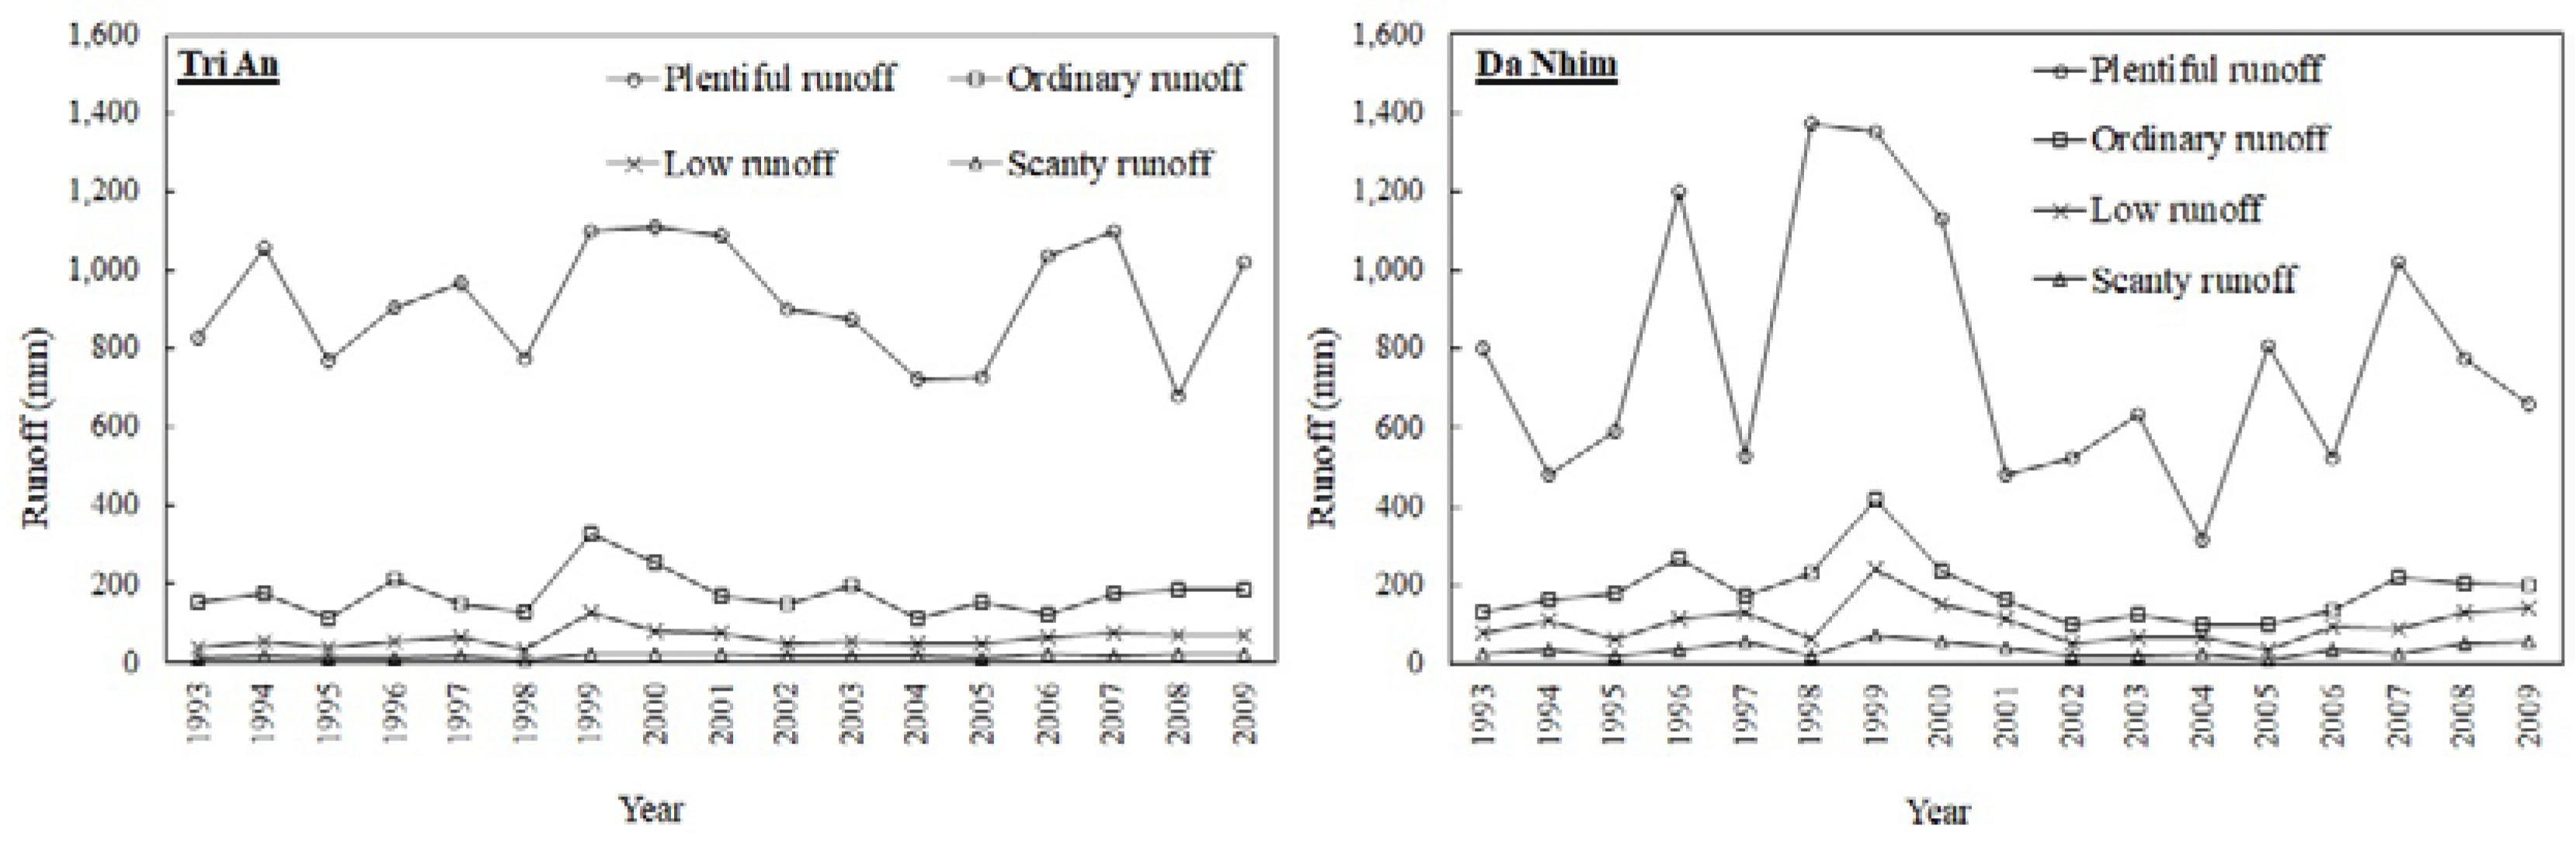
Figure 5 and Figure 6 show the changes in plentiful, ordinary, low, and scanty flow and runoff at Tri An and Da Nhim in the same period. The average proportions of plentiful, ordinary, low, and scanty runoff at Da Nhim were 70%, 17%, 10%, and 3%, respectively. Similarly, at Tri An, the proportions were 78%, 15%, 5%, and 2%, respectively. At Tri An, all the plentiful, ordinary, low, and scanty runoff suddenly increased in 1999 and decreased after that until 2004. At Da Nhim, all runoff increased twice, in 1996 and in 1999, corresponding to two times of forest reductions in this region. Although the plentiful and ordinary runoff decreased before increasing again in 1998, the low and scanty runoff continued to increase until 1997, then decreased in 1998. As mentioned above, deforestation has occurred since 1996 and the largest area of forest cover was lost in 1999; leading the flow–duration curve of 1999 to occupying the top position of the FDCs chart. After 1999, all the plentiful, ordinary, low, and scanty runoff decreased until 2004. From 1999 to 2004, the reductions in the plentiful, ordinary, low, and scanty runoff at Da Nhim were 1036, 318, 175, and 47 mm (77%, 76%, 72%, and 64%), respectively, and at Tri An, the reductions were 380, 320, 77, and 10 mm (35%, 67%, 61%, and 40%), respectively.
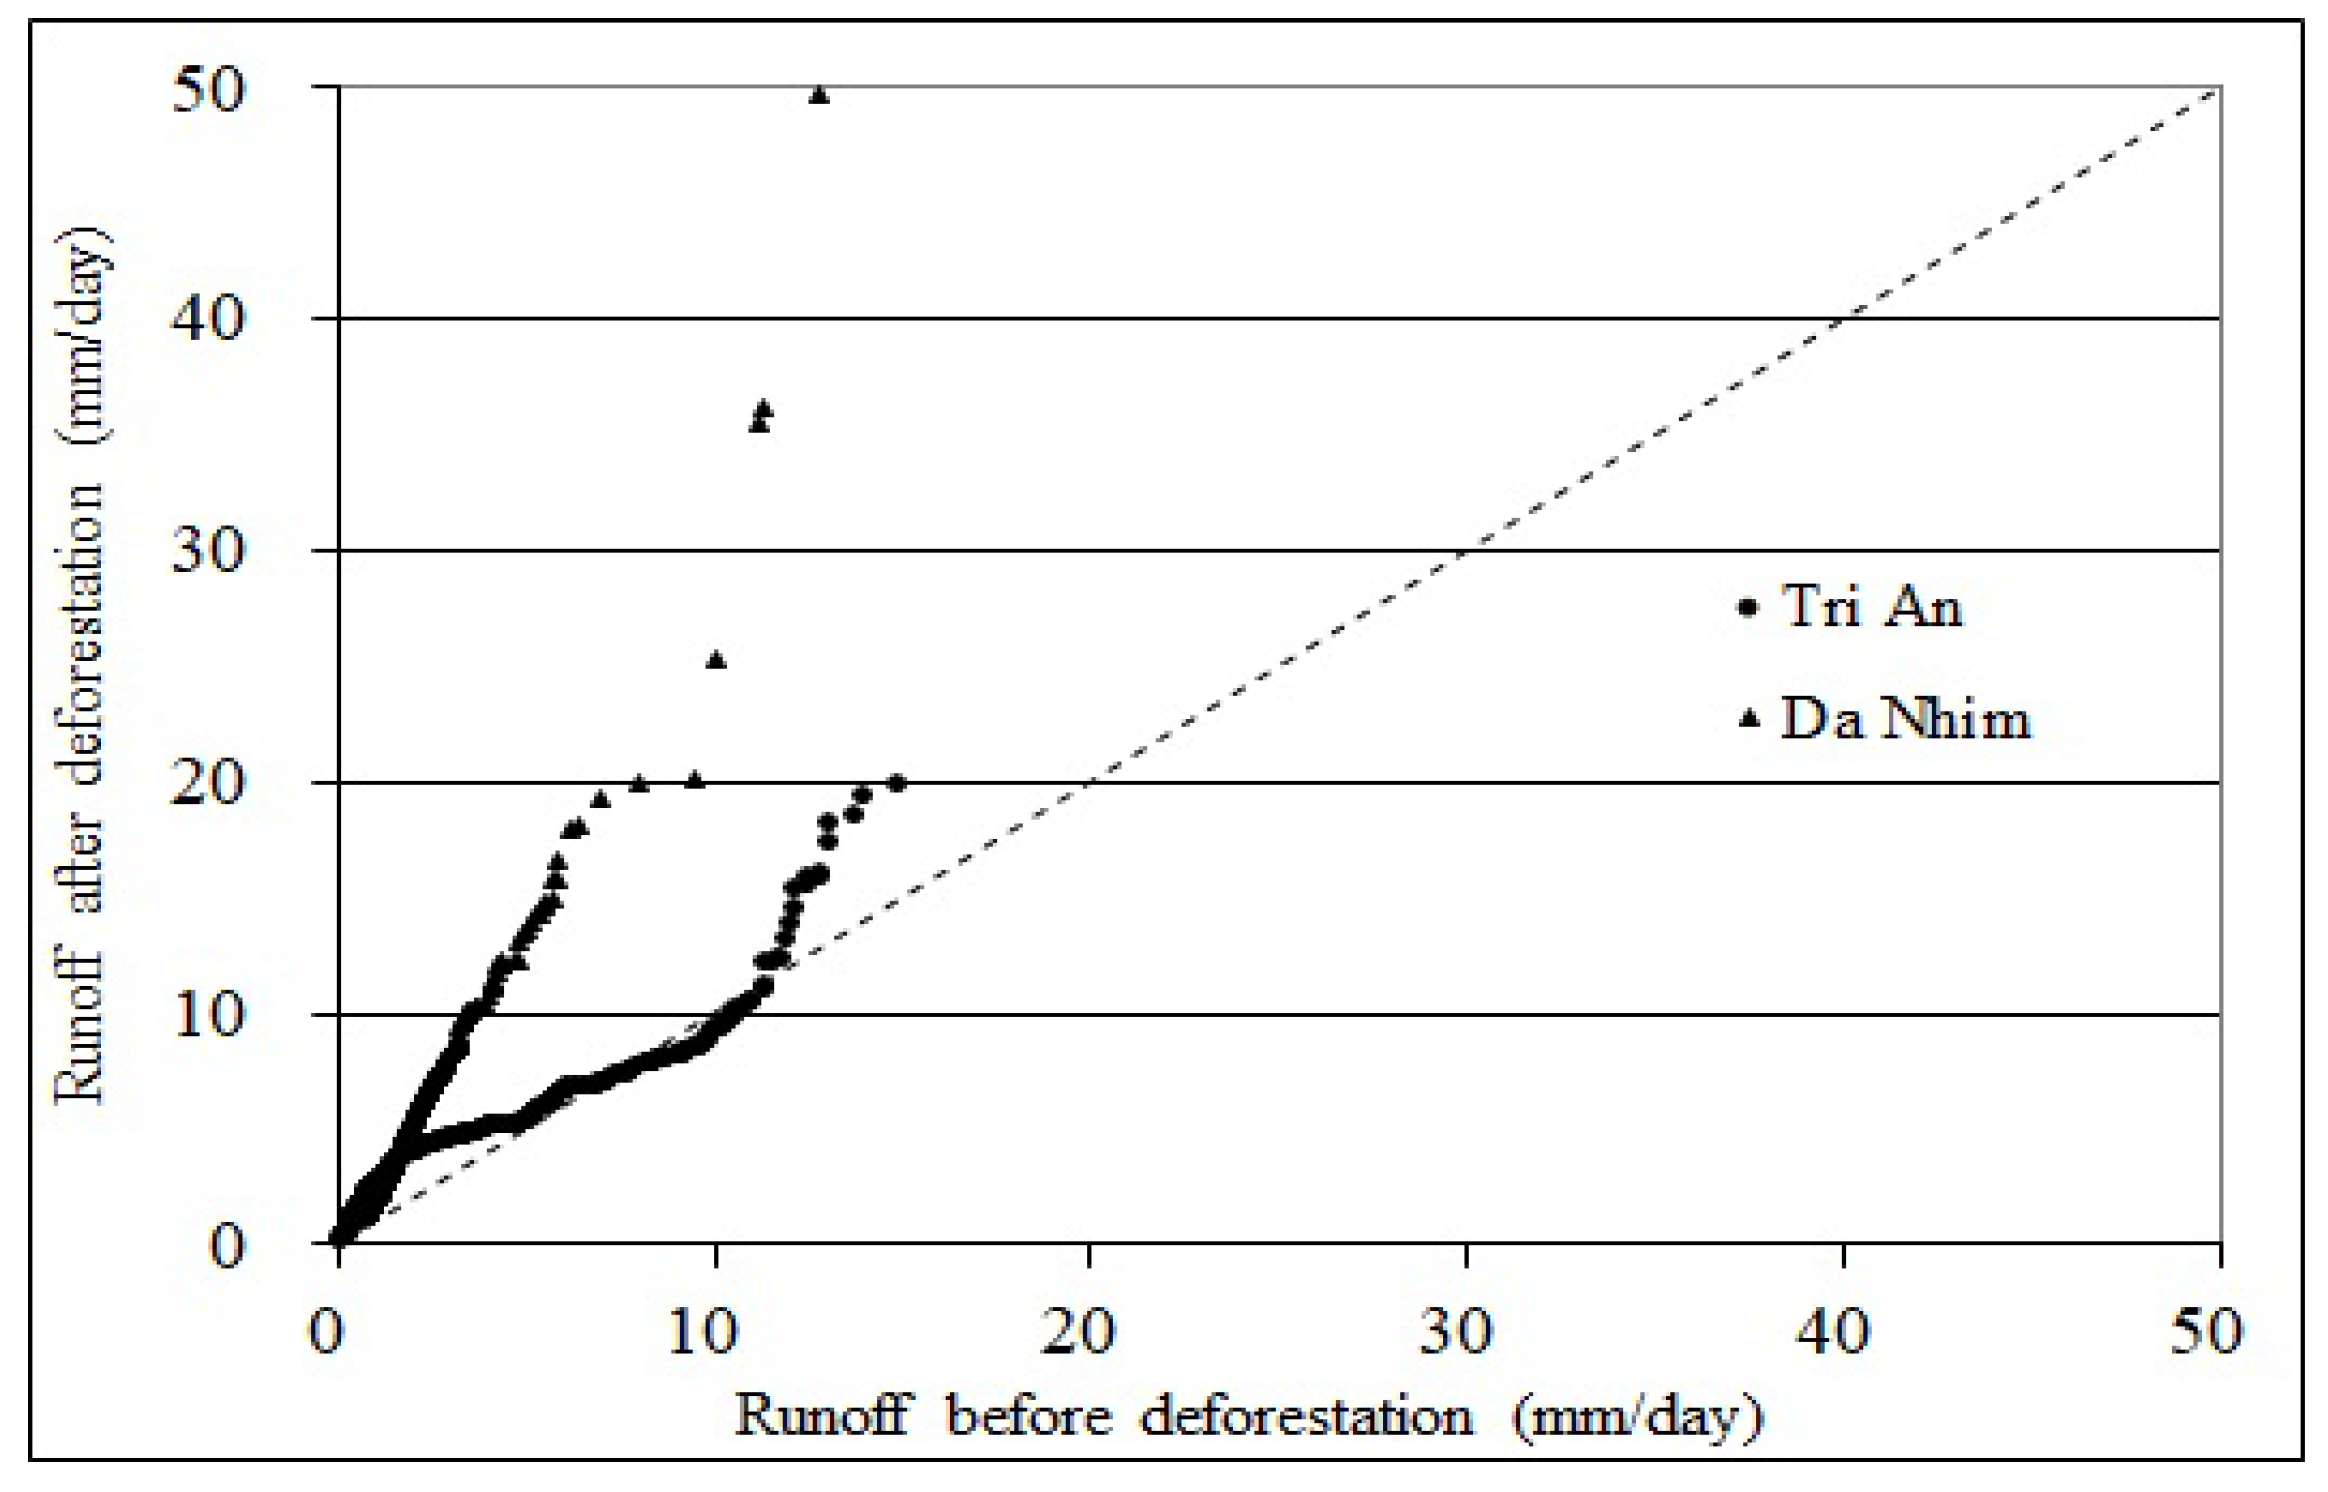
Comparing the flow rate of Tri An and Da Nhim before (1994) and after (1999) deforestation (the bold letters present the large side between the Tri An and Da Nhim basin) (Table 8). Before deforestation, in the high-water side, the Tri An flow rate was larger than that of Da Nhim and conversely in the low-water side, the Da Nhim flow rate was larger. The large/small flow rates of both basins were reserved between day 192nd and 193rd on FDC (1.72 mm/day). Specifically, for more than half of a year (192 days) the flow rate at Tri An is larger than Da Nhim, but in the low-water side (<1.72 mm/day) the flow rate at Da Nhim is larger. After deforestation, all of the flow rates at Da Nhim were larger than the flow rates at Tri An, as both the value and rate of changes at Da Nhim were greater than at Tri An. This means that the flow rate increased due to the effect of deforestation, and this influence in the small basin is greater than in the large basin. Figure 7 compares the flow rate of the same days, before and after deforestation.
Look at the Figure 7, Da Nhim FDC was located above the 1-1 line, meaning that the flow after deforestation was higher. Based on the 1-1 line, the part of Tri An FDC below the 1-1 line takes about 60 days with runoff value from 6.82 to 11.46 mm/day. After that, even though the flow subsequently increased, overall the increase of Tri An was smaller than that of Da Nhim.
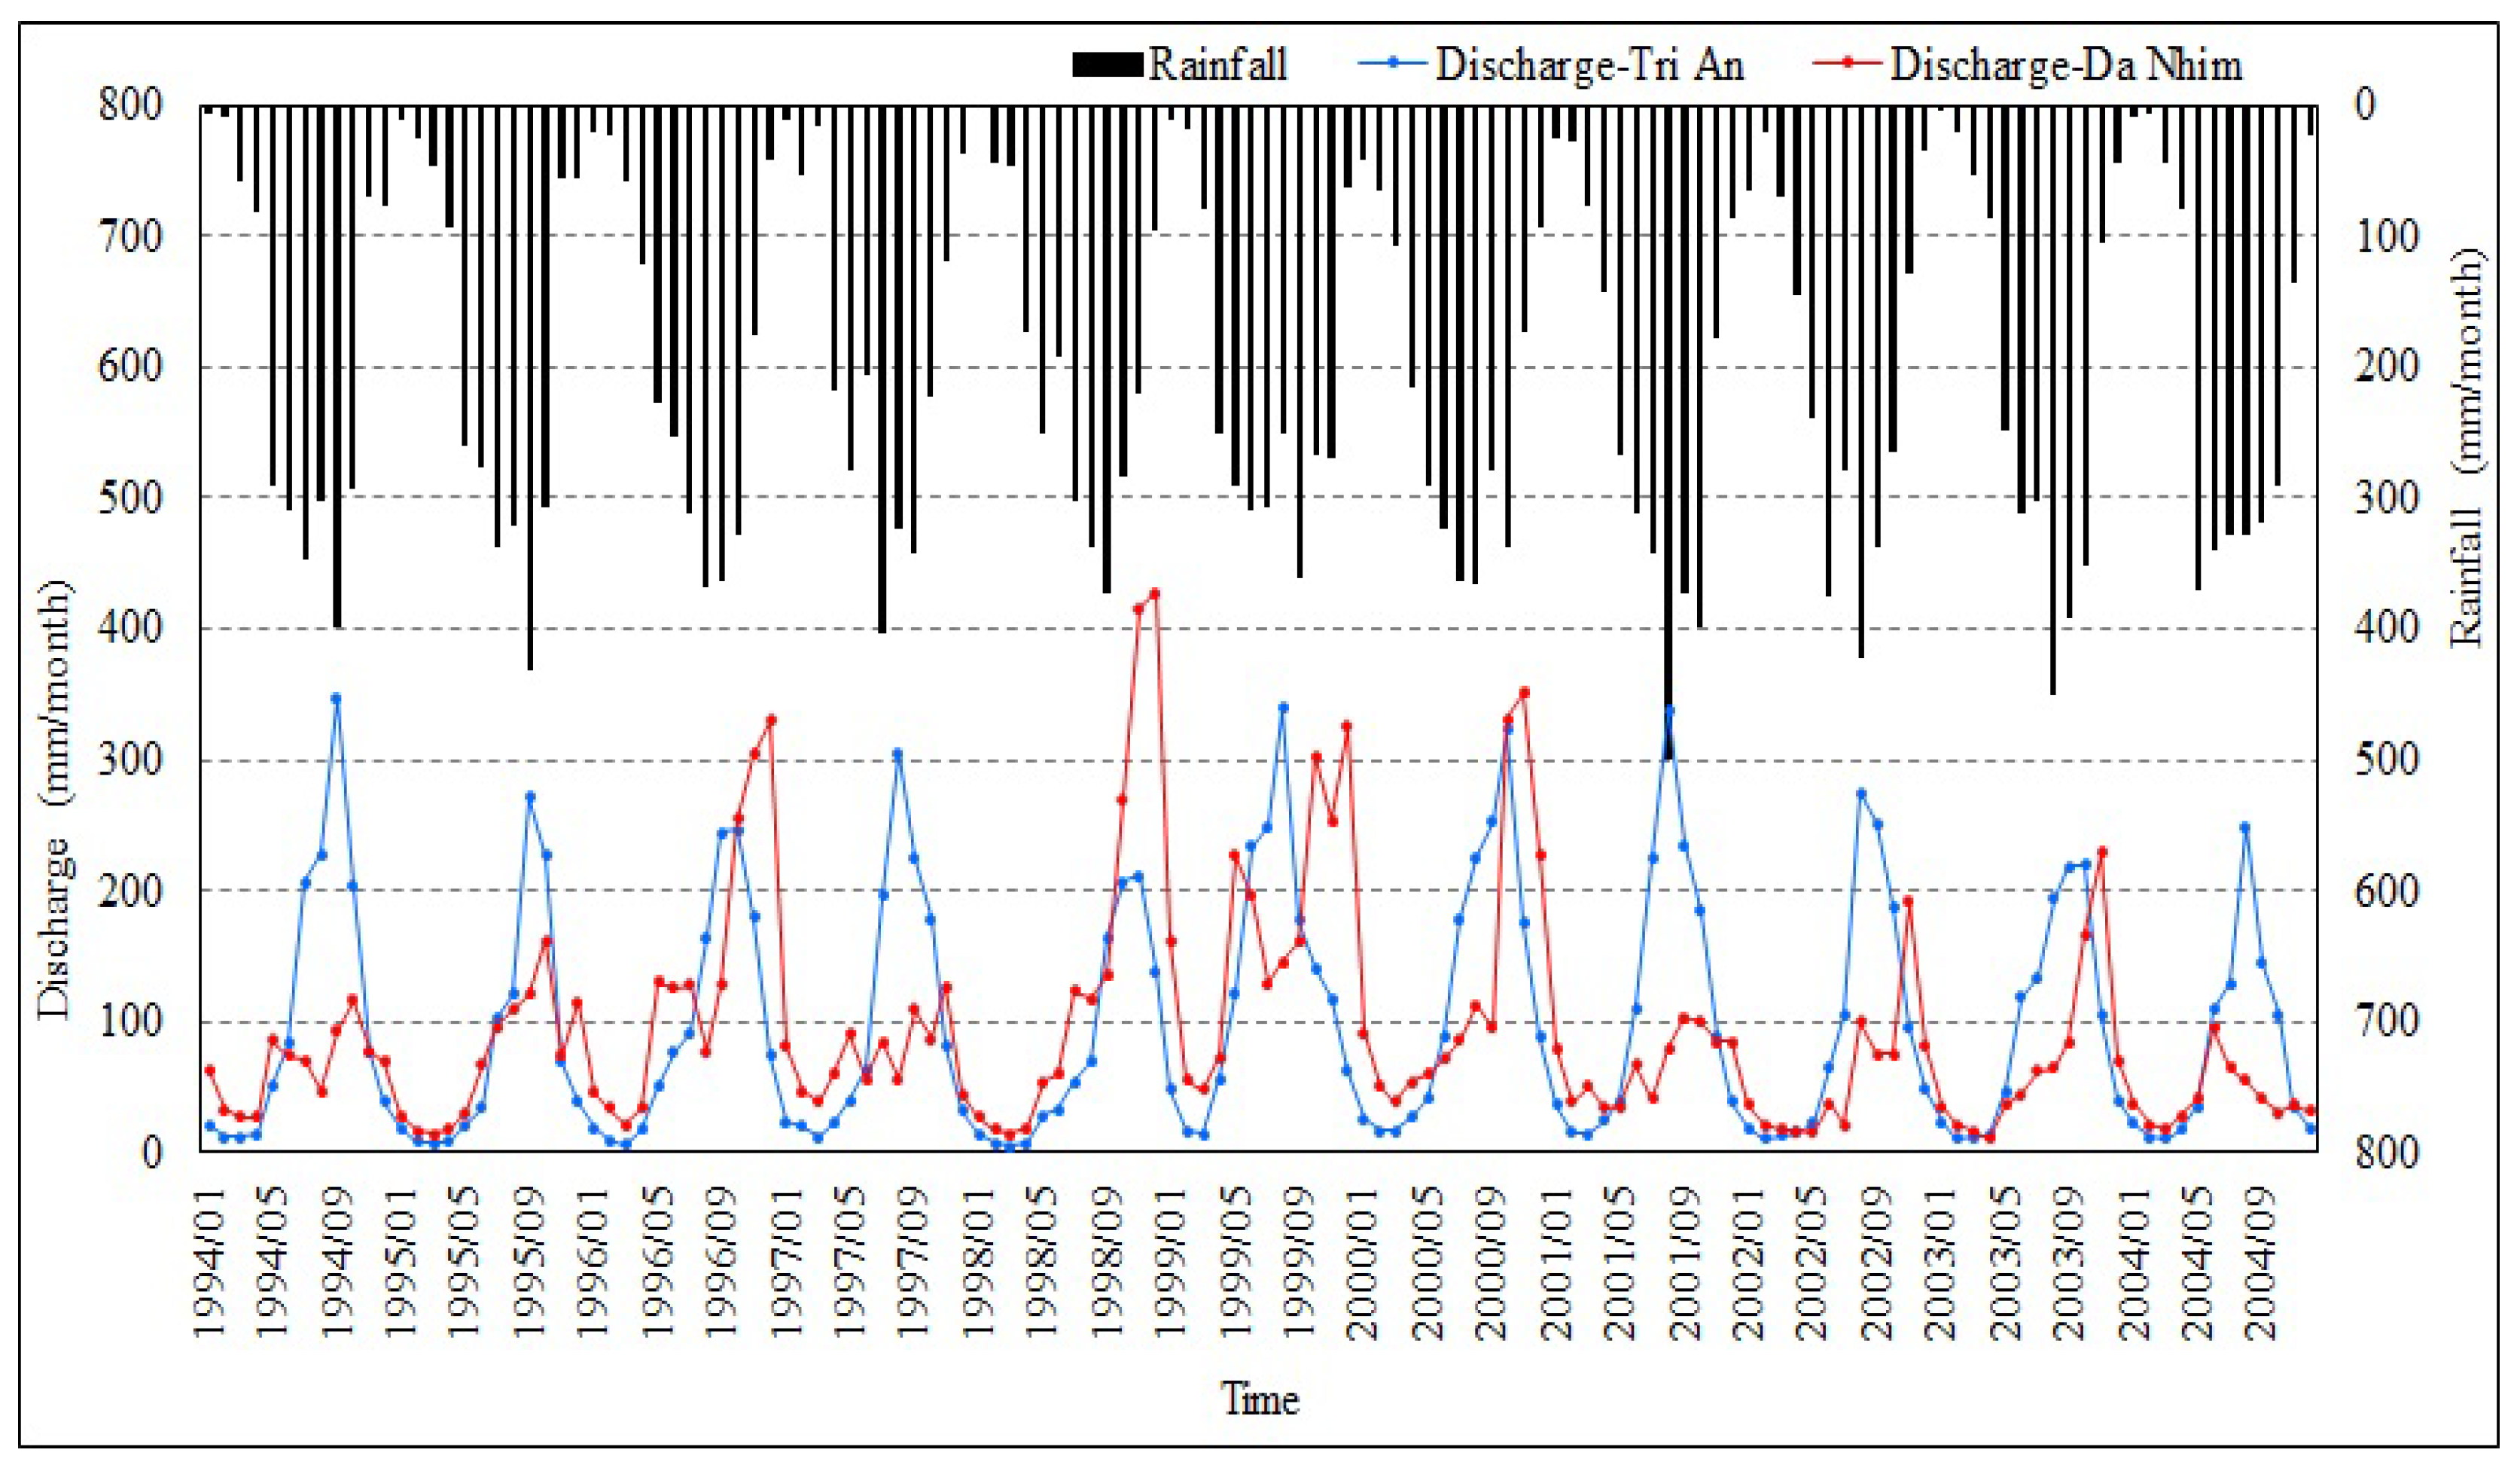
By viewing the annual hydrographs shown in Figure 8, although annual rainfall was almost unchanged, discharge at Da Nhim station in November and December, 1996 and 1998, increased dramatically, equivalent to reducing the forest area in the upper region. The peak flow at Tri An station increased in 1999, 2000, and 2001, the years which saw the largest decline in forest area.
Nakano et al. [12,39] summarized the results of several studies in Japan and confirmed that the plentiful, ordinary, low, and scanty runoff increases were due to deforestation. The primary cause of the increase in plentiful runoff was the increase in surface runoff, and the primary cause of the increase in ordinary, low, and scanty runoff was the decrease in evapotranspiration loss due to the decrease in forest vegetation. Similarly, Maita et al. [48,49] also concluded that annual discharge increased after deforestation, and the FDC in forested watersheds is influenced more by vegetation than by geology. Long-term change in FDC was affected by both forest growth and precipitation fluctuations [50]. This research reinforced those findings. Moreover, this study found that the runoff decreased rapidly as the vegetation recovered and continued to decrease during the period of 1999–2004. This is similar finding to Yao et al. [51] where runoff reduced by forest growth with the increased leaf area index. In addition, Noguchi et al. [36] showed that the FDCs are affected by differences of variation in rainfall and annual rainfall. In this study, considering the years 1999, 2002 and 2004, the FDCs were different as showed in Figure 5. Annual rainfalls were 2475, 2380, and 2277 mm, respectively. Though the variation of rainfall during these years caused the differences of FDC curves, the trends of runoff illustrated clearly the impacts of land cover change to flow in the areas.
Forest soil absorbs, temporarily stores, and gradually releases rainwater to the river to mitigate flooding, along with storing rainwater as a water resource, demonstrating the forest’s capacity for water resource conservation. Forests are covered by lower vegetation, such as shrubs and fallen leaves, preventing erosion and runoff of soil due to rainwater. Additionally, the roots of trees fix the soil and rocks, etc., to prevent soil collapse, providing landslide prevention and soil conservation functions [52]. The tropical monsoon forests shed their leaves every year in the dry season, and that leaf litter acts as a special shield, protecting soil from erosion produced by rain, and maintaining the structure of the surface soil layer [53]. According to Whitmore [54], after human disturbances in tropical forests, soil is usually covered by creeping plants or thicket-forming resam ferns, and the density of the plant growth quickly responds to the increased sunlight on the undergrowth layer. Bamboo culms grow at a rate of 1 m/day for a few days by expanding the internodes of previously formed shoots. The study area is in the tropical rainforest region with bamboo forests among the major ecosystem types, so along with crops replacing lost forest, the rapid regrowth of secondary forest is the cause of NDVI increased right after deforestation. In addition, Pham et al. [16] concluded that land conversion for agriculture is one of the main direct drivers of deforestation and forest degradation in Vietnam, meaning that lost forests were replaced with crops. On a national scale, the Vietnamese government has developed various policies and programs targeting a reduction in deforestation and forest degradation. One of these is the five-million-hectare reforestation program from 1998 to 2010. The result of the program is that nationwide forest coverage increased from 33.2% in 1999 to 37.1% in 2004 [55].
5. Conclusions
In this study, two types of remote sensing, GIS data were used for LULCC calculation. The effects of LULCC on tropical hydrology as well as the relationship between LULCC and local hydrology was found. This is relevant research for strategic decision makers, especially regarding water resources and forest management. Using two different temporal and spatial scales of satellite data, Landsat and GIMMS-NDVI, we examined the LULCC in discrete time and the continuous vegetation change in the upstream Dong Nai River Basin, Vietnam. The results of the land cover classification from Landsat images in 1973, 1989, 1994, 2005, and 2014 showed that the forest-covered area fell sharply between 1994 and 2005 throughout the study area due to the conversion to agricultural land, caused by population growth. The proportions of forest and agricultural land in 1994 were 73% and 23%, respectively, changing to 51% and 40% in 2005. In other words, 3343 km2 of forest cover was converted to agricultural land during the period of 1994 to 2005. Using GIMMS-NDVI, the secular change assessment shows that deforestation occurred after 1996, leading to the vegetation area sharply decreasing in 1999. The lost forest was replaced with crops and vegetation the following year; however, the forest area decreased again after 2004. Deforestation or the conversion of forest areas to agricultural land has led to an immediate increase in the total discharge, maximum flow, and all plentiful, ordinary, low, and scanty runoffs, and subsequently a decline in these quantities due to vegetation regrowth which is a tropical forest characteristic. Comparing the flow rate of before and after forest loss, the response in the small basin is larger than that in a big basin.
Author Contributions
N.C.Q.T. Truong designed the research topic, conducted the data analysis and drafted the manuscript; N.C.Q.T. Truong and H.Q.N. Nguyen conducted the data collection and field survey; A.K. designed the research topic and provided suggestions to revise the paper.
Funding
This research received no external funding.
Acknowledgments
We acknowledge the Ministry of Education, Culture, Sports, Science, and Technology (MEXT) of Japan for providing a Doctoral Scholarship to N.C.Q.T. Truong. We are also deeply grateful for the support we received from our colleagues at the Vietnam National University in Ho Chi Minh City, Institute for Environment and Resources.
Conflicts of Interest
The authors declare no conflict of interest.
References
- Bewket, W.; Sterk, G. Dynamics in land cover and its effect on stream flow in the Chemoga watershed, Blue Nile basin, Ethiopia. Hydrol. Process. 2005, 19, 445–458. [Google Scholar] [CrossRef]
- Costa, M.H.; Aurélie, B.; Jeffrey, A.C. Effects of large-scale changes in land cover on the discharge of the Tocantins River, Southeastern Amazonia. J. Hydrol. 2003, 283, 206–217. [Google Scholar] [CrossRef]
- Kashaigili, J.J. Impacts of land-use and land-cover changes on flow regimes of the Usangu wetland and the Great Ruaha River, Tanzania. Phys. Chem. Earth 2008, 33, 640–647. [Google Scholar] [CrossRef]
- Kashaigili, J.J.; Majaliwa, A.M. Implications of land use and land cover changes on hydrological regimes of the Malagarasi river, Tanzania. J. Agric. Sci. Appl. 2013, 2, 45–50. [Google Scholar] [CrossRef]
- Khoi, D.N.; Suetsugi, T. Impact of climate and land-use changes on hydrological processes and sediment yield—A case study of the Be River catchment, Vietnam. Hydrol. Sci. J. 2014, 59, 1095–1108. [Google Scholar] [CrossRef]
- Li, Z.; Liu, W.; Zhang, X.; Zheng, F. Impacts of land use change and climate variability on hydrology in an agricultural catchment on the Loess Plateau of China. J. Hydrol. 2009, 377, 35–42. [Google Scholar] [CrossRef]
- Nie, W.; Yuan, Y.; Kepner, W.; Nash, M.S.; Jackson, M.; Erickson, C. Assessing impacts of Landuse and Landcover changes on hydrology for the upper San Pedro watershed. J. Hydrol. 2011, 407, 105–114. [Google Scholar] [CrossRef]
- Tan, M.L.; Ibrahim, A.L.; Yusop, Z.; Zheng, D.; Lloyd, L. Impacts of land-use and climate variability on hydrological components in the Johor River basin, Malaysia. Hydrol. Sci. J. 2015, 60, 873–889. [Google Scholar] [CrossRef]
- Bosch, J.M.; Hewlett, J.D. A review of catchment experiments to determine the effect of vegetation changes on water yield and evapotranspiration. J. Hydrol. 1982, 55, 3–23. [Google Scholar] [CrossRef]
- Chang, J.H. Hydrology in humid tropical Asia. In Hydrology and Water Management in the Humid Tropics; Bonell, M., Hufschmidt, M.M., Gladwell, J.S., Eds.; Cambridge University Press: Cambridge, UK, 1993; pp. 55–66. ISBN 0-521-02002-6. [Google Scholar]
- Lal, R. Challenges in agriculture and forest hydrology in the humid tropics. In Hydrology and Water Management in the Humid Tropics; Bonell, M., Hufschmidt, M.M., Gladwell, J.S., Eds.; Cambridge University Press: Cambridge, UK, 1993; pp. 395–404. ISBN 0-521-02002-6. [Google Scholar]
- Nakano, H. Effect on streamflow of forest cutting and change in regrowth on cut-over area. Bull. Gov. For. Exp. Stn. 1971, 240, 1–251, (In Japanese with English Abstract). [Google Scholar]
- Kuraji, K.; Green-Dam Function (Water Source Protection Function) of Forest and Its Enhancement. Japan Afforestation Flood Control Association. 2003. Available online: http://www.uf.a.u-tokyo.ac.jp/~kuraji/Midorinodam.pdf (accessed on 14 September 2016). (In Japanese).
- Gerold, G.; Leemhuis, C. Effects of “ENSO-events” and rainforest conversion on river discharge in Central Sulawesi (Indonesia). In Tropical Rainforests and Agroforests under Global Change; Tscharntke, T., Leuschner, C., Veldkamp, E., Faust, H., Guhardja, E., Bidin, A., Eds.; Springer: Berlin, German, 2010; pp. 327–350. ISBN 978-3-642-26259-3. [Google Scholar]
- Munoz-Villers, L.E.; McDonnell, J.J. Land use change effects on runoff generation in a humid tropical montane cloud forest region. Hydrol. Earth Syst. Sci. 2013, 17, 3543–3560. [Google Scholar] [CrossRef] [Green Version]
- Pham, T.T.H.; Moeliono, M.; Nguyen, T.H.; Nguyen, H.T.; Vu, T.H. The Context of REDD+ in Vietnam: Drivers, Agents and Institutions; CIFOR Occasional Paper No. 75; Center for International Forestry Research (CIFOR): Bogor, Indonesia, 2012. [Google Scholar]
- Vietnam Statistical Yearbook. General Statistics Office of Viet Nam. 2014. Available online: http://www.gso.gov.vn/default_en.aspx?tabid=515&idmid=&ItemID=15197 (accessed on 20 December 2015).
- Forest Science Institute of Vietnam (FSIV). Vietnam Forestry Outlook Study; Asia-Pacific Forestry Sector Outlook Study II, Working Paper No. APFSOS II/WP/2009/09; FAO-Regional Office for Asia and the Pacific: Bangkok, Thailand, 2009; Available online: http://www.fao.org/docrep/014/am254e/am254e00.pdf (accessed on 1 October 2015).
- Department of Forest Protection (DoFP). Data of Annual Change in Forest Area of Vietnam. Available online: http://kiemlam.org.vn/Desktop.aspx/List/So-lieu-dien-bien-rung-hang-nam (accessed on 1 October 2015).
- Ministry of Natural Resources and Environment, Vietnam (MONRE). The Climate Change and Sea Level Rise Scenarios for Vietnam; MONRE: Hanoi, Vietnam, 2009; Available online: http://www.imh.ac.vn/files/doc/KichbanBDKH/Kich%20ban%20Bien%20doi%20khi%20hau_2009.pdf (accessed on 1 October 2015). (In Vietnamese)
- Approval of Revisions to the National Power Development Plan from 2011 to 2020 with Visions Extended to 2030; Decision No. 428/QD-TTg; Vietnam Government: Hanoi, Vietnam, 2016. (In Vietnamese)
- Asian Development Bank (ADB). Water: Vital for Viet Nam’s Future; ADB: Hanoi, Vietnam, 2009. [Google Scholar]
- Japan International Cooperation Agency (JICA): Nippon Koei Co., Ltd. The Master Plan Study on Dong Nai River and Surrounding Basins Water Resources Development: Final Report; Appendix II: Topography and Geology, Appendix III: Meteorology and Hydrology; Japan International Cooperation Agency: Yokosuka, Japan, 1996; Volume 4, Available online: http://open_jicareport.jica.go.jp/617/617/617_123_11309523.html (accessed on 20 September 2017).
- Sustainable Hydropower Development on the Dong Nai River System. Available online: http://hpcdongnai.com/index.php/news/Tin-noi-bo/Phat-trien-Thuy-dien-ben-vung-tren-he-thong-song-Dong-Nai-322/ (accessed on 22 August 2018). (In Vietnamese).
- World Bank. Viet Nam—Water Resources Sector Review; World Development Sources, WDS; World Bank: Washington, DC, USA, 1996; Available online: http://documents.worldbank.org/curated/en/485611468780338713/Viet-Nam-Water-resources-sector-review (accessed on 1 October 2015).
- Ministry of Agriculture and Rural Development, Vietnam (MARD). Ecology of Natural Forests in Vietnam. In Handbook of Forestry; Phung, N.L., Phan, N.H., Trieu, V.H., Nguyen, N.T., Le, T.C., Eds.; MARD: Ha Noi, Vietnam, 2006. Available online: http://agro.gov.vn/images/2007/04/He%20sinh%20thai%20rung%20tu%20nhien%20Viet%20Nam.pdf (accessed on 20 September 2017). (In Vietnamese)
- Vu, T.P. Final Report on Forest Ecological Stratification in Vietnam; UN-REDD Program Vietnam: Hanoi, Vietnam, 2011. [Google Scholar]
- General Statistics Office of Viet Nam. Statistical Yearbook of Vietnam 2005, 2014, 2016. Available online: https://www.gso.gov.vn/Default.aspx?tabid=512 (accessed on 20 December 2015).
- Global Land Cover Facility, University of Maryland (GLCF). GIMMS Documentation. Available online: http://glcf.umd.edu/library/guide/GIMMSdocumentation_NDVIg_GLCF.pdf (accessed on 14 September 2016).
- Foster, H.A. Duration curves. Trans. Am. Soc. Civ. Eng. 1934, 99, 1213–1267. [Google Scholar]
- James, K.S. Flow-Duration Curves, Manual of Hydrology: Part 2, Low-Flow Techniques; Geological Survey Water-Supply Paper 1542-A; U.S. Government Printing Office: Washington, DC, USA, 1959.
- Kawamura, A.; Kuno, Y.; Jinno, K. Proposal of ascending and descending order logarithmic flow duration curve. Doboku Gakkai Ronbunshu 2004, 761, 91–94. [Google Scholar] [CrossRef]
- Tamai, K.; Miyama, T.; Goto, Y.; Kominami, Y. Influence of Forest Decline by Forest Fire and Pine Wilt Disease on Discharge and Discharge Duration Curve: In the Case of Tatsunokuchi-yama Experimental Forest. J. Jpn. For. Soc. 2004, 86, 375–379. (In Japanese) [Google Scholar]
- Tamai, K.; Shimizu, A.; Hosoda, I.; Miyabuchi, Y.; Shimizu, T.; Miyama, T.; Kominami, Y.; Asano, S. The effect of various forest disturbances on water discharge duration curve: The case comparison between the Sarukawa experi-menttal watershed in Miyazaki-shi and the Tatsunokuchi-yama experimental watershed in Okayama. Bull. For. For. Prod. Res. Inst. 2008, 7, 111–120. (In Japanese) [Google Scholar]
- Katsuyama, M.; Fukushima, K.; Tokuchi, N. Comparison of rainfall-runoff characteristics in forested catchments underlain by granitic and sedimentary rock with various forest age. Hydrol. Res. Lett. 2008, 2, 14–17. [Google Scholar] [CrossRef]
- Noguchi, S.; Nik, A.R.; Tani, M. Runoff characteristics in a tropical rain forest catchment. Jpn. Agric. Res. Q. 2005, 39, 215–219. [Google Scholar] [CrossRef]
- Fujimura, K.; Murakami, M.; Iseri, Y.; Kanae, S. Application of a hydrological model to evaluate the potential hydro energy in a mountainous small river basin of Japan. In Proceedings of the FRIEND-Water 2014, Montpellier, France, 7–10 October 2014. [Google Scholar]
- Sumi, T.; Kuwata, M.; Ishida, H.; Niwa, N.; Kojima, H.; Inoue, M.; Sato, Y.; Takemon, Y.; Kantoush, S. Evaluation of Hydropower Potential in Japan in Consideration of Climate Change; Annuals of Disaster Prevention Research Institute, No. 59 B; Kyoto University: Kyoto, Japan, 2016; (In Japanese with English Abstract). [Google Scholar]
- Nakano, H.; Kikuya, A.; Morisawa, M. Effects of changes in forest conditions especially cutting on runoff—Effects on water-yearly, plentiful, ordinary, low and scanty runoff. Bull. Gov. For. Exp. Stn. 1963, 156, 1–84, (In Japanese with English Abstract). [Google Scholar]
- Ministry of Land, Infrastructure, Transport and Tourism. River Glossary 39–45. Available online: https://www.kkr.mlit.go.jp/yamato/about/glossary/index_category.html (accessed on 22 August 2018). (In Japanese).
- Irish, R. Frame and Fill Program; NASA Goddard Space Flight Center: Greenbelt, MD, USA, 2009.
- Anderson, J.R.; Hardy, E.E.; Roach, J.T. Witmer, R.E. A land Use and Land Cover Classification System for Use with Remote Sensor Data; U.S. Geological Survey Professional Paper 964; U.S. Government Printing Office: Washington, DC, USA, 1976. [Google Scholar]
- Rientjes, T.H.M.; Hailel, A.T.; Kebede, E.; Mannaerts, C.M.M.; Habib, E.; Steenhuis, T.S. Changes in land cover, rainfall and stream flow in Upper Gilgel Abbay catchment, Blue Nile basin—Ethiopia. Hydrol. Earth Syst. Sci. 2011, 15, 1979–1989. [Google Scholar] [CrossRef] [Green Version]
- Congalton, R.G. A review of assessing the accuracy of classification of remotely sensed data. Remote Sens. Environ. 1991, 37, 35–46. [Google Scholar] [CrossRef]
- Foody, G.M. Harshness in image classification accuracy assessment. Int. J. Remote Sens. 2008, 29, 3137–3158. [Google Scholar] [CrossRef] [Green Version]
- General Statistics Office of Vietnam. The 1999 Vietnam Population and Housing Census: Completed Results. Available online: https://www.gso.gov.vn/default.aspx?tabid=407&idmid=4&ItemID=1346 (accessed on 20 December 2015). (In Vietnamese)
- DeFries, R.S.; Rudel, T.; Uriarte, M.; Hansen, M. Deforestation driven by urban population growth and agricultural trade in the twenty-first century. Nat. Geosci. 2010, 3, 178–181. [Google Scholar] [CrossRef]
- Maita, E. A Study on the Influence of Deforestation on Runoff at Fukuroyamasawa Experimental Watershed in Chiba Forest. Ph.D. Thesis, University of Tokyo, Tokyo, Japan, 2006. (In Japanese). Available online: https://repository.dl.itc.u-tokyo.ac.jp/?action=pages_view_main&active_action=repository_view_main_item_detail&item_id=4274&item_no=1&page_id=41&block_id=85 (accessed on 14 September 2016). (In Japanese).
- Maita, E.; Suzuki, M. The effect of forest cutting on flow duration curve of mountainous small watershed: Evaluation of the influence of vegetation on inter-watershed variation in flow duration curve. J. Jpn. For. Soc. 2008, 90, 36–45. [Google Scholar] [CrossRef]
- Kuraji, K.; Gomyo, M. Long-term variation of 10-year mean flow duration curve in a small watershed undergoing forest restoration and succession on denuded hills. Water Sci. 2013, 57, 117–127. (In Japanese) [Google Scholar] [CrossRef]
- Yao, H.; Hashino, M.; Xia, J.; Chen, X. Runoff reduction by forest growth in Hiji River basin, Japan. Hydrol. Sci. J. 2009, 54, 556–570. [Google Scholar] [CrossRef]
- Ministry of Agriculture Forestry and Fisheries (MAFF), Forestry Agency, Japan. Multiple Functional Roles of Forests and Forest Management Activities. In Annual Report on Forest and Forestry in 2013. Available online: http://www.rinya.maff.go.jp/j/kikaku/hakusyo/25hakusyo/pdf/5hon1-1.pdf (accessed on 20 September 2017). (In Japanese).
- Kuznetsov, A.N.; Kuznetsova, S.P. Tropical monsoon forests of Vietnam (Results of 20 Years of Phytoecological Research). Biol. Bull. 2013, 40, 187–196. [Google Scholar] [CrossRef]
- Whitmore, T.C. An Introduction to Tropical Rain Forests; Oxford University Press Inc.: New York, NY, USA, 1990; ISBN 0-19-854276-3. [Google Scholar]
- Ministry of Planning and Investment. Evaluate the Performance of Five Million Hectare Reforestation Programme, Vietnam (MPI-5MHRP). Available online: http://www.ncif.gov.vn/Page/Download.aspx?fileid=379 (accessed on 20 September 2017). (In Vietnamese).
Figure 1.
The upstream Dong Nai River Basin in Vietnam.

Figure 2.
Flow–duration curve, modified from Nakano et al. [39].
Figure 2.
Flow–duration curve, modified from Nakano et al. [39].

Figure 3.
Upstream Dong Nai River Basin land cover maps for 1973, 1989, 1994, 2005, and 2014.

Figure 4.
Maximum NDVI value composite from the first fifteen days of January for the period of 1994–2006.
Figure 4.
Maximum NDVI value composite from the first fifteen days of January for the period of 1994–2006.

Figure 5.
Annual FDCs of Tri An and Da Nhim.

Figure 6.
Annual changes in the plentiful, ordinary, low, and scanty runoff at Tri An and Da Nhim.

Figure 7.
FDCs before and after deforestation of Tri An and Da Nhim.

Figure 8.
Annual hydrographs at Tri An and Da Nhim.


Table 1.
Study site description [28].
Table 1.
Study site description [28].
| Provinces | Area (km2) | Agricultural Land (km2) | Forestry Land (km2) | Population Density (person/km2) |
|---|---|---|---|---|
| Binh Phuoc | 6877 | 4463 | 1729 | 139 |
| Binh Thuan | 7944 | 3618 | 3442 | 154 |
| Dak Nong | 6509 | 3600 | 2353 | 93 |
| Dong Nai | 5864 | 2784 | 1802 | 505 |
| Lam Dong | 9783 | 3677 | 5397 | 132 |
| Whole country | 331,231 | 115,302 | 149,236 | 280 |
Table 2.
Land cover classes description.
| Class | Classification Description |
|---|---|
| Dense-Forest | Areas covered with continuous canopy |
| Sparse-Forest/Shrub | Including areas disturbed by or regenerating following recent harvest or fire, areas covered with shrubs, bushes and small trees |
| Perennial/Orchard | Areas covered with plants that live for more than two years such as rubber, cashew, pepper, fruit trees |
| Crop Land | Areas used for crop cultivation, and the scattered rural settlements |
| Built-Up/Residential | Residential, commercial services, industrial, transportation, communications, industrial and commercial, urban or built-up land |
| Marsh/Grasses | Area covered by grass for a considerable period of the year; area along streams in poorly drained areas and the shallow water along the boundaries of lakes, reservoirs, and rivers |
| Water Bodies | Permanent open water, lakes, reservoirs, and rivers |
Table 3.
Accuracy of classes of the 2005 land cover map.
| Accuracy | Dense Forest | Sparse Forest | Perennial/Orchard | Crop | Marsh Grasses | Built-Up/ Residential | Water Bodies |
|---|---|---|---|---|---|---|---|
| Pa | 97% | 85% | 93% | 61% | 64% | 79% | 89% |
| Ua | 91% | 87% | 92% | 76% | 82% | 83% | 80% |
Table 4.
Area and proportion of each land cover class in 1973, 1989, 1994, 2005, and 2014.
| Land Cover Class | Area (km2) (Percentage) | |||||||||
|---|---|---|---|---|---|---|---|---|---|---|
| 1973 | 1989 | 1994 | 2005 | 2014 | ||||||
| Dense Forest | 5395 | 37% | 6224 | 42% | 6630 | 45% | 5052 | 34% | 4505 | 31% |
| Sparse Forest/Shrub | 7184 | 49% | 4808 | 33% | 4113 | 28% | 2536 | 17% | 2060 | 14% |
| Perennial/Orchard | 1622 | 11% | 2607 | 18% | 2724 | 19% | 5687 | 39% | 6458 | 44% |
| Crop | 404 | 3% | 683 | 5% | 734 | 5% | 906 | 6% | 963 | 7% |
| Marsh Grasses | 6 | 0% | 14 | 0% | 13 | 0% | 17 | 0% | 17 | 0% |
| Built-Up/Residential | 5 | 0% | 10 | 0% | 19 | 0% | 86 | 1% | 128 | 1% |
| Water Bodies | 90 | 1% | 360 | 2% | 473 | 3% | 422 | 3% | 575 | 4% |
Table 5.
Land cover conversion matrix for 1994–2005 (units: km2).
| 2005 | Forest | Agriculture | Marsh Grasses | Built-Up/ Residential | Water Bodies | 1994 Total | |
|---|---|---|---|---|---|---|---|
| 1994 | |||||||
| Forest | 7329 | 3343 | 5 | 17 | 49 | 10,743 | |
| Agriculture | 240 | 3147 | 0 | 52 | 20 | 3459 | |
| Marsh Grasses | 2 | 0 | 11 | 0 | 0 | 13 | |
| Built-up/Residential | 0 | 2 | 0 | 17 | 0 | 19 | |
| Water Bodies | 18 | 101 | 0 | 1 | 353 | 473 | |
| 2005 total | 7588 | 6593 | 17 | 86 | 422 | 14,706 | |
| Provinces | 1999 | 2005 | 2014 |
|---|---|---|---|
| Binh Phuoc | 653,926 | 795,900 | 932,500 |
| Binh Thuan | 1,046,320 | 1,150,600 | 1,207,400 |
| Dak Nong | - | 397,500 | 571,300 |
| Dong Nai | 1,990,678 | 2,193,400 | 2,838,600 |
| Lam Dong | 998,027 | 1,161,000 | 1,259,300 |
| Whole country | 76,323,173 | 83,119,900 | 90,728,900 |
(Dak Nong Province was re-established on 1 January 2004).
Table 7.
Area of burned and destroyed forest from 2000 to 2005 [28] (units: km2).
Table 7.
Area of burned and destroyed forest from 2000 to 2005 [28] (units: km2).
| Provinces | 2000 | 2001 | 2002 | 2003 | 2004 | 2005 |
|---|---|---|---|---|---|---|
| Binh Phuoc | 5.785 | 4.138 | 8.760 | 4.370 | 9.460 | 14.480 |
| Binh Thuan | 4.257 | - | 2.070 | 5.430 | 1.660 | 0.840 |
| Dak Nong | - | - | - | - | 2.580 | 2.250 |
| Dong Nai | 0.332 | 0.620 | 1.250 | 0.279 | 0.215 | 1.475 |
| Lam Dong | 2.380 | 2.050 | 10.998 | 3.140 | 1.630 | 2.863 |
| Total | 12.754 | 6.808 | 23.078 | 13.219 | 15.545 | 21.908 |
Table 8.
Index of FDCs before and after deforestation (mm/day).
| Max. Flow | Plentiful Flow | Ordinary Flow | Low Flow | Scanty Flow | Min. Flow | ||
|---|---|---|---|---|---|---|---|
| Before | Tri An | 14.91 | 5.72 | 1.91 | 0.61 | 0.27 | 0.18 |
| Da Nhim | 12.80 | 2.42 | 1.78 | 1.26 | 0.67 | 0.42 | |
| After | Tri An | 19.73 | 6.04 | 3.84 | 1.45 | 0.37 | 0.11 |
| Da Nhim | 49.66 | 6.73 | 4.68 | 2.79 | 1.27 | 1.16 | |
| Changes | Tri An | 4.82 | 0.32 | 1.93 | 0.84 | 0.11 | −0.07 |
| Da Nhim | 36.86 | 4.31 | 2.91 | 1.53 | 0.60 | 0.74 | |
| Rate of Changes | Tri An | 0.32 | 0.06 | 1.01 | 1.37 | 0.40 | −0.40 |
| Da Nhim | 2.88 | 1.78 | 1.64 | 1.21 | 0.90 | 1.77 | |
© 2018 by the authors. Licensee MDPI, Basel, Switzerland. This article is an open access article distributed under the terms and conditions of the Creative Commons Attribution (CC BY) license (http://creativecommons.org/licenses/by/4.0/).
Share and Cite
MDPI and ACS Style
Truong, N.C.Q.; Nguyen, H.Q.; Kondoh, A. Land Use and Land Cover Changes and Their Effect on the Flow Regime in the Upstream Dong Nai River Basin, Vietnam. Water 2018, 10, 1206. https://doi.org/10.3390/w10091206
AMA Style
Truong NCQ, Nguyen HQ, Kondoh A. Land Use and Land Cover Changes and Their Effect on the Flow Regime in the Upstream Dong Nai River Basin, Vietnam. Water. 2018; 10(9):1206. https://doi.org/10.3390/w10091206
Chicago/Turabian StyleTruong, Nguyen Cung Que, Hong Quan Nguyen, and Akihiko Kondoh. 2018. "Land Use and Land Cover Changes and Their Effect on the Flow Regime in the Upstream Dong Nai River Basin, Vietnam" Water 10, no. 9: 1206. https://doi.org/10.3390/w10091206
Note that from the first issue of 2016, this journal uses article numbers instead of page numbers. See further details here.