Article

The Effect of Ca and Mg Ions on the Filtration Profile of Sodium Alginate Solution in a Polyethersulfone-2-(methacryloyloxy) Ethyl Phosphorylchloline Membrane

1
Department of Chemical Engineering, Universitas Syiah Kuala, Jl. Syeh A Rauf, 7, Darussalam, Banda Aceh 23111, Indonesia
2
Graduate School of Chemical Engineering, Universitas Syiah Kuala, Banda Aceh 23111, Indonesia
3
Department of Chemical Engineering, UniversitiTeknologi Petronas, Bandar Seri Iskandar, Perak 32610, Malaysia
*
Author to whom correspondence should be addressed.
Water 2018, 10(9), 1207; https://doi.org/10.3390/w10091207
Submission received: 14 August 2018 / Revised: 2 September 2018 / Accepted: 4 September 2018 / Published: 7 September 2018

Abstract

:
The efforts to improve the stability of membrane filtration in applications for wastewater treatment or the purification of drinking water still dominate the research in the field of membrane technology. Various factors that cause membrane fouling have been explored to find the solution for improving the stability of the filtration and prolong membrane lifetime. The present work explains the filtration performance of a hollow fiber membrane that is fabricated from polyethersulfone-2-(methacryloyloxy) ethyl phosphorylchloline while using a sodium alginate (SA) feed solution. The filtration process is designed in a pressure driven cross-flow module using a single piece hollow fiber membrane in a flow of outside-inside We investigate the effect of Ca and Mg ions in SA solution on the relative permeability, membrane resistance, cake resistance, and cake formation on the membrane surface. Furthermore, the performance of membrane filtration is predicted while using mathematical models that were developed based on Darcy’s law. Results show that the presence of Ca ions in SA solution has the most prominent effect on the formation of a cake layer. The formed cake layer has a significant effect in lowering relative permeability. The developed models have a good fit with the experimental data for pure water filtration with R2 values between 0.9200 and 0.9999. When treating SA solutions, the developed models fit well with experimental with the best model (Model I) shows R2 of 0.9998, 0.9999, and 0.9994 for SA, SA + Ca, and SA + Mg feeds, respectively.

1. Introduction

In the last few decades, the use of membrane technology for water and wastewater treatment has undergone rapid development. Membrane material developments have also been comprehensively and continuously conducted [1,2,3,4]. In comparison with conventional processes, membrane technology offers some advantages. Membrane filtration is highly flexible and it can easily be applied under a required specification. It can be combined with other processes (i.e., membrane bioreactor). The process operation can be performed continuously and automatically, with high selectivity. Membrane is able to separate small particles, such as microbes, bacteria, viruses, and ions [5]. Additionally, the technology can easily be scaled-up in a low foot-print, and the separation properties can be easily fine-tuned with solvent treatment of the membrane material, as described elsewhere [6]. Membrane processes also offer sustainable solutions for various applications, such as waste valorization [7], desalination [8], organocatalysis [9], and extraction [10].
Hollow fiber membranes are the most frequently used in the water processing industry. They are in form of pipe-shape with a diameter 340 μm–1 mm [11,12], where the flow of permeate can be adjusted from inside to outside or vice versa [6]. They have the most prominent advantage over flat membranes in terms its much higher packing density. However, besides those advantages, membrane fouling remains the major obstacle that limits the process productivity via blockage of pores by foulant. Membrane fouling is a serious problem that decreases the hydraulic performance. Therefore, extensive researches have been done for understanding the mechanisms and finding methods for membrane fouling control.
The studies of membrane modification to minimize the fouling and investigation of the factors affecting the foulant deposition and build-up constitute one of the main focuses of membrane research. Some of the common foulant materials include inorganics (clay, silica, salt, and oil), living creatures (microorganisms) [13], and synthetic or natural organic substances [14]. Fouling decreases flux and indirectly affect membrane lifetime because of the use of chemical agent for maintenance and intensive cleanings. Fouling management also dictates process operation and increases the operational costs due to the need for more energy and chemicals for physical and chemical cleanings. Both are required for membrane performance recovery and for regularly maintaining the system productivity.
Based on removability of the foulant, fouling is categorized into reversible and irreversible [15]. Foulant is formed inside the pore or resides on top of the membrane surface as a result of the concentration of polarization, cake layer development, adsorption of foulant materials, and the diffusion of the substance on the membrane pores [16,17]. The nature of foulant can be detected while using different tools, such as Fourier Transform Infrared spectroscopy (FTIR) for chemical bonding identification, Scanning Electron Microscopy (SEM), or Atomic Force Microscopy (AFM) for obtaining surface morphology.
In addition to actual autopsy of foulant from a fouled membrane, many other approaches have also been developed to comprehend the nature of membrane fouling, including the use of mathematical model. Mathematical model help one to understand the mechanism of membrane fouling and formation of fouling layer. By analyzing the pattern of the data obtained from experimental results, one can envisage models that explain such a pattern and later can relate it with the actual physical phenomena [18].
The study of the fouling phenomenon while using a mathematical model for the commercial microfiltration polypropylene hollow-fiber membrane for dead-end TiO2 catalyst separation has been conducted elsewhere [19]. In the study, the model was driven in a constant-flux system, as such the pressure develops overtime to compensate membrane fouling. The developed model can explain the cake layer formation that corresponds to cake resistance (Rc) [19]. In another study, a model has been developed to predict flux decline of polypropylene and polyethersulfone membranes for filtration of yeast suspension in a cross-flow system. The developed model offers a good predictions of flux trend as function of time [20].
This study investigates the membrane fouling of sodium alginate (SA) solution in the presence of Ca and Mg ions. The nature of the fouling is monitored by measuring water permeability, membrane resistance, and the rejection coefficient. Such performances were later modelled using mathematical formula. SA is one of the natural organic substances (NOM) that is often found in industrial wastewater and seawater [21]. In membrane filtration, this substance may generate adverse fouling effects [15]. Therefore, a comprehensive study is required to understand the phenomenological nature, the type, and filtration condition that may affect the membrane fouling involving SA [22]. A mathematical model was developed by studying the effect of the appearance of Ca and Mg ions. The available models in literature do not include the presence of Ca and Mg ions. The focus was on cake-formation by assessing the membrane resistance (Rm), cake resistance (Rc), and flux decrease (Jp). The models were validated by fitting it with experimental data to predict the Rm, Rc, and Jp.

2. Theory

A transport model can be developed based on Darcy’s law by considering both mass and momentum balances under constant temperature and pressure. The flow of feed solution passing the membrane pores through the walls of the hollow fiber membrane is considered to be laminar, where the axial flow is ignored.
For fouling investigation, the filtration is driven by pressure ang the transport is from outside to inside. The separation is dominant on the surface, so the cake layer is assumed only on the outer wall of the membrane with minimum extent of pore blocking. We assume that the formed cake is homogeneous and clogged up, so the thickness of the cake is uniform surrounding the outer membrane surface. From such assumption, mathematical models to predict the relative permeability (Jp/Jo) profile as function of Rm, Rc, radius of cake (rc), and δc have been developed. Illustration on the filtration flow and formation of cake layer on the membrane surface are shown in Figure 1.

3. Method

3.1. Material

The polymer, the solvent and membrane modifying agent were polyethersulfone (PES-Ultrason E6020 P, BASF Co, Ludwigshafen, Germany) and dimethyl formamide (DMF, WAKO Pure Chemical Industries, Ltd., Osaka, Japan) and 2-(methacryloyloxy)ethyl phosphorylchloline (MPC, Sigma Aldrich, Steinheim, Germany), respectively. The samples of Ca and Mag ions were formulated from CaCl2 and Mg2SO4 compounds (both from WAKO Pure Chemical Industries, Ltd., Osaka, Japan). NaOH and H2SO4 were used to control the pH of the sample water (Sigma Aldrich, Steinheim, Germany). All of the chemicals were used as received without further purification.

3.2. Membrane Preparation and Characterization

A lab-made hydrophilic hollow fiber ultrafiltration membrane was used. It was made and conditioned to have good properties by adding 2-(methacryloyloxy) ethyl phosphorylchloline (MPC) in the polymer solution. The polymer solution (PES 20 wt% and MPC 2 wt% in DMF solvent) was pumped with a flow rate of 0.06 ms−1 through the spinneret to the coagulation bath with an air gap distance of 5 cm. The formed membrane was tied on a spindle cylinder, with a rotation speed of 0.22 ms−1.
The morphology of the resulting membrane was analyzed using SEM (FE-SEM, JSM-7500F, JEOL Ltd., Tokyo, Japan). One piece of hollow fiber membrane was freeze dried for one night in a tube (FD-1000, Eyela, Tokyo, Japan). The membrane was then put and fractured under liquid nitrogen, followed by the coating procedure with Pt/Pd sputtering before SEM analysis. The degree of hydrophilicity of the membrane was analyzed with a water contact angle meter (Kyowa Interface Science Co., Drop Master 300, CA-A, Saitama, Japan). The sample was fixed on a metal plate. Around 0.5 μL of water was poured on the membrane surface, and the contact angle between the water and the membrane surface was then recorded. The data for the water contact angle were based on the results of ten measurements.

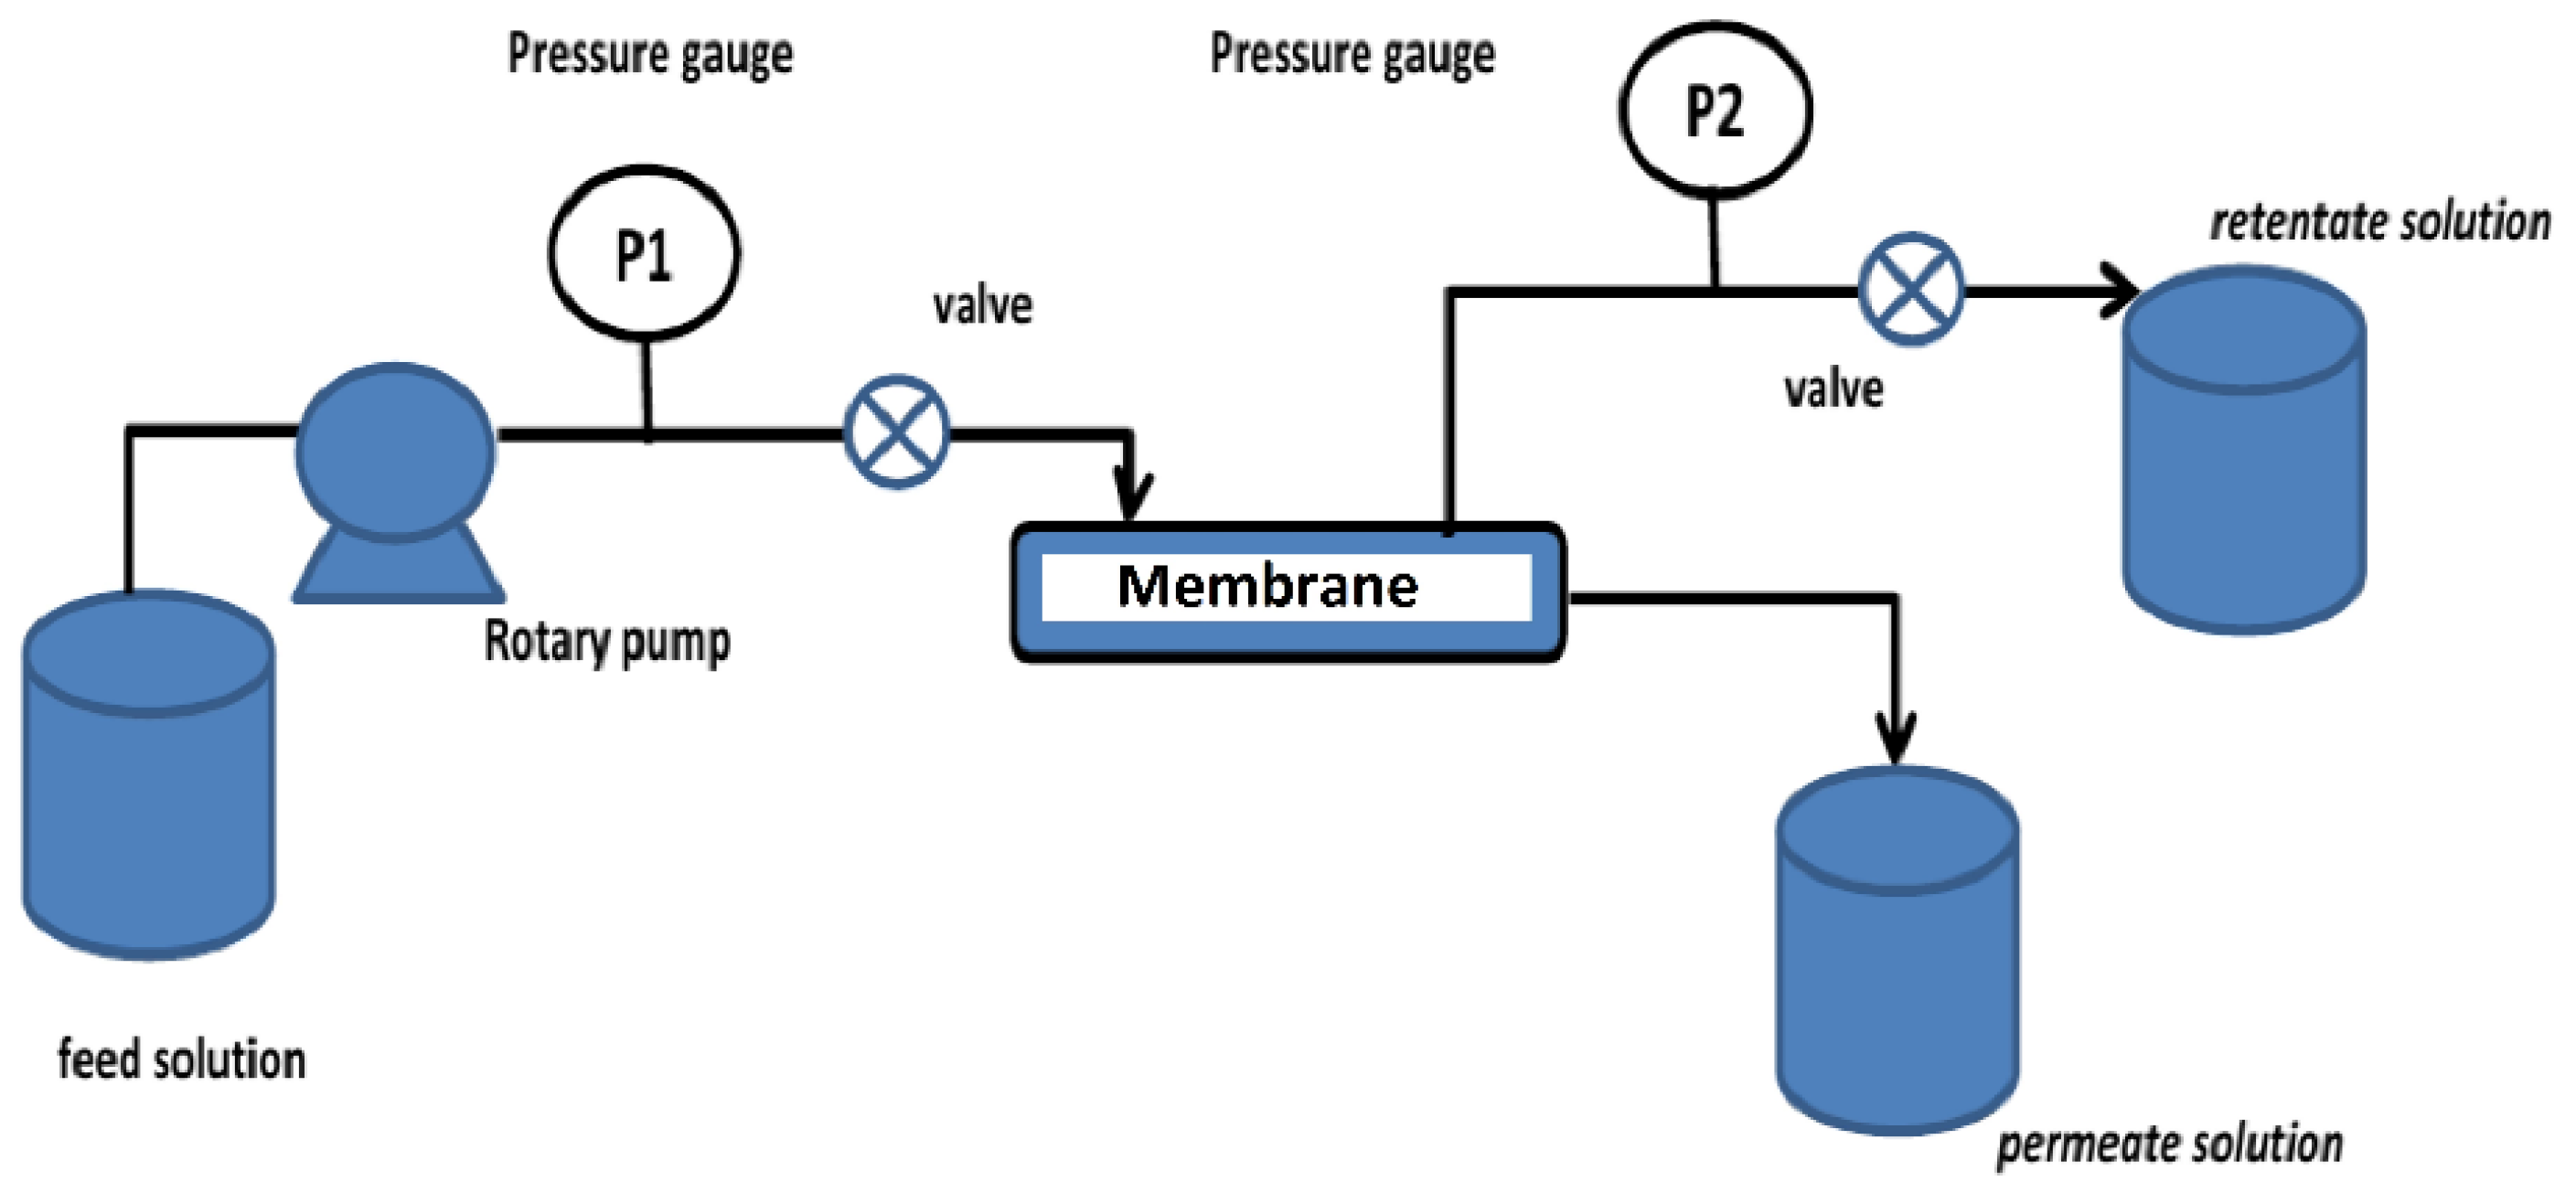
3.3. Ultrafiltration Process

The membrane filtration profile was obtained while using a cross-flow filtration module operating in pressure different outside (PDO) system, in which water penetrates the membrane from out to inside of the fiber. A lab-scale PDO filtration unit is shown in Figure 2. The ultrafiltration set-up consisted of a peristaltic pump (Watson Marlow, Sci. 323, Rommerskirchen, Germany), two pressure gauges to regulate the pressure, a cross-flow module of out-in flow type, one strand of hollow fiber membrane, a feedback tank, and a permeate tank.
In order to examine the filtration profile and to monitor membrane fouling, three models of feed solution were configured: (1) SA solution of 50 ppm, (2) SA solution of 50 ppm with 0.125 mM of Ca ion, and (3) SA solution of 50 ppm with 0.125 mM of Mg ion. The concentration range was taken as the upper values that lead cake layer fouling, as reported elsewhere by [23]. All the feeds were set at pH of 7. The filtration was started by draining the feed solution with a peristaltic pump in which with feed flow from the outer to inner side of the fiber a gauge pressure of 1 atm. The permeate was allowed to accumulate in the lumen (inner part of the hollow fiber), and after it was full, the permeate overflowed into the collection tank. The volume and weight of the permeate were recorded every 10 min, and the filtration lasted for one hour.
The water permeability of the membrane at the first 10 min ( J 10 ) and at the next n min ( J n ) were calculated using Equations (1) and (2). With the same procedure, the water permeability was also calculated for the permeate of the feeds containing SA, SA + Ca, and SA + Mg.
J 10 × ( l m 2 × hr × atm ) = V 10 AtP
J n × ( l m 2 × hr × atm ) = V n AtP
where V 10 and V n are the permeate volume over a filtration time of 10 min and the next 10 min. A, t, and P are the membrane surface area, filtration time, and membrane pressure, respectively. The relative permeability (Rp) over time is presented relative to the first 10 min value, as in Equation (3).
R P = J n J 10

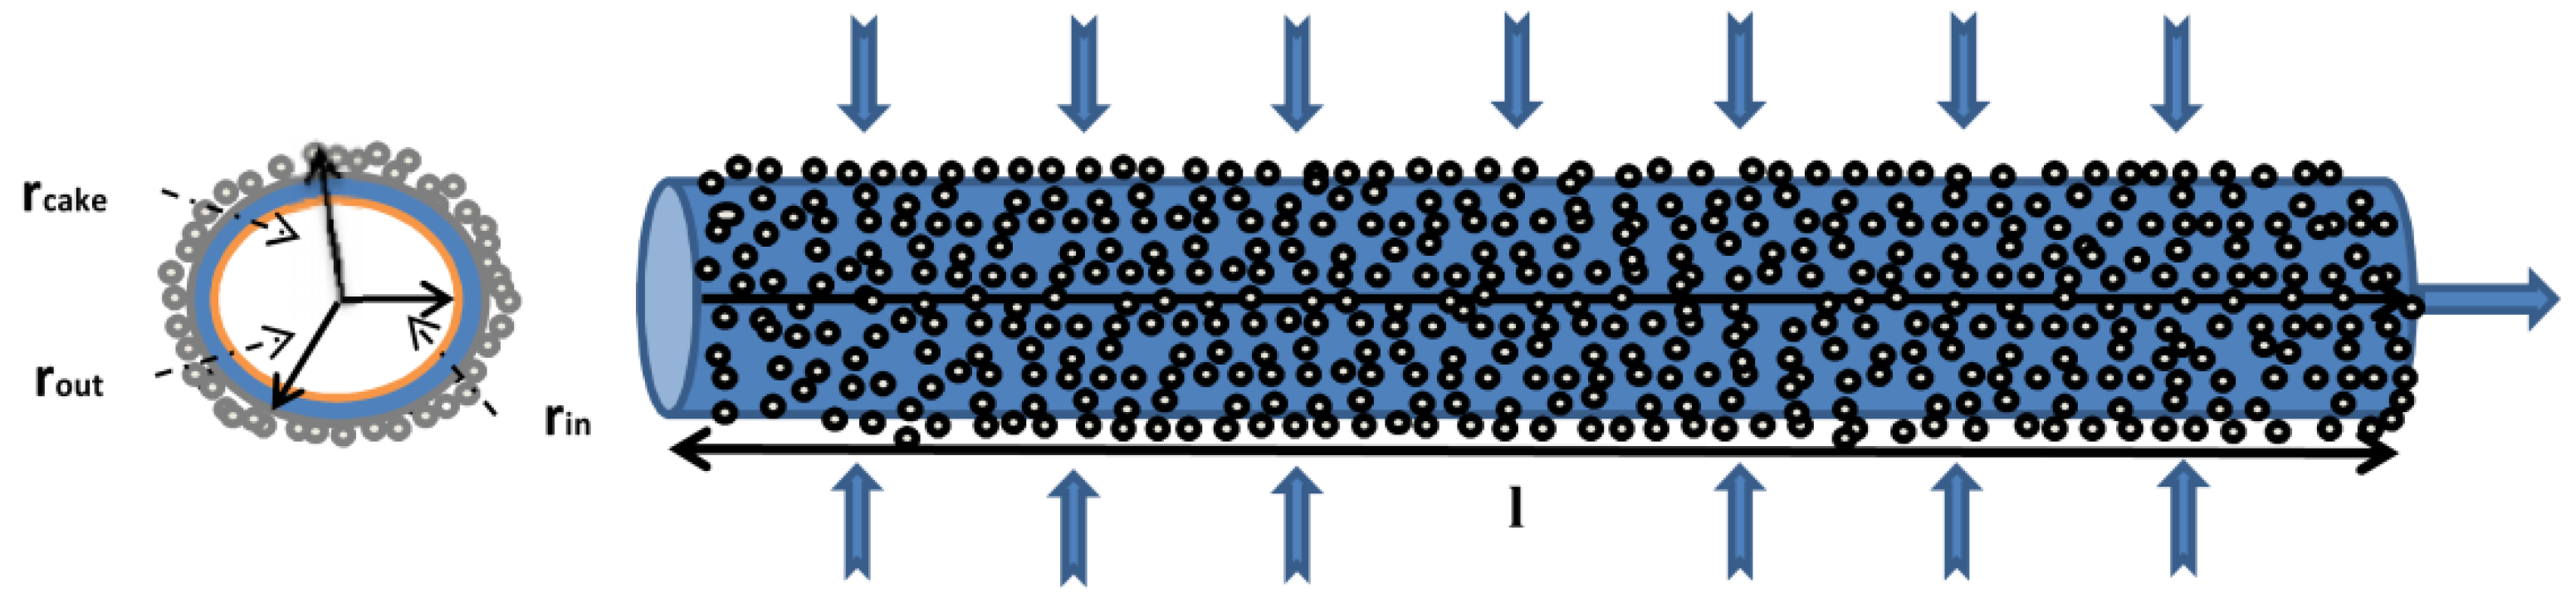
3.4. Cake Layer Model

Membrane fouling for filtration of SA solution, as revealed later from the SEM image, is largely in the form of cake layer on the outer membrane surface. The cake-formation model, in this case, is assumed to follow the mass transfer of fluid in porous media and the formation of a cake layer as a part of the fouling phenomenon obeys the Darcy’s law, as in Equation (4) [24].
dV dt = V p = k μ A dP dr
Differentiation of Equation (4) results in Equation (5).
dP dr = V p Ak μ
Under this condition, there is a change in the radius of the membrane (r) as a result of the increasing thickness of cake and the decreasing filtration flux. The membrane surface area is assumed perfectly cylindrical, as formula shown in Equation (6).
A ( t ) = 2 π r ( t ) l
If the general direction of permeate flow is perpendicular to the center of the membrane, and the axial rate is negligible, with the initial limit before filtration ri ≤ r ≤ ro, and during filtration until the forming of cake ro ≤ r ≤ r c ( t ) , Equation (5) can be expanded, as follows:
P = V p ( t ) 2 π lk m μ [ ln r 0 r i ] + V p ( t ) 2 π lk c μ [ ln r c ( t ) r 0 ]
By linking the result of the integration of Equation (7) with the membrane resistance (Rm) in Equation (8) and cake resistance (Rc) in Equation (9). [25], Equation (7) can be formulated as Equation (10).
R m = 1 k m r 0 ln r 0 r i
R c ( t ) = 1 k c r 0 ln r c ( t ) r 0
P = V p ( t ) 2 π r 0 l μ ( 1 k m r 0 [ ln r 0 r i ] + 1 k c r 0 [ ln r c ( t ) r 0 ] )
when V p ( t ) 2 π r 0 l is the permeate flux change against time at constant pressure (P). Equation (10) can be simplified into Equations (11) and (12), as also proposed in literature [26].
P = J p ( t ) μ ( R m + R c ( t ) )
J p ( t ) = P μ ( R m + R c ( t ) )
By assuming that the formation of the cake layer on the membrane surface equals to the particles approaching the outer surface, in which R c ( t ) [19] is the radius of cake against time; the equation can be written, as follow:
V p C b dt 2 π hr c dr c ( 1 ε c ) ρ s + 2 π hr c dr c C b = 0
dr c dt = V p C b 2 π hr c ( ( 1 ε c ) ρ s C b )
The mass balance of the component transfer is shown in Equation (15) [27]:
J c + D dc dx = Jc p
By assuming that there is no reverse diffusion from the bulk toward the direction of inflow implying that:
D dc dx = 0
Equation (15) can be simplified into:
J c = Jc p
When the inflow and the outflow rate are written as formula shown in Equations (18) and (19);
J c = V 0 dC b
Jc p = J 0 A   C b dt
in which V 0 is the feed volume, Equation (17) can then be expanded to Equation (20).
V 0 dC b = J 0 A   C b dt
here, J 0 and A are the initial flux of filtration and surface area of the membrane, respectively. J 0 A = V p is the permeate flow rate:
V 0 dC b = V p C b dt
dC b dt = V p V 0 C b
At t = 0, C b = C 0 , the change in bulk concentration against time can be written as
C b ( t ) = C 0 exp ( V p V 0 t )
By substituting Equation (23) into Equation (20) and integrated the resulting equation in respect to time with the boundary condition of t = 0 and rc = r0, it results in Equation (24).
r c ( t ) = r 2 + V 0 π l ln ( 1 ε ) ρ s C 0 exp ( V p V 0 t ) ( 1 ε ) ρ s C 0
The Rc value then can be written by substituting Equation (24) into Equation (25), resulting Equation (26), as follows:
R c ( t ) = 1 k c r 0 ln r c ( t ) r 0
R c ( t ) = 1 k c r 0 ln r 2 + V 0 π l ln ( 1 ε ) ρ s C 0 exp ( V p V 0 t ) ( 1 ε ) ρ s C 0 r 0

3.5. Model Validation

Equation (26) is used to examine Rc by fitting the model with experimental data via the minimum sum squares of errors (SSE) methods [28]. This way, the smallest deviation between model and experimental data is obtained to predict the unknown variables:
SSE = i = 1 n ( X experiment X Model ) 2
The obtained value is then used to determine the other independent variables, and is validated with the R2 value as reference (Equation (28)).
R 2 = i = 1 n ( X experiment X ¨ experiment ) 2 ( X Model X ¨ experiment ) 2
Here, X experiment is the result of experimental data; X ¨ experiment the average of the results of the experimental data with respect to the filtration time; and, X Model the result calculated based on the model. The result of the R2 calculation is better when the value is close to 1, which indicates that the model is in good agreement with the experimental result [29].

4. Results and Discussion

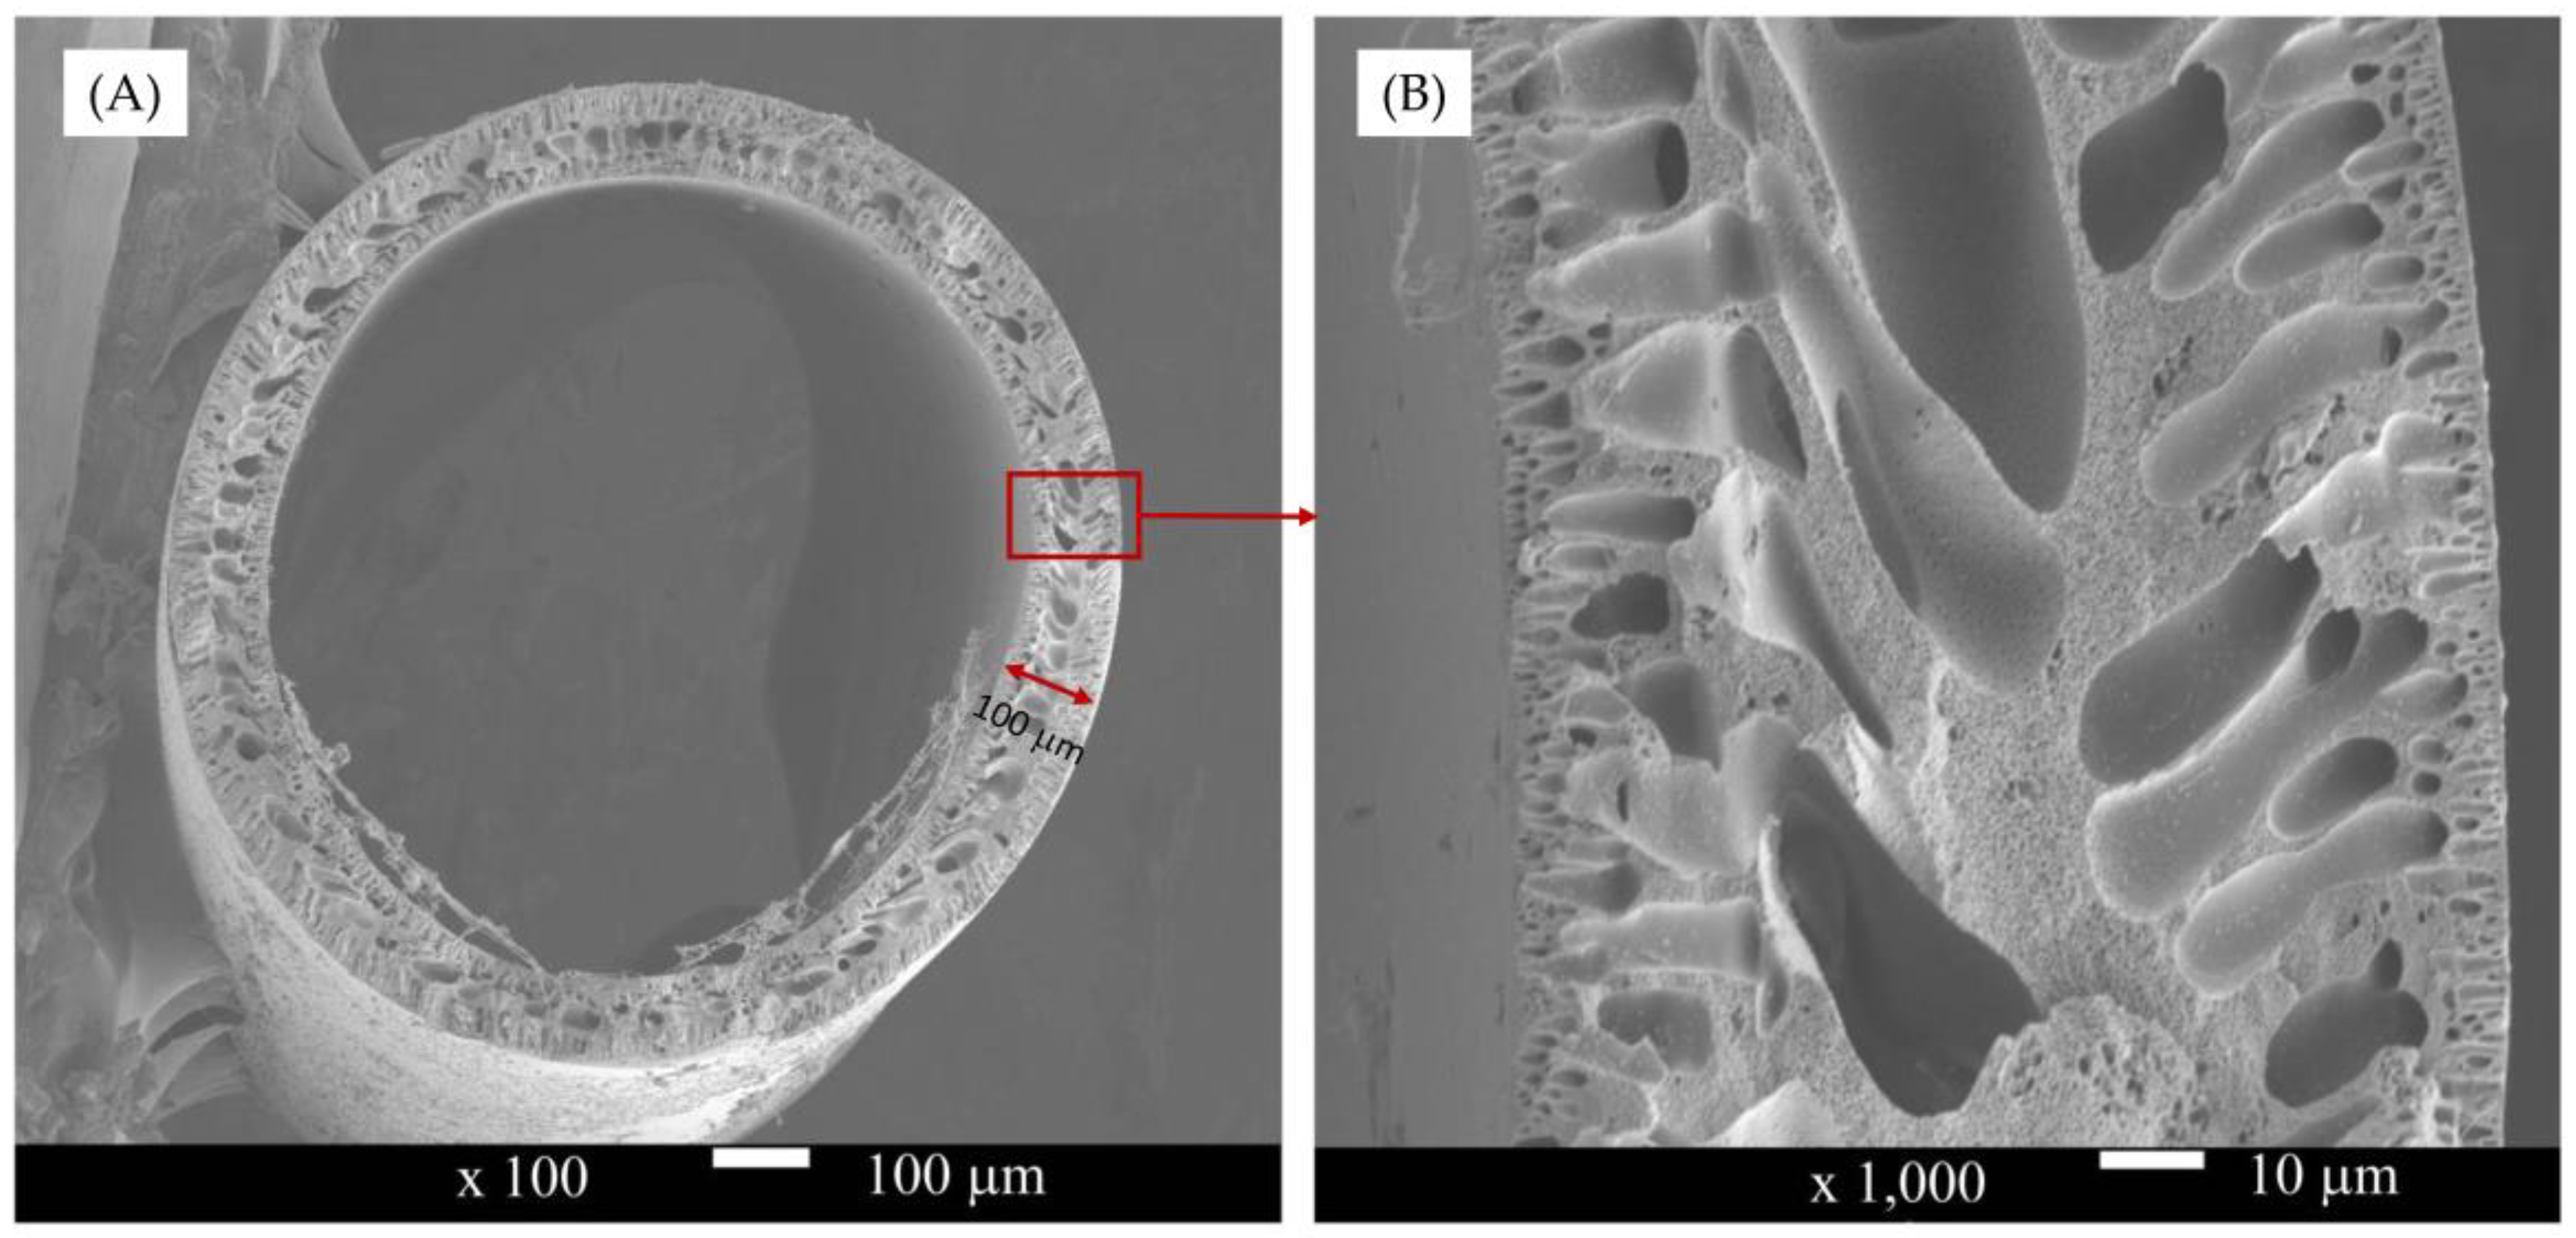
4.1. Membrane Characteristic

The results of the SEM characterization are shown in Figure 3. They show morphology of membrane comprising of skin layers inside and outside of the fiber. Macrovoid structures are seen underneath the skins and sponge-like structure in the middle of the membrane. Such structures are common for the membrane that was prepared by the dry-wet spinning method. The water contact angle of membrane surface is 62.8 ± 1.4°, showing a good hydrophilic trait.

4.2. Pure Water Filtration

Figure 4 shows decreasing water permeability profile for 1 h filtration plotted against the total permeate volume. Water permeability gradually decreases until reaching a constant value. The decrease in water permeability in this case is not caused by the membrane fouling, but as a result of pressure compaction, which alters the membrane structure until a certain shape and flux are constant.
Figure 4 also shows the predicted water permeability according the developed mass transfer model. The model is used to predict the tendency of water permeability in identifying weather the flux has reached a threshold value. The prediction can also be used to evaluate the membrane lifetime [20].
In this study, the profile of water permeability is predicted while using the mathematical models, as in Equations (29) and (30).
J t = J 0 exp ( t A + Bt ) ,   ( model   I )
J t = J 0 ( 1 + ( t τ ) ) 0.5 ,   ( model   II )
J t is water permeability at a certain time, J0 the water permeability at the beginning of filtration, t the filtration time, A and B constants, and τ constant time. The calculation results of models I and II are shown in Table 1. The values of R2 for model I is 0.95, and for model II is 0.61. This means that model I is more accurate than model II with a good correlation against the experiment result.

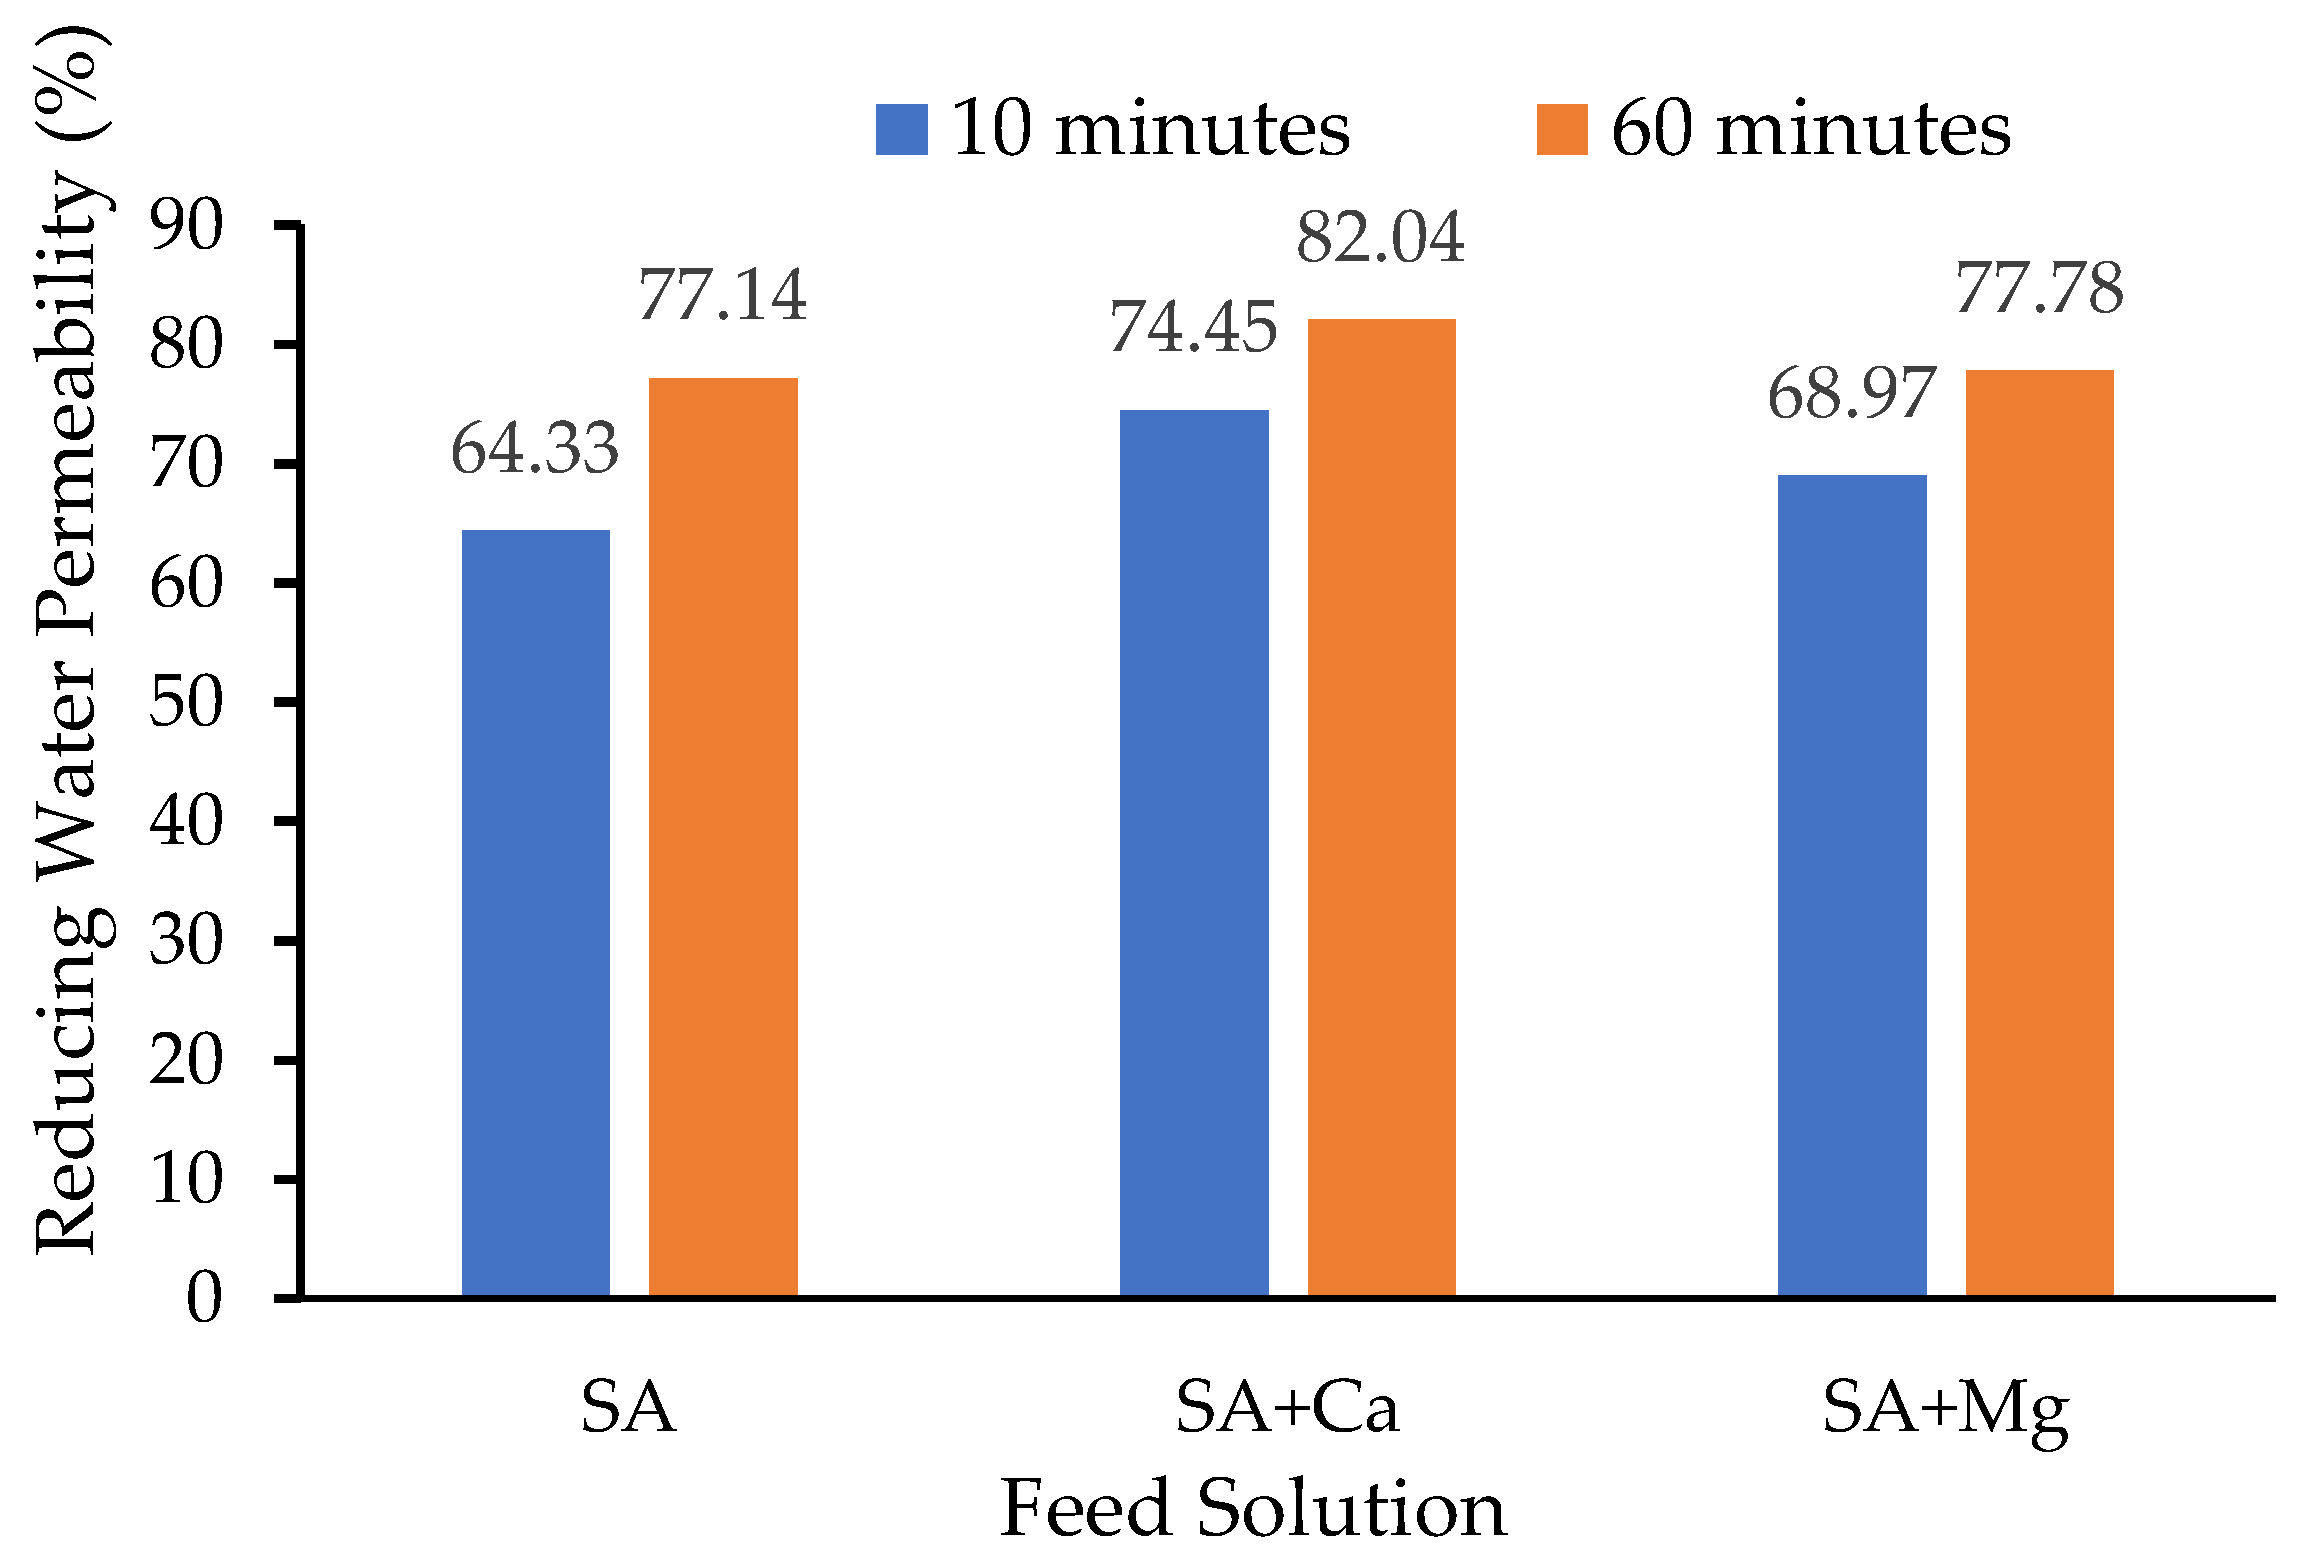
4.3. Filtration of Sodium Alginate Solution

The profile of water permeability for filtration of SA solution test is calculated while using Equation (3), and also predicted using Model I and Model II. Since the feed contains SA, it is assumed that the cake resistance causes the decrease in water permeability. Hence, we use a water permeability reduction model by the substitution of Equations (26) and (12) to form Equation (31) (Model III). Thus, the J p ( t ) value can be compared with the result of the experiment, Model I and Model II.
J p ( t ) = P μ ( R m + 1 k c r 0 ln r 2 + V 0 π l ln ( 1 ε ) ρ s C 0 exp ( V p V 0 t ) ( 1 ε ) ρ s C 0 r 0 )
The tendency of the relative permeability of the SA solution based on the experimental results, and prediction through Model I, II, and III are described in Figure 5A–C, respectively. The correlation of the experimental data and the calculation results with Model I, Model II, and Model III were concluded based on the R2 value (Table 2). From Table 2, it can be observed that the validation result of the Models I is quite good with the R2 values between 0.9994 and 0.9999, which means that Model I have a good fit with the experimental results.
Overall, the results described in Figure 5 indicate a drastic decrease in the relative permeability from the first data point. The reduction in the relative permeability gradually continues until the end of the filtration. The phenomenon of the permeability loss in the filtration of SA solution is quite different than the filtration process using deionized water. For the latter, the decrease in the permeability is below 50% of the initial value (Figure 4).
From experimental data and the models, it can be observed that the metal ions affect the filtration performances (Figure 5B,C). Metal ions interact with SA in the feed solution. When accumulate on the membrane surface, it leads to polarization concentration. The rates of permeability decline using the SA + Ca and SA + Mg are greater than of the SA solution. Moreover, when counting the ratio of water permeability reduction, it is clear that the decrease in the relative permeability of the membrane filtration while using SA + Ca solution is higher than the SA + Mg. As described in Figure 6, the change in relative permeability after 10 min with the SA + Ca is 74.75% higher than the rests. Extending filtration beyond one hour also shows the further reduction of relative permeability for the SA + Ca feed.
In summary, the presence of Ca2+ and Mg2+ ions in the feeds accelerates membrane fouling. They decrease SA charge, and influence the adhesion force between the SA particles and the membrane surface, which turns to accelerate the membrane fouling [30]. The other reason is due to the nature of the Ca ion, which has a special property to the carboxylic group to form an aggregate with a larger molecular size [31].

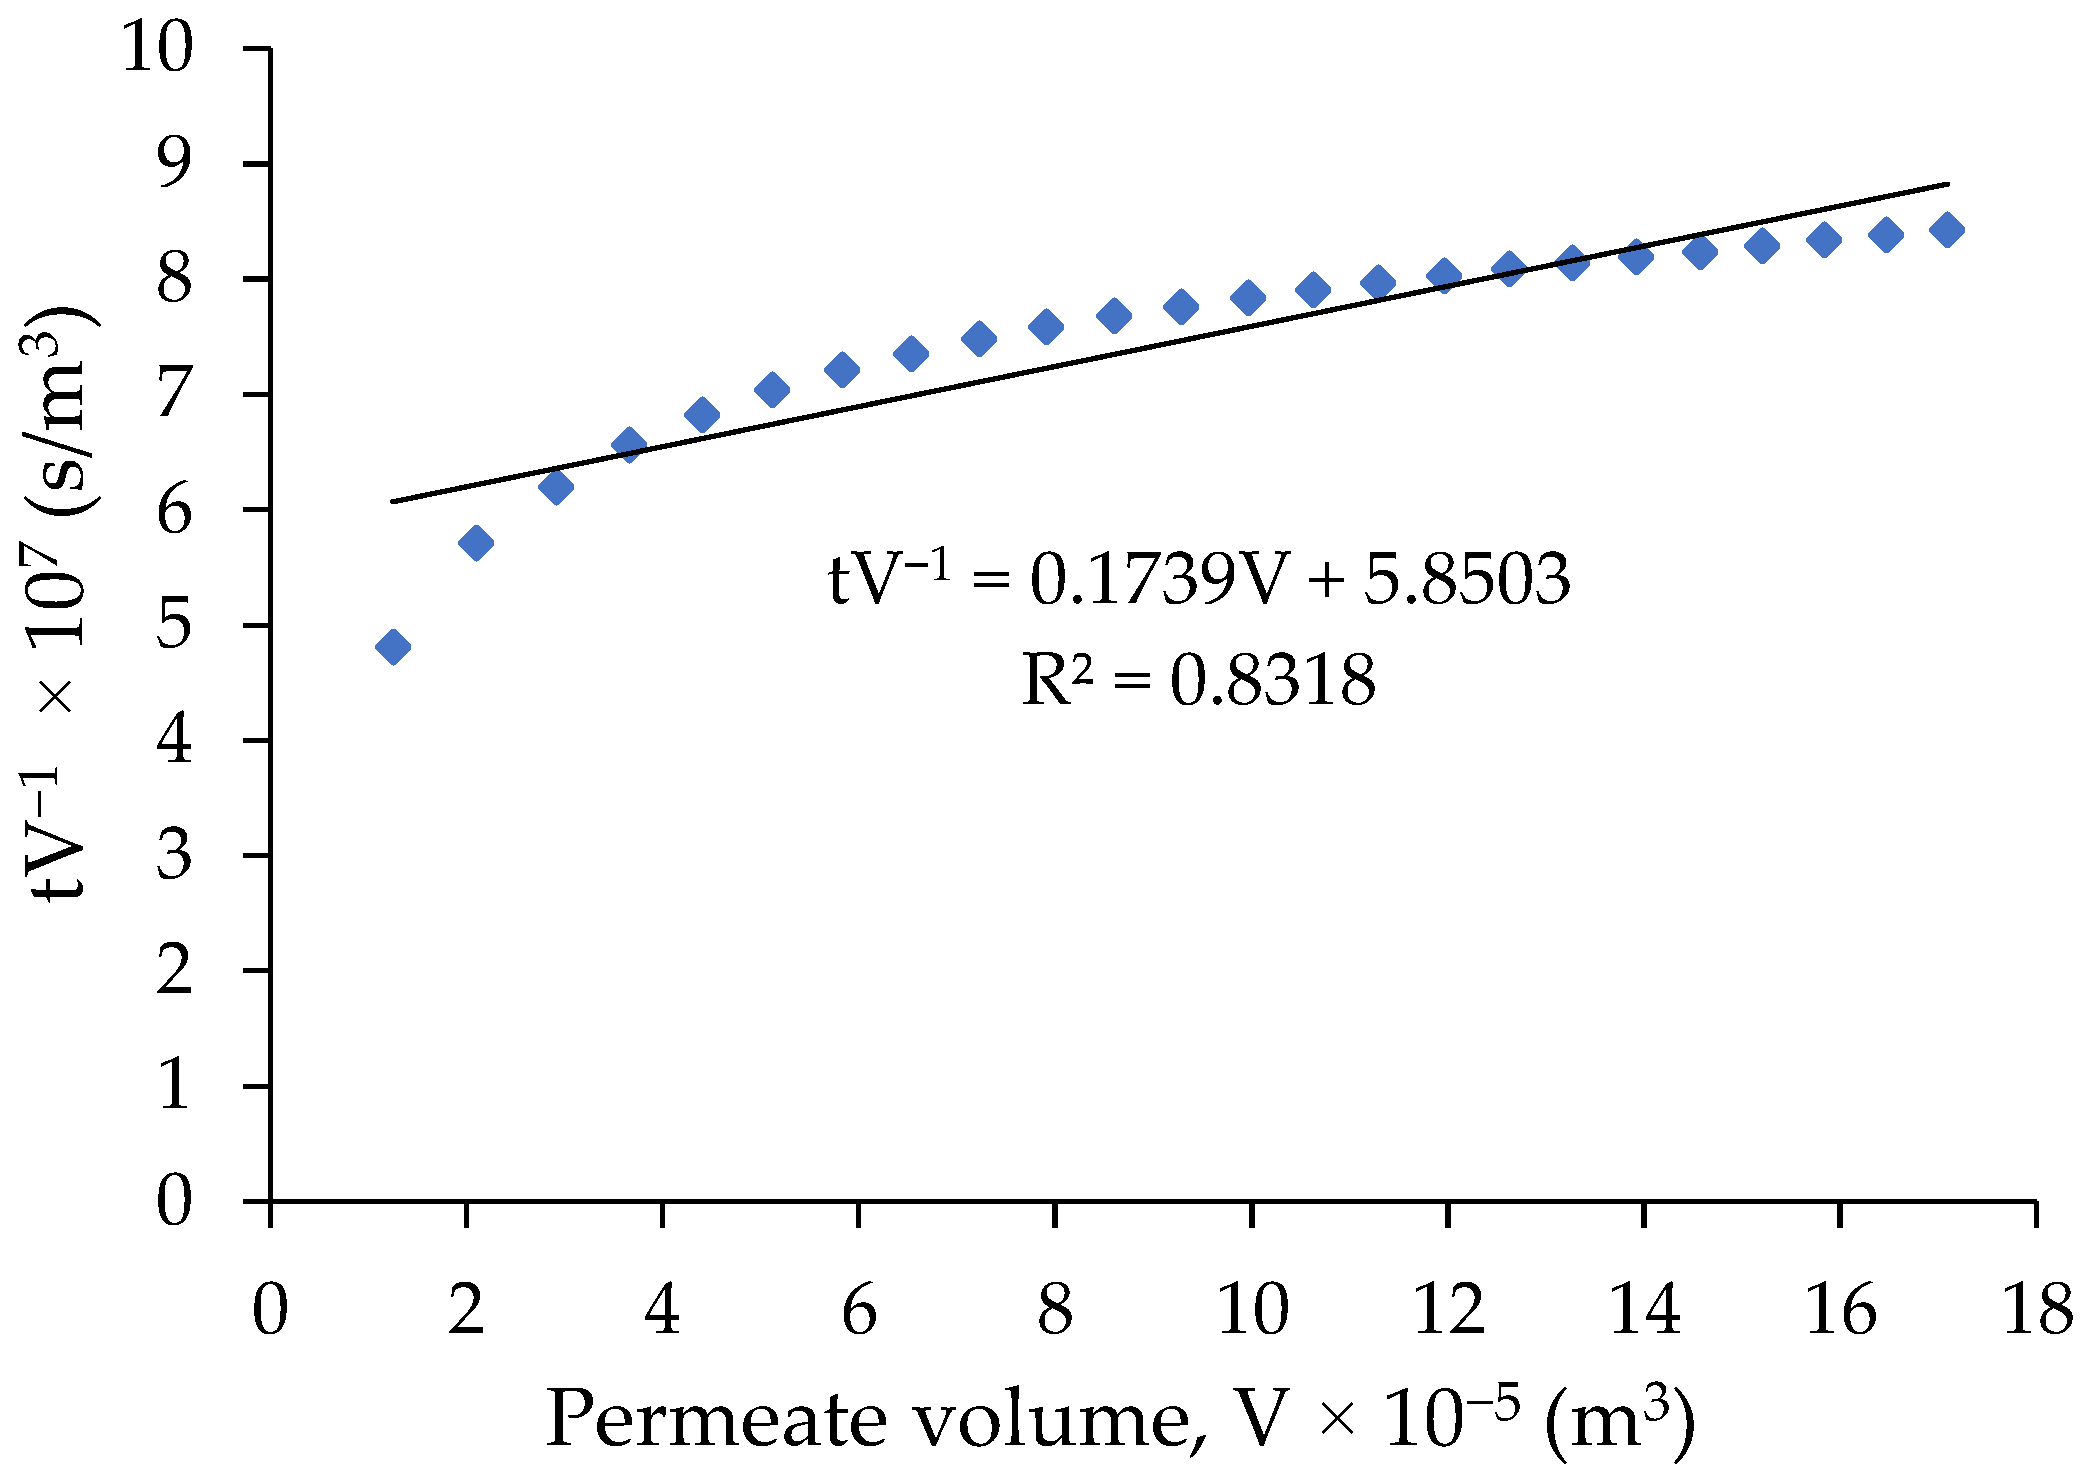
4.4. Membrane Resistance (Rm)

Membrane resistance (Rm) is the intrinsic properties of the membrane in hindering the permeating water [32]. Its value is determined by filtering pure water and by fitting to Equation (32):
dt dV = μ α c s A 2 ( Δ p ) V + μ A ( Δ p ) R m = K p V + B
Integration of Equation (32), results:
t V = K p V 2 + B
By plotting tV−1 (filtration time on the permeate volume) versus V (volume of permeate), as described in Figure 7, the value of Kp−2 (as slope) and B (as intercept to y-axis of linear equation) are obtained. This way, the Rm value is provided in Table 3. The Rm-value is then used to calculate the equation model for further determination of the permeation reduction and the resistance of the membrane due to formation of cake layer.

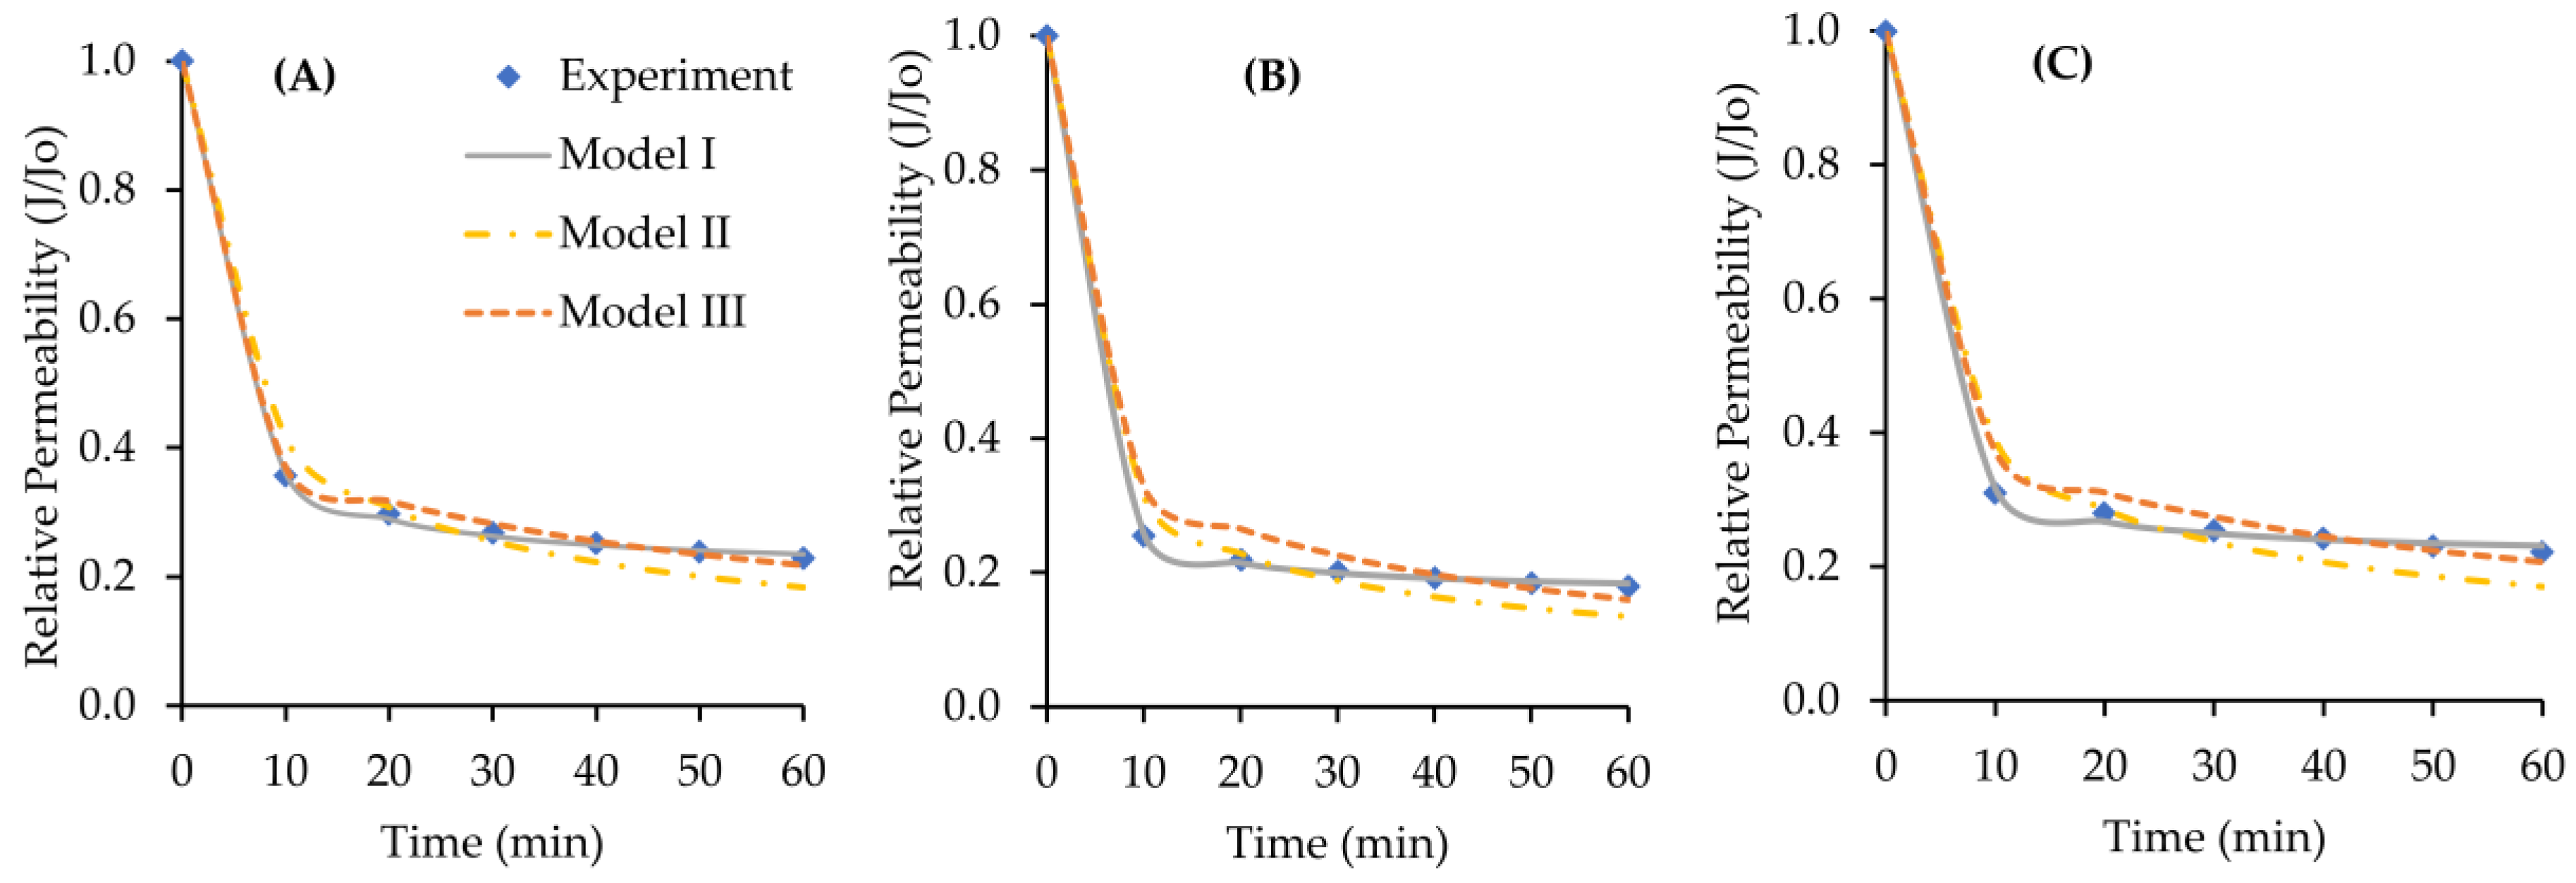
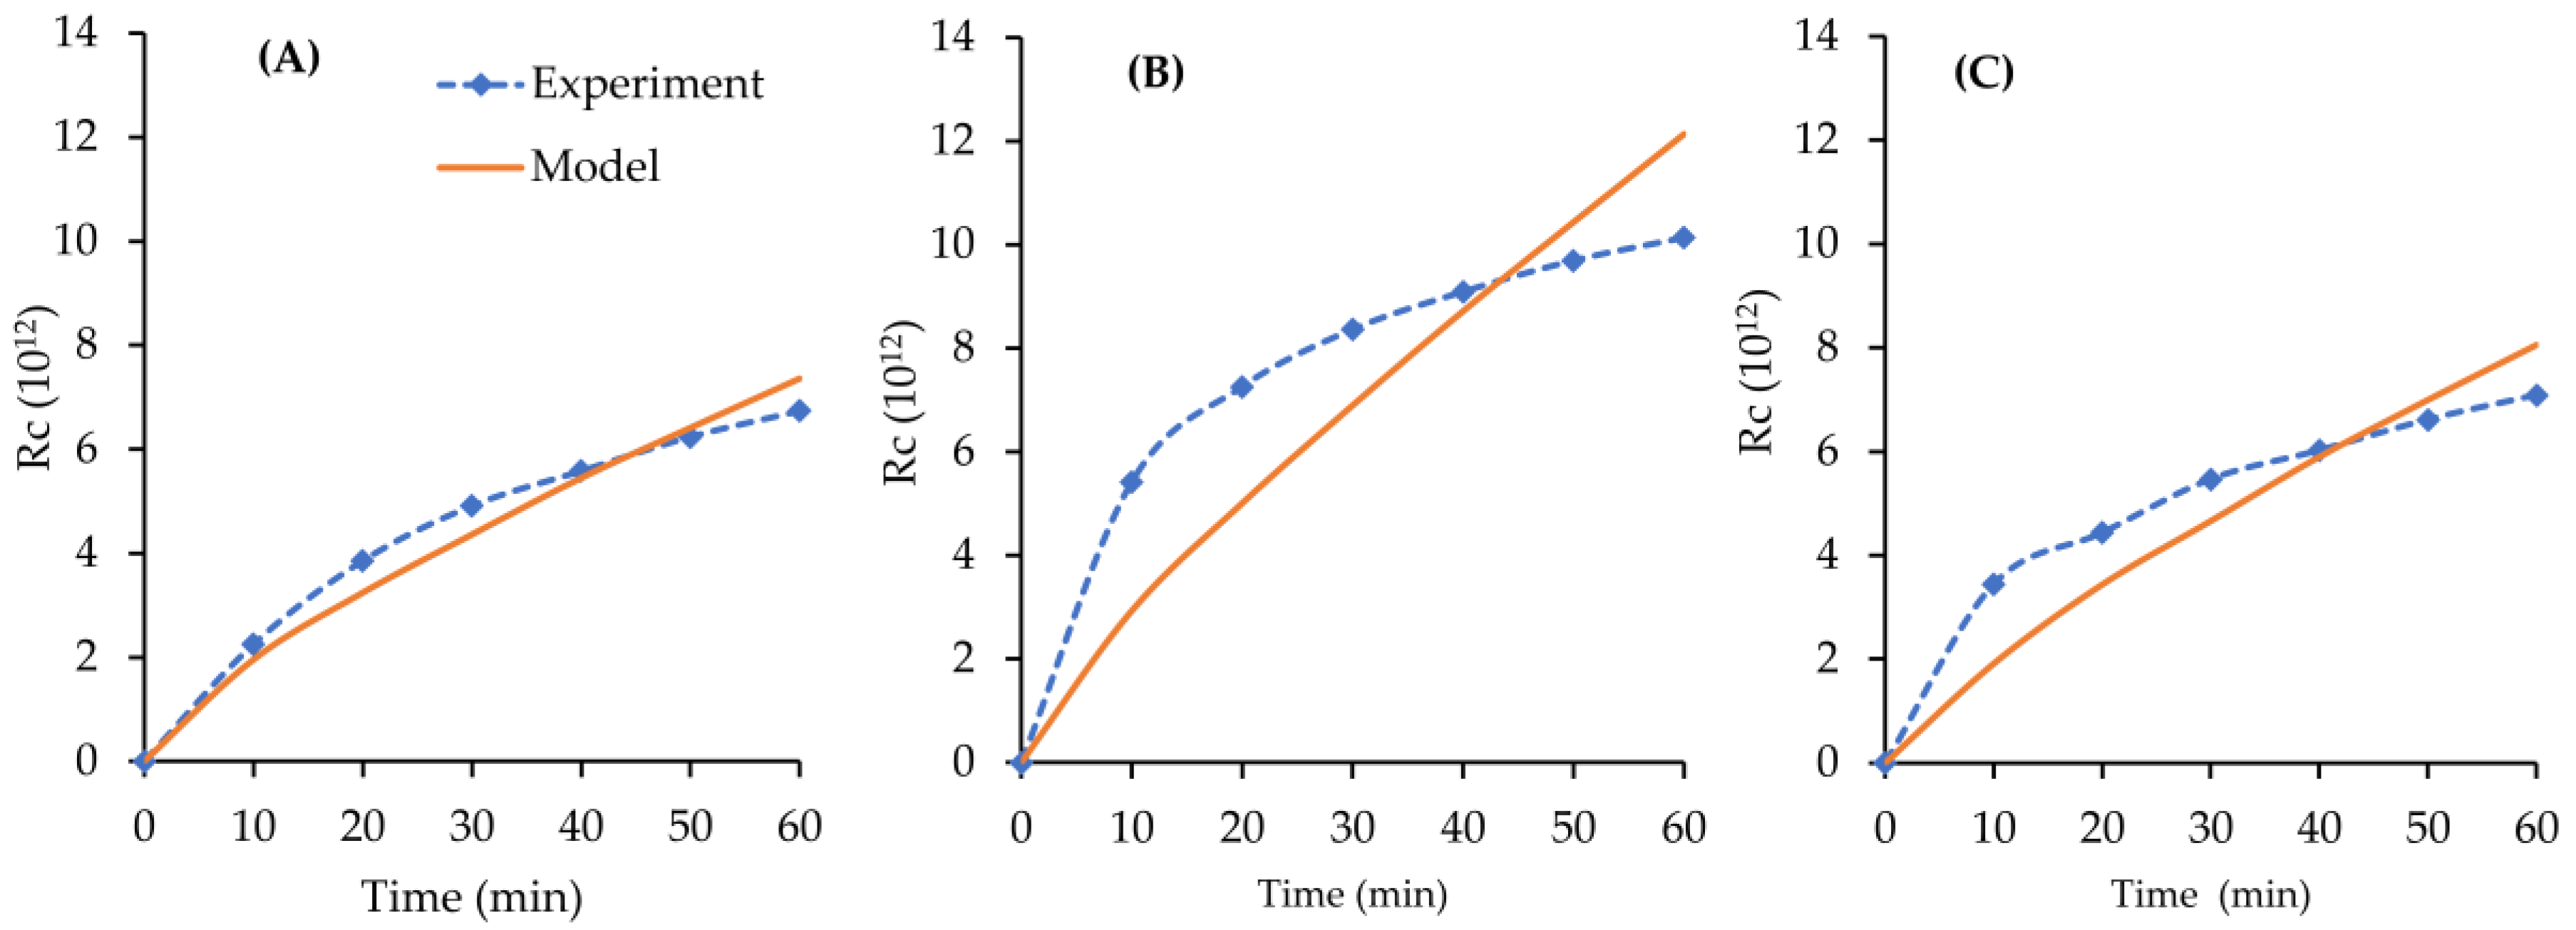
4.5. Cake Resistance Model

The cake resistance is additional persistence of the membrane in allowing mass transport due to the formation of the cake layer on its surface. This condition leads to the concentration of polarization, and consequently, causes a reduction in the permeability [33,34]. The Rc value depends on the type of particle contained in the feed solution. For the experimental data, the Rc might be determined while using Equation (34).
R c ( t ) = P μ   J p ( t ) R m
in which t, P, and Jp are the filtration time (hour), membrane pressure (atm), and permeation, respectively (l·m−2·h−1). Furthermore, µ and Rm are the solution viscosity (Pa.s) and membrane resistance (m−1), respectively. The Rc value is also predicted while using the developed model (Equation (19)), and the results were validated using Equation (28).
The permeability of cake (Kc), and cake porosity ( ε ) can be obtained from Equation (19) by considering the SSE on Rc of the experimental data. The cake resistances based on the filtration results of SA, SA + Ca, and SA + Mg are depicted in Figure 8A–C, respectively. It is shown that the resistance of the cake increases with respect of the filtration time. The maximum resistance was obtained for filtration system while using the SA + Mg feed (Figure 8B).
The increase in the Rc provides additional persistence of the filtration process besides the effect of Rm, which directly and significantly reduces the water permeation. The increasing cake resistance based on the mathematics model for the filtration system using SA, SA + Ca, and SA + Mg as the feeds is also shown in Figure 8. The best correlation between the experimental data and the results of the model development is in the filtration system while using the SA feed (Figure 8B), with the R2 of 0.8622 (Table 3).

4.6. Cake Layer Build-Up

Membrane fouling occurs via several mechanisms, e.g., the forming of a cake layer on the surface, concentration of polarization, and pore blocking (entrapment of foulant in membrane pores). In this study, we ascribe the fouling as build-up of cake layer on the outer surface of the hollow fiber membrane. The cake resistance was previously discussed and obtained while using Equation (34). Based on the Rc data, the increase in the cake radius can be determined using Equation (9). The radius of the cake layer is considered to be the thickness of the cake formed on the outer surface of the membrane. The build-ups of cake layer thickness on the membrane surface for the filtration of the three feeds are shown in Figure 9. The presence of Ca ions in the SA solution has the greatest effect on the formation of cake layer.
The increase in the cake layer thickness on the membrane surface in this work instantly affects the decrease in the water permeability. The greatest cake layer thickness has the lowest water permeability (Figure 6). This is because an increase in the thickness of the cake (δ) leads to an increase in the membrane resistance, thereby inhibiting the mass transport and thus decreasing the permeate volume. Regarding this permeation performance, some researcher has modified the membrane in order to minimize the formation of cake layer with various hydrophilic polymer [4,35].

5. Conclusions

The fouling mechanisms of PES-MPC membrane for filtration of SA, SA + Ca, and SA + Mg solutions were studied and modelled. The presence of CA and Mg ions significantly lowers hydraulic performance. The developed models fit well with experimental with the best model (Model I) shows R2 of 0.9998, 0.9999, and 0.9994 for SA, SA + Ca, and SA + Mg feeds, respectively. The effect of Ca was greater than the Mg ions in compacting the cake layer. When filtering the SA + Ca feed, the relative permeability decreased by up to 82% after 60 min filtration. As revealed by the developed model for filtration of this feed, the rate of cake resistance increment against time is directly proportional to the increase in the cake thickness reaching the highest δc of 7.59 × 10⁻⁷ m. Due to severe effect of Ca and Mg ions on membrane fouling, their presences in a feed solution must be strongly considered when designing membrane filtration system. An unconventional fouling control system maybe required to achieve good system performance.

Author Contributions

N.A. proposed the research topic and experimental concept, prepared and editing the manuscript. S.S. was responsible for laboratory experiment. F.R. and M.R.B. contributed in providing research materials and advising the research data.

Funding

The research is funded by the Competency-Based Research Grant, the Ministry of Research, Technology and Higher Education of Indonesia (Grant: 02/UN11.2/PP/SP3/2018).

Acknowledgments

We express our gratitude to the Ministry of Research, Technology and Higher Education of Indonesia and the institutions that gave technical support, such as Syiah Kuala University of Banda Aceh, Indonesia, and Kobe University, Japan.

Conflicts of Interest

The authors declare no conflict of interest.

References

  1. Arahman, N.; Mulyati, S.; Rahmah, M.; Takagi, R. The removal of fluoride from water based on applied current and membrane types in electrodialyis. J. Fluor. Chem. 2016, 191, 97–102. [Google Scholar] [CrossRef]
  2. Sheng, A.L.K.; Bilad, M.R.; Osman, N.B.; Arahman, N. Sequencing batch membrane photobioreactor for real secondary effluent polishing using native microalgae: Process performance and full-scale projection. J. Clean. Prod. 2017, 168, 708–715. [Google Scholar] [CrossRef]
  3. Arahman, N.; Mulyati, S.; Rahmah, M.; Takagi, R.; Matsuyama, H. Removal pro file of sulfate ion from mix ion solution with diff erent type and configuration of anion exchange membrane in elctrodialysis. J. Water Process Eng. 2017, 20, 173–179. [Google Scholar] [CrossRef]
  4. Plisko, T.V.; Liubimova, A.S.; Bildyukevich, A.V.; Penkova, A.V.; Dmitrenko, M.E.; Mikhailovskii, V.Y.; Melnikova, G.B.; Semenov, K.N.; Doroshkevich, N.V.; Kuzminova, A.I. Fabrication and characterization of polyamide-fullerenol thin film nanocomposite hollow fiber membranes with enhanced antifouling performance. J. Membr. Sci. 2018, 551, 20–36. [Google Scholar] [CrossRef]
  5. Shahkaramipour, N.; Tran, T.N.; Ramanan, S.; Lin, H. Membranes with surface-enhanced antifouling properties for water purification. Membranes 2017, 7, 13. [Google Scholar] [CrossRef] [PubMed]
  6. Razali, M.; Didaskalou, C.; Kim, J.F.; Babaei, M.; Drioli, E.; Lee, Y.M.; Szekely, G. Exploring and exploiting the effect of solvent treatment in membrane separations. ACS Appl. Mater. Interface 2017, 9, 11279–11289. [Google Scholar] [CrossRef] [PubMed]
  7. Didaskalou, C.; Buyuktiryaki, S.; Kecili, R.; Fonte, C.P.; Szekely, G. Valorisation of agricultural waste with adsorption/nanofiltration hybrid process: From materials to sustainable process design. Green Chem. 2017, 19, 3116–3125. [Google Scholar] [CrossRef]
  8. Li, G.; Law, W.C.; Chan, K.C. Floating, highly efficient, and scalable graphene membranes for seawater desalination using solar energy. Green Chem. 2018, 20, 3689–3695. [Google Scholar] [CrossRef]
  9. Didaskalou, C.; Kupai, J.; Cseri, L.; Barabas, J.; Vass, E.; Holtz, T.; Szekely, G. Membrane-grafted asymmetric organocatalyst for an integrated synthesis-separation platform. ACS Catal. 2018, 8, 7430–7438. [Google Scholar] [CrossRef]
  10. Kumar, A.; Thakur, A.; Panesar, P.S. Lactic acid extraction using environmentally benign green emulsion ionic liquid membrane. J. Clean. Prod. 2018, 181, 574–583. [Google Scholar] [CrossRef]
  11. Lee, M.J.; Hamid, M.R.A.; Lee, J.; Kim, J.S.; Lee, Y.M.; Jeong, H.K. Ultrathin zeolitic-imidazolate framework ZIF-8 membranes on polymeric hollow fibers for propylene/propane separation. J. Membr. Sci. 2018, 559, 28–34. [Google Scholar] [CrossRef]
  12. Huang, A.; Feng, B. Synthesis of novel graphene oxide-polyimide hollow fiber membranes for seawater desalination. J. Membr. Sci. 2018, 548, 59–65. [Google Scholar] [CrossRef]
  13. Rana, D.; Matsuura, T. Surface modifications for antifouling membranes. Chem. Rev. 2010, 110, 2448–2471. [Google Scholar] [CrossRef] [PubMed]
  14. Motsa, M.M.; Mamba, B.B.; D’Haese, A.; Hoek, E.M.V.; Verliefde, A.R.D. Organic fouling in forward osmosis membranes: The role of feed solution chemistry and membrane structural properties. J. Membr. Sci. 2014, 460, 99–109. [Google Scholar] [CrossRef]
  15. Charfi, A.; Yang, Y.; Harmand, J.; Ben Amar, N.; Heran, M.; Grasmick, A. Soluble microbial products and suspended solids influence in membrane fouling dynamics and interest of punctual relaxation and/or backwashing. J. Membr. Sci. 2015, 475, 156–166. [Google Scholar] [CrossRef] [Green Version]
  16. Vargas, A.; Moreno-Andrade, I.; Buitrón, G. Controlled backwashing in a membrane sequencing batch reactor used for toxic wastewater treatment. J. Membr. Sci. 2008, 320, 185–190. [Google Scholar] [CrossRef]
  17. Suwal, S.; Doyen, A.; Bazinet, L. Characterization of protein, peptide and amino acid fouling on ion-exchange and filtration membranes: Review of current and recently developed methods. J. Membr. Sci. 2015, 496, 267–283. [Google Scholar] [CrossRef]
  18. Teychene, B.; Collet, G.; Gallard, H. Modeling of combined particles and natural organic matter fouling of ultra filtration membrane. J. Membr. Sci. 2016, 505, 185–193. [Google Scholar] [CrossRef]
  19. Popović, S.; Dittrich, M.; Cakl, J. Modelling of fouling of outside-in hollow-fiber membranes by TiO2particles. Sep. Purif. Technol. 2015, 156, 28–35. [Google Scholar] [CrossRef]
  20. Mallubhotla, H.; Belfort, G. Semiempirical Modeling of cross-flow microfiltration with periodic reverse filtration. Ind. Eng. Chem. Res 1996, 5, 2920–2928. [Google Scholar] [CrossRef]
  21. Hashino, M.; Katagiri, T.; Kubota, N.; Ohmukai, Y.; Maruyama, T. Effect of membrane surface morphology on membrane fouling with sodium alginate. J. Membr. Sci. 2011, 366, 258–265. [Google Scholar] [CrossRef]
  22. Xu, W.T.; Zhao, Z.P.; Liu, M.; Chen, K.C. Morphological and hydrophobic modifications of PVDF flat membrane with silane coupling agent grafting via plasma flow for VMD of ethanol-water mixture. J. Membr. Sci. 2015, 491, 110–120. [Google Scholar] [CrossRef]
  23. Charfi, A.; Jang, H.; Kim, J. Membrane fouling by sodium alginate in high salinity conditions to simulate biofouling during seawater desalination. Bioresour. Technol. 2017, 240, 106–114. [Google Scholar] [CrossRef] [PubMed]
  24. Rathore, A.S.; Kumar, V.; Arora, A.; Lute, S.; Brorson, K.; Shukla, A. Mechanistic modeling of viral filtration. J. Membr. Sci. 2014, 458, 96–103. [Google Scholar] [CrossRef]
  25. Kin, J.; Dole, P. Filtration model for hollow fi ber membranes with compressible cake formation. Desalination 2009, 240, 2–6. [Google Scholar]
  26. Zhang, H.; Gao, J.; Jiang, T.; Gao, D.; Zhang, S.; Li, H.; Yang, F. Bioresource technology a novel approach to evaluate the permeability of cake layer during cross-flow filtration in the flocculants added membrane bioreactors. Bioresour. Technol. 2011, 102, 11121–11131. [Google Scholar] [CrossRef] [PubMed]
  27. Mulder, M. Basic Principles of Membrane Technology, 4th ed.; Kluwer Academic Publisher: Dordrecht, The Netherlands, 1991. [Google Scholar]
  28. Badrnezhad, R.; Mirza, B. Journal of industrial and engineering chemistry modeling and optimization of cross-flow ultrafiltration using hybrid neural network-genetic algorithm approach. J. Ind. Eng. Chem. 2014, 20, 528–543. [Google Scholar] [CrossRef]
  29. Netcher, A.C.; Duranceau, S.J. Modeling the improvement of ultra fi ltration membrane mass transfer when using biofiltration pretreatment in surface water applications. Water Res. 2016, 90, 258–264. [Google Scholar] [CrossRef] [PubMed]
  30. Chang, H.; Liang, H.; Qu, F.; Shao, S.; Yu, H.; Liu, B. Role of backwash water composition in alleviating ultra filtration membrane fouling by sodium alginate and the effectiveness of salt backwashing. J. Membr. Sci. 2016, 499, 429–441. [Google Scholar] [CrossRef]
  31. Hao, Y.; Moriya, A.; Maruyama, T.; Ohmukai, Y.; Matsuyama, H. Effect of metal ions on humic acid fouling of hollow fiber ultrafiltration membrane. J. Membr. Sci. 2011, 376, 247–253. [Google Scholar] [CrossRef]
  32. Sarkar, D.; Chakraborty, D.; Naskar, M.; Bhattacharjee, C. Characterization and modeling of radial flow membrane (RFM) module in ultra filtration. Desalination 2014, 354, 76–86. [Google Scholar] [CrossRef]
  33. Paipuri, M.; Kim, S.H.; Hassan, O.; Hilal, N.; Morgan, K. Numerical modelling of concentration polarisation and cake formation in membrane filtration processes. Desalination 2015, 365, 151–159. [Google Scholar] [CrossRef]
  34. Garcia-Ivars, J.; Iborra-Clar, M.-I.; Alcaina-Miranda, M.-I.; Van der Bruggen, B. Comparison between Hydrophilic and Hydrophobic metal nanoparticles on the phase separation phenomena during formation of asymmetric polyethersulphone membranes. J. Membr. Sci. 2015, 493, 709–722. [Google Scholar] [CrossRef]
  35. Arahman, N.; Mulyati, S.; Lubis, M.R.; Razi, F.; Takagi, R.; Matsuyama, H. Modification of polyethersulfone hollow fiber memrbanes with different polymeric additives. Membr. Water Treat. 2016, 4, 355–365. [Google Scholar] [CrossRef]
Figure 1. Illustration of the outside-inside flow in which cake layer is formed on the outer surface of the hollow fiber membrane. The rin is inner radius of hollow fiber membrane, rout outer radius, rcake radius of cake, l length of the fiber.
Water 10 01207 g001
Figure 2. Lab-scale of cross-flow filtration for single piece of hollow fiber membrane. The filtrations were run at pressure of 1 atm, and the permeate was collected as an overflow and weighted every 10 min. The set-up was used for filtration of different feeds: (1) 50 ppm sodium alginate (SA) solution, (2) 50 ppm SA + 0.125 mM of Ca ion, and (3) 50 ppm SA + 0.125 mM of Mg ion.
Water 10 01207 g002
Figure 3. Scanning Electron Microscopy (SEM) image of hollow fiber membrane of the whole cross-section (A), and enlarged cross-section (B).
Water 10 01207 g003
Figure 4. The profile of pure water flux: comparison between experimental data and models.
Water 10 01207 g004
Figure 5. The decrease in permeability for (A) the SA; (B) the SA + Ca; and, (C) the SA + Mg sample.
Water 10 01207 g005
Figure 6. Reducing water permeability when treating several types of feeds.
Water 10 01207 g006
Figure 7. Relation between t/V and V.
Water 10 01207 g007
Figure 8. The increase in the cake resistance for (A) the SA; (B) the SA + Ca; and, (C) the SA + Mg feeds.
Water 10 01207 g008
Figure 9. The improvement in the cake layer thickness versus the filtration time.
Water 10 01207 g009
Table 1. Result of data processing of pure water filtration with Model I and Model II.
Membrane TypeModel IModel II
ConstantStandard ErrorConstantStandard Error
ABSSER2ΤSSER2
CA4920.281.240.000380.954772.560.0008980.61
Table 2. Validation model and experimental results of relative permeability shown in Figure 5.
Sample SolutionRelative Permeability Model Validation (R2)
Model IModel IIModel III
SA0.99980.92610.9943
SA + Ca0.99990.94380.9837
SA + Mg0.99940.92000.9898
Table 3. Result of calculation from the values of membrane resistance (Rm), ε c permeability of cake (Kc), and R2 for every membrane and sample treatment.
Rm (m−1)Feed ε c Kc (m−2)Rc Validation (R2)
5.75 × 10¹²SA0.71231.66 × 10−200.8622
SA + Ca0.53724.94 × 10−210.6701
SA + Mg0.55009.42 × 10−210.7165

