1. Introduction
The urban population is expected to increase by 54 to 66% by 2050 [
1]. Population growth and higher per capita water usage presents a challenge to future water demand [
2]. Moreover, the number of mega-cities with more than 10 million inhabitants will grow to over 40 by 2030 [
3], which will create significant water demand in certain locations [
4]. The combination of growing urban development and climate change will have a significant impact on water security [
5]. Therefore, it is important to conduct systems modeling to examine whether water supply sources are adequate to meet future demand scenarios [
6].
Recently, a number of studies have demonstrated that water end-use analysis can be utilized to inform policy and practices for urban water systems [
7]. Specifically, water end-use studies can provide essential water consumption information regarding when, where, how, and why residential users consume water in the home [
8,
9]. However, the accurate disaggregation of large amounts of water flow data into different end-use categories is challenging. Therefore, this is the focal point of this water end-use study.
Over the last few years, numerous smart water metering programs have been applied to a number of cities worldwide to monitor residential water consumption [
10]. There are presently two main approaches being applied for undertaking the disaggregation of residential smart meter water data: (1) decision tree algorithm-applied by Trace Wizard
® [
11] and Identiflow
® [
12] and (2) machine learning algorithms-applied by HydroSense [
13], BuntBrainForEndUses
® [
14], REU2016 [
15], and
Autoflow [
5].
Autoflow employs a hybrid combination of pattern recognition algorithms (i.e., Hidden Markov Model and Dynamic Time Warping algorithm) and data mining techniques (i.e., event probability analysis) to learn distinct flow signature patterns for each water end-use category [
5,
7,
16,
17]. This approach overcomes the drawbacks of other existing models to address the water end-use classification problem. For Trace Wizard
®, this software is strongly dependent on the experience of the analyst and two weeks of flow data requires two hours of work by the analyst [
7]. In addition, the accuracy of Trace Wizard
® is reduced when more than two events occur concurrently [
18]. Identflow
® has a higher reported accuracy than Trace Wizard
® [
7], but its accuracy heavily depends on the physical features for each fixture/appliance that was input into the software [
10]. The drawback of HydroSense is that it needs a large number of obtrusive pressure sensors (i.e., 33 sensors in a single household) connected to each water device [
13] to be effective.
The first version of
Autoflow v1.1 provided recognition accuracy greater than 90% for a set of mechanised appliances (e.g., clothes washer, dishwasher, toilet, etc.) while behaviorally influenced water end-use categories (e.g., shower, bathtub, and irrigation) was below 70%. It achieved an average overall pattern recognition accuracy across all categories of 85% [
17].
Autoflow v2.1 achieved an overall water end use pattern recognition accuracy of 90% and better handled combined event disaggregation [
5]. While
Autoflow v2.1 accuracy is getting close to the targeted 95% recognition accuracy required for a commercial application, there are some deficiencies with this version related to the initial clustering of discrete events into the most likely water end-use category before more detailed pattern recognition algorithms are applied.
To address this deficiency in
Autoflow v2.1, the present study developed a hybrid model combining Self-Organizing Maps (SOM) and K-means clustering techniques in order to improve the existing data clustering process. SOM has been applied in water resources problems [
19], water quality analysis [
20], and pattern analysis [
21]. Moreover, SOM and K-means are combined and applied in market segmentation [
22] and water distribution systems [
23]. In this paper, water end-use pattern recognition accuracy improvements related to the addition of the newly developed SOM+K-means computational procedure has been evaluated (i.e.,
Autoflow v3.1 compared to
Autoflow v2.1). The overall clustering process was divided into two main stages: (1) weight matrix estimation using SOM based on the water end-use events features and (2) clustering all of the unclassified water end-use events according to the weight matrix.
The following sections of the paper outline the study background, the enhanced classification model, the model validation and discussion, and finally a description on how this research is an integral part of the urban water industry. The Background (
Section 2) briefly introduced the importance of conducting water end-use studies, the difference between the conventional water metering process and advanced process, the existing models for autonomous water end-use classification, an overview of the existing versions of
Autoflow, and persuasion for the latest version of
Autoflow.
Section 3 provides a detailed application of SOM and K-means, which has been applied as a pre-grouping process in the proposed version
Autoflow v3.1 to improve the recognition accuracy of single water end-use event analysis. Afterward, two independent verification processes, limitations, and future research directions are provided in the model validation section (
Section 4). Lastly,
Section 5 summarizes the
Autoflow software and outlines the importance of its widespread implementation for the urban water industry.
2. Background
2.1. Conventional Water Metering Process
Water end-use studies have been increasingly used by water businesses globally in the past decade to understand water demand characteristics and trends for their customers. Moreover, water end use data underpins future demand forecasts for a city and the design of effective demand management strategies. Reliable accounting and management of water demand is now expected from customers in the current digital and sustainability conscious era. Smart metering and other sensor technologies now provides the opportunity to collect big data on water usage within each segment of an intelligent water network. However, useful analysis of this big data especially what is required to disaggregate residential water consumption into discrete water end use categories previously required extensive human resources. This resource intensive water end use data analysis process needed to be automated to make it feasible for viable widespread implementation. The authors addressed this problem by designing an autonomous water end use analysis software tool (Autoflow) that will enable future smart meters to be equipped with this firmware or cloud linked software that will provide water end use information to each and every residential customer as well as urban water processionals. Such near real-time water end use information will significantly enhance the management of future urban water resources.
Water consumption data is recorded manually on a monthly or even half-yearly basis. Current water billing systems typically use only two to four data points to describe a whole year’s worth of water consumption data of a household. Kilolitre is often the current resolution of a report, which are counted by conventional water meters that do not have the ability to record when (i.e., the time of day) and where (e.g., tap, toilet) the consumption takes place [
24]. The current water metering system has many limitations since it does not provide real-time or continuous water flow data and does not provide flow data of a sufficient resolution to allow for water end-use event disaggregation. Continuous water flow data (i.e., minute to hourly) is essential for real-time network modeling and optimized water infrastructure modeling and engineering [
25,
26,
27]. Water end use data is useful for water demand management [
28], enhanced water infrastructure planning [
25], managing water peak demand [
29], and understanding water-energy linkages [
30,
31].
2.2. Existing Autonomous Water End Use Classification Models
With the advent of smart meters providing greater volumes of high-resolution water flow data, researchers have begun to develop advanced models to autonomously or semi-autonomously classify collected real-time and continuous water consumption data into different water end-use categories. There are two main categories of models including descriptive models and predictive models [
10]. Descriptive models analyze the observed water consumption behaviors of users and these models can focus on consumption patterns, according to the resolution of water flow data (e.g., [
25,
26,
32,
33]). Predictive models focus on solving the problem of water demand (e.g., [
5,
28,
34,
35]). Nguyen [
16] provides a comprehensive critique of the strengths and weaknesses of each of the existing models. This critique suggested that the utilization of smart water meters at the property boundary, which is supported by firmware that could autonomously disaggregate water flow data into discrete water end use categories by applying machine learning techniques, was the most feasible approach to realize a vision of end-use data being delivered to customers and utilities.
2.3. Water End-Use Classification Process Using Autoflow
Many applications have been developed to automate this costly process including HydroSense, Identiflow, and Trace Wizard, but these existing software have many limitations preventing their widespread implementation. Autoflow was developed to address the deficiencies evident in these applications. Autoflow software is now being utilized by five water utilities in Australia. Autoflow enabled the accurate and reliable use event disaggregation of water consumption data, which is useful for understanding when, where, and how various categories of residential consumers use water in their homes. The primary functions of the software include, but are not limited to, collecting and transferring water consumption data through a smart water metering system and analyzing the data and producing a wide range of water end use reports, which can be accessed by relevant stakeholders (i.e., consumers, water utilities, etc.). Anonymous summary reports can also be compiled for government departments to assist them in formulating a range of policies (e.g., incentives, outdoor water restrictions, behavioral marketing, etc.).
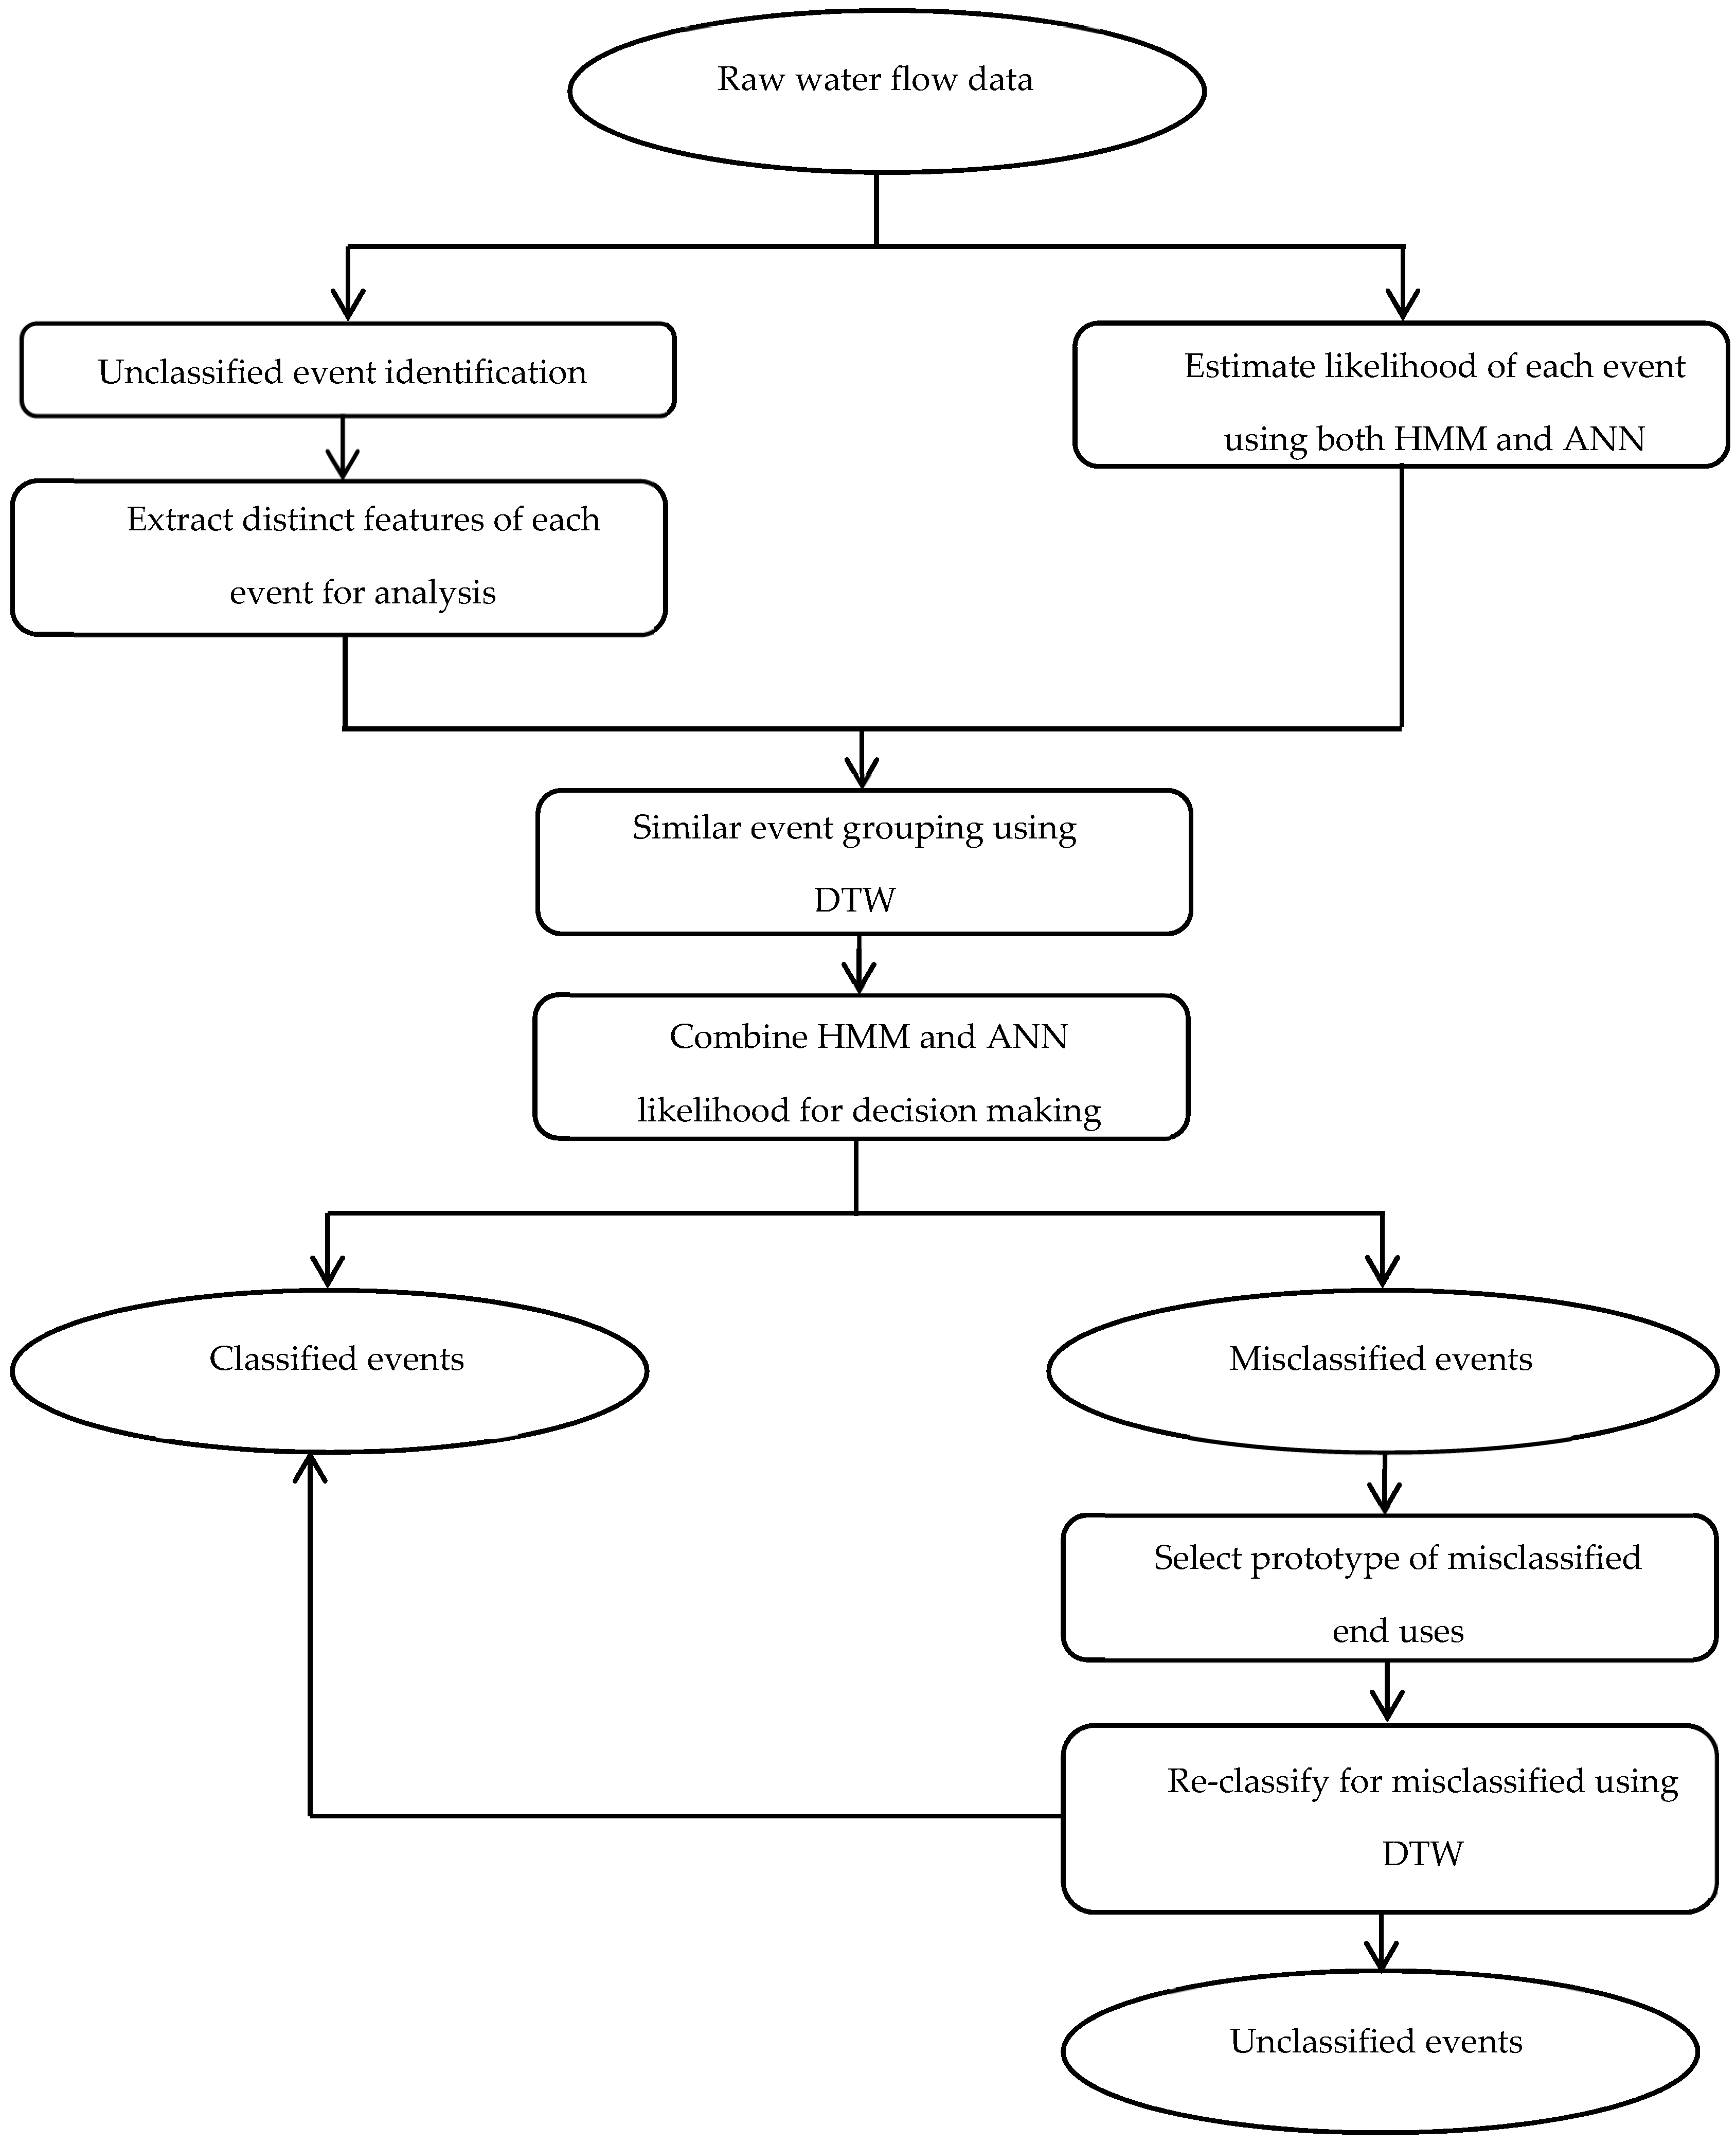
The
Autoflow offers a robust pattern recognition procedure through the hybrid combination of existing popular techniques.
Autoflow v1.1 software combined Hidden Markov Model (HMM), Artificial Neural Networks (ANN), and the Dynamic Time Warping (DTW) algorithm (
Figure 1). The first version was suitable for mechanical water end-use category analysis such as clothes washers, dishwashers, and toilets [
7,
16].
Autoflow v2.1 included an additional search process using the Dynamic Time Warping algorithm. This enhanced version marginally increased the classification accuracy of mechanized end use categories [
5].
The goals of the design of the
Autoflow processing algorithms is to provide both accuracy and efficiency. The first version of
Autoflow (i.e.,
v1.1) achieved an average overall pattern recognition accuracy across all categories of 85%. The overall accuracy of
Autoflow v2.1 was more than 90% and had a 4.9% and 8.0% improvement for single event and combined event categorization, respectively. In terms of efficiency, the
Autoflow v2.1 can recognize patterns in almost 100 events in one second, which is considerably faster than an expert using Trace Wizard.
Autoflow v2.1 also provided an illustrative user interface offering a user-defined water consumption web page to view daily, weekly, and monthly consumption tables as well as charts on consumers’ water demand across major end-use categories (e.g., clothes washer, shower, irrigation, etc.). The system also provides customer alerts regarding whether they have leaks rather than waiting for the present slow feedback process from the traditional metering process [
5,
7,
16].
Given that mechanized end use categories such as clothes washer, dishwasher, and toilet usually consist of similar and repeated patterns, one of the initial Autoflow analysis modules completed a grouping process where similar patterns were initially classified as belonging together before subsequent detailed pattern recognition procedures were completed. Autoflow v1.1 and v2.1 adopted DTW as the main technique to achieve this task. However, recent investigations indicated that DTW had some limitations since it grouped similar patterns based on a pre-determined distance threshold between the unclassified events and the reference event. Two events would be considered similar if their distances to a third event (i.e., reference event) were close. However, this distance value is merely a dimensionless number that represents the shape difference between two given patterns and, in some cases, two completely different events could have the same distance as the reference event. As a result, DTW could assign those two events into the same initial category even though their water end use patterns are completely different. While this incorrect classification was often discovered in subsequent analysis, it increased the data processing effort and resulted in higher rates of erroneous classification.
2.4. Overview of Applied Techniques
Apart from DTW, many other popular clustering techniques have been established and widely applied including SOM [
36], K-means clustering [
37], and Artificial Neural Network (ANN) [
38] to address various complex pattern matching problems such as hand writing, speech recognition, fingerprint recognition, surface water level, and seabed liquefaction predictions [
39,
40]. By investigating many of the above mentioned models, it was determined that the SOM and K-means clustering were highly suitable approaches for clustering similar water end use events together as required in this study.
The SOM is a type of ANN with an unsupervised learning process [
36]. This approach attempts to replicate the function of the brain when it receives visual and memory stimulation and is useful for efficiently identifying common patterns and clustering them together.
The SOM network consists of an input layer and an output layer (Kohonen layer). The output layer is designed as a two-dimensional arrangement of neurons that have an ability to project a high dimensional input to a low-dimensional grid by maintaining the topological order. In this layer, each neuron represents a cluster. In addition, the input layer of nodes is connected to the output nodes and own a weight vector respectively. Euclidean distance and cosine distance are two major criteria between the weight vector of output nodes and input nodes.
The SOM algorithm has the advantage of producing intuitive results [
41], but it has two limitations related to its static architecture and capabilities to characterize hierarchical relations within the data [
42]. The K-means algorithm is a well-established statistical technique for unsupervised iterative data cluster analysis. SOM and K-means clustering were the utilized techniques for enhancing
Autoflow v2.1, which is described in the next section.
3. Enhanced Water End-Use Classification Model
Autoflow v2.1 adopted the DTW technique for grouping similar end-use events. However, DTW was heavily dependent on a threshold value, which defined the similarity between two samples. For Autoflow v3.1, DTW was replaced by the hybrid SOM+K-means clustering analysis module in order to improve residential water endues pattern recognition accuracy. The following sections describe how these techniques were applied to this pattern recognition problem.
3.1. SOM for Water End-Use Pattern Recognition
The formulated six-step procedure detailed below applied the SOM technique for the initial clustering of residential water end use events into different water end-use categories.
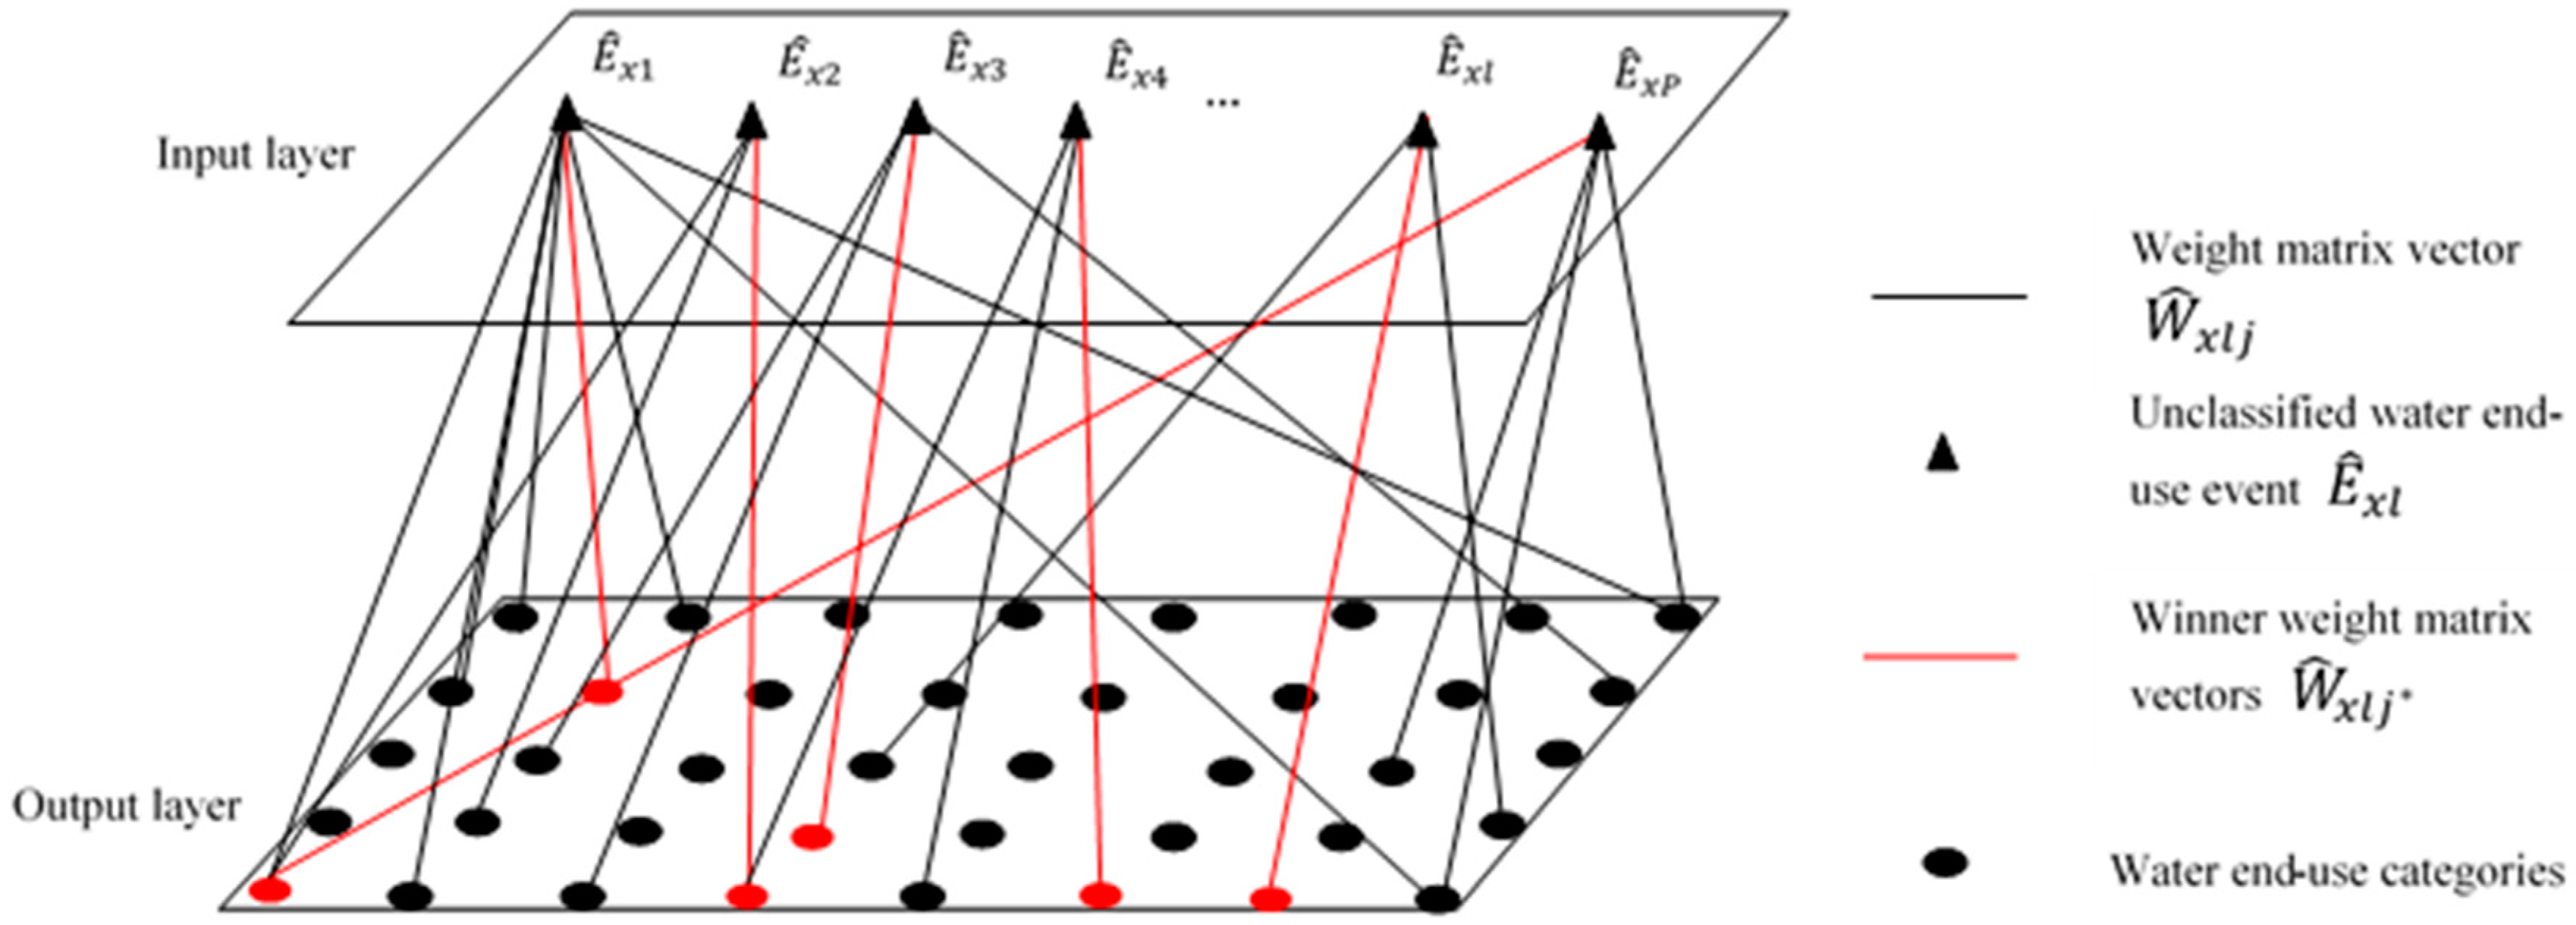
Step 1-Input Layer Settings
As shown in
Figure 2, the input layer are given vector
of the water end-use events, which are then normalized as
, where
P is the number of unclassified events. In the present study, each water event has three features including volume, duration, and maximum flowrate. Therefore, an additional subscript
is used to present the features and input events are presented by
.
Step 2-Output Layer Settings
A 2D network of
rows and
columns of water end-use categories is set up in the output layer, which is shown in
Figure 2. The total number of categories
is written as Equation (1).
Step 3-Assign Matrix Vectors
Assign a random initial value to the weight matrix vector. Since the network is fully connected, each input node is connected to each category. Therefore, the weight matrix vector between the input event and categories is
, which can be normalized as Equation (2).
In the output layer, the weight matrix vector is .
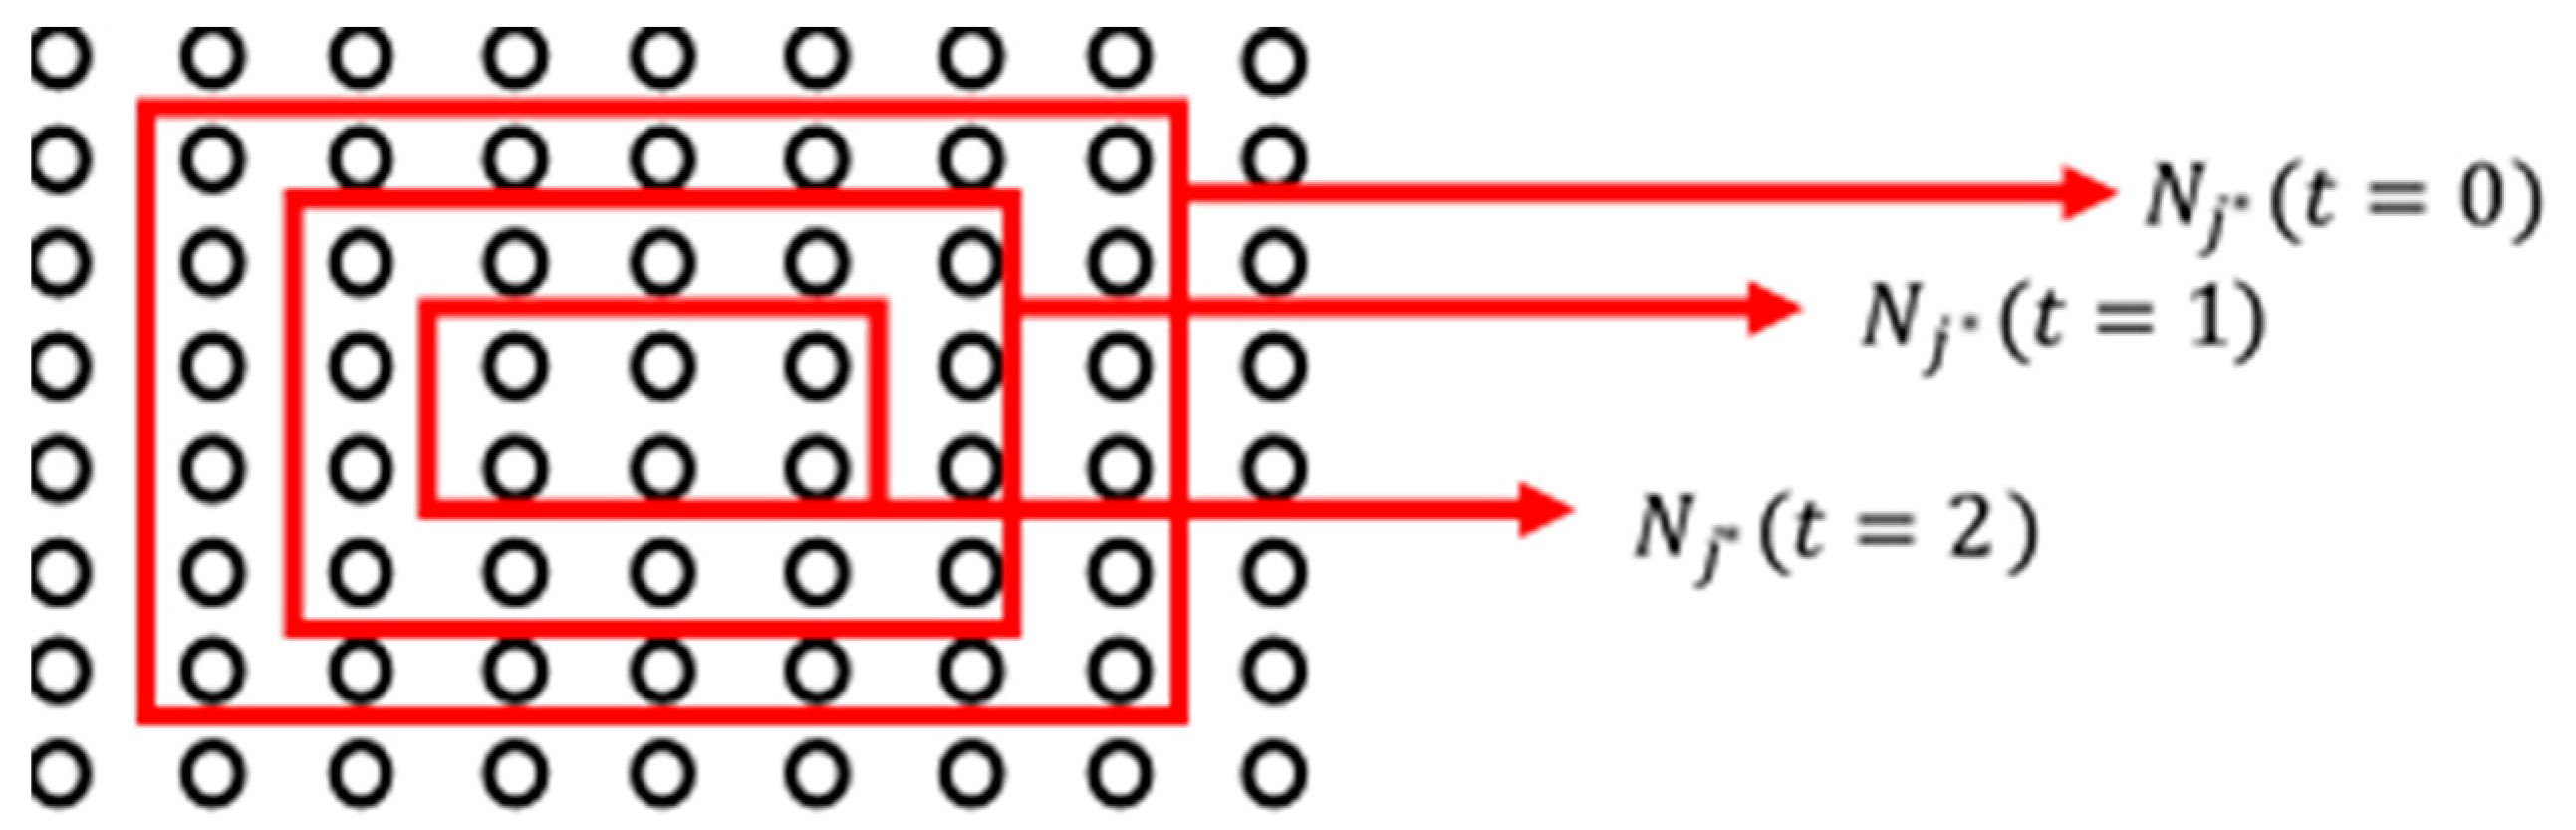
Step 4-Determine Winner Category and Define the Winner Neighbourhood Area
In this step, the distance between input vectors and all categories in the output layer is calculated. The iterative method is used to determine the winner category
according to the minimum distance from the input nodes to the output nodes. The weight matrix vector of the winner category is
, which can be normalized as Equation (3).
Then, the initial neighbor area of the winner category is defined as
and it is a larger zone, which decreases over the iteration steps. This is shown in
Figure 3. The maximum iteration is
.
In addition, the neighbor area will update per Equation (4).
Step 5-Adjust Winner Weight Matrix Vectors and Update Neighboring Area
According to the SOM network, the winner category has an activation value of ONE while other neurons have activations of ZERO, which is seen in Equation (5).
However, only the winner neuron can adjust the weight matrix vector. The adjustment function is given by Equation (6).
where 0
and it is a function, which decreases with the number of iterations to ensure the convergence of the algorithm. In this present paper, the learning rate is given by Equation (7).
Step 6-End Judgement
When the learning rate or , the training process is finished. When the stopping condition is not satisfied, the algorithm will go back to Step 2 of the procedure until the maximum iteration number is reached.
3.2. K-Means for End-Use Study
The specific process of the K-means algorithm is shown below.
Step 1-Initial Centroids Selection
Randomly select
samples as the initial cluster centroid
from all winner weight matrix vectors
. In this paper, the winner weight matrix vectors are the input data in the K-means algorithm in order to cluster the matrix first and get the final weight matrix as the initial centroids in the next grouping process. For input data with three features, each centroid can be represented as Equation (8).
Step 2-Assign Matrix Vectors
In this step, each vector will be grouped according to the similarity (distance)
to the centroids. The distance to each centroid is calculated for each input vector and can be calculated by using Equation (9). Afterward, the object is assigned to the closest (minimum distance) centroid, which can be normalized as Equation (10).
where
is an element of the weight matrix vector.
Step 3-Update the Centroid
When all matrix vectors have been grouped, the centroids position is updated. The new position of it is based on the new means of each cluster. The position of group
is written as Equation (11).
where
is the number of elements belonging to group
.
Step 4-Iteration
Repeat Step 2 and Step 3 of this procedure until the centroid of the clusters no longer changes so far. At the end of the process, the distance between the clusters is maximal and the distance between the centroids and their data is minimal. After this step, the clustering result is a new set of matrix vectors .
Step 5-2nd K-Means Clustering for Unclassified Events
Input the previous result as the initial centroids. Then input the all unclassified events and group those using specific K-means. The process is the same as in Step 2. Then, the unclassified will be grouped into groups.
3.3. Hybrid SOM-K-Means Model for Residential Water End-Use Pattern Recognition
Application of the algorithms for the data clustering process described above was crucial before the operation of the previously developed pattern matching algorithms and associated analysis processes. The structure of the SOM network is robust but simple and can handle outliers. In the situation where the mesh of neurons is larger, the number of clusters is larger. Reducing the number of clusters in the SOM algorithm can reduce the final number of water end-use groups. However, the quality or the accuracy of clustering will be decreased. In addition, the clustering result of the K-means algorithm is greatly affected by the selection of the initial cluster centroid. If the initial centers are not properly selected, the result may fall into a local optimal solution rather than a global optimal result. For these reasons, this section presents the model operationalization process for this specific problem including how these two techniques were combined and how they can improve the clustering process in Autoflow v3.1.
The existing water end-use model predominately applied only computing techniques [
43]. The entire procedure for the hybrid technique includes two stages. First, each water event is presented by extracted features and grouped through SOM (reaching a certain number of cycles). In addition, a set of weight vectors are calculated. Second, these vectors that serve as the initial cluster centroids were applied in K-means clustering.
Figure 1 presents the algorithms implemented in the previous version of
Autoflow v2.1. In this version, the initial pre-grouping process was undertaken by the Dynamic Time Warping algorithm before the decision-making stage. Moreover, this pre-grouping process is a major component of the whole pattern recognition analysis process and the accuracy of this stage can affect the final water category recognition accuracy directly. Hence, it is necessary to seek a method with high accuracy and efficiency in the pre-grouping process to improve the overall accuracy of
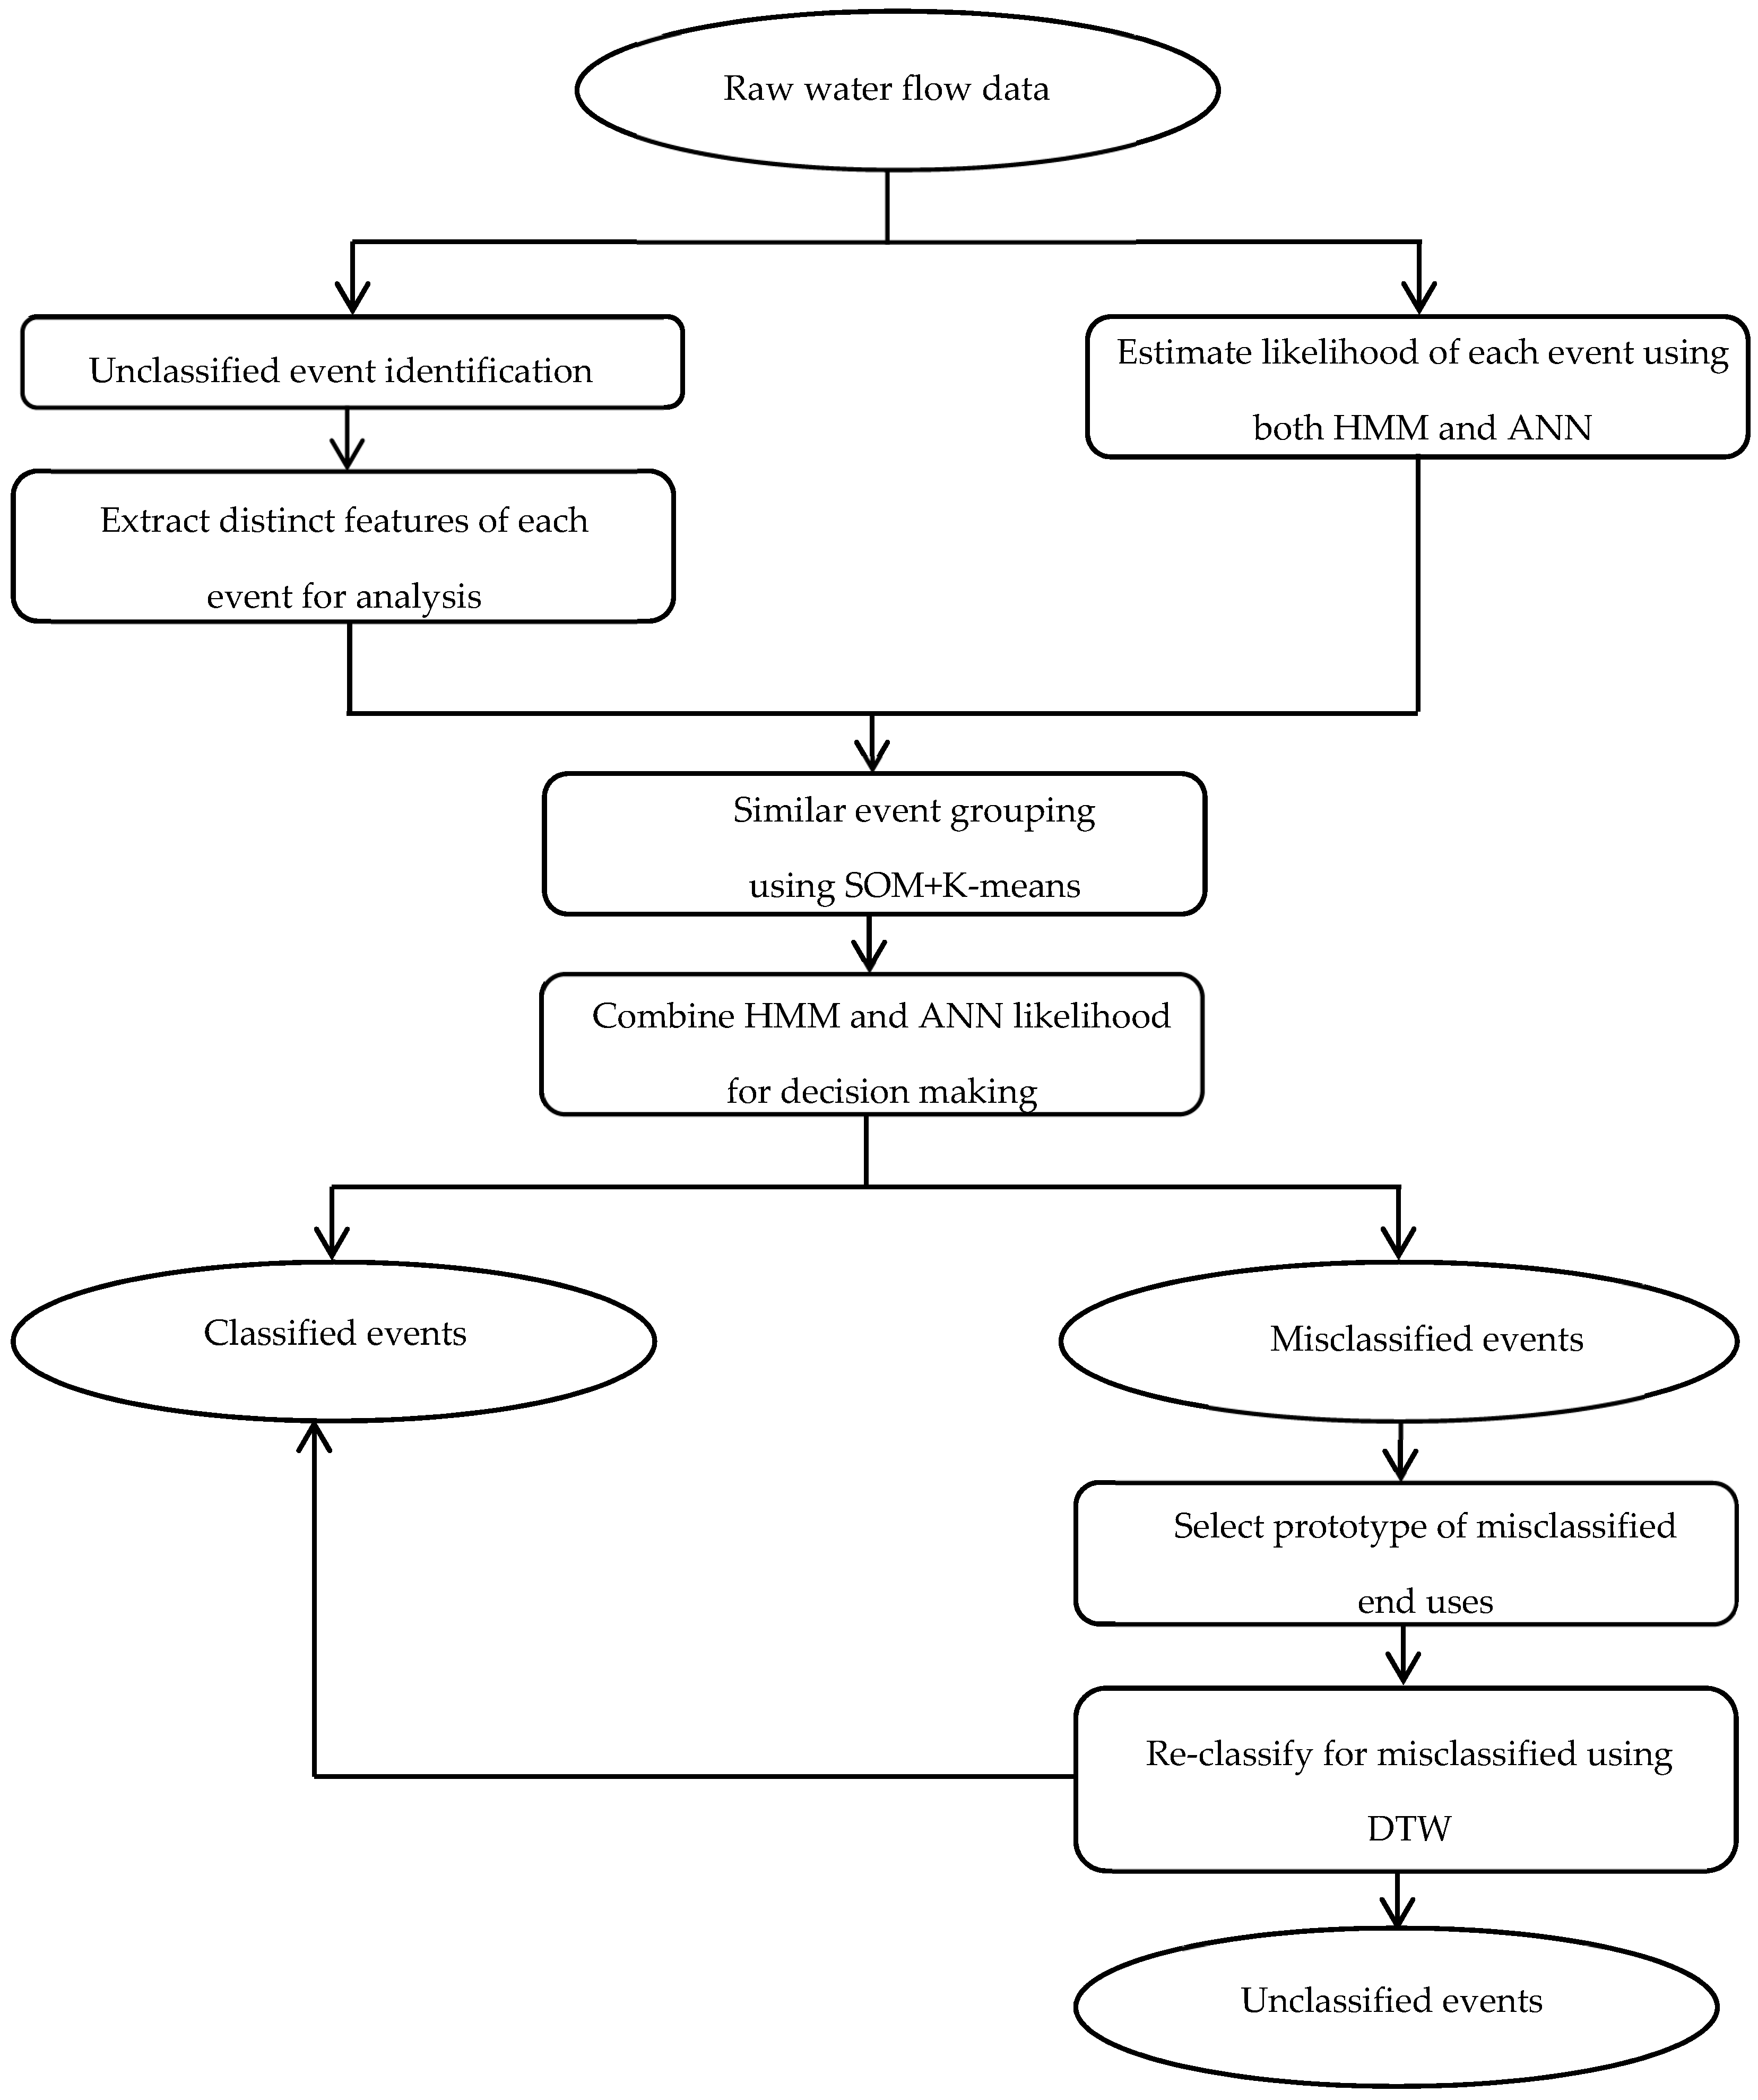
Autoflow. In the developed version
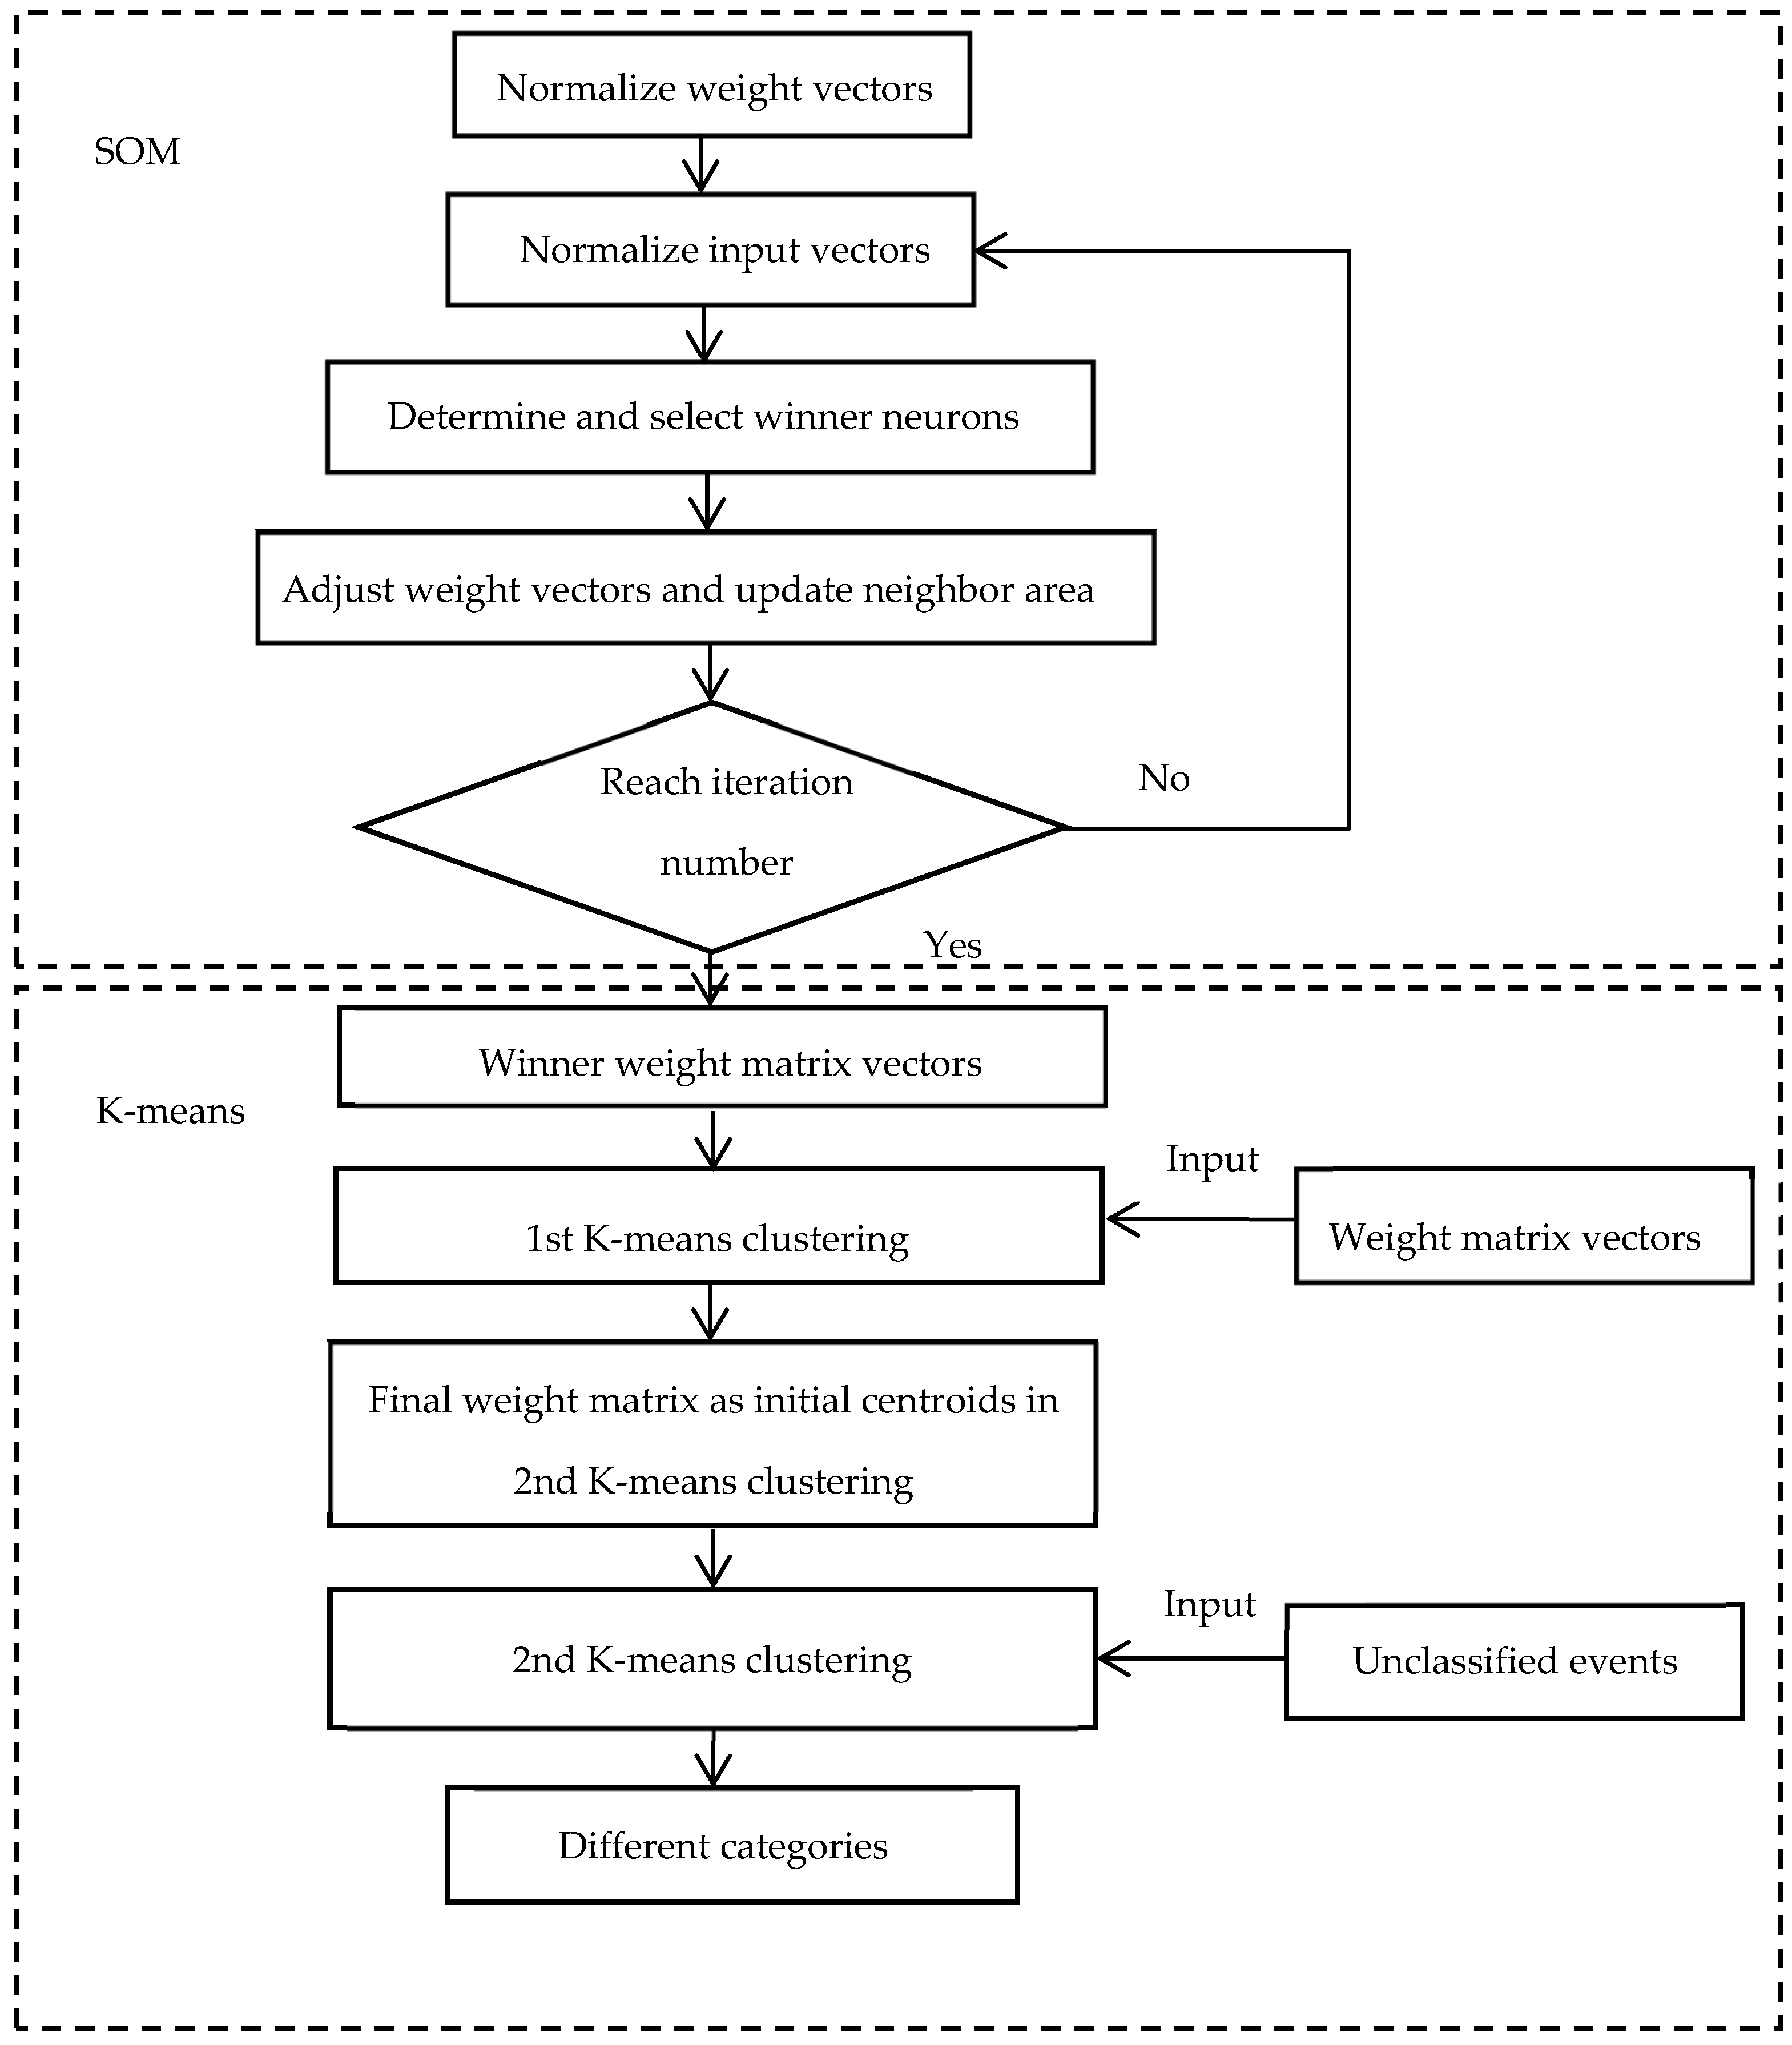
Autoflow v3.1, the hybrid technique combining SOM and K-means has replaced the DTW algorithm in the initial pre-grouping process, which is shown in
Figure 4. The specific subset of the entire procedure for the newly included SOM-K-means clustering process is detailed in
Figure 5. Readers are referred to Nguyen [
5,
7,
16,
17] for the detailed analytical procedures for the other parts of the procedure described in
Figure 4.
The advantages of this hybrid technique include: (i) maintaining the characteristics of the self-organizing of the SOM algorithm, (ii) maintains the high efficiency of K-means clustering, (iii) reduces the convergence time in SOM, and (iv) reduces the impact of the initial centroid selection in the K-means algorithm.
4. Model Validation
As described below, two stages of model testing and verification were undertaken in this study.
- (i).
Model testing utilized the herein recommended hybrid combination of SOM + K-means on a total of 9200 random event samples.
- (ii).
Event model verification was conducted by applying the Autoflow v3.1 software tool to 30 independent homes from Australia and comparing against using original Autoflow v2.1.
4.1. Independent Testing Process
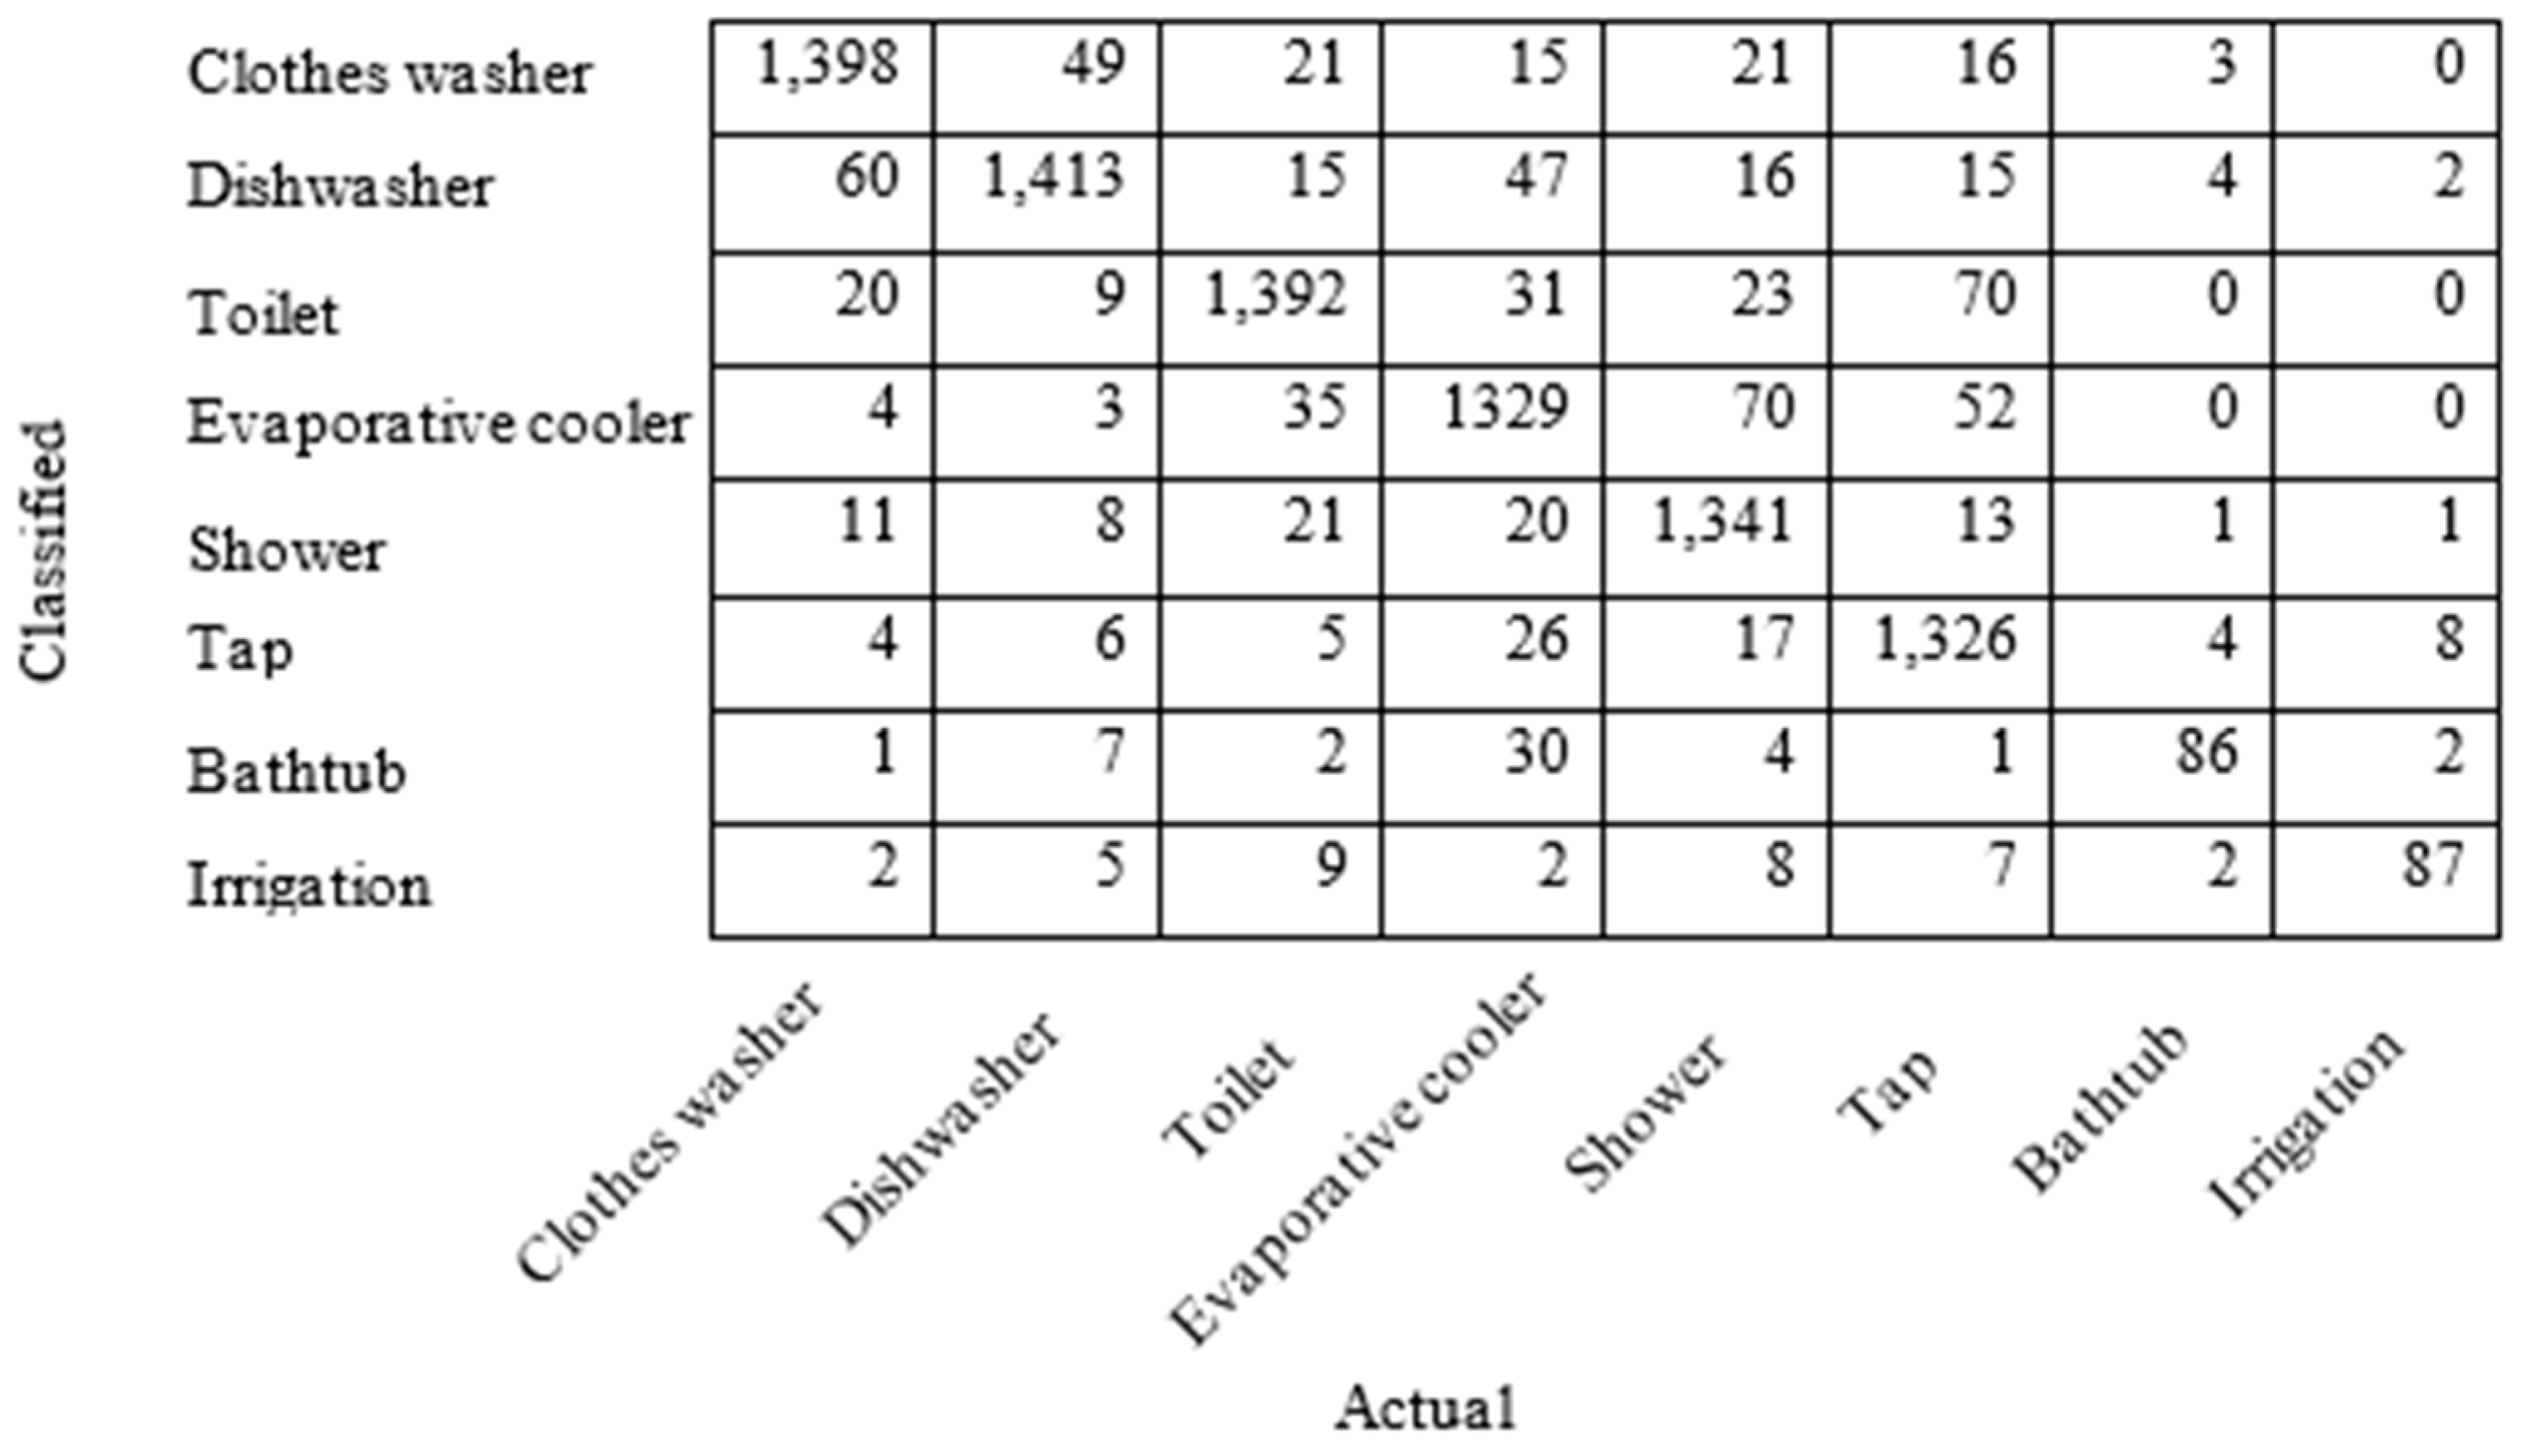
A total of 9200 samples were randomly selected from 104,271 disaggregated samples of eight different categories for testing. These selected samples were mixed together and the SOM + K-means analysis module was adopted to partition them into eight different groups where each group was expected to consist of similar events. The correctly classified water end use events are shown in
Figure 6. The model accuracy is determined by dividing the number of correctly grouped events for each category by the number of events for testing that category. For example, for the clothes washer event category, the number of testing samples was 1500 and the number of clothes washer events correctly grouped was 1398, which resulted in an accuracy of 93.2%.
Table 1 details that the
Autoflow v3.1 water end use event recognition accuracy ranged from 86% for the bathtub to 94.2% for the dishwasher. It is interesting to note that in
Table 1, the hybrid model improved the accuracy of both the more predictable mechanized water end-use event categories (i.e., clothes washer, dishwasher, evaporative cooler, and toilet) as well as those more variable categories heavily dependent on human behaviors (i.e., tap, bathtub, irrigation, and shower). Overall, the newly developed hybrid method that has been augmented in
Autoflow v3.1 has achieved a higher overall pattern recognition accuracy when compared to the prior utilized DTW technique applied in
Autoflow v2.1 for this similar clustering function.
4.2. Autoflow Recognition Accuracy Using Independent Homes
To determine the true accuracy of the Autoflow v3.1 model, 30 independent home datasets were collected. These 30 homes based in Australia were independent of the original training and testing datasets and each water end-use event was certified by home owners.
Table 2 compares the average accuracy achieved for each category between the
Autoflow v2.1 developed using DTW, HMM, and ANN and the
Autoflow v3.1 (i.e., SOM + K-means + ANN + HMM) for the independent sample of 30 homes. Water end use event pattern recognition accuracy for
v3.1 ranged from 75.1% for irrigation to 90.1% for the clothes washer. Irrigation event recognition accuracy should be treated with caution and is not considered reliable for small samples (i.e., N = 30 homes) since this usage category has a smaller number of samples and is sporadic. As can be seen from this table, an average accuracy of more than 85% has been achieved for mechanical categories with the maximum of 90.1% for the clothes washer and the minimum of 85.5% for the toilet. In comparison with the
Autoflow v2.1, the new
v3.1 model has provided greater overall accuracy especially for the mechanized water end use categories. Notable version comparison improvements include 87.6% compared to 82.1% for the dishwasher, 86.8% compared to 83.4% for the evaporative air cooler, and 85.5% compared to 83.1% for the toilet. It is noticeable that the newly included SOM-K-means clustering algorithm has been more effective for mechanized water end use event categorization.
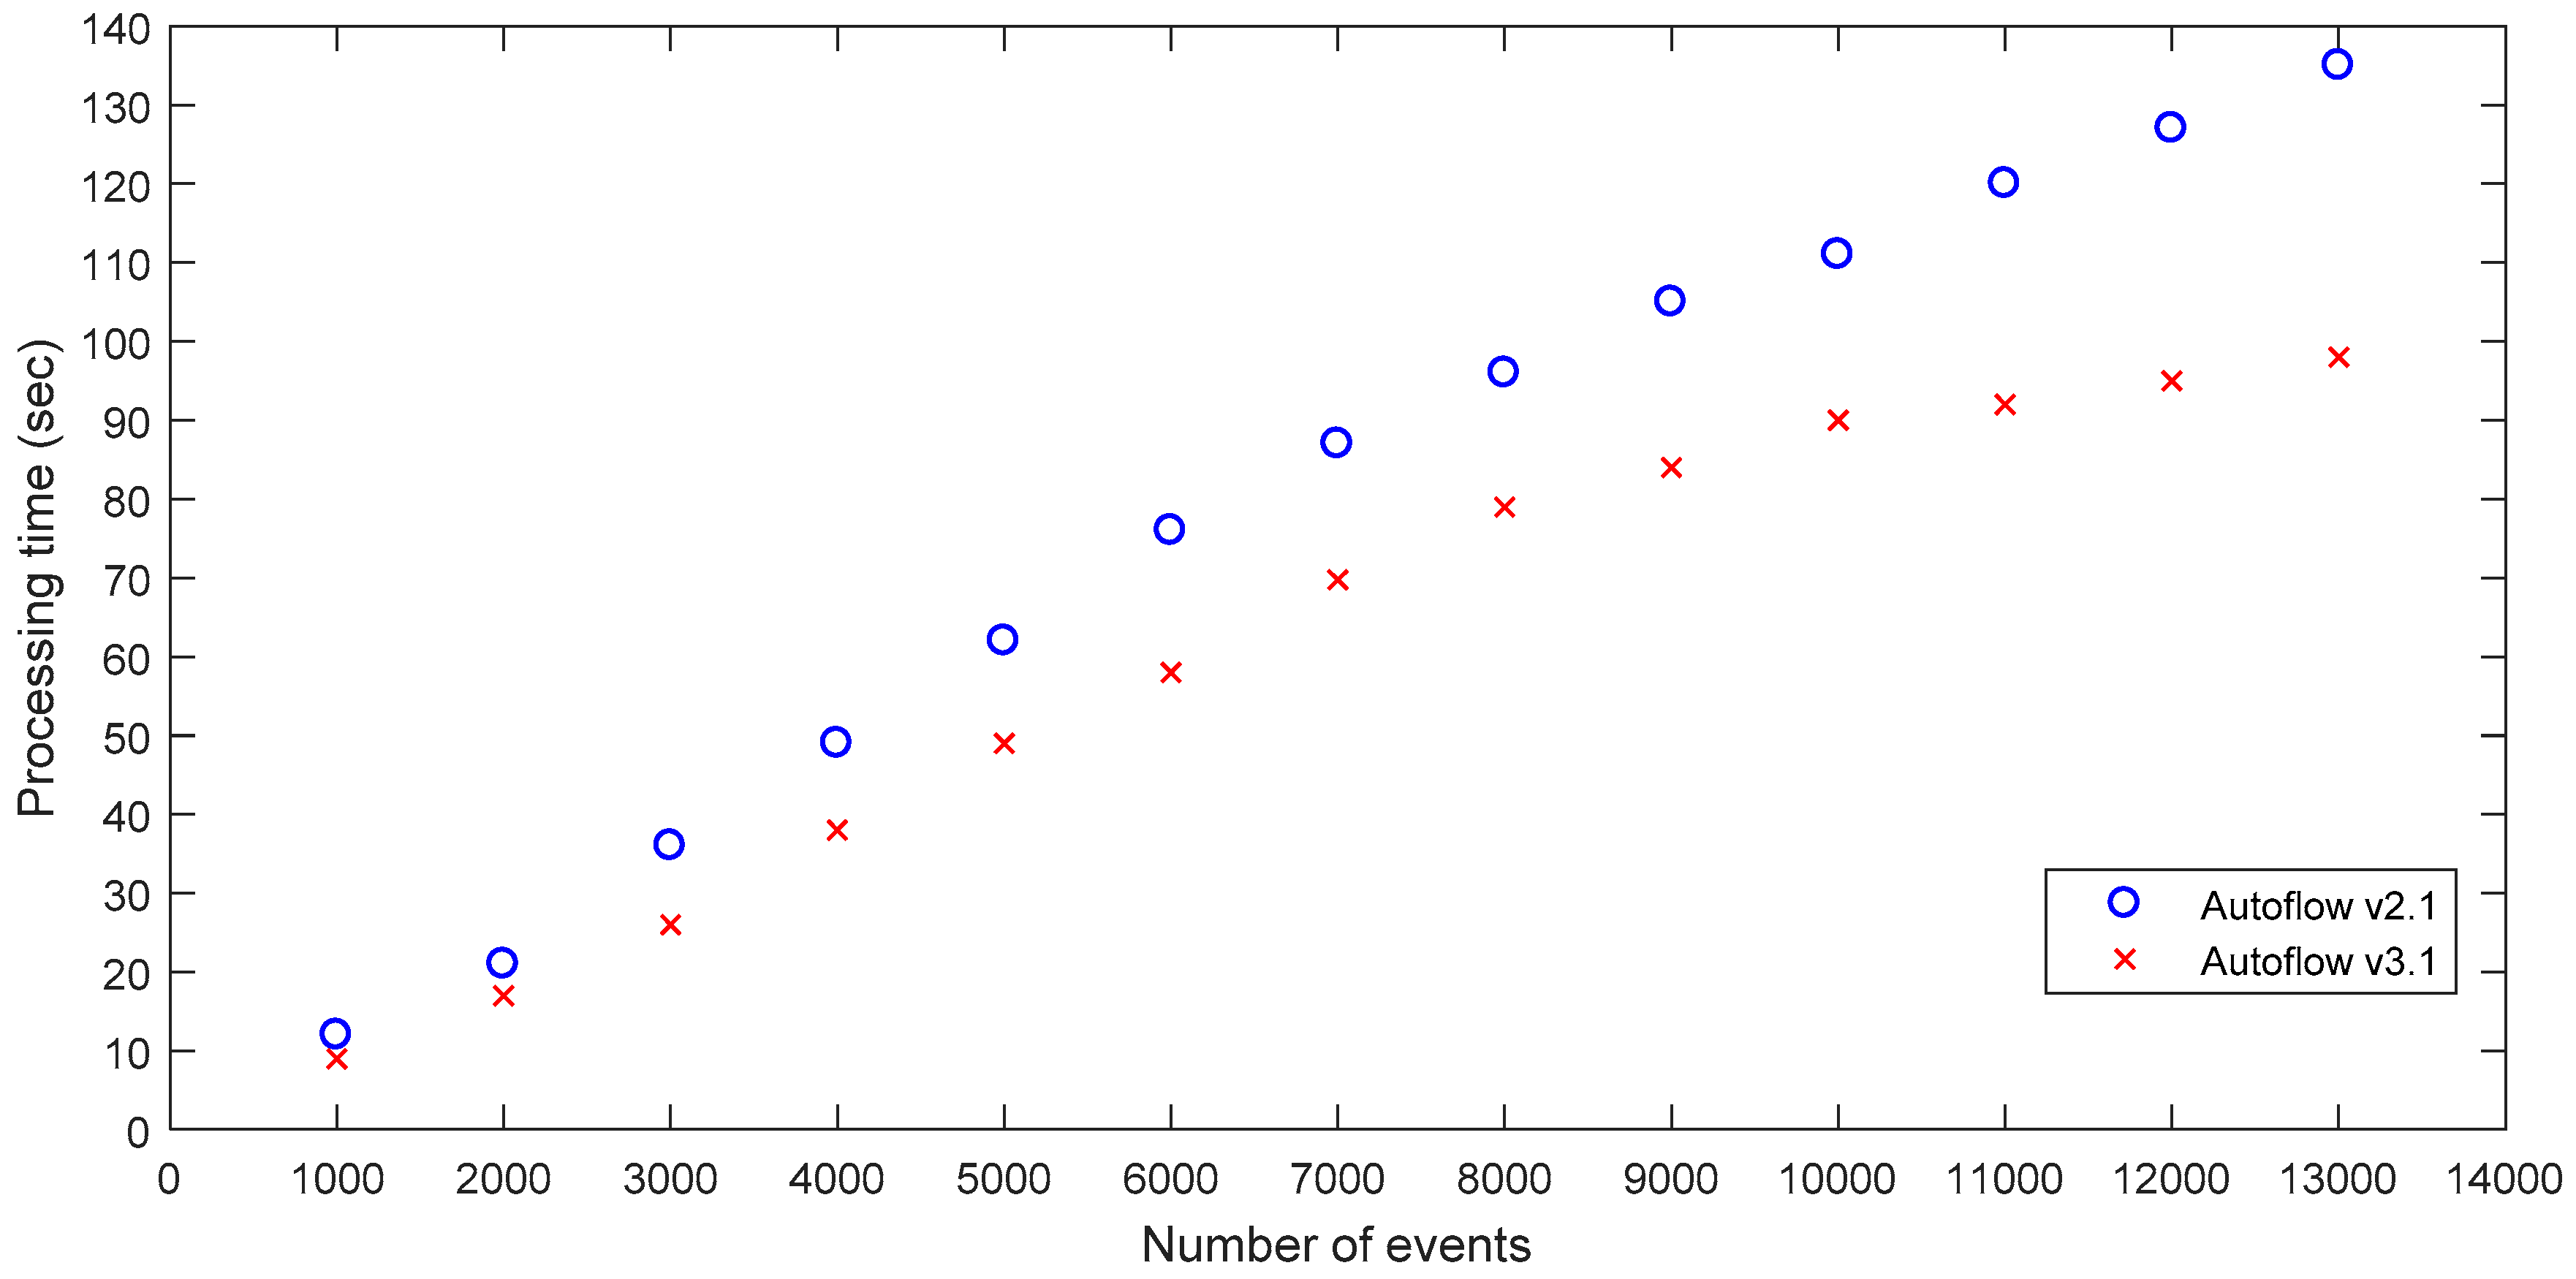
Additionally, regarding water end use pattern recognition accuracy improvements, the processing time to analyze the 30 independent residential homes water end-use events was determined, which is shown in
Figure 7.
Figure 7 illustrates the processing time comparison between
Autoflow v3.1 and previous version
Autoflow v2.1.
Autoflow v3.1 has reduced the flow data end-use disaggregation time compared with the previous version. As evident in
Figure 7, processing time per event reduces further with
Autoflow v3.1 when there is a greater number of unclassified events. In terms of the number of events, although
Autoflow v2.1 had a good efficiency, it still cannot achieve a processing speed of 100 events per second. In the developed
Autoflow v3.1, a pattern recognition speed greater than 100 events per second could be achieved. Overall, a 20% improvement in processing time was achieved for
Autoflow v3.1 compared to
Autoflow v2.1.
Testing results have indicated that the replacement of DTW by the combination of SOM with K-means has improved recognition accuracy in Autoflow v3.1 especially for the mechanized water end use categories. The hybrid technique was less effective for behaviorally influenced water end use categories (e.g., shower) since there is a much greater variety in the patterns of these events. Thereby, this makes clustering more challenging.
However, Autoflow still can be improved in future research. The developed analytical approach was reliable for categorizing most end-use categories with the exception of irrigation, tap, and shower. In order to significantly improve recognition accuracy of these end-use event categories, which heavily depend on human behavior, further research on how to unobtrusively incorporate local contextual data (i.e., residential household descriptive and behavioral information) into the Autoflow analysis process is required. To achieve this, the development of self-learning algorithms for the incorporation into the final analytical phase needs to be completed. Collecting and analyzing each event feature of a much larger sample of events (e.g., different regions, dwelling type, etc.) will be the focus of future research. The future developed version of Autoflow that includes self-learning functionality should complete a more accurate disaggregation of water end-use data for new residential households having some different water using fixtures.
5. Conclusions
The Autoflow software, which is an integrated water management system, employs smart water metering and a series of intelligent algorithms to automate the disaggregation of high-resolution residential water flow data into discrete water end-use events. Autoflow v3.1 presented in this paper includes a new analysis module to the prior version that groups similar events using a hybrid combination of customized SOM and K-means algorithm. The verification process demonstrated that the enhanced version increased the recognition accuracy. Moreover, the study showed that the inclusion of the SOM+K-means method provides better clustering of mechanized water end-use events such as clothes washer, dishwasher, evaporative cooler, and toilet. Autoflow v3.1 has significant implications for the urban water industry.
Autoflow is a commercial software, which is currently being used by various water utilities in Australia (e.g., Yarra Valley Water, City West Water, and South-east Water). This application was developed using MATLAB and it can be used both as a desktop and as a web application. At this stage, the main features of the software include, but are not limited to, collecting and transferring water consumption data through a smart water metering system as well as, analyzing the data and producing a wide range of reports that can be accessed by various users (i.e., consumers, water utilities, and government organizations). However, work is underway to embed this novel software as firmware within smart meters and transfer processed water end-use data to consumers via an application on their phone or computer.
Autoflow has significant implications for consumers and water businesses, government departments, the metering and software industry, and the wider urban water industry. For consumers, Autoflow provides them with an easily accessible interface, which allows consumers to monitor where and when they are consuming water in their household. By consumers having water end use data readily available to them on a daily basis, they will be have better understanding on their water consumption and be able to target efficiency efforts (i.e., understand that their shower consumption is high). For the water utility, compiled anonymized city-level water end use data can assist them with a range of operational functions including water demand management, distribution network infrastructure planning, post-meter leakage management, and customer engagement. Government departments and agencies charged with urban water policy can use water end use data for designing effective water efficiency policies (i.e., rebates, restrictions, etc.). The water metering industry are currently developing advanced digital meters that can record and transmit high resolution water usage data (i.e., 0.01 L/1 s). Such metering technology facilitates widespread autonomous water end use analysis. Autoflow software could be embedded into future smart meters firmware or alternatively housed in a server for cloud-based processing. Based on these arguments, there is a strong need for further research on developing intelligent water consumption analysis algorithms and associated software such as Autoflow. The creation of such software poses significant benefits for infrastructure planners, water demand managers, architects and developers, and policy advisors who seek to better understand water consumption patterns.


