Variation Analysis of Streamflows from 1956 to 2016 Along the Yellow River, China

1
State Key Laboratory of Hydraulic Engineering Simulation and Safety, Tianjin University, Tianjin 300350, China
2
Department of Agricultural and Biological Engineering, Purdue University, West Lafayette, IN 47907, USA
*
Author to whom correspondence should be addressed.
Water 2018, 10(9), 1231; https://doi.org/10.3390/w10091231
Submission received: 26 July 2018
/
Revised: 24 August 2018
/
Accepted: 7 September 2018
/
Published: 12 September 2018
(This article belongs to the Special Issue Hydrological Processes under Environmental Change)
Abstract
:With the change of climate and the impacts of human activities, the water resources crisis of the Yellow River is becoming increasingly serious. How and why did the streamflows of the Yellow River basin change? Based on observed annual runoff data (1956–2016) of 10 main hydrological stations along the Yellow River, the linear regression method, the Spearman rank correlation method and the Mann-Kendall test method are used to analyze runoff trend. The orderly clustering method, the sliding t test method and the Lee-Heghinian Method are used to identify the abrupt change point. Finally, the wavelet analysis method is used to identify runoff time series period. The results show that: (1) With the exception of the streamflow of Tangnaihai, the streamflows of all examined stations have significantly declining trends. The decrease of the streamflow from the upper to the middle to the lower reaches is becoming more and more obvious; (2) The runoff of the Yellow River has changed greatly. The abrupt change point at Tangnaihai occurred in 1989. The abrupt change points of the other stations took place in 1985; (3) The runoff along the Yellow River presents multi-time scale changes. The streamflows appear to have strongest periods of 25–40 years with a 40-year scale, which indicate the alternate oscillations of the high and the low water periods. The periods of <6 and 7–24 years are not stable and are complicated. The first main period of runoff in the Yellow River is 30 years; (4) The streamflow upstream of Tangnaihai station is mainly affected by the climate. The streamflows downstream of Tangnaihai station are influenced by human activities, especially water extraction and diversion and the operations of the large reservoirs. These research results have important practical guiding significance for hydrological forecasting, evaluation and management of water resources, construction of water conservancy projects and sustainable utilization of water resources in the region.
1. Introduction
River runoff is an important water resource. As climate change and human activities intensify, river runoff is undergoing significant spatiotemporal changes. It has direct effects on the allocation, exploitation and utilization of water resources and the physical, chemical and biological processes of river ecosystems [1,2,3,4]. Therefore, the attribution analysis of river runoff change has been one of the major and difficult problems in current hydrological science.
As the second largest river in China, the Yellow River is the paramount water source in northwestern and northern China [5]. The Yellow River supplies fresh water not only for approximately 114 million people, accounting for about 8.7% of the total Chinese population [6,7], but also for agricultural production, accounting for about 13% of the country’s total cultivated area [8]. As a result of population increase, economic development and natural factors, the water resources of the Yellow River are now under great pressure as a water resource [9]. The flow shows a significant decreasing trend [10,11] with the exception of the upstream of the Tangnaihai station [12]. The decrease of flow is mainly influenced by climate and human activities. Many researchers have conducted widely studied on these two aspects, but their results are inconsistent. Ref. [13] found that reduced precipitation in the 1990s accounted for 75% and 43% of the reductions in river discharge in the upper and middle drainage basins. Ref. [1] concluded that during 1970–2008, climate change and human activities respectively contribute 17% and 83% to the reduction in water discharge in the Upper reaches of Yellow River basin. The corresponding relative contributions in the Middle reaches are 71% and 29% to reductions in water discharge. Ref. [14] reported that changes in land use were responsible for more than 70% of the decrease in streamflow of the headwater sub-catchments of the Yellow River basin that occurred in the 1990s. Ref. [15] thought that climate change contributed to total runoff deviations by over 40%, while water consumption and soil erosion control practices contributed over 50% in the middle Yellow River. For the entire runoff change of the whole Yellow River, the total contributions from precipitation were 11.76%, from potential evapotranspiration were 3.83%, and from human activities were 92.07% [16]. The average human activities contribution rate is 72.0% for the streamflow reduction, which is significantly stronger than the precipitation contribution rate (28.0%) [17].
In research methods, the majority of previous studies [17,18,19,20] use a single method to study trend and variation of runoff time series, and the results obtained lack a certain degree of feasibility. Therefore, this paper uses multiple methods to evaluate and analyze the change trend and the variation of the entire Yellow River flow from 1956–2016. In addition, the periodic characteristics are identified by using wavelet analysis.
The objectives of this study are: (i) to analyze the spatiotemporal variations during the last 60 years in streamflow along the whole Yellow River; (ii) detect both trends and abrupt changes of streamflow; (iii) identify the characteristics of multi-time scales in streamflow; and (iv) discuss the main reasons for the variations in streamflow. The research results of this paper are expected to provide a helpful reference for water resource planning and effective management, the construction of water conservancy projects, and ecological environment protection in the Yellow River basin.
2. Study Area
The Yellow River originates from the Yueguzonglie basin in the north of Bayan Har Mountains of Qinghai-Tibet Plateau, covering a drainage area of 795,000 km2, with a total length of 5464 km. Compared to other rivers, one of its strikingly different characteristics is the different sources of flow and sediment. According to its distinct climatic, hydrological, and geomorphological characteristics, the Yellow River is commonly separated into three major sections: The upper, middle, and lower reaches. The Yellow River Basin covers many sub-reaches, but the water is mainly yielded from its upper reach in the Qinghai-Tibetan Mountains [21].
The upstream area is a 3471 km long area from the river head to Toudaoguai which is located in Hekou town in the Inner Mongolia Autonomous Region with a catchment area of 386,000 km2. The upper reaches of Yellow River basin are in arid and semi-arid areas. The area from river head to Longyangxia Reservoir is located in the high and cold area of Qinghai Plateau which contains alpine steppe, alpine meadow and marsh steppe. The area from Longyangxia to Lanzhou, located in the connecting part of the Qinghai Plateau and the Loess Plateau, mainly contains alpine meadow and meadow steppe, where arable land accounts for only 9.5% of the total area, and woodland area accounts for 14.8%. The area from Lanzhou to Toudaoguai is located in the region of the Loess Plateau, with annual average precipitation of only between 150 and 300 mm [22]. It is adjacent to the Tengger Desert of Inner Mongolia in the north and the Erdos desert in the south.
The middle reaches pass the Loess Plateau, which is characterized by a fragile ecological environment and severe soil loss [11]. The middle reaches stretch over a length of 1206 km from Toudaoguai to Huayuankou with a basin area of 362,138 km2. This section is mainly located in the Loess Plateau with large numbers of tributaries converging into it. It descends from an altitude of 1000 m at Toudaoguai to 95 m at Huayuankou. The climate is semiarid and arid with an annual average precipitation of 516 mm.
The lower reaches where elevation is under 95 m are confined by manmade levees on both sides. The basin area is 22,726 km2 and the climate is humid with an annual average precipitation of 648 mm [23].
3. Materials and Methods
3.1. Data Sources
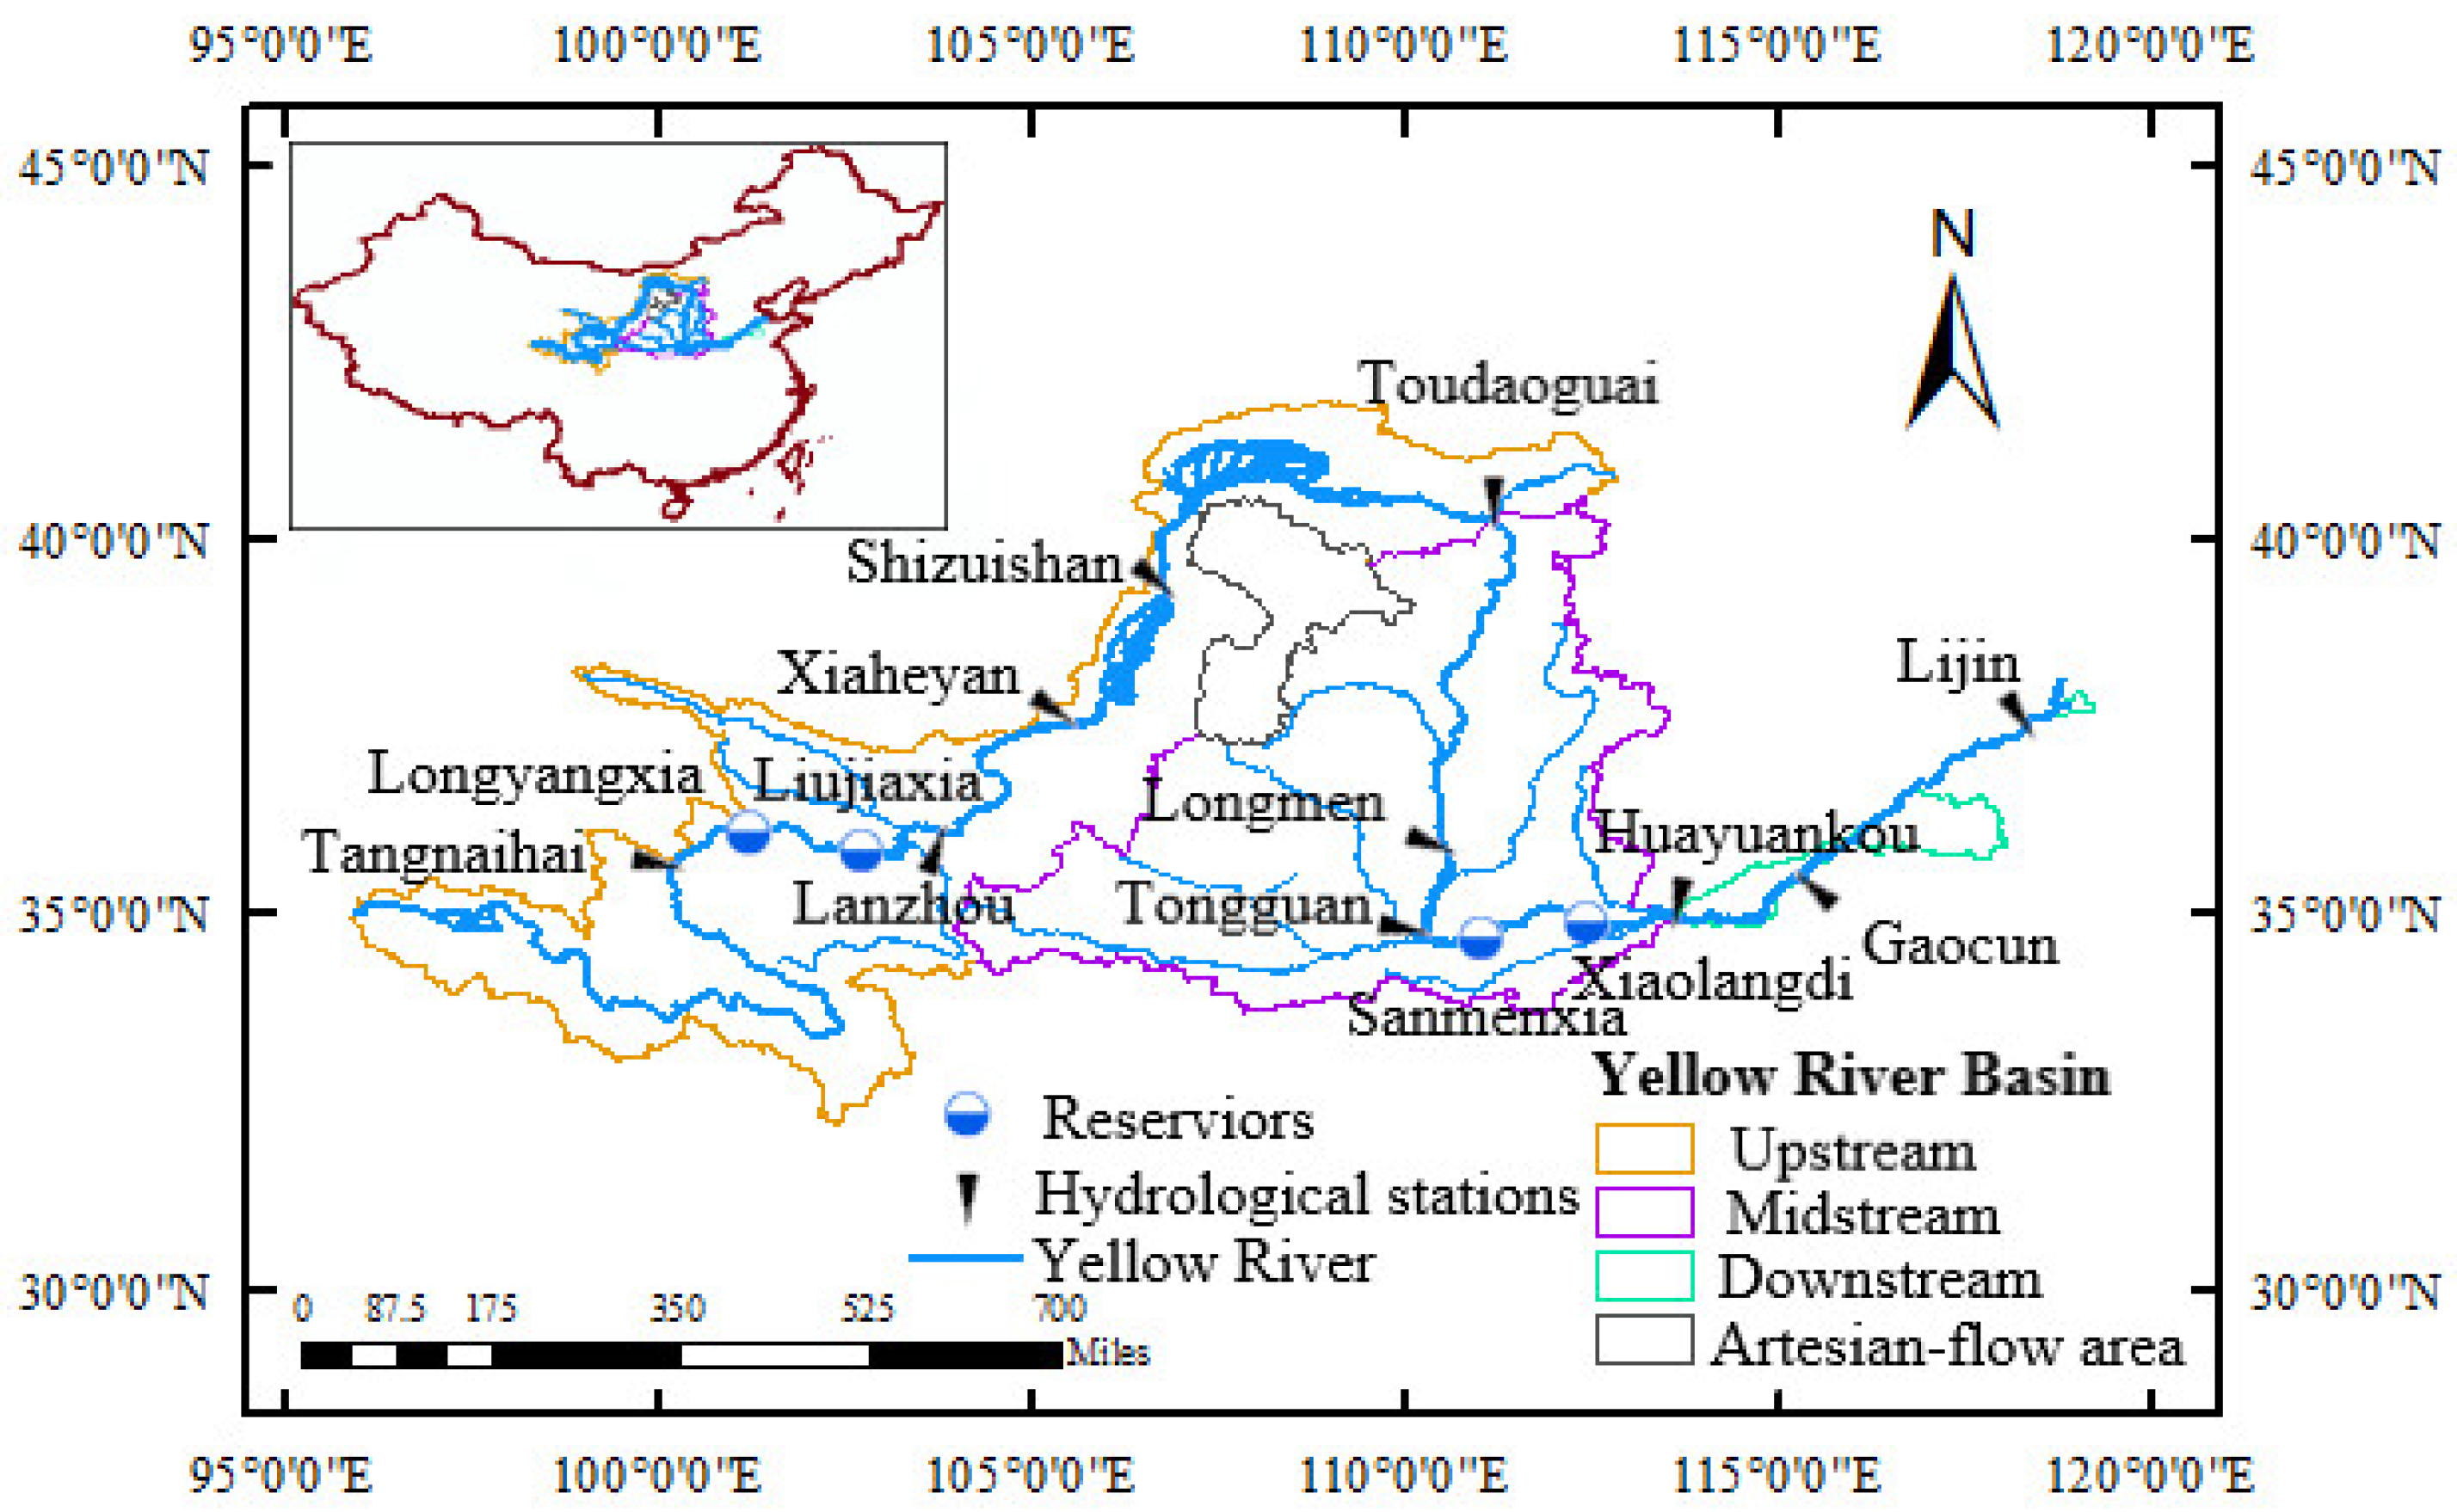
Data used in this study mainly include the annual runoff (108 m3) observed from 1956 to 2016 of 10 hydrologic stations along the Yellow River. These stations are Tangnaihai, Lanzhou, Xiaheyan, Shizuishan, Toudaoguai, Longmen, Tongguan, Huayuankou, Gaocun and Lijin (Figure 1). The details of data information are shown in the Table 1. Among these hydrological stations, Tangnaihai, Lanzhou, Xiaheyan, Shizuishan are located in the upstream region. Tangnaihai is the inflow station of Longyangxia reservoir, and Lanzhou is the outflow station. Toudaoguai station is located in the boundary area between the upper and middle reaches, which is the control station to monitor the coming flow and sediment from the upper reaches of the Yellow River. Longmen station and Tongguan station are located in the middle reaches. Huayuankou station is the boundary station between the middle reaches and the lower reaches. It is the starting point for the Yellow River becoming the Overhanging River. The Gaocun and Lijin stations belong to the downstream region. Lijin hydrological station is the last station on the Yellow River. The calculated annual runoffs by daily runoff time series were consistent with values of annual runoff from the Yellow River water resources bulletin in repeated years. As such, two time series are reliable and consistent. Data of annual reservoir storage capacity change include Liujiaxia reservoir and Longyanxia from 1987 to 2016 and Xiaolangdi reservoir from 1999 to 2016. Data of annual water diversion consumptions include the upper, middle and lower regions in the Yellow River basin from 1998 to 2015. These data come mainly from the Yellow River water resources committee and partly from the Yellow River water resources bulletin, which is compiled by the Yellow River water resources committee.
3.2. Methods
Hydrological time series are comprehensive reactions of combined climate conditions, natural geographical conditions and human activities [24]. Thus, the data themselves reflect the influence of these factors. In general, hydrological sequences can always be decomposed into two components, namely deterministic and stochastic components. Deterministic components contain certain physical concepts, including period, trend and jump components. Random components are caused by irregular oscillations and random effects, which cannot be explained strictly on a physical basis. In this paper, evolution trends, abrupt change points and periods of the Yellow River runoff are studied, while not considering stochastic components.
For the studies of the trend and the abrupt change point, their theory and methods are mainly based on the statistical parameters and nonparametric test method. The different statistical methods have different assumptions (such as that data must have a normal distribution, homogeneity, etc.). If the data cannot meet the hypothesis condition, the calculated result will deviate from the actual situation [25,26,27,28]. Thus, it is assumed that the existence of trend and variation of streamflow sequences should be verified using at least two methods [29].
Identification of dominant periods is a typical and important issue in hydrologic series analysis, because it is the basis of building effective stochastic models and understanding complex hydrologic processes [30]. The estimated spectra using these traditional methods (such as FFT, MESA) often exhibit pseudo-periods, which sometimes cannot identify certain actual periods [24,31]. The EMD method can directly represent multiple time scale change, but because of the intermittent noise signal and the influence of the modal mix, instability in the EMD algorithm makes the physical meaning unclear [24,32]. Wavelet analysis can better realize the time-frequency localization and reveal the implied change characteristics of the time series. Therefore, it is suitable for the study of complex hydrologic systems with multi-time scale variation characteristics [30].
3.2.1. Trend Analysis Method
Trend analysis is an important and common tool for developing a better understanding of the impacts of climate change and human activities on hydrological systems. In order to have more confidence on the existence of trends in streamflow time series, we decided to apply three different tests in this study. The significance level of statistical analysis was uniformly set as magnitude 0.05, so as to avoid analysis error caused by different confidence intervals and make the calculation results comparable.
(1) Linear regression method
The linear regression (LR) trend method is one of the most common mathematical statistics methods, which can directly reflect the qualitative change trend of sequences. Thus, it is widely used in trend analysis of time series of precipitation, runoff, temperature and water quality. The linear regression method is used to judge the trend change by the significance test of the linear correlation coefficient [33,34,35].
(2) Mann-Kendall test method
The Mann-Kendall (MK) test method is a non-parametric test method recommended by WMO (World Meteorological Organization) and is widely used to analyze the trend of time series of precipitation, runoff, and temperature and water quality. The MK test does not require samples to follow a certain distribution, nor is it subject to the interference of a few abnormal values. It is applicable to data of non-normal distributions such as hydrology and meteorology. The MK test method has the characteristics of simple calculation, wide detection range and a high degree of quantification [25,35,36,37,38].
(3) Spearman rank correlation method
The Spearman rank correlation method is a robust and simple test method, which does not require certain distribution of samples and is not disturbed by a few abnormal values. This method is not a function of time sequence itself, but the information of the observed value rank (i.e., number of qualifying) function. Thus, it can eliminate the influence of the distribution of the original sequence. It was found that the Spearman rank test is more concise than MK. The Spearman rank test principle is based on the correlation coefficient test [25,34,35,37,39,40].
3.2.2. Identification of Abrupt change Point
Change point analysis is one important element of hydrological statistics and analysis, especially in the distinction between the impact of climate change and human activities on the hydrological processes [41,42]. Compared with the trend, the change point inference is more complex, and the time and amplitude of the jump may reach different conclusions due to different test methods [43]. Therefore, this paper adopts three methods: The sliding t test, the ordered clustering method and the Lee-Heghinian method.
(1) Sliding t test method
The sliding t test method verifies the difference of two average values by checking whether there is a significant difference in the mean of the two sub-sequences in a sequence. If the difference of means of the two sub-sequences exceeds a certain significance level, it means that sequence variation has occurred [44]. The traditional t test is a parameter method. The corresponding point of the maximum value is found to be the abrupt change point only through finding all points satisfied the given conditions [2].
(2) Clustering ordered method
The ordered cluster analysis is a method of classifying samples according to the size of the sample gap in a continuous sample. Its mathematical theory is based on the classification algorithm proposed by Fisher, also known as the optimal segmentation method. The principle of classification is to minimize the sum of squares between the same class. The sums of squares between two classes are the maximum [2,38].
(3) Lee-Heghinian Method
3.2.3. Period Identification of Wavelet Analysis
In practical research, the wavelet transform coefficients are obtained through the wavelet transform equation, by which the time and frequency characteristics of time series are analyzed. Selecting the proper fundamental wavelet function is the precondition of wavelet analysis [33]. In this paper, the selected Morlet complex wavelet function is a single frequency complex sine function under Gaussian envelope, because its time and frequency domain localization is better [47].
Based on the results of time scale distribution, it is easy to analyze the periodicity of streamflow series. For time series , is the result of the continuous wavelet transform (CWT) [47], i.e.,
is the wavelet coefficient, which varies with parameters a and b.
The Morlet complex wavelet function Ψ is expressed as follows [33]:
where is a constant; is the imaginary number.
The relationship between time scale a and period T of the Morlet complex wavelet follows:
where is the central frequency of the wavelet; is the sample frequency.
The square integral of all wavelet coefficients on scale a in the time domain is the wavelet squared difference:
In the process of wavelet analysis, due to the limitation of the observation conditions, the measured length of annual runoff series is limited, so on both ends of the sequence so-called “boundary effects” possibly occur, especially in shorter sequences. In order to avoid this deficiency, both ends of the hydrological time series were extended symmetrically in this paper.
4. Results
4.1. Change Process of Annual Streamflow
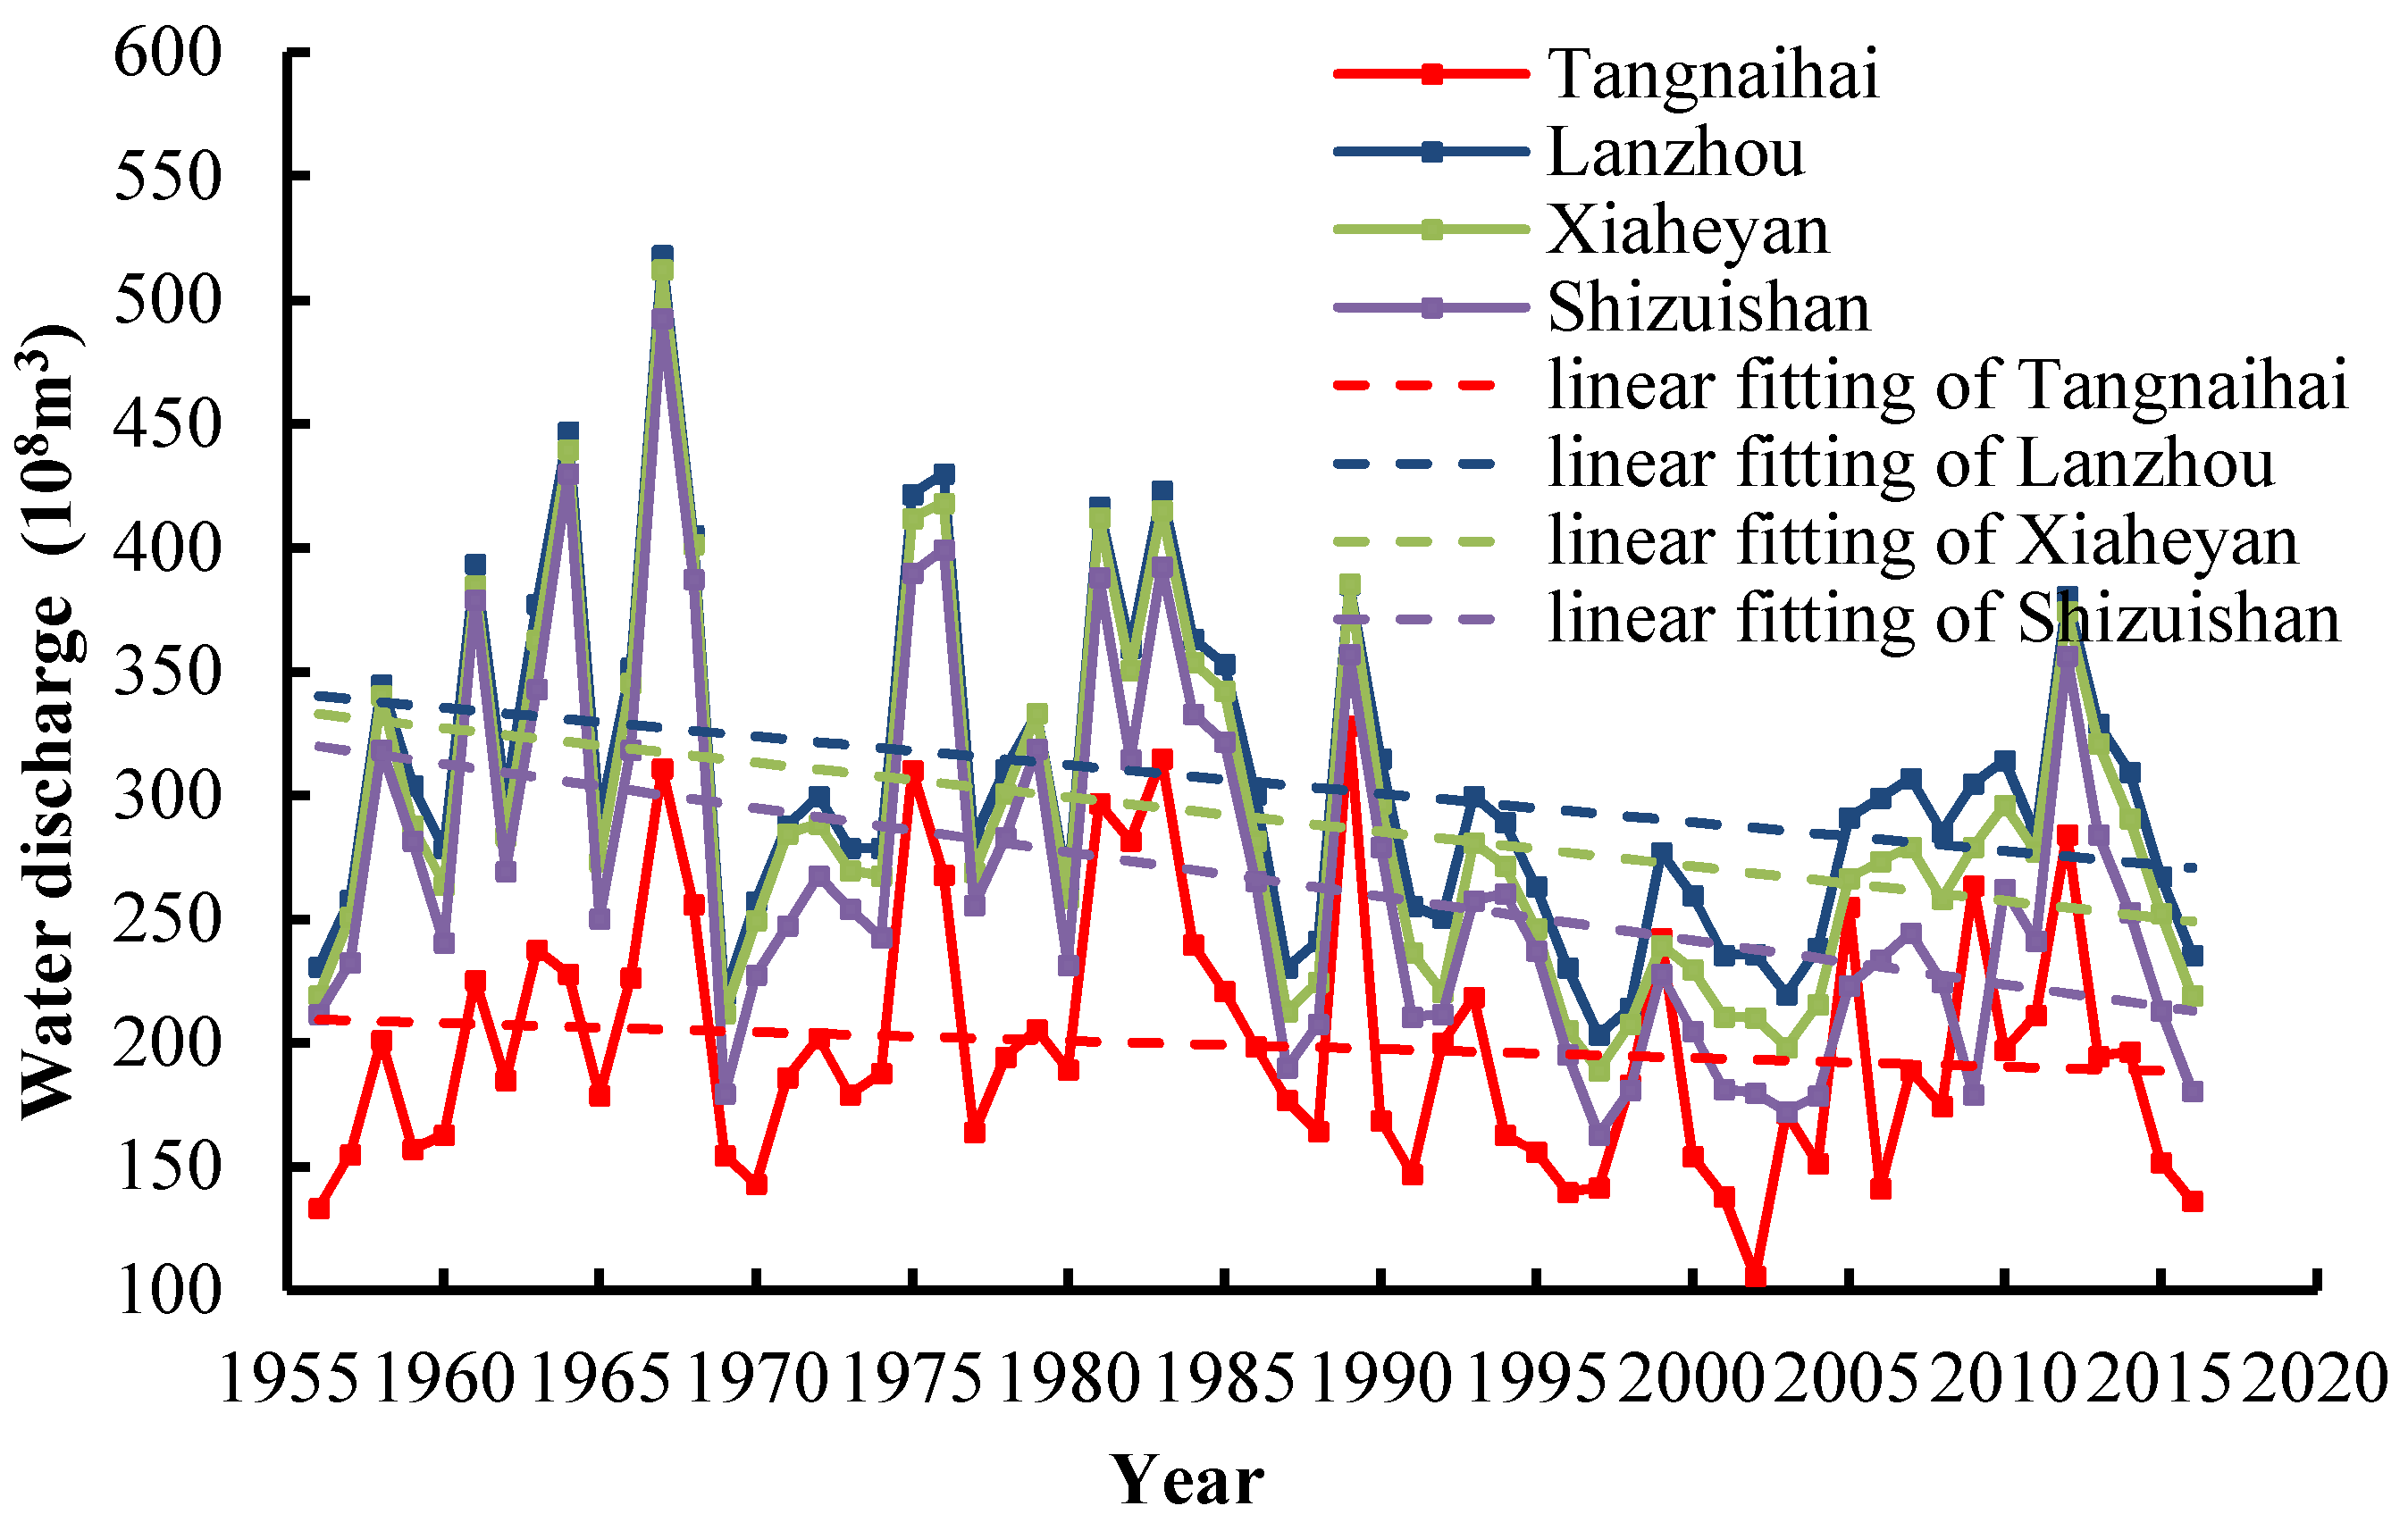
Figure 2 presents the annual runoff change processes of the four stations in the upper reaches of the Yellow River, namely Tangnaihai, Lanzhou, Xiaheyan and Shizuishan. It can be seen that the annual runoff change processes of Lanzhou, Shizuishan and Toudaoguai (Figure 3) are consistent. The change process of Tangnaihai is different from those of the other three stations. The annual streamflow from Tangnaihai to Lanzhou increases, while the annual streamflow from Lanzhou to Xiaheyan, Shizuishan and Toudaoguai decreases.
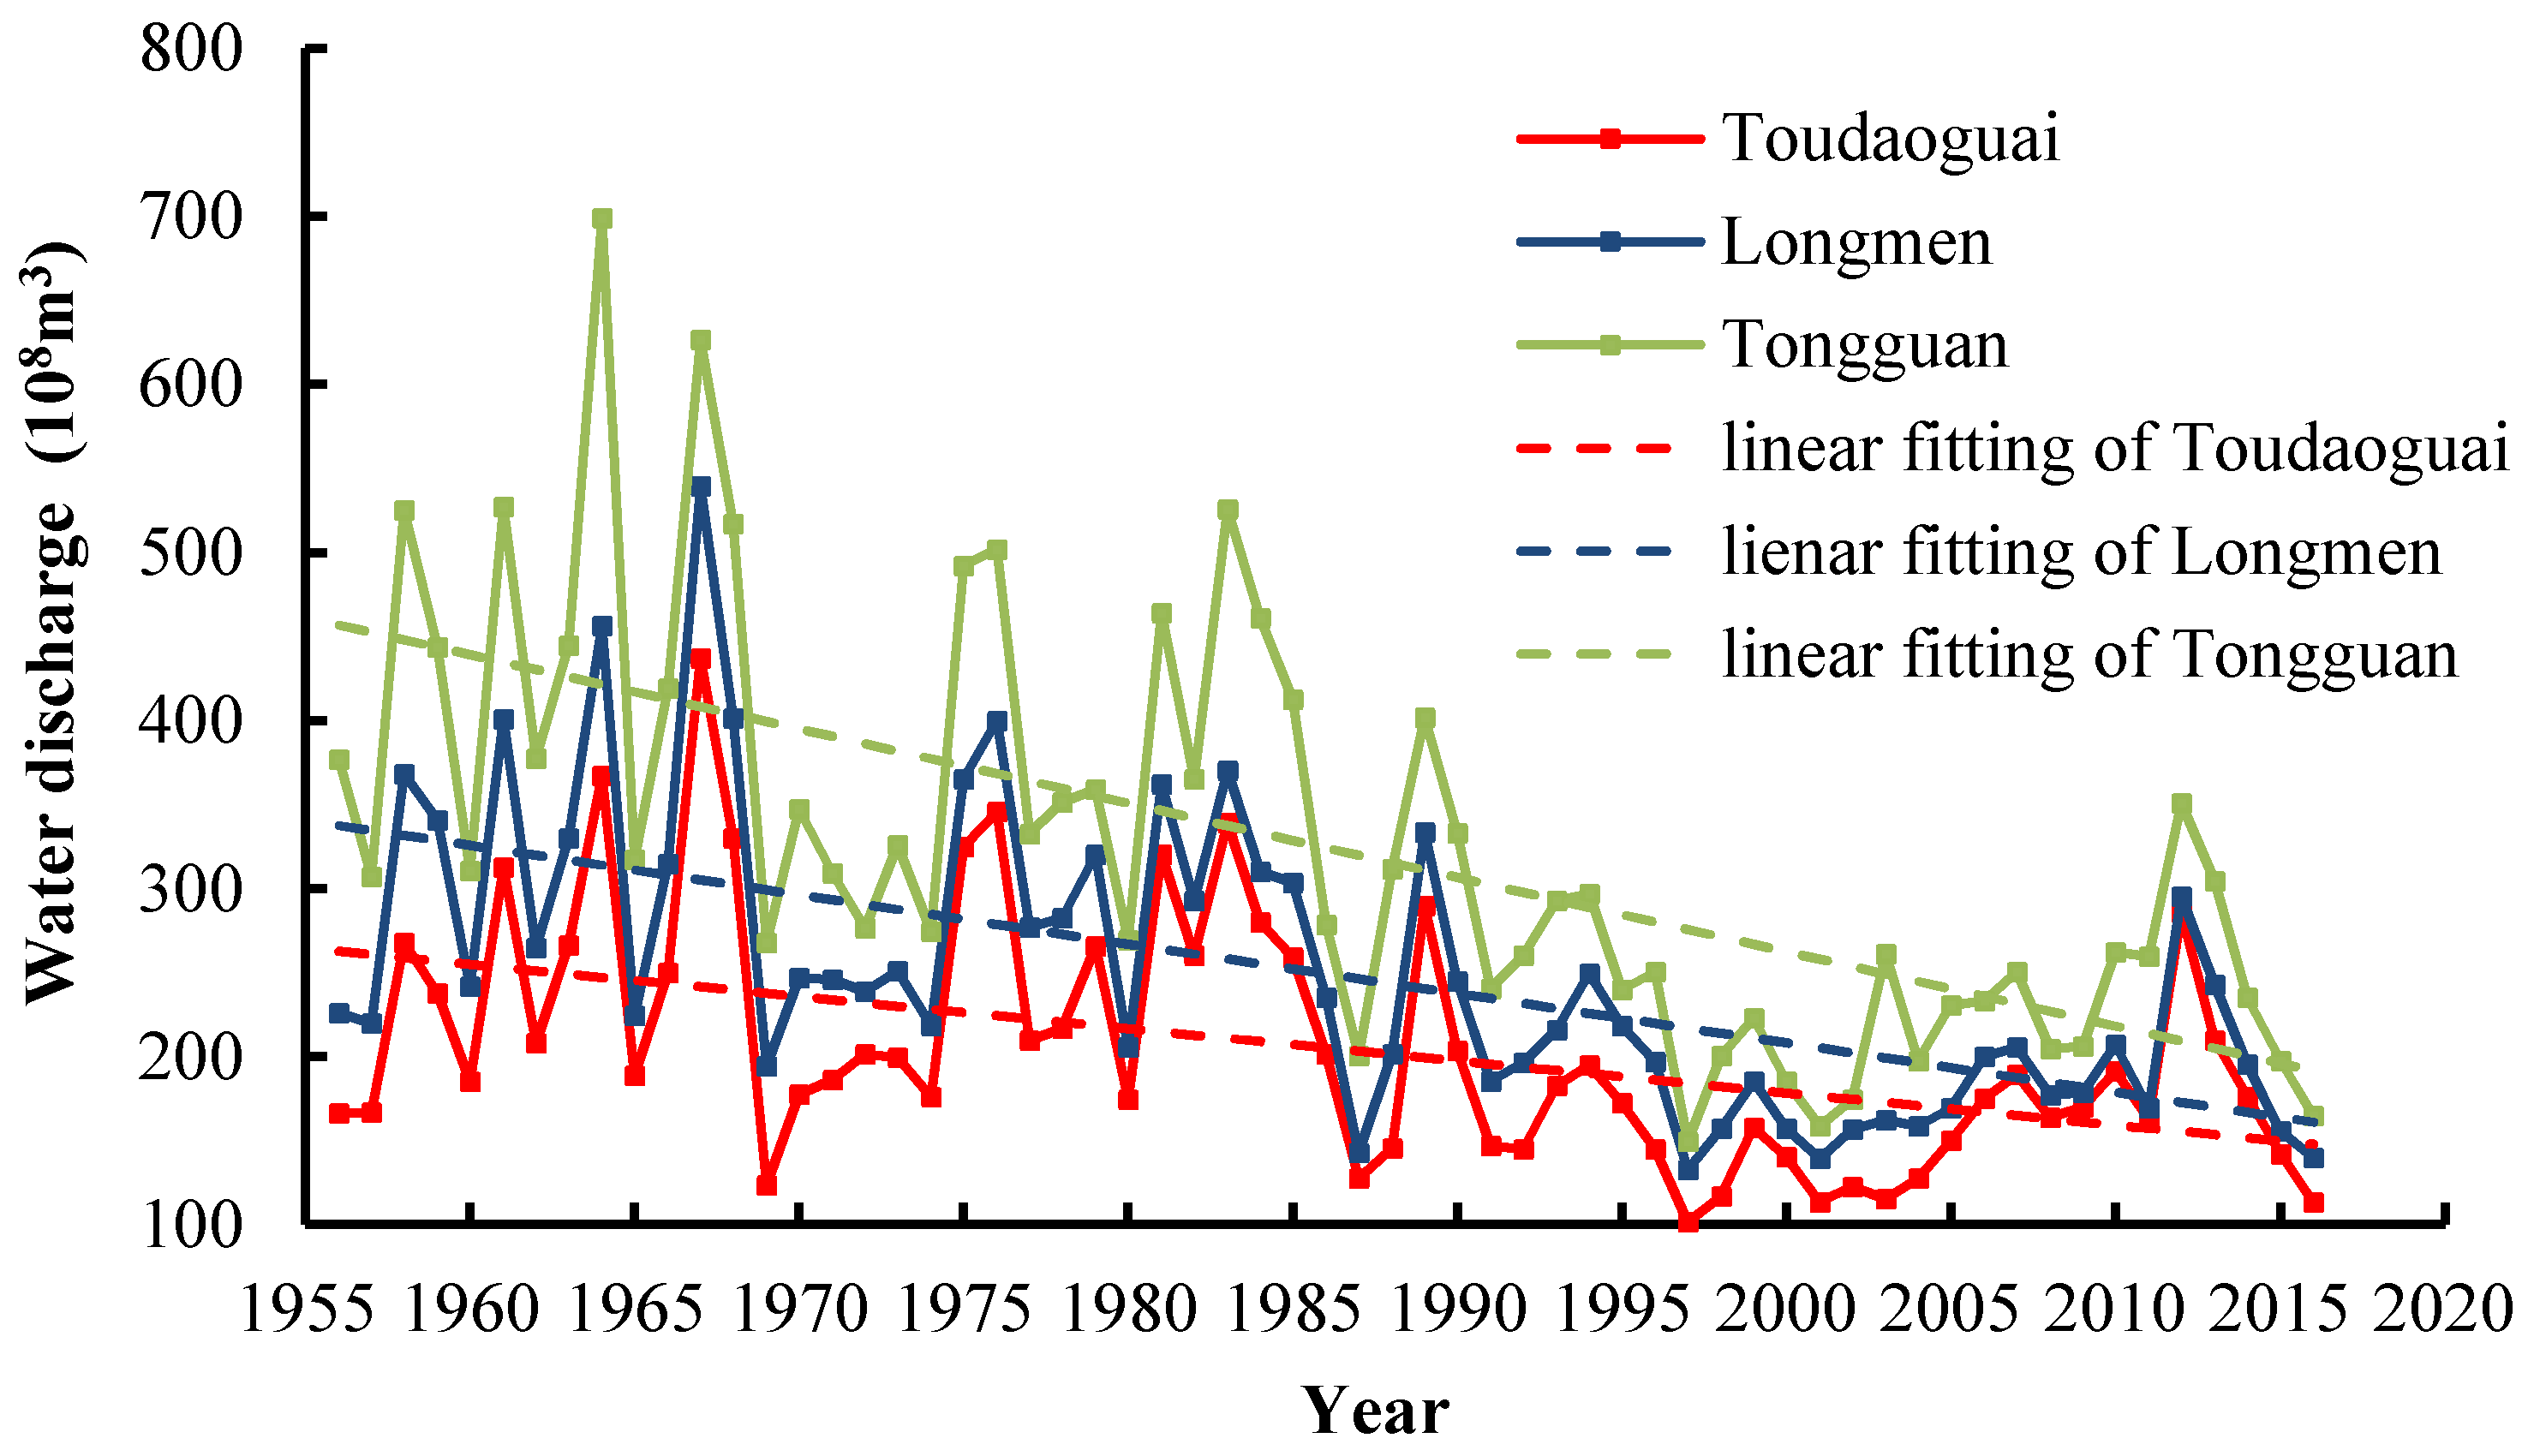
Figure 3 presents the annual runoff variation trends of Toudaoguai, Longmen and Tongguan in the middle reaches of the Yellow River. It can be seen that the annual runoff change of Toudaoguai is consistent with that of Longmen. The annual runoff changes at Tongguan and Huayuankou (Figure 4) are consistent. The annual flow from Toudaoguai to Longmen, Tongguan and Huayuankou increases along the way.
Figure 4 presents the annual runoff variation trends of Huayuankou, Gaocun and Lijin hydrological stations. In general, the annual runoff changes of the three stations are consistent. Especially before 1970 (except 1960), the runoff changes of the three stations were nearly identical. After 1970, annual streamflow from Huayuankou to Gaocun and Lijin decreased along the way.
4.2. Trend Change and Abrupt Change Points
The trend evaluation and level tests were carried out by using the linear regression method, the Mann Kendall rank method and the Spearman rank correlation method under a confidence level of 0.05. The runoff decrease trend of Tangnaihai was not significant. The significance of annual runoff decrease trend of Lanzhou station had mixed results. One result was a significant trend by the linear regression test (Figure 2) and the Spearman’s rank test. Another result was not significant by the Mann-Kendall rank method. For the remaining 8 stations (Xiaheyan, Shizuishan, Toudaoguai, Longmen, Tongguan, Huayuankou, Gaocun and Lijin), the test results of three methods are a significantly decreasing trend. In identifying the abrupt change point, the T sliding method, the Lee-Heghinian method and the Orderly clustering method were used. The results of three methods are consistent for each station. The abrupt change point of Tangnaihai is in 1989, and for the remaining 9 stations, the abrupt change points are all in 1985 (Table 2).
The average and the variation coefficient (CV) are the two most important parameters for hydrological design of water conservancy projects, which affect the scale and safety of water conservancy projects. Moreover, CV is also the main index reflecting the interannual change of river runoff. At the abrupt change point (excluding variation points), the whole time series are divided into two subsequences. Then the average and CV of the whole sequence, before variation and after variation sequences are calculated. The results are shown in Table 3 indicating that the mean annual runoff before the variation sequence in each station is largest. The average after the variation sequence in each station is smallest. From the upstream to the middle and the lower reaches, the change of the average is increasingly large. Compared with the average of the subsequence before variation, the streamflow of Tangnaihai, Toudaoguai and Lijin decreases to 86%, 66% and 38%, respectively. In general, the order of CV is the whole sequence, the sequence before variation and the subsequence after variation. From the upper to the middle and the lower reaches, the CV of the sequences (except Lanzhou) are larger and larger.
4.3. Period
Period is an important component of runoff compositions. Wavelet transform was used to analyze the periods of flow along the Yellow River. The streamflows of Tangnanhai, Toudaoguai and Lijin were selected to carry out the analysis in detail.
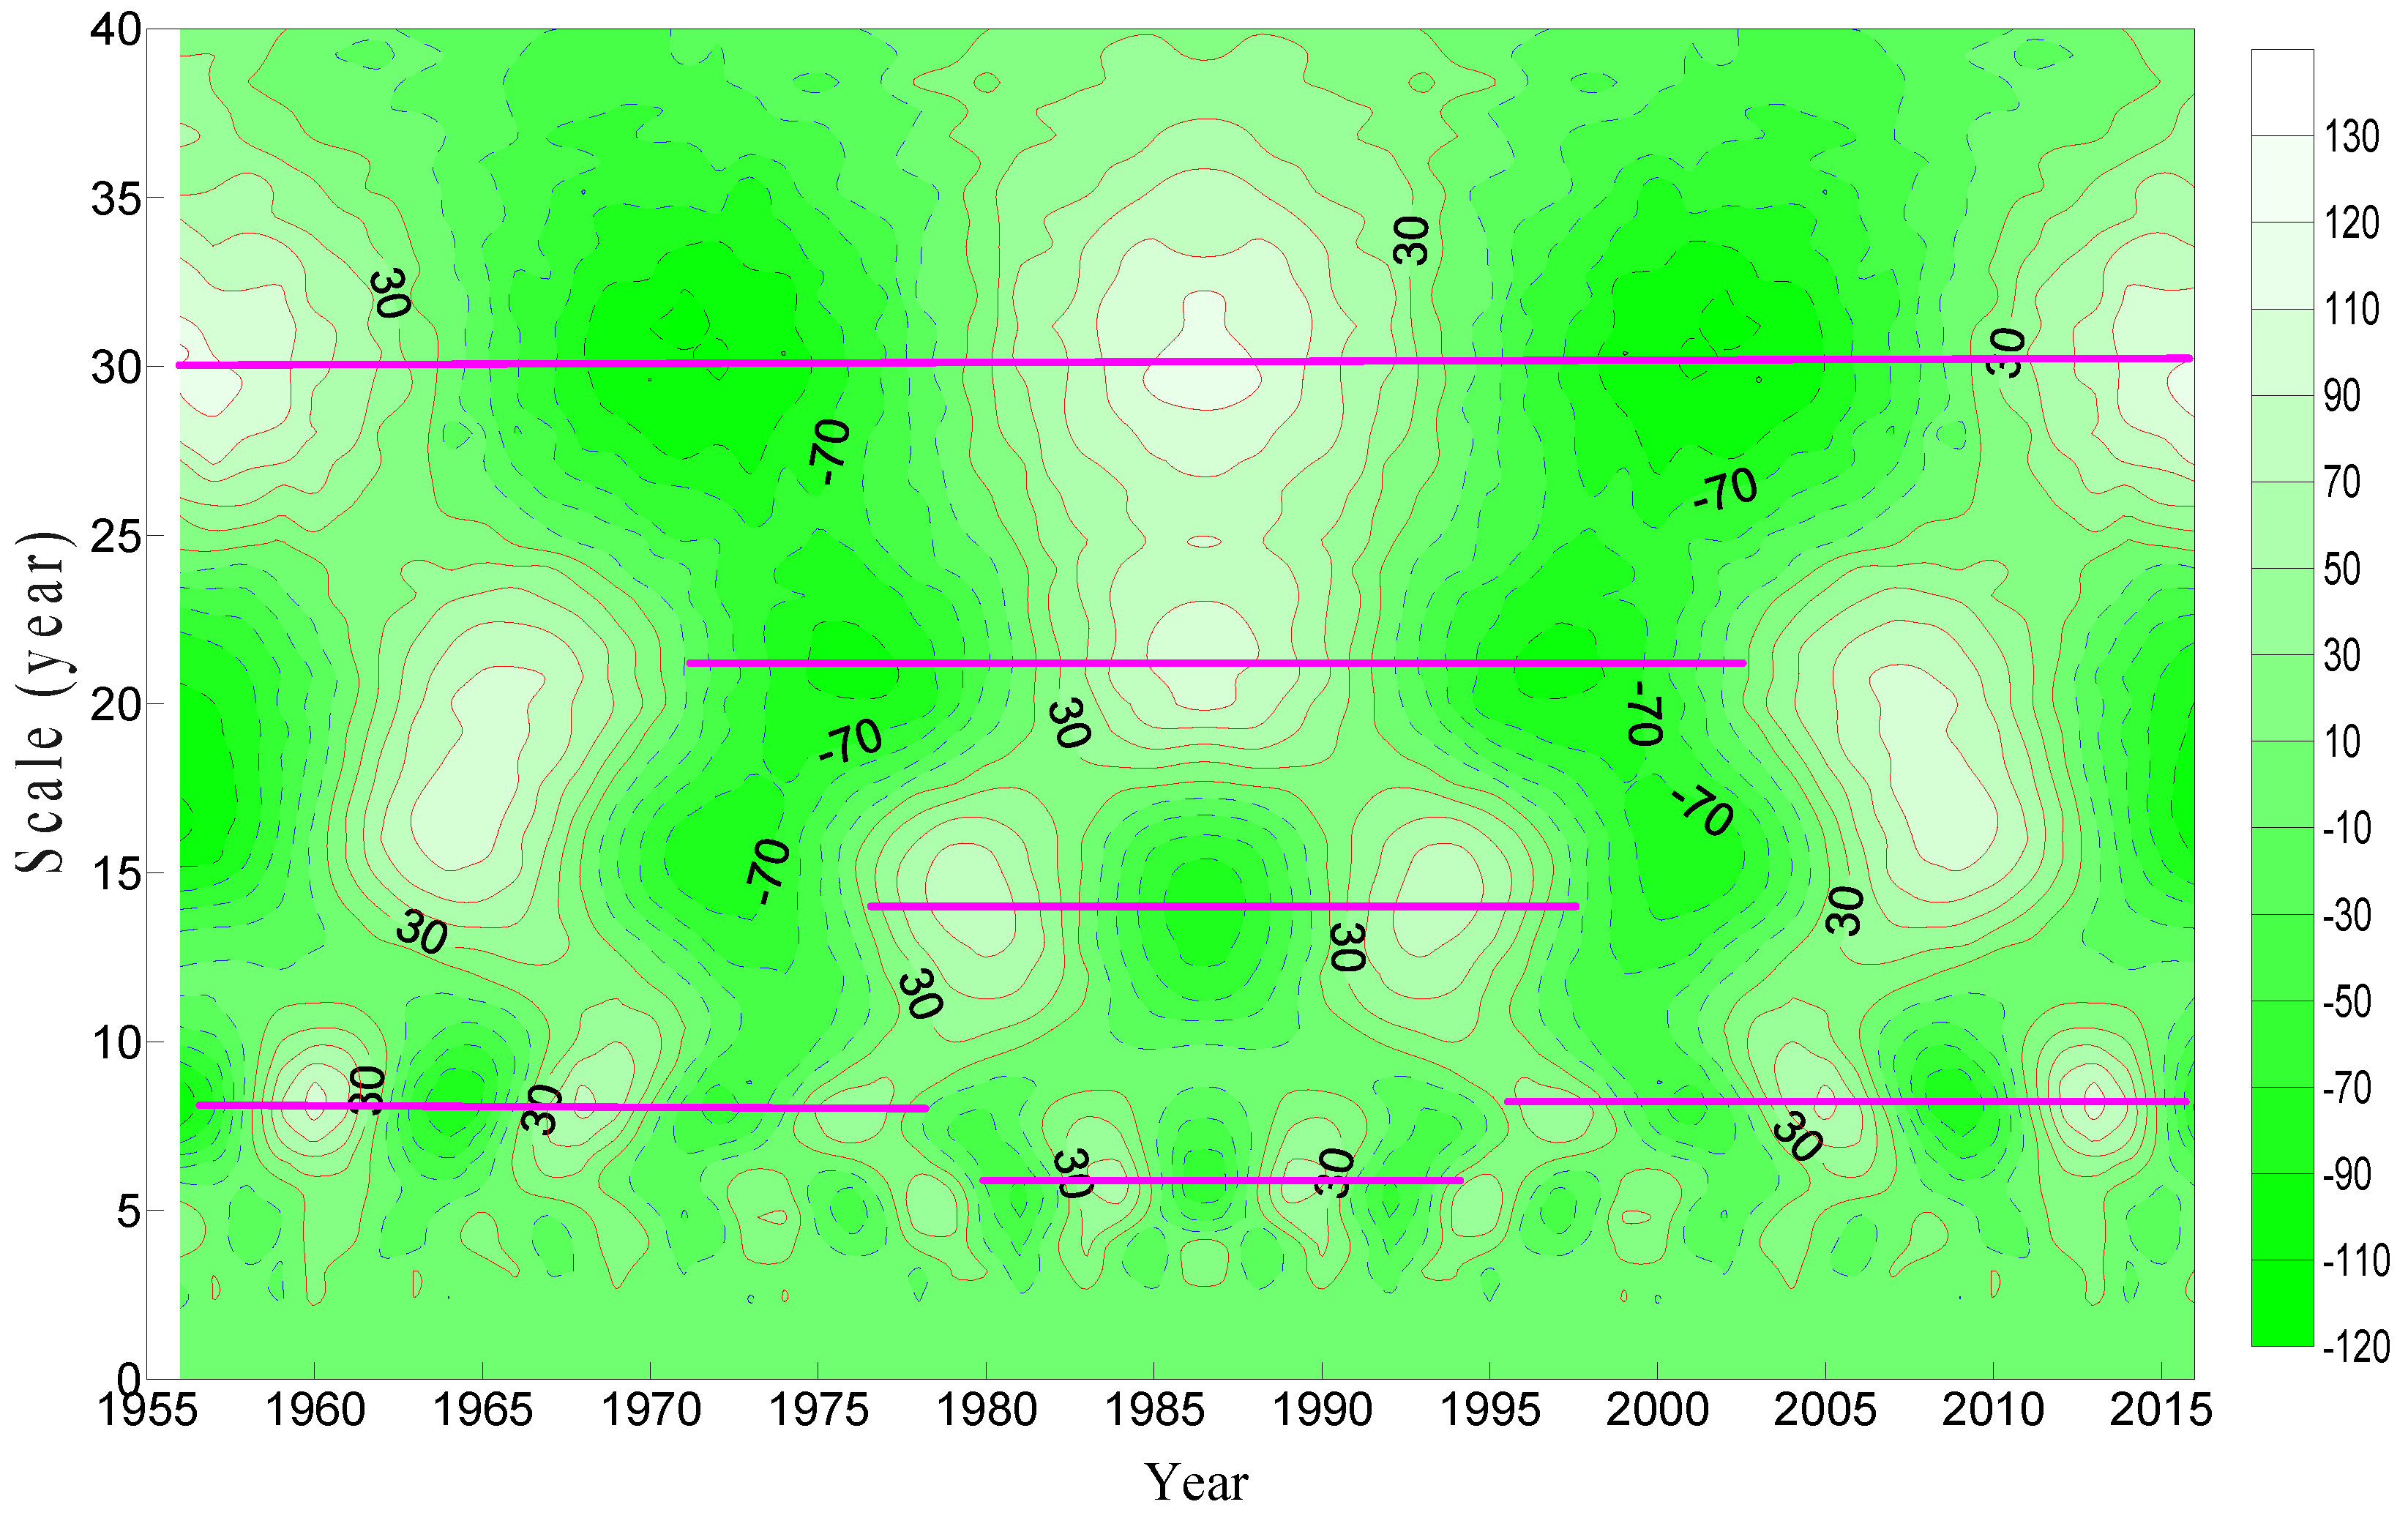
(1) The real part of the wavelet coefficient
The real part of the wavelet coefficients can reflect runoff series periodic change at different time scales and the distribution in the time domain, and then can judge the future trend of flow series at different time scales. When the real part of the wavelet coefficient is positive, it shows that runoff is in a high flow period. If the real part of the wavelet coefficient is negative, it denotes that runoff is in a low flow period.
From the real part coefficients contour map of Tangnaihai (Figure 5), it can be clearly seen that there are 3–6, 6–24 and 25–37 years periodical characters within a 40-year scale. The scales of 25–37 years were very stable in the whole time domain. There were 3 high water and 2 low water shocks. On 6–24 and 3–6-year scales, their oscillation frequencies are very high and complicated. The scale of 3–6 years occurred during 1975–1998.
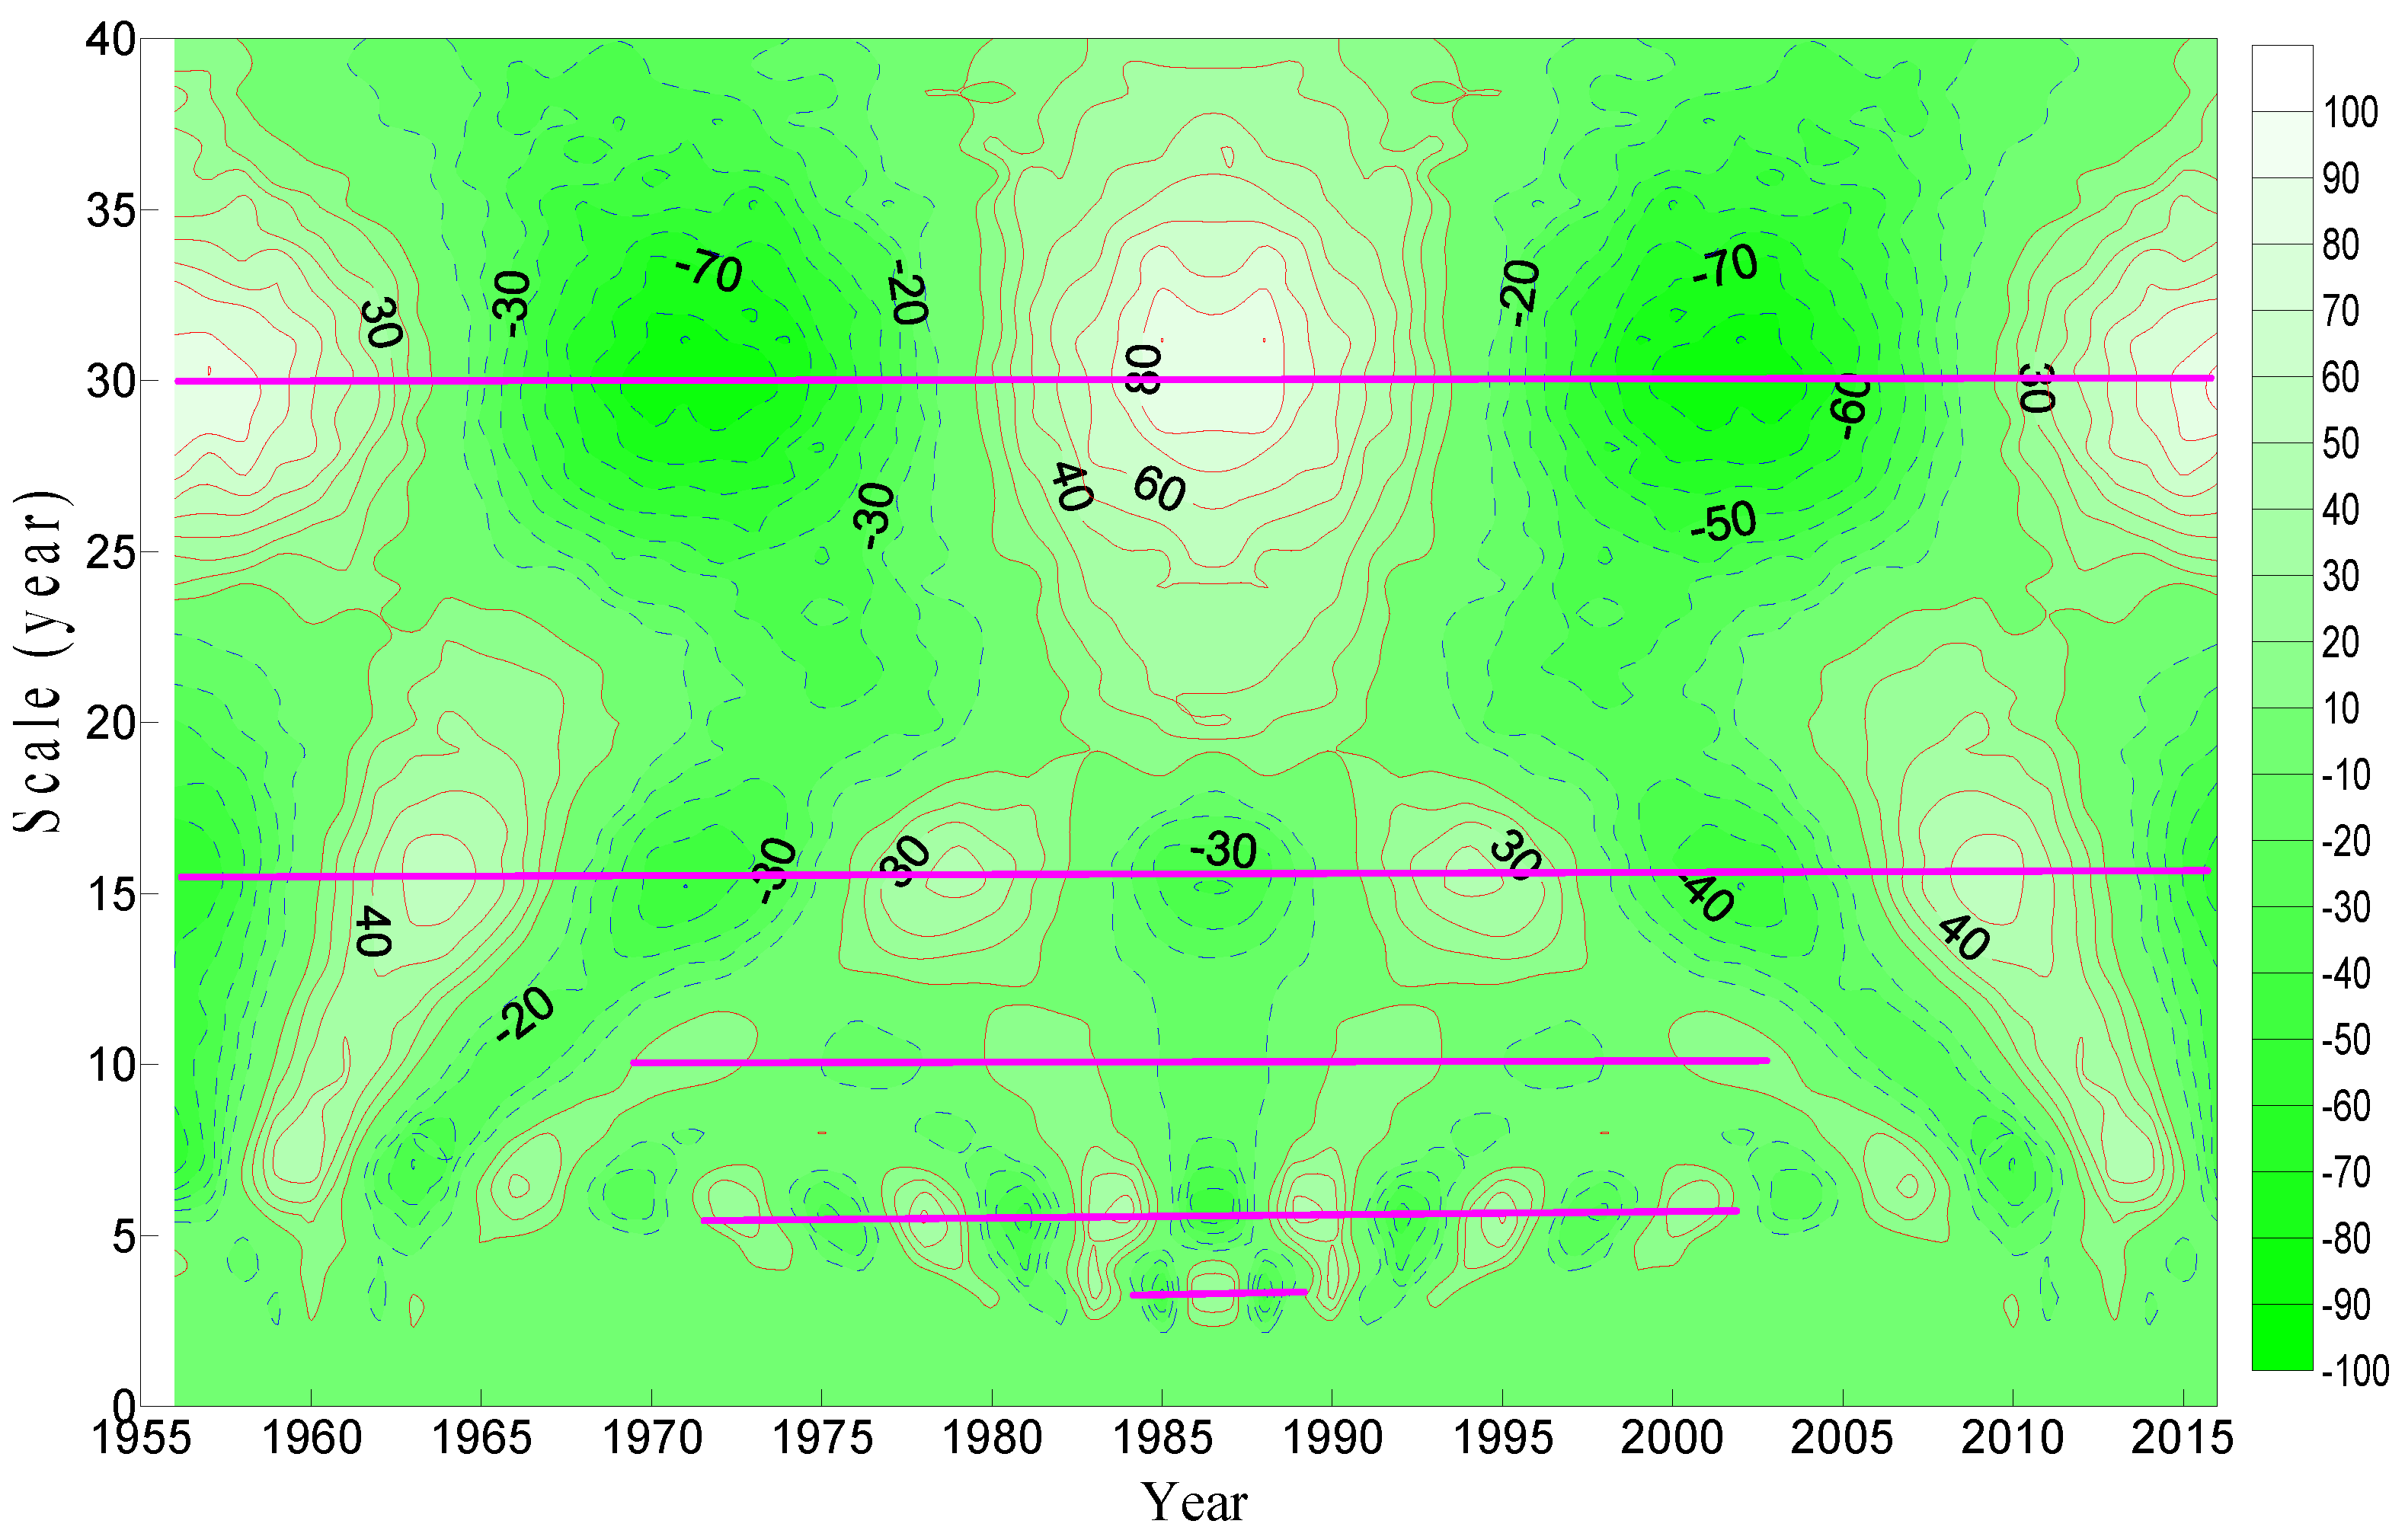
For Toudaoguai station (Figure 6), there are three time scale changes. Among them, the scales of 20–40 and 5–23 years are stable in the whole time domain. The former experienced 3 high water and 2 low water shocks, and the later underwent 4 high water and 5 low water shocks. The scale of 2–6 years is not stable and occurred during 1971–2002.
For Lijin station (Figure 7), we can clearly see the multi-time scale characteristics of flow evolution. Among them, the scale of 25–40 years was very stable. There were 3 high water and 2 low water oscillation periods in the whole time domain. The scale of 12–24 years was not stable. Different high-low water oscillations occurred in different time domains. The scale of 3–10 years occurred during 1964–2004. There were more cycle oscillations.
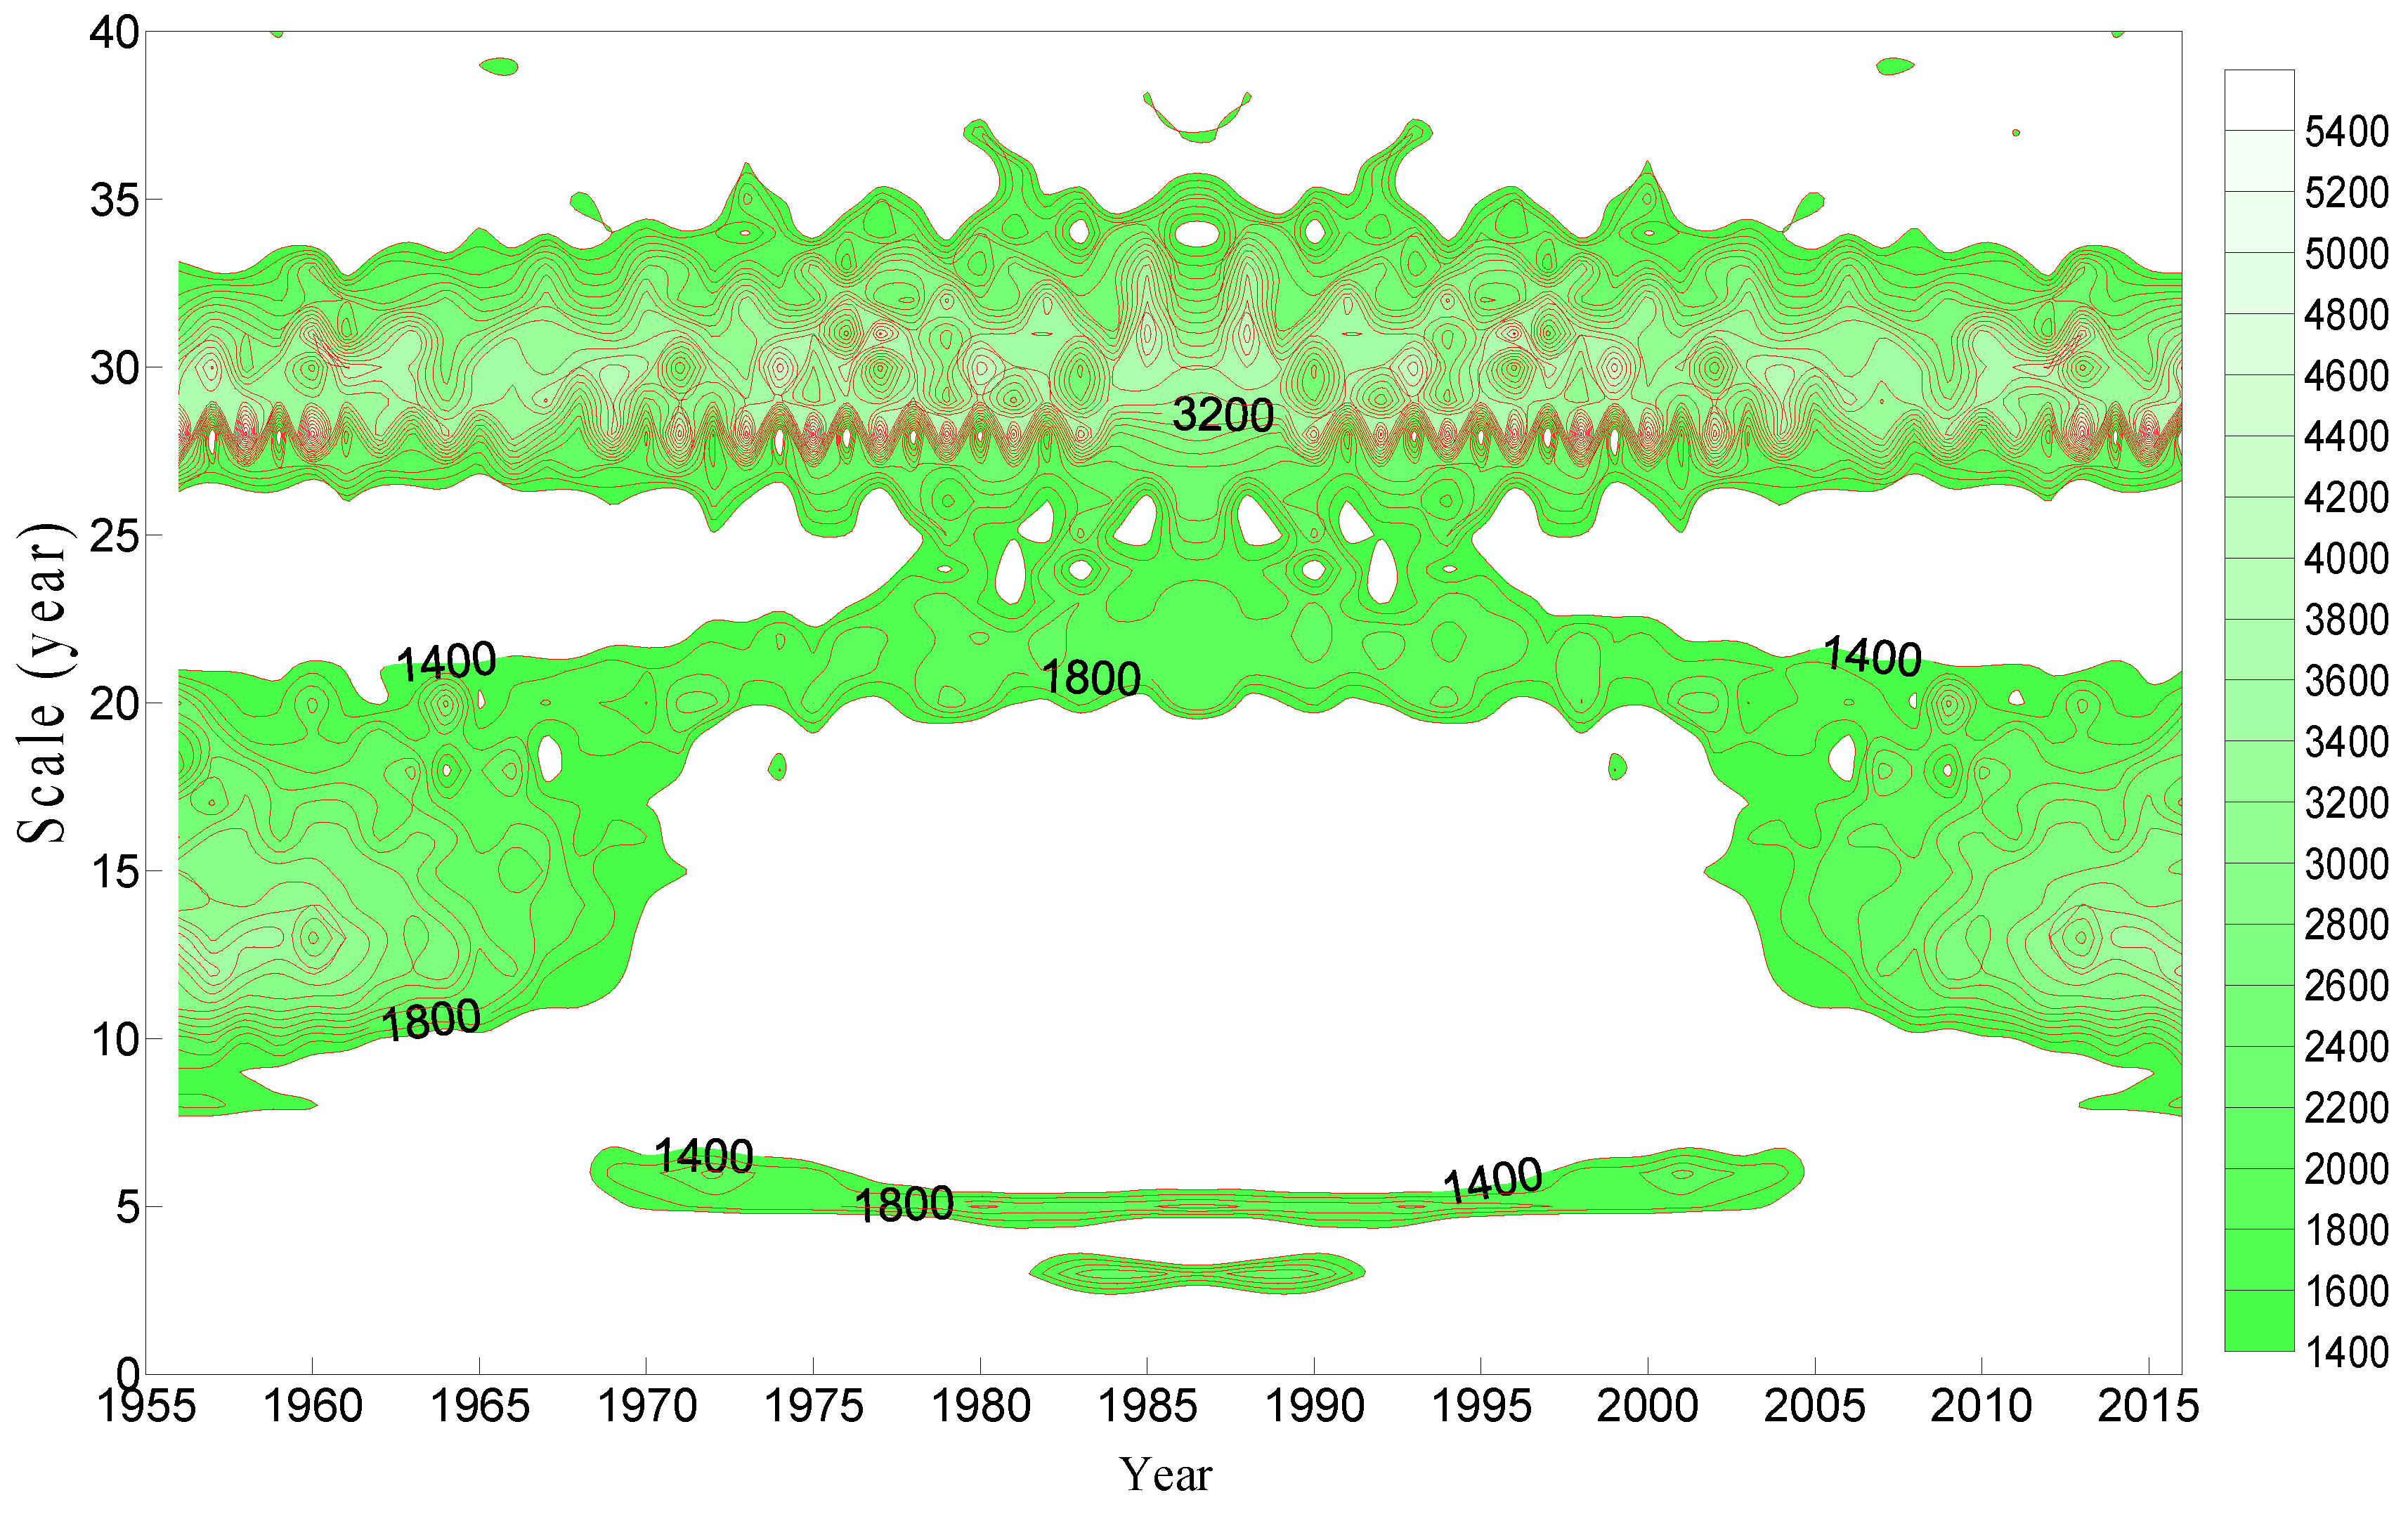
(2) Modulus square of wavelet coefficients
The modulus square of the wavelet coefficients represents the energy spectrum. It can reflect the energy variability in time scale. The higher the energy is, the stronger the periodic oscillation is.
In the wavelet modulus square contour map of Tangnaihai (Figure 8), the scale of 26–35 years has the strongest energy and shows the most significant period. The energy of the scale of 19–22 years is stronger, which occurred from 1970 to 2002. The energy of the scale of 9-21 years is weak, which is mainly concentrated in the two periods of 1956–1970 and 2004–2016. The energy of the scale of 2–7 years is weaker, which occurred mainly in the period 1968–2004.
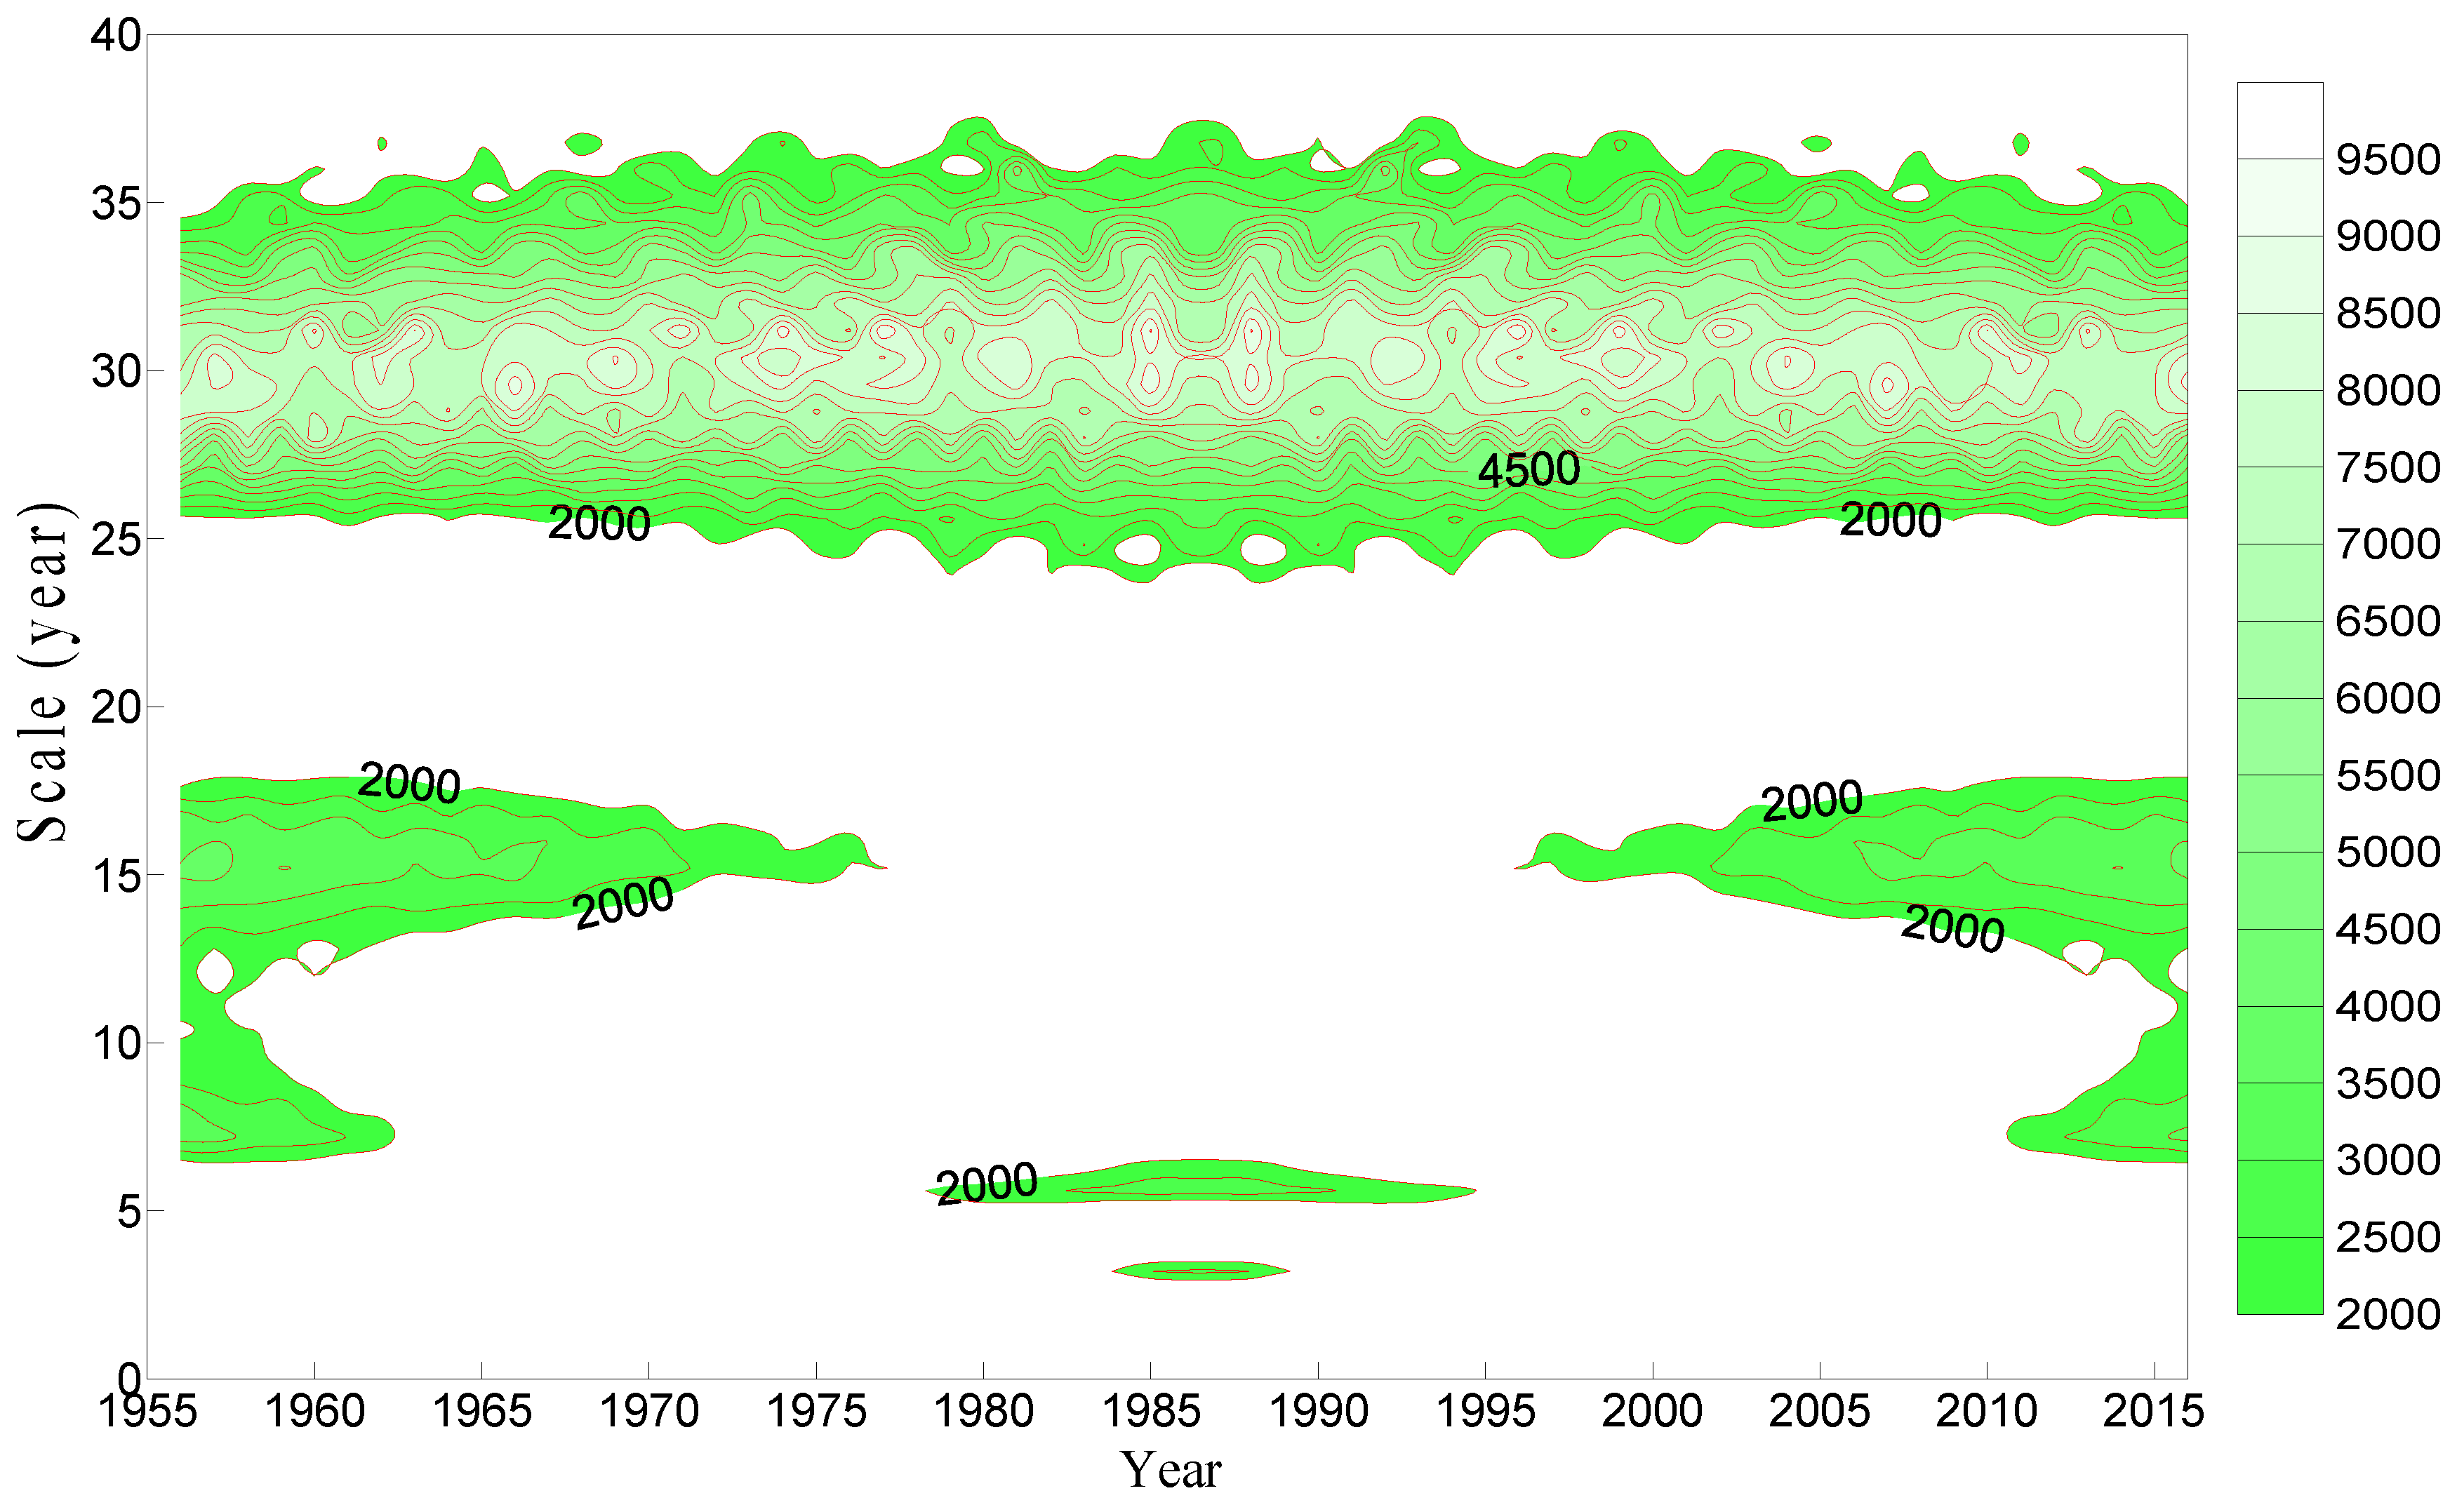
For Toudaoguai (Figure 9), the energy of the scale of 25–35 years is the strongest and the period is the most significant, which occurred in the whole time domain. However, the energy of the scales of 14–19 and 3–6 years is weak, and the periodic change is localized. The scale of 14–19 years is mainly focused from 1956 to 1976 and from 1995 to 2016. The scale of 3–6 years was mainly concentrated in the period from 1978 to 1995.
For Lijin (Figure 10), the energy of the scale of 26–36 years was the strongest and the periods are the most significant, which occurred in the whole time domain. In the scale of 14–22 years, the energy is stronger and the period is significant, which occurred for the whole period. On the scale 6–10 years, the energy is weak and the period is not significant, which is mainly concentrated in the periods from 1956 to 1973 and 2002 to 2016.
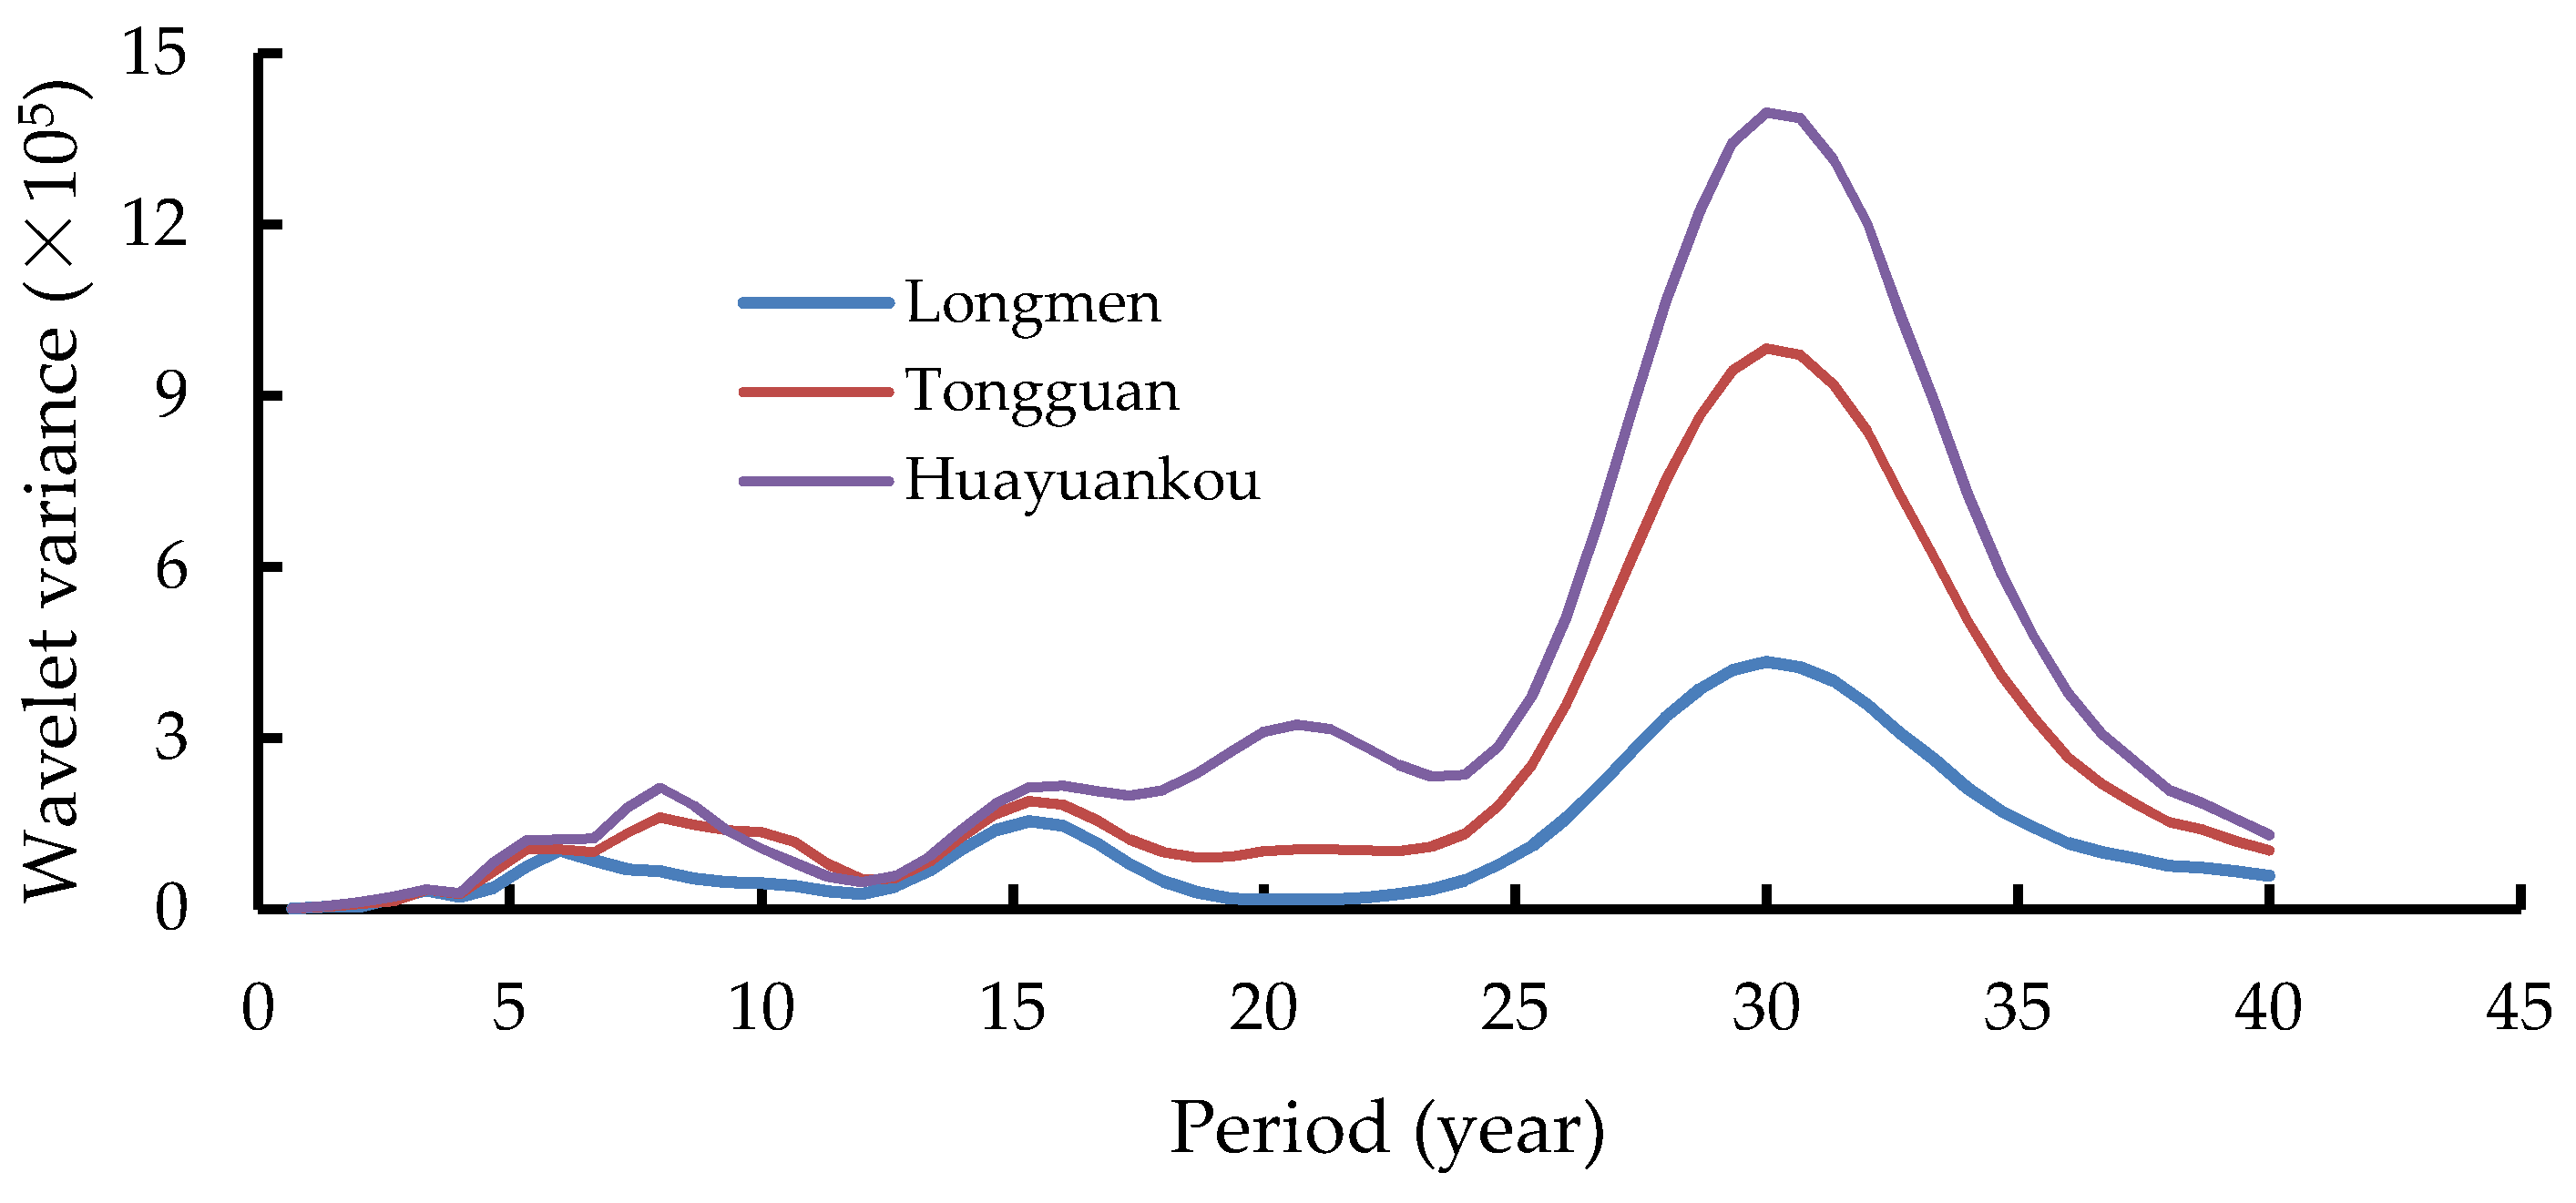
(3) Wavelet variance
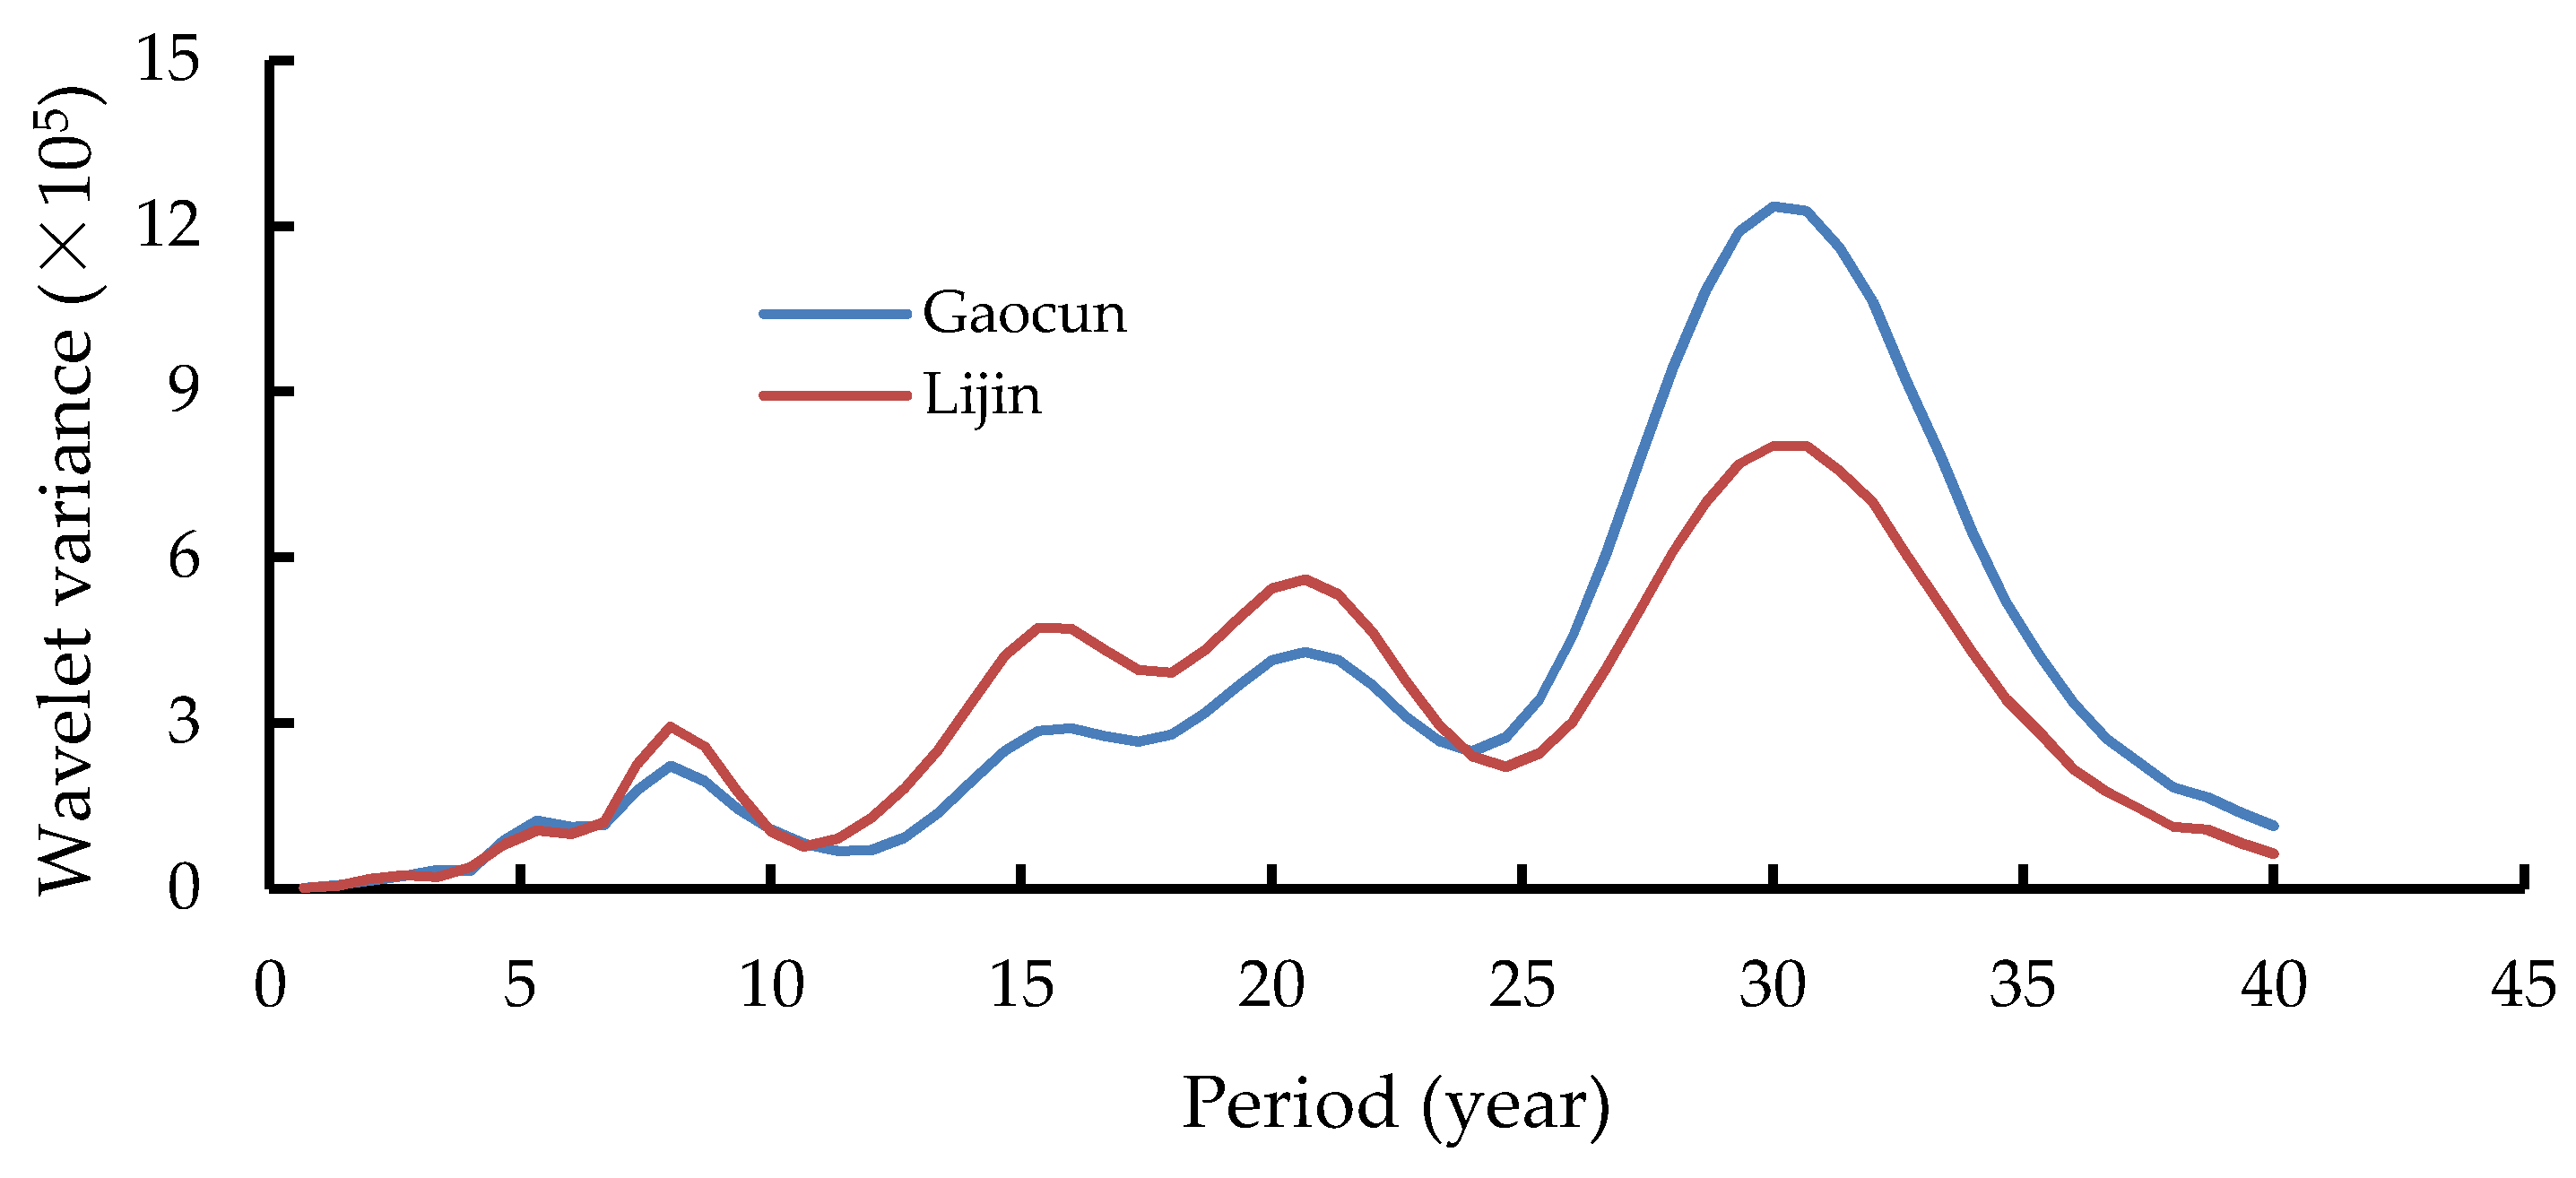
The wavelet square can reflect the distribution of fluctuation energy with scale in flow time series. It can be used to determine the main period of flow evolution.
As Figure 11, Figure 12 and Figure 13 show, the corresponding period of the maximum values of each station is 30 year, which indicates the oscillation in this period are very strong, and are the first main period of annual flow evolution in the Yellow River basin. The second main periods of Lanzhou, Xiaheyan, Toudaoguai, Longmen and Tongguan are 15.33 years. The second main periods of Tangnaihai, Huayuankou, Gaocun and Lijin are 20.67 years. The second main period of Shizuishan is 6 years. The third main periods of Tangnaihai, Shizuishan and Lijin are 15.33 years, and the third main periods of Xiaheyan, Toudaoguai and Longmen are 6 years. The third main periods of Huayuakou and Gaocun are 16 years. The third main period of Lanzhou is 20.67 years. The third main period of Tongguan is 8 years. The fourth main periods of Huayuankou, Gaocun and Lijn are 8 years. The fourth main periods of Xiaheyan, Toudaoguai and Tongguan are 20.67 years. The fourth main period of Tangnaihai is 5.33 years. The fourth main period of Lanzhou is 6.0 years. The fourth main period of Shizuishan is 10 years. The fourth main period of Longmen is 3.33 years.
5. Discussion
5.1. Analysis of Trend
The decrease in precipitation, incoming water from the upper reaches, regulation of large reservoirs, soil and water conservation measures as well as water consumption contribute most to the significant reduction of streamflow. These factors are discussed in the sections that follow.
5.1.1. Meteorological and Climatic Factors
Precipitation and evapotranspiration are the most important factors to affect runoff change [37,48]. Evaporation is affected by temperature changes.
In the upstream of Lanzhou region, the precipitation did not significantly increase or decrease since 1950. From Lanzhou to Toudaoguai, precipitation decrease is relatively obvious, but the section water supply accounts for only 1% of the total water in the main river. Thus, flow in the Yellow River upstream is not significantly affected by the interannual variability of precipitation in this region [38].
The annual air temperature has increased by 0.80 °C in the headwater catchment of the Yellow River basin during the past 42 years [43]. The loss of flow due to increasing temperature exceeded the slightly increased precipitation over the upper Basin [49]. Ref. [50] indicated that the variations of regional precipitation have a predominant effect on the flow variations.
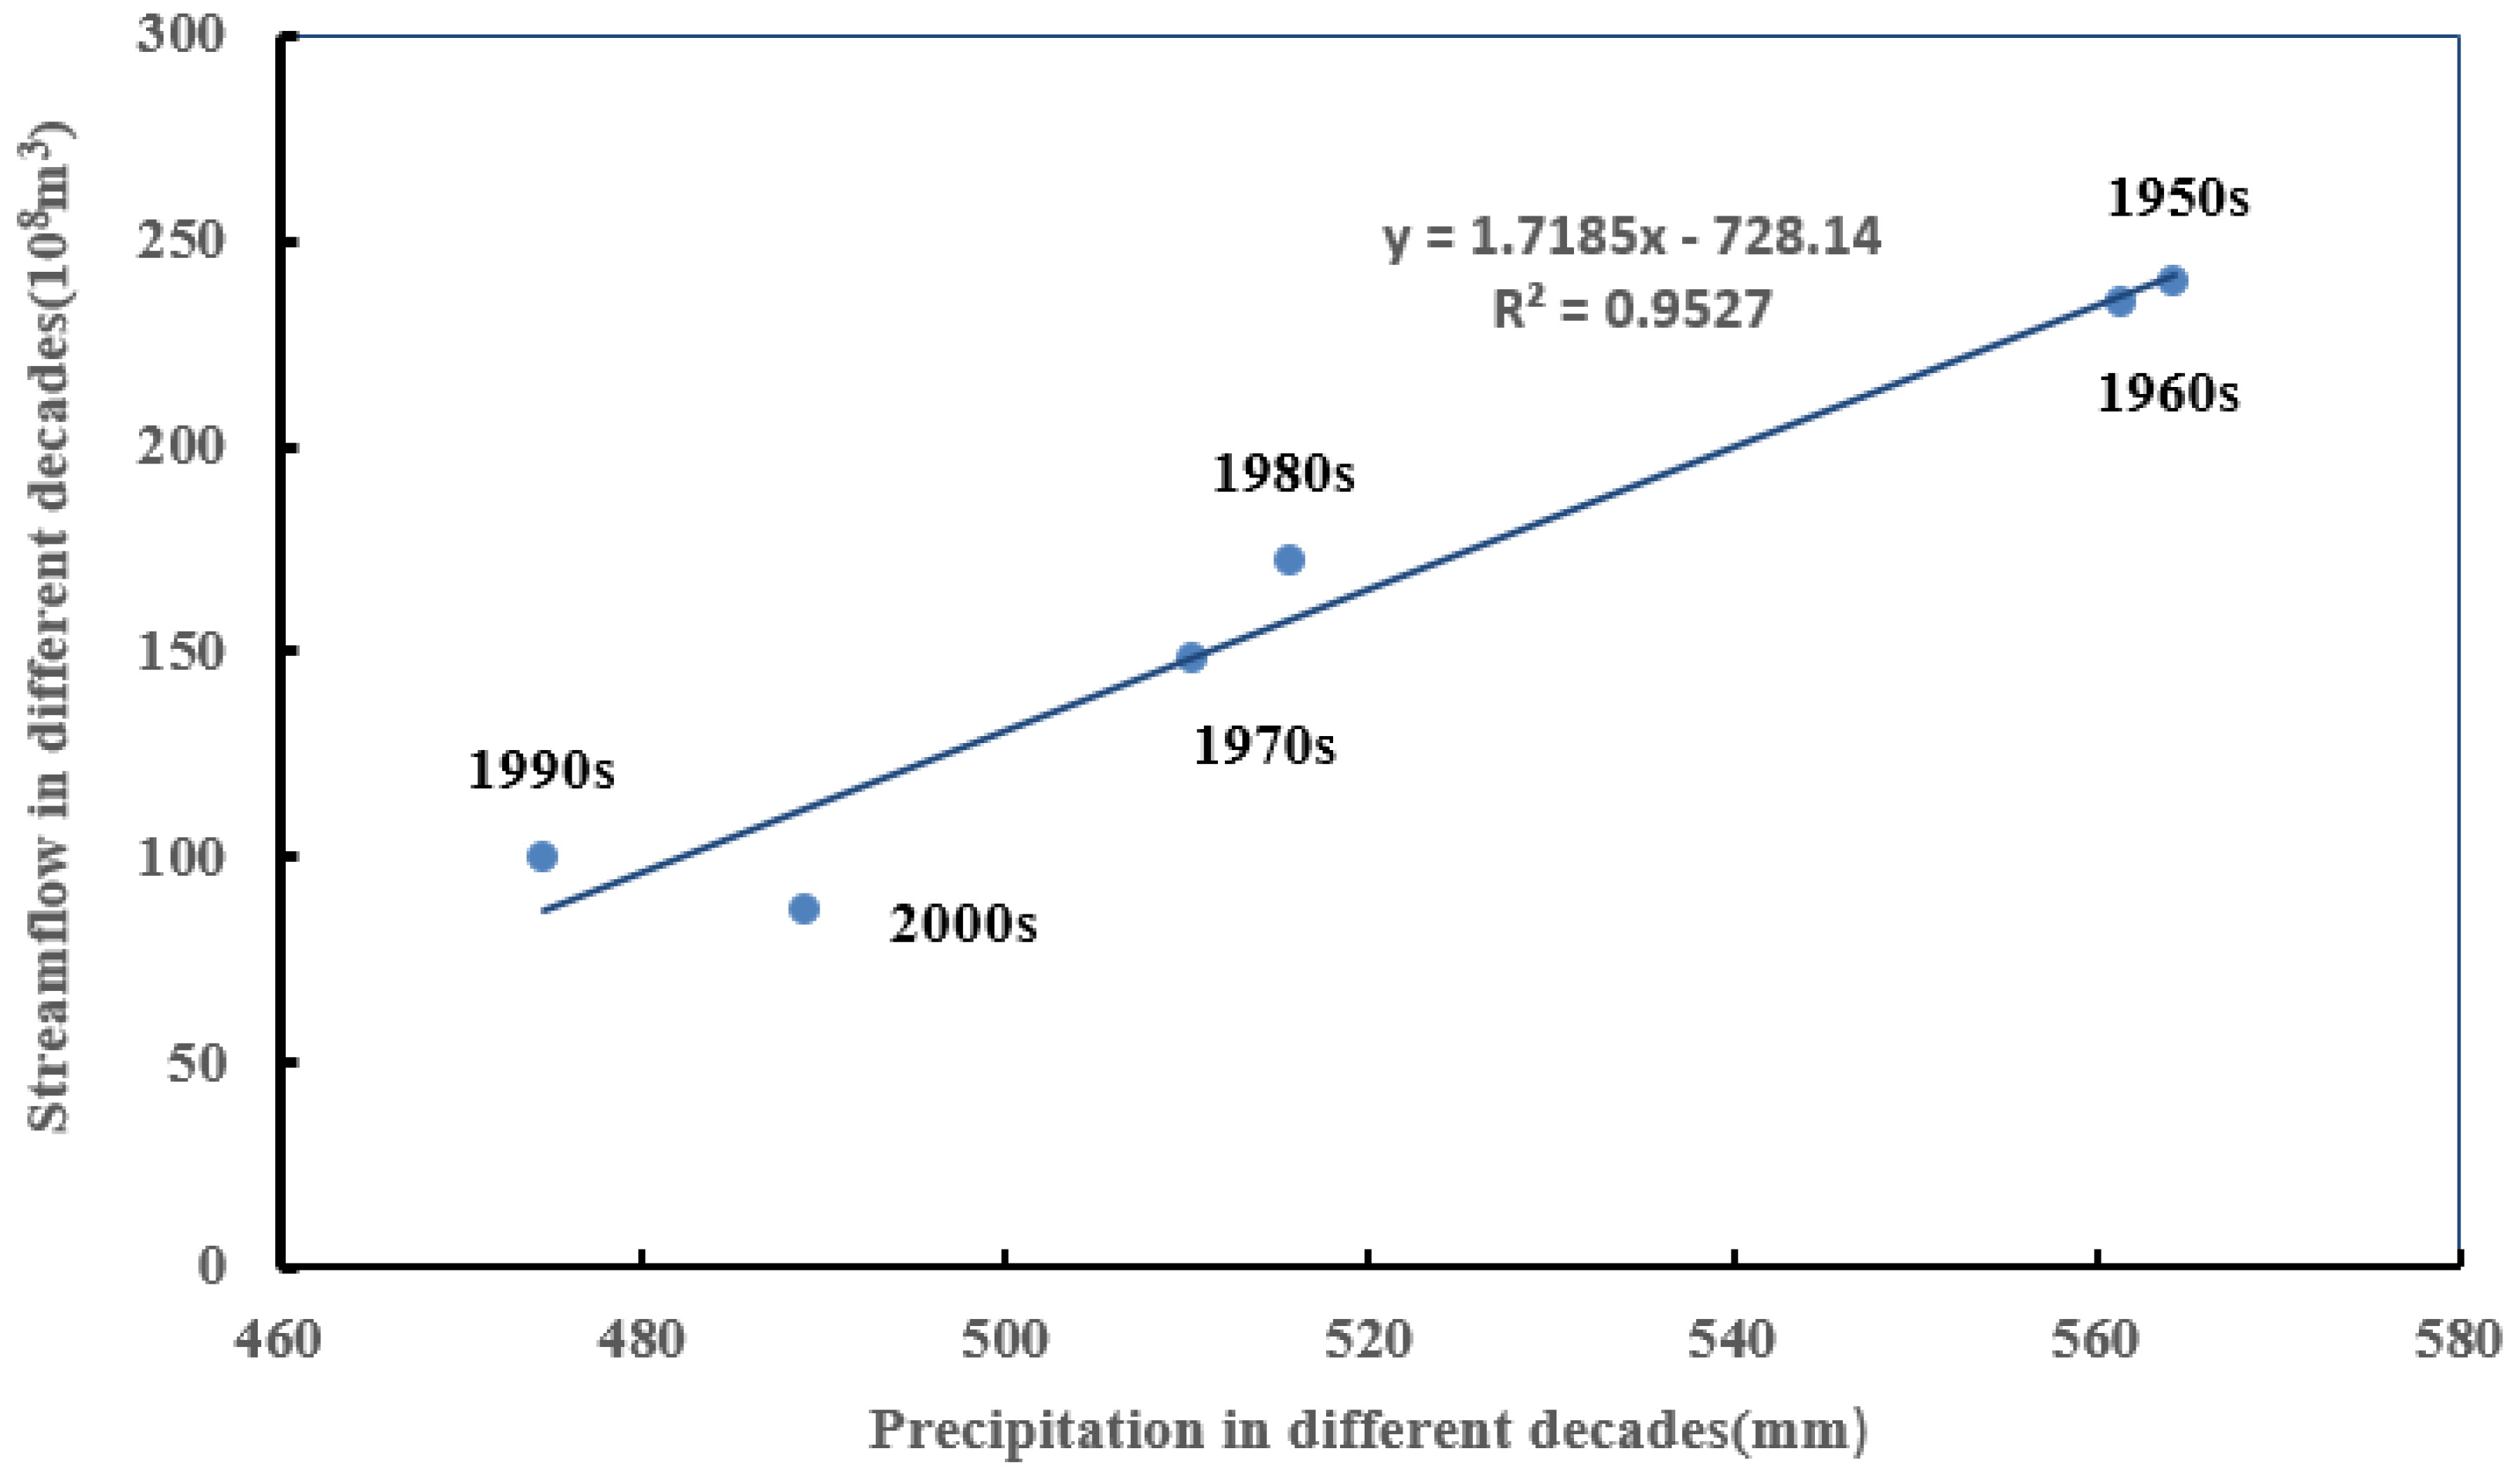
In the middle reaches of the Yellow River, the average annual rainfall decreased, with an average decrease rate of 28 mm/a [49]. Figure 14 shows correlation diagram of precipitation and streamflow in the middle of the Yellow River from 1950s to 2000s and data in the Figure were extracted from the Ref. [17]. Correlation coefficient of precipitation and streamflow is over 0.9 in the middle reaches of the Yellow River, which indicates that precipitation is an important factor influencing streamflow. The average annual temperature increases by 0.3 °C every ten years, and climate warming will increase potential evaporation and reduce runoff [51,52]. Strong evaporation and drought were exacerbated by the significant warming and precipitation reduction overall and led to severe water scarcity in the middle basin. Climate impacts on runoff in the lower basin of the Yellow River could be negligible because of its very small area [49].
5.1.2. Human activities
Among all anthropogenic activity factors, consumptions of agriculture and industry, dam construction and water conservation measures have had the greatest effect on the river’s hydrological cycle.
(1) Effect of consumption
With the rapid development of China’s national economy, especially after the 1980s, in the central and western regions, agricultural irrigation, industrial production and urban water demand for the Yellow River water resources grew rapidly. The annual diversion water from the Yellow River is about 6.401 billion m3, accounting for 38% of the water from the middle reaches of the Yellow River [17]. From the Figure 15, it may see that water diversion consumptions of the Upper region are the largest and the downstream region is the second largest. The middle stream region is the smallest in the 1998–2015 period. The trends of water diversion consumptions are increasing in the middle and downstream regions. According to the Yellow River conservancy commission (1998–2012), statistics show that agricultural irrigation water consumption is the largest; the second is industrial water, county livestock and fish farming, residents, and ecological water for the environment [53].
(2) Effect of reservoirs and dams
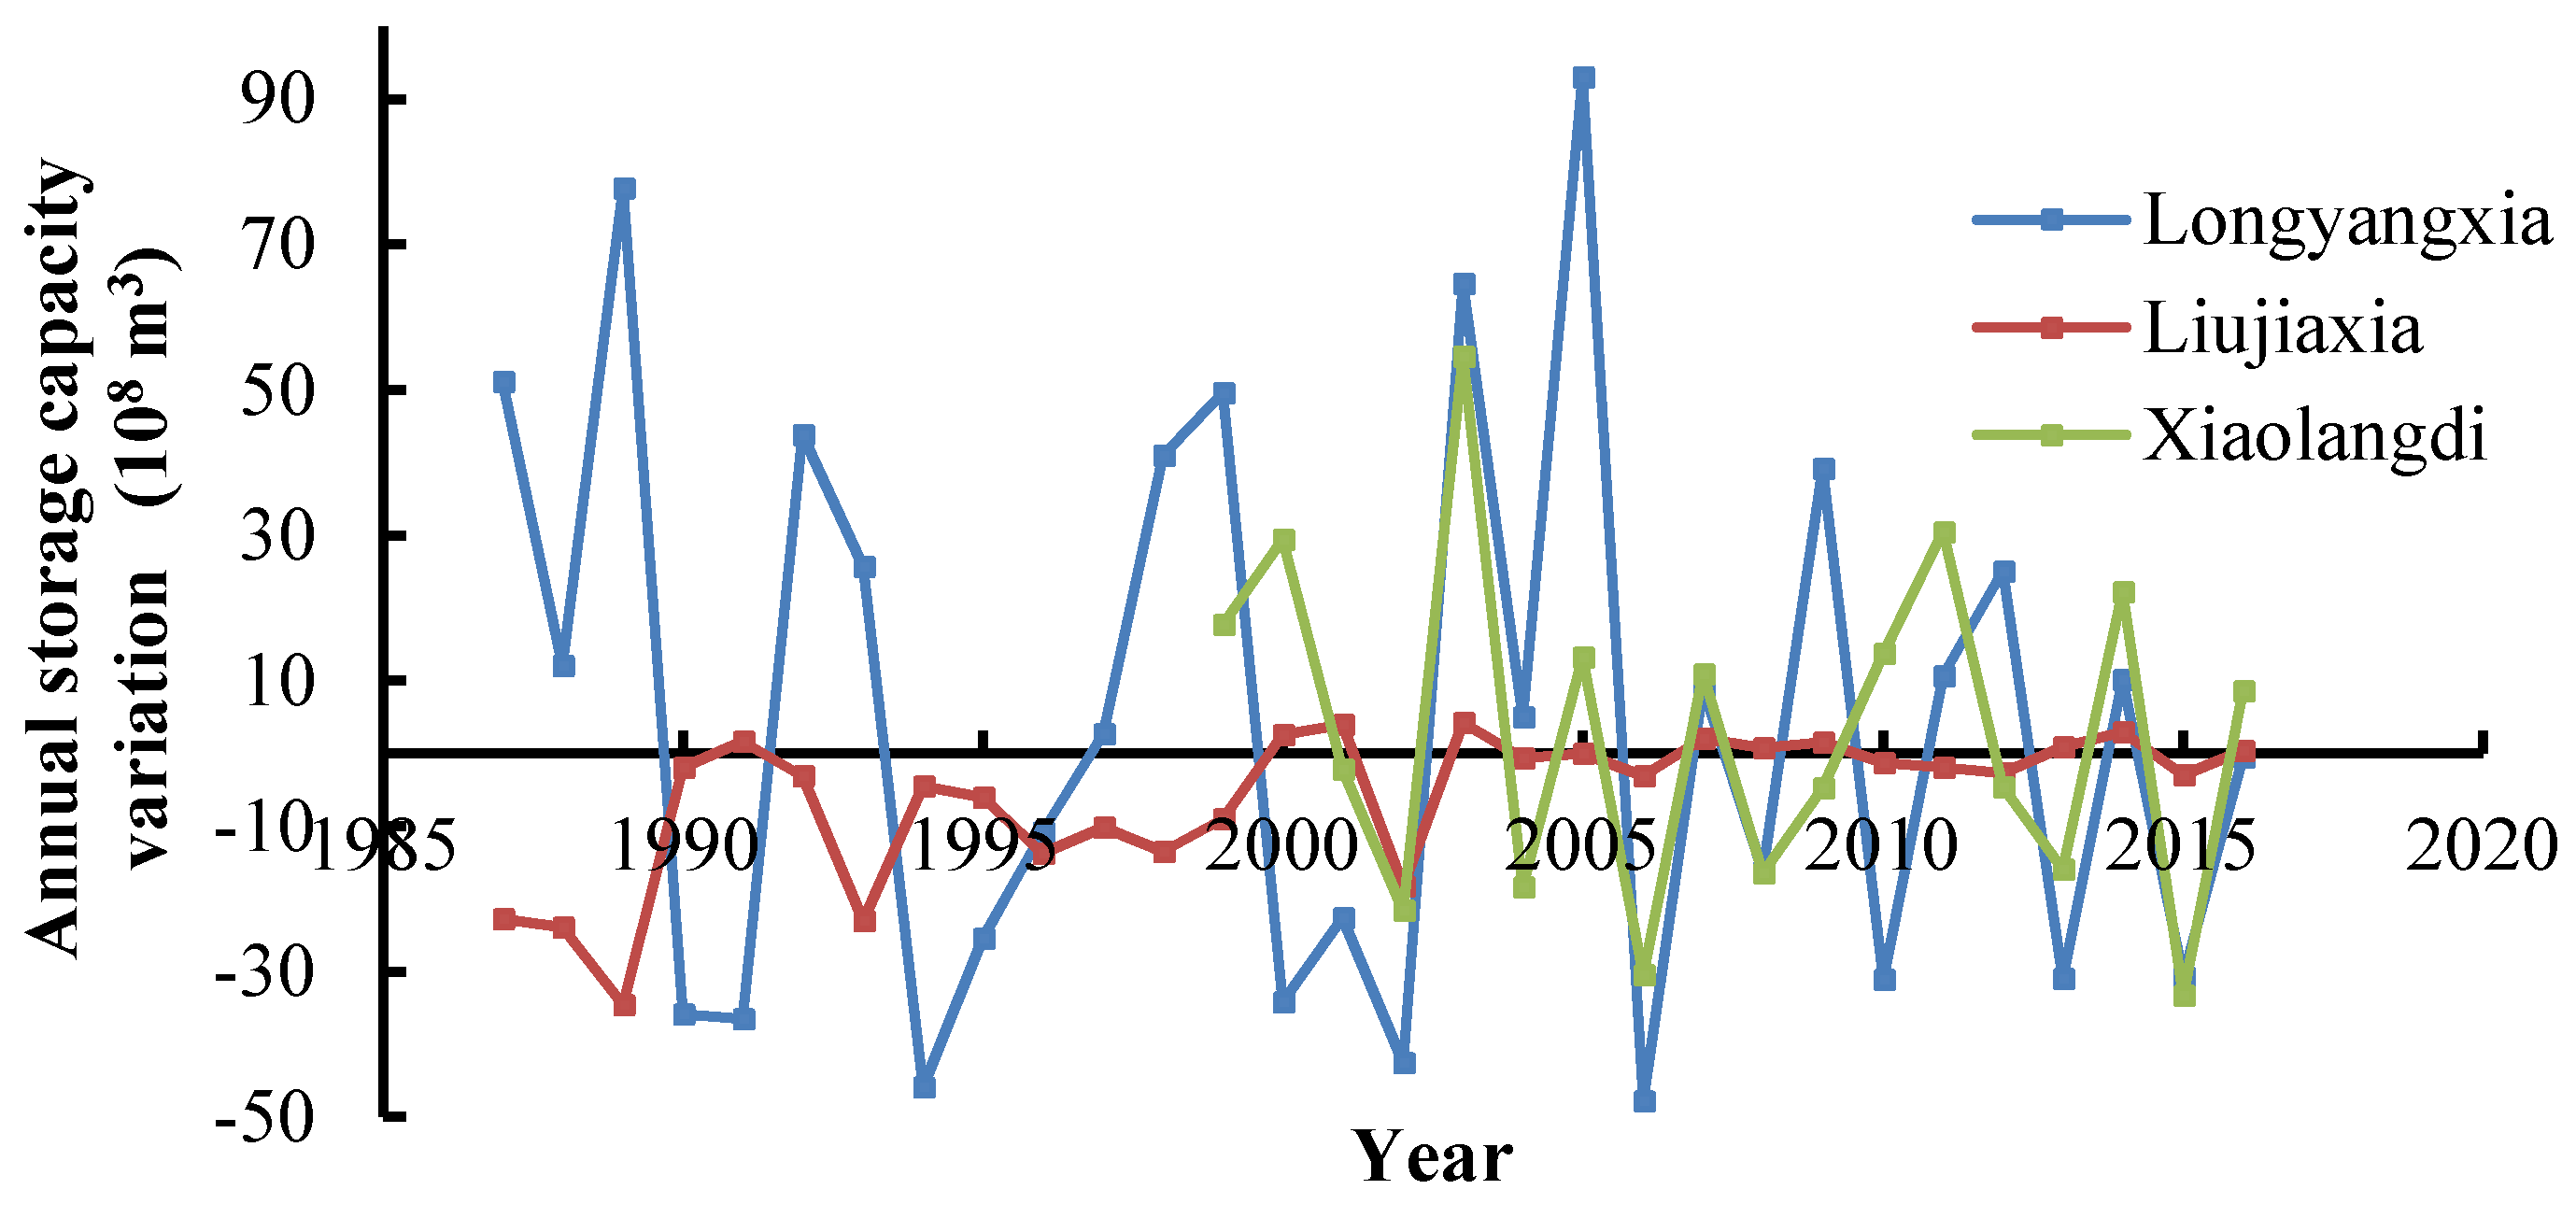
Among all human activities, the construction of dams and reservoirs is the most direct way to manipulate river water resources. To meet the demand of agricultural irrigation, as well as to prevent flooding, the natural seasonal distribution of water discharge was changed by dams and reservoirs [6]. Longyangxia reservoir has a regulated capacity of 19.36 billion m3, and a normal water level of 24.70 billion m3 [54]. The reservoir’s storage varies greatly from year to year, with a maximum annual water storage of 9.3 billion m3 (2005) and a minimum of 272 million m3 (Figure 16). The annual streamflows below Lanzhou are therefore greatly controlled by the Liujiaxia and Longyangxia reservoirs. Xiaolangdi reservoir in the middle reaches which was built in 1999 has influence on water resources of the lower reaches. The maximum annual water storage is 5.5 billion m3 (2003) (Figure 16). The evaporation and leakage losses from the reservoir were about 10.04 × 10⁸ m3/a, accounting for 6.08% of average annual streamflow in the MRYR basin [17].
(3) Effect of soil and water conservation
Since the 1950s, a number of soil conservation measures were implemented on the Loess Plateau, including terraces, check dams, reservoirs, afforestation and planting grass [11]. By the end of 2007, the preliminary area of soil and water conservation was 225.6 × 10⁹ m2, including 119.5 × 10⁹ m2 of forestation and 36.7 × 10⁹ m2 of land terracing [7]. These measures have significantly altered the hydrological regime of the river [53]. Ref. [17] concluded that streamflow reduction through soil and water conservation measures respectively 4.54 × 10⁸ m3/a, 5.70 × 10⁸ m3/a and 6.41 × 10⁸ m3/a in 1970–1979, 1980–1989 and 1990–1996 periods. Ref. [55] pointed out that water and soil conservation measures have become the main influencing factor for the dramatic reduction of water in the middle reaches.
5.2. Analysis of Change Point
The variation of flow occurred at the Tangnaihai mainly around 1989. In the headwaters of the Yellow River, abrupt changes occurred in the mid-1980s for temperature, in the late 1980s for precipitation and in the early 1980s for sunshine duration and pan evaporation [43].
For the other 9 stations, the variation points all were around 1985 in this study. However, in previous research, there are different abrupt points. In middle reaches of the Yellow River, Ref. [17] indicated that the abrupt decline in streamflow began in 1985. Ref. [19] concluded that the abrupt change of the water discharge from the late 1980s to the early 1990s arose from human extraction. Ref. [51] suggested that abrupt changes in streamflow at mainstream stations occurred when large reservoirs were built, which agrees with this study.
5.3. Analysis of Period
It is a very difficult to estimate periods in hydrologic series effectively [24]. Ref. [50] found that there are significant periods at scales of quasi-biannual, 4 years, 6–8 years, 12–14 years and above 20 years in both the flow and regional climate variations in the source region of the Yellow River. Ref. [33] studied the streamflow periodicity at the Guide station, and within a 52-year scale detected circa 8 years and 17 years periodicity for the observed streamflow. Some periods of this study are consistent with these studies.
For Toudaoguai station, the quantitative periodicity of the observed streamflow is located at circa 4, 8, and 18 years within the 52-year period. For the Huayuankou station in the observed streamflow, there are circa 3, 9 and 21 year periods within the 52 year period. The observed streamflows at the Lijin station had the same main periodicity of 3, 9, and 21 years for the observed streamflow [33]. Ref. [24] found that the periods of annual flow data at the Lijin hydrologic station are 18 years, 11 years and 3 years. In this paper, the main periodicities were 30, 21 and 16 years within the 56 year period.
Annual flow is an important index of a river, which may be affected by solar activities. The relationships between solar activities and the flow in the Yellow River are complicated [9]. The correlation between sunspot relative number and flow may be lower, because the flow progress is affected by factors such as precipitation, land cover and land use, soil, vegetation, and others besides solar activities. The climatic variability exists in all the data types and is partially coincident with known climate cycles such as the Pacific Decadal Oscillation and the EI Nino-Southern Oscillation [56]. Ref. [47] found that in the middle and lower reaches of the Yellow River, the cycle of precipitation is linked with El Nino events, Wolf Sun Spot Numbers and Pacific Decadal Oscillation (PDO). Ref. [12] didn’t detect periodicity from 1969 to 1973 and after 1986 in his study. He suggested this can be attributed to the intensive human activities in the upper and middle reaches of the Yellow River during the past six decades.
In summary, the effects of the aforementioned factors on flow periodicity are associated with a number of complex physical processes. More robust methods are thus desired to be advanced in the future studies.
6. Conclusions
First, the runoff trends of the upper, middle and lower stream along the Yellow River are decreasing. The reductions of annual runoff are more and more from the upstream to the downstream of the Yellow River since 1986. These changes are mainly influenced by human activities, especially water extraction and diversion and the operations of the large reservoirs. Second, the abrupt change points of the stations other than Tangnaihai happened in 1985 which is relative to the construction of the large reservoirs. Third, the flows along the Yellow River present characteristics of multiscale changes. At the large scale, the periodic changes were very stable for the whole period. At the small scale, the periodic changes were local and complicated. The first main period of runoff in the Yellow River is 30 years, and the second main period is 15 years in most of the upper and the middle reaches and 20.67 years in the lower reaches. Therefore, the water resources crisis in the Yellow River basin is very severe. In order to ensure sustainable use of the water resources of the Yellow River, some effective measures must be taken, such as further developing the scientific operations of reservoirs, reasonable allocation of water resources and implantation of necessary water-saving measures, especially in agriculture.
Author Contributions
X.W. designed the article structure and wrote the manuscript; B.E. initiated the idea of this review article and revised the manuscript; X.Y. provided important academic guidance; P.Y. contributed to the discussion of the results and to the analysis. All authors reviewed the manuscript.
Funding
This research is funded by the National Key R&D Program of China (2017YFC0405601), the National Scholarship Council and the Science Fund for Creative Research Groups of the National Natural Science Foundation of China (51621092).
Acknowledgments
We thank all the authors who contribute to this special issue. We thank the reviewers who contributed their expertise and time on reviewing those articles. Without their support, it would be impossible to assess properly those manuscripts submitted. We thank the Yellow River commission for providing valuable data.
Conflicts of Interest
The authors declare no conflict of interest.
References
- Miao, C.; Ni, J.; Borthwick, A.G.L.; Yang, L. A preliminary estimate of human and natural contributions to the changes in water discharge and sediment load in the Yellow River. Glob. Planet. Chang. 2011, 76, 196–205. [Google Scholar] [CrossRef] [Green Version]
- Guo, X.N.; Yu, C.S.; Zheng, C.Q.; Liu, L.L.; Song, M.H. Characteristic Analysis of Rainfall Variation in Zhuzhaoxin River Basin. Appl. Mech. Mater. 2013, 353–356, 1293–1296. [Google Scholar] [CrossRef]
- Lan, Y.; Zhao, G.; Zhang, Y.; Wen, J.; Liu, J.; Hu, X. Response of runoff in the source region of the Yellow River to climate warming. Quat. Int. 2010, 226, 60–65. [Google Scholar] [CrossRef]
- Rougé, C.; Ge, Y.; Cai, X. Detecting gradual and abrupt changes in hydrological records. Adv. Water Resourc. 2013, 53, 33–44. [Google Scholar] [CrossRef]
- Li, H.; Zhang, Q.; Singh, V.P.; Shi, P.; Sun, P. Hydrological effects of cropland and climatic changes in arid and semi-arid river basins: A case study from the Yellow River basin, China. J. Hydrol. 2017, 549, 547–557. [Google Scholar] [CrossRef]
- Wang, H.; Yang, Z.; Saito, Y.; Liu, J.P.; Sun, X. Interannual and seasonal variation of the Huanghe (Yellow River) water discharge over the past 50 years: Connections to impacts from ENSO events and dams. Glob. Planet. Chang. 2006, 50, 212–225. [Google Scholar] [CrossRef]
- Kong, D.; Miao, C.; Wu, J.; Duan, Q. Impact assessment of climate change and human activities on net runoff in the Yellow River Basin from 1951 to 2012. Ecol. Eng. 2016, 91, 566–573. [Google Scholar] [CrossRef]
- Meng, F.; Su, F.; Yang, D.; Tong, K.; Hao, Z. Impacts of recent climate change on the hydrology in the source region of the Yellow River basin. J. Hydrol. Reg. Stud. 2016, 6, 66–81. [Google Scholar] [CrossRef]
- Li, C.H.; Yang, Z.F.; Huang, G.H.; Li, Y.P. Identification of relationship between sunspots and natural runoff in the Yellow River based on discrete wavelet analysis. Expert Syst. Appl. 2009, 36, 3309–3318. [Google Scholar] [CrossRef]
- Zhu, Y.; Lin, Z.; Wang, J.; Zhao, Y.; He, F. Impacts of Climate Changes on Water Resources in Yellow River Basin, China. Procedia Eng. 2016, 154, 687–695. [Google Scholar] [CrossRef]
- Wei, Y.; Jiao, J.; Zhao, G.; Zhao, H.; He, Z.; Mu, X. Spatial–temporal variation and periodic change in streamflow and suspended sediment discharge along the mainstream of the Yellow River during 1950–2013. Catena 2016, 140, 105–115. [Google Scholar] [CrossRef]
- Zhao, G.; Mu, X.; Strehmel, A.; Tian, P. Temporal variation of streamflow, sediment load and their relationship in the Yellow River basin, China. PLoS ONE 2014, 9, e91408. [Google Scholar] [CrossRef] [PubMed]
- Liu, C.M.; Zhang, X.C. Causal analysis on actual water flow reduction in the mainstream of the Yellow River. Acta Geogr. Sin. 2004, 59, 323–330. [Google Scholar]
- Zheng, H.X.; Zhang, L.; Zhu, R.R.; Liu, C.M.; Sato, Y.; Fukushima, Y. Responses of streamflow to climate and land surface change in the headwaters of the Yellow River Basin. Water Resour. Res. 2009, 45, W00A19. [Google Scholar] [CrossRef]
- Shi, C.; Zhou, Y.; Fan, X.; Shao, W. A study on the annual runoff change and its relationship with water and soil conservation practices and climate change in the middle Yellow River basin. Catena 2013, 100, 31–41. [Google Scholar] [CrossRef]
- Wang, S.; Yan, M.; Yan, Y.; Shi, C.; He, L. Contributions of climate change and human activities to the changes in runoff increment in different sections of the Yellow River. Quat. Int. 2012, 282, 66–77. [Google Scholar] [CrossRef]
- Gao, P.; Mu, X.M.; Wang, F.; Li, R. Changes in streamflow and sediment discharge and the response to human activities in the middle reaches of the Yellow River. Hydrol. Earth Syst. Sci. 2011, 15, 1–10. [Google Scholar] [CrossRef] [Green Version]
- Zhang, Q.; Xu, C.-Y.; Yang, T. Variability of Water Resource in the Yellow River Basin of Past 50 Years, China. Water Resour. Manag. 2008, 23, 1157–1170. [Google Scholar] [CrossRef]
- Miao, C.; Ni, J.; Borthwick, A.G.L. Recent changes of water discharge and sediment load in the Yellow River basin, China. Prog. Phys. Geogr. 2010, 34, 541–561. [Google Scholar] [CrossRef] [Green Version]
- Xu, J. The water fluxes of the Yellow River to the sea in the past 50 years, in response to climate change and human activities. Environ. Manag. 2005, 35, 620–631. [Google Scholar] [CrossRef]
- Wang, S.; Fu, B.; Liang, W.; Liu, Y.; Wang, Y. Driving forces of changes in the water and sediment relationship in the Yellow River. Sci. Total Environ. 2017, 576, 453–461. [Google Scholar] [CrossRef] [PubMed]
- Fan, X.; Shi, C.; Shao, W.; Zhou, Y. The suspended sediment dynamics in the Inner-Mongolia reaches of the upper Yellow River. Catena 2013, 109, 72–82. [Google Scholar] [CrossRef]
- Peng, J.; Chen, S.; Dong, P. Temporal variation of sediment load in the Yellow River basin, China, and its impacts on the lower reaches and the river delta. Catena 2010, 83, 135–147. [Google Scholar] [CrossRef]
- Sang, Y.-F.; Wang, D. New Method for Estimating Periods in Hydrologic Series Data. In Proceedings of the 2008 Fifth International Conference on Fuzzy Systems and Knowledge Discovery, Shandong, China, 18–20 October 2008; pp. 645–649. [Google Scholar] [CrossRef]
- Yue, S.; Pilon, P.; Cavadias, G. Power of the Mann-Kendall and Spearman’s rho tests for detecting monotonic trends in hydrological series. J. Hydrol. 2002, 259, 254–271. [Google Scholar] [CrossRef]
- Ishak, E.H.; Rahman, A.; Westra, S.; Sharma, A.; Kuczera, G. Evaluating the non-stationarity of Australian annual maximum flood. J. Hydrol. 2013, 494, 134–145. [Google Scholar] [CrossRef]
- Önöz, B.; Bayazit, M. Block bootstrap for Mann-Kendall trend test of serially dependent data. Hydrol. Process. 2012, 26, 3552–3560. [Google Scholar] [CrossRef]
- Yue, S.; Wang, C. The mann-kendall test modified by effective sample size to detect trend in serially correlated hydrological series. Water Resour. Manag. 2004, 18, 201–218. [Google Scholar] [CrossRef]
- Kahya, E.; Kalaycı, S. Trend analysis of streamflow in Turkey. J. Hydrol. 2004, 289, 128–144. [Google Scholar] [CrossRef]
- Sang, Y.-F.; Wang, D.; Wu, J.-C.; Zhu, Q.-P.; Wang, L. The relation between periods’ identification and noises in hydrologic series data. J. Hydrol. 2009, 368, 165–177. [Google Scholar] [CrossRef]
- Padmanabhan, G. Maximum entropy spectral analysis of hydrologic data. Water Resour. Res. 1988, 24, 1519–1533. [Google Scholar] [CrossRef]
- Sang, Y.-F.; Wang, Z.; Liu, C. Period identification in hydrologic time series using empirical mode decomposition and maximum entropy spectral analysis. J. Hydrol. 2012, 424–425, 154–164. [Google Scholar] [CrossRef]
- He, B.; Miao, C.; Shi, W. Trend, abrupt change, and periodicity of streamflow in the mainstream of Yellow River. Environ. Monit. Assess. 2013, 185, 6187–6199. [Google Scholar] [CrossRef] [PubMed]
- Sonali, P.; Nagesh Kumar, D. Review of trend detection methods and their application to detect temperature changes in India. J. Hydrol. 2013, 476, 212–227. [Google Scholar] [CrossRef]
- Sharma, C.S.; Panda, S.N.; Pradhan, R.P.; Singh, A.; Kawamura, A. Precipitation and temperature changes in eastern India by multiple trend detection methods. Atmos. Res. 2016, 180, 211–225. [Google Scholar] [CrossRef]
- Onyutha, C.; Tabari, H.; Taye, M.T.; Nyandwaro, G.N.; Willems, P. Analyses of rainfall trends in the Nile River Basin. J. Hydro-Environ. Res. 2016, 13, 36–51. [Google Scholar] [CrossRef]
- Pandey, B.K.; Khare, D. Identification of trend in long term precipitation and reference evapotranspiration over Narmada river basin (India). Glob. Planet. Chang. 2018, 161, 172–182. [Google Scholar] [CrossRef]
- Ran, D.; Yao, W.; Jiao, P. Identification and comprehensive diagnosis of sharp change of annual runoff volume and silt discharge series at Toudaoguai Hydrometric station in the upper reaches of the Yellow River. Arid Zone Res. 2014, 31, 928–936. [Google Scholar]
- Gauthier, T. Detecting Trends Using Spearman’s Rank Correlation Coefficient. Environ. Forensics 2001, 2, 359–362. [Google Scholar] [CrossRef]
- Shadmani, M.; Marofi, S.; Roknian, M. Trend Analysis in Reference Evapotranspiration Using Mann-Kendall and Spearman’s Rho Tests in Arid Regions of Iran. Water Resour. Manag. 2011, 26, 211–224. [Google Scholar] [CrossRef] [Green Version]
- Carrie Morrill, J.T.O.; Julia, E.C. A synthesis of abrupt changes in the Asian summer monsoon since the last deglaciation. Holocene 2003, 13, 465–476. [Google Scholar] [CrossRef]
- Zhao, F.; Xu, Z.; Huang, J. Long-term trend and abrupt change for major climate variables in the upper Yellow River Basin. Acta Meteorol. Sin. 2007, 21, 204–214. [Google Scholar]
- Zhao, F.F.; Xu, Z.X.; Huang, J.X.; Li, J.Y. Monotonic trend and abrupt changes for major climate variables in the headwater catchment of the Yellow River basin. Hydrol. Process. 2008, 22, 4587–4599. [Google Scholar] [CrossRef]
- Wu, X.; Li, H.; Sun, Z.; Dong, Y. Analysis and Diagnosis of changes in Annual Runoff in Kuye River Valley in North Shanxi. J. Ecol. Rural Environ. 2016, 32, 558–562. [Google Scholar]
- Meddi, H. Annual Variability of Precipitation of the North West of Algeria. APCBEE Procedia 2013, 5, 373–377. [Google Scholar] [CrossRef]
- Servat, E.; Paturel, J.E.; Lubès, H.; Kouamé, B.; Ouedraogo, M.; Massonc, J.M. Climatic variability in humid Africa along the Gulf of Guinea Part I dtailed analysis of the phenomenon in cote dIvoire. J. Hydrol. 1997, 191, 1–15. [Google Scholar] [CrossRef]
- Hao, Z.; Zheng, J.; Ge, Q. Precipitation cycles in the Middle and Lower Yellow River. Acta Meteorol. Sin. 2007, 62, 537–544. [Google Scholar]
- Liu, Q.; Yang, Z.; Cui, B. Spatial and temporal variability of annual precipitation during 1961–2006 in Yellow River Basin, China. J. Hydrol. 2008, 361, 330–338. [Google Scholar] [CrossRef]
- Tian, Q.; Prange, M.; Merkel, U. Precipitation and temperature changes in the major Chinese river basins during 1957–2013 and links to sea surface temperature. J. Hydrol. 2016, 536, 208–221. [Google Scholar] [CrossRef]
- Sun, W.; Cheng, B.; Li, R. Climate Variations in the Source Region of the Yellow River. Acta Meteorol. Sin. 2009, 64, 117–127. [Google Scholar]
- Zhang, X.P.; Zhang, L.; McVicar, T.R.; Van Niel, T.G.; Li, L.T.; Li, R.; Yang, Q.; Wei, L. Modelling the impact of afforestation on average annual streamflow in the Loess Plateau, China. Hydrol. Process. 2008, 22, 1996–2004. [Google Scholar] [CrossRef]
- Wang, D.; Hagen, S.C.; Alizad, K. Climate change impact and uncertainty analysis of extreme rainfall events in the Apalachicola River basin, Florida. J. Hydrol. 2013, 480, 125–135. [Google Scholar] [CrossRef]
- Zhao, G.; Tian, P.; Mu, X.; Jiao, J.; Wang, F.; Gao, P. Quantifying the impact of climate variability and human activities on streamflow in the middle reaches of the Yellow River basin, China. J. Hydrol. 2014, 519, 387–398. [Google Scholar] [CrossRef]
- Yao, W.; Hou, S.; Ding, Y. Effects on flow and sediment in the upper Yellow River by operation of Longyangxia Reservoirs and Liujiaxia Reservoir. Adv. Water Sci. 2017, 28, 1–13. [Google Scholar]
- Zhao, Y.; Mu, X.; He, Y.; Xiao, C. Relationship between runoff and sediment discharge in the main channel of Yellow River from 1959 to 2011. J. Sediment Res. 2014, 31–37. [Google Scholar] [CrossRef]
- Hanson, R.T.; Newhouse, M.W.; Dettinger, M.D. A methodology to assess relations between climatic variability and variations in hydrologic time series in the southwestern United States. J. Hydrol. 2004, 287, 252–269. [Google Scholar] [CrossRef]
Figure 1.
Location of the Yellow River basin, 10 hydrological stations and large reservoirs.

Figure 2.
Variation trend of annual streamflow of the upper reaches in the Yellow River.

Figure 3.
Variation trend of annual streamflow of the middle reaches in the Yellow River.

Figure 4.
Variation trend of annual streamflow of the lower reaches in the Yellow River.

Figure 5.
Real part coefficients contour map of streamflow at Tangnaihai station.

Figure 6.
Real part coefficients contour map of streamflow at Toudauguai station.

Figure 7.
Real part coefficients contour map of streamflow at Lijin station.

Figure 8.
Modulus square of wavelet coefficient contour map of streamflow at Tangnaihai station.

Figure 9.
Modulus square of wavelet coefficient contour map of streamflow at Toudaoguai station.

Figure 10.
Modulus square of wavelet coefficient contour map of streamflow at Lijin station.

Figure 11.
Wavelet variances of streamflows at Tangnaihai, Lanzhou, Xiaheyan, Shizuishan and Toudauguai in the upstream reaches.
Figure 11.
Wavelet variances of streamflows at Tangnaihai, Lanzhou, Xiaheyan, Shizuishan and Toudauguai in the upstream reaches.

Figure 12.
Wavelet variances of streamflows at Longmen, Tongguan and Huayuankou in the middle reaches.
Figure 12.
Wavelet variances of streamflows at Longmen, Tongguan and Huayuankou in the middle reaches.

Figure 13.
Wavelet variances of streamflows at Gaocun and Lijin in the downstream reaches.

Figure 14.
Correlation diagram of precipitation and streamflow in the middle of the Yellow River from 1950s to 2000s.
Figure 14.
Correlation diagram of precipitation and streamflow in the middle of the Yellow River from 1950s to 2000s.

Figure 15.
Variations of water diversion consumes at the upper, middle and lower of along the Yellow River.
Figure 15.
Variations of water diversion consumes at the upper, middle and lower of along the Yellow River.

Figure 16.
Variations of annual storage capacity of Longyangxia, Liujiaxia and Xiaolangdi reservoirs along the Yellow River.
Figure 16.
Variations of annual storage capacity of Longyangxia, Liujiaxia and Xiaolangdi reservoirs along the Yellow River.


Table 1.
Data information of ten hydrological stations along the Yellow River.
| Station Names | Area (km2) | Longitude | Latitude | Series Length | Time Interval |
|---|---|---|---|---|---|
| Tangnaihai | 121,972 | 100°09′ | 35°30′ | 1956–1987 | Daily |
| 1986–2016 | Yearly | ||||
| Lanzhou | 222,551 | 103°49′ | 36°04′ | 1956–1987 | Daily |
| 1986–2016 | Yearly | ||||
| Xiaheyan | 254,142 | 105°03′ | 37°27′ | 1956–1988 | Daily |
| 1986–2016 | Yearly | ||||
| Shizuishan | 309,146 | 106°47′ | 39°15′ | 1956–1988 | Daily |
| 1986–2016 | Yearly | ||||
| Toudaoguai | 367,898 | 110°02′ | 40°27′ | 1956–2006 | Daily |
| 1998–2016 | Yearly | ||||
| Longmen | 497,552 | 110°35′ | 35°40′ | 1956–2005 | Daily |
| 1998–2016 | Yearly | ||||
| Tongguan | 682,144 | 110°18′ | 34°36′ | 1956–2005 | Daily |
| 1998–2016 | Yearly | ||||
| Huayuankou | 730,000 | 113°39′ | 34°55′ | 1956–2012 | Daily |
| 1998–2016 | Yearly | ||||
| Gaocun | 734,146 | 115°05′ | 35°23′ | 1956–2009 | Daily |
| 1998–2016 | Yearly | ||||
| Lijin | 751,900 | 118°18′ | 37°31′ | 1950–2014 | Daily |
| 1998–2016 | Yearly |
The location of the stations can be referred to Figure 1.
Table 2.
Trends of annual streamflow of ten stations along the Yellow River from 1956 to 2016.
| Station Name | Trend | Abrupt Change Point | |||
|---|---|---|---|---|---|
| Tangnaihai | −1.64 | −0.99 | −1.05 | Decreasing | 1989 |
| Lanzhou | −2.49 | −1.82 | −1.89 | Decreasing | 1985 |
| Xiaheyan | −2.89 | −2.36 | −2.6 | Decreasing | 1985 |
| Shizuishan | −3.64 | −3.21 | −3.6 | Decreasing | 1985 |
| Toudaoguai | −3.99 | −3.63 | −3.99 | Decreasing | 1985 |
| Longmen | −5.75 | −5.06 | −6.53 | Decreasing | 1985 |
| Tongguan | −6.65 | −5.59 | −7.72 | Decreasing | 1985 |
| Huayuankou | −5.96 | −5.26 | −6.52 | Decreasing | 1985 |
| Gaocun | −5.98 | −5.25 | −6.49 | Decreasing | 1985 |
| Lijin | −6.84 | −5.79 | −7.45 | Decreasing | 1985 |
Table 3.
Average and CV of different flow time series along the Yellow River.
| Station Name | Average of Different Flow Series (108 m3) | CV of Different Flow Series | ||||
|---|---|---|---|---|---|---|
| 1956–2016 | 1956–1984 | 1986–2016 | 1956–2016 | 1956–1984 | 1986–2016 | |
| Tangnaihai * | 199.02 | 210.16 | 181.09 | 0.26 | 0.24 | 0.24 |
| Lanzhou | 305.32 | 335.22 | 274.98 | 0.22 | 0.22 | 0.16 |
| Xiaheyan | 291.05 | 326.24 | 255.64 | 0.24 | 0.23 | 0.19 |
| Shizuishan | 266.54 | 306.20 | 226.40 | 0.28 | 0.25 | 0.21 |
| Toudaoguai | 205.31 | 247.79 | 162.57 | 0.36 | 0.30 | 0.27 |
| Longmen | 249.50 | 307.24 | 192.37 | 0.35 | 0.27 | 0.24 |
| Tongguan | 324.38 | 407.51 | 242.60 | 0.37 | 0.27 | 0.24 |
| Huayuankou | 354.98 | 450.28 | 260.99 | 0.41 | 0.32 | 0.25 |
| Gaocun | 331.02 | 431.02 | 232.81 | 0.46 | 0.35 | 0.29 |
| Lijin | 275.05 | 401.55 | 152.91 | 0.66 | 0.44 | 0.45 |
* Flow sequences time range of Tangnaihai station divided by abrupt change point are 1965–1988 and 1990–2016.
© 2018 by the authors. Licensee MDPI, Basel, Switzerland. This article is an open access article distributed under the terms and conditions of the Creative Commons Attribution (CC BY) license (http://creativecommons.org/licenses/by/4.0/).
Share and Cite
MDPI and ACS Style
Wang, X.; Engel, B.; Yuan, X.; Yuan, P. Variation Analysis of Streamflows from 1956 to 2016 Along the Yellow River, China. Water 2018, 10, 1231. https://doi.org/10.3390/w10091231
AMA Style
Wang X, Engel B, Yuan X, Yuan P. Variation Analysis of Streamflows from 1956 to 2016 Along the Yellow River, China. Water. 2018; 10(9):1231. https://doi.org/10.3390/w10091231
Chicago/Turabian StyleWang, Xiujie, Bernard Engel, Ximin Yuan, and Peixian Yuan. 2018. "Variation Analysis of Streamflows from 1956 to 2016 Along the Yellow River, China" Water 10, no. 9: 1231. https://doi.org/10.3390/w10091231
Note that from the first issue of 2016, this journal uses article numbers instead of page numbers. See further details here.