Article

Stable Isotope Analysis Reveals the Importance of Riparian Resources as Carbon Subsidies for Fish Species in the Daning River, a Tributary of the Three Gorges Reservoir, China

1
College of Animal Science and Technology, Southwest University, Chongqing 400715, China
2
Yangtze River Fisheries Research Institute, Chinese Academy of Fishery Science, Wuhan 430223, China
*
Authors to whom correspondence should be addressed.
Water 2018, 10(9), 1233; https://doi.org/10.3390/w10091233
Submission received: 7 August 2018 / Revised: 3 September 2018 / Accepted: 11 September 2018 / Published: 12 September 2018
(This article belongs to the Section Water, Agriculture and Aquaculture)

Abstract

:
The patterns of carbon flow in large rivers influenced by dams are still not well known. We hypothesized that spatial variation in fish assimilation of basal production sources would be affected by heterogeneity of landscape-scale hydrology within a watershed due to the impoundment. We used stable isotope analysis and Bayesian mixing models to estimate relative contributions of basal production sources to fish consumers in a tributary of the Three Gorges Reservoir (TGR) with remarkably heterogeneous habitats between the upper and lower reaches. Model estimates indicated that riparian C3 plants were the main basal food source irrespective of reaches or feeding groups. Autochthonous algae carbon also appeared to be important as secondary carbon sources. However, the major contributive aquatic algae in the upstream were benthic algae while planktonic algae were important in the downstream, and this difference was related to their distinct hydrological characteristics. The contribution from C4 plants was comparatively less important to all fish consumers. Our results highlighted the significance of the riparian C3 carbon source to fish consumers in the TGR tributary and that the difference in landscape-scale characteristics was not enough to influence the pattern, which may be attributed to abundant standing stock of the riparian plants as well as hydrologic regimes in this river.

1. Introduction

Deciphering the dominant carbon sources and energy pathways in riverine food webs is fundamental for understanding ecosystem function, with implications for future fluvial management and conservation. The sources and transport of carbon and energy in large river ecosystems have been conceptualized as several theoretical concepts, including the river continuum concept (RCC) [1], the flood pulse concept (FPC) [2] and the riverine productivity model (RPM) [3]. Each conceptual model has stressed the importance of organic matter originating from autochthonous or allochthonous sources [4]; such as the RCC stressing subsidy from upstream processing of terrestrial organic matter [1], the FPC emphasizing lateral river floodplain exchanges [2], and the RPM highlighting carbon derived from local in-stream production [5,6,7]. Owing to the hydrogeomorphic diversity among or within large river systems however, a single conceptual model of carbon dynamics is unlikely to apply to all rivers or to one river with various habitat units included [8,9]. Therefore, a more comprehensive concept, such as the Riverine Ecosystem Synthesis (RES), which regards rivers as arrangements of large hydrogeomorphic patches (functional process zones), is proposed to synthesize various river ecosystem concepts [10,11]. This new holistic and generalized concept has been developing recently in, for example, the river wave concept [12]. Moreover, anthropogenic influences, such as dam construction, land uses, and hydrological modification, can change subsidy pathways [13,14,15,16,17] and thereby intensify unpredictability of the variation. As a result, the most important carbon source supporting riverine food webs would vary depending on the temporal and spatial patterns of all kinds of environmental conditions [4,18,19].
Dams alter hydrologic conditions in the river, which affect the life cycles of river biota and species interactions in the food webs, and thereby change some ecosystem processes [20]. The creation of lentic habitats in the reservoir can causes the dominant carbon source to change along with increasing the importance of algal production [8,16], especially downstream from the reservoir where exporting pelagic-derived production from the reservoir could subsidize the food web [13,21,22]. Although tributaries contributing to the overall biodiversity of large rivers [23] are also likely to be changed in hydrogeomorphic nature due to the impoundment, carbon flow in these influenced tributaries is less focused.
The Yangtze River is by far the largest river in China. The Three Gorges Dam (TGD) was constructed near Yichang city in Hubei province, where the Yangtze River’s middle and upper reaches meet. The dam is 185 m high and impounds the Three Gorges Reservoir (TGR), which is 600 km in length with a total storage capacity of approximately 39.3 × 10 km9 m3. The TGR began filling on 1 June 2003. Hydrologic regulation is carried out according to flood control, which gradually draws down to its lowest water level at 145 m prior to the flood season near April, and maintains a normal pool level at 175 m after the flood season, usually from October. There are ten tributaries with a watershed area larger than 1000 km2 joining the Yangtze River within the Three Gorges Reservoir Area. After impoundment of the TGR, the lower reaches of these tributaries are submerged by backwater and deep lacustrine habitats are formed with the same fluctuation cycle as the mainstream. The upper streams, however, maintain natural fluvial conditions. In the early stage of TGR operation, terrestrial C3 plants and C4 plants were testified as being the dominant carbon source to consumers which collected from the mainstream sites in the reservoir [24]. Another study conducted in the backwater area of Xiaojiang River, which is also a TGR tributary but more affected by anthropogenic activities, demonstrated that microalgae and terrestrial C4 plants were the main energy sources for economically important fish before and after the impoundment, respectively [25]. The Daning River is a typical tributary in the TGR with heterogeneous habitats, and the river continuity and natural landscape are undamaged and effectively protected. The carbon pathway in this tributary after TGR impoundment is still unclear.
The objective of this study was to ascertain the main carbon contributions to the aquatic food web in a tributary of the TGR with heterogeneous habitats. We hypothesized that there were different carbon pathways between the upper and lower river reflecting the heterogeneity of landscape-scale hydrology within the watershed, and that fish species from the upper river relied mainly on terrestrial carbon while the lower river depended on the autochthonous carbon. We further explored the contribution difference of carbon source among fish species with distinct feeding strategies in order to identify the influence of the feeding strategy on the contributions. To test the hypothesis, we analyzed and compared carbon and nitrogen stable isotope ratios of the principal primary production sources and fish consumers in the river. Bayesian mixing models were used to determine the relative importance of different food sources.

2. Materials and Methods

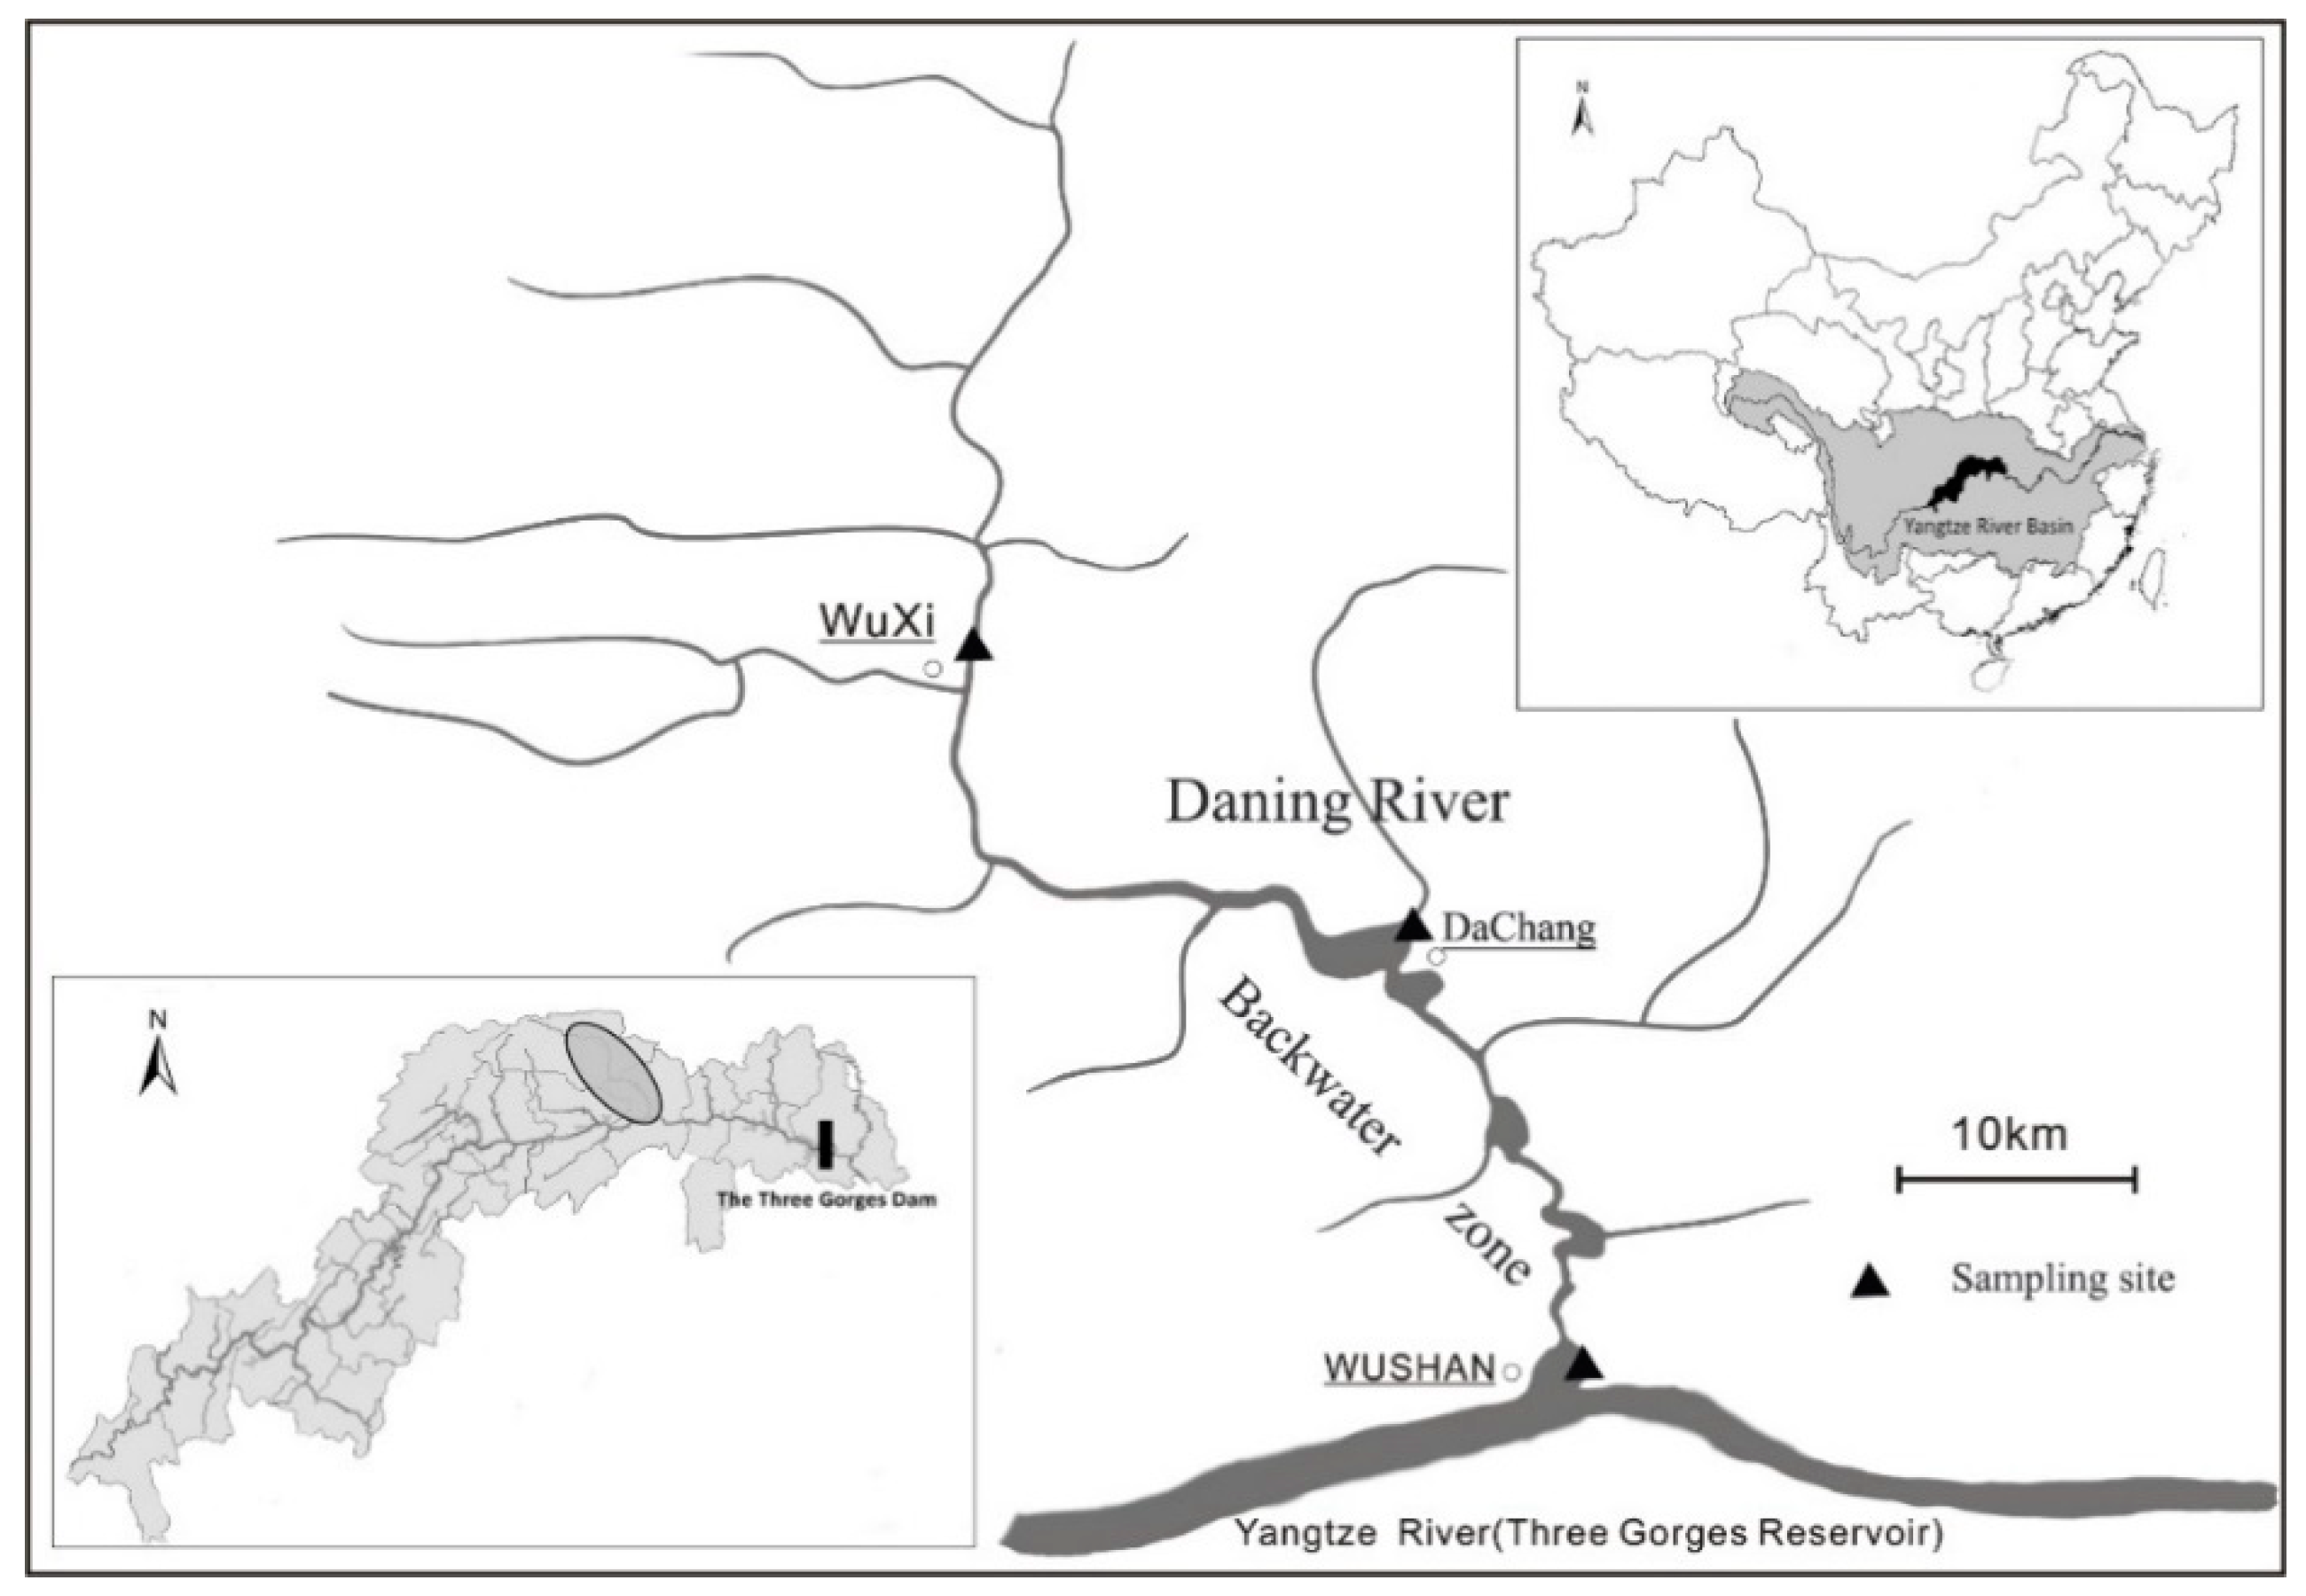
2.1. Study Area and Site Descriptions

The Daning River is a tributary of the Yangtze River, located in the middle of the Three Gorges Reservoir (Figure 1). The River flows in a southerly direction for approximately 200 km from its headwaters to the reservoir at Wushan City, 123 km upstream of the Three Gorges Dam, draining a catchment of 4426 km2. Due to the hydrologic regulation of the TGR, the downstream of the river forms a backwater area 60 km in length with a mean depth of approximately 40 m when the water level rises to 175 m (October–February), and 47 km long and 23 m deep at the lowest water level of 145 m [26]. The water velocity in this area is less than 0.04 m/s after the impoundment. The river is canyon-shaped with three long gorges in the lower reaches, characterized by an incised channel with steep littoral zones. Meanwhile, there are several large open sections scattered in backwater areas with less steep slopes and wide lateral habitats characterized by muddy substrates sprouting dense macrophyte mats during lower water levels. The fluctuation of water level results in a long perpendicular fluctuating belt in the incised channels, and a vast periodic inundated area up to a total of 15 km2 in the open zone [27]. The upper reaches of the river remain a typical fluvial habitat with a 10–30 m wide alluvial flat. The upstream is 5–10 m wide and 1–3 m deep at low-flow periods, with a gravel-cobble substrate and a pool-riffle morphology. This reach has a gradient of approximately 8 m/km and a water velocity of more than 1.5 m/s. The main land uses in the watershed include 22.2% cropland, 11.4% grassland, and 65.8% forest [28]. However, most of the farming land is distributed in the downstream area where the elevation is below 800 m.

2.2. Sample Collection and Analysis

Samples were collected from two different types of habitats. Two sites (Wushang, Dachang) in the backwater zone downstream represent lacustrine habitats and one upstream site (Wuxi) represents riverine systems in the Daning River (Figure 1). Sampling was carried out during flood season (May–June), dry season (December), drawdown (March) and impoundment (September–October) periods from 2012 to 2013.
Potentially important basal carbon sources of aquatic and terrestrial origin were aggregated as four major groups according to previous studies in TGR and other rivers [9,24]: Riparian C3 plants, terrestrial C4 plants, benthic algae and seston. The dominant terrestrial vegetation was collected from the riparian zone, including: Polygonum hydropiper, Conyza canadensis, Alternanthera philoxeroides, and Xanthium sibiricum for C3 plants; and Cynodon dactylon, Cyperus rotundus, Eleusine indica, Setaria faberii, crops (corn seedlings) and tree leaves for C4 plants. Plant samples were air dried, placed in plastic bags and transported to the laboratory for further processing. Benthic algae (attached algae, mostly filamentous) were scraped directly off accessible stable substrate surface. Samples were rinsed with distilled water repeatedly, and any sediment particles, detritus or microorganisms were removed during examination under a microscope. Seston was filtered from a composite water sample containing samples from several depths (surface, 5 m, 15 m at downstream sites, and surface at upstream) with a water bottle at each site. Water samples were pre-filtered through a 112 μm plankton net to remove zooplankton and large detritus. Seston samples were then obtained by filtering water through a pre-combusted (450 °C, 4 h) Whatman GF/C (1.2 μm) filter using a manual pump. Microscopic examination showed that the seston were composed mostly of phytoplankton and suspended particulate organic matter of undetermined origin.
Fish were captured using 2 m by 50 m gillnets with a wide range of mesh sizes (30, 60, 80 and 120 mm). The number and weight of fish species collected were recorded. A total of 38 fish species (28 for downstream, 15 for upstream) were selected for isotopic analysis based on the abundance and frequency of capture in several surveys [29]. For each species, only large adult individuals were selected in case of the influence of ontogenetic diet shifts on isotopic value. According to the literature, five feeding groups are found in the 28 selected downstream species [30,31,32,33], including planktivores, herbivores, benthivores, omnivores and piscivores. Because of no evident feeding differentiation for the upstream fish species, most of which are omnivores [30,32], the comparison of fish with feeding groups came from downstream. For selected individuals, fish were weighed (g), measured (mm), and dissected to extract approximately 5–10 g of dorsal muscle tissue for isotopic analysis.
All samples were dried to a constant weight for at least 48 h at 60 °C and crushed to a homogeneous fine powder using a mortar and pestle. Samples were then sent to the Stable Isotope Laboratory, Chinese Academy of Forestry, Beijing, China, for analysis of carbon and nitrogen isotope ratios using a Flash EA1112 HT Elemental Analyzer coupled to a DELTA V Advantage Isotope Ratio Mass Spectrometer. Stable isotope ratios are expressed as delta (δ) and defined as parts per thousand (‰) relative to the laboratory standard material: δ X = ( R s a m R s t d ) / R s t d × 10 3 , where X is 13C or 15N and R is the corresponding ratio13C/12C or 15N/14N. The standard material for carbon is Pee Dee Belemnite (PDB) limestone, and the nitrogen standard is atmospheric nitrogen. Precision of the isotopic analysis was 0.1‰ for carbon and 0.2‰ for nitrogen.

2.3. Bayesian Mixing Model

Bayesian isotopic mixing models in the Stable Isotope Analysis in R (SIAR) package [34] were employed to estimate relative contributions of basal production sources to each fish consumer for each habitat. These models account for uncertainties associated with sample variability and trophic enrichment on the assumption they are normally distributed [34]. The average and standard deviations of δ13C and δ15N of each food source and fish collected from lotic or lentic reaches were used separately as input values for the SIAR models for that habitat. Although C3 and C4 riparian plants are widespread along the river channel, most of them are not evenly distributed. In order to include all the possible allochthonous sources fish could assimilate to, mean source values (with variation) combined across all sites were used for C3 and C4 plants in either downstream or upstream analyses. Trophic enrichment values were 0.4 ± 0.19 ‰ for δ13C [35] and 3.4 ± 0.13‰ for δ15N [36] in all models. Through a Markov chain Monte Carlo method, each mixing model was fit to generate simulations of plausible values for dietary proportions consistent with the data using a Dirichlet prior distribution [34]. Each model was run for 200,000 iterations, using non-informative priors to guide the dietary proportion simulations. Upper and lower 95% credibility intervals were used to describe the range of feasible contributions for each food source to each fish consumer [34]. The solution with the highest probability produced by the model, instead of the mean value of all the possible solutions, was utilized to evaluate and compare the discrepancy among reaches or feeding groups.

2.4. Statistical Analyses

The Shapiro-Wilk’s test and Levene’s test were used to test the normality and homogeneity of variances for δ13C and δ15N isotopic signatures data respectively, before comparing the differences among basal food sources (n = 4) and reaches (n = 2). The nonparametric Kruskal–Wallis test, followed by Dunn’s post-hoc tests were used when the data did not consistently meet the normality assumption. Otherwise, one-way ANOVA with Tukey’s post-hoc tests were employed when data were normally distributed. Between-group differences of the combined source contributions were analysed using similarity tests with the Bray–Curtis coefficient as a dissimilarity index (ANOSIM, with 5000 permutations). When there were significant differences, a similarity of percentage analysis (SIMPER) was used to determine dissimilarity for each pair-wise combination of feeding groups and the relative contribution of each carbon source to between-group differences. A t-test was used to compare contribution proportions of primary food sources in different reaches. Statistical analyses were conducted using IBM SPSS Statistics (16.0) and PAST3. Statistical significance was determined at p = 0.05.

3. Results

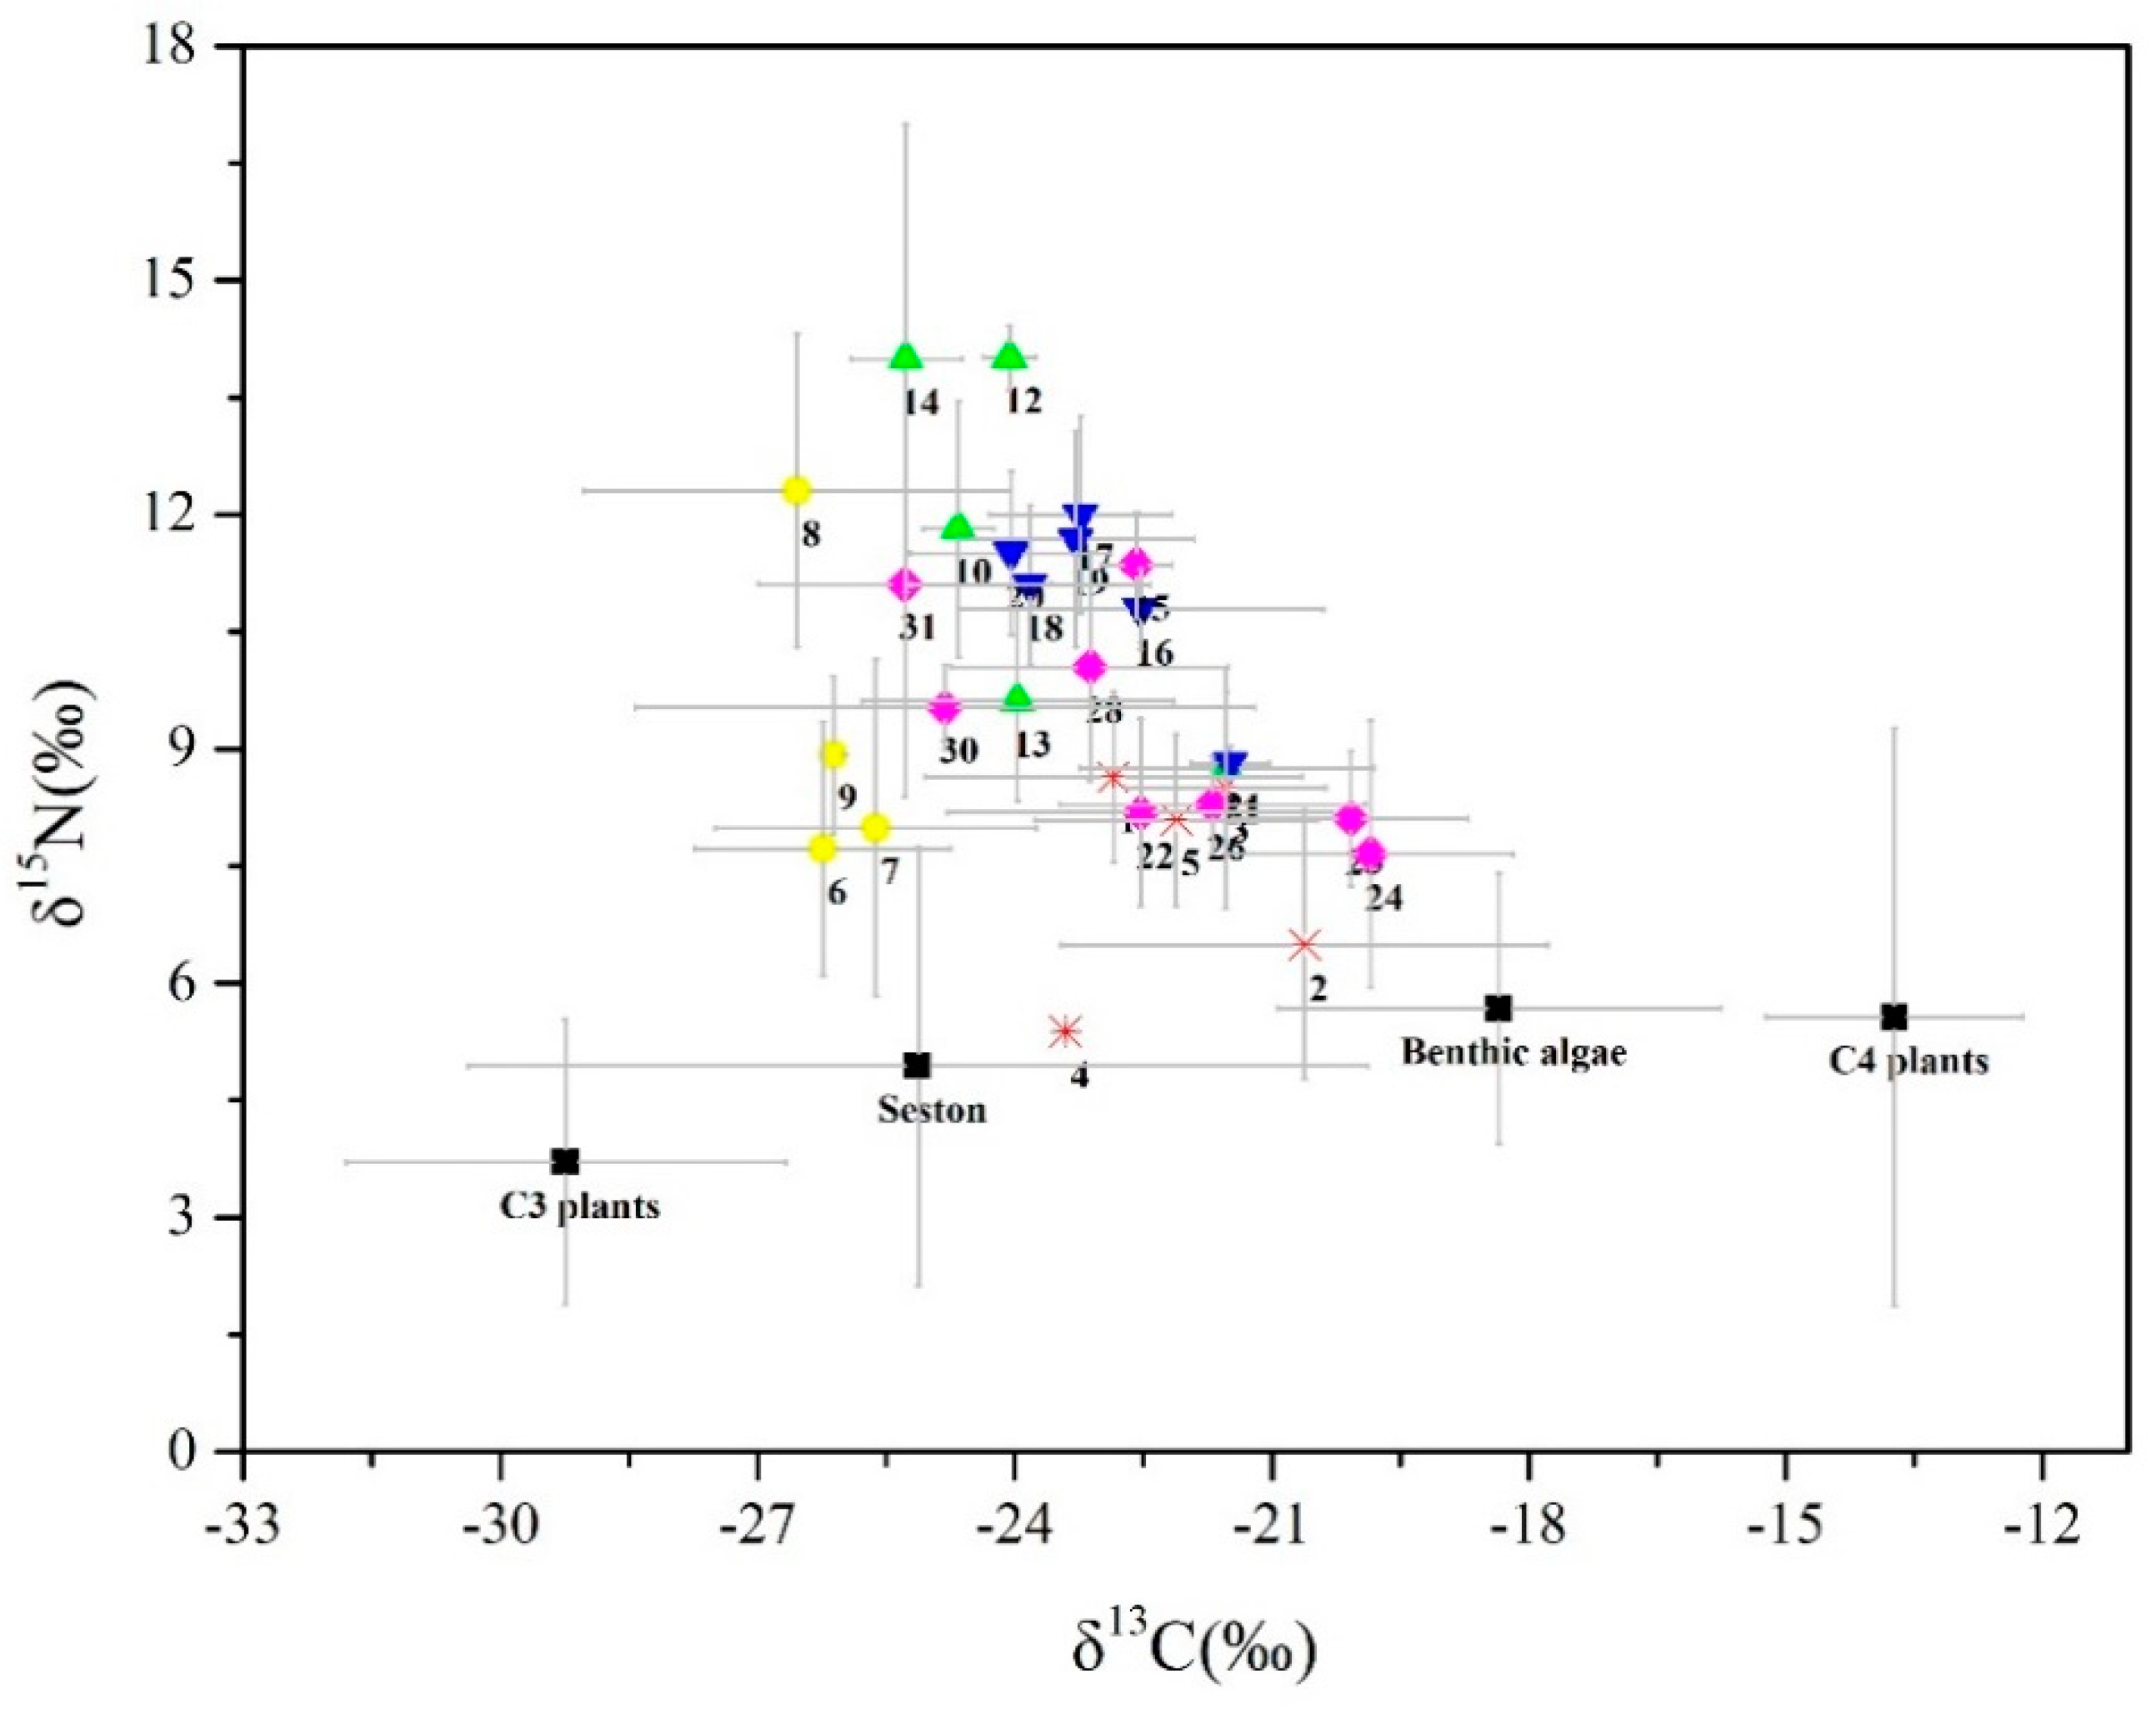
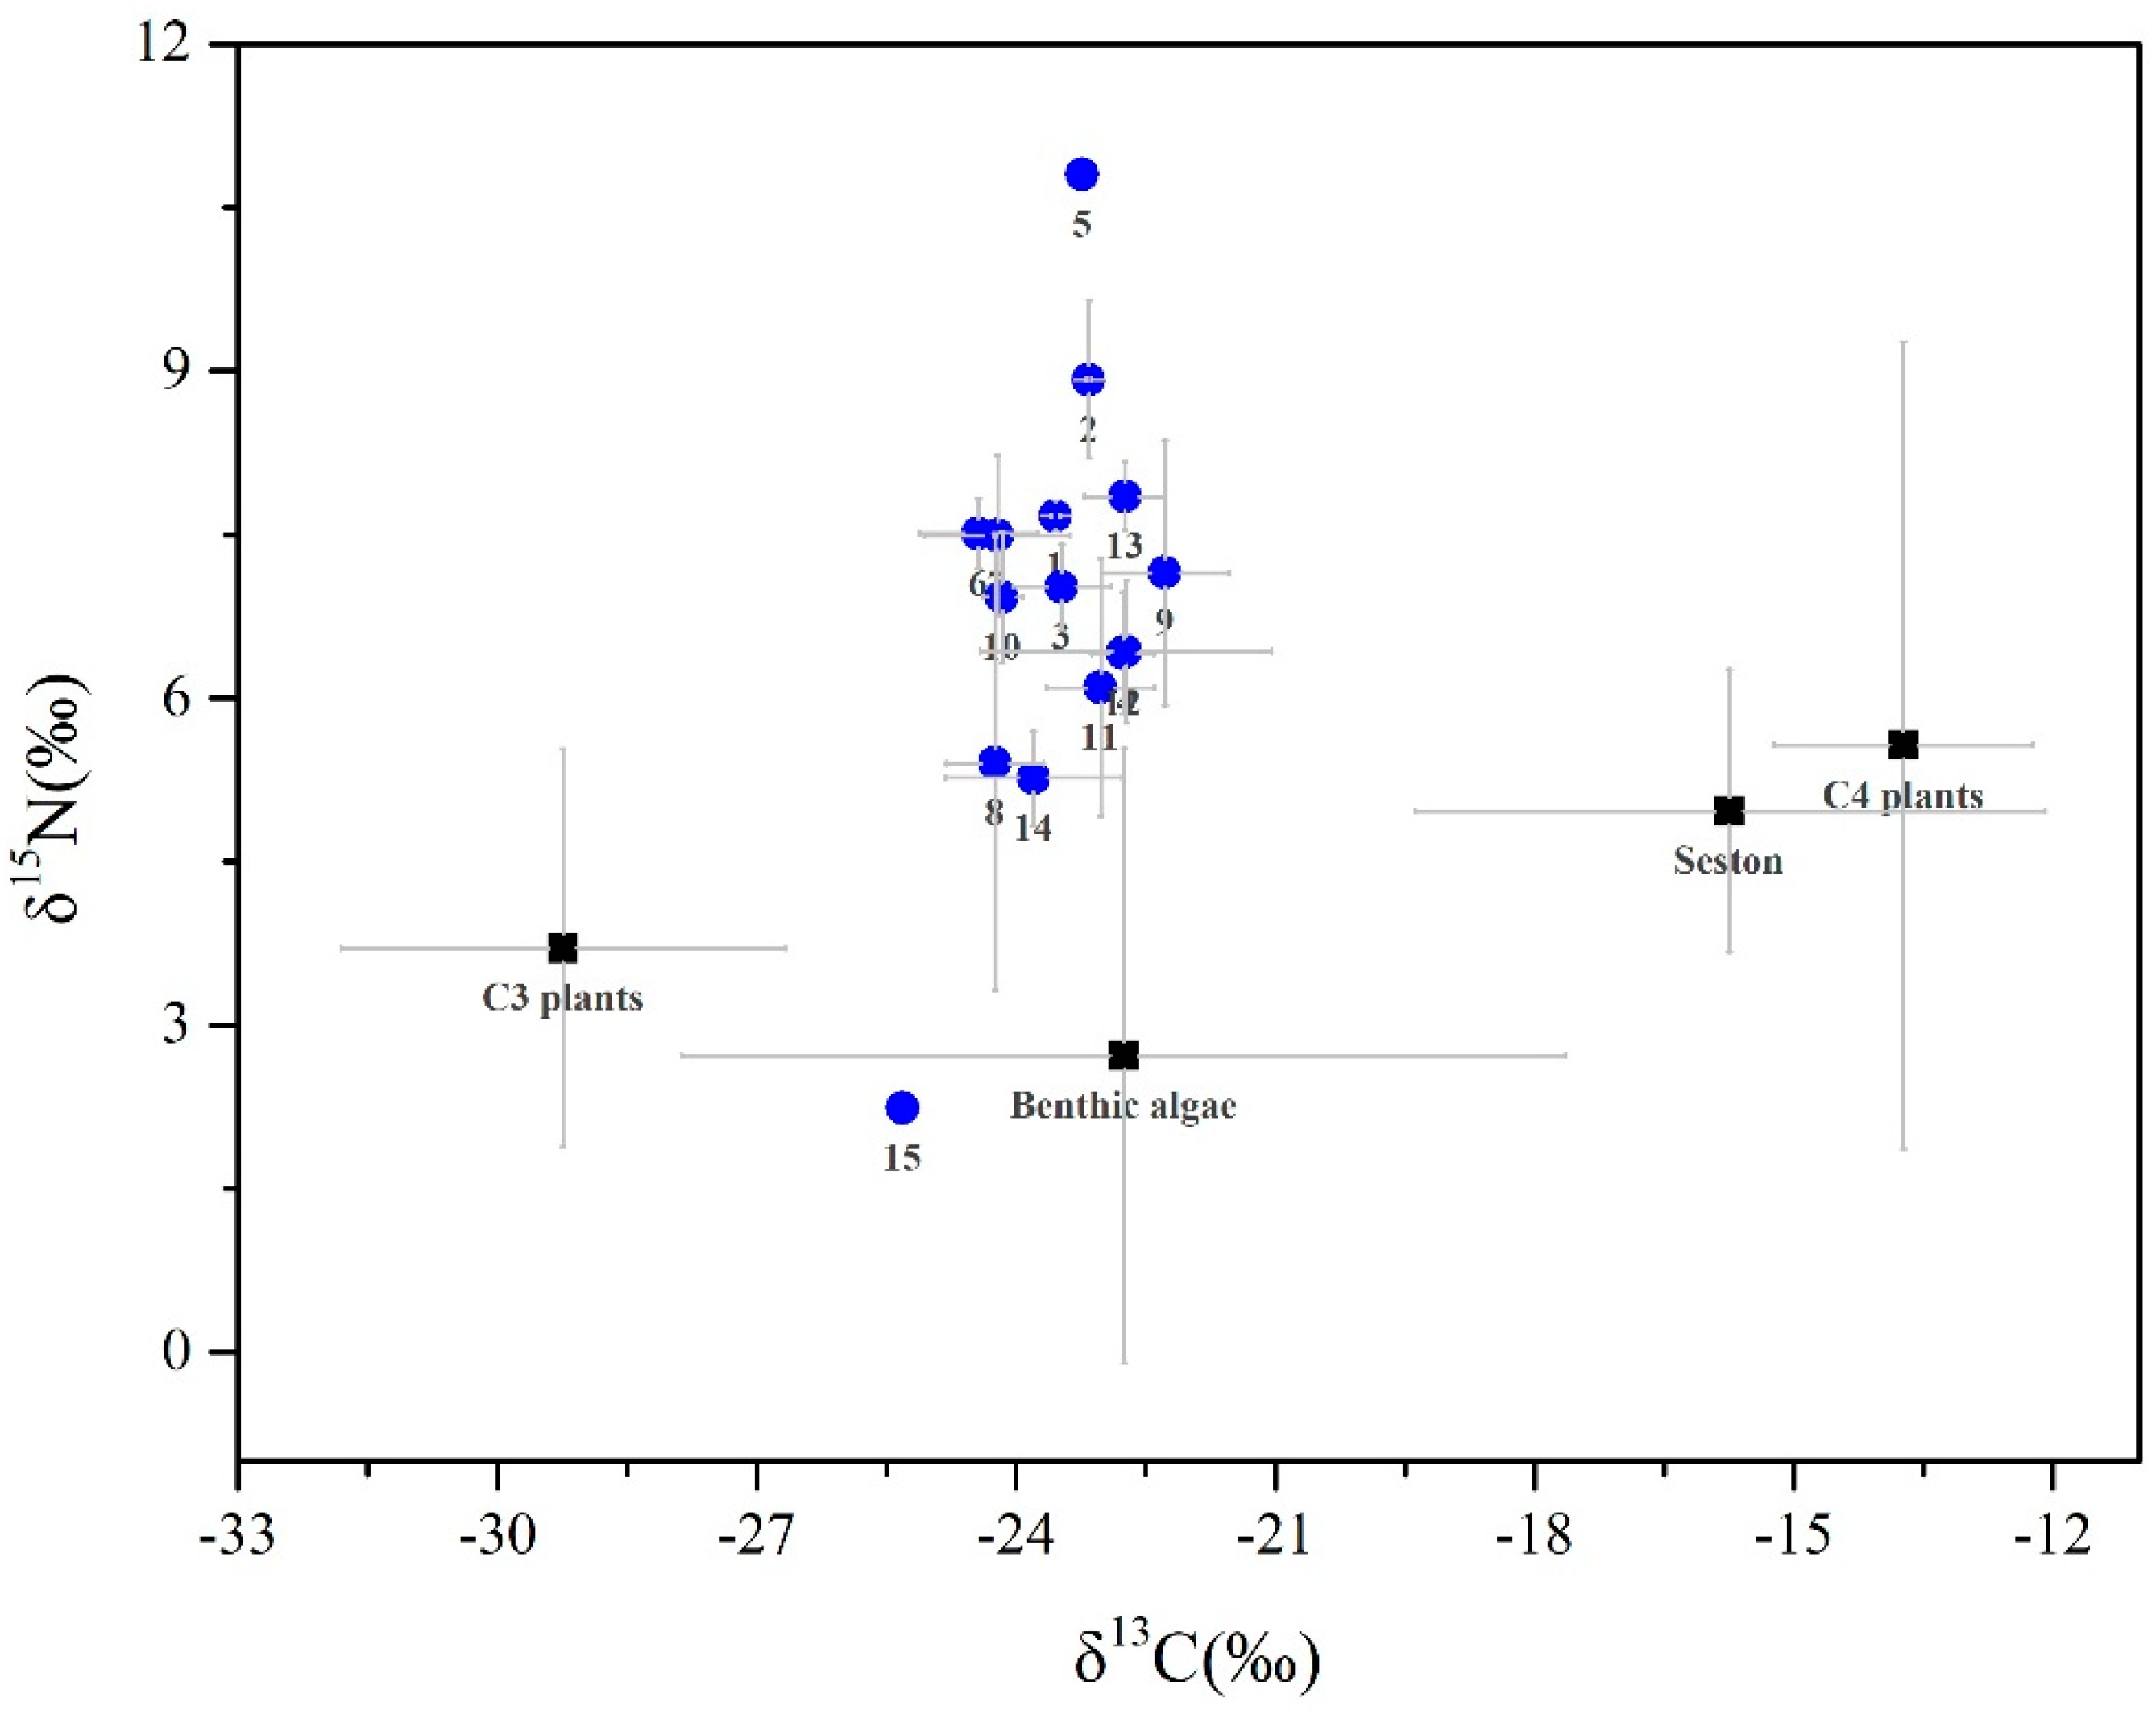
3.1. Isotopic Signatures

The δ13C values of the basal carbon sources in the Daning River spanned a broad range from −33.41‰ to −10.44‰ (Figure 2 and Figure 3, and Table S1). There were significant differences among the δ13C signatures of the four basal production sources for both downstream (ANOVA, F = 31.44, p < 0.01) and upstream (ANOVA, F = 38.62, p < 0.01). Riparian C3 plant signatures were more depleted in δ13C than lentic benthic algae and terrestrial C4 plants, whereas they had no significant difference with seston in δ13C from the downstream. However, C3 plants were the most depleted carbon source in the upstream, while seston was more enriched in δ13C than benthic algae at the upper reaches. In addition, seston δ13C signatures appeared to be significantly different between the lower and upper reaches (ANOVA, F = 18.88, p < 0.01). Although the δ15N values of the basal carbon sources also varied largely from −0.39‰ to 11.99‰ (Figure 2 and Figure 3 and Table S1), differences in δ15N among the four basal production sources were not significant in the downstream (ANOVA, F = 0.73, p = 0.542) or upstream (ANOVA, F = 2.15, p = 0.112). There were no significant differences in δ15N between the lower and upper reaches for each basal carbon source.
The δ13C and δ15N signatures of fish varied from −29.74‰ to −16.61‰ and from 2.25‰ to 17.51‰, respectively (Figure 2 and Figure 3, and Table S1). There were no significant differences in fish consumer δ13C between the upstream and downstream (ANOVA, F = 0.62, p = 0.434). However, the fish species collected from the lower reaches had consistently higher δ15N values than those from the upper reaches (ANOVA, F = 55.10, p < 0.01).

3.2. Contributions of Basal Carbon Sources

The Bayesian isotope mixing model indicated that riparian C3 plants were the primary carbon source for fish in both lower and upper reaches (Table 1 and Table 2). In the downstream, the lower 95% credibility intervals of C3 plants for all 28 fish species were consistently greater than 0.02. The average lower and upper 95% credibility intervals for C3 plants were 0.14 and 0.59, respectively. Meanwhile, the highest likely contributions of C3 plants estimated from the Bayesian model for each species ranged from 0.25 to 0.71, with an average proportion of 0.37. However, the lower 95% credibility intervals of the other three basal carbon sources for a great number of fish species (seston for 15 species, benthic algae for 20 species, C4 plants for 19 species) from the downstream were less than 0.01. The average upper 95% credibility intervals for seston, benthic algae, and C4 plants were 0.46, 0.42, and 0.34, respectively. Moreover, the simulated likely contributions to the downstream fish species were 0.06–0.33 (average = 0.27) for seston and 0.04–0.32 (average = 0.22) for benthic algae. The lowest average contributions of terrestrial C4 plants were observed for these fish species from the limnetic zone, as the average proportion was 0.13.
Similar to the downstream site, the model results revealed that all 15 fish species collected from the upstream derived the majority of their carbon from C3 plants (Table 2), with the average lower 95% credibility intervals equal to 0.12 and upper 95% credibility intervals at 0.64. The simulated most likely contributions of C3 plants from the Bayesian model varied between 0.28 and 0.56 with an average of 0.39. The contribution from benthic algae to each fish species was relatively low, as only three fish species had lower 95% credibility intervals greater than zero, although the upper 95% credibility intervals were typically greater than 50%. On average, benthic algae contributed 0.30 of production (between 0.26 and 0.34) to each upstream fish species. As for the contribution from seston and C4 plants, the lower 95% credibility intervals for all upstream fish were zero while the average upper 95% credibility intervals were merely 0.38 and 0.35, respectively. Consequently, these two basal carbon sources had the lower contributions for seston at 0.12 and C4 plants at 0.08 on average.

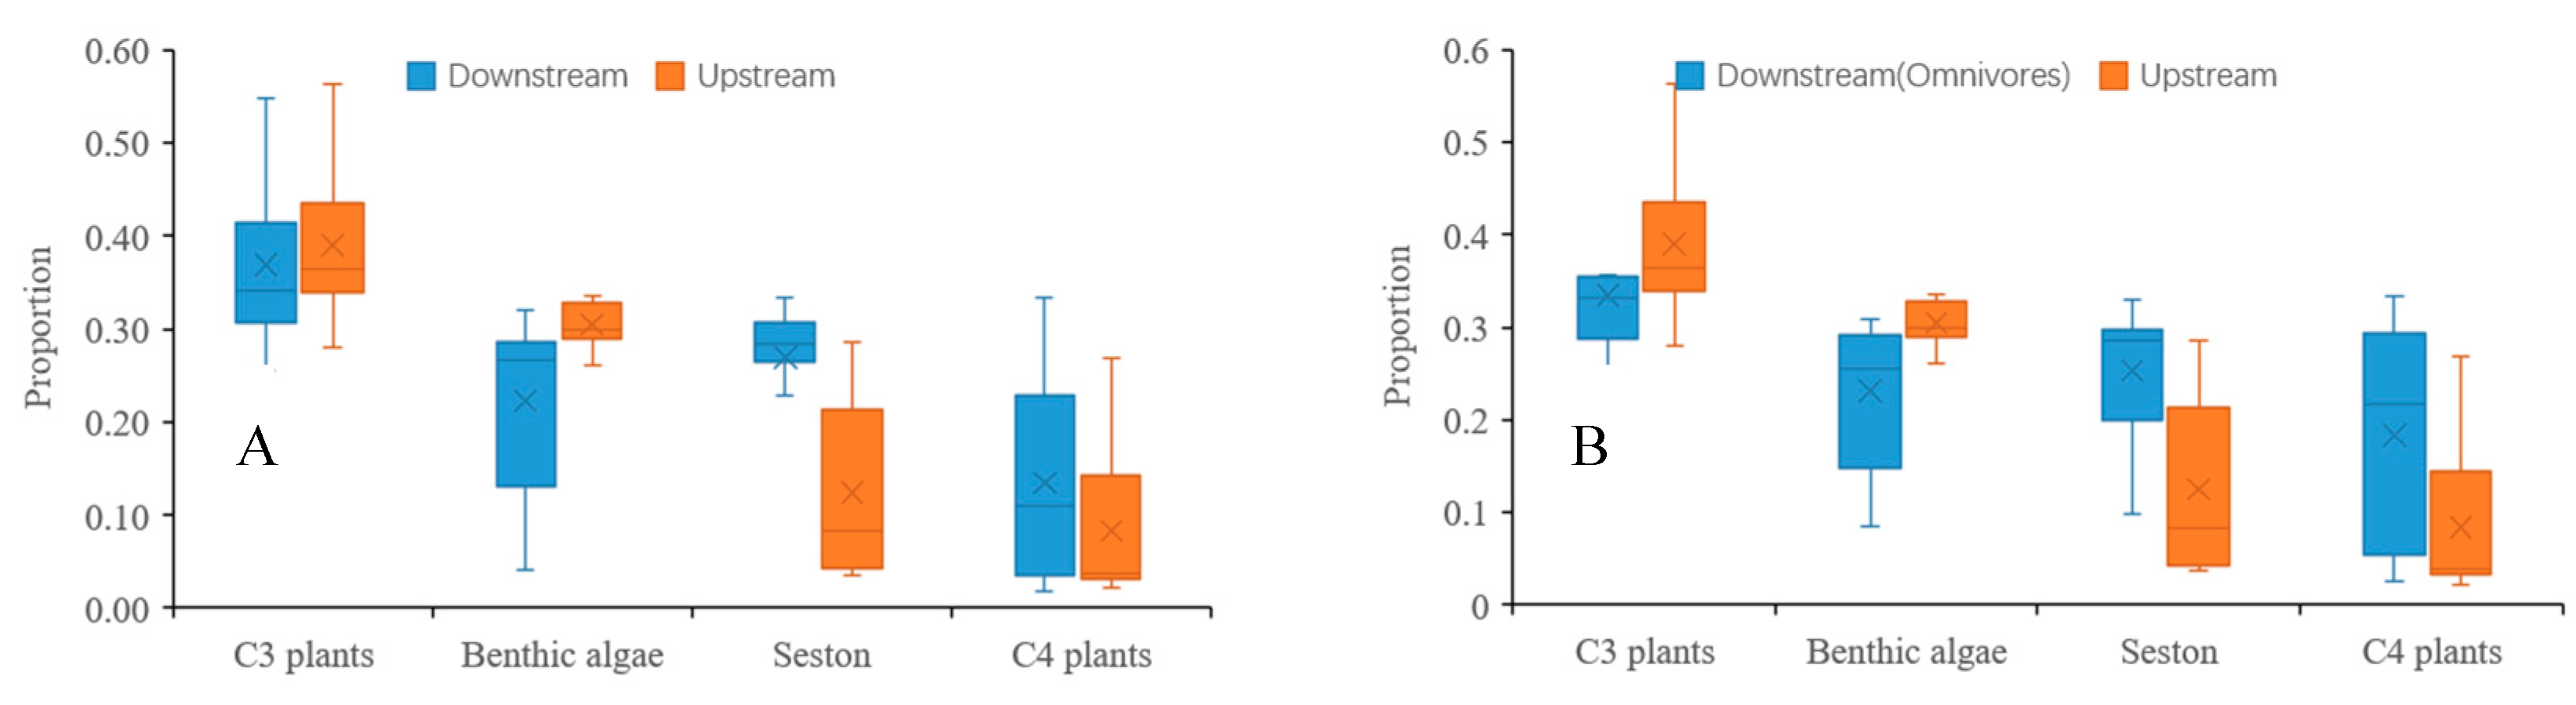
3.3. Spatial Variability in Contribution

Significant differences were observed in the contribution proportions of four basal carbon sources between the downstream and upstream (ANOSIM, R = 0.29, p < 0.01). The between-reaches dissimilarity was 23.68, which was explained as 35.7% for seston, 22.78% for C4 plants, 20.81% for C3 plants and 20.71% for benthic algae, respectively. Furthermore, the average contribution proportions of benthic algae for all fish species in the downstream were significantly lower than those in the upstream (t-test, t = −4.263, p < 0.01; Figure 4A) whereas the average proportions of downstream seston contributions were significantly higher than the upstream (t-test, t = 5.424, p < 0.01; Figure 4A). There was no difference in the contribution of C3 plants (t-test, t = −0.726, p = 0.472) or C4 plants (t-test, t = 1.891, p = 0.066) between the two reaches (Figure 4A).
A comparison between the omnivorous fishes from the downstream and all upstream fishes was also conducted. There were significant differences in contribution proportions of basal sources between the downstream and upstream (ANOSIM, R = 0.39, p < 0.01). Dissimilarity between them was 23.74 and 33.32% of seston explained this dissimilarity. Only the contribution from C3 plants showed no significant differences between the upper and lower reaches (t-test, t= −1.782, p = 0.089; Figure 4B). There were significant differences between the upstream and downstream in contribution proportions of benthic algae (t-test, t = −2.422, p < 0.05), seston (t-test, t = 3.365, p < 0.01) and C4 plants (t-test, t = 2.529, p < 0.05) (Figure 4B).

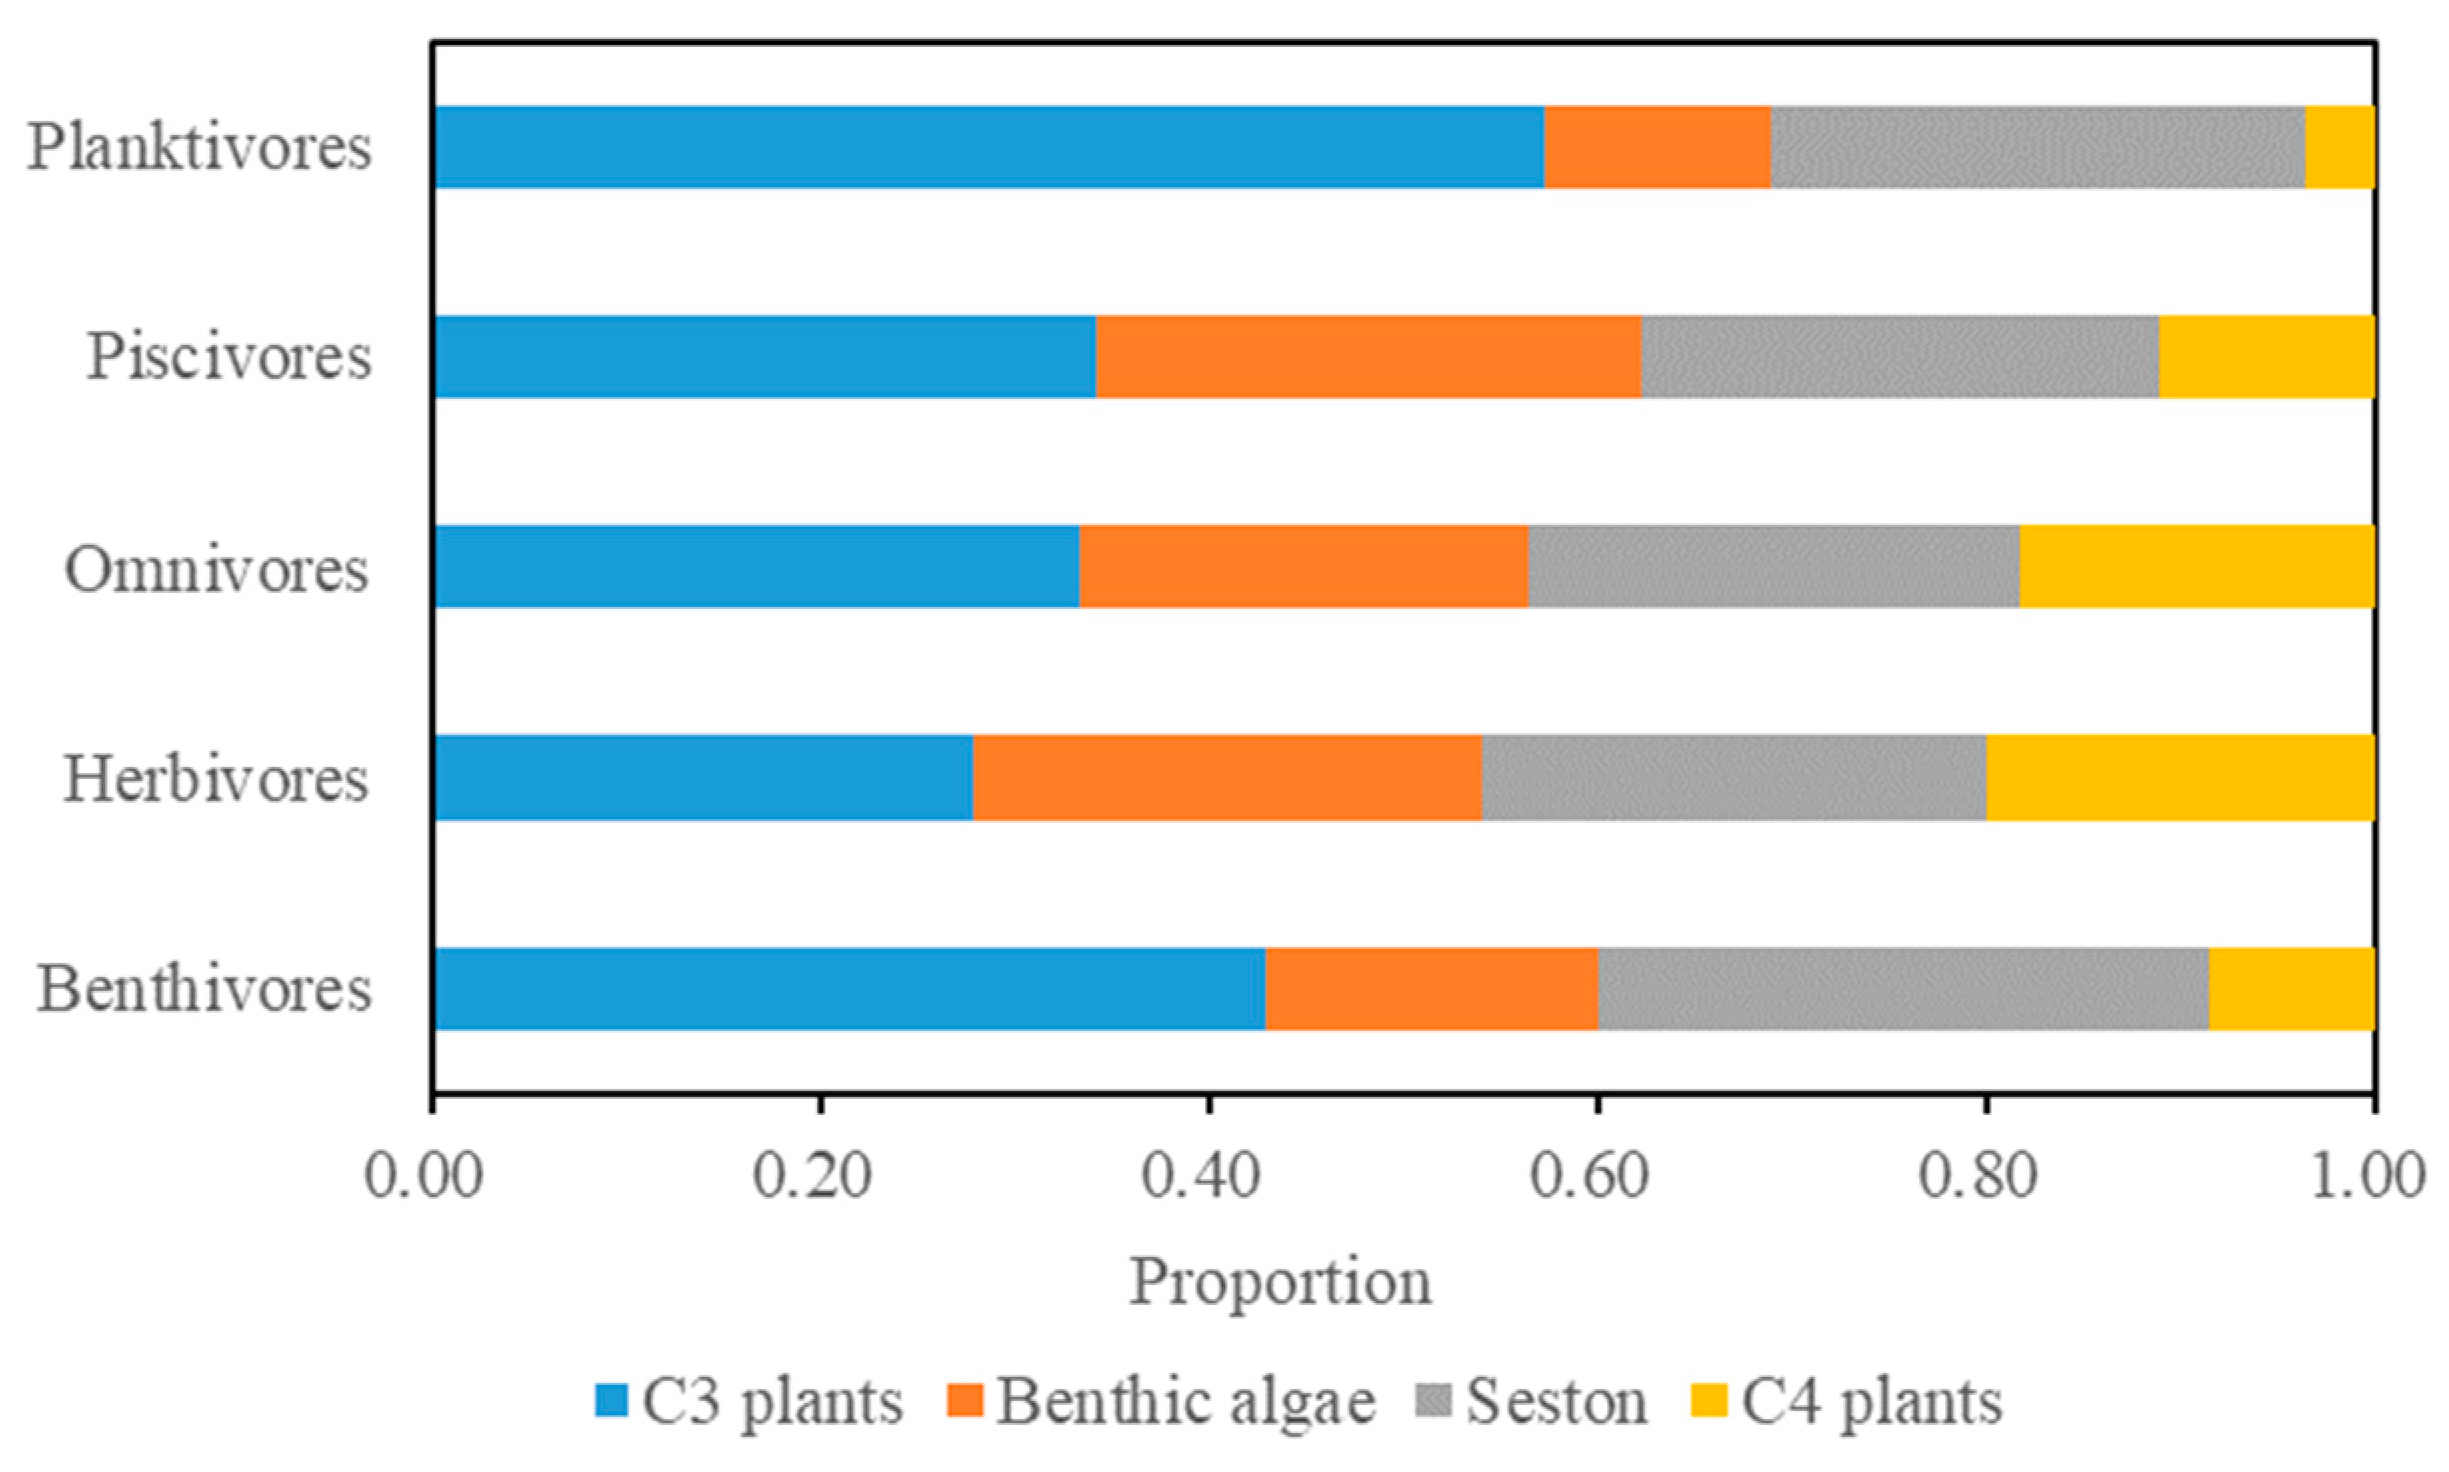
3.4. Differences in Contribution Among Feeding Groups

The composite contributions of four basal carbon sources were significantly different among feeding groups from the lower reaches (ANOSIM, R = 0.17, p < 0.05) (Figure 5). Intergroup dissimilarities ranged from 10.77% to 33.03% with the overall average dissimilarity of 20.18% (Table 3). Planktivores differed significantly from herbivores (R = 0.65, p < 0.01), omnivores (R = 0.36, p < 0.05) and piscivores (R = 0.46, p < 0.05); and benthivores were significantly distinguishable from herbivores (R = 0.45, p < 0.05) and piscivores (R = 0.28, p < 0.05), respectively. No significant differences were found for other pair-wise comparisons among feeding groups. C4 plants were observed as having the largest contribution (30.45%) to the between-group differences when all feeding groups were included, followed by benthic algae (27.65%), C3 plants (26.72%) and seston (15.18%). In addition, for each basal carbon source, the relative contributions were significantly different among feeding guilds from the lower reaches, except for seston (Kruskal-Wallis test, benthic algae: p < 0.01; seston: p = 0.559; C3 plants: p = 0.059; C4 plants: p = 0.036) (Figure 5).

4. Discussion

4.1. The Relative Importance of Four Basic Carbon Sources

The SIAR model estimates indicated that riparian C3 plants were the primary carbon source consistently supporting fish biomass in both the downstream and upstream of the Daning River. However, terrestrial C4 plants were relatively unimportant and contributed the least fraction of biomass for most fish species. Our results conform to a number of previous studies that certain terrestrial carbon, namely C3 macrophytes rather than C4 vegetation from the riparian zone, provide major support to consumers [8,9,37,38]. Nevertheless, these outcomes contradict, to some extent, a recent study reporting the importance of C4 plants as one of the dominant carbon sources in the TGD [24].
Our results also demonstrated that the average contribution from seston was similar to C3 plants regardless of feeding type, and that 13 fish species still had lower 95% credibility intervals greater than zero in the downstream. This highlights the relative importance of seston as a carbon source especially to downstream fish. Meanwhile, benthic algae as a potential carbon subsidy to upstream fish, was also observed. Given that the seston in the limnetic zone comprised mainly of planktonic algae, it is reasonable to conclude that autochthonous food sources (aquatic algae) in the Daning River serve as certain unneglectable and vital supports to fish production. This finding is consolidated by studies of other reservoirs [8,16] and rivers [39,40,41] where algal carbon of either suspended or benthic origin is considered to be of much importance.
The lower importance of terrestrial C4 plants to fish species observed in our study conflicts with the result from the main river channel of the Yangtze River [24]. The authors argued that terrestrial C4 carbon is as important a contribution as C3 carbon because of inadequate algal production, potential high quality of terrestrial plant parts or detritus and invertebrate processing of indigestible terrestrial vegetation [24]. Resource quality, rather than availability, is the likely explanation of less assimilation of C4 material in the Daning River [42,43,44], considering that C3 and C4 plants are both abundant in flood plains along this tributary, particularly, in periodically inundated areas in the downstream. As consumers reveal a preference for high-quality food resources, determining the upper trophic level consumers’ production despite its origin and quantity [43,45], C3 plants (with lower C/N ratio) and algae are more palatable and digestible providing an efficient energy source compared to C4 plants, even via the invertebrate transfer pathway. This phenomenon is also demonstrated in the central Amazon River system where the importance of carbon source from plant groups is not proportional to their total production [42,46,47].

4.2. Spatial Variation of Carbon Source Contribution

In spite of the dominant carbon source from C3 in the stream, the distinction in trophic pathway between the upper and lower reaches was still evident. Besides C3 vegetation, fish species from the downstream appeared to be supported by seston, whereas upstream fish consumers seemed to assimilate much less (Figure 4). This could be explained by the composition of this carbon source where seston from the upstream consisted of detritus derived primarily from terrestrial plant production, which was confirmed by the fact that seston from the lotic water zone had an isotopic signature aligned with C4 terrestrial vegetation (Figure 2, with large overlap). Instead, planktonic algae were the main components of the downstream seston through microscope inspection, as mentioned above.
The perceptible difference in carbon pathway patterns in the Daning River relates to divergent landscape-scale hydrologic characteristics in the different reaches as described in many other riverine studies [8,13,16]. Due to the impoundment of the TGR, the lacustrine environment has been shaped in the downstream with water velocity sharply halted and water depth gradually deepening along the tributary. The large periodic inundated zone in open sections covers plentiful riparian macrophytes and grass during the lower-water-level period, which become potential carbon sources to fish consumers when water rises through decomposition or invertebrate processing [9]. Meanwhile, the higher water transparency as a result of sedimentation, as well as longer water residence times in the backwater zones, could promote algal growth [48] that accounts for the potential importance of phytoplankton as a carbon source in the downstream. Actually, the downstream has been mesotrophic since impoundment and algae bloom usually takes place in May–October at these open sections [26]. Additionally, the rocky substrate along the downstream steep littoral zones also provides ample opportunities for attachment of epiphytic algae and collection of detritus. In the upper fluvial channel, however, relatively high water velocity constrains suspended algae biomass and results in seston mostly from agitation of benthic detritus dominated by terrestrial organic matter [49], accounting for the reduced importance of this source compared to the downstream. In the upstream, conversely, the flat valley characterized by shallow water and rocky substrate appears to provide suitable conditions for the production of riparian plants and benthic algae supporting fish consumers.

4.3. The Carbon Pathway in the Influenced Backwater Zone

In our study, fish groups relied on inputs of algae less than riparian C3 carbon, which is not fully consistent with the RPM that have increasingly emphasized the importance of algal carbon with little importance of riparian inputs [3,5,6]. The RPM is supposed to be applied to reservoirs or impounded sections where fish consumers rely mainly on pelagic-derived nutrients as observed in many other studies [7,8,13,14]. In the early period (nearly one year) after the TGR impoundment, significant increases in phytoplankton production at the lacustrine zone had not yet enhanced planktonic algal contribution to consumers [24]. The shorter time scale following TGD completion, as well as the limited availability for algal carbon to the consumer taxa, are credited as the explanations for these lower contributions [24]. After nearly ten years of TGR operation, the significance of planktonic algae in the impounded sections has gradually increased (Table 1). Nevertheless, the riparian carbon source remains as a major support to this newly-formed reservoir. Despite relative scarcity of algal carbon to massive fish biomass resulting from the small euphotic zone relative to the deep water column [24,50], we infer that hydrologic characteristics including water mixing processes in the backwater area [51] are critical factors to influencing the contribution of algal carbon. An evident alternation of the thermal stratification (May–September) and mixing (October–February) periods are strongly associated with the hydrologic regime, as surveyed in the Daning River [50]. The thermal stratification emerges during the flood season [50] when the water level is low and the inflows are relatively high in the downstream. However, a previous report has confirmed that the flow velocities are not capable of disturbing the development of thermal stratification in this river [52]. A high biomass of phytoplankton (or occasionally algae blooms) caused by high water temperature [50,53] are restricted to the epilimnion due to the relative stability of the water column, which also prevents internal circulation of nutrients that confine the extent and range of phytoplankton growth [54]. In addition, a majority of the annual precipitation in the Daning River valley falls during this stratification period, bringing a large amount of terrestrial carbon nutrients into the water [26]. On the other side, during the dry season (October–February) when the water level rises (for power generation and navigation), the water from the TGR mainstream flows back into the tributaries [51] and severely disrupts the thermal stratification causing rapid mixing of water bodies [50]. Nevertheless, the decreasing temperature in these seasons (winter and spring) limits the total cumulative biomass of algae, whereas the rising water storage inundates a large area of open valley with enormous riparian plant growth. Therefore, these periodic hydrologic regimes provide great opportunities for fish consumers to feed on the riparian carbon sources. In conclusion, the primary carbon sources for fish consumers have been dominated by the riparian material so far, which stressed the vital subsidization of terrestrial carbon to aquatic food webs in large rivers and their tributaries.

4.4. The Influence of Diet Strategies on the Importance of Major Carbon Sources

The feeding strategies influenced the proportions of different resources consumed according to distinct feeding groups, but have not altered C3 plants as the dominant carbon source within each group (Figure 5). The result is in contrast to studies conducted in other rivers or lakes where the most important carbon sources for different feeding groups vary widely [55,56]. It is plausible that fish consumers are expected to have more contributions from diets they prefer or from their selective foraging strategies, which are linked to morphological or physiological characteristics [57,58] as well as food availability [59,60]. However, many fish species can alter their diet opportunistically in response to the relative abundance and quality of food to maximize energy and nutritional gains relative to costs [61,62]. Dietary similarity for different species may occur in a system where food resources are abundant [63,64]. Therefore, the constancy of C3 carbon supports for distinct feeding groups is probably attributed to unrestricted and sustained carbon subsidies from nutritious C3 plants in the Daning River. Moreover, fish, as secondary or tertiary consumers for most species, are likely generalists, exhibiting trophic plasticity in accordance with resource availability or habitat features, rather than restrictive specialists [15,59,65,66]. This is the case even for species with remarkable morphological adaptations such as silver carp, Hypophthalmichthys molitrix, which have evolved specialized filter apparatuses showing temporal variations in prey species compositions in previous reports [67,68]. Aside from feeding on riparian plants directly, they could also integrate carbon source pathways of primary consumers in proportions, such as zooplankton or benthic invertebrates, which may assimilate carbon derived from C3 plants. In our study, the disparity in the contribution of each source for omnivores was less divergent than other groups probably because of their more generalist feeding habits. Furthermore, it is reported that similar isotope compositions of two sources pooled in the analysis may obscure the relative importance of contribution [47,69]. Underlying crucial carbon sources may be masked given the broad range of possible of solutions due to the large overlap of seston and C3 plant isotope values in our models.

5. Conclusions

This study indicates that riparian C3 plants were the major energy source supporting fish consumers in a tributary of the TGR. Aquatic algae were also an important secondary carbon source, but the components of algae changed spatially in the river with planktonic algae being dominant in the downstream and benthic algae in the upstream. This is possibly a result of different landscape-scale hydrologic characteristics within the stream. C4 plants provided little support for fish consumers even though they were plentiful along the riparian. The lower quality of C4 plants that affected food source utilization, compared to C3 carbon, may account for this discrepancy. The comparatively lesser importance of algae to riparian C3 carbon in the backwater area does not fully support the RPM. However, our results emphasize the consistent carbon subsidies from riparian terrestrial plants in the lacustrine zone after nearly ten years of e impoundment of the TGR. In agreement with the limited availability of algal carbon in this zone, another explanation is the hydrologic regime of the water-level-fluctuation cycle in the downstream, restricting algal carbon biomass production and promoting the opportunity of riparian C3 vegetation with its decaying detritus assimilation. Moreover, the feeding strategies did not shift C3 plants to being the dominant carbon source for all the species, indicating that an abundant carbon source of nutritious C3 plants emerging along the Daning River support this typical tributary.

Supplementary Materials

The following are available online at https://www.mdpi.com/2073-4441/10/9/1233/s1. Table S1. Summary of stable isotope compositions (δ13C and δ15N, mean ± SD) for basal carbon sources and fish collected from the Daning River.

Author Contributions

Conceptualization, H.D., D.C., and Y.L.; Investigation, H.D., M.L. and X.D.; Writing-Original Draft Preparation, H.D.; Writing-Review & Editing, H.D., Y.L., M.L., S.L. and D.C.

Funding

This research was funded by the Hubei Key Laboratory of the Three Gorges Project for Conservation of Fishes (Grant NO. SXSN14381).

Acknowledgments

We are grateful to Ke Yuan for the assistance with laboratory analysis of carbon and nitrogen isotope ratios.

Conflicts of Interest

The authors declare no conflict of interest.

References

  1. Vannote, R.L.; Minshall, G.W.; Cummins, K.W.; Sedell, J.R.; Cushing, C.E. The river continuum concept. Can. J. Fish. Aquat. Sci. 1980, 37, 130–137. [Google Scholar] [CrossRef]
  2. Junk, W.J.; Bayley, P.B.; Sparks, R.E. The flood pulse concept in river-floodplain systems. Can. Spec. Publ. Fish. Aquat. Sci. 1989, 106, 110–127. [Google Scholar]
  3. Thorp, J.H.; Delong, M.D. The riverine productivity model: An heuristic view of carbon sources and organic processing in large river ecosystems. Oikos 1994, 70, 305–308. [Google Scholar] [CrossRef]
  4. Pingram, M.A.; Collier, K.J.; Hamilton, D.P.; David, B.O.; Hicks, B.J. Carbon sources supporting large river food webs: A review of ecological theories and evidence from stable isotopes. Freshw. Rev. 2012, 5, 85–103. [Google Scholar] [CrossRef]
  5. Thorp, J.H.; Delong, M.D.; Greenwood, K.S.; Casper, A.F. Isotopic analysis of three food web theories in constricted and floodplain regions of a large river. Oecologia 1998, 117, 551–563. [Google Scholar] [CrossRef] [PubMed]
  6. Thorp, J.H.; Delong, M.D. Dominance of autochthonous autotrophic carbon in food webs of heterotrophic rivers. Oikos 2002, 96, 543–550. [Google Scholar] [CrossRef]
  7. Delong, M.D.; Thorp, J.H. Significance of instream autotrophs in trophic dynamics of the Upper Mississippi River. Oecologia 2006, 147, 76–85. [Google Scholar] [CrossRef] [PubMed]
  8. Hoeinghaus, D.J.; Winemiller, K.O.; Agostinho, A.A. Landscape-scale hydrologic characteristics differentiate patterns of carbon flow in large-river food webs. Ecosystems 2007, 10, 1019–1033. [Google Scholar] [CrossRef]
  9. Zeug, S.C.; Winemiller, K.O. Evidence supporting the importance of terrestrial carbon in a large-river food web. Ecology 2008, 89, 1733–1743. [Google Scholar] [CrossRef] [PubMed]
  10. Thorp, J.H.; Thoms, M.C.; Delong, M.D. The riverine ecosystem synthesis: Biocomplexity in river networks across space and time. River Res. Appl. 2006, 22, 123–147. [Google Scholar] [CrossRef]
  11. Thorp, J.H.; Thoms, M.C.; Delong, M.D. The Riverine Ecosystem Synthesis, 1st ed.; Elsevier: London, UK, 2008. [Google Scholar]
  12. Humphries, P.; Keckeis, H.; Finlayson, B. The river wave concept: Integrating river ecosystem models. BioScience 2014, 64, 870–882. [Google Scholar] [CrossRef]
  13. Mercado-Silva, N.; Helmus, M.R.; Zanden, M.J.V. The effects of impoundment and non-native species on a river food web in Mexico’s central plateau. River Res. Appl. 2009, 25, 1090–1108. [Google Scholar] [CrossRef]
  14. Freedman, J.A.; Lorson, B.D.; Taylor, R.B.; Carline, R.F.; Stauffer, J.R. River of the dammed: Longitudinal changes in fish assemblages in response to dams. Hydrobiologia 2014, 727, 19–33. [Google Scholar] [CrossRef]
  15. Carvalho, D.R.; Castro, D.; Callisto, M.; Moreira, M.Z.; Pompeu, P.S. Isotopic variation in five species of stream fishes under the influence of different land uses. J. Fish Biol. 2015, 87, 559–578. [Google Scholar] [CrossRef] [PubMed]
  16. Kaymak, N.; Winemiller, K.O.; Akin, S.; Altuner, Z.; Polat, F.; Dal, T. Stable isotope analysis reveals relative influences of seasonal hydrologic variation and impoundment on assimilation of primary production sources by fish in the Upper Yesilırmak River, Turkey. Hydrobiologia 2015, 753, 131–147. [Google Scholar] [CrossRef]
  17. Delong, M.D.; Thoms, M.C. Changes in the trophic status of fish feeding guilds in response to flow modification. J. Geophys. Res. Biogeosci. 2016, 121, 949–964. [Google Scholar] [CrossRef]
  18. Herwig, B.R.; Wahl, D.H.; Detters, J.M.; Soluk, D.A. Spatial and temporal patterns in the food web structure of a large floodplain river assessed using stable isotopes. Can. J. Fish. Aquat. Sci. 2007, 64, 495–508. [Google Scholar] [CrossRef]
  19. Poole, G.C. Stream hydrogeomorphology as a physical science basis for advances in stream ecology. J. N. Am. Benthol. Soc. 2010, 29, 12–25. [Google Scholar] [CrossRef]
  20. Power, M.E.; Dietrich, W.E.; Finlay, J.C. Dams and downstream aquatic biodiversity: Potential food web consequences of hydrologic and geomorphic change. Environ. Manag. 1996, 20, 887–895. [Google Scholar] [CrossRef]
  21. Doi, H.; Chang, K.H.; Ando, T.; Imai, H.; Nakano, S.I.; Kajimoto, A.; Katano, I. Drifting plankton from a reservoir subsidize downstream food webs and alter community structure. Oecologia 2008, 156, 363–371. [Google Scholar] [CrossRef] [PubMed]
  22. Wellard Kelly, H.A.; Rosi-Marshall, E.J.; Kennedy, T.A.; Hall, R.O., Jr.; Cross, W.F.; Baxter, C.V. Macroinvertebrate diets reflect tributary inputs and turbidity-driven changes in food availability in the Colorado River downstream of Glen Canyon Dam. Freshw. Sci. 2013, 32, 397–410. [Google Scholar] [CrossRef]
  23. Fernandes, C.C.; Podos, J.; Lundberg, J.G. Amazonian ecology: Tributaries enhance the diversity of electric fishes. Science 2004, 305, 1960–1962. [Google Scholar] [CrossRef] [PubMed]
  24. Wang, J.; Gu, B.; Huang, J.; Han, X.; Lin, G.; Zheng, F.; Li, Y. Terrestrial contributions to the aquatic food web in the middle Yangtze River. PLoS ONE 2014, 9, e102473. [Google Scholar] [CrossRef] [PubMed]
  25. Li, B.; Wang, Z.J.; Yue, X.J.; Wang, Y.M.; Jin, L.; Zhang, Y.G. Influence of 175-m-impoundment in Three Gorges Reservoir Area on the food web energy sources of main commercial fishes in backwater area of Xiaojiang River. Chin. J. Appl. Ecol. 2013, 24, 1715–1721. [Google Scholar]
  26. Deng, C. Studies on Entrophication in the Three Gorgers Reservoir, 1st ed.; China Environmental Science Press: Beijing, China, 2007. [Google Scholar]
  27. Hang, Y. Study on Pollution Character and Water Environment Impact of the Wet-Dry Zones in the Three Gorges Reservoir. Ph.D. Thesis, Chongqing University, Chongqi, China, 2007. [Google Scholar]
  28. Shen, Z.; Hong, Q.; Yu, H.; Liu, R. Parameter uncertainty analysis of the non-point source pollution in the Daning River watershed of the Three Gorges Reservoir Region, China. Sci. Total Environ. 2008, 405, 195–205. [Google Scholar] [CrossRef] [PubMed]
  29. Yang, F.; Yao, W.Z.; Deng, H.T.; Chen, D.Q.; Liu, S.P.; Duan, X.B. The current situation of fish resources in the Daning River after the impoundment of the Three Gorges Reservoir. Freshw. Fish. 2013, 43, 51–57. [Google Scholar]
  30. The Fish Laboratory of Institute Hydrobiology of Hubei Province. Fishes in the Yangtze River, 1st ed.; Science Press: Beijing, China, 1976. [Google Scholar]
  31. Zeng, X.Z. Fishery Resources of the Yangtze River Basin, 1st ed.; Marine Press: Beijing, China, 1990. [Google Scholar]
  32. Ding, R.H. The Fishes of Sichuan, 1st ed.; Sichuan Publishing House of Science and Technology: Chengdu, China, 1994. [Google Scholar]
  33. Zhang, T.L. Life-History Strategies, Trophic Patterns and Community Structure in the Fishes of Lake Biandantang. Ph.D. Thesis, Graduate University of the Chinese Academy of Sciences, Wuhan, China, 2005; pp. 61–118. [Google Scholar]
  34. Parnell, A.C.; Inger, R.; Bearhop, S.; Jackson, A.L. Source partitioning using stable isotopes: Coping with too much variation. PLoS ONE 2010, 5, e9672. [Google Scholar] [CrossRef] [PubMed] [Green Version]
  35. Post, D.M. Using stable isotopes to estimate trophic position: Models, methods, and assumptions. Ecology 2002, 83, 703–718. [Google Scholar] [CrossRef]
  36. Vander Zanden, M.J.; Rasmussen, J.B. Variation in δ15N and δ13C trophic fractionation: Implications for aquatic food web studies. Limnol. Oceanogr. 2001, 46, 2061–2066. [Google Scholar] [CrossRef]
  37. Marchese, M.R.; Saigo, M.; Zilli, F.L.; Capello, S.; Devercelli, M.; Montalto, L.; Paporello, G.; Wantzen, K.M. Food webs of the Paraná River floodplain: Assessing basal sources using stable carbon and nitrogen isotopes. Limnologica 2014, 46, 22–30. [Google Scholar] [CrossRef]
  38. Zeng, Y.; Lai, Z.; Yang, W.; Li, H. Stable isotopes reveal food web reliance on different carbon sources in a subtropical watershed in South China. Limnologica 2018, 69, 39–45. [Google Scholar] [CrossRef]
  39. Leigh, C.; Burford, M.A.; Sheldon, F.; Bunn, S.E. Dynamic stability in dry season food webs within tropical floodplain rivers. Mar. Freshw. Res. 2010, 61, 357–368. [Google Scholar] [CrossRef]
  40. Pingram, M.A.; Collier, K.J.; Hamilton, D.P.; Hicks, B.J.; David, B.O. Spatial and temporal patterns of carbon flow in a temperate, large river food web. Hydrobiologia 2014, 729, 107–131. [Google Scholar] [CrossRef]
  41. Neres-Lima, V.; Brito, E.F.; Krsulović, F.A.; Detweiler, A.M.; Hershey, A.E.; Moulton, T.P. High importance of autochthonous basal food source for the food web of a Brazilian tropical stream regardless of shading. Int. Rev. Hydrobiol. 2016, 101, 132–142. [Google Scholar] [CrossRef]
  42. Forsberg, B.R.; Araujo-Lima, C.A.R.M.; Martinelli, L.A.; Victoria, R.L.; Bonassi, J.A. Autotrophic carbon sources for fish of the central Amazon. Ecology 1993, 74, 643–652. [Google Scholar] [CrossRef]
  43. Marcarelli, A.M.; Baxter, C.V.; Mineau, M.M.; Hall, R.O. Quantity and quality: Unifying food web and ecosystem perspectives on the role of resource subsidies in freshwaters. Ecology 2011, 92, 1215–1225. [Google Scholar] [CrossRef] [PubMed]
  44. Carroll, T.M.; Thorp, J.H.; Roach, K.A. Autochthony in karst spring food webs. Hydrobiologia 2016, 776, 173–191. [Google Scholar] [CrossRef]
  45. Brett, M.T.; Bunn, S.E.; Chandra, S.; Galloway, A.W.; Guo, F.; Kainz, M.J.; Kankaala, P.; Lau, D.C.; Moulton, T.P.; Power, M.E.; et al. How important are terrestrial organic carbon inputs for secondary production in freshwater ecosystems? Freshw. Biol. 2017, 62, 833–853. [Google Scholar]
  46. Oliveira, A.C.B.; Soares, M.G.M.; Martinelli, L.A.; Moreira, M.Z. Carbon sources of fish in an Amazonian floodplain lake. Aquat. Sci. 2006, 68, 229–238. [Google Scholar] [CrossRef]
  47. Mortillaro, J.M.; Pouilly, M.; Wach, M.; Freitas, C.E.C.; Abril, G.; Meziane, T. Trophic opportunism of central Amazon floodplain fish. Freshw. Biol. 2015, 60, 1659–1670. [Google Scholar] [CrossRef]
  48. Roach, K.A.; Winemiller, K.O.; Davis, S.E., III. Autochthonous production in shallow littoral zones of five floodplain rivers: Effects of flow, turbidity and nutrients. Freshw. Biol. 2014, 59, 1278–1293. [Google Scholar] [CrossRef]
  49. Finlay, J.C. Stable-carbon-isotope ratios of river biota: Implications for energy flow in lotic food webs. Ecology 2001, 82, 1052–1064. [Google Scholar] [CrossRef]
  50. Zhu, K.; Bi, Y.; Hu, Z. Responses of phytoplankton functional groups to the hydrologic regime in the Daning River, a tributary of Three Gorges Reservoir, China. Sci. Total Environ. 2013, 450, 169–177. [Google Scholar] [CrossRef] [PubMed] [Green Version]
  51. Zhao, Y.; Zheng, B.; Wang, L.; Qin, Y.; Li, H.; Cao, W. Characterization of mixing processes in the confluence zone between the Three Gorges Reservoir mainstream and the Daning River using stable isotope analysis. Environ. Sci. Technol. 2015, 50, 9907–9914. [Google Scholar] [CrossRef] [PubMed]
  52. Holbach, A.; Wang, L.; Chen, H.; Hu, W.; Schleicher, N.; Zheng, B.; Norra, S. Water mass interaction in the confluence zone of the Daning River and the Yangtze River—A driving force for algal growth in the Three Gorges Reservoir. Environ. Sci. Pollut. Res. 2013, 20, 7027–7037. [Google Scholar] [CrossRef] [PubMed]
  53. Zhang, J.L.; Zheng, B.H.; Liu, L.S.; Wang, L.P.; Huang, M.S.; Wu, G.Y. Seasonal variation of phytoplankton in the DaNing River and its relationships with environmental factors after impounding of the Three Gorges Reservoir: A four-year study. Procedia Environ. Sci. 2010, 2, 1479–1490. [Google Scholar] [CrossRef]
  54. Becker, V.; Huszar, V.L.M.; Naselli-Flores, L.U.I.G.I.; Padisak, J. Phytoplankton equilibrium phases during thermal stratification in a deep subtropical reservoir. Freshw. Biol. 2008, 53, 952–963. [Google Scholar] [CrossRef]
  55. Jepsen, D.B.; Winemiller, K.O. Basin geochemistry and isotopic ratios of fishes and basal production sources in four neotropical rivers. Ecol. Freshw. Fish. 2007, 16, 267–281. [Google Scholar] [CrossRef]
  56. Mao, Z.G.; Gu, X.H.; Zeng, Q.F.; Chen, H.H. Carbon sources and trophic structure in a macrophyte-dominated polyculture pond assessed by stable-isotope analysis. Freshw. Biol. 2016, 61, 1862–1873. [Google Scholar] [CrossRef]
  57. Webb, P.W. Body and fin form and strike tactics of four teleost predators attacking fathead minnow (Pimephales promelas) prey. Can. J. Fish. Aquat. Sci. 1984, 41, 157–165. [Google Scholar] [CrossRef]
  58. Drewe, K.E.; Horn, M.H.; Dickson, K.A.; Gawlicka, A. Insectivore to frugivore: Ontogenetic changes in gut morphology and digestive enzyme activity in the characid fish Brycon guatemalensis from Costa Rican rain forest streams. J. Fish. Biol. 2004, 64, 890–902. [Google Scholar] [CrossRef]
  59. Beaudoin, C.P.; Tonn, W.M.; Prepas, E.E.; Wassenaar, L.I. Individual specialization and trophic adaptability of northern pike (Esox lucius): An isotope and dietary analysis. Oecologia 1999, 120, 386–396. [Google Scholar] [CrossRef] [PubMed]
  60. Correa, S.B.; Winemiller, K.O. Niche partitioning among frugivorous fishes in response to fluctuating resources in the Amazonian floodplain forest. Ecology 2014, 95, 210–224. [Google Scholar] [CrossRef] [PubMed]
  61. Abrams, P.A. Life history and the relationship between food availability and foraging effort. Ecology 1991, 72, 1242–1252. [Google Scholar] [CrossRef]
  62. Peterson, C.C.; Winemiller, K.O. Ontogenic diet shifts and scale-eating in Roeboides dayi, a Neotropical characid. Environ. Biol. Fish. 1997, 49, 111–118. [Google Scholar] [CrossRef]
  63. Croxall, J.P.; Reid, K.; Prince, P.A. Diet, provisioning and productivity responses of marine predators to differences in availability of Antarctic krill. Mar. Ecol. Prog. Ser. 1999, 177, 115–131. [Google Scholar] [CrossRef] [Green Version]
  64. Vaudo, J.J.; Heithaus, M.R. Dietary niche overlap in a nearshore elasmobranch mesopredator community. Mar. Ecol. Prog. Ser. 2011, 425, 247–260. [Google Scholar] [CrossRef] [Green Version]
  65. Winemiller, K.O. Ontogenetic diet shifts and resource partitioning among piscivorous fishes in the Venezuelan ilanos. Environ. Biol. Fish. 1989, 26, 177–199. [Google Scholar] [CrossRef]
  66. Quevedo, M.; Svanbäck, R.; Eklöv, P. Intrapopulation niche partitioning in a generalist predator limits food web connectivity. Ecology 2009, 90, 2263–2274. [Google Scholar] [CrossRef] [PubMed] [Green Version]
  67. Spataru, P.; Gophen, M. Feeding behaviour of silver carp Hypophthalmichthys molitrix Val. and its impact on the food web in Lake Kinneret, Israel. Hydrobiologia 1985, 120, 53–61. [Google Scholar] [CrossRef]
  68. Ke, Z.; Xie, P.; Guo, L.; Liu, Y.; Yang, H. In situ study on the control of toxic Microcystis blooms using phytoplanktivorous fish in the subtropical Lake Taihu of China: A large fish pen experiment. Aquaculture 2007, 265, 127–138. [Google Scholar] [CrossRef] [Green Version]
  69. Phillips, D.L.; Inger, R.; Bearhop, S.; Jackson, A.L.; Moore, J.W.; Parnell, A.C.; Semmens, B.X.; Ward, E.J. Best practices for use of stable isotope mixing models in food-web studies. Can. J. Zool. 2014, 92, 823–835. [Google Scholar] [CrossRef]
Figure 1. The location of the Three Gorges Reservoir Region and the sampling sites in the Daning River.
Water 10 01233 g001
Figure 2. Biplot of δ13C and δ15N values (mean value and standard deviation) of basal organic carbon sources and fish collected from the downstream (backwater zone) of the Daning River. The fish species code was in accordance with Table 1. Black square, organic matter sources; green triangle, benthivores; blue inverted triangle, piscivores; violet diamond, omnivores; yellow dot, planktivores; red star, herbivores.
Water 10 01233 g002
Figure 3. Biplot of δ13C and δ15N values (mean value and standard deviation) of basal organic carbon sources (black square) and fish (blue dot) collected from the upstream of the Daning River. The fish species code was in accordance with Table 2.
Water 10 01233 g003
Figure 4. Comparison of the highest likely contributions of four basal carbon sources to fish species between the downstream (backwater zone) and the upstream. (A) All fish species from the downstream and upstream; (B) only omnivorous fish from the downstream and all of the upstream fish. Boxes show the interquartile range, and whiskers show the 10th and 90th percentiles. The median and mean values are shown as a horizontal line and cross in the middle of the box, respectively.
Water 10 01233 g004
Figure 5. Averages of proportional contributions in four basal carbon sources of different trophic groups in the downstream (backwater zone) of the Daning River.
Water 10 01233 g005
Table 1. Bayesian isotopic mixing model estimates of the highest likely percent contributions (95% BCI, Bayesian credibility interval) of basal carbon sources to different feeding types of fish species collected from the downstream (backwater zone) of the Daning River.
CodeTaxaC3 PlantsBenthic AlgaeSestonC4 Plants
Herbivores
1Parabramis pekinensis0.31 (0.10–0.49)0.31 (0.02–0.50)0.31 (0.02–0.48)0.13 (0.00–0.31)
2Ctenopharyngodon idella0.27 (0.03–0.46)0.27 (0.00–0.45)0.27 (0.00–0.46)0.30 (0.06–0.48)
3Squaliobarbus curriculus0.30 (0.03–0.46)0.29 (0.00–0.49)0.27 (0.00–0.44)0.25 (0.02–0.43)
4Megalobrama amblycephala0.33 (0.03–0.56)0.26 (0.00–0.45)0.29 (0.00–0.48)0.21 (0.00–0.40)
5Spinibarbus sinensis0.31 (0.08–0.50)0.30 (0.01–0.49)0.28 (0.01–0.43)0.19 (0.01–0.37)
Planktivores
6Hypophthalmichthys molitrix0.71 (0.46–0.85)0.04 (0.00–0.21)0.06 (0.00 –0.40)0.02 (0.00–0.15)
7Aristichthys nobilis0.55 (0.33–0.80)0.04 (0.00–0.26)0.26 (0.00–0.47)0.03 (0.00–0.18)
8Neosalanx taihuensis0.38 (0.06–0.75)0.05 (0.00–0.39)0.33 (0.00–0.59)0.03 (0.00–0.31)
9Hyporhamphus intermedius0.31 (0.02–0.62)0.26 (0.00–0.45)0.28 (0.00–0.51)0.05 (0.00–0.40)
Benthivores
10Silurus asotus0.43 (0.20–0.70)0.19 (0.00–0.38)0.31 (0.01–0.49)0.03 (0.00–0.25)
11Myxocyprinus asiaticus0.32 (0.11–0.53)0.27 (0.00–0.45)0.27 (0.00–0.43)0.25 (0.02–0.41)
12Pelteobagrus nitidus0.36 (0.10–0.64)0.24 (0.00–0.42)0.31 (0.01–0.51)0.03 (0.00–0.31)
13Pelteobagrus vachelli0.52 (0.29–0.72)0.05 (0.00–0.34)0.30 (0.00–0.45)0.07 (0.00–0.25)
14Coreius heterodon0.42 (0.13–0.73)0.08 (0.00–0.38)0.32 (0.01–0.52)0.03 (0.00–0.28)
Piscivores
15Culter dabryi dabryi0.28 (0.04–0.45)0.32 (0.02–0.51)0.32 (0.03–0.52)0.13 (0.00–0.32)
16Siniperca kneri0.40 (0.22–0.58)0.28 (0.01–0.45)0.24 (0.01–0.40)0.10 (0.00–0.29)
17Elopichthys bambusa0.36 (0.15–0.61)0.29 (0.00–0.43)0.30 (0.01–0.48)0.05 (0.00–0.28)
18Culter mongolicus0.34 (0.10–0.57)0.27 (0.00–0.45)0.29 (0.01–0.48)0.12 (0.00–0.32)
19Culter alburnus0.43 (0.23–0.63)0.28 (0.01–0.42)0.27 (0.01–0.44)0.04 (0.00–0.25)
20Leiocassis longirostris0.30 (0.09–0.50)0.30 (0.01–0.49)0.23 (0.00–0.41)0.24 (0.02–0.40)
Omnivores
21Hemiculter leucisculus0.35 (0.18–0.58)0.08 (0.00–0.41)0.30 (0.00–0.44)0.22 (0.01–0.35)
22Carassius auratus0.28 (0.12–0.43)0.25 (0.01–0.44)0.10 (0.00–0.33)0.33 (0.16–0.50)
23Cyprinus carpio0.25 (0.06–0.42)0.26 (0.00–0.46)0.18 (0.00–0.38)0.31 (0.14–0.53)
24Opsariichthys bidens0.31 (0.04–0.51)0.28 (0.00–0.47)0.29 (0.00–0.46)0.21 (0.00–0.39)
25Pseudobrama simoni0.32 (0.14–0.52)0.25 (0.00–0.45)0.25 (0.00–0.41)0.23 (0.02–0.39)
26Squalidus argentatus0.36 (0.18–0.55)0.31 (0.01–0.46)0.30 (0.01–0.44)0.09 (0.00–0.29)
27Hemiculter bleekeri0.34 (0.08–0.60)0.30 (0.00–0.46)0.28 (0.01–0.49)0.04 (0.00–0.33)
28Saurogobio dabryi0.46 (0.25–0.73)0.11 (0.00–0.32)0.33 (0.01–0.52)0.02 (0.00–0.20)
Table 2. Bayesian isotopic mixing model estimates of the highest likely percent contributions (95% BCI, Bayesian credibility interval) of basal carbon sources to fish species collected from the upstream of the Daning River.
CodeTaxaC3 PlantsBenthicalgaeSestonC4 Plants
1Trilophysa bleekeri0.33 (0.01–0.60)0.29 (0.00–0.54)0.25 (0.00–0.43)0.09 (0.00–0.41)
2Rhinogobius cliffordpopei0.41 (0.13–0.66)0.33 (0.01–0.52)0.04 (0.00–0.37)0.03 (0.00–0.33)
3Hemibarbus labeo0.42 (0.20–0.68)0.32 (0.00–0.52)0.06 (0.00–0.34)0.03 (0.00–0.29)
4Onychostoma macrolepis0.34 (0.07–0.61)0.31 (0.00–0.52)0.16 (0.00–0.41)0.04 (0.00–0.37)
5Siniperca kneri0.36 (0.09–0.63)0.30 (0.00–0.50)0.25 (0.00–0.44)0.14 (0.00–0.34)
6Glyptothorax fukiensis0.43 (0.11–0.72)0.34 (0.00–0.56)0.04 (0.00–0.36)0.04 (0.00–0.33)
7Paracobitis variegatus0.46 (0.26–0.73)0.32 (0.01–0.55)0.04 (0.00–0.28)0.02 (0.00–0.24)
8Carassius auratus0.32 (0.02–0.62)0.30 (0.00–0.52)0.04 (0.00–0.44)0.06 (0.00–0.43)
9Acrossocheilus monticolus0.36 (0.11–0.60)0.29 (0.00–0.51)0.12 (0.00–0.41)0.14 (0.00–0.36)
10Zacco platypus0.56 (0.30–0.73)0.26 (0.00–0.51)0.04 (0.00–0.26)0.02 (0.00–0.23)
11Cyprinus carpio0.34 (0.03–0.58)0.30 (0.00–0.52)0.21 (0.00–0.43)0.11 (0.00–0.41)
12Schizothorax prenanti0.34 (0.02–0.57)0.30 (0.00–0.52)0.21 (0.00–0.43)0.18 (0.00–0.41)
13Saurogobio dabryi0.39 (0.18–0.63)0.33 (0.02–0.54)0.08 (0.00–0.36)0.04 (0.00–0.32)
14Discogobio yunnanensis0.49 (0.26–0.71)0.33 (0.00–0.50)0.05 (0.00–0.31)0.04 (0.00–0.26)
15Spinibarbus sinensis0.28 (0.00–0.49)0.27 (0.00–0.49)0.29 (0.00–0.48)0.27 (0.00–0.48)
Table 3. Intergroup dissimilarity for each trophic group in the downstream (backwater zone) of the Daning River.
Intergroup Dissimilarity (%)BenthivoresHerbivoresOmnivoresPiscivores
Herbivores20.36
Omnivores20.8713.36
Piscivores16.8610.7715.56
Planktivores22.4233.0331.3827.84

