A Framework for Assessing Instream Supporting Ecosystem Services Based on Hydroecological Modelling


Institute for Infrastructure and Environment, School of Energy, Geoscience, Infrastructure and Society, Heriot-Watt University, Edinburgh EH14 4AS, UK
*
Author to whom correspondence should be addressed.
Water 2018, 10(9), 1247; https://doi.org/10.3390/w10091247
Submission received: 21 August 2018
/
Revised: 5 September 2018
/
Accepted: 9 September 2018
/
Published: 14 September 2018
(This article belongs to the Section Water Resources Management, Policy and Governance)
Abstract
:River systems provide diverse ecosystem services (ES), such as flood regulation (regulating), fresh water (provisioning), nutrient cycling (supporting), and recreation (cultural), among others. The construction of infrastructure (e.g., for hydropower, irrigation) enhances the delivery of tangible ES for example food or energy (generally provisioning) to meet human needs. However, the resulting change to river flows threatens both the ecological health of a river and its ability to provide intangible but vital ES, for example those which support the delivery of other services. Understanding these supporting ES processes in river systems is essential to fully recognise the impact of water resources development on ES delivery. Whilst approaches for assessing instream supporting ES are under development, to date few provide quantitative methods for assessing delivery. Thus, this paper sets out a framework for the assessment of instream supporting ES using hydroecological modelling. It links supporting ES delivery to fluvial hydrological indicators through the use of ecologically relevant hydrological indices and macroinvertebrate flow preferences. The proposed framework is demonstrated on the Beas River basin (Western Himalayas, India), and is flexible enough to be transferred to a basin-wide model, thereby allowing ES relationships to be accounted for in basin-wide water resources planning.
1. Introduction
River systems provide a range of tangible benefits (e.g., freshwater supply) and intangible benefits (e.g., religious enrichment) which both directly and indirectly contribute to human well-being [1]. In recent decades, the ecosystem services concept has emerged as a key approach in understanding the range of benefits provided. The Millennium Ecosystem Assessment [2] defined ecosystem services as “the benefits people obtain from ecosystems.” These ecosystem services are classified into four broad categories:
- Provisioning—the products obtained from ecosystems e.g., water supply;
- Regulating—the benefits from regulation of ecosystem processes e.g., flood regulation;
- Cultural—the non-material benefits from ecosystems e.g., religious enrichment; and
- Supporting—the underlying processes and services necessary for the production of all other ecosystem services. These include ecosystem processes such as soil formation, primary productivity, biogeochemistry, nutrient cycling, and habitat provision.
Despite their importance, river catchments are among the most threatened and degraded ecosystems in the world [3,4]. The Millennium Ecosystem Assessment [2] attributes this to the modification and alteration of rivers flows, quality and structure, through a range of human activities aimed at tangible benefits like food provision and water supply. While river catchments are often considered as a source of water for supply, they also play a key role in the provision of other ecosystem services [5,6].
Frequently, the development of water resources enhances the provision of tangible ecosystem services; for example, the construction of dams for hydropower and/or irrigation to meet prioritised human needs, provides provisioning ecosystem services such as freshwater and food supply [7,8]. However, as a direct consequence, the provision of intangible services such as nutrient cycling (supporting); habitat provision (supporting) and religious enrichment (cultural) may be reduced [9,10,11]. Alteration of river flows, through such developments, threatens both the ecological health of rivers and their ability to provide these intangible but vital ecosystem services upon which humans are dependent [7,12]. This results in both intentional, and unintentional, trade-offs between ecosystem service categories, negatively impacting downstream ecosystems and the services they provide [1,2].
To recognise the impact of water resources development on ecosystem service delivery, understanding of the formation and regulation of supporting ecosystem services is essential [6]. The role of biota, such as macroinvertebrates, is especially important. Understanding of ecosystem processes and supporting ecosystem services in river systems remains limited, leading to mismanagement [6].
There is no single, accepted and agreed upon methodology for the assessment of ecosystem services [11,13,14]. A variety of methodologies may be applied, ranging from the simple desktop review to complex modelling. Methods focused specifically on the assessment of instream supporting ecosystem services are still in development [6]. One option is to look to the instream macroinvertebrate community. As well as being excellent indicators of environmental change [15], macroinvertebrates play a significant role in the delivery of a diverse range of instream supporting ecosystem services [6,16]. As primary consumers, detritivores, predators, and pollinators, the instream macroinvertebrate community contributes to the provision of ecosystem services in the freshwater environment including nutrient cycling, bioturbation (sediment reworking), bio-irrigation (flushing water through sediment burrows), and decomposition. These include macroinvertebrates positioned at intermediate trophic levels (approximately the middle of the food web) which serve as the main in-stream food source for fish [17] and other invertebrates, as well as a number of birds, mammals, reptiles, and amphibians. Arguably, one of the most important instream supporting ecosystem services provided by the macroinvertebrate community [16], is the breaking down and recycling of organic matter such as leaf litter into dissolved and fine particulate organic matter. This is a fundamental process upon which nutrient cycling is based.
Commonly, the diversity of the instream macroinvertebrate community serves as an ecological proxy for river health, e.g., water quality [18,19,20]. However, macroinvertebrates are also sensitive to changes in the flow regime [21], thus making them ideal for the assessment of the ecological implications of flow regulation and abstraction in river systems [22,23]; they are also frequently used to establish required environmental flows [21,24]. Hydroecological modelling is a well-established technique for the investigation of macroinvertebrate response to flow; examples include [15,22,25,26]. The flow component of this hydroecological relationship is characterised by ecologically/biologically relevant hydrological indices (based on the Indicators of Hydrologic Alteration [27,28,29]; see also the Nature Conservancy Conservation Gateway [30]), whilst the macroinvertebrate community response is determined via the Lotic-Invertebrate Index for Flow Evaluation (LIFE, [21]). LIFE is a weighted index which considers macroinvertebrate flow velocity preferences.
The aim of this paper is to set out a framework for the assessment of instream supporting ecosystem services using macroinvertebrates and hydroecological modelling in order to quantify these alongside more tangible ecosystem services (e.g., water supply). The development and application of the proposed framework is based on the Beas River basin (Western Himalayas, India), where increasing water demands for domestic, industrial, and irrigation purposes and hydropower generation have led to rapid dam construction and development [31]. Additionally, changing climatic conditions have led to increases in temperature, decreased snow fall and glacier shrinkage [32]. These drivers of change have, and continue to, impact on the delivery of ecosystem services. This calls for the need to understand the impact of such developments on ecosystem services delivery; particularly those less tangible [33], in order to balance the conflicting demands of both human society and those of the riverine ecosystem.
2. Proposed Framework
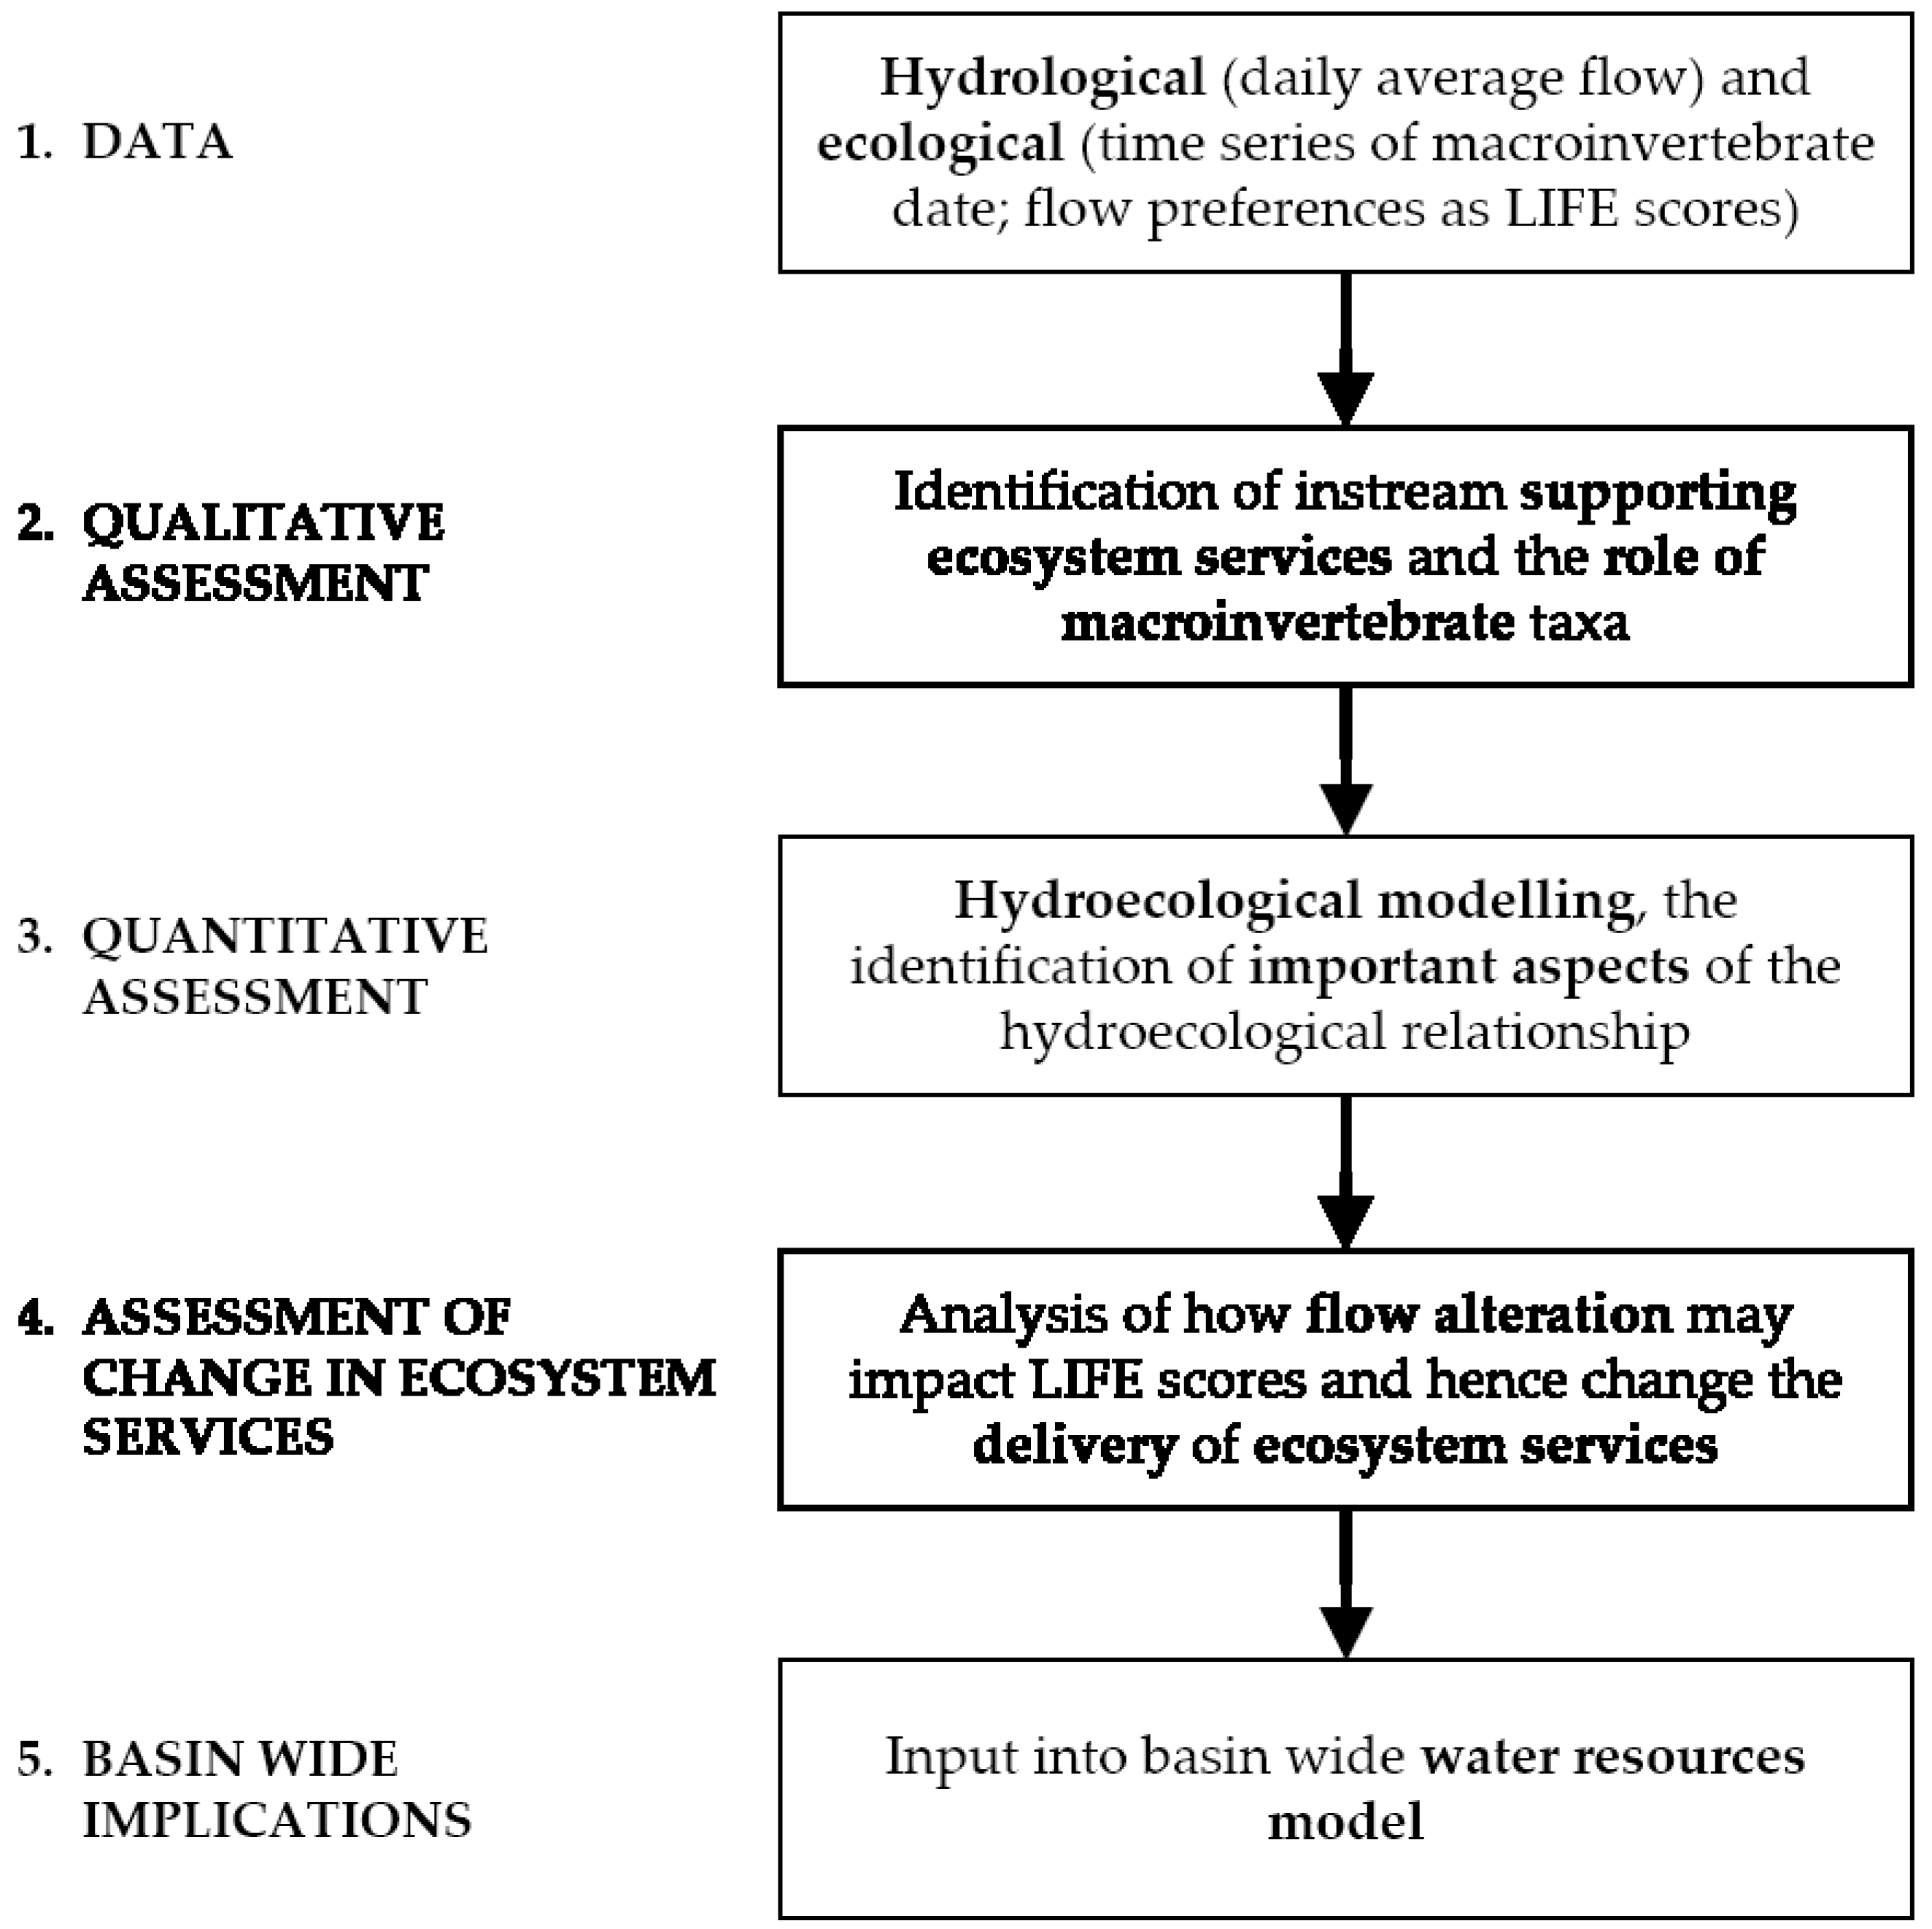
A framework to assess the instream supporting ecosystem services of rivers is proposed and applied to a case study, the Beas River in the Western Himalayas. The goal of the framework is to link ecosystem service delivery to hydrological indicators. In doing so, the framework links changes to ecosystem delivery to be associated with changes in flow; for example: new flow abstraction and future climate change. The framework consists of a five-step methodology: data gathering, assessment (qualitative and quantitative), future investigations and the basin-wide implications (Figure 1).
The first step in the proposed framework is to acquire both hydrological and ecological data, which has to be processed into suitable formats for subsequent steps. Hydrological data has to be analysed to identify ecologically relevant indices, while the macroinvertebrate data (identified to family level) needs to be calculated into LIFE scores to understand the flow preferences of the identified macroinvertebrates. The second step involves the use of literature to catalogue the specific roles played by macroinvertebrates in instream supporting ecosystem services. The third step is a quantitative assessment which involves hydroecological modelling to understand the relationship between flow and identified macroinvertebrates and the use of this relationship to analyse how changes in flow would affect the delivery of instream supporting ecosystem services (Step 4). The final step involves inputting the framework into basin-wide water resource models, such as WEAP in order to build in ecosystem service relationships into basin-wide understanding of future infrastructure development or impact studies. The above steps are each described in detail below.
2.1. Stage 1—Data
Ecological and hydrological indicators serve as the basis for the development of the hydroecological model (Stage 3—Quantitative Assessment). The ecological index is the Lotic-Invertebrate Index for Flow Evaluation (LIFE), a weighted index taking into account the flow velocity preferences (Table 1) of the macroinvertebrate community [21]. The LIFE index is derived from records of macroinvertebrate sampling (taxonomic Family/Species abundance). Taxa are assigned a flow score, fs, based on abundance and flow group (I–VI; Table 1); flow group represents taxa flow preferences or ecological flow association (Table 1). LIFE is the measure of the sum of the flow scores relative to the total number of taxa, n, in a given sample (Equation (1)). LIFE scores can range from 1 to 12, with high scores representing taxa which prefer “rapid flows”, whilst low scores indicate a preference for “drying or drought impacted sites” [34].
A hydrological time series, of at least the length of the ecological dataset (above) is required. Both time series should be of sufficient extent (i.e., sample size) to ensure statistical robustness. Longer time series facilitate greater understanding of seasonality and long-term trends. The hydrological data should be in the form of daily average flows, gauged per site or at the mouth of the catchment.
2.2. Stage 2—Qualitative Assessment
Macroinvertebrates have specific roles and functions in the maintenance of instream supporting ecosystem services. The relative importance of each taxa is dependent on the supporting ecosystem services or process in question. For example, families in the taxonomic order Diptera (true flies), such as Simuliidae (black fly) play a key role in the shredding of coarse plant litter to obtain food; in doing so, they convert coarse leaf litter into fine particulate. Consequently, the presence or absence of particular taxa can alter the rate of processes such as the decomposition rate; such losses could result in changes in energy flow or nutrient cycling.
Following a qualitative approach, the roles and functions of the taxa present in the study area are identified and catalogued in a tabular format (see Section 4.2 Catalogue). With reference to the scientific literature, the roles of the observed taxa in providing supporting ecosystem services are first identified and the associated supporting ecosystem services are then defined. Literature used in the application of the case study includes: [16,17,35,36]. Taxa are classified by their flow preferences, based on the flow groups identified in the LIFE methodology (see stage 1 and Table 1) [21]. Finally, the effect of increasing abundance on LIFE score is determined; essentially, flow groups greater than or lower than III increase and decrease LIFE scores, respectively, whilst changes in the abundance of taxa in flow group III has no effect.
2.3. Stage 3—Quantitative Assessment
The purpose of the quantitative assessment is to identify and quantify the hydroecological relationship in a given river; this is achieved through the development of a numerical model. All analysis may be performed using the open source software R (Version 3.5.0; [37]).
A hydroecological dataset is created by linking the LIFE scores with hydrological indicators (e.g., mean flow, Q10, Q95) from the period immediately preceding the sampling. The hydrological indicators must be ecologically relevant and reflect the five facets of the flow regime required to support riverine ecosystems [27]: Magnitude, frequency, duration, timing, and rate of change; examples include the Indicators of Hydrologic Alteration [28]. It may be necessary to adjust the time period of the hydrological indices to account for seasonality in the hydrological regime. In the case study application, the hydrological indices are calculated per season. If lag in ecological response has been observed, then the hydrological indices may be time-offset following [15,38]. To address any redundancy in the hydrological indicators, Principal component analysis (PCA) is applied; following [39], the most relevant indices are selected proportionally from Richter’s (1996) [27] five facets of the flow regime.
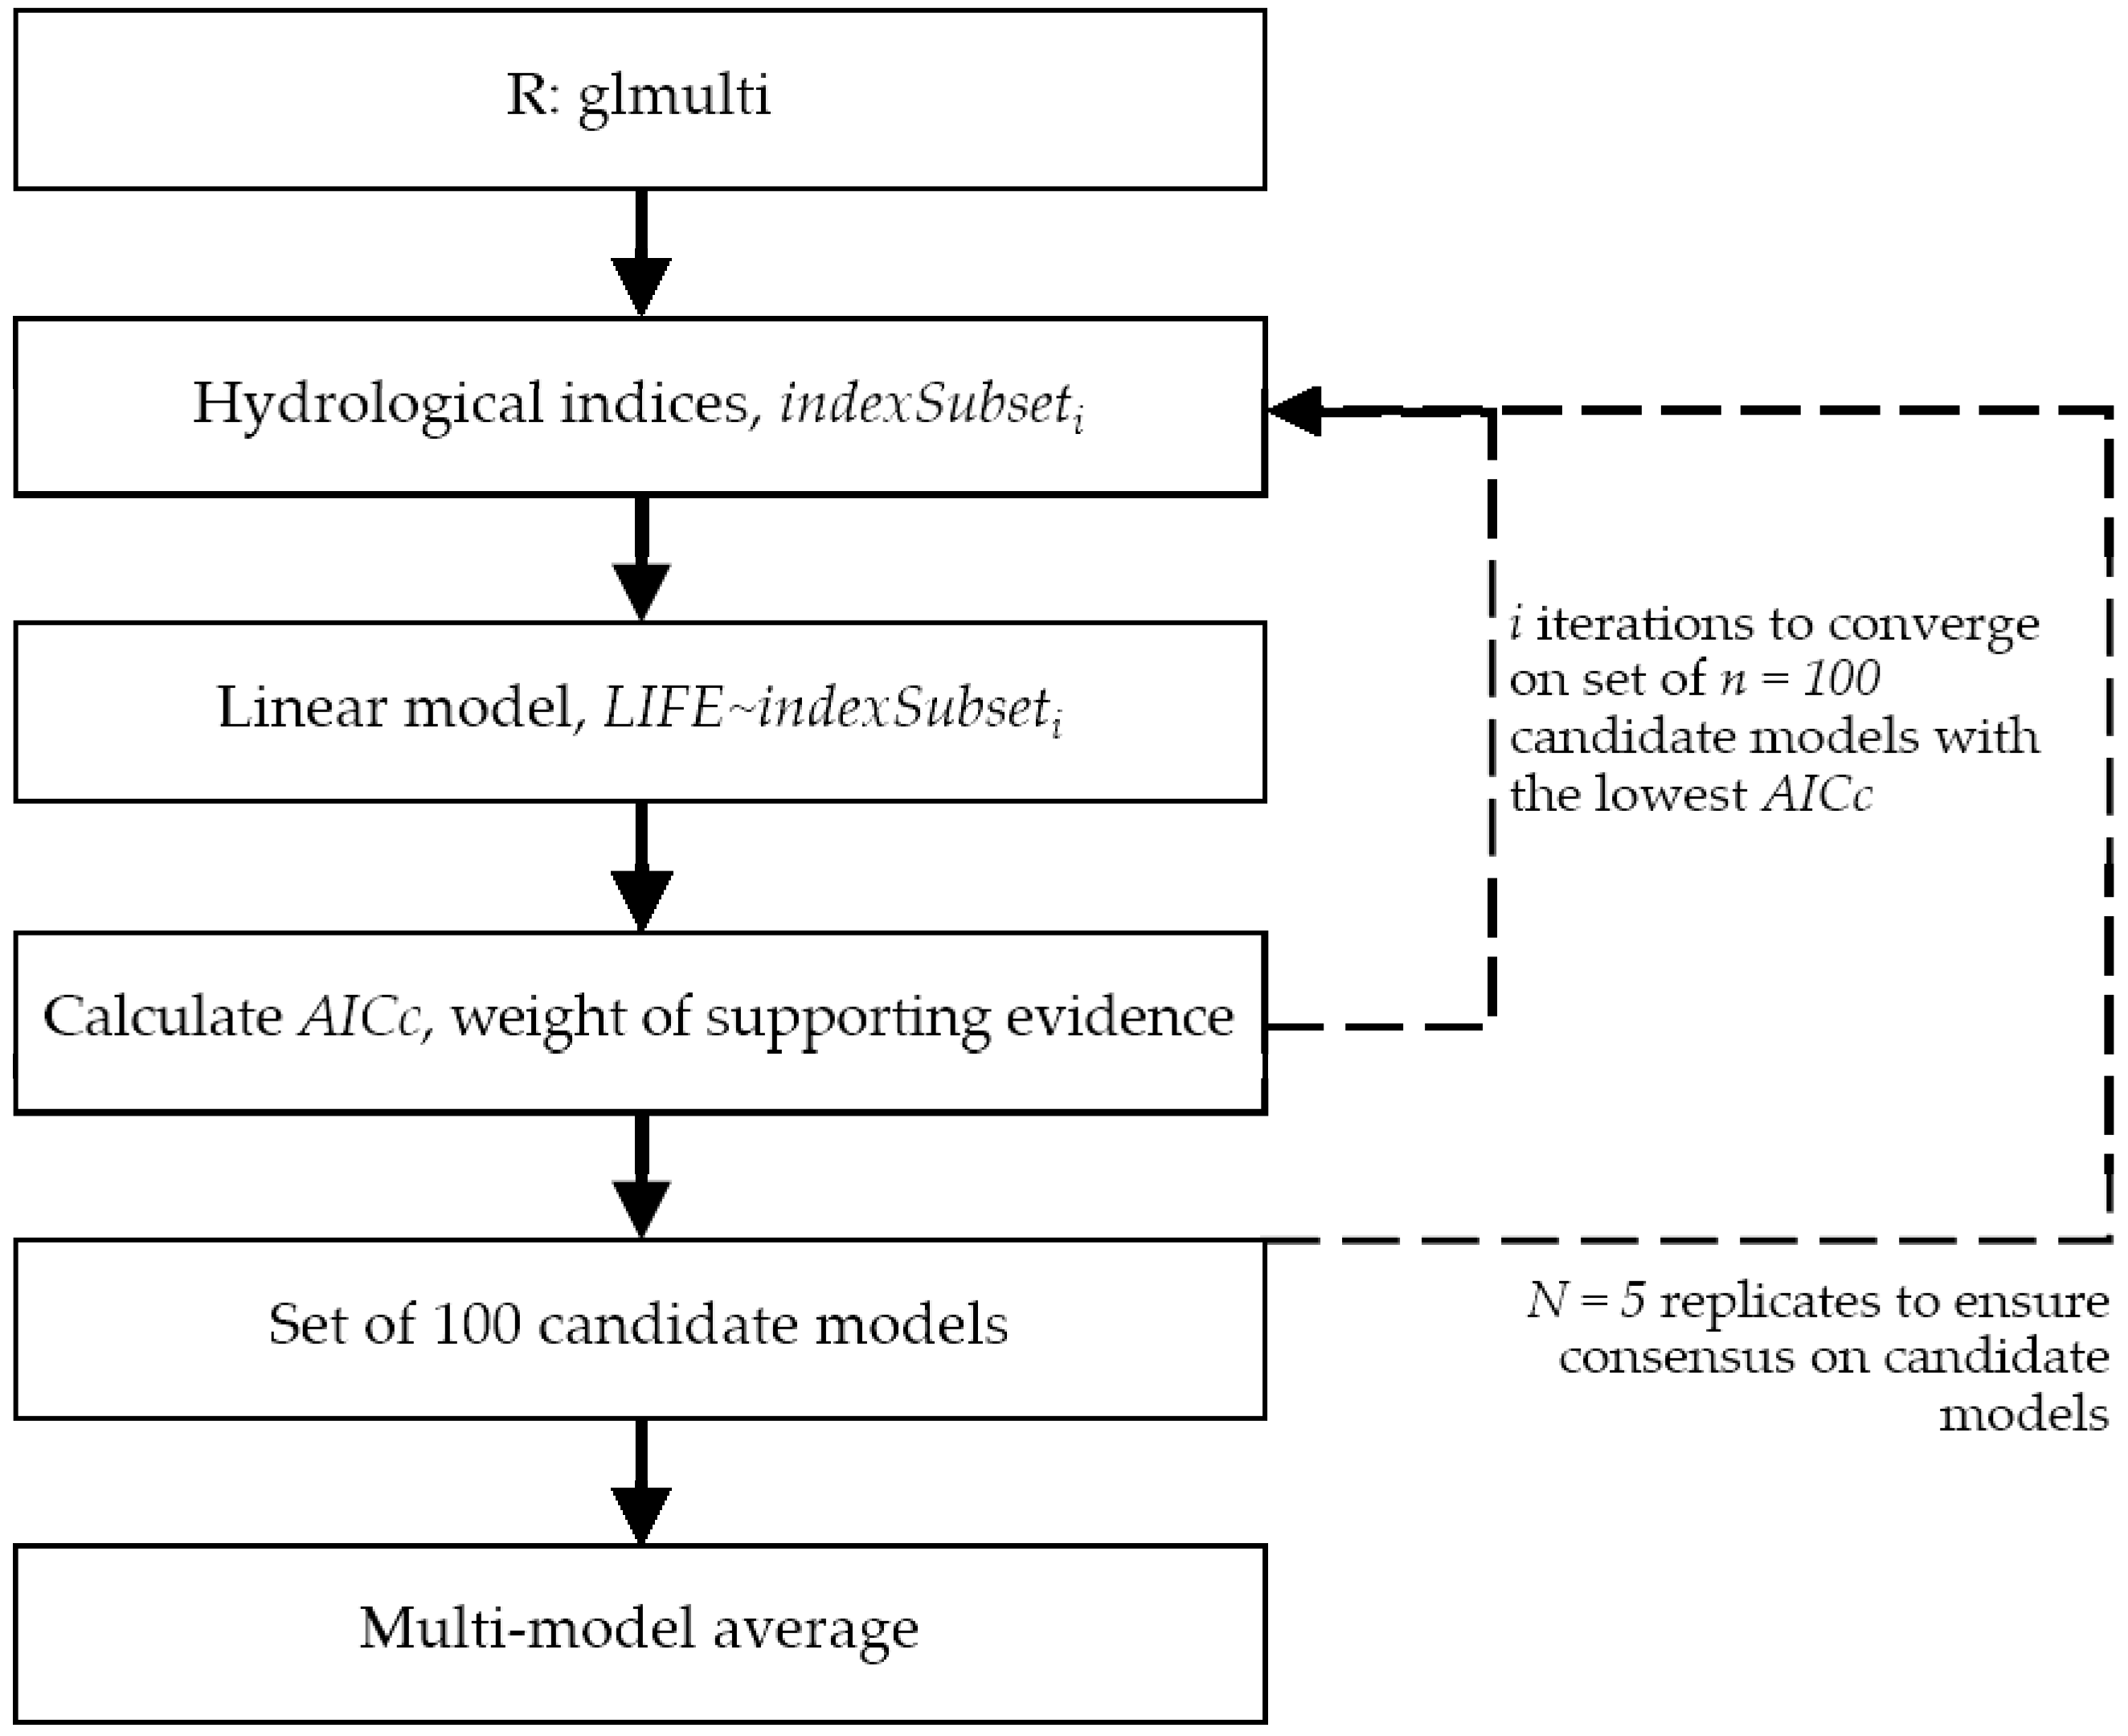
Macroinvertebrate LIFE scores are paired with the reduced set of hydrological indices. Subsequently, the hydroecological model is developed following an information theory approach as set out in [38]; see Figure 2 for application via the R package glmulti [40].
The hydroecological model is assessed in terms of modelling error and statistical uncertainty. Modelling error is a measure of the errors when simulating the data, in this case, the observed data. The analysis is centred on relative error, defined as the measure of error difference divided by observed value. These errors are first considered through an observed-simulated plot, followed by probability density functions which illustrate the distribution and magnitude of the errors.
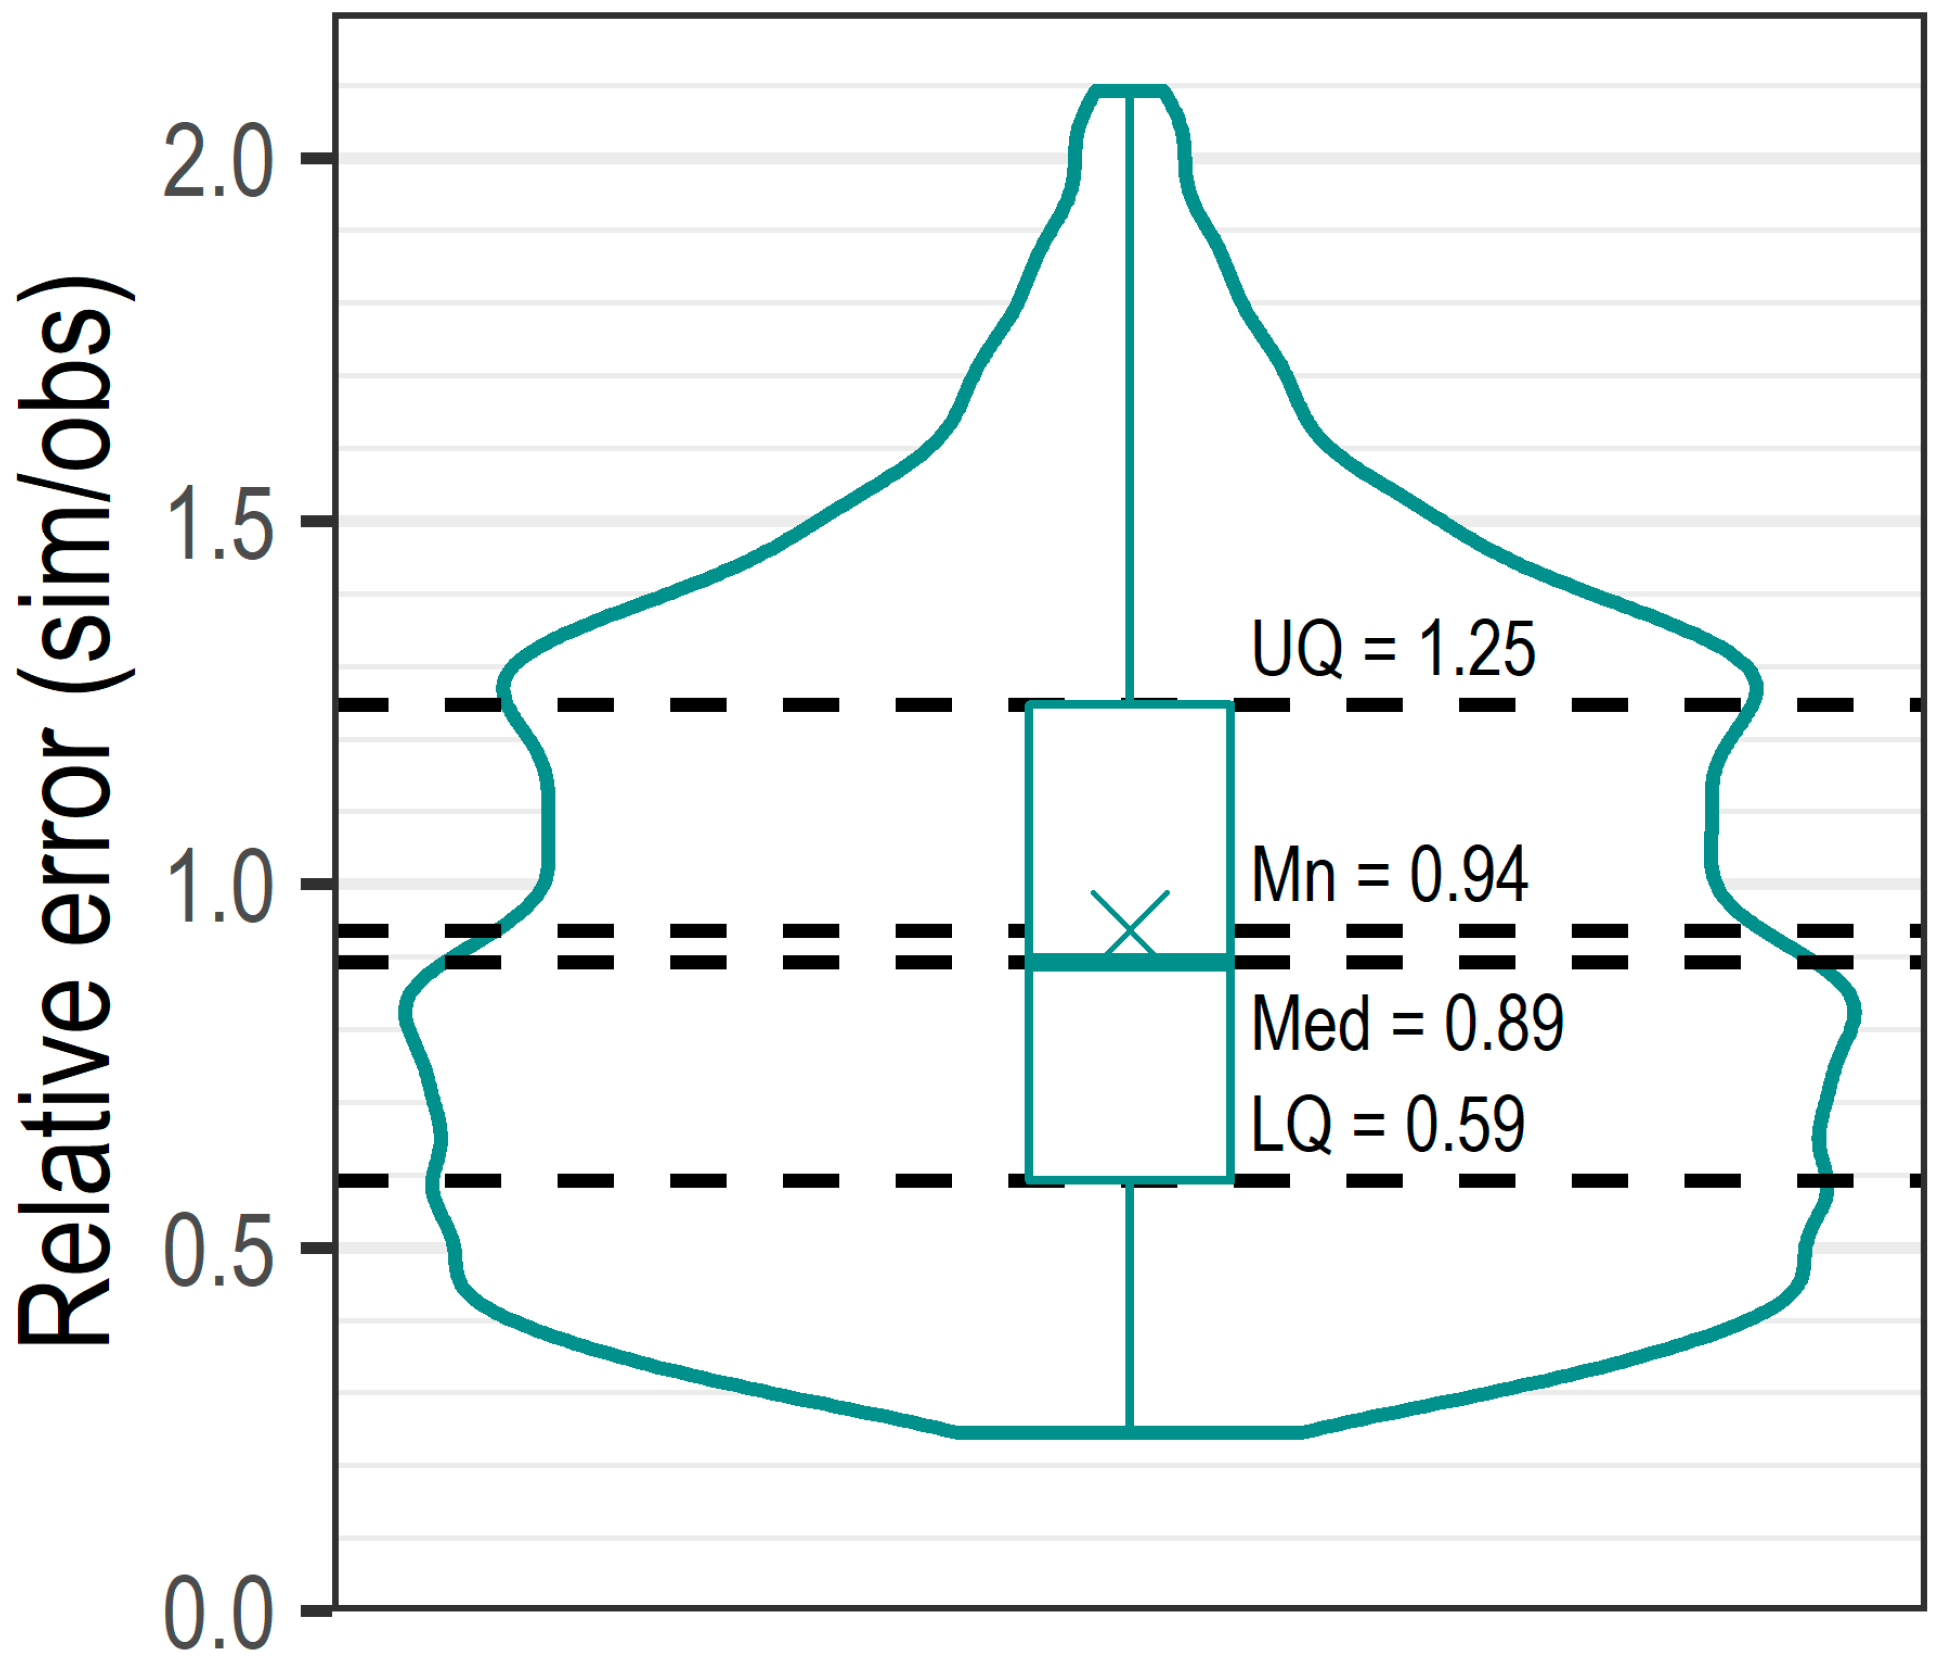
Uncertainty is introduced throughout the modelling process. In this paper, the focus is on statistical uncertainty as defined by [41] (p. 1520): “the difference between a simulated value and an observation” and “the possible variation around the simulated and observed values”. In practical terms, this statistical uncertainty dictates the usefulness of the model. High levels of uncertainty prevents meaningful interpretation of the results, leading to less than optimal decision-making [41]. In order to determine this uncertainty, a Monte Carlo (MC) approach is applied. Uniform random sampling (e.g., through Sobol-sequencing [42]) is used to explore the model parameter space, generating 10,000 parameter sets. Model outputs for each parameter set are determined; the relative error, observed to simulated, is determined for each. This relative error is examined through a violin/box plot, highlighting the magnitude and distribution (violin plot) of modelling errors.
2.4. Stage 4—Assessment of Change in Ecosystem Services
Flow alteration is a principal motivation for the development of this framework. An understanding of the impacts of water resources development and climate change on river flow and thus supporting ecosystem services is essential. These impacts may be assessed by inputting altered flows into the hydroecological model. The method of alteration is dependent on the purpose of the framework application (water resources development or climate change) and the availability of data; examples include the use of climate change projections to drive hydrological models, or the generation of a synthetic time series where the observed flow is altered by percentages, or time series from reservoir releases. Assessment is made with reference to the observed LIFE scores, with the impact upon the delivery of supporting ecosystem services determined with reference to the catalogue (e.g., Section 4.2 Catalogue).
2.5. Stage 5—Basin-Wide Implications
The framework is then easily transferable into basin-wide water resource models such as WEAP or RibaSIM in order to build in ecosystem service relationships into basin-wide understanding of future infrastructure development or impact studies.
3. Framework Application
The proposed framework was applied to the case study, the upper catchment of the Beas River in the western Himalayas (India).
3.1. Case Study Area
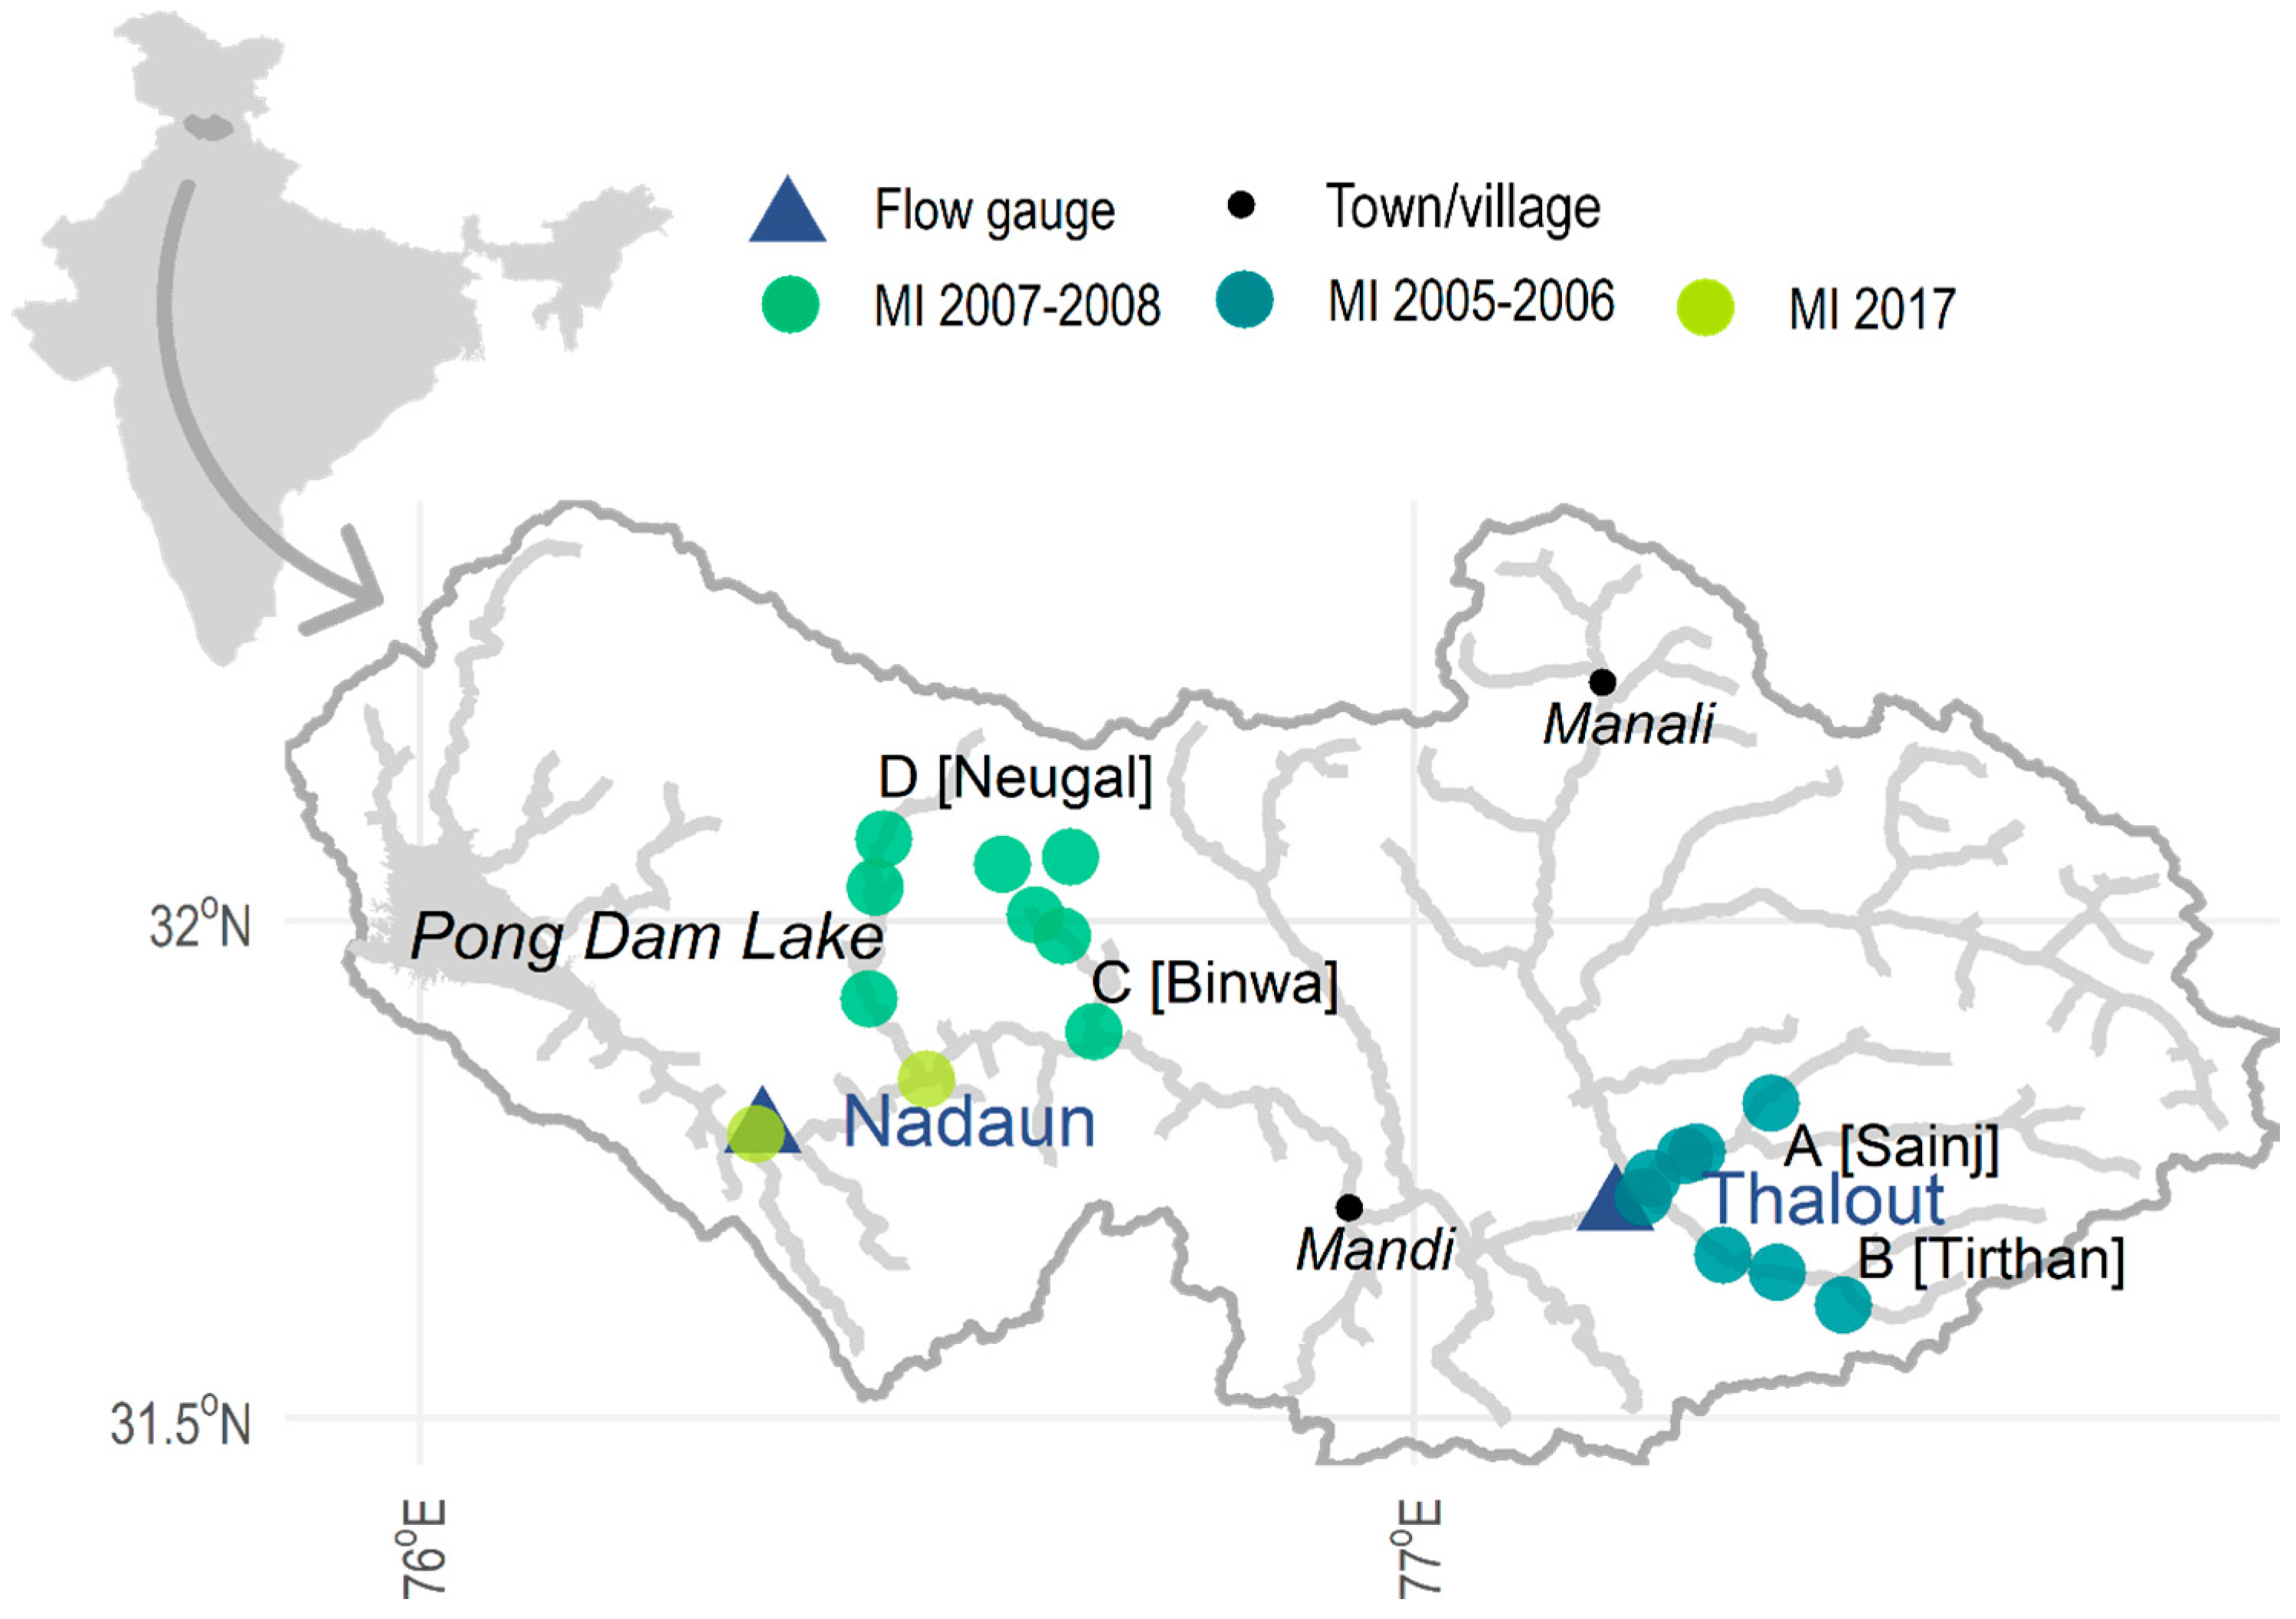
The proposed framework is applied to the upper catchment of the Beas River (Figure 3), from the source in the western Himalayas (31.51° N, 77.05° E; 6600 m above sea level) to the Pong Dam Reservoir. The catchment area upstream of the Pong reservoir is approximately 12,560 km2, with elevation varying from 245 to 6600 m above sea level [43]. The Beas River is one of the five main tributaries of the Indus River System, flowing southwest for 470 km before joining the Satluj River at Harike (Punjab, India); the other tributaries are the Jhelum, Chenad, Ravi, and Satluj Rivers. The Indus River is one of the longest rivers in the world with a number of dams, weirs, barrages, and basin transfers, and a large network of canals and distributaries [44]. An inter-basin transfer of waters within the study reach (from the Beas River to the Indus River) occurs at Pandoh dam (constructed in 1977), Himachal Pradesh, 21 km upstream of the town of Mandi (Figure 3); approximately 4800 million m3/s is transferred through a 13.1 km with a capacity of 7 m/s. Additionally, within the study reach is the Pong Dam (largest hydropower project in the Beas basin), with a further seven operational hydropower schemes and 12 hydropower projects under construction [44]. The interlinking of the three main rivers (Beas, Satluj, and Ravi) in the Indian Indus basin serves to augment water supply for power generation and the 900 km Indira Gandhi canal, its 8800 km distributaries and 6500 km field channels [44].
The Pong dam (constructed in 1974) and reservoir support the provision of a host of ecosystem services in the region, including: flood protection (regulating), hydropower generation (provisioning), and irrigation water supply (provisioning) to semi-arid areas in Punjab; the main granary and, thus, food bowl of Haryana, desert areas in Rajasthan and across India [44].
The hydroclimatology of the catchment is considered at length by [44]. Twelve percent of the total catchment area is occupied by permanent snow and ice (around Manali; Figure 3); approximately 780 km2). This permanent snow sub-catchment receives snowfall during the winter season (December to March). The snow and glacier melt contribute 35% of the annual flows in the Beas River basin while the monsoon season (June–September) provides 70% of the total annual rainfall [44]. Snowmelt contribution starts from March and lasts until June/July. Usually, the end of May/June clears the seasonal snow accumulated on glaciers during winter season and the glaciers start contributing to streamflow thereafter. Glaciers contribute to their maximum from July/August until September/October. Thus, in the pre-monsoon season (March–May), a major part of streamflow is generated from seasonal snowmelt. The river flow during the monsoon (June–September) mainly consists of monsoonal run-off combined with snow-melt discharge. In the post-monsoon season (October–November), streamflow is believed to be partly from glaciers and some occasional rain events. The minimum streamflow is observed during the winter (December–February) as lower temperatures limit snow and glacier melting.
The distinct hydrology of the Beas River results in a highly seasonal flow regime (Figure 4), with four clear seasons: summer (pre-monsoon; March–May), monsoon (June–September), autumn (post-monsoon; October–November), and winter (December–February).
3.2. Stage 1—Data
Macroinvertebrate (MI) data, identified to the species and family level, was made available from two previous studies: [45,46]. All macroinvertebrate sampling sites were located on tributaries of the Beas River; due to the availability of flow data, 16 of the 28 sites were selected (Figure 3). Both studies collected macroinvertebrate (MI) samples monthly across distinct two-year periods: Manesh (2011) from January 2005 to December 2006 at A and B (Figure 3, Sainj River and Tirthan River) and Sharma and Dhanze (2012) from March 2007 to February 2008 at C and D (Figure 3; Binwa River and Neugal River).
Monthly Family LIFE scores for each site were determined following [21]. To reflect the seasonality in the region (Table 2), and to account for missing data (LIFE scores undetermined, i.e., months where the only taxa present had no definitive flow preferences), LIFE scores were pooled with 96 seasonal average scores determined (16 sites, two years, three ecological seasons; see Table 2).
Historic daily average flow data was made available by the Bhakra Beas Management Board (BBMB) for two gauging stations (Figure 3): Nadaun (31.789722° N, 76.344972° E) (1980–2017) and Thalout (31.711101° N, 77.202105° E) (1967–2007). Seasonality in the flow regime was determined with seasonal subseries plots (after [47]; Appendix A, Figure A1) and flow exceedance curves (Figure 4); the hydrological seasons are summarised in Table 2. Gauged flows were downscaled to site level using monthly flow and velocity measurements (recorded at the time of macroinvertebrate sampling).
3.3. Stage 2—Qualitative Assessment
3.4. Stage 3—Quantitative Assessment
A total of 80 ecologically relevant hydrological indices were derived per season/site (Appendix B, Table A1). Principal component analysis reduced the number of indices to 18 per season/site (Appendix B, Table A1, highlighted). The seasonal LIFE scores were then paired with the hydrological indices from the immediately preceding season; for example, LIFE in ecological winter is paired with the monsoon hydrologic season (see also Table 2). The seasonal LIFE scores and hydrological indices were paired; the hydroecological model was then determined in R using glmulti as per the framework.
3.5. Stage 4—Assessment of Change in Ecosystem Services
The assessment of change in ecosystem services was carried out as per the proposed framework (Section 2). The observed flows were altered by a series of percentages (±1, 2.5, 5, 10) and the hydrological indices recalculated. From this, new LIFE scores were derived. It was found that this is too simple an approach. To fully understand the impact of change on LIFE and ecosystem services, a generator capable of producing changes in all five facets of the flow regime is required. Such an approach is beyond the scope of this study. Consequently, the impact of changes in each indicator was explored qualitatively.
4. Results and Discussion
The results and discussion from the application of the proposed framework to the Beas River are considered over four sections. First, a summary of the observed data is provided, including the macroinvertebrate community composition and LIFE scores. This is followed by consideration of the catalogue and role of observed taxa. The hydroecological model is then considered with a view to increasing understanding of the hydroecological relationship in the river; uncertainty in the model and model validation are discussed. These findings inform the final section exploring how alteration of the flow regime impacts on the ability to provide instream supporting ecosystem services.
4.1. Observed Data
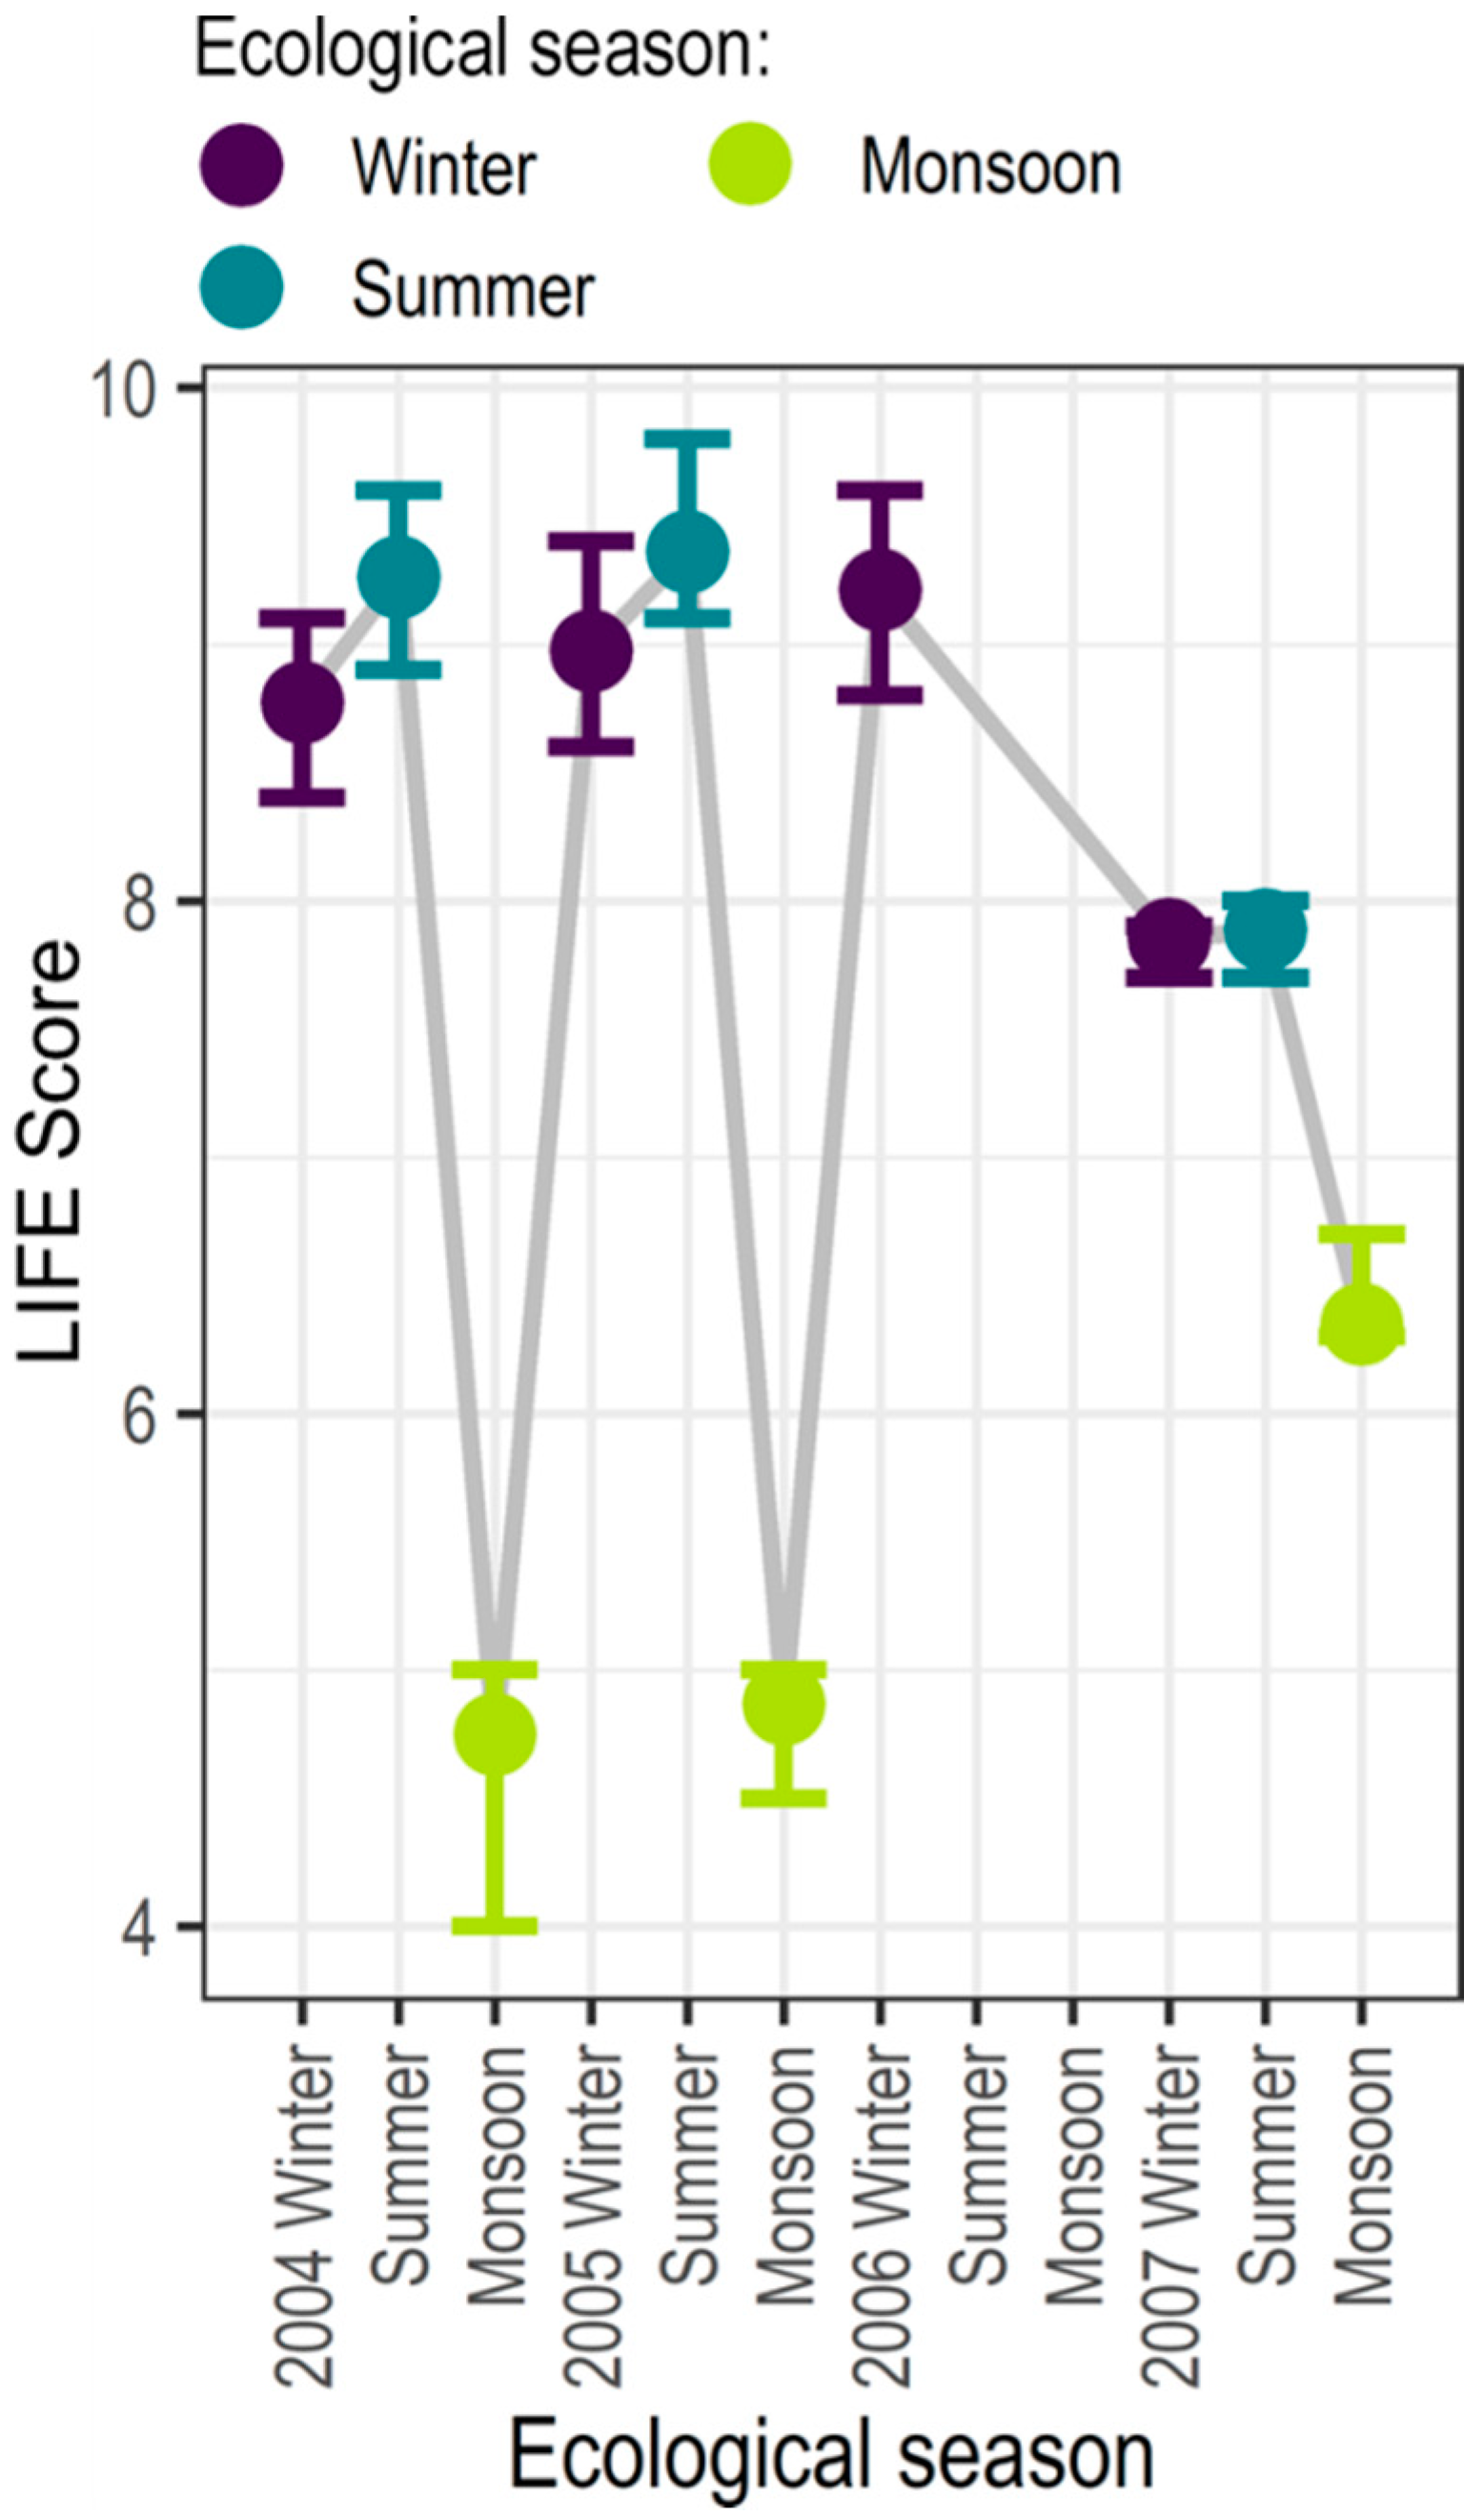
Despite differences in the spatial location and timing of macroinvertebrate sampling, similar patterns in seasonal average LIFE scores are observed (Figure 5). The peaks in LIFE score observed in winter and summer are a positive indication in terms of the provision of supporting ecosystem services, with the majority of the taxa catalogued in these seasons preferring higher flows (Table 3). Conversely, in the monsoon season, LIFE scores are at their lowest.
The low LIFE scores in the monsoon season would be expected to represent the presence of a large number of drought-tolerant taxa. However, the flow exceedance curves (Figure 4) for the two gauges show that antecedent flows in summer are high (summer represents the immediately preceding season assumed to be the predictor of ecological response during the monsoon). One explanation may be that higher scoring taxa have been washed downstream due to high monsoon river flows (Figure 4) [46]. Supporting this hypothesis is the change in macroinvertebrate community structure from winter/summer to monsoon, with the number of taxa reducing from an average LIFE score of 10 to 2–4. During the monsoon, only the two Plecoptera families (Perlodidae and Capniidae) prefer high flows; the other two families observed, Diptera: Culicidae and Coleoptera: Hydrophilidae both prefer low flows. However, temperature and rainfall are important factors in determining the distribution of Culcidae, mosquitoes [48]; indeed, despite their preference for lower flows, [48] also observe the greatest number of Culicidae species during the Indian monsoon seasons. As scavenger beetles, Hydrophilidae are observed throughout the year in the Beas River; their presence during the monsoon may be explained, in part, by their strong swimming abilities [49].
Figure 4 depicts flow distribution curves (FDC) for both gauging stations for the available records. The seasonality of the flow regime is clear, with the monsoon flows an order of magnitude greater than winter flows. This seasonality is more distinct upstream than downstream, with higher levels of inter-seasonal variability also in evidence; one possible explanation for this is increasing levels of urbanisation and modification of the river. The FDC indicate a possible decreasing trend in flow, however, with no statistically significant change point, there is no evidence to support this.
4.2. Catalogue
The outcome of the qualitative assessment, a catalogue of instream supporting ecosystem services and the effect increasing abundance of given families has on LIFE score, is available in Table 3; the catalogue is considered in order of the role of taxa in the provision of instream supporting ecosystem services.
Filter and surface deposit feeders contribute to the provision of supporting ecosystem services such as nutrient cycling and bioturbation [50]. In the Beas River, it is the non-biting midges (Chironomidae) that occupy this role; however, inference is not possible because the LIFE methodology does not define any relationship between flow and chironomid [21].
A number of the observed taxa are known to occupy the role of shredder: Black fly (Simuliidae), Leuctridae and Limnephilidae. Simuliidae has a limited presence in the Beas River, being observed only in the pre-monsoon season (summer), whilst the families Leuctridae and Limnephilidae, though abundant, are only observed in winter. In the summer season, higher LIFE scores may indicate the presence of Simuliidae, however, given their limited numbers, this is uncertain. In winter, given observed abundances and flow groups, LIFE scores ranging from 5 to 9 would indicate the presence of these shredders.
The family Limnephilidae, observed in the winter seasons occupies the role of sediment reworker; as one of only two taxa in this season that prefer low flows, their presence could be indicated by lower LIFE scores (5–7). No sediment worker families observed in summer or during the monsoon. Dragonfly were observed, however, at limited sites on single occasions. Another known sediment worker is the mayfly Ephemeridae [51], abundant in both summer and winter; though unobserved in this study, Ephemeridae have been observed in the Himalayan region [52].
In the summer and winter seasons a number of taxa serve as a food source, contributing to secondary production supporting ecosystem service [53]. As above, no inference is made from the presence of Chironomidae and Simuliidae. Three families from the order Ephemeroptera (Heptageniidae, Ephemerellidae, and Baetidae) are observed with high abundances in winter and summer; thus, higher LIFE scores are a positive indication that these families are present as a food source. Likewise, the Trichoptera: Hydropsychidae, are abundant in summer and winter, with similar flow preferences. Present in all seasons is the order Plecoptera; in the summer and winter their presence is also indicated by the highest LIFE scores. In the monsoon season, the families Perlodidae and Capniidae are the only taxa that exert an increasing influence on LIFE scores; therefore, scores greater than six are indicative of the presence of this food source.
An indication of the ecosystem service provision for the reference period (2004–2006) can be made from the observed LIFE scores (Figure 5) and the catalogue (Table 3). In the winter and summer of 2004–2006, LIFE scores are very high, suggesting that indicated taxa are present and providing the supporting ecosystem services indicated in the catalogue. In 2007, with reduced abundances, the LIFE scores fall; here, supporting services provision would be maintained but in a reduced form. Conversely, in the monsoon season (2004–2005), LIFE is low (<5), with the mosquitoes and water scavenger beetles dominating; at this time the provision of services would be inhibited. No data is available for 2006. In 2007, LIFE scores increase considerably with the presence of the Plecoptera; the Plecoptera act as food source, hence, this increase in LIFE scores is an indication in an improvement in supporting service provision.
4.3. Hydroecological Relationship
The principal objective of the hydroecological model is to expand the understanding of the hydroecological relationship; the structure of the model is described in Equation (2), with model structure and parameter definitions provided in Table 4. The facets of the flow regime captured by the model are predominantly magnitude and duration. The hydrological indices are considered below by the aspect of the flow regime they represent (high, low and average flows):
High flows are first captured in the most important index, Mn30MaxQ50, the seasonal maximum flow over a 30-day moving average; the negative coefficient indicates that lower flows are preferred overall. This is reiterated with the positive sign of the opposite index, Mn30MinQ50. The index Q01Q50 further indicates that flows which are too high may negatively impact the river ecology and thus the supporting ecosystem service delivered; this is balanced by Q05Q50 which suggests that high flows do have some positive influence.
Indices describing low flows dominate the model. The two most important of these are Min and Mn7Min which describe the seasonal and seven-day average minimum flows respectively. Notably, minimum flows have a negative impact whilst the seven-day average minimum flows exert a positive influence. The similarities in coefficient suggest that severe one-day low flow events may be counteracted if it is sustained over a number of days. The index JDMinSD builds on this, indicating that the days which have the seven lowest flows are important; high variation has a negative impact. In addition to these extreme low flows, PlsQ75 shows that moderate low flows are also important, specifically in the form of pulses.
High and low flow values are of clear importance to the river ecology; though it is worth noting that a number of these indices are relative to seasonal median or average conditions. The importance of seasonal average conditions is also in evidence with the index 20R80.
In terms of the predictive ability of the model, the parameter uncertainty is highly variable (confidence intervals associated with each parameter; Table 4). The greatest uncertainty lies in the parameterisation of Min and Mn7Min; a suggestion that these indices may not be as balanced as the model initially suggests. The effect of average conditions is also a large source of uncertainty. As a river wide model with a low temporal resolution, this uncertainty is expected. With regards to the implications of this uncertainty in the parameters, further inference may be made from the 10,000 Monte Carlo simulations (Figure 6). The box plot (spread or range of the uncertainty) shows that the hydrological model performs well across the inter-quartile range; the violin plot shows a left-skewed distribution of uncertainty, reflecting a tendency to underestimate LIFE scores. It is also noteworthy that relative error is centred close to one (which would indicate perfect agreement between models).
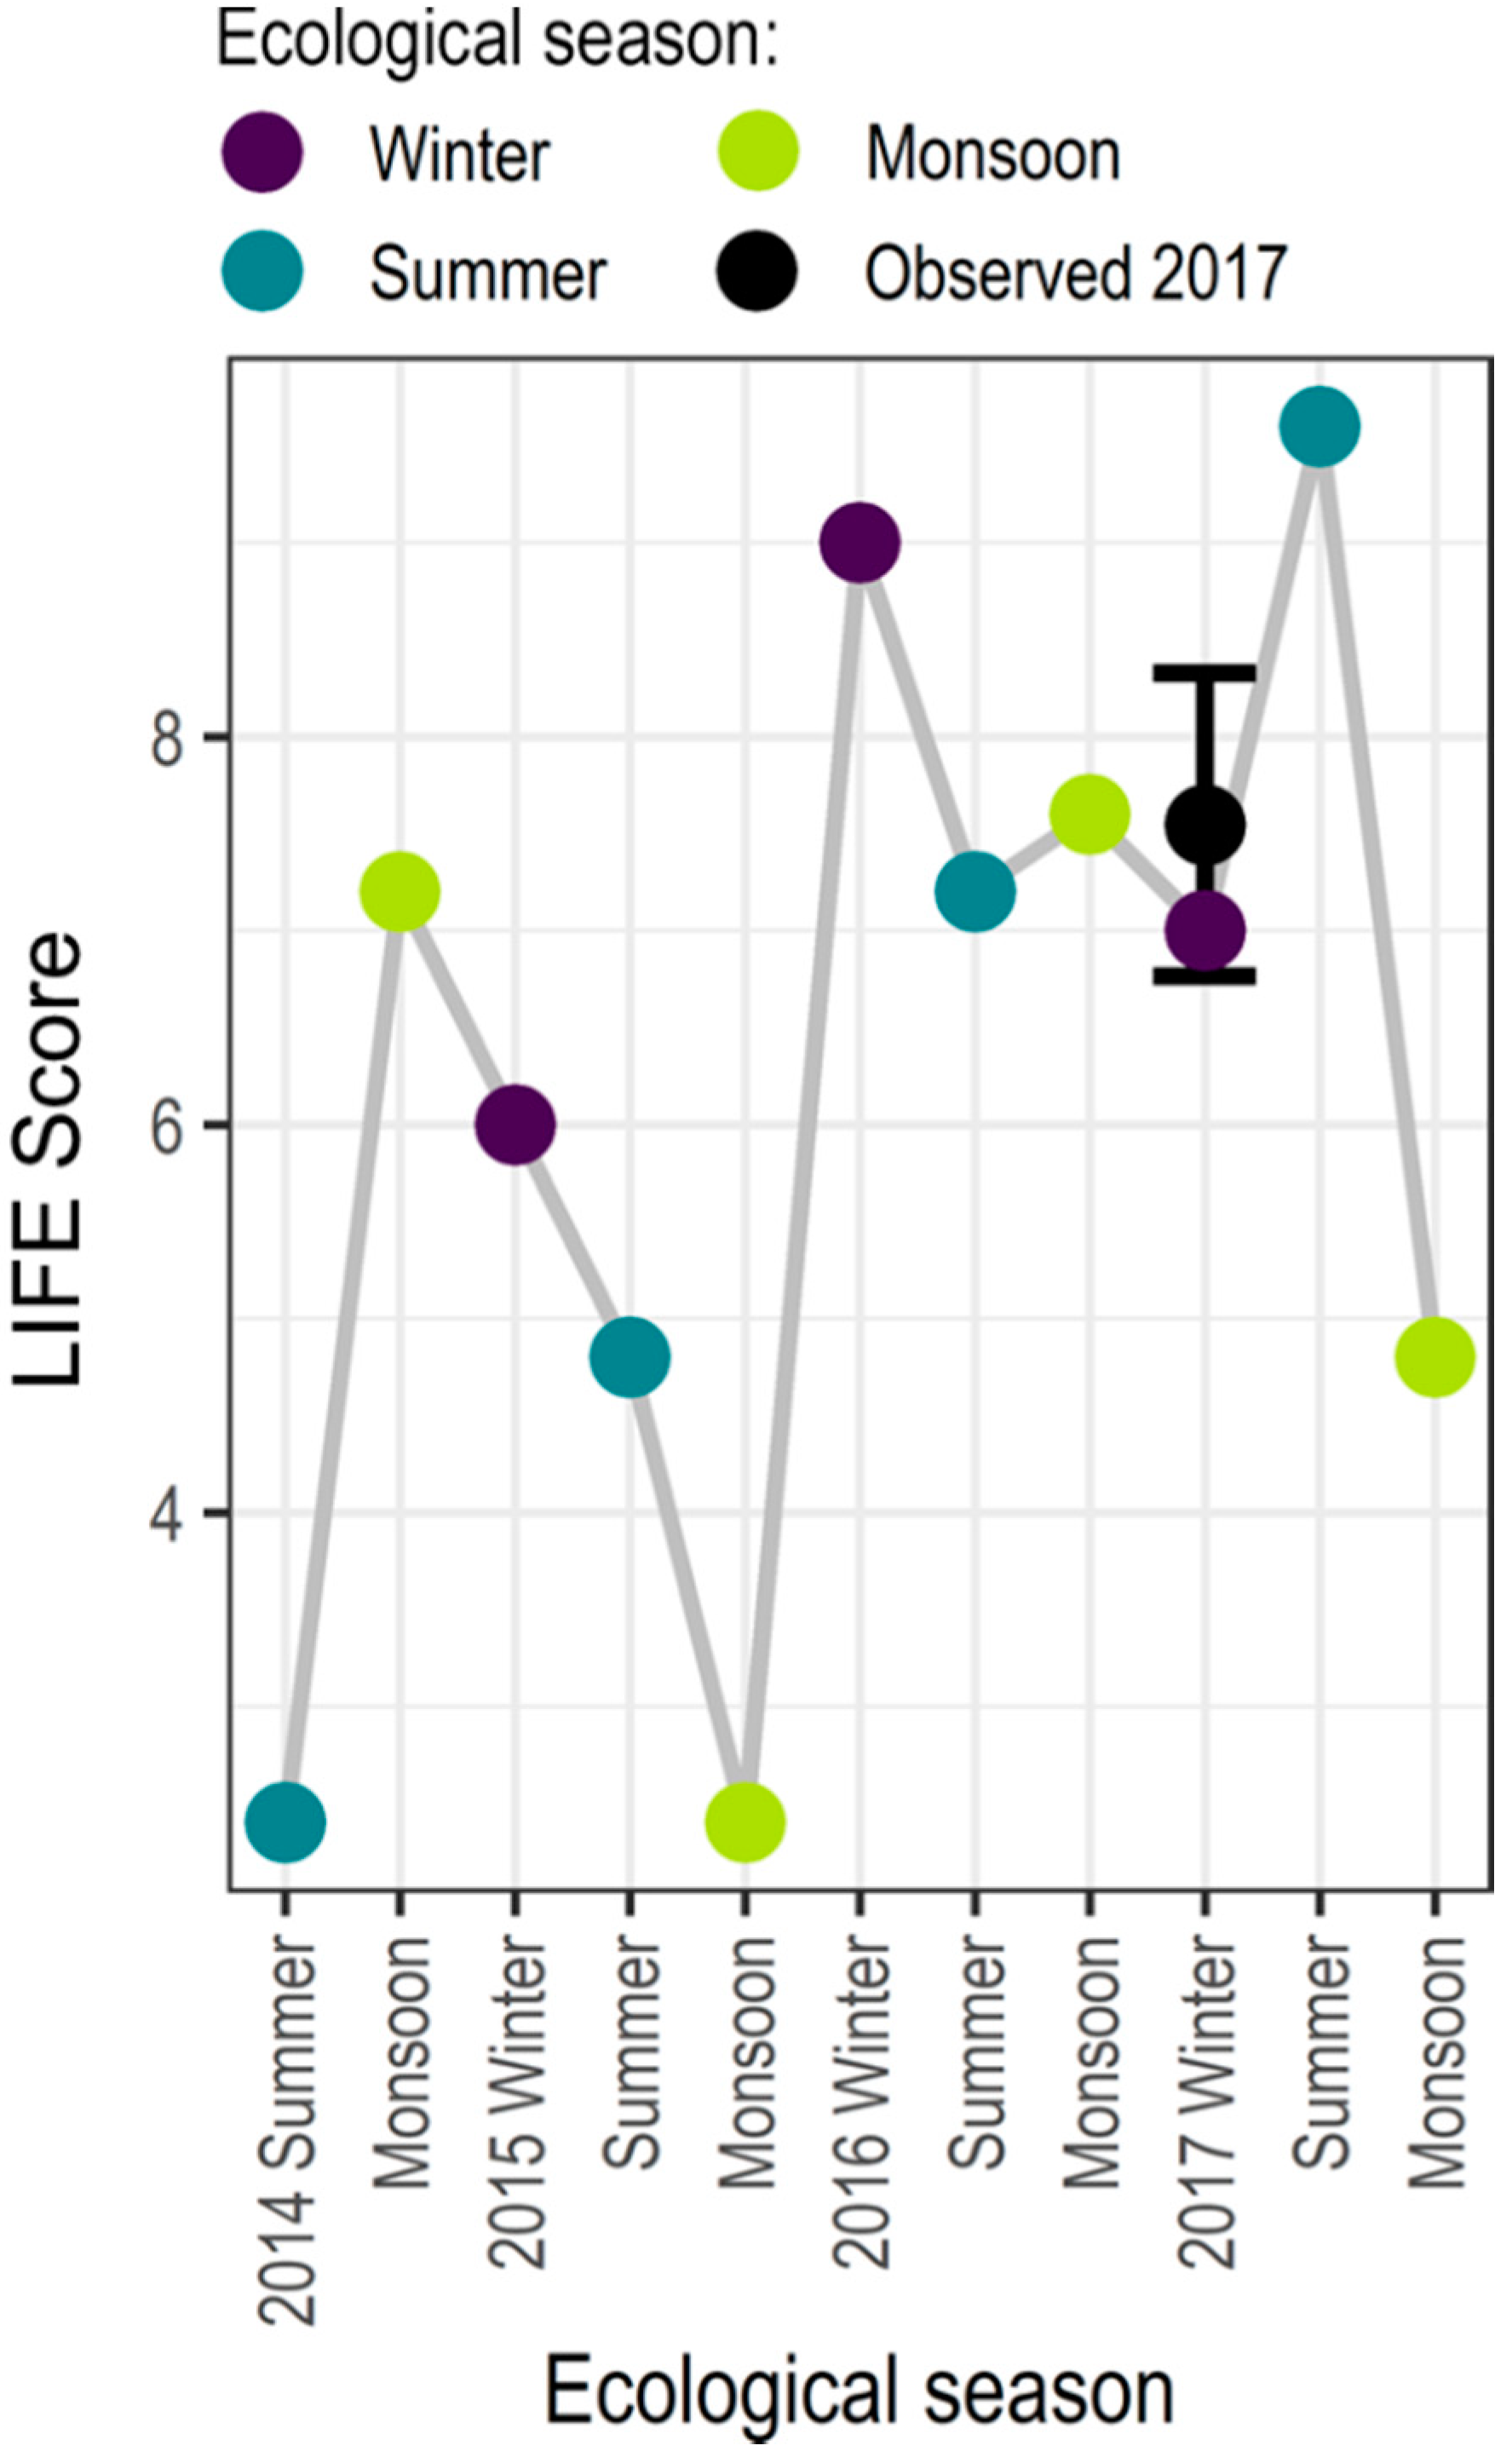
To further validate the hydroecological model output, hydrological indices are calculated for the Nadaun gauge for the period 2014–2017. The simulated LIFE scores are considered relative to the 2017 sampling (at Nadaun and Sajunpur; undertaken as part of this study; [54]) in Figure 7. The simulated LIFE score lies between the two observed values.
Considering the above, and given the purpose of this framework, the predictive ability of the hydroecological model is considered satisfactory.
4.4. Altered Flow Regime
The alteration of the flow regime (increased flow magnitude of ±1%, 2.5%, 5%, 10%) sees no change in ecological response. This behaviour can be explained through a review of the model parameters which reveals that only four of the nine hydrological indices are determined by flow magnitude, as well as the frequency index PlsQ75. Further, of these, three (20R80, Q05Q50, and Q01Q50) are determined by percentiles and ratios which remain unchanged with the percentage increase in flow magnitude.
The remaining five hydrological indices are determined by the four other facets of the flow regime (Table 5). To assess the impacts of flow alteration on these indices, a qualitative assessment, based on the structure of the hydroecology, is performed. Alteration of the frequency, duration, and timing of events through an increase in the distribution (non-continuous) number of days with higher or lower flows has a positive impact on river ecology; however, the negative impact of the index JDMinSD cannot be discounted. In reverse, a decrease in the distribution of events (an increase in event duration) sees a large negative impact on LIFE scores. Overall, it is the increase in duration of high flow events that represent the greatest overall threat to the instream river ecology.
No quantitative assessment is possible with regards to changes in the distribution of high and/or low flow days. From the hydroecological model it is clear that increasing these distributions could have a generally positive effect on LIFE scores, and by extension, supporting ecosystem service provision. However, a decrease in distribution and magnitude could be extremely harmful. With large reductions in LIFE score, the macroinvertebrate community composition would be significantly different, impacting the ability to fill the roles and provide the supporting ecosystem services in the catalogue. Although taxa with lower flow preferences may be able to fulfil these roles, the composition of this community remains an unknown. Such inference may be possible with a longer hydroecological time series.
Disruption of macroinvertebrate community impacts on the rates and variability of instream supporting ecosystem services delivery [36,55]. As illustrated in Table 5, alteration of the flow regime has both negative and positive impacts on macroinvertebrate abundance and community structure and this in turn influences the variability and the number of instreaming supporting ecosystem services delivered.
In the Beas River, future changes in the flow regime related to climate change [43] and increased dam construction activities [56], could lead to changes in the magnitude, timing and distribution of flow through the year. This would result in a largely negative ecological response and possibly the elimination/loss of some key macroinvertebrate species. Given that macroinvertebrate species contribute disproportionately to different supporting ecosystem services [35,57,58], the maintenance of diverse flow conditions remains crucial in maintaining the macroinvertebrate community and the range of supporting ecosystem services they deliver.
In the wider context, the improved understanding of supporting ecosystem services provided by studies such as this serves as an important scientific evidence base. This evidence may serve to inform a number of the United Nations Sustainable Development goals (SDGs), specifically those linked to the environment and human wellbeing [59,60], highlight that supporting ES play an important role in achieving SDG targets under SDG 14 and 15, Life Below Water and Life on Land. Supporting ES are further identified in contributed to SDG1 (No Poverty), SDG2 (Zero Hunger and SDG6) (Clean Water). In this study, understanding of how intangible, often less researched [6], supporting ES such as habitat and biodiversity maintenance, are impacted by water resource development in river systems is explored. Such an understanding could serve to inform national SGDs policy considerations and strategies for protecting important biodiversity species such as macroinvertebrates and sustainable development of river systems, as key ecosystems.
4.5. Limitations of the Method
The requirement for macroinvertebrate data represents a major limiting factor in the application of the proposed framework; the typical requirement of a long-term ecological time series (>20 years) is impractical. However, the framework application illustrates that sampling over a limited number of years allows for the development of an acceptable hydroecological model (assessed in terms of uncertainty). Due to data limitations (in the macroinvertebrate datasets), long-term historic understanding of the macroinvertebrate community and subsequent LIFE scores in the study catchment is limited. Consequently, this narrowed the scope within which the changes in LIFE scores could be assessed in the study area. In spite of this, the application of the LIFE methodology represents a positive development. However, the LIFE methodology does not include ubiquitous taxa such as Chironomidae due to their varied flow preferences and hence it was not possible to account for this abundant taxon within the framework.
5. Conclusions
The aim of this paper was to develop a framework that could be used to assess instream supporting ecosystem services, based on hydroecological modelling. The method couples a quantitative assessment of the relationship between flow and instream ecological response, with a qualitative assessment of the roles individual macroinvertebrate families play in supporting ecosystem service delivery.
The model was used to understand the role changing flows may have (e.g., from climate change, or water infrastructure development) on instream delivery of supporting ecosystem services in the study basin; although this may also hold for other river basins. Changes (increases) to flow magnitude were assessed quantitatively; the results indicate that change in magnitude alone has little or no impact on LIFE scores and thus on the delivery of supporting ecosystem services. The assessment of the ecological response to changes in other aspects of the flow regime (for example: duration, timing, and frequency) were considered qualitatively. Changes in the duration and frequency (of both low and high flows) were shown to exert a positive impact on the ecological response. Conversely, changes in the timing, specifically increasing the number of days with low flows, indicated a largely negative ecological response. More complex changes to river flows (e.g., interactions of magnitude, frequency, and timing) and, thus, ecological response and delivery of supporting ecosystem services need to be explored in conjunction with detailed modelling of future changes to the flow regime. This must be completed within the context of a whole system model.
In conclusion, this framework presents a novel approach to supporting ecosystem service delivery assessment using a coupled quantitative and qualitative approach. It provides a quantitative means by which instream supporting ecosystem services can be assessed at the basin-wide scale for the first time. The approach can directly be used within whole-system approaches, for example: basin-wide water resource models such as WEAP or Ribasim, in order to ensure impacts or changes to the provision of supporting ecosystem services is assessed. Additionally, this research highlights the value of long-term macroinvertebrate datasets in water resources development, as well as the protection of the riverine ecosystem and the ecosystem services it provides.
Author Contributions
The paper was jointly drafted by S.N. and A.V. and edited by all authors prior to submission. S.N. provided expertise on ecosystem services, led the qualitative assessment and led the discursive elements of the paper; S.N. also collected the field data used to validate the hydroecological model. A.V. provided expertise on macroinvertebrates and LIFE, undertook the quantitative assessment (development of the hydroecological model) and led the computational analysis. L.B. conceptualized the method in which supporting ecosystems could be included within a larger basin model, the framework, and manuscript.
Funding
This research was funded by the UK Natural Environment Research Council, grant number NE/N016394/1 and the APC was funded by Heriot-Watt University.
Acknowledgments
This work is part of an ongoing Sustaining Himalayan Water Resources in a changing climate (SusHi-Wat) research project and we acknowledge funding support from the UK Natural Environment Research Council (NERC; Project NE/N016394/1) and the Indian Ministry of Earth Sciences (MoES) under the aegis of the Newton-Bhabha scheme. We are also grateful to our project partners IITRoorkee, NIT-Hamirpur, NIH-Roorkee, and IISc-Bangalore, Cranfield University, the British Antarctic Survey and the Bhakra-Beas Management Board.
Conflicts of Interest
The authors have no conflicts of interest to declare.
Appendix A
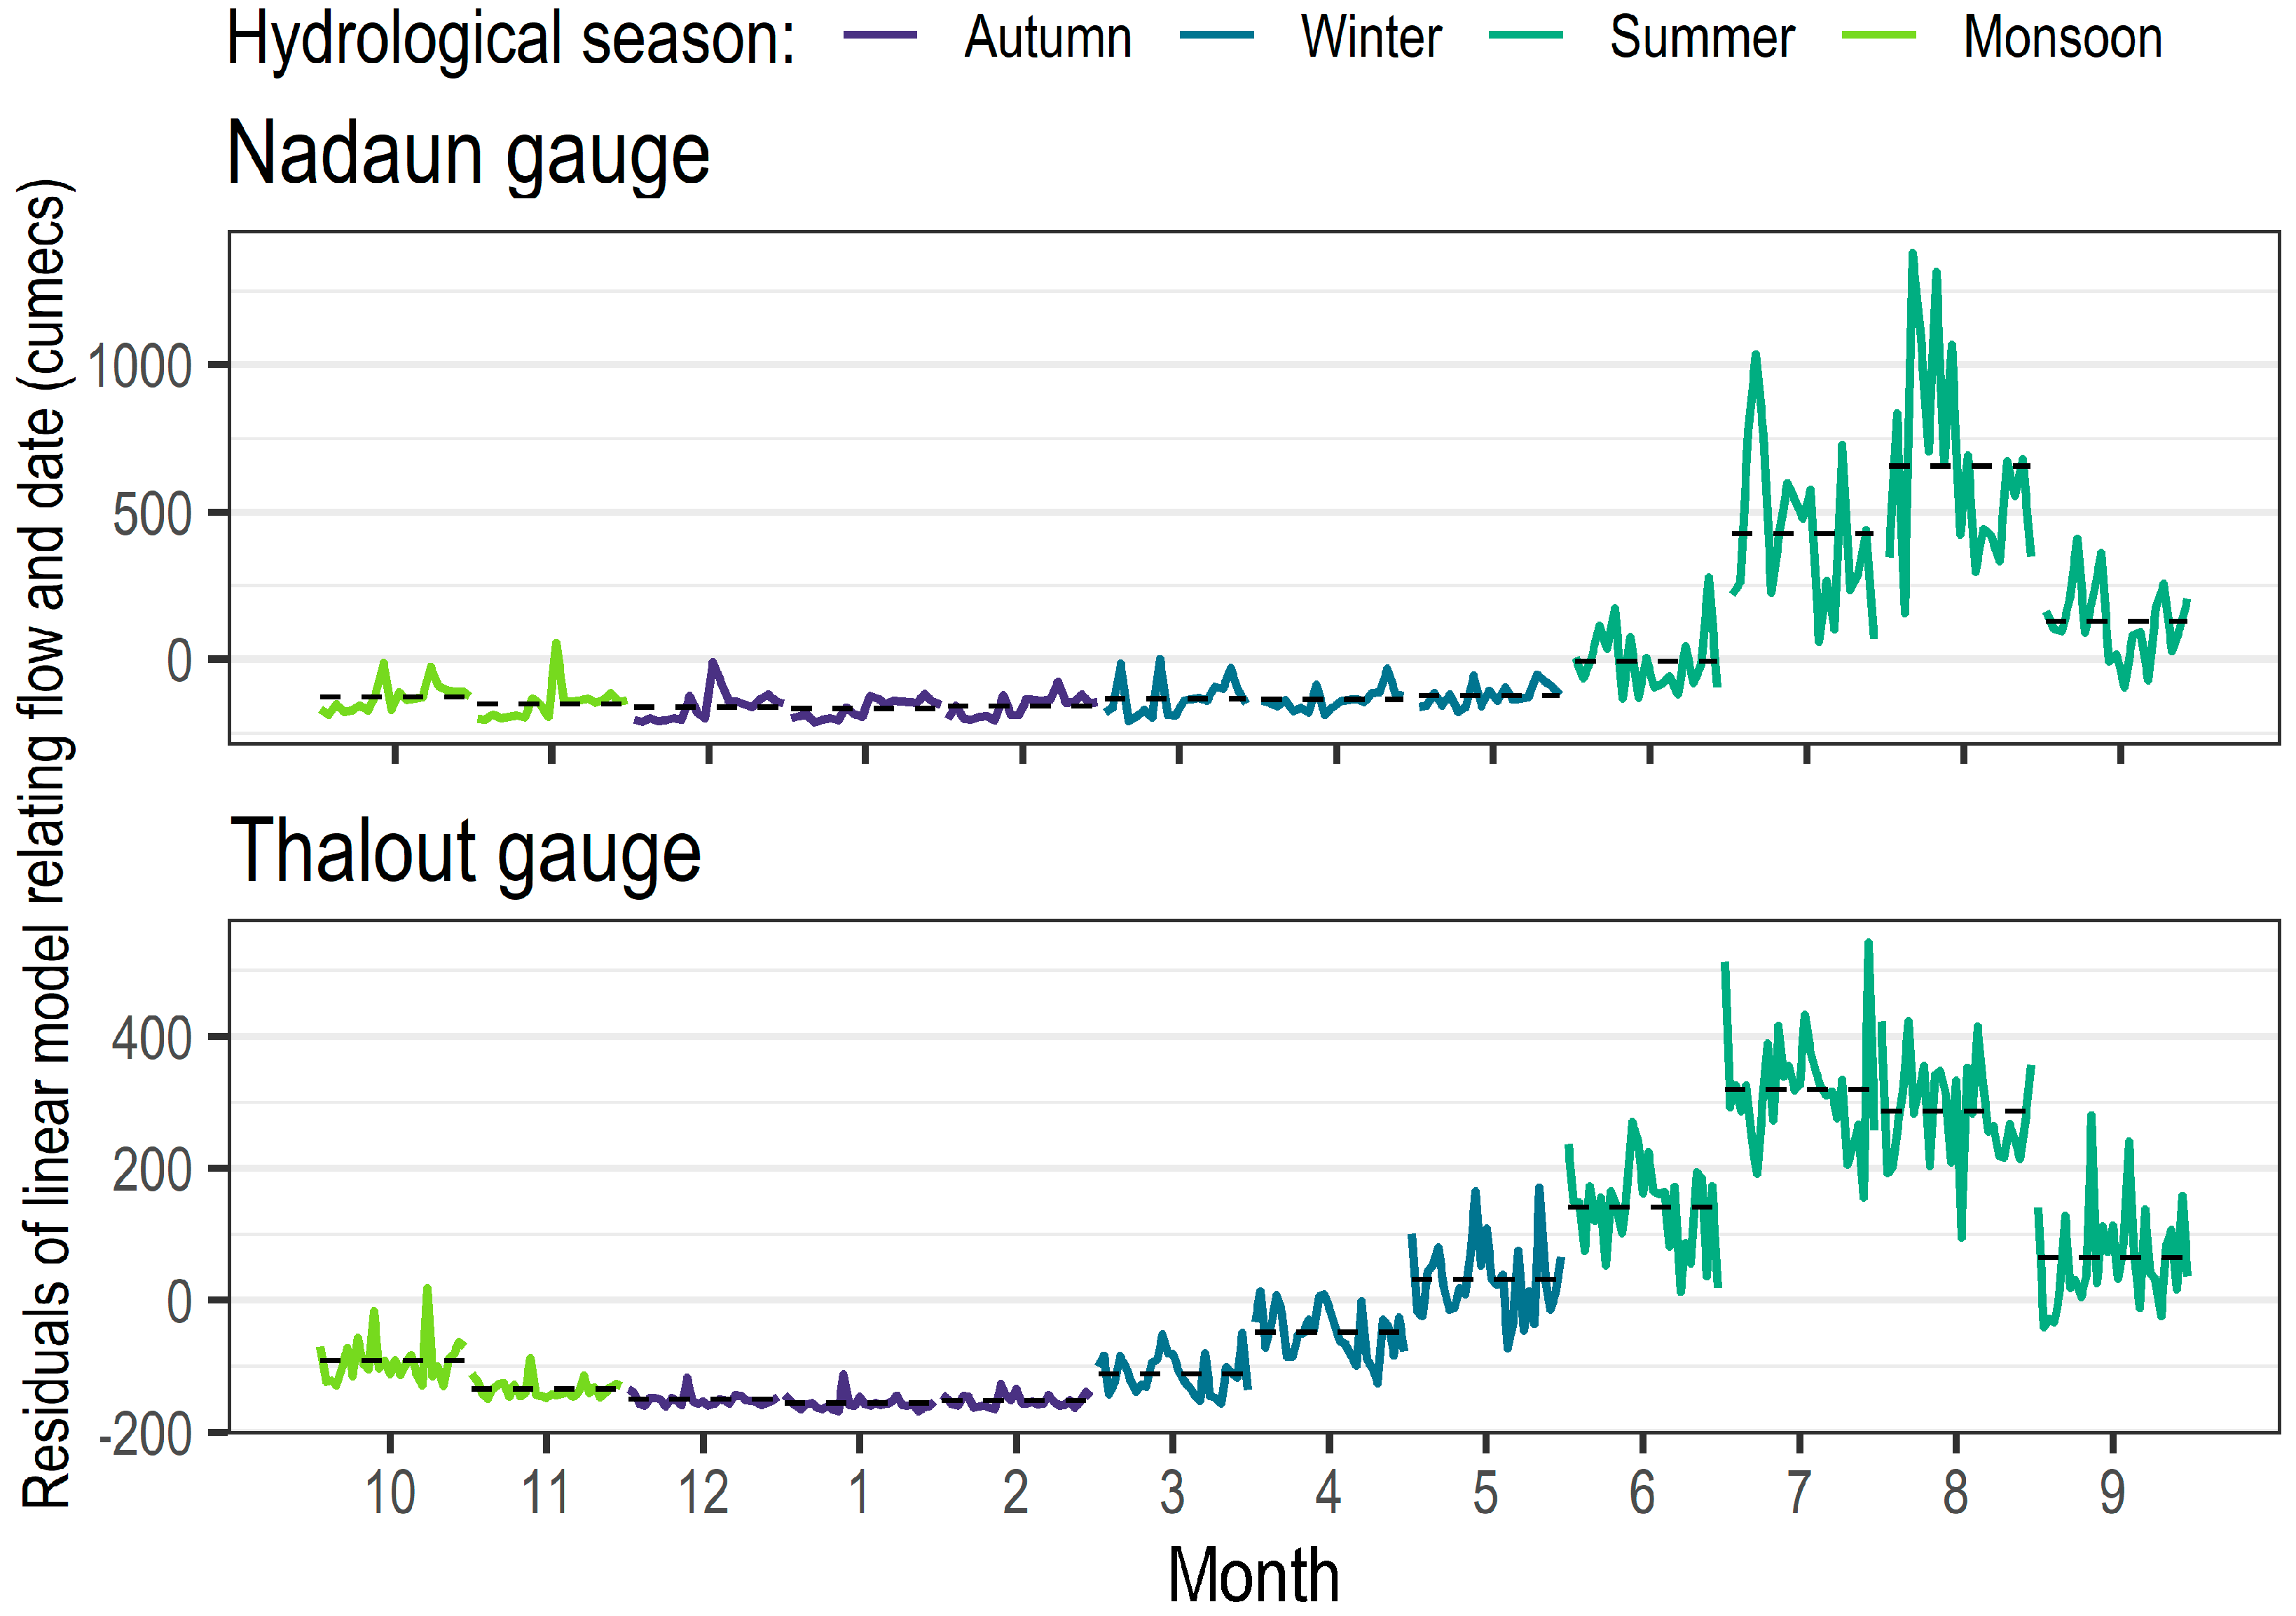
Seasonal subseries plots [47] for each gauging station are used to detect the seasonality in the time series. Data is detrended through fitting a linear model; the residuals are plotted using the R function monthplot.
Figure A1.
Seasonal subseries plots for the two gauging stations in the case study catchment.

Appendix B
Definitions of the hydrological indices derived (for each season and time-offset). The facets of the flow regime are magnitude (M), frequency (F), duration (D), timing (T), and rate of change (R); the types of flow event are average (A), low (L), and high (H).
The source references, from which the indices are derived from, are: [25,27,28,29,39,61,62,63,64,65,66,67,68,69,70,71,72,73].

Table A1.
Complete list of the 80 ecologically relevant hydrological indices derived per season/site. The number of indices was reduced to those in bold through the application of principal component analysis.
Table A1.
Complete list of the 80 ecologically relevant hydrological indices derived per season/site. The number of indices was reduced to those in bold through the application of principal component analysis.
| # | Facet | Aspect | Index | Units | Definition | Source Derived from |
|---|---|---|---|---|---|---|
| 1 | M | A | Mn | m3s−1 | Mean daily average flow. | [2,3,4,6,7,8,9,10] |
| 2 | M | A | Sum | m3 | Total volume of flow. | [7] |
| 3 | M | A | Rng | m3s−1 | Range; the variability in daily average flow. | [7] |
| 4 | M | A | IQR | m3s−1 | Interquartile range; the variability in daily average flows. | [19] |
| 5 | M | A | SD | - | Standard deviation; the variability in daily average flow. | [7] |
| 6 | M | A | Var | - | Coefficient of variance; the variability of daily average flow. | [2,3,4,8,10,11] |
| 7 | M | A | logQVar | - | Coefficient of variation of the log-transformed flows corresponding to the 5, 10, 15, 20, …, 80, 95, 90, 95 percentiles. | [8,12,13] |
| 8 | M | A | Sk | - | Skewness; the degree to which the mean is affected by extreme events relative to the median. | [1,2,3,4,7,8,16] |
| 9 | M | A | Sk100 | - | Skewness; the degree to which the range is affected by extreme events relative to the median. | [7,11] |
| 10 | M | A | Sk50 | - | Skewness; the degree to which the interquartile range is affected by extreme events relative to the median. | [7,11] |
| 11 | M | A | SkRel | m3s−1 | Relative skewness; the scale of the skew relative to the median. | [2,3,4,7,18] |
| 12 | M | A | 10R90 | - | Characterisation of lows and highs; ratio of the 10th and 90th percentiles in daily average flow. | [7,8,12,13] |
| 13 | M | A | 20R80 | - | Characterisation of moderate lows and highs; ratio of the 20th and 80th percentiles in daily average flow. | [7,8,12,13] |
| 14 | M | A | 25R75 | - | Characterisation of moderate lows and highs; ratio of the 25th and 75th percentiles in daily average flow. | [7,8,12,13] |
| 15 | M | A | 10R90Log | - | Characterisation of lows and highs; ratio of the 10th and 90th percentiles of log-transformed daily average flow. | [12,13] |
| 16 | M | A | 20R80Log | - | Characterisation of moderate lows and highs; ratio of the 20th and 80th percentiles of log-transformed daily average flow. | [12,13] |
| 17 | M | A | 25R75Log | - | Characterisation of moderate lows and highs; ratio of the 25th and 75th percentiles of log-transformed daily average flow. | [12,13] |
| 18 | M | A | Q01Q50 | - | Characterisation of high flows; one percent exceedance flow relative to the median. | This study. |
| 19 | M | A | Q05Q50 | - | Characterisation of high flows; five percent exceedance flow relative to the median. | This study. |
| 20 | M | A | Q10Q50 | - | Characterisation of high flows; ten percent exceedance flow relative to the median. | [2,3,4,7] |
| 21 | M | A | Q20Q50 | - | Characterisation of high flows; twenty percent exceedance flow relative to the median. | [2,3,4,7] |
| 22 | M | A | Q25Q50 | - | Characterisation of high flows; twenty five percent exceedance flow relative to the median. | [2,3,4,7] |
| 23 | M | A | Q30Q50 | - | Characterisation of moderate high flows; thirty percent exceedance flow relative to the median. | [19] |
| 24 | M | A | Q40Q50 | - | Characterisation of moderate high flows; forty percent exceedance flow relative to the median. | [19] |
| 25 | M | A | Q50 | m3s−1 | Median daily average flow. | [2,3,4,8] |
| 26 | M | A | Q60Q50 | - | Characterisation of moderate low flows; sixty percent exceedance flow relative to the median. | [19] |
| 27 | M | A | Q70Q50 | - | Characterisation of moderate low flows; seventy percent exceedance flow relative to the median. | [19] |
| 28 | M | A | Q75Q50 | - | Characterisation of low flows; seventy five percent exceedance flow relative to the median. | [2,3,4,7] |
| 29 | M | A | Q80Q50 | - | Characterisation of low flows; eighty percent exceedance flow relative to the median. | [7] |
| 30 | M | A | Q90Q50 | - | Characterisation of low flows; ninety percent exceedance flow relative to the median. | [2,3,4,7] |
| 31 | M | A | Q95Q50 | - | Characterisation of low flows; ninety five percent exceedance flow relative to the median. | This study. |
| 32 | M | A | Q99Q50 | - | Characterisation of low flows; ninety nine percent exceedance flow relative to the median. | This study. |
| 33 | M | H | Max | m3s−1 | Maximum flow. | [8,17] |
| 34 | M | H | MaxQ50 | - | Relative maximum flow; maximum flow divided by the median. | [7] |
| 35 | M | H | Q01 | - | One percent flow exceedance. | This study. |
| 36 | M | H | MaxMonthlyMed | - | Mean of the maximum monthly flow relative to the median flow value for the entire flow record. | [4,8] |
| 37 | M | H | MaxMonthlyVar | - | Variability of maximum monthly flows. | [19] |
| 38 | M | H | MaxMonthlyLogVar | - | Variability of log-transformed maximum monthly flows. | [5,8] |
| 39 | M | L | Min | m3s−1 | Minimum flow. | [8,17] |
| 40 | M | L | MinQ50 | - | Relative minimum flow; minimum flow divided by the median. | [2,3,6,7] |
| 41 | M | L | Q99 | - | Ninety nine percent flow exceedance. | This study. |
| 42 | M | L | MinMonthlyMed | - | Mean of the minimum monthly flow relative to the median flow value for the entire flow record. | [8,17] |
| 43 | M | L | MinMonthlyVar | - | Variability of minimum monthly flows. | [19] |
| 44 | M | L | MinMonthlyLogVar | - | Variability of log-transformed minimum monthly flows. | [19] |
| 45 | F | H | PlsQ25 | - | High flow pulse count; the number of flow events where flows are above a threshold equal to the twenty five percent exceedance flow value for the entire flow record. | [8,14,15,16] |
| 46 | F | H | PlsQ50 | - | Flow pulse count; the number of flow events where flows are above a threshold equal to the median flow value for the entire flow record. | [2,3,4,8] |
| 47 | F | L | PlsQ75 | - | Low flow pulse count; the number of flow events where flows falls below a threshold equal to the seventy five percent exceedance flow value for the entire flow record. | [8,14,15,16] |
| 48 | D | H | Mn7Max | m3s−1 | Seasonal maximum of 7-day moving average flow. | This study. |
| 49 | D | H | Mn7MaxQ50 | - | Seasonal maximum of 7-day moving average flow relative to the median. | This study. |
| 50 | D | H | Mn30MaxQ50 | - | Seasonal maximum of 30-day moving average flow relative to the median. | [8,14,15,16] |
| 51 | D | H | PlsDurQ25 | days−1 | Total duration of flow pulses above twenty five percent exceedance flow. | This study. |
| 52 | D | H | PlsDurQ25Mn | days−1 | Average duration of flow pulses above twenty five percent exceedance flow. | This study. |
| 53 | D | H | PlsDurQ25Var | days−1 | Variability in flow pulses above twenty five percent exceedance flow. | This study. |
| 54 | D | H | PlsDurQ50 | days−1 | Total duration of flow pulses above fifty percent exceedance flow. | This study. |
| 55 | D | H | PlsDurQ50Mn | days−1 | Average duration of flow pulses above fifty percent exceedance flow. | [2,3,4,8] |
| 56 | D | H | PlsDurQ50Var | days−1 | Variability in flow pulses above fifty percent exceedance flow. | This study. |
| 57 | D | L | Mn7Min | m3s−1 | Seasonal minimum of 7-day moving average flow. | This study. |
| 58 | D | L | Mn7MinQ50 | - | Seasonal minimum of 7-day moving average flow relative to the median. | This study. |
| 59 | D | L | Mn30MinQ50 | - | Seasonal minimum of 30-day moving average flow relative to the median. | [8,14,15,16] |
| 60 | D | L | PlsDurQ75 | days−1 | Total duration of flow pulses below seventy five percent exceedance flow. | This study. |
| 61 | D | L | PlsDurQ75Mn | days−1 | Average duration of flow pulses below seventy five percent exceedance flow. | [4,8] |
| 62 | D | L | PlsDurQ75Var | days−1 | Variability in flow pulses below seventy five percent exceedance flow. | This study. |
| 63 | R | A | fallMn | m3s−1 | Fall rate; mean change in flow for days in which the change is negative. | [8,14,15,16] |
| 64 | R | A | fallVar | - | Variability in fall rate; variability in flow for days in which the change is negative. | [8,14,15,16] |
| 65 | R | A | fallLogMed | m3s−1 | Log fall rate; the median change in log-transformed flow, for days in which the change is negative. | [4,8] |
| 66 | R | A | riseMn | m3s−1 | Rise rate; mean change in flow for days in which the change is positive. | [8,14,15,16] |
| 67 | R | A | riseVar | - | Variability in rise rate; variability in flow for days in which the change is positive. | [8,14,15,16] |
| 68 | R | A | riseLogMed | m3s−1 | Log rise rate; the median change in log-transformed flow, for days in which the change is negative. | [4,8] |
| 69 | R | A | RevNeg | - | Number of negative changes in flow from one day to the next. | [7,14,15,16] |
| 70 | R | A | RevPos | - | Number of positive changes in flow from one day to the next. | [7,14,15,16] |
| 71 | R | A | RevVar | - | Variability in the number of negative and positive changes in flow from one day to the next. | [8,15] |
| 72 | T | A | JDRng | - | Difference in the Julian date of the maximum and minimum daily average flow. | [19] |
| 73 | T | H | JDMax | - | Julian date of the 1-day maximum daily average flow. | [4,7,8,14,15,16] |
| 74 | T | H | JDMaxMn | - | Julian date of the mean 30-day maximum flow. | [19] |
| 75 | T | H | JDMaxSD | - | Standard deviation in the Julian date of the seven 1-day maximum daily average flow. | [7] |
| 76 | T | H | JDMaxVar | - | Variability in the Julian date of the seven 1-day maximum daily average flow. | This study. |
| 77 | T | L | JDMin | - | Julian date of the 1-day minimum daily average flow. | [4,7,8,14,15,16] |
| 78 | T | L | JDMinMn | - | Julian date of the mean 30-day minimum flow. | This study. |
| 79 | T | L | JDMinSD | - | Standard deviation in the Julian date of the seven 1-day minimum daily average flow. | [7] |
| 80 | T | L | JDMinVar | - | Variability in the Julian date of the seven 1-day minimum daily average flow. | This study. |
References
- Yeakley, J.; Ervin, D.; Chang, H.; Granek, E.F.; Dujon, V.; Shandas, V.; Brown, D. Ecosystem services of streams and rivers. In River Science; John Wiley & Sons, Ltd.: Hoboken, NJ, USA, 2016; pp. 335–352. [Google Scholar]
- MEA. Ecosystems and Human Well-Being: Synthesis [Millenium Ecosystem Assessment]; Island Press: Washington, DC, USA, 2005. [Google Scholar]
- Gilvear, D.J.; Spray, C.J.; Casas-Mulet, R. River rehabilitation for the delivery of multiple ecosystem services at the river network scale. J. Environ. Manag. 2013, 126, 30–43. [Google Scholar] [CrossRef] [PubMed]
- Febria, C.M.; Koch, B.J.; Palmer, M.A. Operationalizing an ecosystem services-based approach for managing river biodiversity. In Water Ecosystem Services: A Global Perspective; Gordon, I.J., Martin-Ortega, J., Ferrier, R.C., Khan, S., Eds.; Cambridge University Press: Cambridge, UK, 2015; pp. 26–34. [Google Scholar]
- Mace, G.M.; Norris, K.; Fitter, A.H. Biodiversity and ecosystem services: A multilayered relationship. Trends Ecol. Evol. 2012, 27, 19–26. [Google Scholar] [CrossRef] [PubMed]
- Durance, I.; Bruford, M.W.; Chalmers, R.; Chappell, N.A.; Christie, M.; Cosby, B.J.; Noble, D.; Ormerod, S.J.; Prosser, H.; Weightman, A.; et al. Chapter Three—The Challenges of Linking Ecosystem Services to Biodiversity: Lessons from a Large-Scale Freshwater Study. In Advances in Ecological Research; Woodward, G., Bohan, D.A., Eds.; Academic Press: London, UK, 2016; Volume 54, pp. 87–134. [Google Scholar]
- Vörösmarty, C.J.; McIntyre, P.B.; Gessner, M.O.; Dudgeon, D.; Prusevich, A.; Green, P.; Glidden, S.; Bunn, S.E.; Sullivan, C.A.; Liermann, C.R.; et al. Global threats to human water security and river biodiversity. Nature 2010, 467, 555–561. [Google Scholar] [CrossRef] [PubMed] [Green Version]
- Martin-Ortega, J.; Ferrier, R.C.; Gordon, I.J.; Khan, S. Water Ecosystem Services—A Global Perspective; Cambridge University Press: Cambridge, UK, 2015. [Google Scholar]
- Beck, M.W.; Claassen, A.H.; Hundt, P.J. Environmental and livelihood impacts of dams: Common lessons across development gradients that challenge sustainability. Int. J. River Basin Manag. 2012, 10, 73–92. [Google Scholar] [CrossRef]
- Auerbach, D.A.; Deisenroth, D.B.; McShane, R.R.; McCluney, K.E.; LeRoy Poff, N. Beyond the concrete: Accounting for ecosystem services from free-flowing rivers. Ecosyst. Serv. 2014, 10, 1–5. [Google Scholar] [CrossRef]
- Gilvear, D.J.; Beevers, L.C.; O’Keeffe, J.; Acreman, M. Chapter 8—Environmental Water Regimes and Natural Capital: Free-Flowing Ecosystem Services. In Water for the Environment; Academic Press: London, UK, 2017; pp. 151–171. [Google Scholar]
- Arthington, A. Chapter 4—River Ecology, The Natural Flow Regime Paradigm, and Hydroecological Principles. In Environmental Flows: Saving Rivers in the Third Millenium; Arthington, A., Ed.; University of California Press: Oakland, CA, USA, 2012. [Google Scholar]
- Grizzetti, B.; Lanzanova, D.; Liquete, C.; Reynaud, A.; Cardoso, A.C. Assessing water ecosystem services for water resource management. Environ. Sci. Policy 2016, 61, 194–203. [Google Scholar] [CrossRef]
- Costanza, R.; de Groot, R.; Braat, L.; Kubiszewski, I.; Fioramonti, L.; Sutton, P.; Farber, S.; Grasso, M. Twenty years of ecosystem services: How far have we come and how far do we still need to go? Ecosyst. Serv. 2017, 28, 1–16. [Google Scholar] [CrossRef]
- Visser, A.; Beevers, L.; Patidar, S. Macro-invertebrate Community Response to Multi-annual Hydrological Indicators. River Res. Appl. 2017, 33, 707–717. [Google Scholar] [CrossRef] [Green Version]
- Macadam, C.R.; Stockan, J.A. More than just fish food: Ecosystem services provided by freshwater insects. Ecol. Entomol. 2015, 40, 113–123. [Google Scholar] [CrossRef]
- Wallace, J.B.; Webster, J.R. The Role Of Macroinvertebrates In Stream Ecosystem Function. Annu. Rev. Entomol. 1996, 41, 115–139. [Google Scholar] [CrossRef] [PubMed]
- Chaube, U.C.; Sharma, S.; Sharma, P.; Kumar, P. Water quality assessment of River Satluj using benthic macroinvertebrates. In Proceedings of the Scientific Conference Rivers in the Hindu Kush-Himalay—Ecology & Environmental Assessment, Kathmandu and Dhulikhel, Nepal, 3–7 March 2008. [Google Scholar]
- Singh, N.; Sharma, R.C. Some Important Attributes Which Regulates The Life of Macro-Invertebrates: A Review. Int. J. Recent Sci. Res. 2014, 5, 357–361. [Google Scholar]
- Chauhan, A.; Verma, S.C. Distribution and Diversity of Aquatic Insects in Himachal Pradesh, India: A Review. Int. J. Curr. Microbiol. Appl. Sci. 2016, 5, 273–281. [Google Scholar] [CrossRef] [Green Version]
- Extence, C.A.; Balbi, D.M.; Chadd, R.P. River flow indexing using British benthic macroinvertebrates: A framework for setting hydroecological objectives. Regul. Rivers Res. Manag. 1999, 15, 545–574. [Google Scholar] [CrossRef]
- Monk, W.A.; Wood, P.J.; Hannah, D.M.; Wilson, D.A. Macroinvertebrate community response to inter-annual and regional river flow regime dynamics. River Res. Appl. 2008, 24, 988–1001. [Google Scholar] [CrossRef] [Green Version]
- Ghosh, D.; Biswas, J. Macroinvertebrate diversity indices: A quantitative bioassessment of ecological health status of an oxbow lake in Eastern India. J. Adv. Env. Health Res. 2015, 3, 78–90. [Google Scholar]
- Poff, N.L.; Zimmerman, J.K.H. Ecological responses to altered flow regimes: A literature review to inform the science and management of environmental flows. Freshw. Boil. 2010, 55, 194–205. [Google Scholar] [CrossRef]
- Clausen, B.; Biggs, B. Relationships between benthic biota and hydrological indices in New Zealand streams. Freshw. Boil. 1997, 38, 327–342. [Google Scholar] [CrossRef]
- Worrall, T.P.; Dunbar, M.J.; Extence, C.A.; Laizé, C.L.R.; Monk, W.A.; Wood, P.J. The identification of hydrological indices for the characterization of macroinvertebrate community response to flow regime variability. Hydrol. Sci. J. 2014, 59, 645–658. [Google Scholar] [CrossRef] [Green Version]
- Richter, B.D.; Baumgartner, J.V.; Powell, J.; Braun, D.P. A Method for Assessing Hydrologic Alteration within Ecosystems. Conserv. Boil. 1996, 10, 1163–1174. [Google Scholar] [CrossRef]
- Richter, B.D.; Baumgartner, J.; Wigington, R.; Braun, D. How much water does a river need? Freshw. Boil. 1997, 37, 231–249. [Google Scholar] [CrossRef]
- Richter, B.D.; Baumgartner, J.V.; Braun, D.P.; Powell, J. A spatial assessment of hydrologic alteration within a river network. Regul. Rivers Res. Manag. 1998, 14, 329–340. [Google Scholar] [CrossRef]
- The Nature Conservancy. Indicators of Hydrologic Alteration (IHA). Available online: https://www.conservationgateway.org/ConservationPractices/Freshwater/EnvironmentalFlows/MethodsandTools/IndicatorsofHydrologicAlteration/Pages/indicators-hydrologic-alt.aspx (accessed on 3 September 2018).
- Grumbine, R.E.; Pandit, M.K. Threats from India’s Himalaya Dams. Science 2013, 339, 36–37. [Google Scholar] [CrossRef] [PubMed]
- Jain, S.K.; Goswami, A.; Saraf, A.K. Assessment of Snowmelt Runoff Using Remote Sensing and Effect of Climate Change on Runoff. Water Resour. Manag. 2010, 24, 1763–1777. [Google Scholar] [CrossRef]
- Gopal, B. Ecosystem services of rivers and their relation to flows. In Environmental Flows: An Introduction for Water Resources Managers; National Institute of Ecology: New Delhi, India; Pretoria, South Africa, 2014; pp. 67–80. [Google Scholar]
- Clarke, R.T.; Armitage, P.D.; Horby, D.; Scarlett, P.; Davy-Bowker, J. Investigation of the Relationship between the LIFE Index and RIVPACS: Putting LIFE into RIVPACS; Environment Agency: Bristol, UK, 2003. [Google Scholar]
- Covich, A.P.; Palmer, M.A.; Crowl, T.A. The Role of Benthic Invertebrate Species in Freshwater Ecosystems: Zoobenthic species influence energy flows and nutrient cycling. BioScience 1999, 49, 119–127. [Google Scholar] [CrossRef]
- Covich, A.P.; Austen, M.C.; Bärlocher, F.; Chauvet, E.; Cardinale, B.J.; Biles, C.L.; Inchausti, P.; Dangles, O.; Solan, M.; Gessner, M.O.; et al. The Role of Biodiversity in the Functioning of Freshwater and Marine Benthic Ecosystems. BioScience 2004, 54, 767–775. [Google Scholar] [CrossRef]
- R Core Team. R: A Language and Environment for Statistical Computing. Available online: https://www.R-project.org/ (accessed on 4 September 2018).
- Visser, A.; Beevers, L.; Patidar, S. Complexity in hydroecological modelling, a comparison of stepwise selection and information theory. River Res. Appl. 2018. [Google Scholar] [CrossRef]
- Olden, J.D.; Poff, N.L. Redundancy and the choice of hydrologic indices for characterizing streamflow regimes. River Res. Appl. 2003, 19, 101–121. [Google Scholar] [CrossRef]
- Calcagno, V. Glmulti: Model Selection and Multimodel Inference Made Easy. Version 1.0.7. Available online: https://CRAN.R-project.org/package=glmulti (accessed on 4 September 2018).
- Warmink, J.J.; Janssen, J.A.E.B.; Booij, M.J.; Krol, M.S. Identification and classification of uncertainties in the application of environmental models. Environ. Model. Softw. 2010, 25, 1518–1527. [Google Scholar] [CrossRef]
- Sobol, I.M. Uniformly distributed sequences with an additional property of uniformity. USSR Comput. Math. Math. Phys. 1976, 16, 236–242. (In English) [Google Scholar] [CrossRef]
- Adeloye, A.J.; Soundharajan, B.S.; Ojha, C.S.P.; Remesan, R. Effect of Hedging-Integrated Rule Curves on the Performance of the Pong Reservoir (India) During Scenario-Neutral Climate Change Perturbations. Water Resour. Manag. 2016, 30, 445–470. [Google Scholar] [CrossRef] [Green Version]
- Jain, S.K.; Agarwal, P.K.; Singh, V.P. Indus Basin. In Hydrology and Water Resources of India; Springer: Dordrecht, The Netherlands, 2007; Volume 1, pp. 473–511. [Google Scholar]
- Manesh, K. Ecology of Some Selected Hillstreams of River Beas in the Vicinity of the Upper Himalayas of Himachal Pradesh India. Panjab University, India, Shodhganga@INFLIBNET Centre. 2011. Available online: http://hdl.handle.net/10603/82916 (accessed on 4 September 2018).
- Sharma, I.; Dhanze, R. Evaluation of macrobenthic fauna in hill stream environment of Western Himalaya, India. J. Threat. Taxa 2012, 4, 2875–2882. [Google Scholar] [CrossRef] [Green Version]
- Cleveland, W.S. Visualizing Data; Hobart Press: Summit, NJ, USA, 1993; 360p. [Google Scholar]
- Wilson, J.; Sevarkodiyone, S. Spatial and temporal distribution of mosquitoes (Culicidae) in Virudhunagar district, Tamil Nadu, South India. Int. J. Mosq. Res. 2014, 1, 4–9. [Google Scholar]
- White, D.S. Coleoptera (Beetles) in Aquatic Ecosystems A2—Likens, Gene E. In Encyclopedia of Inland Waters; Academic Press: Oxford, UK, 2009; pp. 144–156. [Google Scholar]
- Nogaro, G.; Mermillod-Blondin, F.; Montuelle, B.; Boisson, J.-C.; Gibert, J. Chironomid larvae stimulate biogeochemical and microbial processes in a riverbed covered with fine sediment. Aquat. Sci. 2008, 70, 156–168. [Google Scholar] [CrossRef]
- Matisoff, G.; Wang, X. Particle Mixing by Freshwater Infaunal Bioirrigators: Midges (Chironomidae: Diptera) and Mayflies (Ephemeridae: Ephemeroptera). J. Great Lakes Res. 2000, 26, 174–182. [Google Scholar] [CrossRef]
- Sivaramakrishnan, K.G. Systematics of the Ephemeroptera of India: Present status and future prospects. Zoosymposia 2016, 11. [Google Scholar] [CrossRef]
- Jacquemin, S.J.; Pyron, M.; Allen, M.; Etchison, L. Wabash River Freshwater Drum Aplodinotus grunniens Diet: Effects of Body Size, Sex, and River Gradient. J. Fish Wildl. Manag. 2014, 5, 133–140. [Google Scholar] [CrossRef]
- Ncube, S.; Beevers, L.; Adeloye, A.J.; Visser, A. Assessment of freshwater ecosystem services in the Beas River Basin, Himalayas region, India. Proc. IAHS 2018, 379, 67–72. [Google Scholar] [CrossRef]
- Cuffney, T.; Wallace, B.; Lugthart, J. Experimental evidence quantifying the role of benthic invertebrates in organic matter dynamics of headwater streams. Freshw. Boil. 1990, 23, 281–299. [Google Scholar] [CrossRef] [Green Version]
- Elahi, K.M.; Sikder, M.T. Mega Dams in the Himalayas: An Assessment of Environmental Degradation and Global Warming. In Proceedings of the International Conference on Environmental Aspects of Bangladesh (ICEAB), University of Kitakyushu, Kitakyushu, Japan, 4 September 2010; pp. 13–16. [Google Scholar]
- Handa, I.T.; Aerts, R.; Berendse, F.; Berg, M.P.; Bruder, A.; Butenschoen, O.; Chauvet, E.; Gessner, M.O.; Jabiol, J.; Makkonen, M.; et al. Consequences of biodiversity loss for litter decomposition across biomes. Nature 2014, 509, 218–221. [Google Scholar] [CrossRef] [PubMed] [Green Version]
- Noriega, J.A.; Hortal, J.; Azcárate, F.M.; Berg, M.P.; Bonada, N.; Briones, M.J.I.; Del Toro, I.; Goulson, D.; Ibanez, S.; Landis, D.A.; et al. Research trends in ecosystem services provided by insects. Basic Appl. Ecol. 2018, 26, 8–23. [Google Scholar] [CrossRef]
- United Nations. Sustainable Development Goals. Available online: https://sustainabledevelopment.un.org/sdgs (accessed on 4 September 2018).
- Wood, S.L.R.; Jones, S.K.; Johnson, J.A.; Brauman, K.A.; Chaplin-Kramer, R.; Fremier, A.; Girvetz, E.; Gordon, L.J.; Kappel, C.V.; Mandle, L.; et al. Distilling the role of ecosystem services in the Sustainable Development Goals. Ecosyst. Serv. 2018, 29, 70–82. [Google Scholar] [CrossRef]
- Biggs, B.J.F. Periphyton communities and their environments in New Zealand rivers. N. Z. J. Mar. Freshw. Res. 1990, 24, 367–386. [Google Scholar] [CrossRef] [Green Version]
- Clausen, B.; Biggs, B. Flow indices for ecological studies in temperate streams: Groupings based on covariance. J. Hydrol. 2000, 237, 184–197. [Google Scholar] [CrossRef]
- Clausen, B.; Iversen, H.; Ovesen, N. Ecological flow indices for Danish streams. In Nordic Hydrological Conference 2000; Nilsson, T., Ed.; Nordic Association for Hydrology: Uppsala, Sweden, 2000; pp. 3–10. [Google Scholar]
- Hughes, J.; James, B. A hydrological regionalization of streams in Victoria, Australia, with implications for stream Ecology. Mar. Freshw. Res. 1989, 40, 303–326. [Google Scholar] [CrossRef]
- Jowett, I.G.; Duncan, M.J. Flow variability in New Zealand rivers and its relationship to in-stream habitat and biota. N. Z. J. Mar. Freshw. Res. 1990, 24, 305–317. [Google Scholar] [CrossRef]
- Monk, W.A.; Wood, P.J.; Hannah, D.M.; Wilson, D.A.; Extence, C.A.; Chadd, R.P. Flow variability and macroinvertebrate community response within riverine systems. River Res. Appl. 2006, 22, 595–615. [Google Scholar] [CrossRef] [Green Version]
- Poff, N.L. A hydrogeography of unregulated streams in the United States and an examination of scale-dependence in some hydrological descriptors. Freshw. Boil. 1996, 36, 71–79. [Google Scholar] [CrossRef]
- Poff, N.L.; Ward, J.V. Implications of Streamflow Variability and Predictability for Lotic Community Structure: A Regional Analysis of Streamflow Patterns. Can. J. Fish. Aquat. Sci. 1989, 46, 1805–1818. [Google Scholar] [CrossRef]
- Puckridge, J.T.; Sheldon, F.; Walker, K.F.; Boulton, A.J. Flow variability and the ecology of large rivers. Mar. Freshw. Res. 1998, 49, 55–72. [Google Scholar] [CrossRef]
- Richards, R.P. Measures of Flow Variability for Great Lakes Tributaries. In Statistical Methods for the Assessment of Point Source Pollution, Proceedings of a Workshop on Statistical Methods for the Assessment of Point Source Pollution, Burlington, ON, Canada, 12–14 September 1988; Chapman, D.T., El-Shaarawi, A.H., Eds.; Springer: Dordrecht, The Netherlands, 1989; pp. 261–277. [Google Scholar] [CrossRef]
- Richards, R.P. Measures of Flow Variability and a New Flow-Based Classification of Great Lakes Tributaries. J. Great Lakes Res. 1990, 16, 53–70. [Google Scholar] [CrossRef]
- Wood, P.J.; Agnew, M.D.; Petts, G.E. Flow variations and macroinvertebrate community responses in a small groundwater-dominated stream in south-east England. Hydrol. Process. 2000, 14, 3133–3147. [Google Scholar] [CrossRef]
- Wood, P.J.; Hannah, D.M.; Agnew, M.D.; Petts, G.E. Scales of hydroecological variability within a groundwater-dominated stream. Regul. Rivers Res. Manag. 2001, 17, 347–367. [Google Scholar] [CrossRef]
Figure 1.
Outline of the proposed framework.

Figure 2.
Stages of the hydroecological modelling following an information theory approach [38].
Figure 2.
Stages of the hydroecological modelling following an information theory approach [38].

Figure 3.
Map of the Beas River Basin and its situation (inset top left); the locations of the flow gauges and macroinvertebrate (MI) sampling are indicated.
Figure 3.
Map of the Beas River Basin and its situation (inset top left); the locations of the flow gauges and macroinvertebrate (MI) sampling are indicated.

Figure 4.
Flow exceedance curves for each gauging station, by decade and hydrological season.

Figure 5.
Observed average seasonal LIFE scores across all sites for the period 2004–2007 (hydrological years); error bars indicate the minimum and maximum LIFE scores observed.
Figure 5.
Observed average seasonal LIFE scores across all sites for the period 2004–2007 (hydrological years); error bars indicate the minimum and maximum LIFE scores observed.

Figure 6.
Hydroecological model parameter uncertainty, the distribution of the relative error for 10,000 MC simulations. The box plot illustrates the spread of the data (summary statistics), whilst the violin plot highlights the distribution (or density) of the uncertainty.
Figure 6.
Hydroecological model parameter uncertainty, the distribution of the relative error for 10,000 MC simulations. The box plot illustrates the spread of the data (summary statistics), whilst the violin plot highlights the distribution (or density) of the uncertainty.

Figure 7.
Validation of the hydroecological model. Simulated seasonal LIFE scores from 2014–2017 (hydrological years). The observed data, two samples collected in winter 2017, are indicated in black, with the circle representing the mean LIFE score.
Figure 7.
Validation of the hydroecological model. Simulated seasonal LIFE scores from 2014–2017 (hydrological years). The observed data, two samples collected in winter 2017, are indicated in black, with the circle representing the mean LIFE score.

Table 1.
Macroinvertebrate flow groups and associated flow preferences as defined by [21].
Table 1.
Macroinvertebrate flow groups and associated flow preferences as defined by [21].
| Flow Group | Flow Preference |
|---|---|
| I | Rapid flows |
| II | Moderate to fast flows |
| III | Slow or sluggish flows |
| IV | Slow flows and standing water |
| V | Standing water |
| VI | Drying or drought impacted |
Table 2.
Months corresponding to the hydrological and ecological seasons in the Beas River, ordered by hydrological year (beginning in October).
Table 2.
Months corresponding to the hydrological and ecological seasons in the Beas River, ordered by hydrological year (beginning in October).
| Month | Hydrological Season | Ecological Season |
|---|---|---|
| October | Autumn | Winter |
| November | Autumn | Winter |
| December | Winter | Winter |
| January | Winter | Winter |
| February | Winter | Winter |
| March | Summer | Summer |
| April | Summer | Summer |
| May | Summer | Summer |
| June | Monsoon | Monsoon |
| July | Monsoon | Monsoon |
| August | Monsoon | Monsoon |
| September | Monsoon | Winter |
Table 3.
Beas River catalogue of instream ecosystem services and the effect increasing abundance of given families has on LIFE score. Latin and common names are indicated in italics and brackets respectively; fg stands for flow group following [21]. The seasons in which taxa are observed in is indicated by W (winter), S (summer), and M (monsoon).
| Role in Instream Supporting Ecosystem Services | Defined Instream Supporting Ecosystem Services | Taxonomic Order | Taxonomic Family | Season Observed | Flow Preference | Increasing Abundance Effect |
|---|---|---|---|---|---|---|
Filter and surface deposit feeders:
|
| Diptera (true fly) | Chironomidae (non-biting midges) | W; S | NA | NA |
| Ephemeroptera (mayfly) | Ephemeridae (Hexagenia sp.) | W; S | Moderate; fast. fg = II | + | ||
Facultative and specialist shredders:
|
| Diptera (true fly) | Simuliidae (black fly) | S (limited) | Moderate; fast. fg = II | + |
| Plecoptera (stonefly) | Leuctridae | W | Rapid; moderate; fast. fg = I/II | + | ||
| Trichoptera (caddisfly) | Limnephilidae | W | Flowing; standing. fg = IV | - | ||
| Sediment reworkers excavate and increase breakdown of buried leaf litter in the sand. |
| Ephemeroptera (mayfly) | Ephemeridae | NA | NA | NA |
| Odonata | Cordulegastridae (dragonfly) | Moderate; fast. fg = II | + | |||
| Trichoptera (caddisfly) | Limnephilidae | W | Flowing; standing. fg = IV | - | ||
| Food source for mammals, birds, reptiles, amphibians, bats, fish. |
| Diptera (true fly) | Chironomidae (non-biting midges) | W; S | NA | NA |
| Simuliidae (black fly) | S (limited) | Moderate; fast. fg = II | + | |||
| Ephemeroptera (mayfly) | All observed families | W; S | Moderate; fast. fg = II | + | ||
| Trichoptera (caddisfly) | Hydropsychidae | W; S | Moderate; fast. fg = II | + | ||
| Plecoptera (stonefly) | All observed families | M | Rapid; moderate; fast. fg = I/II | + |
Table 4.
Hydroecological model structure and index definitions ordered by relative importance. The facets of the flow regime are indicated by M (magnitude), D (duration), T (timing), and F (frequency), whilst the aspect of the flow regime is indicated by H (high), A (average), and L (low). The confidence interval is relative to the value of the coefficient.
| # | Index | Facet | Aspect | Definition | Unit | Coefficient | Importance | Confidence Interval |
|---|---|---|---|---|---|---|---|---|
| 0 | intercept | - | - | - | - | 7.03 | 1.00 | 17.78 |
| 1 | Mn30MaxQ50 | D | H | Seasonal maximum of 30-day moving average flow relative to the median. | - | −0.26 | 0.57 | 0.84 |
| 2 | Min | M | L | Seasonal minimum flow. | m3/s | −12.85 | 0.55 | 71.27 |
| 3 | Mn7Min | D | L | Seasonal minimum of seven-day moving average flow. | m3/s | 12.56 | 0.52 | 76.78 |
| 4 | 20R80 | M | A | Ratio of the 20th and 80th percentiles in daily average flow. | - | 7.88 | 0.52 | 40.34 |
| 5 | Q05Q50 | M | H | Five percent exceedance flow relative to the median. | - | 0.17 | 0.48 | 1.82 |
| 6 | JDMinSD | T | L | Standard deviation in the Julian data of the seven one-day minimum daily average flow. | - | −0.08 | 0.46 | 0.57 |
| 7 | PlsQ75 | F | L | Number of low flow pulses below a Q75 (seasonal, baseline) threshold. | - | 0.03 | 0.44 | 0.17 |
| 8 | Q01Q50 | M | H | Characterisation of extremes; one percent exceedance flow relative to the median. | - | -0.10 | 0.40 | 0.60 |
| 9 | Mn30MinQ50 | D | L | Seasonal minimum of 30-day moving average flow relative to the median. | - | 0.03 | 0.30 | 12.07 |
Table 5.
Predicted hydroecological response to alteration of the facets of the flow regime (based on the hydroecological model). Increases detailed; decreases have inverse effects. The symbols ▲/▼ indicates changes observed through inputting adjusted flow magnitudes into the hydroecological model.
Table 5.
Predicted hydroecological response to alteration of the facets of the flow regime (based on the hydroecological model). Increases detailed; decreases have inverse effects. The symbols ▲/▼ indicates changes observed through inputting adjusted flow magnitudes into the hydroecological model.
| Facet | Alteration | Ecological Response (∆Life) | Impact on Supporting Ecosystem Services | |
|---|---|---|---|---|
| Magnitude | Increase magnitude | NA | ▬ | ▬ |
| Duration | Increased distribution of high flow days | Positive | ▲ | Diverse macroinvertebrate community, increased rates and number of supporting ES delivered. |
| Increased distribution of low flow days | Positive | ▲ | Diverse macroinvertebrate community, increased rates and number of supporting ES delivered. | |
| Timing | Increased distribution of high flow days | NA | ▬ | ▬ |
| Increased distribution of low flow days | Negative | ▼ | Altered macroinvertebrate community, reduced rates/number of supporting ES delivered. | |
| Frequency | Increase the distribution of high flow days | Positive | ▲ | Diverse macroinvertebrate community, increased rates and number of supporting ES delivered. |
| Increase the distribution of low flow days | Positive | ▲ | Diverse macroinvertebrate community, increased rates and number of supporting ES delivered. | |
© 2018 by the authors. Licensee MDPI, Basel, Switzerland. This article is an open access article distributed under the terms and conditions of the Creative Commons Attribution (CC BY) license (http://creativecommons.org/licenses/by/4.0/).
Share and Cite
MDPI and ACS Style
Ncube, S.; Visser, A.; Beevers, L. A Framework for Assessing Instream Supporting Ecosystem Services Based on Hydroecological Modelling. Water 2018, 10, 1247. https://doi.org/10.3390/w10091247
AMA Style
Ncube S, Visser A, Beevers L. A Framework for Assessing Instream Supporting Ecosystem Services Based on Hydroecological Modelling. Water. 2018; 10(9):1247. https://doi.org/10.3390/w10091247
Chicago/Turabian StyleNcube, Sikhululekile, Annie Visser, and Lindsay Beevers. 2018. "A Framework for Assessing Instream Supporting Ecosystem Services Based on Hydroecological Modelling" Water 10, no. 9: 1247. https://doi.org/10.3390/w10091247
Note that from the first issue of 2016, this journal uses article numbers instead of page numbers. See further details here.