Article

Water Quality as an Indicator of Stream Restoration Effects—A Case Study of the Kwacza River Restoration Project

by
Natalia Mrozińska
1,
Katarzyna Glińska-Lewczuk
2,
Paweł Burandt
2,
Szymon Kobus
2,
Wojciech Gotkiewicz
3,
Monika Szymańska
1,
Martyna Bąkowska
1 and
Krystian Obolewski
1,*
1
Department of Hydrobiology, Kazimierz Wielki University in Bydgoszcz, 85-064 Bydgoszcz, Poland
2
Department of Water Resources, Climatology and Environmental Management, University of Warmia and Mazury in Olsztyn, Pl. Łódzki 2, 10-719 Olsztyn-Kortowo, Poland
3
Department of Agrotechnology, Agricultural Production Management and Agribusiness, University of Warmia and Mazury in Olsztyn, Pl. Łódzki 2, 10-719 Olsztyn-Kortowo, Poland
*
Author to whom correspondence should be addressed.
Water 2018, 10(9), 1249; https://doi.org/10.3390/w10091249
Submission received: 31 July 2018 / Revised: 6 September 2018 / Accepted: 12 September 2018 / Published: 14 September 2018
(This article belongs to the Special Issue Freshwater Quality as a Driver of Aquatic Ecosystem Health)

Abstract

:
River restoration projects rely on environmental engineering solutions to improve the health of riparian ecosystems and restore their natural characteristics. The Kwacza River, the left tributary of the Słupia River in northern Poland, and the recipient of nutrients from an agriculturally used catchment area, was restored in 2007. The ecological status of the river’s biotope was improved with the use of various hydraulic structures, including palisades, groynes and stone islands, by protecting the banks with trunks, exposing a fragment of the river channel, and building a by-pass near a defunct culvert. The effects of restoration treatments were evaluated by comparing the physicochemical parameters of river water along the 2.5 km restored section between the source and the mouth to the Słupia, before restoration and 6 years after hydrotechnical treatments. A total of 18 physicochemical parameters were analyzed at 10 cross-sections along the river. The greatest changes were observed in the concentrations of NO3-N and NH4+-N, which decreased by 70% and 50%, respectively. Dissolved oxygen concentration increased by 65%. Chloride values increased by 44%, and chlorophyll-a concentration increased by 30% after the project. The cut-off channel (by-pass), semi-palisades, and single groynes were the treatments that contributed most to water quality improvement. The results of this study indicate that river restoration projects can substantially reduce nitrogen pollution, which is particularly important in agricultural areas. Such measures can effectively reinstate natural conditions in river ecosystems. Hydrochemical monitoring is required to control the parameters of restored rivers.

1. Introduction

River ecosystems are influenced by a variety of anthropogenic factors. Their structure and function respond to both abiotic and biotic factors. Abiotic components such as hydrology [1,2,3], geomorphology [4,5], hillslope–riparian interactions [6], groundwater–surface-water interactions [7,8], nutrient availability [9,10,11], light [12], dissolved gases [13], and water chemistry [14], play an important role in the development of biological communities in streams and rivers. These external determinants may be regarded as bottom-up controls of the trophic chain [15]. The interactions in lotic ecosystems are often interrupted by man-made changes in the river channel, including the straightening of naturally meandering bends, embankments, bottom deepening, as well as intensive land use in their catchment areas. Therefore, these activities induce changes in both water quality (WQ) [10], and the type and quantity of energy and food sources (organic matter and nutrients) that reach the ecosystem [13,16]. River restoration is a process of returning an ecosystem to a pre-disturbance state [16,17]. To achieve that goal, both the structure and the function of rivers and floodplains should be recreated by re-establishing their original hydrological attributes and the associated physical, chemical, and biological characteristics [18,19]. River and floodplain restoration requires subsequent monitoring of abiotic and biotic factors, and the identification of ecosystem stressors, that provide design guidance for targeted enhancements [18,19,20,21]. Post-project monitoring supports continued advancements in restoration approaches to biologically impaired rivers.
Waters flowing through rural areas have numerous functions and constitute a valuable component of the natural environment [20]. Human efforts aiming to adapt aquatic systems for agricultural and residential purposes have induced both physical and chemical alterations in river channels [10,13,21]. River regulation, reinforcement of river banks, decrease in river bed slopes, and the construction of hydraulic systems and buildings inhibit or prevent the migration of flora and fauna. Anthropogenic disturbances alter both geomorphic features and the natural balance of water reaching the floodplain. Intensive farming is commonly regarded as a non-point source of pollution, which leads to significant deterioration of water quality, as well as significant changes in water runoff dynamics. The associated water quality problems can affect the ecology and economy of riparian areas by decreasing the productivity of fisheries and reducing the recreational appeal of those areas [21,22].
The growing environmental impacts of nutrient pollution have prompted efforts to track pollution sources and manage nutrient loads in streams and rivers [21,22]. The loss of nutrients (mainly N and P) from catchments can be effectively minimized on-site through multiple strategies, including reducing fertilizer inputs, fixing leaky sewer systems, and banning the use of phosphates in detergents [21,22,23]. However, in many regions, good management practices that aim to reduce pollution sources and loads meet social, political, and economic resistance.
In Europe, natural river corridors and floodplains are rare and threatened by human activity. Due to growing levels of awareness that streams fulfil important ecological, societal, and economic functions, scientists, water authorities, NGOs, and political exponents have rendered river restoration a trendy and popular discipline. The restoration of streams, rivers, wetlands, and floodplains has become a pivotal element of catchment management to counteract anthropogenic degradation, depletion of river health and water resources, and to increase overall biodiversity and ecosystem service provisioning. In recent years, the primary goals of stream restoration, such as bank stabilization, upgrading aging infrastructure, and repairing property damage, have been expanded to include a streams natural ability to retain and transform nutrients from catchment areas. According to Newcomer Johnson et al. [23], the effectiveness of stream restoration practices in improving water quality should be determined based on an empirical understanding of the possibilities and limitations of restoration across a range of environmental conditions, including watershed size, land use, stream flow, and restoration type (Table 1).
Restoration practices in streams and rivers may enhance nutrient retention and transformation processes through temporary storage, assimilation, adsorption, or permanent removal through coupled nitrification and denitrification [23]. One of the most effective restoration solutions in improving water quality is the reconnection of stream side-arms [24,25,26]. Hein et al. [24] provided interesting evidence for the purifying function of side-arms in the Austrian part of the Danube floodplain, whereas Glińska-Lewczuk [25] demonstrated that meander cut-offs with different hydrological connectivity play an important role as effective biofilters for draining farmlands in postglacial areas in the southern Baltic Sea basin. It is worth noting that the reverse can occur under specific conditions. For example, eutrophication in cut-off side-arms may deteriorate water quality in the main river after re-connection. According to Schönbrunner et al. [27], in changed hydrological regimes, phosphorus released from sediments in dry–wet cycles in shallow side-channels may affect riverine water due to increased surface water exchange with the main river channel.
The key components and interactions which determine the success of river basin restoration projects are generally difficult to quantify due to the complexity of river ecosystems. This is probably the main reason why very few programs undergo systematic post-intervention evaluation, despite an increase in the number of implemented restoration projects [23,34]. The most common and recommended method for assessing restoration-induced changes in river ecosystems is water quality monitoring [34] and monitoring of biotic components, mainly benthic invertebrates [12,18,34]. According to Viswanathan et al. [35], changes in the hydrological regime of a river resulting from the deployment of various hydraulic structures in the riverbed improve habitat heterogeneity [19,36], and increase the quantity of benthic organic matter (BOM) [36], algae [37], and microorganisms [38]. These changes contribute to gross primary production (GPP), which increases the concentration of dissolved organic carbon (DOC) under exposure to sunlight [39]. Nitrogen is fixed by microorganisms, which combined with higher GPP, decreases the concentration of available nitrogen. The above mechanism decreases the fertility of river water, which is the main objective of many restoration projects [40].
The overall objective of our study was to investigate the effectiveness of stream restoration techniques in improving water quality in an impaired stream of an agricultural catchment. We hypothesized that the hydrotechnical structures deployed in the restored river section will modify the morphology of the riverbed, will increase the heterogeneity of floodplain habitats, and will contribute to water quality improvement. We set out to determine which of the applied restoration techniques delivered the anticipated effects and could be recommended for future projects as solutions that most effectively restore river ecosystem health. In the present study, only abiotic components and the key interactions between the physicochemical parameters of the river system were considered. Therefore, the aim of this study was to present the treatments applied in the project to restore the Kwacza River ecosystem, to identify the most important correlations between hydrotechnical treatments and abiotic components, to predict the effects of the restoration project six years after its completion, and to analyze various methods for evaluating the progress of restoration. We hope that the presented results will be useful in other restoration projects, and will provide a rational basis for setting appropriate and cost-effective goals for ecosystem recovery.

2. Materials and Methods

2.1. Study Area

The source of the Kwacza River is situated 30 m above sea level (latitude: 54°23′08′′ N, longitude: 17°01′42′′ E; Figure 1).
The Kwacza River catchment is located in the center of the Pomerania Region (northern Poland) and covers an area of 85 km2. The Kwacza River is a tributary of the middle Słupia River, the main river in the region. Kwacza has a length of 42.6 km between its source and its mouth in the Słupia River (latitude: 54°23′29′′ N, longitude: 17°02′01′′ E). The hydrographic network of the Kwacza River consists of many small watercourses, some of which have been highly transformed by hydrotechnical structures for the needs of stream restoration, in particular in its lower course where the Kwacza River meets the Słupia River. The river catchment has been nearly entirely reclaimed. Wetland areas were drained and converted into grasslands (Table 2).
The flow of the Kwacza River was partially diverted into a by-pass ditch to irrigate meadows and grasslands [18]. Peat was excavated across a large area in the river catchment. The river basin was used less for agricultural purposes during the economic crisis of the late 1980s. Drainage canals and the irrigation system ceased to operate. Plant succession in peatlands led to the development of meadow plant communities, including sedges, willow scrubs, and riparian forests. These processes induced changes in rush vegetation and contributed to the expansion of plant communities of the class Molinio-Arrhenatheretea [41]. At present, arable lands are predominant in the upper and middle parts of the Kwacza River catchment.

2.2. Hydrometric Measurements

Hydrometric measurements were carried out in 2007 (before restoration, T+0) and 2013 (after restoration, T+6) at 10 river cross-sections (Figure 1) to compare the changes in hydrodynamics. At each cross-section, three vertical profiles of flow velocity (v, m·s−1), on both shores and in the middle of the riverbed, were measured every three months with an electromagnetic flow meter (Valeport Ltd., 803 moel, Devon, UK). Streamflow (Q, m·s−3) was calculated using mean flow velocity and cross-sectional area at site K-10. Water levels in the Kwacza and Słupia Rivers were monitored with the TD-Diver submersible data logger (Van Essen Instruments, Delft, The Netherlands) at hourly intervals. The results were compensated with the Baro-Diver data logger for real-time atmospheric pressure monitoring (Van Essen Instruments, The Netherlands).

2.3. Water Quality Sampling

In situ measurements were performed and water samples were collected from each study site (K1–K10 and S) on a monthly basis during six summer months, both before and after restoration. A total of 120 samples were collected from the Kwacza River and 12 samples were collected from the Słupia River. Physicochemical parameters, including water temperature, electrolytic conductivity (EC), pH, dissolved oxygen (DO, mg·L−1), oxygen saturation (DO, %), chlorophyll-a (Chl-a), total dissolved solids (TDS), and salinity, were measured in situ with a calibrated YSI 6600 multiparametric probe (Ohio, USA). Ion concentrations in water samples were assessed in a laboratory where cations (Ca2+, Na+, K+, and Mg2+-NH4+-N) and anions (NO3-N, NO2-N, Cl) were analyzed with the use of the 881 Compact IC Pro ion chromatograph (Metrohm, Herisau, Switzerland). Before analysis, the samples were passed through 0.2-µm sterile filters, and examined on Metrosep C4 250/4.0 and Metrosep A Supp 5 250/4.0 columns with Metrosep C4 Guard/4.0 and Metrosep A Supp 4/5 Guard 4.0 pre-columns, respectively. Total phosphorus (TP) and orthophosphates (PO43−-P) were measured with ascorbic acid and ammonium molybdenate. The unfiltered fraction of P was determined by acid digestion, followed by peroxidisulphate oxidation and the addition of ammonium chloride [42]. Chemical oxygen demand (CODCr) was measured with potassium dichromate. All chemical parameters were assessed with the use of standard analytical methods [43]. Annual loading, expressed as the product of average flow (Q, m·s−3) and the concentration of an individual element in water (mg·L−1), was calculated in tonnes·year−1, while its load outflowing from a unit catchment area was determined in kg·year−1·km−2.

2.4. Data Analysis

The significance of differences between mean values was determined using the Mann–Whitney U test. The initial critical probability value was set at p < 0.05. Ordination techniques were used to describe the relationships between the groups of water parameters (pH, EC, DO, PO4-P, NH4-N, NO3-N, and Cl) and environmental variables (distance to the river mouth and discharge Q). The length of the gradient determined by Detrended Correspondence Analysis of plant communities was <2 SD, which suggests that principal component analysis (PCA) was the appropriate method [44,45]. PCA was performed to validate the distribution of water parameters between the studied periods (T+0 and T+6).
Generalized Additive Models (GAMs) were used to test the importance of environmental variables for treatments. Two different datasets, one for each sampling period (T+0 and T+6), were used in GAM analyses to avoid dependence in the datasets. Eight environmental variables were selected for analysis from the measured parameters. The selected variables included WQ variables (NH4+-N and NO3-N) and a landscape variable (distance to the river mouth). The above parameters were chosen to minimize redundancy in the set of explanatory variables during regression analysis. All variables were log-transformed (log10(x + 1)) to reduce the effect of outliers. GAM calculations were performed with CANOCO software. The variables for the final model were obtained by automatic stepwise selection, and the Akaike Information Criterion (AIC) was used to select the best model with increasing complexity (degrees of freedom equal to 1, 2, and 3). The increase in deviance caused by each variable included in the model and obtained by stepwise selection was tested, and only variables that caused a significant increase in deviance were retained in the final model. When overdispersion was detected, the F-test was performed instead of the Chi-square test to determine the significance of the deviance explained by each selected variable [44]. Drop contribution was used to identify the contribution of each explanatory variable, and it was expressed as the decrease in deviance resulting from the elimination of a variable from the final model [44,45].

3. Results

3.1. Hydrological Characteristics

The hydrological conditions observed at the studied sites in 2007 and 2013 were characteristic of river networks with a complex hydrological regime in the temperate zone. The mean discharge of the Słupia River at the gauging station in Słupsk was estimated at Q < 14 m3·s−1. In spring, discharge usually increases due to melt water, it increases in summer due to rainfalls, and is minimal in autumn. Overflows and backward flows from the Słupia to the Kwacza were not observed in the analyzed periods. Before the restoration project, the hydrological regime of the Kwacza River was marked by ground-rain-melt supply with an average flow of 0.41 m3·s−1 (Table 3).
Overland flow was similar to other rivers in that region, and it was estimated at 6.0 L·s−1·km−2. No significant changes in mean water stage were observed along the restored section. In the T+6 period, both water flows and water stages were somewhat lower in sites K1 and K10 relative to T+0, which could be associated with the draining effect of the Słupia River during low water stage, especially in the summer of 2013.
The applied hydrotechnical structures generally decreased flow velocity along the restored section of the Kwacza River, and water retention time increased after the reconstruction of the river’s cross-sectional geometry (Table 3). The most significant changes in water flow were observed in sites where double groynes (K6) and stone islands (K8) had been introduced (Figure 1 and Figure 2).
The narrowing of the river channel increased channel depth and maximum flow velocity in the cross-section to 0.9 m·s−1. The applied structures induced clear changes in streamflow velocity (U test, p < 0.01). In the T+0 period, mean flow velocity was higher than in the T+6 period only at sites K1, K2, and K10 (1.5-fold and 6.5-fold, respectively) (Figure 2). In the remaining sites, restoration works contributed to a significant increase in water velocity. The highest velocities were noted in the cross-section with stone islands (K6) where water current reached 1.2 m·s−1, and in the double groynes (K5) and double semi-palisade (K7) where water current increased to 1.1 m·s−1. Both the groynes and the semi-palisade contributed to significant stabilization of water levels.

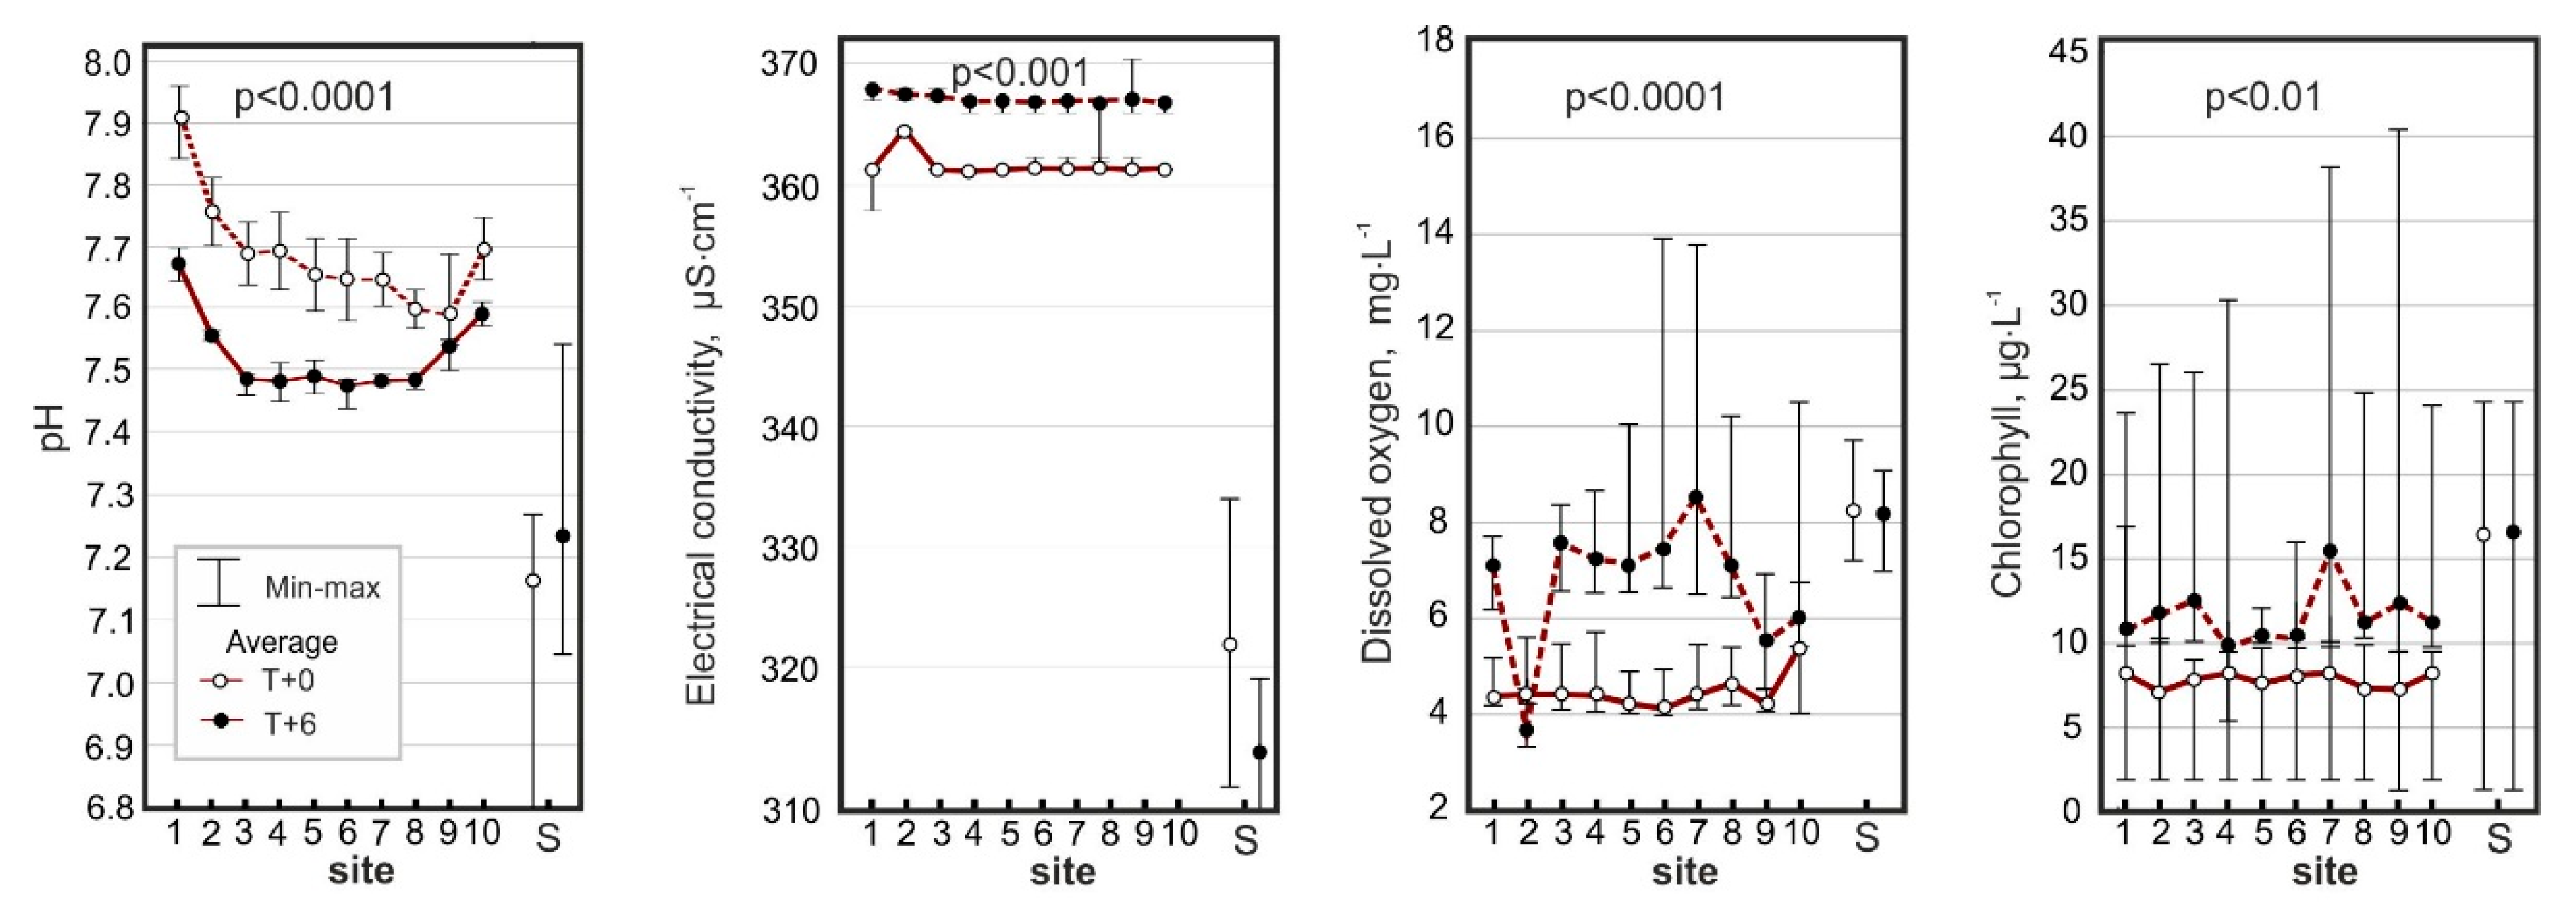
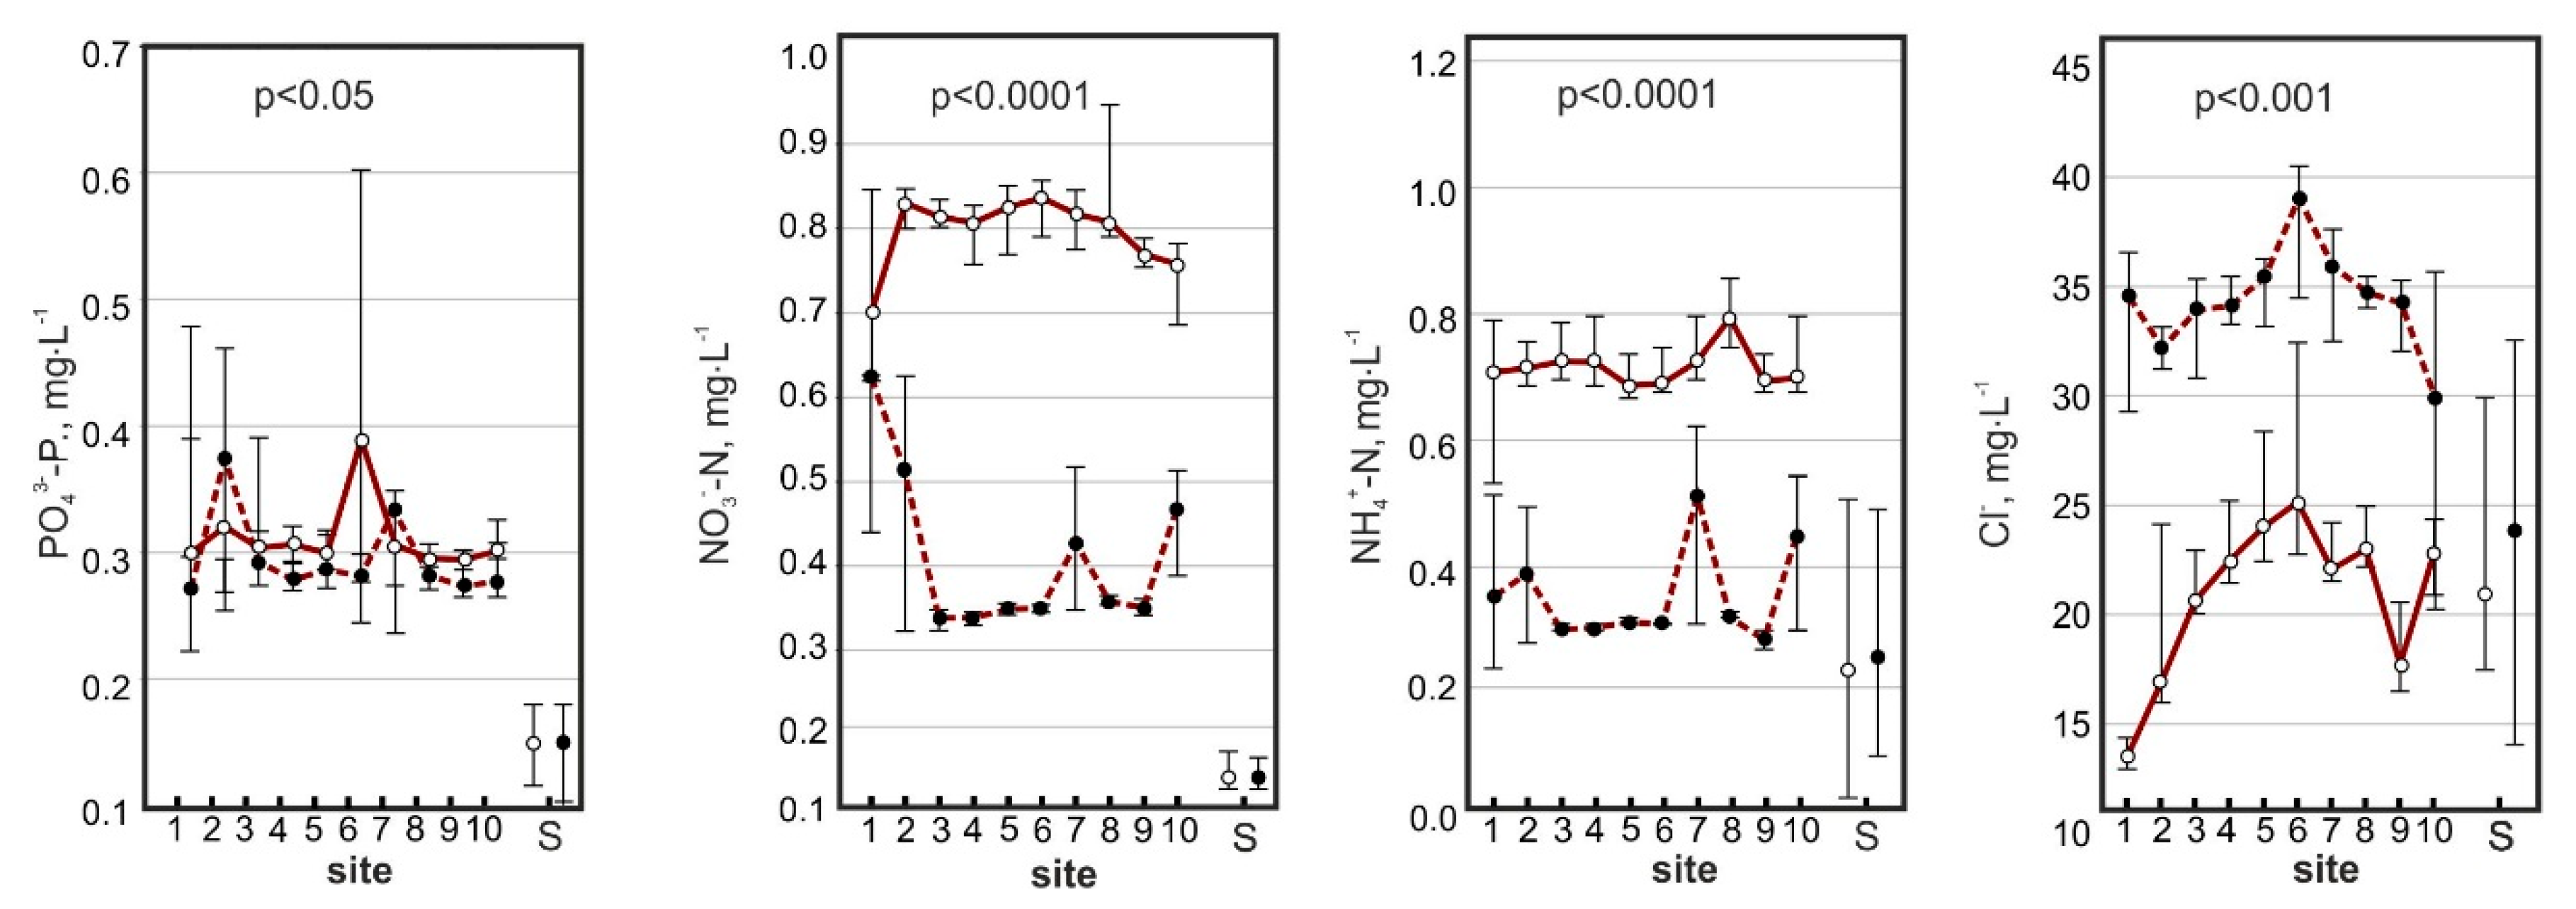
3.2. The Hydrochemical Characteristics of Water in the Kwacza River before and after Restoration

The results of the analysis of discrete samples collected before and after restoration from 10 sampling sites between the up-stream (K1) and down-stream (K10) segments of the Kwacza River, and from the main Słupia channel as the reference site, are shown in Table 1. The values of most water quality parameters were higher in the Kwacza River than in the Słupia River. Nutrient concentrations (PO43−-P, NO3-N, and NH4+-N) were elevated along the studied section of the river, in particular before restoration. During this period, a decrease in pH and nitrogen compounds was observed between sites K1 and K10, and an increase was noted in DO and Cl.
A comparison of selected physical and chemical parameters between K1 and K10 before and after restoration revealed considerable differences (Figure 3). The values of most parameters clearly decreased after restoration, and the greatest decrease was noted in pH, DO, NO3-N, and NH4+-N (U test, p < 0.0001). The mean values of EC, Cl (p < 0.001), and Chl-a (p < 0.01) decreased significantly, whereas the drop in PO43−-P concentration was on the brink of statistical significance (Figure 3).
The installation of various hydrotechnical structures contributed to greater fluctuations in parameter values along the watercourse. The coefficients of variation (cv) of DO and Chl-a, NH4+-N, TP, and Cl increased (Table 4), and these parameters were most sensitive to changes in habitat conditions.
The changes in WQ resulting from restoration activities on the Kwacza River were referenced to the hydrochemical background of the Słupia River, the recipient of the Kwacza outflow. Both before and after the restoration, the mean PO43−-P concentration was almost 3-fold higher in the Kwacza than in the Słupia, while COD and Chl-a concentrations were nearly 2-fold higher (Table 4). In the period before the restoration (T+0), the greatest differences were observed in the values of NO3-N and NH4+-N, which were 7-fold and 4-fold higher in the Kwacza than in the Słupia, respectively. After restoration (T+6), only 2-fold differences were noted in the above mineral nitrogen forms. The concentrations of Ca and Cl were also significantly higher in the Kwacza than in the Słupia. The remaining parameters did not differ significantly between the analyzed periods.

3.3. Changes in Water Quality Induced by Restoration Treatments

The restoration of the Kwacza River induced the most pronounced changes in water quality in the vicinity of the by-pass (K2), semi-palisade (K1), and groynes (K5 and K6). The greatest changes were noted in chloride concentrations (Figure 3), which were significantly higher in T+6 than in T+0. After restoration, the concentrations of Chl-a and ammonia nitrogen peaked in the insolated area (K7), whereas pH value and EC were significantly influenced by the single semi-palisade (Table 5).
As a result of the restoration, the mean concentration of NO2-N decreased 1.5-fold between sites K1 and K10, but it remained 5-fold higher than in the Słupia River (Table 4 and Table 6). Similar observations were made in the mean concentration of nitrate nitrogen (Table 6). Only the concentration of NH4+-N was higher in the Kwacza than in the Słupia.
The differences in nutrient loads carried by the Kwacza River were compared in the T+6 period after the completion of the restoration project. The comparison revealed that altered hydrological conditions and decreased nutrient inputs contributed to a decrease in the amount of substances transported by the river (Table 6). After the restoration of the Kwacza River, the amount of total dissolved matter transported annually by the river at site K10 decreased by 7%, from 7.3 tonnes·year−1 to 6.8 tonnes·year−1. However, the annual loss of chemical elements per unit area from the Kwacza catchment remained higher even after the restoration period, and amounted to 80 kg·year−1·km−2. A comparison of the annual loads carried by the river in K10 before and after restoration revealed that the amount of nitrate-N decreased by 64%, NH4+-N by 50%, K+ by 12%, and Na+ and Cl by 9%. In contrast, the newly created habitats did not influence the amount of P carried by the river at site K10 (Table 6). Calcium was the only studied macroelement whose loads increased (by 11%) after restoration.
Six years after installation, the restoration system contributed to the removal of 12 kg NO3-N per year (57%), and it increased K+ and Mg2+ loads by 1 kg between up-stream (K1) and down-stream (K10) segments of the Kwacza River. Unlike the loss of nitrate-N induced by the installed structures in the riverbed, phosphates were not limited by the restoration project. The changes in the remaining chemical elements were not identified or were not statistically significant (p < 0.05).

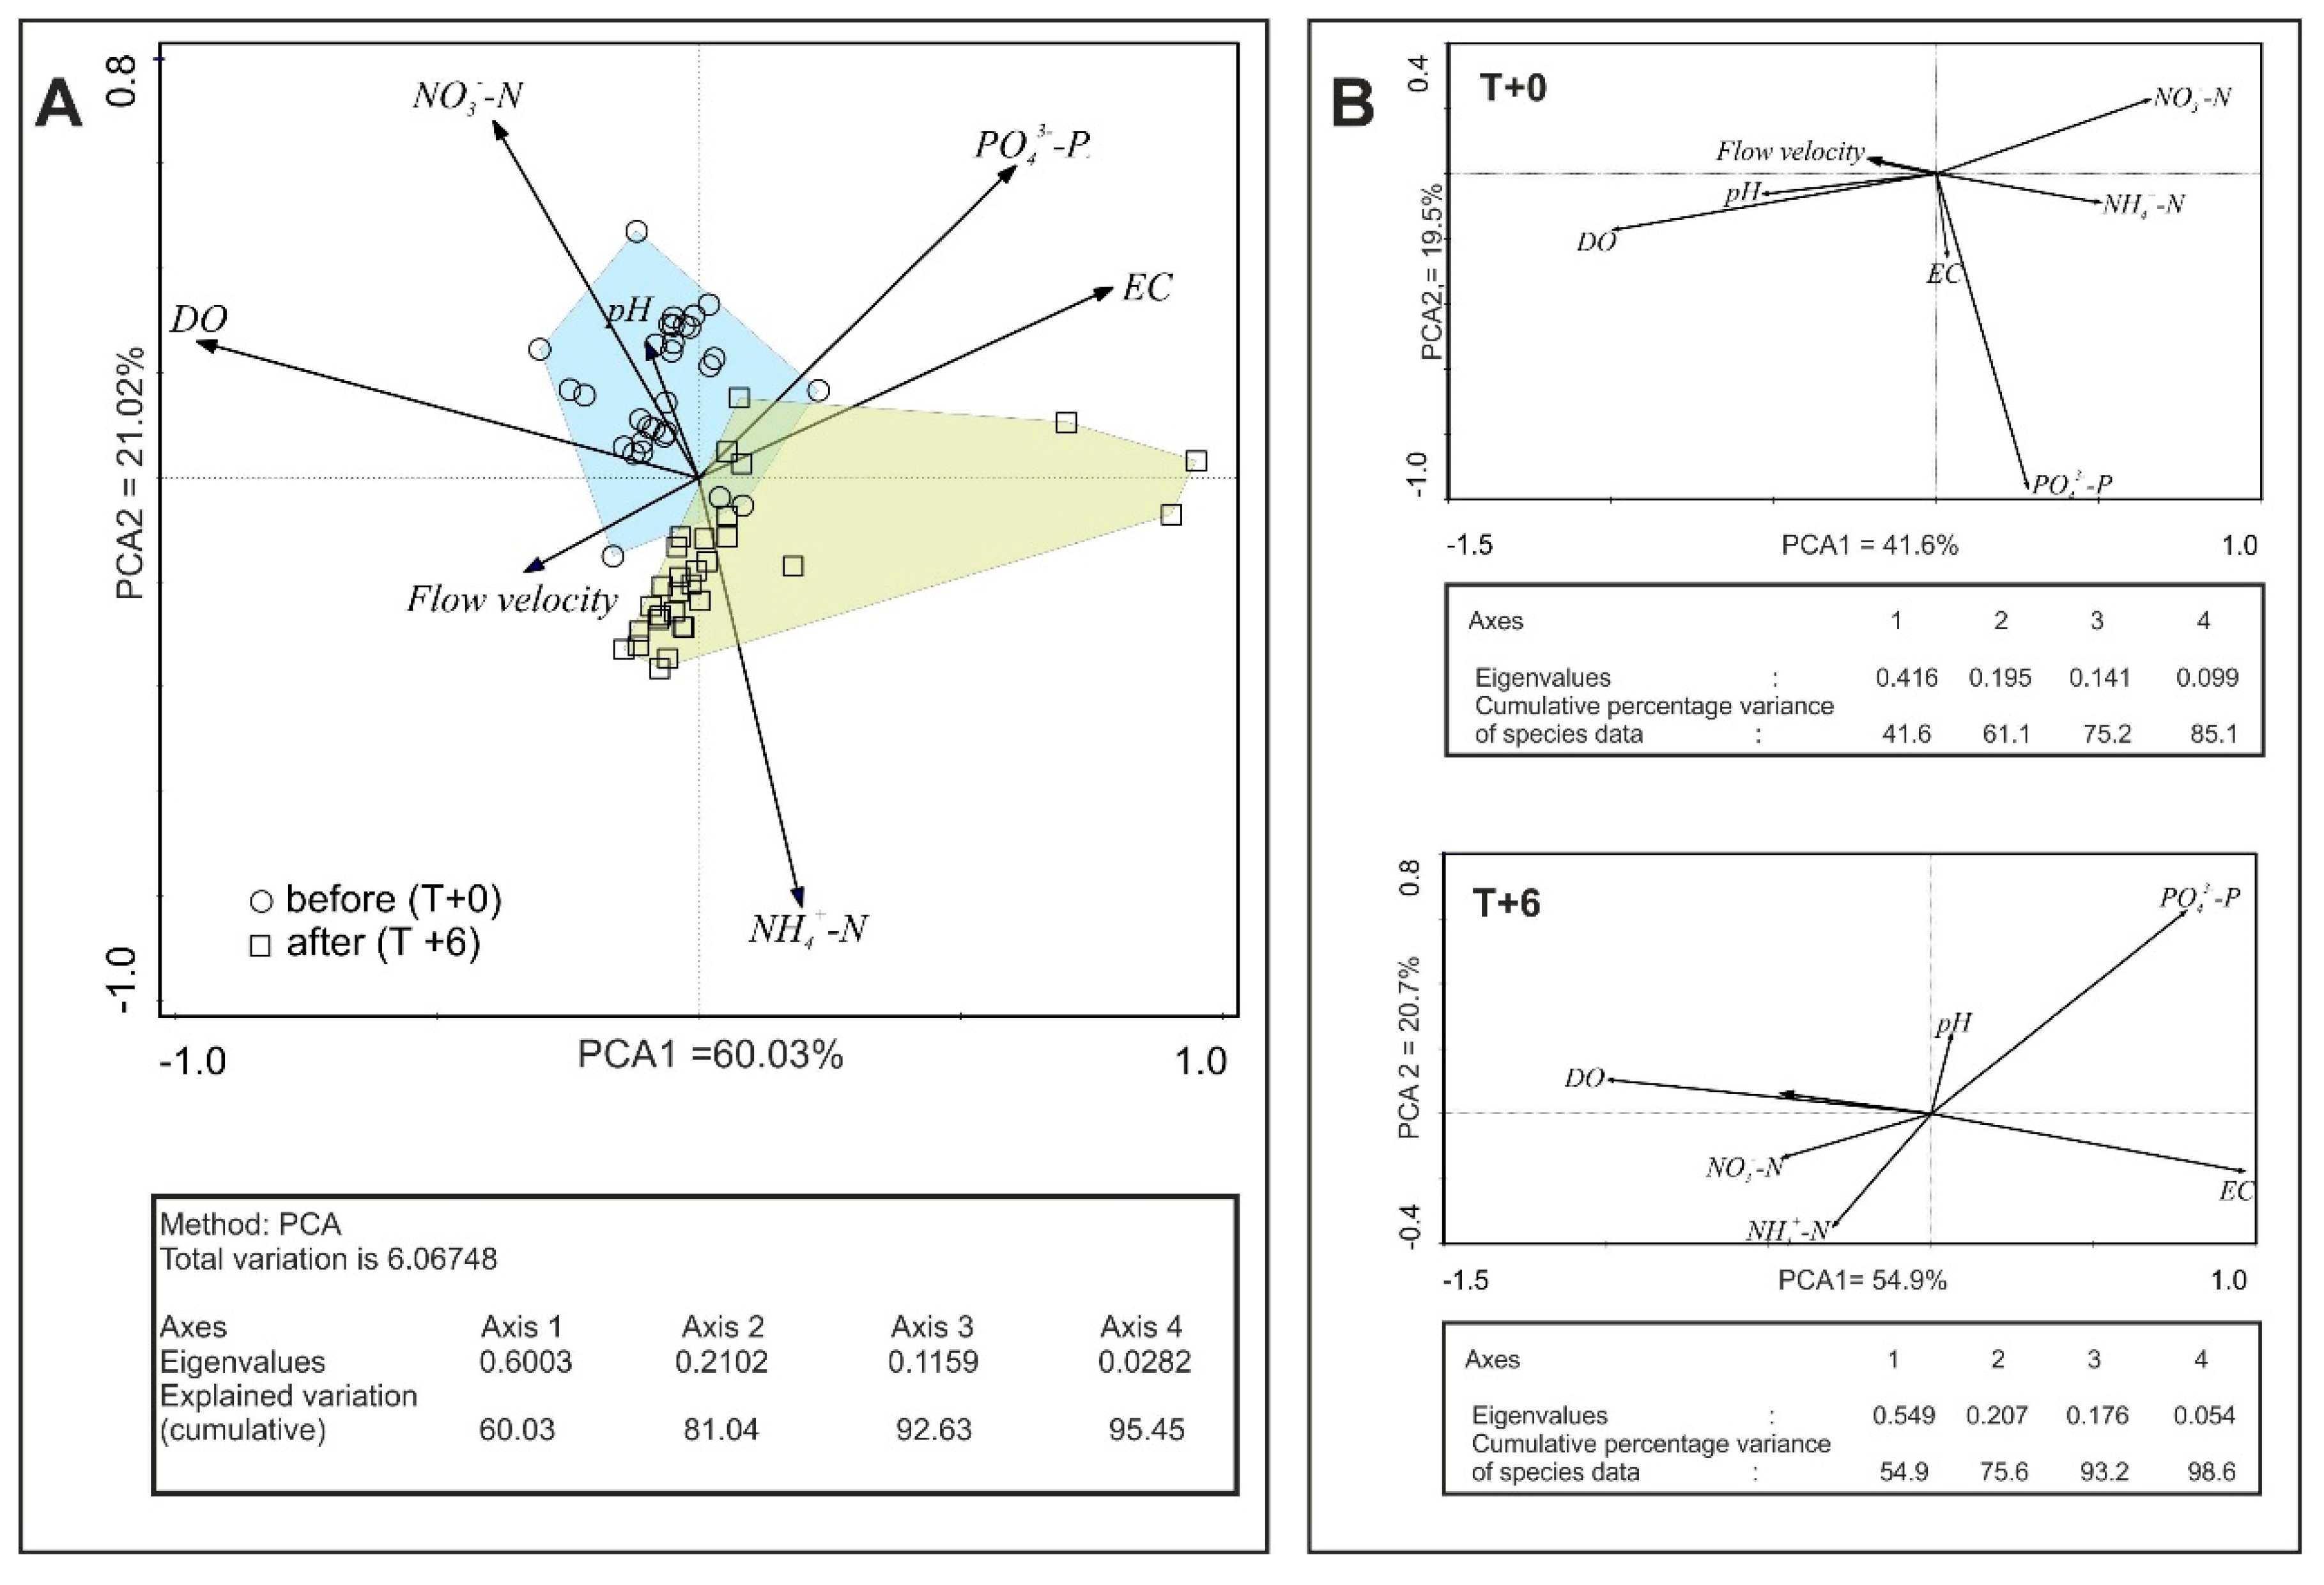
3.4. Ordination Analyses

The general trends and the spatial distribution of the variables correlated with the principal components were analyzed based on the results of the PCA (Figure 4A). Seven hydrological, physical, and chemical parameters which are reliable indicators of ecosystem quality were ultimately selected from the group of 17 environmental variables analyzed in the ordination. One physical parameter (temperature) and 10 chemical parameters (COD, TDS, K+, Na+, Mg2+, Ca2+, Cl, TP, NO2-N, and Chl-a) were not included in the model because they were redundant, or did not significantly contribute to the quality of the results.
The PCA revealed differences in the distribution of nutrients and other water parameters in the evaluated periods (Figure 4B. Both canonical axes explained more than 60% of variance in the period T+0 and 75% in the period T+6. The first axis was most influenced by the concentrations of nitrogen compounds and PO43−-P before restoration, and by PO43−-P and EC values after restoration. The second axis was most influenced by flow velocity in the T+0 period, and by DO and, partially, by velocities in the T+6 period.
The PCA analysis comprehensively illustrates the relationships between the studied water parameters, and in particular the negative correlation between flow velocity versus EC and PO43−-P (Figure 4A). A comparison of PCA results for the Kwacza River before and after restoration (Figure 4B) revealed the significant role of DO in nutrient removal. A local increase in water flow velocity increased water oxygenation and contributed to nitrification. The removal of nitrate-N appeared to be strongly influenced by hydraulic residence time in the restored segments of the river.

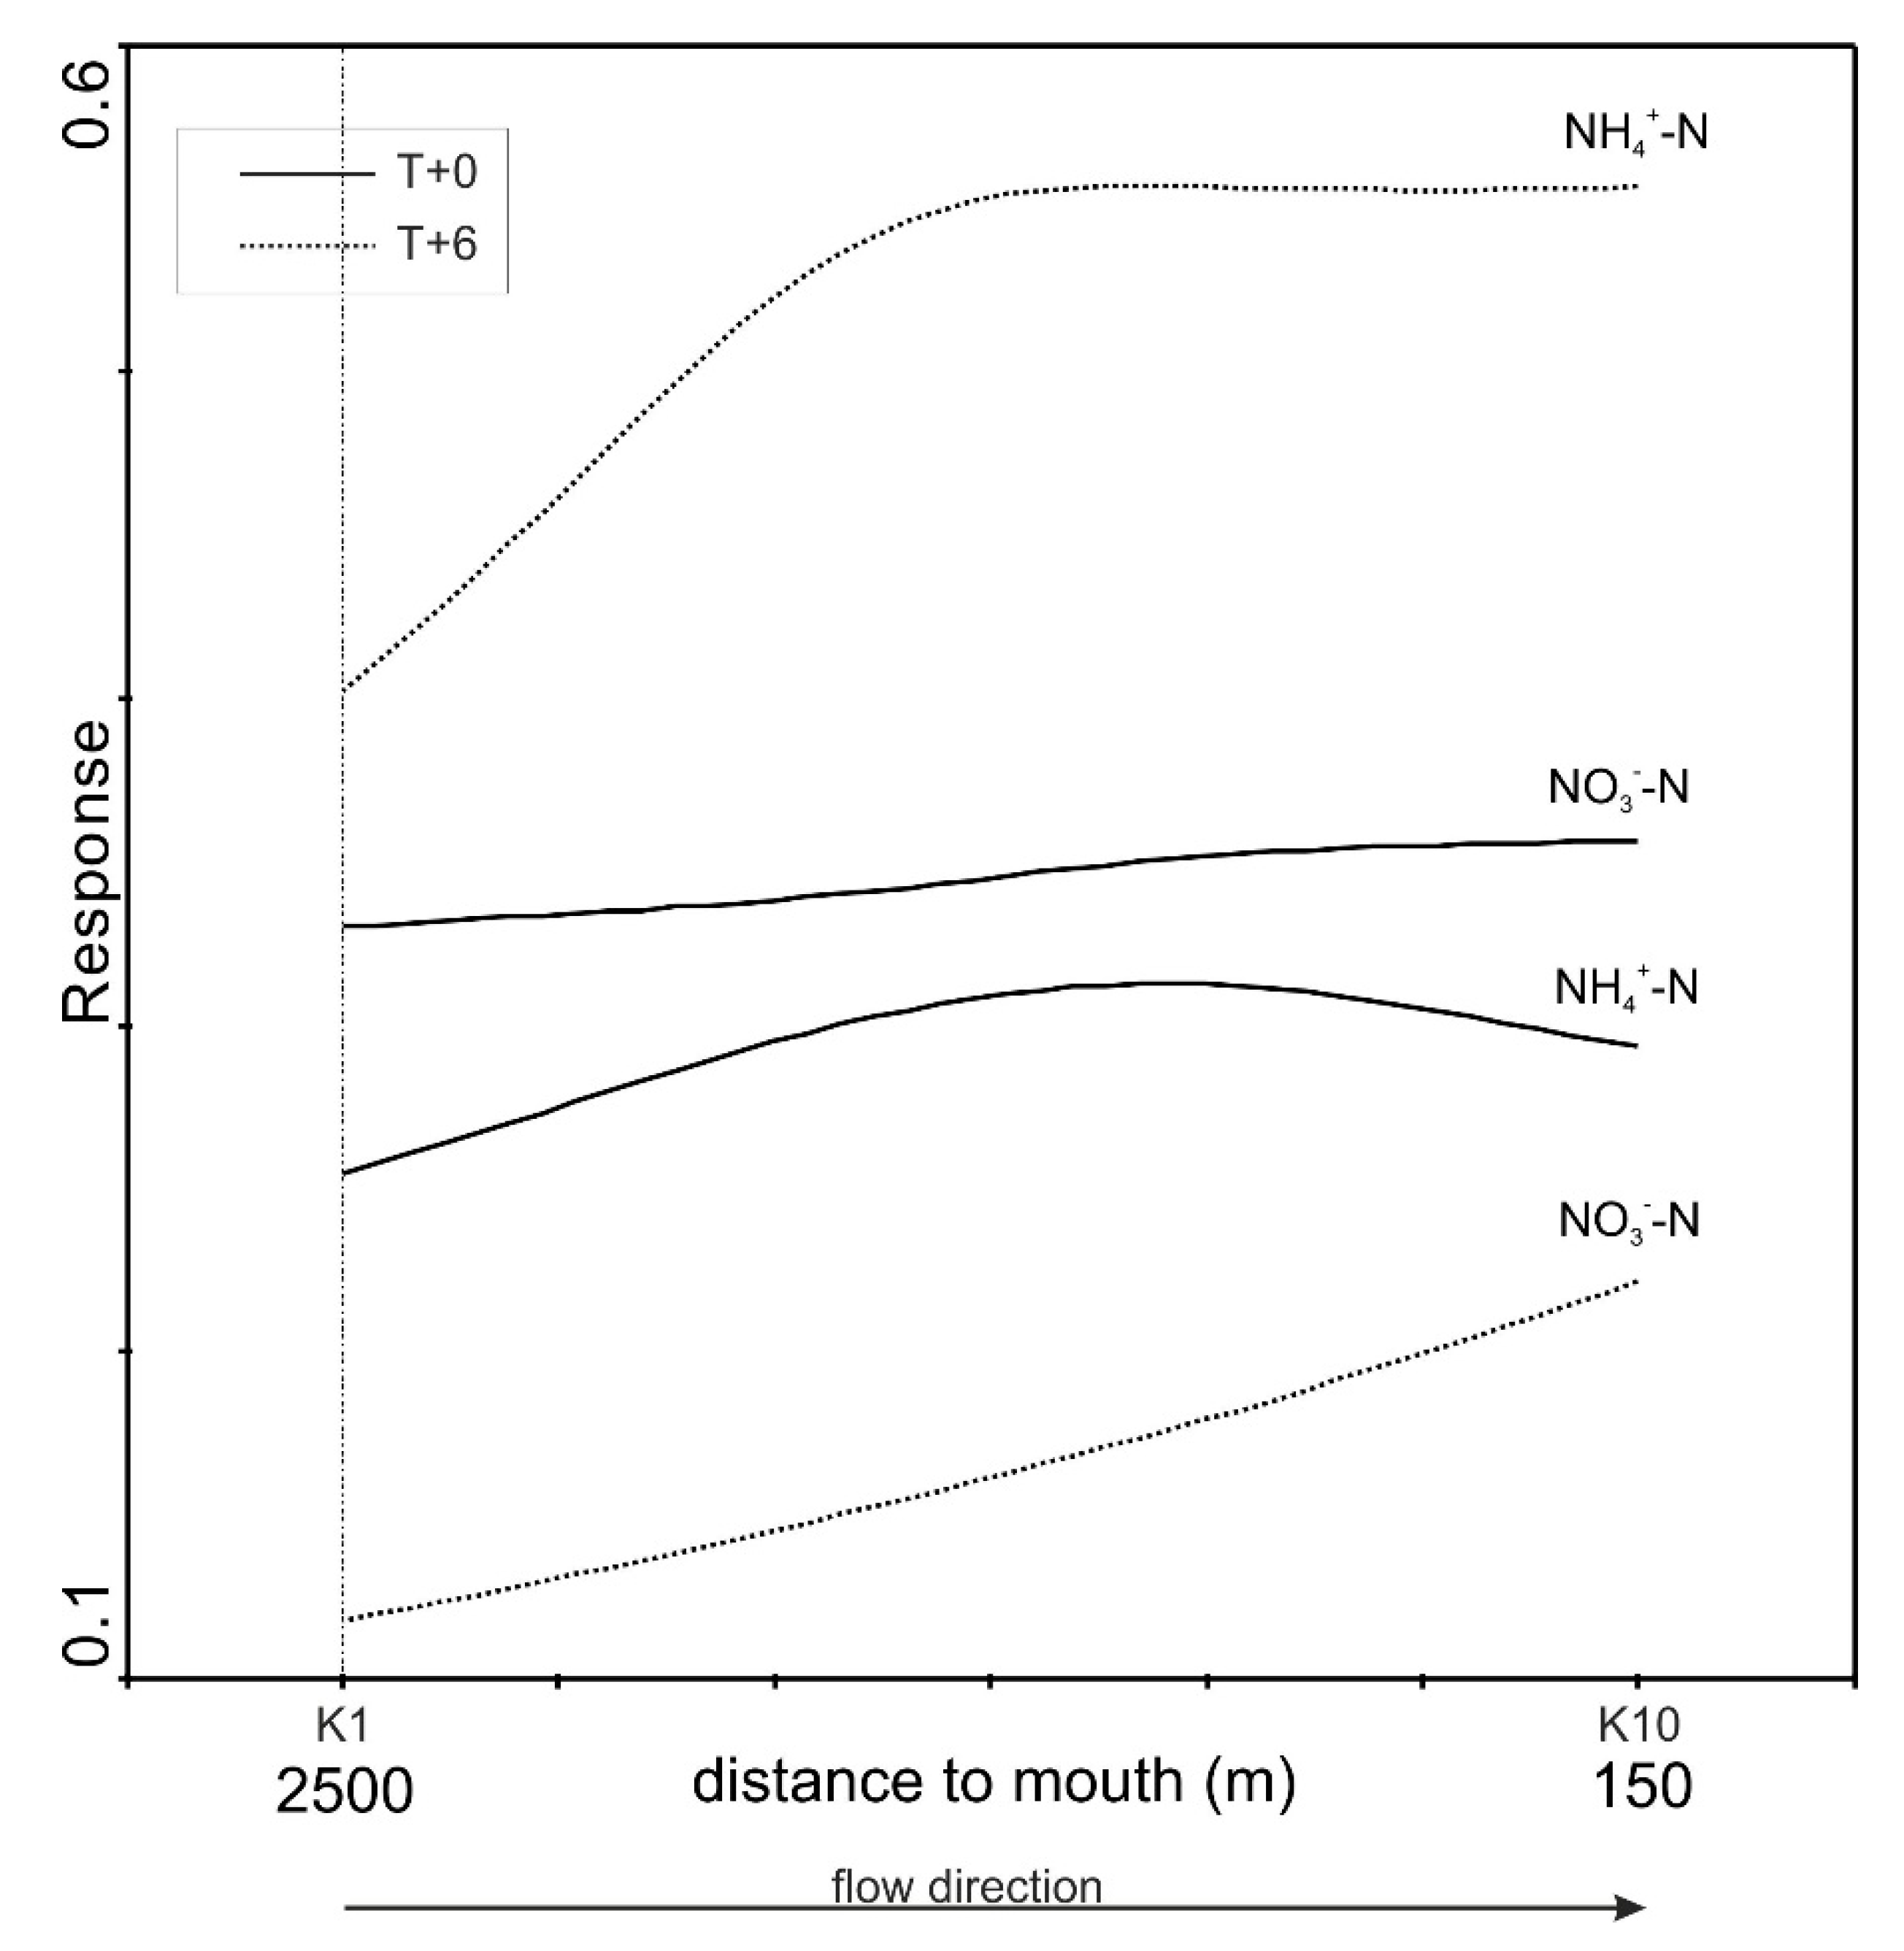
3.5. Generalized Additive Model (GAM)

Three GAMs illustrating total nitrate nitrogen and ammonia nitrogen concentrations were developed for each sampling period (T+0 and T+6). The distance to the river mouth was the only parameter in the final GAM for T+0 and T+6 sampling periods.
All variables were bound by a negative linear or a quasi-linear correlation with selected WQ parameters. A positive quasilinear relationship with nitrate nitrogen was observed in both T+0 and T+6 (Figure 5). For ammonia nitrogen, different variables from each dataset (before and after restoration) were selected in the final GAM. Interestingly, the GAM for ammonia nitrogen concentrations revealed a positive quasilinear response both in T+6 and T+0. However, some of the relationships determined in GAM analyses should be interpreted with caution because confidence intervals were wide, in particular in the upper limit of the gradient (e.g., the river mouth after restoration; Figure 5).

4. Discussion

River catchments in the temperate climate zone are characterized by high ground water levels and frequent spring floods; therefore, agricultural activities can compromise water quality in catchment areas [2,46]. In farmland situated in the vicinity of rivers, fertilization and agricultural treatments contribute to uneven distribution of mineral compounds and contamination of surface and underground waters with nutrients, mostly nitrogen and phosphorus [8,46,47,48,49,50].
Farmland is reclaimed to move excess surface water, which accelerates the runoff of chemical pollutants from fertilizers and anthropogenic substances, induces biochemical transformations in habitats, and influences water quality [51,52]. These processes pose a particular threat for river catchments with mostly light or sandy soils. This is also the case in the Kwacza River basin where excess nutrients are easily discharged with rain water [45]. River sections where riparian vegetation is lost are more exposed to pesticides and fertilizers. These factors could be chiefly responsible for the decrease in ecosystem biodiversity [8,48,53].
In the past, water quality management was rarely taken into consideration in river restoration projects [54,55]. The emphasis was placed on the restoration of habitat diversity and biotic communities in rivers and adjacent areas. The main goal of the Kwacza River restoration project was to stimulate the development of habitat heterogeneity in the riverbed along a 2.5 km-long section. During this process, mud deposits in the riverbed were replaced with sand to create favorable breeding grounds for the Atlantic salmon Salmo salar L. and sea trout Salmo trutta m. trutta L., and to create slow-moving resting areas for migratory species [54]. In the present paper, we focused on the role of the installed hydrotechnical structures in improving river water quality.
The restoration of the Kwacza River began in T+0, and the first measurable effects could be expected six years after the project’s completion (Table 3). In the pre-restoration period, the removal rates of NH4+-N, NO3-N, PO43−-P, Cl, and selected cations were low, and NO2-N and TP concentrations increased in the studied section of the river (Table 5). After restoration, hydrotechnical treatments and greater insolation enhanced river self-purification processes. The above can be attributed to greater differences in the morphological parameters of the river channel as well as the introduction of macrophytes, which substantially decrease flow velocity and contribute to self-purification processes [1,52,55,56]. The applied treatments, including groynes, semi-palisades, and stone islands, also increased DO levels and promoted the decomposition of organic matter by microorganisms.
Unlike P, N can be permanently removed by coupled nitrification–denitrification, a process that transforms inorganic compounds (NH4+, NO2, and NO3) into inert gaseous products (N2O and N2) [23]. Our results indicate a transition from locally anoxic conditions with increased NH4+-N concentrations during the pre-restoration period, and a decrease in NH4+-N levels with an increase in DO after restoration. This change seems to indicate that locally higher water velocities stimulate an increase in DO, whereby mineralization and nitrification are responsible for the conversion of NH4+-N to NO3-N. The restoration of the riverbed with river bars and groynes promoted the growth of aquatic vegetation, and effectively contributed to a decrease in NO3-N due to plant uptake, which was accompanied by an increase in Chl-a. The results of PCA clearly point to a nitrogen-limited system rather than a phosphorus-limited system.
The extent to which each of the above factors contributed to the observed improvement is difficult to assess; however, the restoration project decreased annual loads of TDS by 510 kg, Cl by 102 kg, Na+ by 25 kg, NO3-N by 18 kg, and NH4+-N by 11 kg (Table 6). No significant changes in TP or PO43−-P removal were observed. The restoration project significantly contributed to nitrate-N loss, not only between the compared years, but also along the restored river section after restoration (Figure 3 and Figure 5, Table 6). Above all, the restoration system contributed to the removal of 57% of nitrate-N, which decreased N loads by 12 kg per year.
In the group of analyzed parameters, Cl is generally considered as a conservative element, and consequently, a good indicator of geochemical changes. However, in catchments located in the vicinity of the sea, changes in Cl concentrations may result from catchment-derived factors—mainly groundwater supply. In the Kwacza River (30 km from the sea), the change in Cl in the restored segment was similar to that noted before restoration, which indicates that the catchment was a source of this element.
It is worth noting that buffer zones composed of riparian vegetation are most effective in preventing agricultural pollutants from entering the river. According to many authors, the width of the buffer zone plays the most important role in protecting water quality [57,58,59]. The pH of water is determined mainly by the presence of aquatic vegetation, which is why pH was lowest near stone islands and in insolated areas strongly overgrown by Ranunculetum aquatilis. Nutrient concentrations are highly correlated with the growth of aquatic vegetation, and the highest nutrient levels were observed in the cut-off channel by the culvert in T+6. This applied hydrotechnical solution induced the greatest changes in WQ parameters (Table 4). The construction of the by-pass promoted the emergence of a new microhabitat composed of lush Callitriche cophocarpa, Sparganium emersum, and Batrachium aquatile vegetation. These types of hydrotechnical treatments reduce channel width and promote the mixing of water and bottom sediments.
Assessments of restoration techniques should also account for the lag between stream restoration and the corresponding changes in water quality. In our approach, monitoring was continued six years after project completion, as recommended by Tuck [31], to determine whether the restored river system had been effectively stabilized and adapted to external disturbances such as floods, changes in land use, and agricultural treatments in the catchment. This study revealed changes in the physicochemical parameters of the Kwacza River already after the first stage of the restoration project when the riparian system had not yet been fully stabilized. Our results indicate that continuous and discrete monitoring of the Kwacza River supports effective prediction of the relationships between monitoring sites and habitats, and the identification of the most effective biological indicators. We are convinced that longer-term monitoring can facilitate assessments of other planned enhancements and their influence on water quality and quantity in the catchment. Our findings contribute to the discussion on the effectiveness of restoration projects in improving the quality of aquatic ecosystems in agricultural catchments.

5. Conclusions

The management of nutrient pollution from agriculture and other human activities poses a considerable challenge. Stream and river restoration projects effectively reduce nutrient loads on the local scale. In small low-gradient rivers such as the Kwacza River, hydrotechnical solutions can improve water quality and activate biogeochemical processes, which limit eutrophication, and ultimately, increase biodiversity. Evaluations of restoration projects require analyses of the river’s ecological status, water quality, and the diversity of hydromorphological conditions. To achieve the main objectives of restoration, water parameters should be monitored before restoration to assess the condition of riparian habitats and propose the most adequate restoration measures. The case study of the Kwacza River showed that water parameters should also be analyzed after the restoration. From the post-restoration perspective, long-term studies are needed to understand changes in nutrient dynamics and to evaluate the resulting progress as projects evolve over time. The described long-term monitoring study revealed that the cut-off channel (by-pass), semi-palisades, and single groynes contributed most significantly to changes in water quality. Our findings support the conclusion that these treatments could be used in the process of designing river restoration projects and managing aquatic ecosystems to monitor the effects of the implemented measures. The described hydrotechnical solutions offer a practical tool for the restoration and conservation of river valleys.

Author Contributions

K.O., K.G.-L., and S.K. conceived and designed the experiments; S.K. and P.B. performed the experiments; P.B., M.S., and M.B. analyzed the data; W.G. contributed materials and analysis tools; N.M., K.O., and K.G.-L. wrote the paper.

Funding

This study was supported financially by the Polish Ministry of Education and Science under grant No. NN305324733.

Conflicts of Interest

The authors declare no conflict of interest.

References

  1. Palmer, M.A.; Bernhardt, E.S.; Allan, J.D.; Lake, P.S.; Alexander, G.; Brooks, S.; Carr, J.; Clayton, S.; Dahm, C.; Follstad Shah, J.; et al. Standards for ecologically successful river restoration. J. Appl. Ecol. 2005, 42, 208–217. [Google Scholar] [CrossRef] [Green Version]
  2. Cavaillé, P.; Dumont, B.; Van Looy, K.; Floury, M.; Tabacchi, E.; Evette, A. Influence of riverbank stabilization techniques on taxonomic and functional macrobenthic communities. Hydrobiologia 2018, 807, 19–35. [Google Scholar] [CrossRef]
  3. Brown, L.E.; Dickson, N.E.; Carrivick, J.L.; Füreder, L. Alpine river ecosystem response to glacial and anthropogenic flow pulses. Freshw. Sci. 2015, 34, 1201–1215. [Google Scholar] [CrossRef] [Green Version]
  4. Jacobsen, D.; Milner, A.M.; Brown, L.E.; Dangles, O. Biodiversity under threat in glacier-fed river systems. Nat. Clim. Chang. 2012, 2, 361–364. [Google Scholar] [CrossRef] [Green Version]
  5. Carrea, C.; Anderson, L.V.; Craw, D.; Waters, J.; Burridge, C.P. The significance of past inters drainage connectivity for studies of diversity, distribution and movement of freshwater-limited taxa within a catchment. J. Biogeogr. 2014, 41, 536–547. [Google Scholar] [CrossRef]
  6. Mulholland, P.J. Regulation of nutrient concentrations in a temperate forest stream: Roles of upland, riparian, and instream processes. Limnol. Oceanogr. 1992, 37, 1512–1526. [Google Scholar] [CrossRef] [Green Version]
  7. Jolly, I.D.; McEwan, K.L.; Holland, K.L. A review of groundwater-surface water interactions in arid/semi-arid wetlands and the consequences of salinity for wetland ecology. Ecohydrology 2008, 1, 43–58. [Google Scholar] [CrossRef]
  8. Capderrey, C.; Datry, T.; Foulquier, A.; Claretand, C.; Malard, F. Invertebrate distribution across nested geomorphic features in braided-river landscapes. Freshw. Sci. 2013, 32, 1188–1204. [Google Scholar] [CrossRef]
  9. Hille, S.; Kristensen, E.A.; Graeber, D.; Riis, T.; Jørgensen, N.K.; Baattrup-Pedersen, A. Fast reaction of macroinvertebrate communities to stagnation and drought in streams with contrasting nutrient availability. Freshw. Sci. 2014, 33, 847–859. [Google Scholar] [CrossRef]
  10. Cha, S.M.; Ham, Y.S.; Ki, S.J.; Lee, S.W.; Cho, K.H.; Park, Y.; Kim, J.H. Evaluation of pollutants removal efficiency to achieve successful urban river restoration. Water Sci. Technol. 2009, 59, 2101–2109. [Google Scholar] [CrossRef] [PubMed]
  11. Glińska-Lewczuk, K.; Burandt, P.; Kujawa, R.; Kobus, S.; Obolewski, K.; Dunalska, J.; Grabowska, M.; Lew, S.; Chormański, J. Environmental factors structuring fish communities in floodplain lakes of the undisturbed system of the Biebrza River. Water 2016, 8, 146. [Google Scholar] [CrossRef]
  12. Bradford, T.M.; Morgan, M.J.; Lorenz, Z.; Hartley, D.M.; Hardy, C.M.; Oliver, R.L. Microeukaryote community composition assessed by pyrosequencing is associated with light availability and phytoplankton primary production along a lowland river. Freshw. Biol. 2013, 58, 2401–2413. [Google Scholar] [CrossRef]
  13. Ormerod, S.J. Restoration in applied ecology: Editor’s introduction. J. Appl. Ecol. 2003, 40, 44–50. [Google Scholar] [CrossRef]
  14. Law, A.; McLean, F.; Willby, N.J. Habitat engineering by beaver benefits aquatic biodiversity. Freshw. Biol. 2016, 61, 486–499. [Google Scholar] [CrossRef]
  15. Kiffney, P.M.; Buhle, E.R.; Naman, S.M.; Pess, G.R.; Klett, R.S. Linking resource availability and habitat structure to stream organisms: An experimental and observational assessment. Ecosphere 2014, 5, 39. [Google Scholar] [CrossRef]
  16. Filoso, S.; Palmer, M. Assessing stream restoration effectiveness at reducing nitrogen export to downstream waters. Ecol. Appl. 2011, 21, 1989–2006. [Google Scholar] [CrossRef] [PubMed]
  17. Glińska-Lewczuk, K.; Bieniek, A.; Sowiński, P.; Obolewski, K.; Burandt, P.; Timofte, C.M. Variability of zinc content in soils in a postglacial river valley—A geochemical landscape approach. J. Elementol. 2014, 19, 361–376. [Google Scholar] [CrossRef]
  18. Obolewski, K.; Glińska-Lewczuk, K.; Bąkowska, M. From isolation to connectivity: The effect of floodplain lake restoration on sediments as habitats for macroinvertebrate communities. Aquat. Sci. 2018, 80, 4. [Google Scholar] [CrossRef]
  19. Paillex, A.; Castella, E.; zu Ermgassen, P.S.E.; Aldridge, D.C. Testing predictions of changes in alien and native macroinvertebrate communities and their interaction after the restoration of a large river floodplain (French Rhone). Fresw. Biol. 2015, 60, 1162–1175. [Google Scholar] [CrossRef]
  20. Bellos, D.; Sawidis, T. Chemical pollution monitoring of the River Pinios (Thessalia-Greece). J. Environ. Manag. 2005, 76, 282–292. [Google Scholar] [CrossRef] [PubMed]
  21. Kersebaum, K.C.; Steidl, J.; Bauer, O.; Piorr, H.P. Modelling scenarios to assess the effects of different agricultural management and land use options to reduce diffuse nitrogen pollution into the river Elbe. Phys. Chem. Earth 2003, 28, 537–545. [Google Scholar]
  22. Kaushal, S.S.; Groffman, P.M.; Band, L.E.; Elliott, E.M.; Shields, C.A.; Kendall, C. Tracking nonpoint source nitrogen pollution in human-impacted watersheds. Environ. Sci. Technol. 2011, 45, 8225–8232. [Google Scholar] [CrossRef] [PubMed]
  23. Newcomer Johnson, T.A.; Kaushal, S.S.; Mayer, P.M.; Smith, R.M.; Sivirichi, G.M. Nutrient Retention in Restored Streams and Rivers: A Global Review and Synthesis. Water 2016, 8, 116. [Google Scholar] [CrossRef]
  24. Hein, T.; Baranyi, C.; Reckendorfer, W.; Schiemer, F. The impact of surface water exchange on the nutrient and particle dynamics in side-arms along the River Danube, Austria. Sci. Total Environ. 2004, 328, 207–218. [Google Scholar] [PubMed]
  25. Glińska-Lewczuk, K. Oxbow lakes as biogeochemical barriers for nutrient outflow from agricultural areas. In Dynamics and Biogeochemistry of River Corridors and Wetlands; Heathwaite, L., Webb, B., Rosenberry, D., Weaver, D., Hayashi, M., Eds.; IAHS: London, UK, 2005; Volume 294, pp. 55–68. [Google Scholar]
  26. Ward, J.V.; Stanford, J.A. Ecological connectivity in alluvial river ecosystems and its disruption by flow regulation. Regul. River Res. Manag. 2009, 11, 105–119. [Google Scholar] [CrossRef]
  27. Schönbrunner, I.M.; Preiner, S.; Hein, T. Impact of drying and re-flooding of sediment on phosphorus dynamics of river-floodplain systems. Sci. Total Environ. 2012, 432, 329–337. [Google Scholar] [PubMed]
  28. Prus, P.; Popek, Z.; Pawlaczyk, P. Good practices for maintaining rivers. WWF Polska 2017. Available online: http://www.kp.org.pl/pdf/2017-08-01_dobre_praktyki_utrzymania_rzek.pdf (accessed on 21 August 2018).
  29. Manual of River Restoration Techniques, 1st ed.; The River Restoration Centre: Silsoe, UK, 1999; Available online: http://www.therrc.co.uk/MOT/Low-res/1999_Edition_1.pdf (accessed on 17 August 2018).
  30. Manual of River Restoration Techniques, Update 1; The River Restoration Centre: Silsoe, UK, 2002; Available online: http://www.therrc.co.uk/MOT/Low-res/2002_Update_1.pdf (accessed on 17 August 2018).
  31. Tuck, J. Environmentally Sustainable River Restoration Techniques. 2008. Available online: https://www.wcmt.org.uk/sites/default/files/migrated-reports/441_1.pdf (accessed on 17 August 2018).
  32. Roni, P.; Hanson, K.; Beechie, A. Global review of the physical and biological effectiveness of stream habitat rehabilitation techniques. N. Am. J. Fish Manag. 2008, 28, 856–890. [Google Scholar] [CrossRef]
  33. Pana, B.; Yuan, J.; Zhang, X.; Wang, Z.; Lu, J.; Yang, W.; Chen, J.; Li, Z.; Zhao, N.; Xu, M. A review of ecological restoration techniques influvial rivers. Int. J. Sediment Res. 2016, 31, 110–119. [Google Scholar] [CrossRef]
  34. Bukaveckas, P.A. Effects of channel restoration on water velocity, transient storage, and nutrient uptake in a channelized stream. Environ. Sci. Technol. 2007, 41, 1570–1576. [Google Scholar] [CrossRef] [PubMed]
  35. Viswanathana, V.C.; Molson, J.; Schirmer, M. Does river restoration affect diurnal and seasonal changes to surface water quality? A study along the Thur River, Switzerland. Sci. Total Environ. 2015, 532, 91–102. [Google Scholar] [CrossRef] [PubMed]
  36. Davis, N.M.; Weaver, V.; Parks, K.; Lydy, M.J. An assessment of water quality, physical habitat, and biological integrity of an urban stream in Wichita, Kansas, prior to restoration improvements (phase I). Arch. Environ. Contam. Toxicol. 2003, 44, 351–359. [Google Scholar] [CrossRef] [PubMed]
  37. Walsh, C.J.; Fletcher, T.D.; Ladson, A.R. Stream restoration in urban catchments through redesigning stormwater systems: Looking to the catchment to save the stream. J. N. Am. Benthol. Soc. 2005, 24, 690–705. [Google Scholar] [CrossRef]
  38. Zuraini, Z.; Sanjay, G.; Shariff, N.M. Effective microorganisms (EM) technology for water quality restoration and potential for sustainable water resources and management. In Proceedings of the International Congress on Environmental Modelling and Software, Ottawa, ON, Canada, 5–8 July 2010; Available online: https://scholarsarchive.byu.edu/iemssconference/2010/all/142 (accessed on 24 August 2018).
  39. Purcell, A.H. A Long-Term Post Project Evaluation of an Urban Stream Restoration Project (Baxter Creek, El Cerrito, California); Water Resources Center Archives; University of California: Berkeley, CA, USA, 2004; Available online: http://repositories.edlib.org/wrca/restoration/purcell (accessed on 24 August 2018).
  40. Kaushal, S.S.; Groffman, P.M.; Mayer, P.M.; Striz, E.; Gold, A.J. Effects of stream restoration on denitrification in an urbanizing watershed. Ecol. Appl. 2008, 18, 789–804. [Google Scholar] [CrossRef] [PubMed]
  41. Lorenz, A.W.; Korte, T.; Sundermann, A.; Januschke, K.; Haase, P. Macrophytes respond to reach-scale river restorations. J. Appl. Ecol. 2012, 49, 202–212. [Google Scholar] [CrossRef]
  42. Ebina, J.; Tsutsui, T.; Shisai, T. Simultaneous determination of total nitrogen and total phosphorous in water using peroxodisulfate oxidation. Water Res. 1983, 17, 1721–1726. [Google Scholar] [CrossRef]
  43. American Public Health Association (APHA). Standard Methods for the Examination of Water and Wastewater, 17th ed.; American Public Health Association (APHA): Washington, DC, USA, 1989. [Google Scholar]
  44. Ter Braak, C.J.F. Canonical correspondence analysis: A new eigenvector technique for multivariate direct gradient analysis. Ecology 1986, 67, 1167–1179. [Google Scholar] [CrossRef]
  45. Ter Braak, C.J.F.; Śmilauer, P. CANOCO Reference Manual and CanoDraw for Windows User’s Guide: Software for Canonical Community Ordination, version 4.5; Microcomputer Power: Ithaca, NY, USA, 2002. [Google Scholar]
  46. Roberts, B.J.; Mulholland, P.J.; Houser, J.N. Effects of upland disturbance and instream restoration on hydrodynamics and ammonium uptake in headwater streams. J. N. Am. Benthol. Soc. 2007, 26, 38–53. [Google Scholar] [Green Version]
  47. Weigelhofer, G.; Fuchsberger, J.; Teufl, B.; Welti, N.; Hein, T. Effects of Riparian Forest Buffers on In-Stream Nutrient Retention in Agricultural Catchments. J. Environ. Qual. 2012, 41, 373–379. [Google Scholar] [CrossRef] [PubMed]
  48. Palmer, M.A.; Menninger, H.L.; Bernhardt, E. River restoration, habitat heterogeneity and biodiversity: A failure of theory or practice? Freshw. Biol. 2010, 55, 205–222. [Google Scholar] [CrossRef]
  49. Beechie, T.J.; Sear, D.A.; Olden, J.D.; Pess, G.R.; Buffington, J.M.; Moir, H.; Roni, P.; Pollock, M.M. Process-based principles for restoring river ecosystems. BioScience 2010, 60, 209–222. [Google Scholar] [CrossRef]
  50. Mainstone, C.P.; Parr, W. Phosphorus in rivers—Ecology and management. Sci. Total. Environ. 2002, 282–283, 25–47. [Google Scholar] [CrossRef]
  51. Evans, D.J.; Johnes, P.J. Physico-chemical controls on phosphorus cycling in two lowland streams. Part 1—The water column. Sci. Total Environ. 2004, 329, 145–163. [Google Scholar] [CrossRef] [PubMed]
  52. Haggard, B.E.; Soerens, T.S. Sediment phosphorus release at a small impoundment on the Illinois River, Arkansas and Oklahoma, USA. Ecol. Eng. 2006, 28, 280–287. [Google Scholar] [CrossRef]
  53. Obolewski, K.; Glińska-Lewczuk, K.; Ożgo, M.; Astel, A. Connectivity restoration of floodplain lakes: An assessment based on macroinvertebrate communities. Hydrobiologia 2016, 774, 23–27. [Google Scholar] [CrossRef]
  54. Fernandes, J.D.F.; de Souza, A.L.; Tanaka, M.O. Can the structure of a riparian forest remnant influence stream water quality? A tropical case study. Hydrobiologia 2014, 724, 175–185. [Google Scholar] [CrossRef]
  55. Feld, C.K.; Birk, S.; Bradley, D.C.; Hering, D.; Kail, J.; Marzin, A.; Melcher, A.; Nemitz, D.; Pedersen, M.L.; Pletterbauer, F.; et al. From natural to degraded rivers and back again: A test of restoration ecology theory and practice. Adv. Ecol. Res. 2011, 44, 199–209. [Google Scholar]
  56. Uowolo, A.L.; Binkley, D.; Carol, A.E. Plant diversity in riparian forests in northwest Colorado: Effects of time and river regulation. For. Ecol. Manag. 2005, 218, 107–114. [Google Scholar] [CrossRef]
  57. Johnson, E.S.; Bell, K.P.; Leahy, J.E. Disamenity to amenity: Spatial and temporal patterns of social response to river restoration progress. Landsc. Urban Plan. 2018, 169, 208–219. [Google Scholar] [CrossRef]
  58. Milano, M.; Chèvre, N.; Reynard, E. Assessing watercourse quality: Challenges in implementing European and Swiss legal frameworks. Environ. Sci. Pollut. Res. 2018, 25, 805–823. [Google Scholar] [CrossRef] [PubMed]
  59. Smith, D.J.; Crymble, S. Water quality considerations in developing a new resource for water supply within the midlands of England. Water Sci. Technol. 1998, 38, 201–208. [Google Scholar] [CrossRef]
Figure 1. The location of hydrotechnical structures and sampling sites along the restored section of the Kwacza River (K1–K10) and the Słupia River (S).
Water 10 01249 g001
Figure 2. Changes in mean flow velocity (m·s−1) in the monitored cross-sections along the Kwacza River before (T+0, white boxes) and after (T+6, grey boxes) restoration periods. Whiskers denote minimum and maximum velocities in a given cross-section, bars—confidence interval (±90%), horizontal line—mean velocity.
Water 10 01249 g002
Figure 3. Changes in selected physical and chemical parameters of the restored section of the Kwacza River during two monitoring events in T+0 and T+6 (significant differences in the U test), and in the reference site on the Słupia River. The numbers below the x-axis denote the studied sites (Kwacza River: 1—site K1, 10—site K10; Słupia River: S).
Water 10 01249 g003aWater 10 01249 g003b
Figure 4. Results of ordination analyses. (A) Principal component analysis (PCA) biplot for environmental variables, sampling sites, and the analyzed periods. (B) PCA biplot for the relationships between environmental parameters and the analyzed periods.
Water 10 01249 g004
Figure 5. Different variables were selected for the final GAM from the dataset, before (T+0) and after restoration (T+6).
Water 10 01249 g005
Table 1. List of stressors and solutions for successful stream restoration.
StressorEnhancement OperationDesign RationaleApplicationReferences
Shadowing of the water table in the river, poor light conditionsPartial removal of trees along river banks
Local widening of the riverbed
Improvement of light conditions (up to 50%)Skerne River (UK)[28,29,30]
Shallowing of the river channelWooden bars
Double groynes
Dredging with the use of wooden bars, and single and double groynesAvon River (UK)
Lewis and Clark River (USA)
[29,30,31]
Straight and channelized river channel with low heterogeneity of habitatsWooden bars
Single and double groynes
Diversification of the midstreamSkerne and Cole Rivers (UK)
Mokelumne River, American
River, Yuba River (USA)
Lawrence River
[29,30,31]
Mid-riverbed stone islandsDiversification of the shoreline (alternate concave and convex shores)Skerne River[29,30,31,32]
Water pollutionBy-pass creation, reconnection of former meandersForming riverbed sections parallel to the “old” riverbed, restoring connections with an oxbow lakeCole River (UK)[29,30]
Bioengineering structures, introducing macrophyte speciesIntroduction of native plants along the stream and bioengineering structures to stabilize the stream channel and reduce stream bank erosion and sediment loads in the stream.
Introduction of macrophytes which are capable of assimilating chemical elements
Avone, Marden, and Kennet Rivers (UK)[28,33]
Table 2. Land-use types in the Kwacza and Słupia River catchments.
RiverUnitTotal AreaArable LandGrasslandForestsWater
Kwaczakm285.0029.0827.8126.821.30
%10034.2132.7131.551.53
Słupiakm21623.00775.73107.82703.8535.60
%10047.796.6443.372.20
Table 3. Hydrological changes in the Kwacza River before (T+0) and after (T+6) restoration at cross-section sites K1 and K10; A—catchment area. Data given in the table represent mean annual values.
ParametersCross-Sections
K1 (A = 63 km2)K10 (A = 85 km2)
T+0T+6T+0T+6
Streamflow Qmean (m3·s−1)0.410.380.550.48
low flow Ql (m3·s−1)0.070.090.090.12
high flow Qh (m3·s−1)1.531.401.391.45
Volume V (106·m3·year−1)12.9311.9817.3415.14
Overland flow q (L·s−1·km−2)6.556.106.515.68
Table 4. Physical and chemical properties (mean ± SD, range) of water in the Kwacza and Słupia Rivers before and after restoration. Abbreviations: ±SD—standard deviation, cv—coefficient of variation (%), Tw—water temperature, EC—electrolytic conductivity, DO—dissolved oxygen, COD—chemical oxygen demand, TDS—total dissolved solids.
ParametersSłupia RiverKwacza River
T+0
N = 6
T+6
N = 6
Before Restoration
T+0
N = 60
After Restoration
T+6
N = 60
Mean ± SDRangecvMean ± SDRangecvMean ± SDRangecvMean ± SDRangecv
Tw, °C9.5 ± 5.54.5–16.9599.5 ± 5.34.6–17.1559.8 ± 4.55.5–16.2469.9 ± 4.65.6–16.446
EC, µS·cm−1326 ± 10312–3365295 ± 0.049288–3012363 ± 10360–3642369 ± 14368–3721
pH7.17 ± 0.316.80–7.7047.24 ± 0.177.05–7.5427.73 ± 0.087. 51–7.9027.52 ± 0.187.43–7.681
Chl-a, µg·L−116.2 ± 10.91.9–24.76816.6 ± 11.41.9–24.7699.7 ± 4.01.9–23.62812.6 ± 2.710.1–41.762
DO, mg·L−18.2 ± 126.7–9.7148.1 ± 0.87.1–9.0104.4 ± 1.84.0–5.7587.2 ± 3.23.6–13.763
DO, %82.5 ± 11.967.8–98.21476.7 ± 7.567.0–84.71055.0 ± 40.728.0–114.06969.8 ± 34.626.0–99.374
COD, mg·L−115.4 ± 2.6213.6–17.21714.5 ± 2.712.4–15.91926.8 ± 15.612.8–43.66824.9 ± 17.014.0–44.458
TDS, g·L−10.23 ± 0.010.22–0.2340.20 ± 0.000.18–0.2140.24 ± 0.000.24–0.2420.24 ± 0.010.24–0.251
NO2-N, mg·L−10.01 ± 0.010.00–0.0170.01 ± 0.010.00–0.0150.04 ± 0.030.01–0.06110.05 ± 0.050.01–0.097
NO3-N, mg·L−10.14 ± 0.010.12–0.16100.14 ± 0.010.12–0.1590.93 ± 0.350.81–1.00110.35 ± 0.310.32–0.5113
NH4+-N, mg·L−10.22 ± 0.180.04–0.52820.24 ± 0.140.11–0.49590.72 ± 0.100.68–0.83810.38 ± 0.090.25–0.5281
PO43−-P, mg·L−10.14 ± 0.040.09–0.18300.14 ± 0.030.10–0.18220.30 ± 0.070.24–0.61230.29 ± 0.070.25–0.3722
TP, mg·L−10.39 ± 0.160.13–0.52400.41 ± 0.060.31–0.49151.12 ± 0.370.83–1.54291.17 ± 0.340.95–1.5633
Ca2+, mg·L−148.7 ± 2.447.0–50.4550.7 ± 2.4048.3–51.2455.0 ± 3.453.0–59.0261.0 ± 1.360.2–62.56
Na+, mg·L−19.6 ± 0.09.6–9.609.5 ± 0.19.8–9.718.9 ± 0.38.7–9.248.7 ± 0.38.3–8.93
K+, mg·L−12.4 ± 0.42.1–2.7182.5 ± 0.52.0–2.9192.6 ± 0.22.4–2.742.5 ± 0.12.4–2.66
Mg2+, mg·L−15.7 ± 1.15.1–6.6186.3 ± 1.15.6–6.9176.3 ± 1.25.3–7.676.7 ± 0.56.3–7.219
Cl, mg·L−121.2 ± 9.518.0–29.94524.4 ± 10.014.1–33.64124.2 ± 14.913.7–34.83534.9 ± 9.821.0–41.862
Table 5. The effects of the applied hydrotechnical structures on the monitored parameters (Mann–Whitney U test). The calculations are based on a comparison of pre-restoration (T+0) and post-restoration (T+6) periods.
StructureParametersUZP
Single semi-palisadeEC1489.5−5.330.0001
pH401.011.550.0001
NO3-N987.46.470.001
Bank protection with trunkspH307.68.040.001
EC298.2−7.240.05
River barNH4+-N941.5−2.740.01
pH321.09.550.001
DO1362.0−5.790.0001
Single groynesCl1644.5−4.770.0001
pH334.69.870.001
EC254.4−6.870.0001
PO43−-P372.03.370.05
Double groynespH355.09.990.001
NO3-N1616.54.870.0001
NH4+-N957.2−2.990.01
Stone islandsDO1324.0−5.110.0001
EC888.7−4.440.001
Double semi-palisadeNO3-N1616.54.870.00
NH4+-N1018.4−3.990.0001
EC844.4−4.140.001
Chl-a944.5−2.320.01
By-passpH387.110.210.0001
EC688.7−1.440.05
DO1205.8−5.090.001
NO3-N1316.52.870.0001
NH4+-N1106.03.790.0001
PO43−-P387.53.550.05
InsolationDO1302.6−5.910.0001
Chl-a1105.5−3.870.01
No treatment-
Table 6. Chemical loads carried by the Kwacza River in cross-section terminal sites K1 and K10 before (T+0) and after restoration (T+6).
LoadLoss of Chemical Elements from the Catchment Per Unit Area (kg·year−1·km−2)Loss of Chemical Elements from the Kwacza River Catchment (tonnes·year−1)Difference in %
Kwacza K1 (A = 63 km2)Kwacza K10 (A = 85 km2)Kwacza K1Kwacza K10K1–K10K1–K10
T+0T+6T+0T+6T+0T+6T+0T+6T+0T+6
TDS11610886807.3086.8047.3106.800100100
NO2-N0.020.030.010.020.0010.0020.0010.002100100
NO3-N0.450.360.330.120.0280.0230.0280.01010043
NH4-N0.150.170.260.130.0090.0110.0220.011244100
PO4-P0.150.130.110.100.0090.0080.0090.009100105
TP0.540.530.400.390.0340.0330.0340.033100100
Cl11.715.812.911.70.7370.9951.0970.995149100
Ca2+26.627.518.420.41.6761.7331.5641.73493100
Na+4.33.93.22.90.2710.2460.2720.247100100
K+1.21.10.90.80.0760.0690.0770.06810199
Mg2+3.03.02.32.20.1890.1890.1960.18710499

