Simulation of Runoff and Glacier Mass Balance and Sensitivity Analysis in a Glacierized Basin, North-Eastern Qinhai-Tibetan Plateau, China

1
Qilian Shan Station of Glaciology and Ecological Environment, State Key Laboratory of Cryospheric Sciences, Northwest Institute of Eco-Environment and Resources, Chinese Academy of Sciences, Lanzhou 730000, China
2
College of Resources and Environment, University of Chinese Academy of Sciences, Beijing 100049, China
*
Author to whom correspondence should be addressed.
Water 2018, 10(9), 1259; https://doi.org/10.3390/w10091259
Submission received: 2 July 2018
/
Revised: 27 August 2018
/
Accepted: 12 September 2018
/
Published: 15 September 2018
(This article belongs to the Section Hydrology)
Abstract
:Glaciers have been recognized as the most sensitive indicators of climate change. Mountainous areas, with their characteristic snow and glacier cover, have long been recognized as special hydrological environments, receiving above-average amounts of precipitation. The streams originating in the mountains, nourished with distinct seasonal variations, provide water for the populations of the adjacent lowland. Little is known about the effect of climate change on snow and glacier hydrology and glacier mass balance in the Laohugou Glacier Basin (LHGB) over the past 50 years. A study of the glacier basin was performed to quantify the expected impact of climate change on the hydrology in the north-eastern Qinghai-Tibet Plateau. The DEM (Digital Elevation Model) data, daily temperature, daily precipitation, and evaporation data were applied to force the HBV (Hydrologiska Byrans Vattenbalansavdelning)-light conceptual model to simulate runoff depth and glacier mass balance in the historical period (1959–2015). A genetic calibration algorithm approach (GAP method) was used to obtain parameter sets that reproduced observed runoff depth well. The results suggested a drastic increase of the runoff depth from 1995 to 2015 in the Laohugou glacier basin driven by increased temperature. Temperature and precipitation increased by 0.40 °C (10a)−1 and 1.6 mm·a−1 (p < 0.01), respectively, at AWS1 (the automatic weather station at 4192 m a.s.l. near the hydrological station) in the LHGB from 1959 to 2015. The simulated runoff depth increased at 5.7 mm·a−1 (p < 0.01), the glacier mass balance (GMB) of the LHGB was −280.5 mm·a−1, and the overall glacier mass balance was −17.55 m w.e. from 1959 to 2015. The runoff is found to be more sensitive to the variation of temperature than the variation of precipitation. When the glacier area is decreased by 10%, 53%, and 100%, the peak runoff (July) decreased by 20.4%, 54.2%, and 72.3% relative to the baseline, respectively. In the future climate, the function of glaciers in compensating a potential low flow and regulating peak flow will be weakened in the critical months.
1. Introduction
The period 1983–2012 might be the warmest 30 years in the Northern Hemisphere in nearly 1400 years. The global average of terrestrial and oceanic surface temperature data calculated by the linear trend shows that from 1880 to 2012, the warming amplitude from multiple independent datasets was 0.85 (0.65 to 1.06) °C [1]. Warming of the climate system is unequivocal, and since the 1950s, many of the observed changes are unprecedented over decades to millennia [2]. But, climate change has spatial heterogeneity. The air temperature of the Tibetan Plateau (TP) has increased dramatically in recent decades, especially after the 1980s, with the annual rates of 0.27 °C per decade during 1961–2005 [3]. Three automatic weather station (AWS) in Laohugou glacier river basin (LHGB) that is located in the northeastern TP experienced a warming trend during 1957–2013, and annual mean temperature has increased by 0.31 °C, 0.35 °C and 0.37 °C per decade at 4180 m a.s.l., 4550 m a.s.l., and 5040 m a.s.l. (p < 0.01), respectively [4].
There are many glaciers on the TP that can be very important water sources, especially in arid and semi-arid regions [5]. In addition, temperature changes have an immense impact on glaciers and thus impact water resources on the TP, which is of great concern [6]. As part of the Shule river basin, glaciers in Laohugou river basin have substantial effects on river runoff in the Shule River basin [7,8]. In the summer, meltwater might provide water for alpine valleys and arid lowlands [9]. Glaciers store water as ice and snow in cold and wet years and provide additional runoff during warm and dry years [10]. The release of water as snowmelt and ice melt in high-elevation basins has considerable social and economic impacts for the population living in Shule River areas with more than 500,000 people. Reduced meltwater may cause the groundwater levels to drop, agricultural irrigation may lack water, and may have significant ecological impact on the habitat of rivers [11]. The reduction of meltwater from glaciers may lead to water shortages and may have serious social and economic consequences because meltwater is a resource on which a large numbers of people depend. These effects are critical under the current conditions of glacier retreat [12] as a consequence of global warming [13]. The change in the quantity and distribution of runoff in mountainous basins will bring new challenges to the management of water resources in the affected areas of the cryosphere. Therefore, it is important to understand the role of ice and snow meltwater on runoff and glacier mass balance changes in glacial environments. However, there is still lack of research on how the runoff and glacier mass balance response to climate change in LHGB. Therefore, the research about long-term variation of the discharge and glacier mass balances is meaningful for the LHGB.
The aim of our study is to simulate and reconstruct glacier runoff and mass balance over the past 50 years in order to understand the response of the glaciers to climate change in the region and examine the impact of climate change on the runoff depth and glacier mass balance of Laohugou river basins in the North-eastern Tibetan Plateau (TP) region under different temperature, precipitation and glacier coverage scenarios. To achieve this we make use of the observed automatic weather station (AWS) data and reconstructed temperature and precipitation data as input into the HBV (Hydrologiska Byrans Vattenbalansavdelning) hydrological model to estimate the discharge and glacier mass balance of Laohugou river basin. Additionally, a sensitivity analysis was performed under different temperature, precipitation, and glacier coverage scenarios.
2. Study Area
The Laohugou Glacier Basin is a heavily glacier coverd subbasin of the Shule river basin in the north-eastern Tibetan Plateau. The study area is undisturbed by human activities and belongs to the continental arid climate zone, mainly controlled by the East Asian monsoon and westerlies. According to the data from a weather station (AWS1) that is installed at an altitude of 4200 m, The multi annual mean air temperature and precipitation are −6.5 °C and 268 mm/year, respectively. The study area’s altitude ranges from 4192 to 5463 m a.s.l., with a total area of 36.5 km2. Based on the First and Second Chinese Glacier Inventory, the areas of the glacier in 1957 and 2009 were 24.49 km2 and 22.3 km2, accounting for 67.65% and 61.60% of the basin area, respectively [14]. The monthly temperature and precipitation show strong seasonal changes, and the precipitation from May to September sums more than 70% of the total annual precipitation. An automatic weather station (AWS1) and a hydrological station are located close to the terminus of the glacier (AWS1) (4192 m a.s.l.) (Figure 1), two other AWSs being located at elevations of 4550 m a.s.l., 5040 m a.s.l. on the glacier, respectively (Figure 1). Its meltwater feeds to the Changma River, a tributary of the Shule River. Located in the western part, Laohugou glacier No. 12 is the largest glacier in the Qilian mountains. The meltwater of ice and snow in the LHGB plays a crucial role in regional water resources in the Shule River Basin. But, so far, there is still a lack of research on the long term glacier discharge and mass balance in the LHGB [15].
3. Data and Methods
3.1. Data
3.1.1. Geographical Data
The digital vector map of modern glaciers and the 30-m-resolution Global Digital Elevation Model (http://westdc.westgis.ac.cn/) that were obtained from the Chinese Glacier Inventory [14,16] were used as topographic input. The basin was divided by altitude zones, aspect classes (North, South, East-West-Horizontal), and zones with and without glaciers (Figure 1). The land cover types include bare land and glaciers cover. It is assumed that the area of the glaciers is constant from 1959 to present in this study, while the deglacierization scenarios were created by cutting glaciers below a certain elevation (below 4700 m a.s.l. equals −10%, below 5000 m a.s.l. equals −53%).
3.1.2. Meteorological Data
The first Chinese Alpine glacier, hydrology and meteorological observation station was established in the Qilian mountain from 1958 to 1962. Temperature and precipitation data were obtained from 1959 to 1961 in LHGB [17]. After these three years, the monitoring was interrupted. Three automatic weather stations AWS1 (4192 m a.s.l.), AWS2 (4550 m a.s.l.) and AWS3 (5040 m a.s.l.) were established in the LHGB in 2008 and have operated until today (Figure 1). The AWS1 with uninterrupted air temperature and precipitation data were used as the input data of the hydrological model. According to the elevation of the three AWSs, the air temperature and the precipitation gradients were calculated as 0.5 °C (100 m)−1 and 9.45% (100 m)−1, respectively. The potential evaporation was calculated while using the Penman-Monteith equation [18].
Data recorded by six national weather stations were used to reconstruct LHGB air temperature and precipitation data from 1959 to 2015 (Figure 1, Table 1). The data recorded at six national meteorological stations were obtained from the China Meteorological Data Sharing Service System (http://data.cma.cn/).
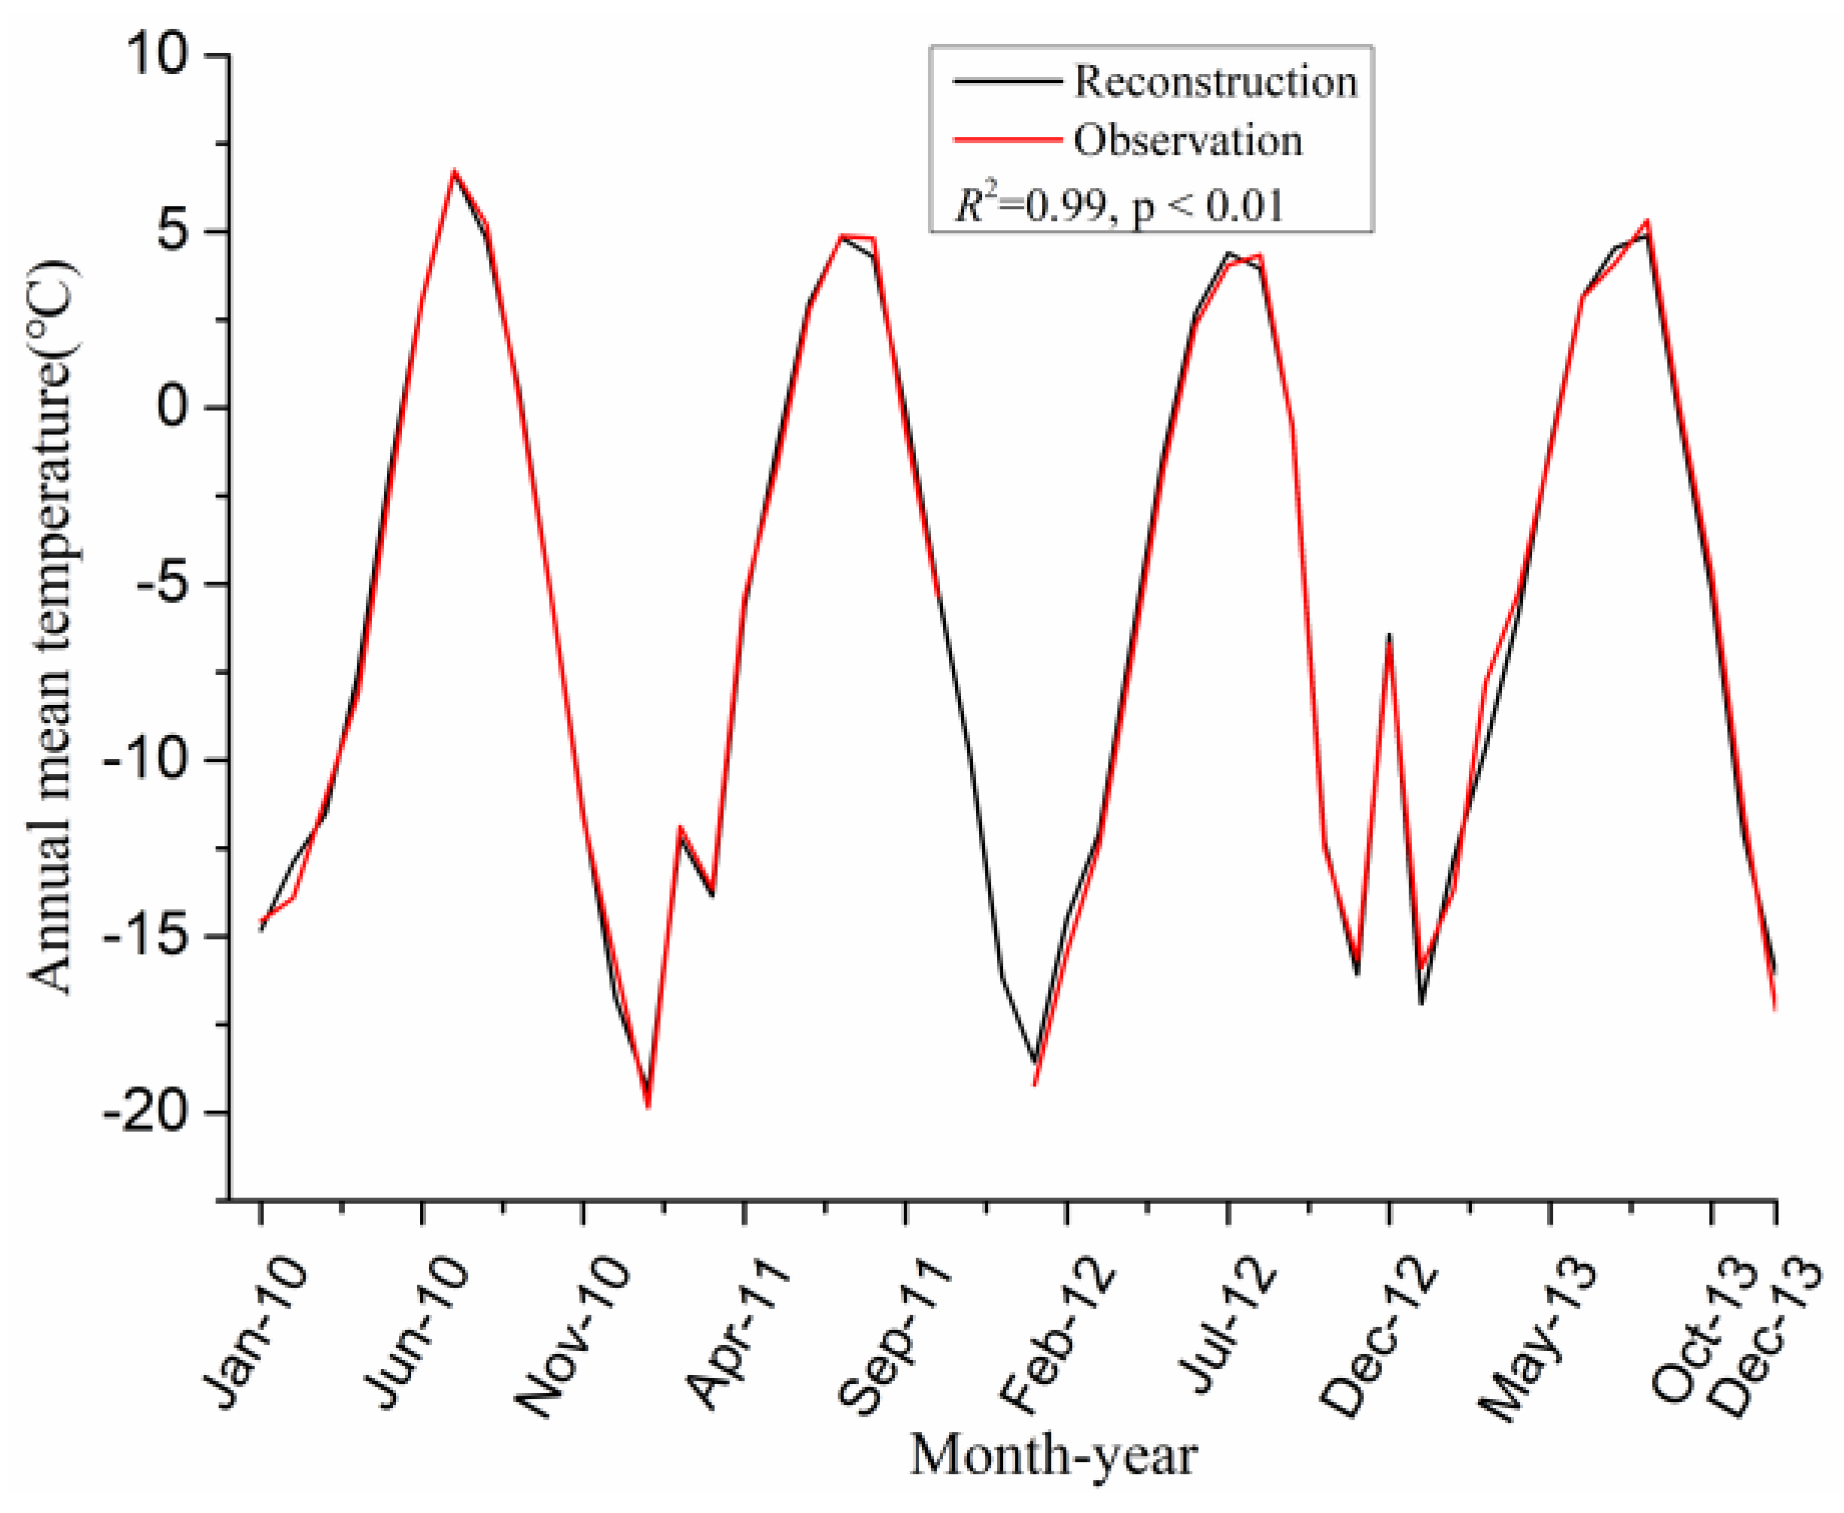
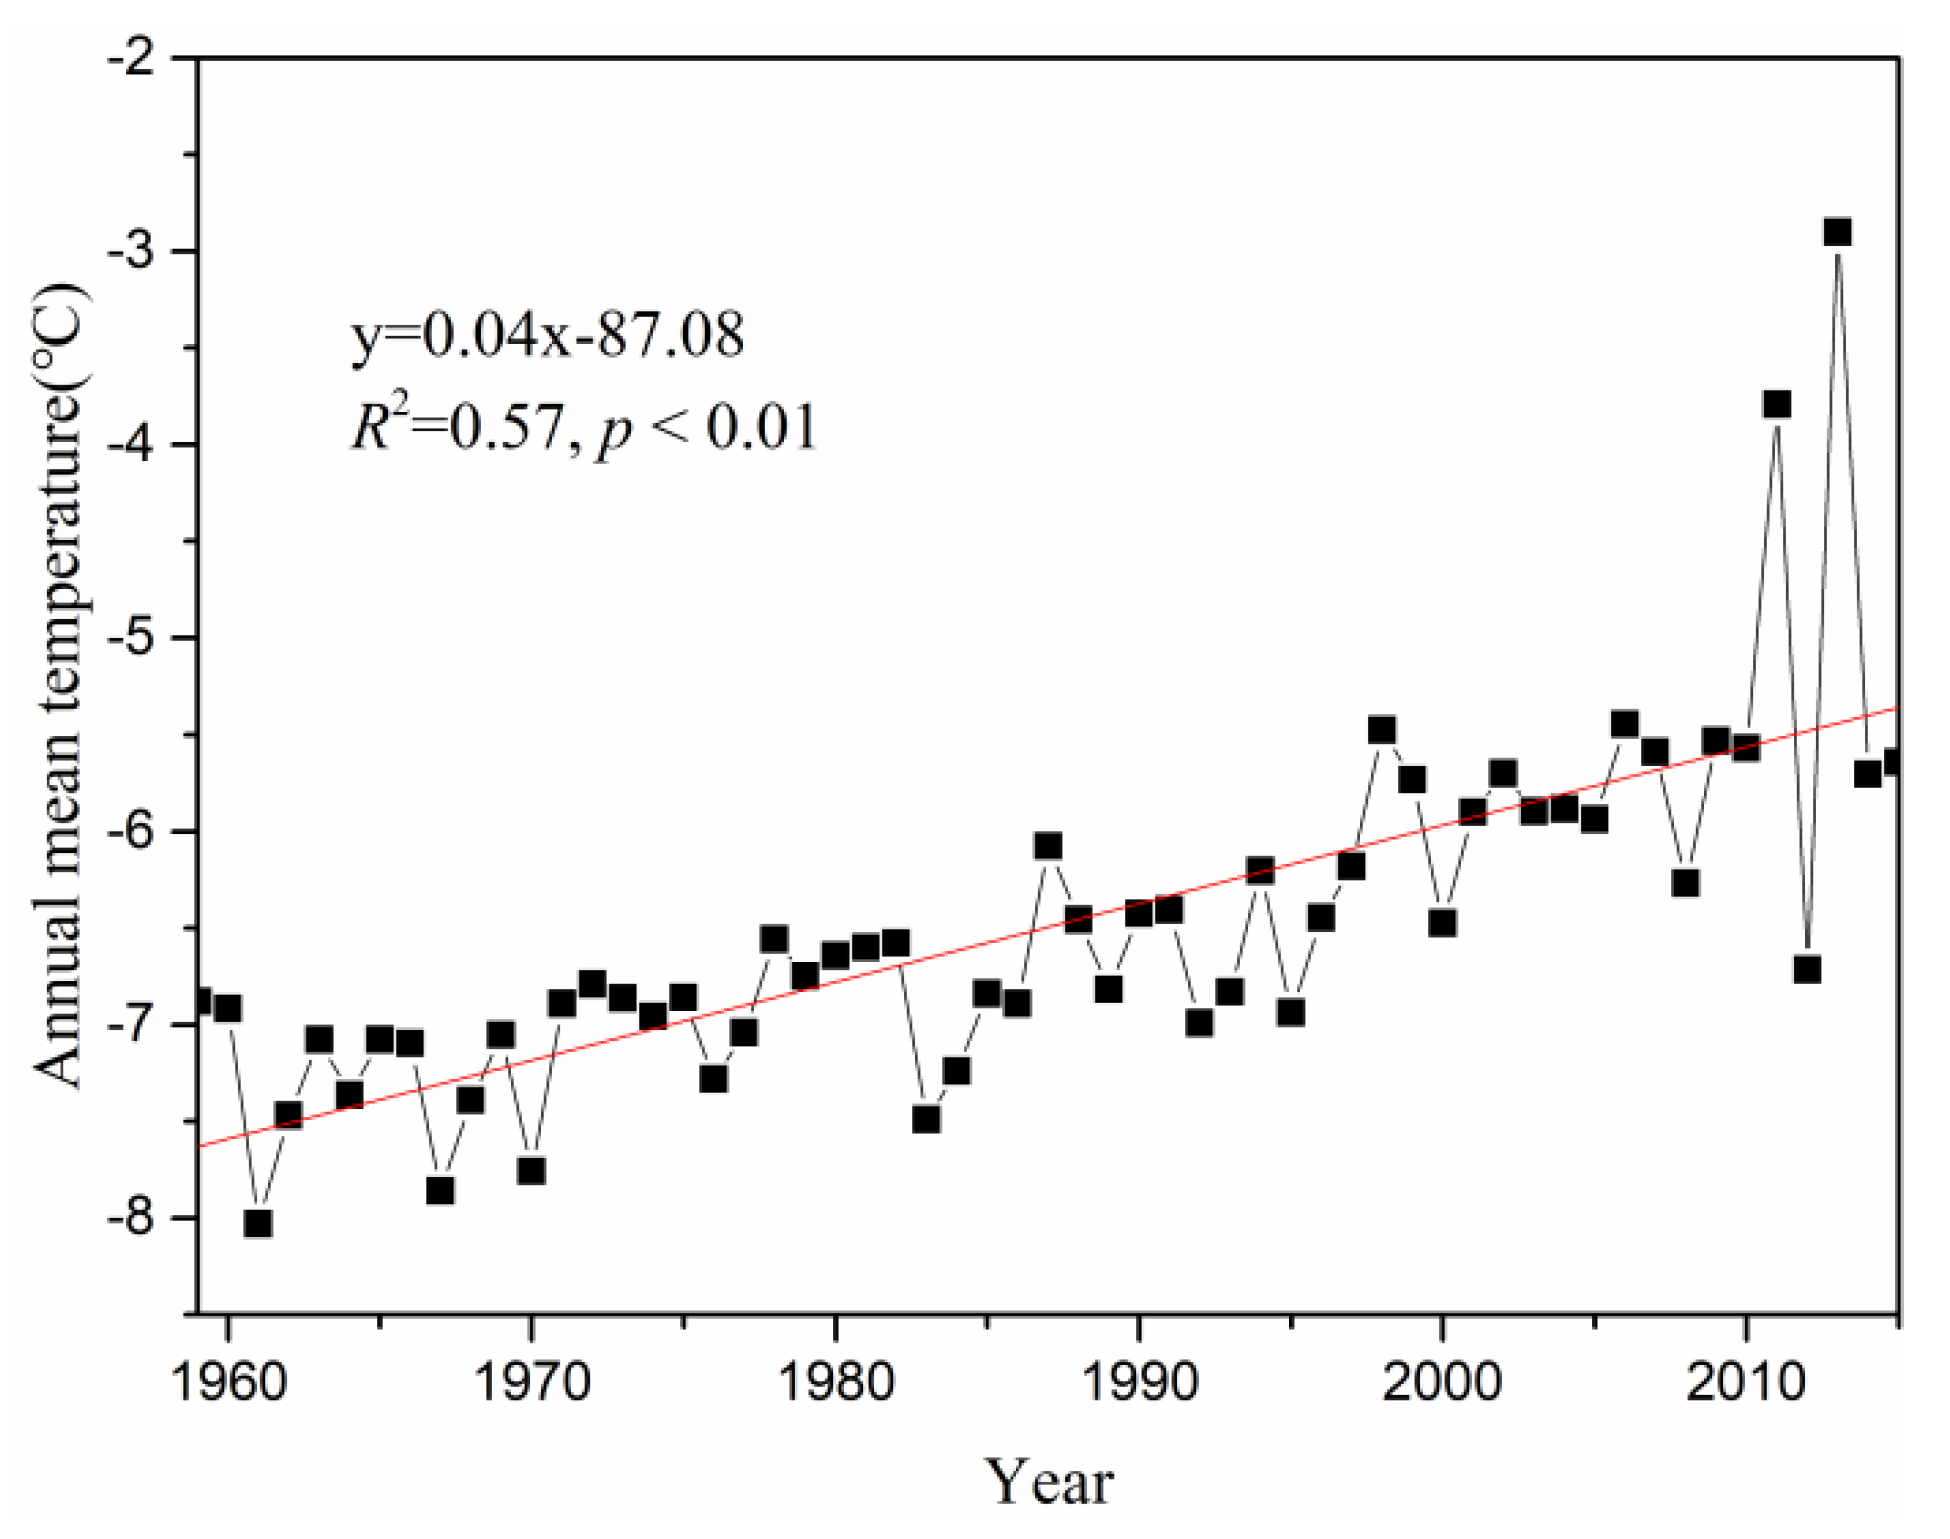
Since the observation data of long time series cannot be obtained, it is necessary to reconstruct the historical temperature and precipitation data. The data of the four NAWS were used to reconstruct the daily air temperature [4]. The reconstructed daily temperatures are in good agreement with the observations from 2010 to 2013 (R2 = 0.99; p < 0.01; Figure 2). The temperature increased by 0.40 °C (10a−1; p < 0.01) in the past semi-century in the LHGB (Figure 3), which is a little higher than the average change in the Tibetan Plateau during 1961–2005. (0.27 °C, 0.3 °C, 10a−1) [3,19]. Based on the results of a previous study [20], it is estimated that the glacier basin may face a faster warming rate in the future.
Based on the daily precipitation data of LHGB during 2010–2012 and the daily precipitation data of four NWSs around LHGB during 1959–2015, the daily precipitation of LHGB during 1959–2009 was reconstructed by using the methods of precipitation gradients and inverse distance weight (IDW). Although there are uncertainties in the reconstructed daily precipitation data, precipitation in the basin has a linear relationship with the nearby meteorological station due to the same large-scale precipitation field. Therefore, the reconstruction of precipitation was computed, as follows:
We used the stepwise multiple regression analysis method to eliminate the precipitation record stations that did not pass the significance test. The relationships with AWS1 were significant at Tuole, Dachaidan, Delingha, and Jiuquan stations (p < 0.01). Finally, data recorded at Tuole, Dachaidan, Delingha, and Jiuquan stations were selected to reconstruct the AWS1 precipitation. This result is reasonable because the LHGB is in the center of the four stations.
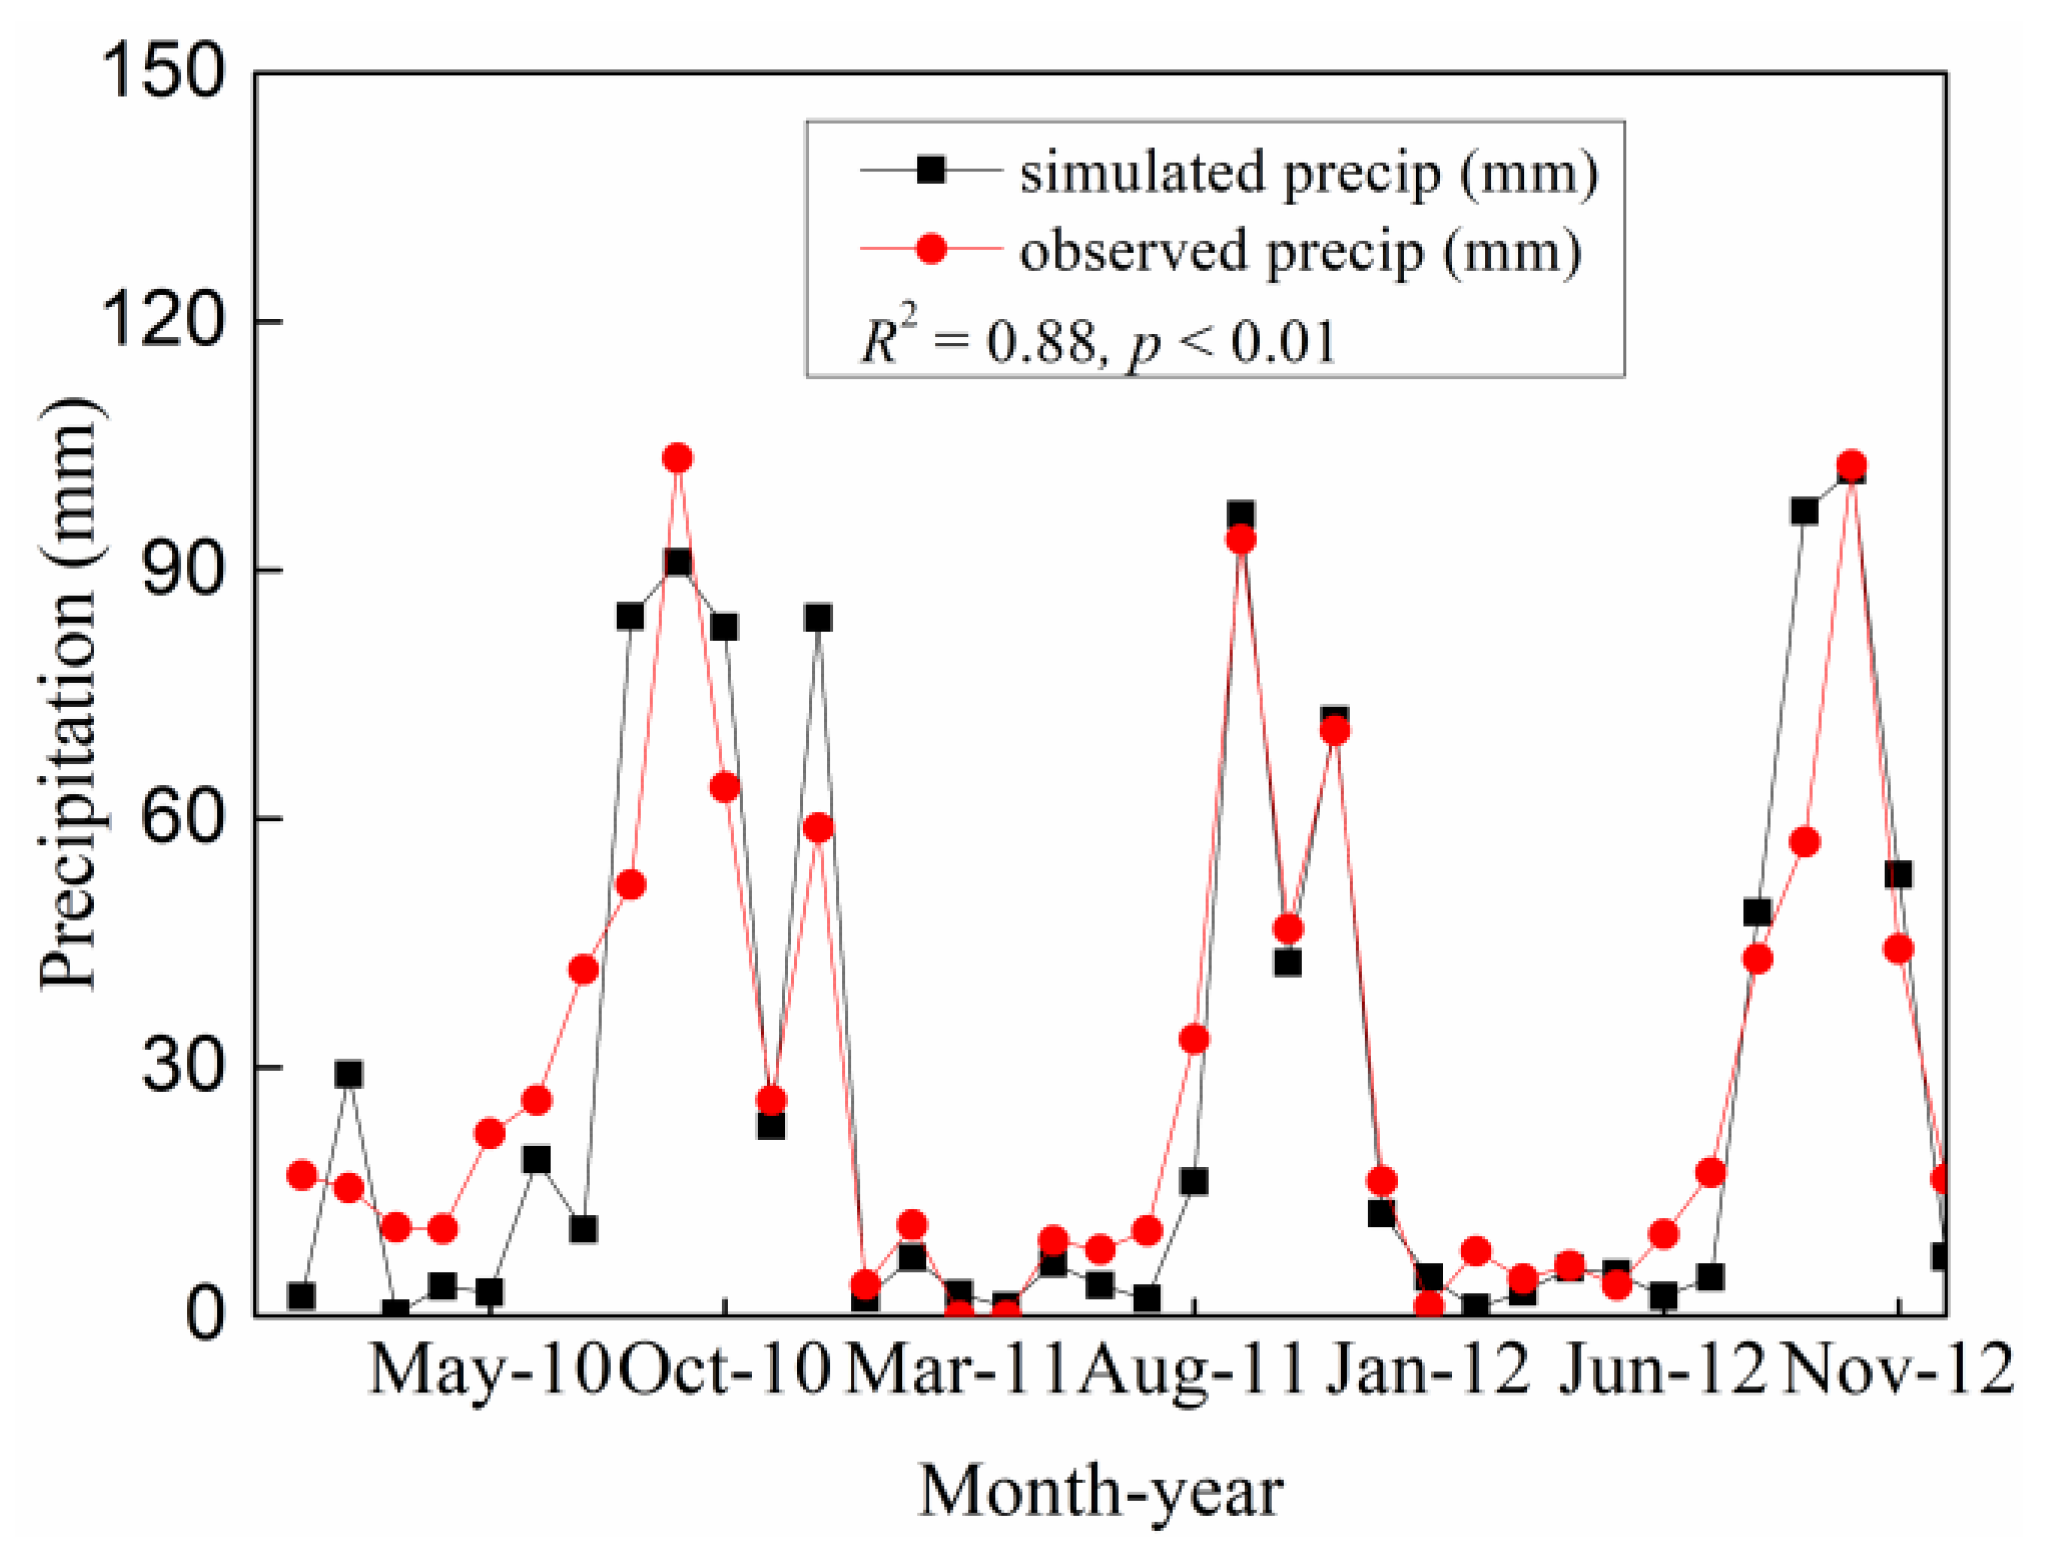
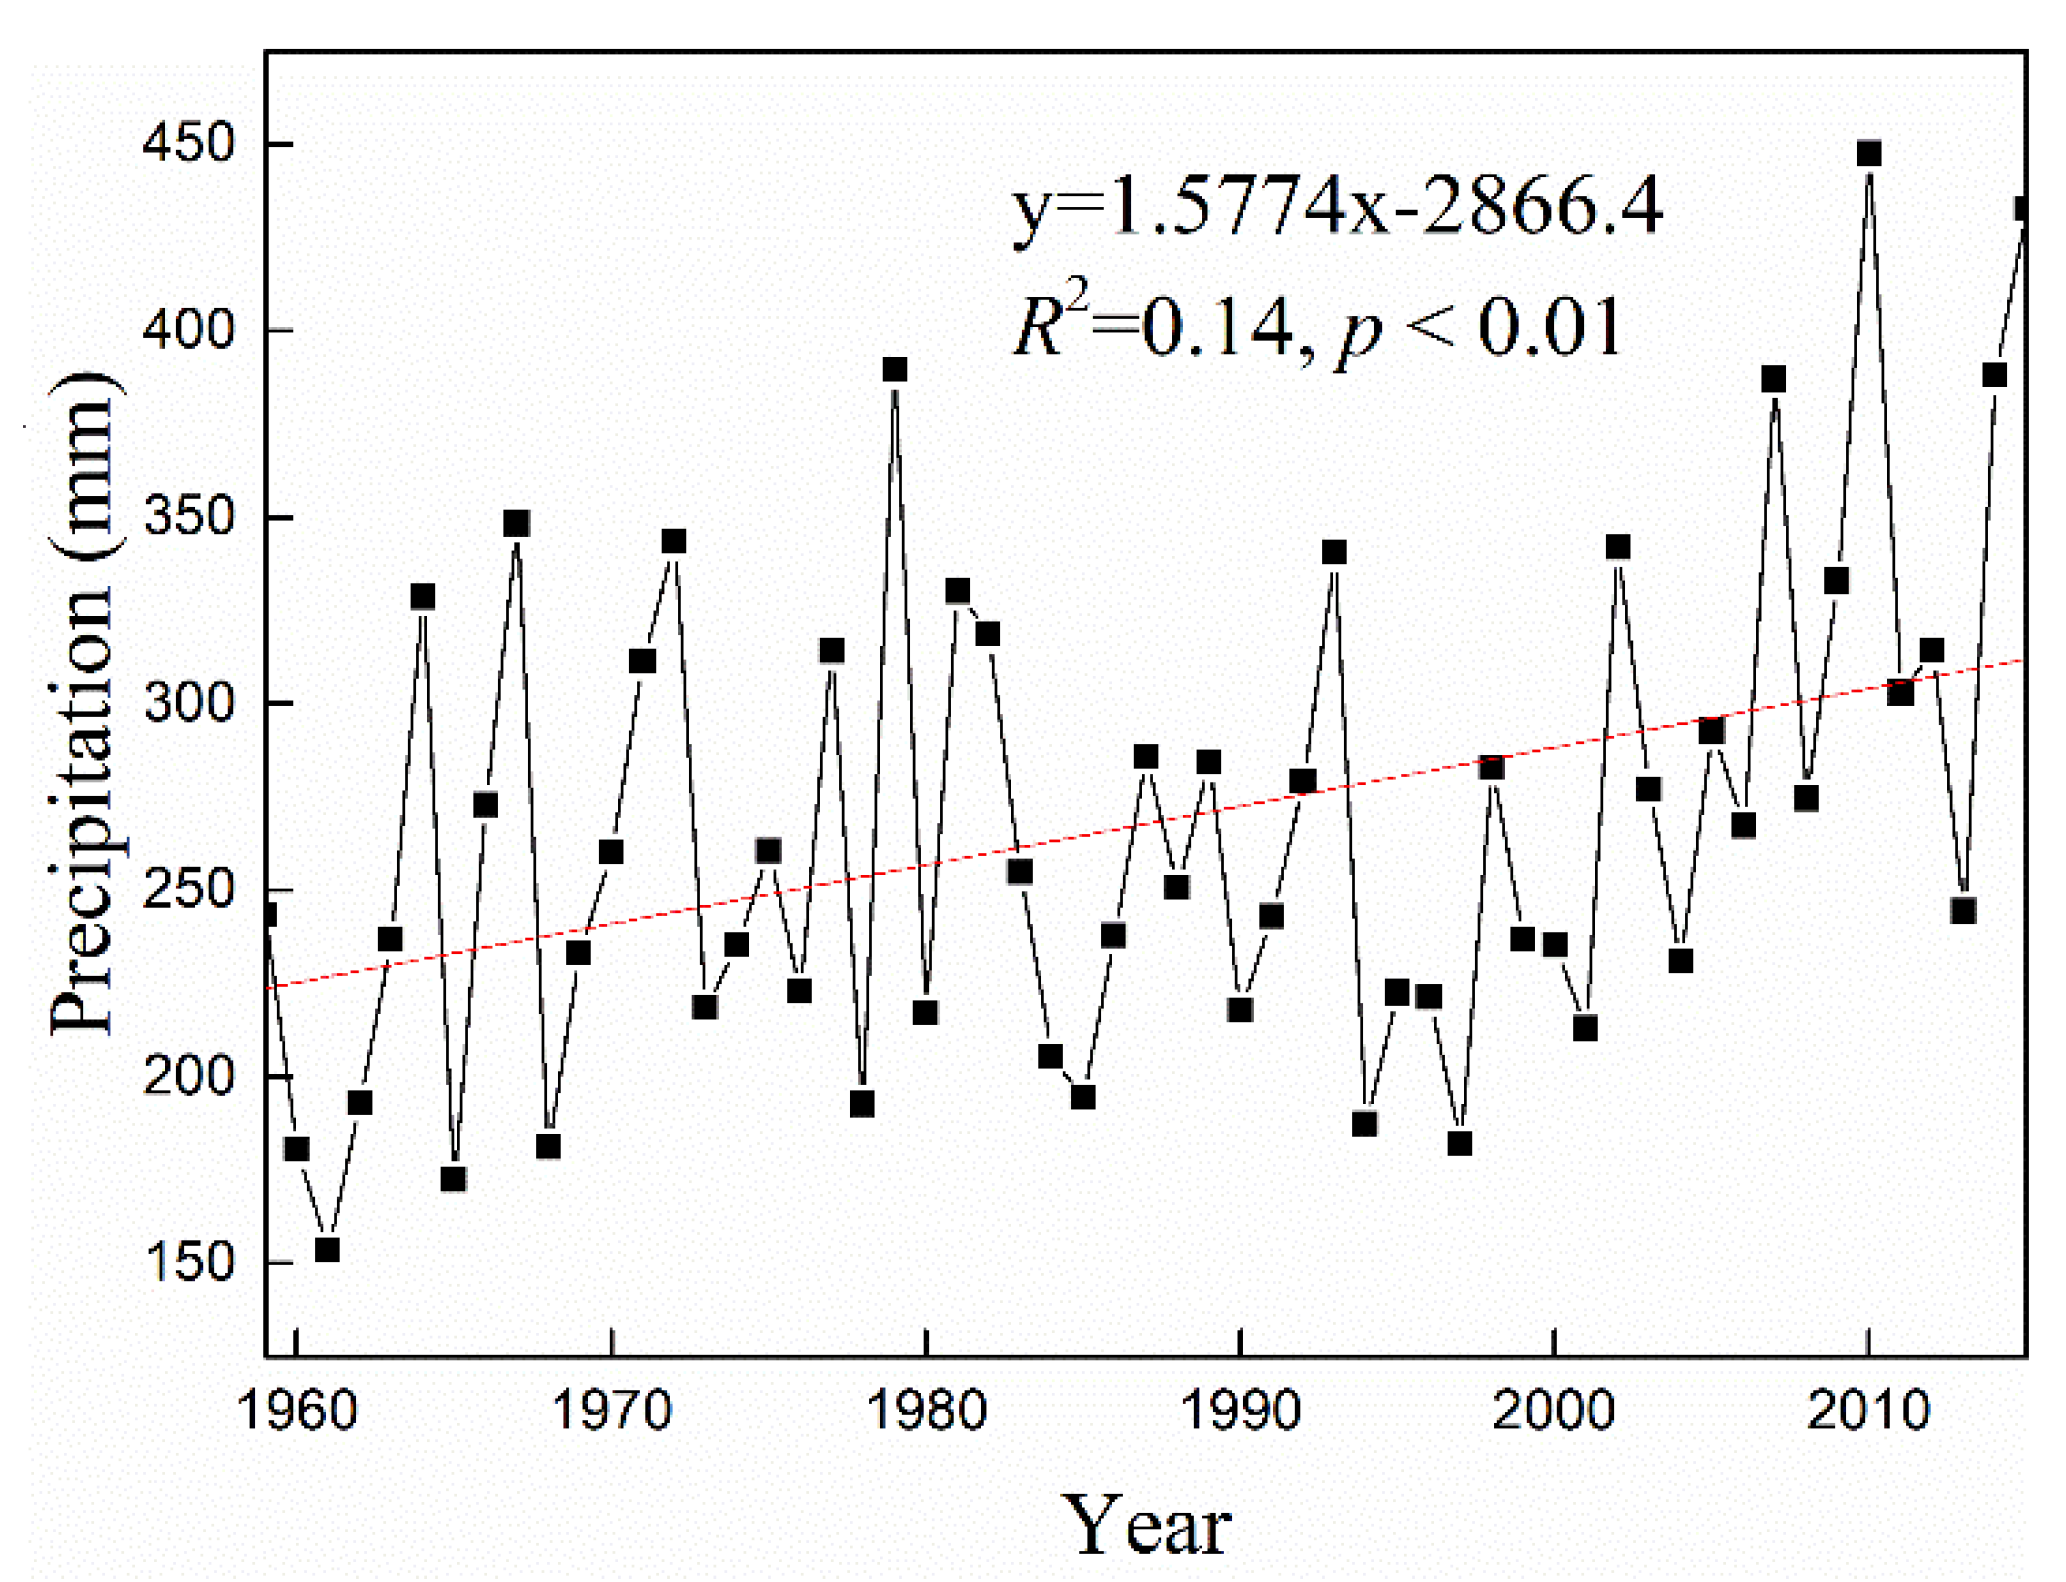
The results of simulated and observed precipitation show that R2 reached 0.88 (p < 0.05) in 2010–2012 (Figure 4). Precipitation is also an important factor affecting runoff in glacier-covered watersheds. In order to know the error of reconstructed precipitation, it is necessary to validate and carry out uncertainty analysis on the reconstructed precipitation. The efficiency coefficient of model (Reff) [21] and Relative error (RE) were used to evaluate the reconstructed result. Reff is equal to 0.96, and the RE (relative error) values are 7%, 8%, and 7% from 1959 to 1961, respectively. The precipitation uncertainty is found to be 5 mm·m−1 and 16 mm·a−1 with significance of 0.99 from 1959 to 1961. The relative error (RE) of total precipitation is 7.5%. There are many factors affecting precipitation in mountainous areas [22], and the result is comparatively reasonable. The results show that the precipitation increased by 1.6 mm·a−1 (p < 0.01) from 1959 to 2015 (Figure 5).
3.1.3. Hydrological Data
The hydrological data were obtained in the Laohugou basin from 1959 to 1961 [17]. Since 2014, the water level was recorded every 15 min by a reinstalled automatic HOBO meter at the original site. Using a flow meter to measure the flow velocity, then discharge is calculated by combining flow velocity and water level data. Then, calculating discharge by combining flow velocity and water level data, the discharge data were established at hydrologic station in 2014 and 2015.
3.2. Runoff Model
The hydrological model HBV-light [23], including a Glacier Ablation Module (GAM) that is based on a temperature index approach was used to simulate runoff and mass balance in the selected catchment [24]. The model needs precipitation, temperature, and potential evaporation as forcing data to simulate the runoff of the catchment. The model divides the basin into several zones according to different altitudes, and the temperature and precipitation of each zone is calculated while using the temperature and precipitation gradients (Pg, Tg). In this study, the basin with two types of land cover (glaciers and non-glaciers) was divided into 12 elevation zones every 100 m and three aspects (north, south, and east-west aspect).
In the HBV snow routine, when the temperature is lower than a certain temperature threshold (TThreshold), precipitation is solid, while above this threshold, precipitation is liquid. The uncertainty in the observation of precipitation is corrected by multiplying the precipitation correction factor (SFCF). Glacier ablation was calculated by the degree-day method (CFMAX). For each elevation zone, a slope correction factor (FSlope) and a glacier correction factor (CFGlacier) have to be specified. For the North slope, the degree-day factor CFMAX will be corrected by dividing its value by FSlope. For the South slope, the degree-day factor CFMAX will be corrected by multiplying its value with FSlope. For the East/West slope no correction will be applied to CFMAX. Refreezing was considered by a threshold temperature, below which liquid meltwater is frozen and stored again in the snow pack (Rf). The snow pack retains melt water until the amount exceeds a certain portion (CHC, usually 0.1) of the water equivalent of the snow pack. When the temperature is below the threshold temperature, then the liquid meltwater is frozen and stored on the surface of snow or glaciers. Each glacier research unit has a separate reservoir for runoff routing, outflow of which is calculated by an outflow coefficient parameterized as a function of snowpack water equivalent (KGmin, dKG, AG) and is multiplied by the liquid water that is stored in the reservoir. Groundwater recharge and actual evaporation are simulated by soil saturation (FC, LP, Beta). The runoff response module is a combination of three linear reservoirs (K0, K1, K2, Perc) and they are calculated while using a triangular weighting function (Maxbas). Finally, we used the observed runoff at the hydrological station to calibrate and validate the model. More details are available in Seibert and Vis [24].
3.3. The Mass Balance Calculation Method
The specific altitude z (m a.s.l.) and the daily snowfall or melting ice mj(z) (mm w.e.) at time step j (day) are calculated by the degree-day factor method [25]:
mj(z) = CFMAX·(Tj(zref) + LR (z − zref) − Tthreshold) if Tj(zref) + LR (z − zref) > Tthreshold
mj(z) = 0 if Tj(zref) + LR (z − zref) < Tthreshold
The degree-day factors of snow and glacier ablation are calculated while using different values because of different albedo on the glacier and snow. The degree day factor CFMAX of glacier is multiplied by a glacier correction factor (CFGlacier). Zhang Yong [26] studied the observed degree-day factors of glaciers in western China. The degree-day factors of glaciers in western China varied from 2.6 to 13.8, therefore, we used the range of 2.6 to 13.8 for the degree-day factors in the process of model calibration. Where DDF is the degree-day factor, Tj(z) is the mean daily temperature, zref is the reference altitude. Tthreshold (°C) is the threshold temperature above which melting begins, and LR is air temperature gradient (°C m−1). It is generally assumed that the threshold temperature is 0 °C [27]. However, during the daytime when the temperature is below 0 °C, ablation will still occur, which is mainly due to radiation ablation [28].
The model needs to determine whether there is snow in the previous periods, in order to determine whether the degree-day factor for snow or for glacier ice should be used, where Sj−1(z) is the amount of snow in the previous period:
where CFR = refreezing coefficient (-), DDF = degree-day factor (mm·°C−1·Δt−1).
DDF = CFMAXsnow if Sj−1(z) > 0 (mm w.e. °C−1 d−1)
DDF = CFMAXice if Sj−1(z) = 0 (mm w.e. °C−1 d−1)
CFMAXice = CFMAX × CFGlacier
Refreezing = CFR·CFMAX × (Tj(zref) + LR (z − zref) − Tthreshold)
The glacier mass balance (B) equals the solid precipitation (P) plus Refreezing and minus the snow and ice melt (M), and evaporation at the glacier (Eact).
B = Psolid − M + Refreezing − Eact (mm w.e.)
Actual evaporation from the box equals the potential evaporation if SM/FC is above LP (-), while a linear reduction is applied when SM/FC is below LP, LP is moisture value above which actual evaporation reaches potential evaporation.
The long-term glacier mass balance could be calculated though Equation (8). The contribution of melting water from permafrost to annual runoff is assumed to be less than 1% [29]. Snow/ice melt (M), refreezing and evaporation at the glacier (Eact) was simulated in the model. Sublimation and permafrost was not been taken into account.
3.4. The Genetic Algorithm Calibration Procedure (GAP)
The Genetic Algorithm procedure (GAP) [30] was used to obtain the optimal parameter set (Table 2) according to the objective functions. To maximize the Nash-Sutcliffe efficiency (Reff), the coefficient of determination was used to evaluate the simulation effect of the model, which are calculated as:
where Reff is the Nash-Sutcliffe criterion, Qobs is the observed daily flow, Qsim is the simulated daily flow, Qavg is the average observed daily flow. Qaobs and Qasim are the average observed and simulated daily flows. The closer Reff is to 1, the better is the goodness of fit [31].
4. Results
4.1. Model Calibration and Validation
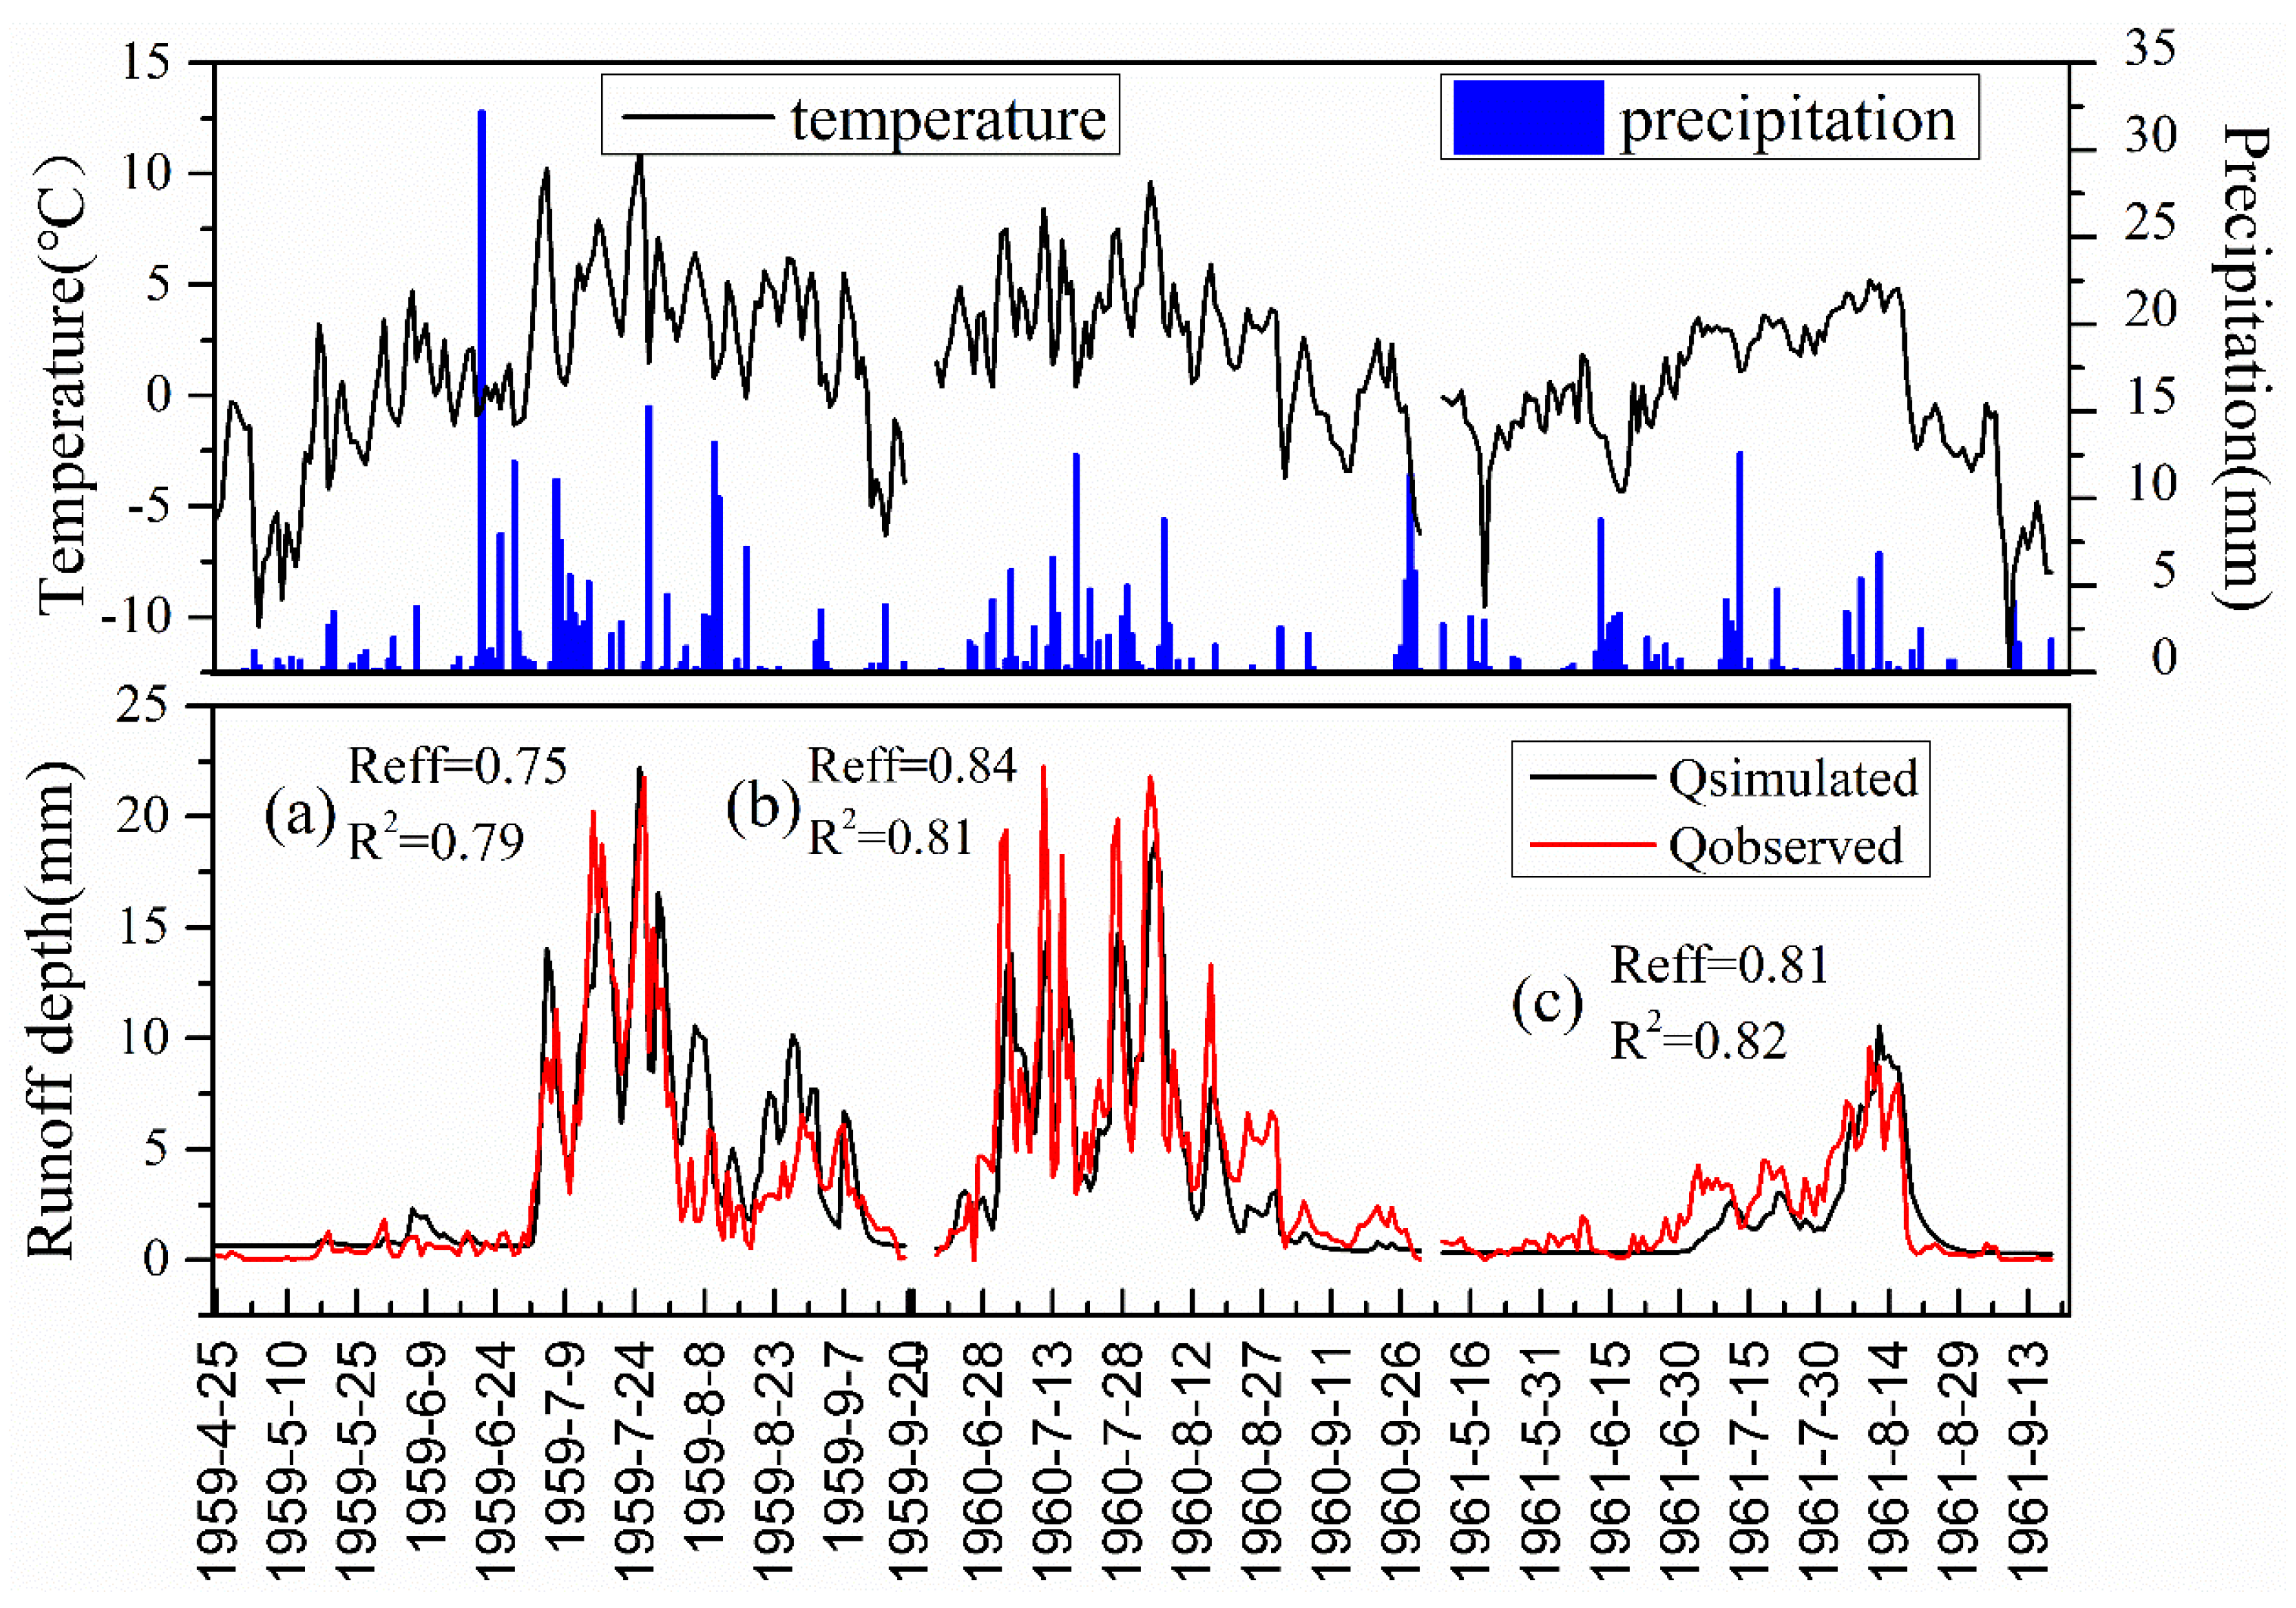
We need to calibrate the 18 parameters in the model, except the temperature and precipitation gradient (Table 3). Daily runoff data from 1/1/1959 to 31/12/1961 were used in the model calibration. Then, the simulated results of the model are validated with the updated hydrological data. In the calibration period, Reff and R2 are 0.75 and 0.79 during 1959, respectively (Figure 6a); 0.84 and 0.81 during 1960, respectively (Figure 6b); and, 0.81 and 0.82 during 1961, respectively (Figure 6c). The simulation results are even better in the validation period, especially for monthly runoff. Therefore, we believe that it can meet the requirements for long-time series runoff simulation (Figure 7 and Figure 8).
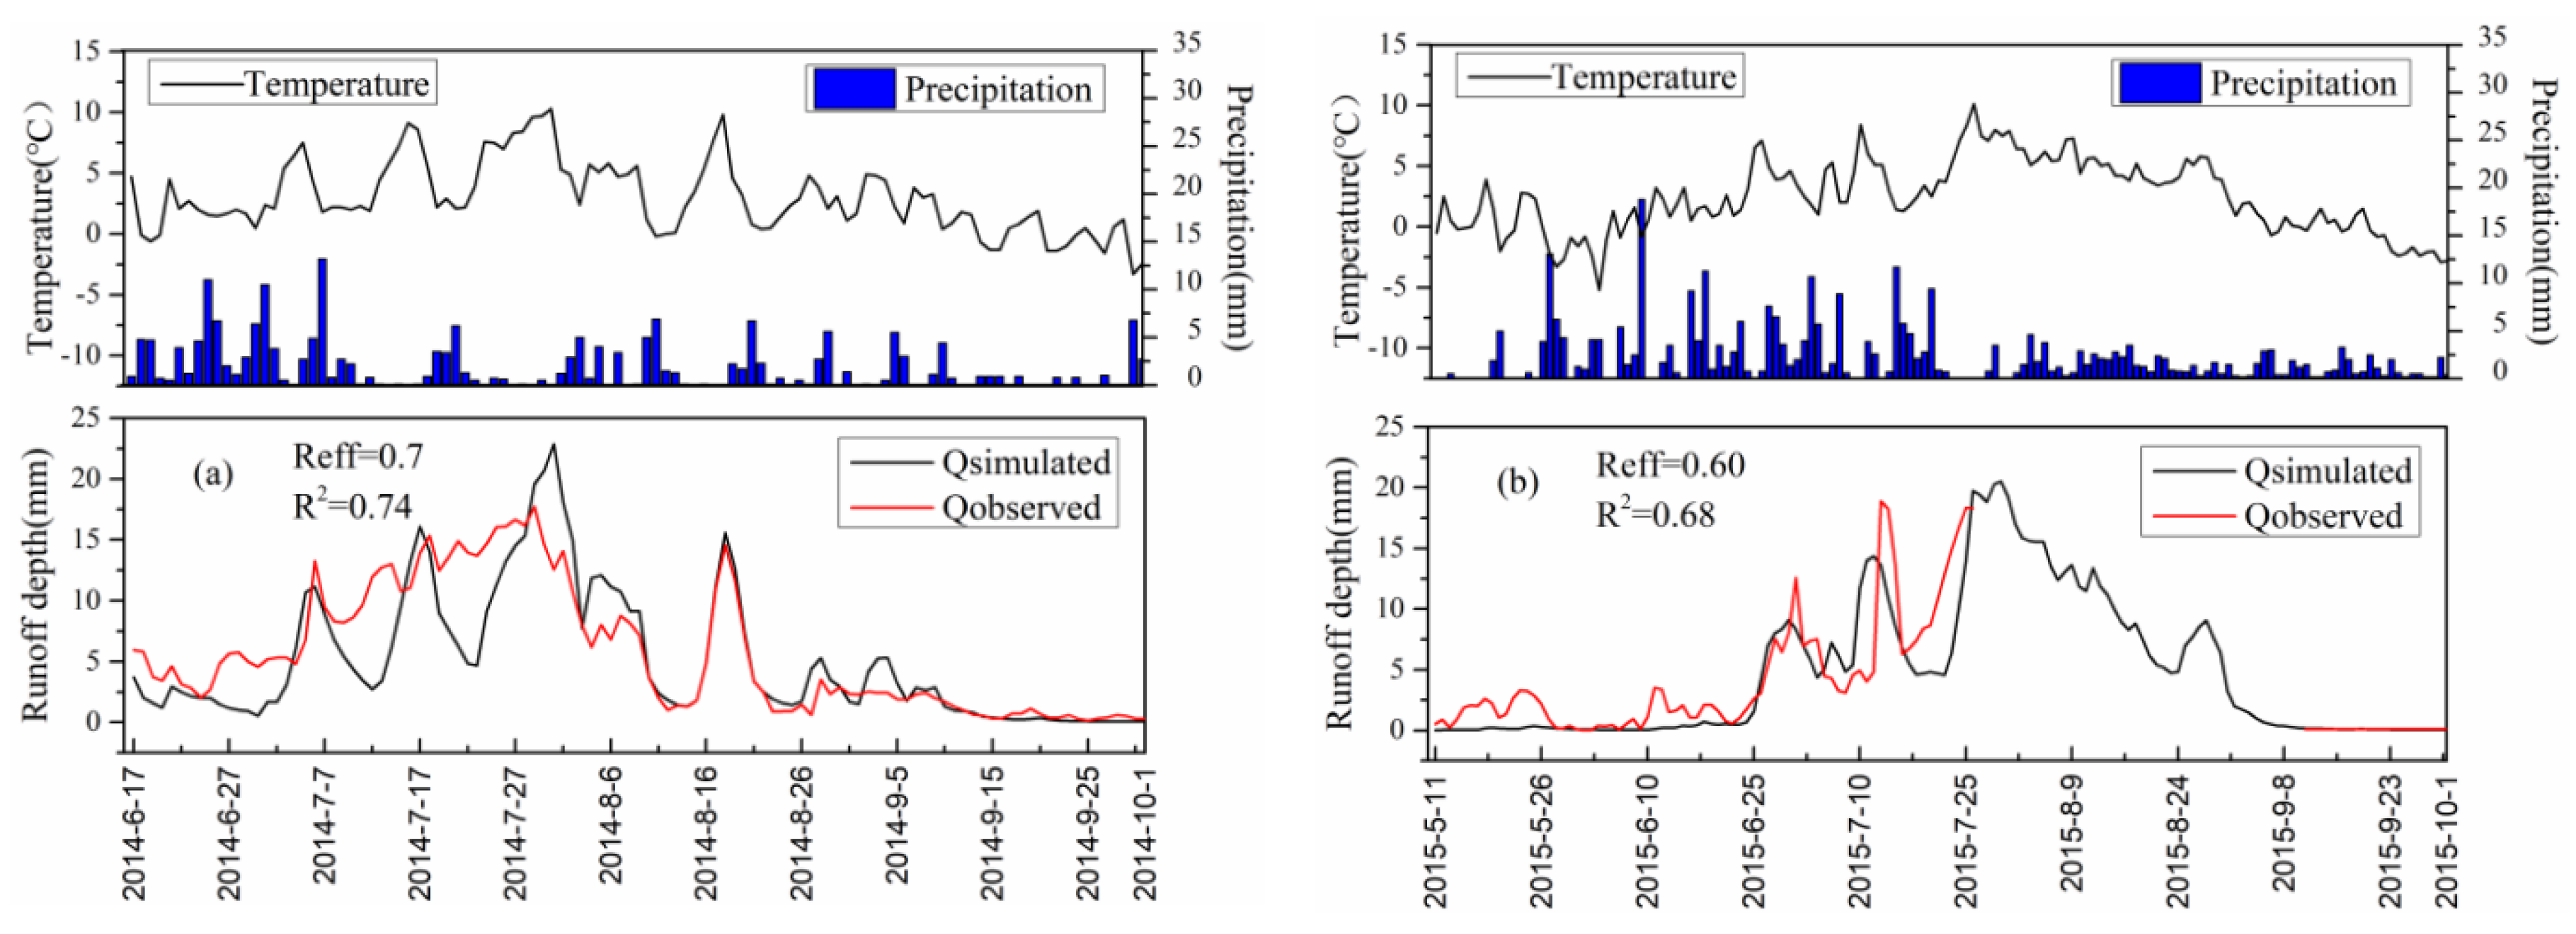
The model was validated for the LHGB by the years 2014 and 2015 with the same parameter sets. In the validation period, Reff and R2 were 0.70 and 0.74, respectively, during 2014 (Figure 7a) and 0.6 and 0.68, respectively, during 2015 (Figure 7b). Figure 7 shows the validation results for the LHGB for the hydrological years 2014 and 2015. It should be noted that the simulation of peak flow was more consistent with the measured runoff, but the simulation of runoff trough was poor during the validation period.
The simulated monthly discharge values were compared with the observed discharge, where the peak flow was slightly underestimated in the LHGB in July (Figure 8). Table 2 presents the daily and monthly model efficiencies for the HBV model during the calibration and validation periods. For the conceptual hydrological model, when the efficiency coefficient of the model is greater than 0.8 in the glacier basin, the simulation has high credibility [32]. For both the calibration and validation period, the monthly efficiency Reff is more than 0.8 (Table 2). Therefore, we are convinced the HBV model has a very high reliability in the simulation of monthly runoff depth. These results are acceptable, especially when considering the uncertainty in such an alpine area with scarce data.
4.2. Simulation of Runoff and Glacier Mass Balance in the LHGB from 1959 to 2015
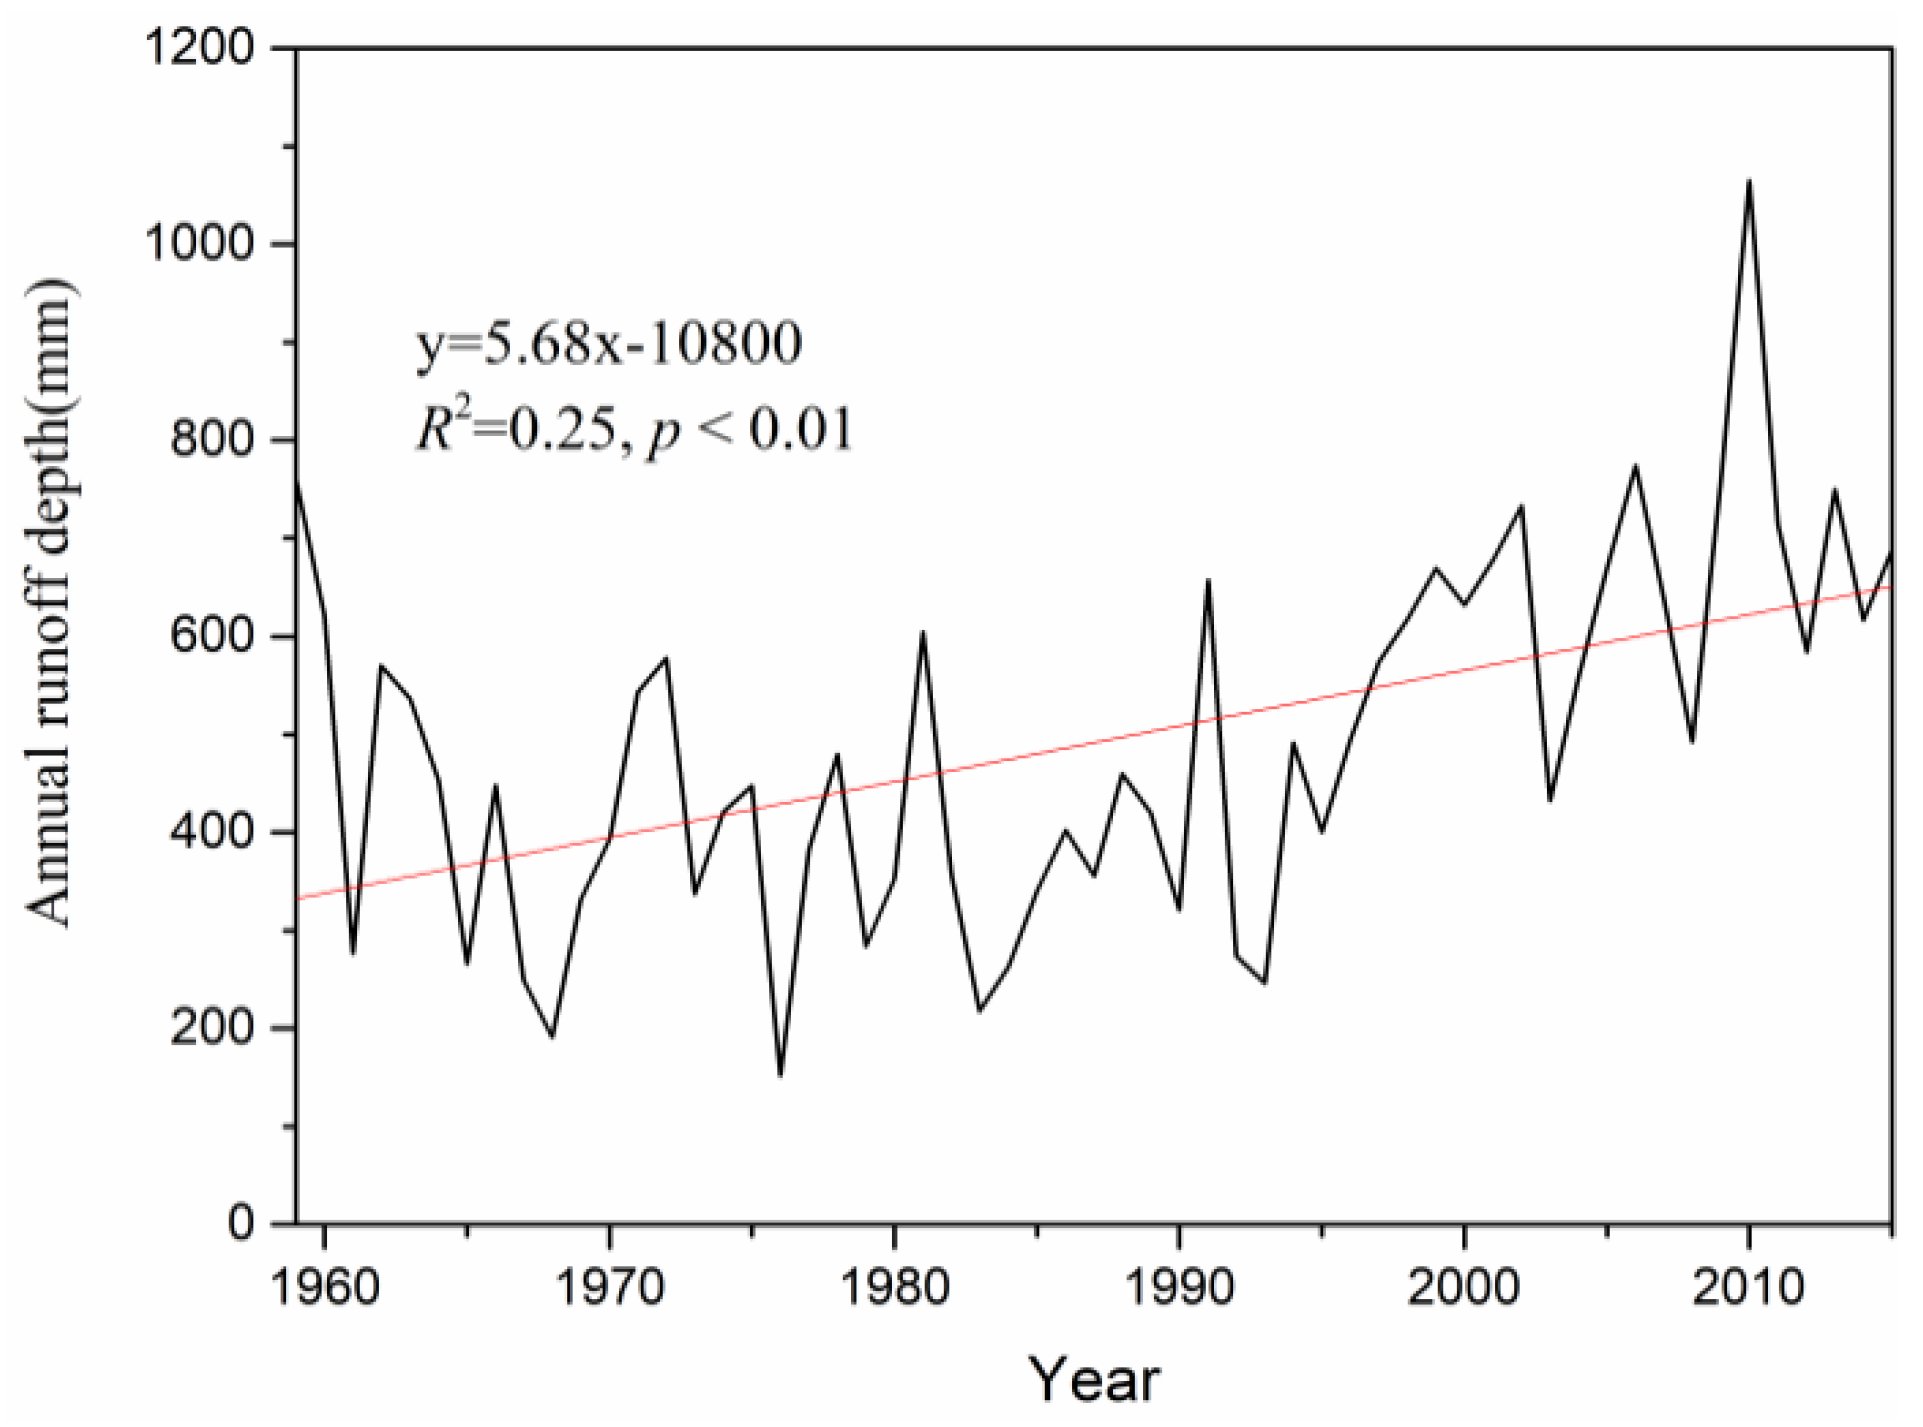
The reconstructed meteorological data and evaporation data were taken as input data of the HBV model, then the runoff depth and glacier surface mass balance were simulated by using the parameterization (Table 3) of the model that was obtained through calibration and validation. The results showed that the simulated runoff at the outlet of the river basin increased at a speed of 5.7 mm·a−1 (p < 0.01) from 1959 to 2015 (Figure 9). Other studies have also simulated the long-term series of runoff depth in nearby glacier regions, they also proved a significant increasing trend around 1990 [19]. The two important factors that affect the runoff were analyzed. The average annual air temperature increased by 0.04 °C·a−1 from 1959 to 2015 (p < 0.01) (Figure 4) and precipitation increased by 1.6 mm·a−1 at the same time (p < 0.01) (Figure 5).
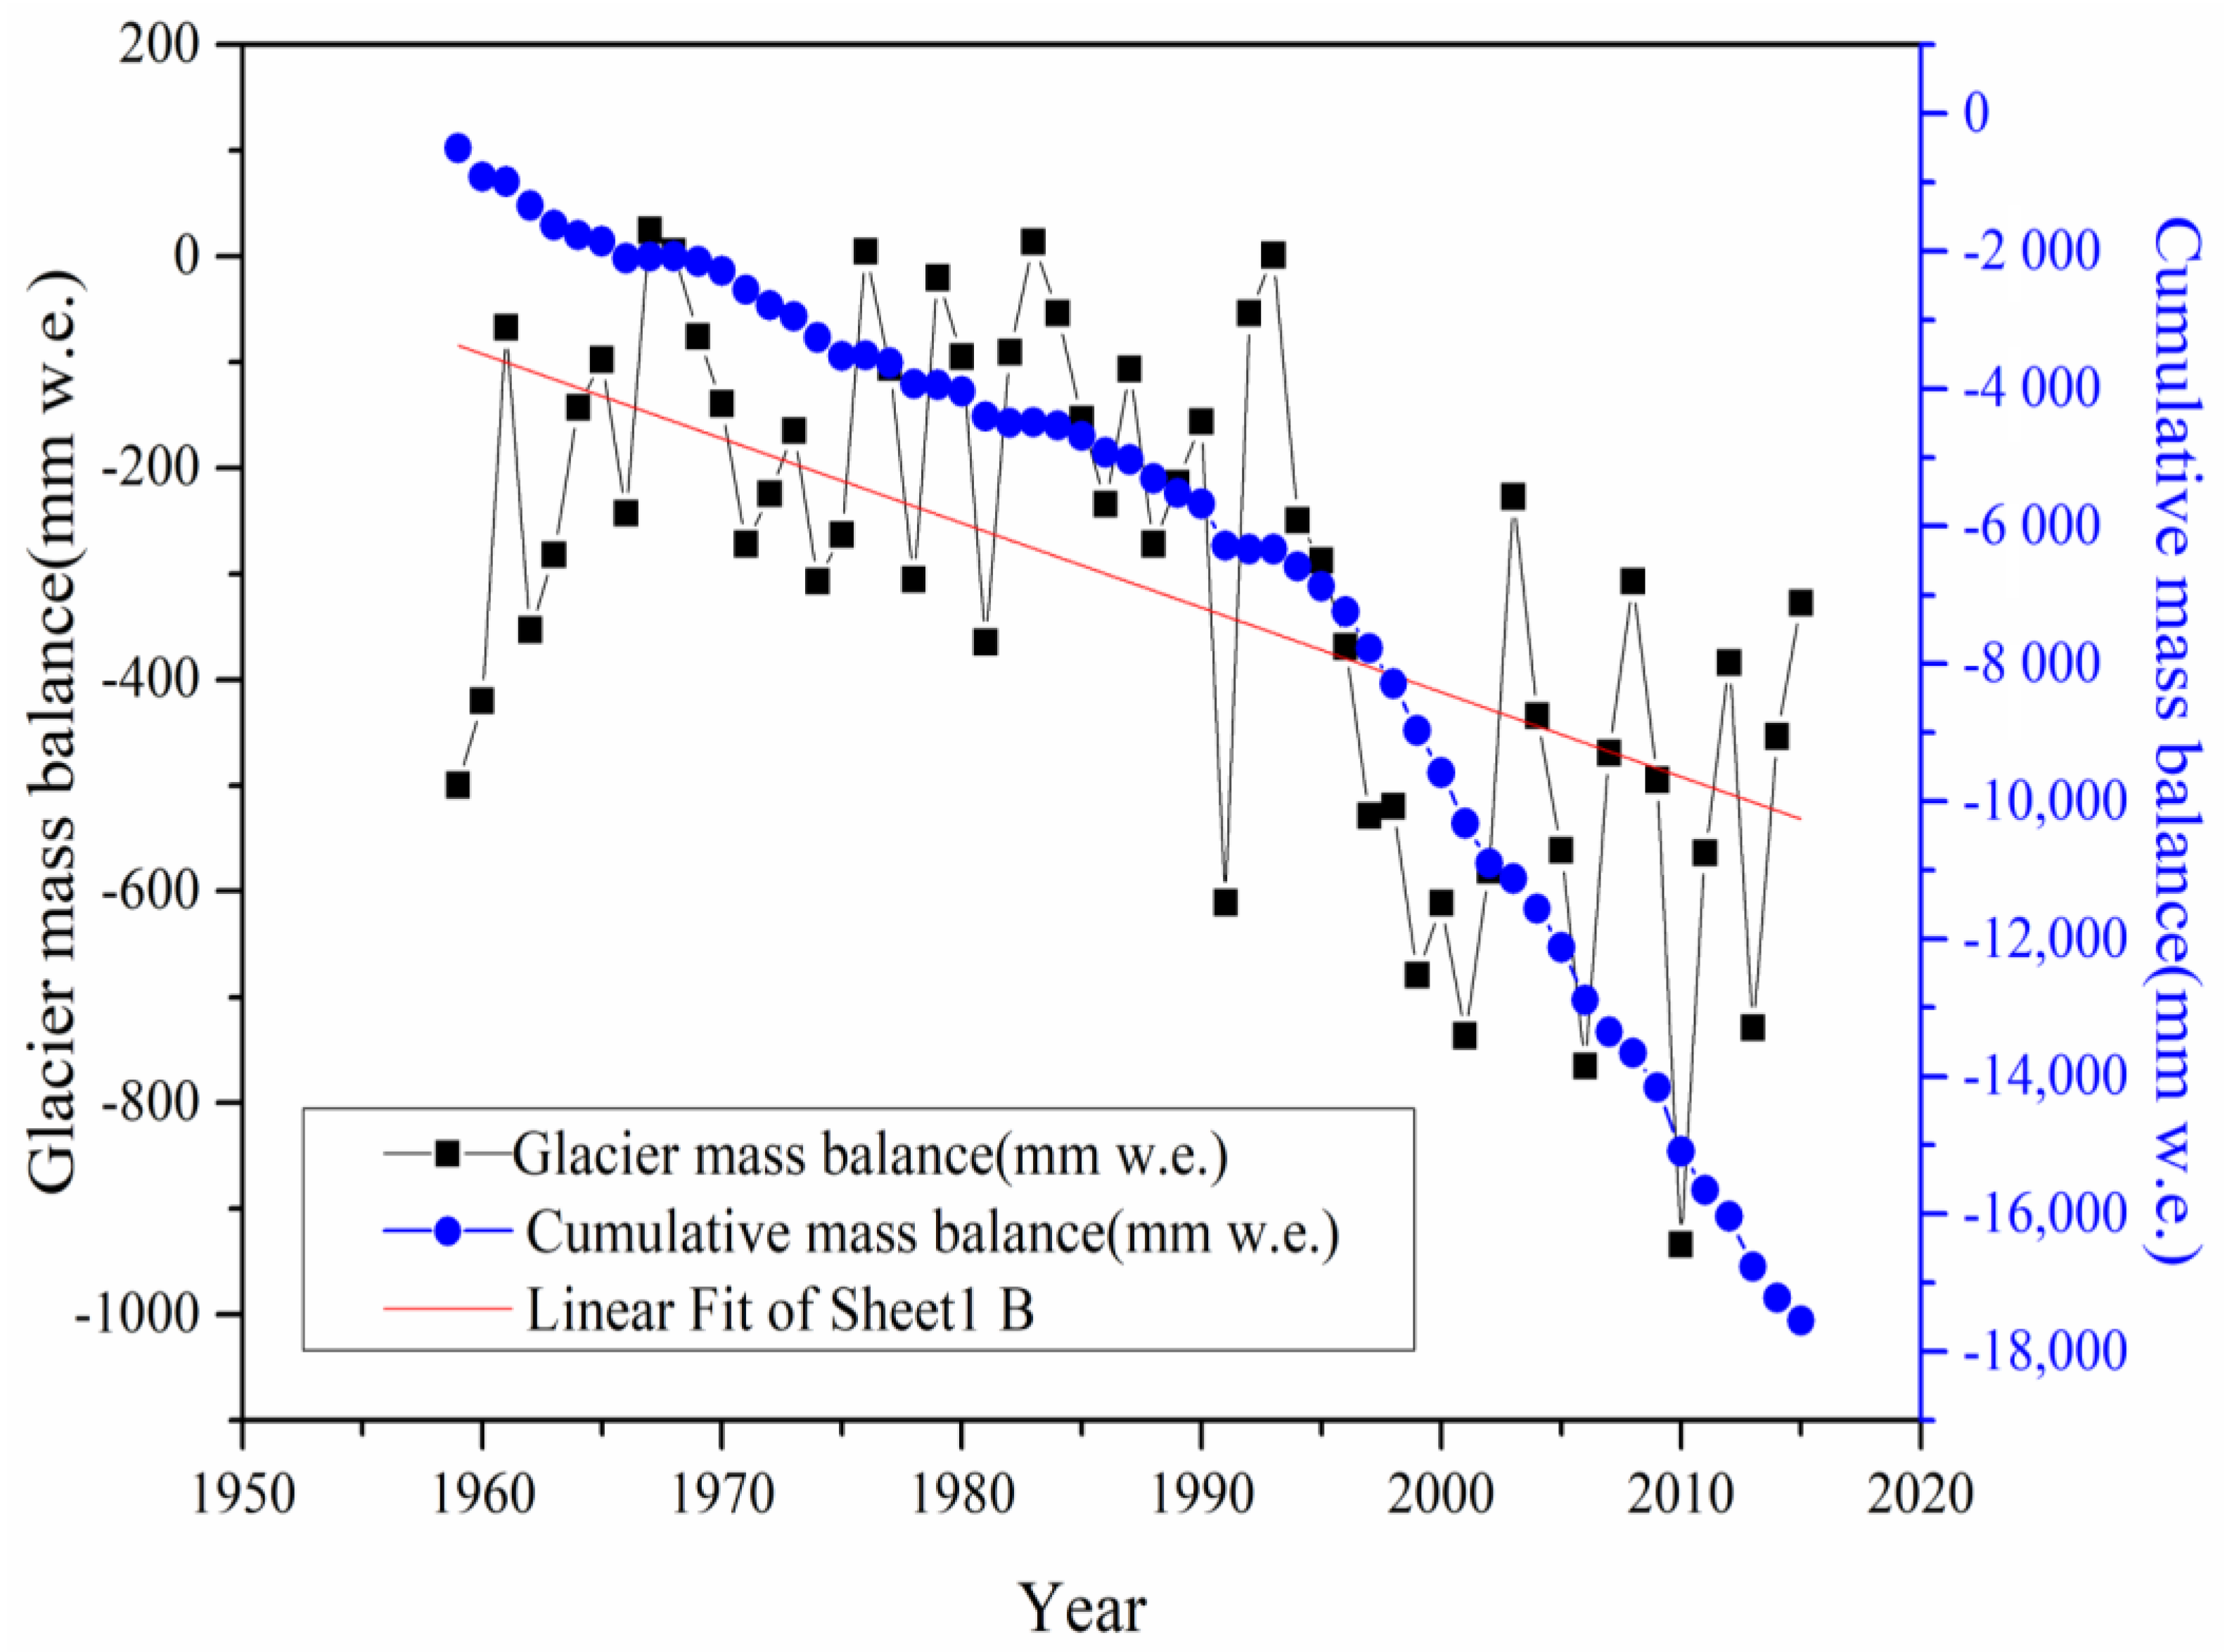
While using the calibrated and validated parameter values, the annual mass balances were modeled. The results showed that the decadal mean mass balance values increased from close to −202 mm w.e. a−1 in the 1960s, −185 mm w.e. a–1 in the 1970s and −157 mm w.e. a–1 in the 1980s to −370 mm w.e. a–1 in the 1990s. Balances were closer to equilibrium in the 1970’s, however the World Glacier Monitoring Service record indicates that the 1980’s saw the beginning of sustained and increasing negative balances. From 2000 to 2010, the annual mass balance was −511 mm w.e. a–1, the cumulative mass balances exhibited accelerated ablation after the 1990s, leading to a sustainable negative cumulative mass balance for the simulation period (1959–2015). Glacier melting in Laohugou glacier river basin increased at an annual rate of 8.0 mm (p < 0.01), and the surface change of the glacier in Laohugou basin have decreased 17.55 m w.e. totally, equivalent to a reduction of 280.5 mm w.e. a−1 (Figure 10). So, why did such a thickness loss not result in a massive area loss? This is due to the small glaciers’ area is more sensitive to climate change. However, for large glaciers, the initial glacier changes were mainly realized as glacier thinning. However, it is necessary to give a more reasonable and accurate explanation based on the glacier area change and glacier thickness data from 1959 to 2015.
There is no long-term glacier mass balance observation data in Laohugou watershed, so we cannot validate our simulated mass balances with the observed mass balance data. Therefore, we chose nearby glaciers with observation data (Table 4) to compare with simulated glacier mass balance. Since the contribution of thawing of permofrost to runoff was not taken into consideration in the simulation period, this part of water may have been added to the loss of glacier mass, so the mass loss of glaciers may be overestimated in this study. Although there is uncertainty in this method, we can determine the long-term trend of glacier mass balance. Then, it can be concluded that the simulated long-term mass balance data in Laohugou basin are within an acceptable ranges [38,39].
4.3. Monthly Average Air Temperature, Precipitation, Runoff Depth and Glacier Mass Balance Changesper Decade
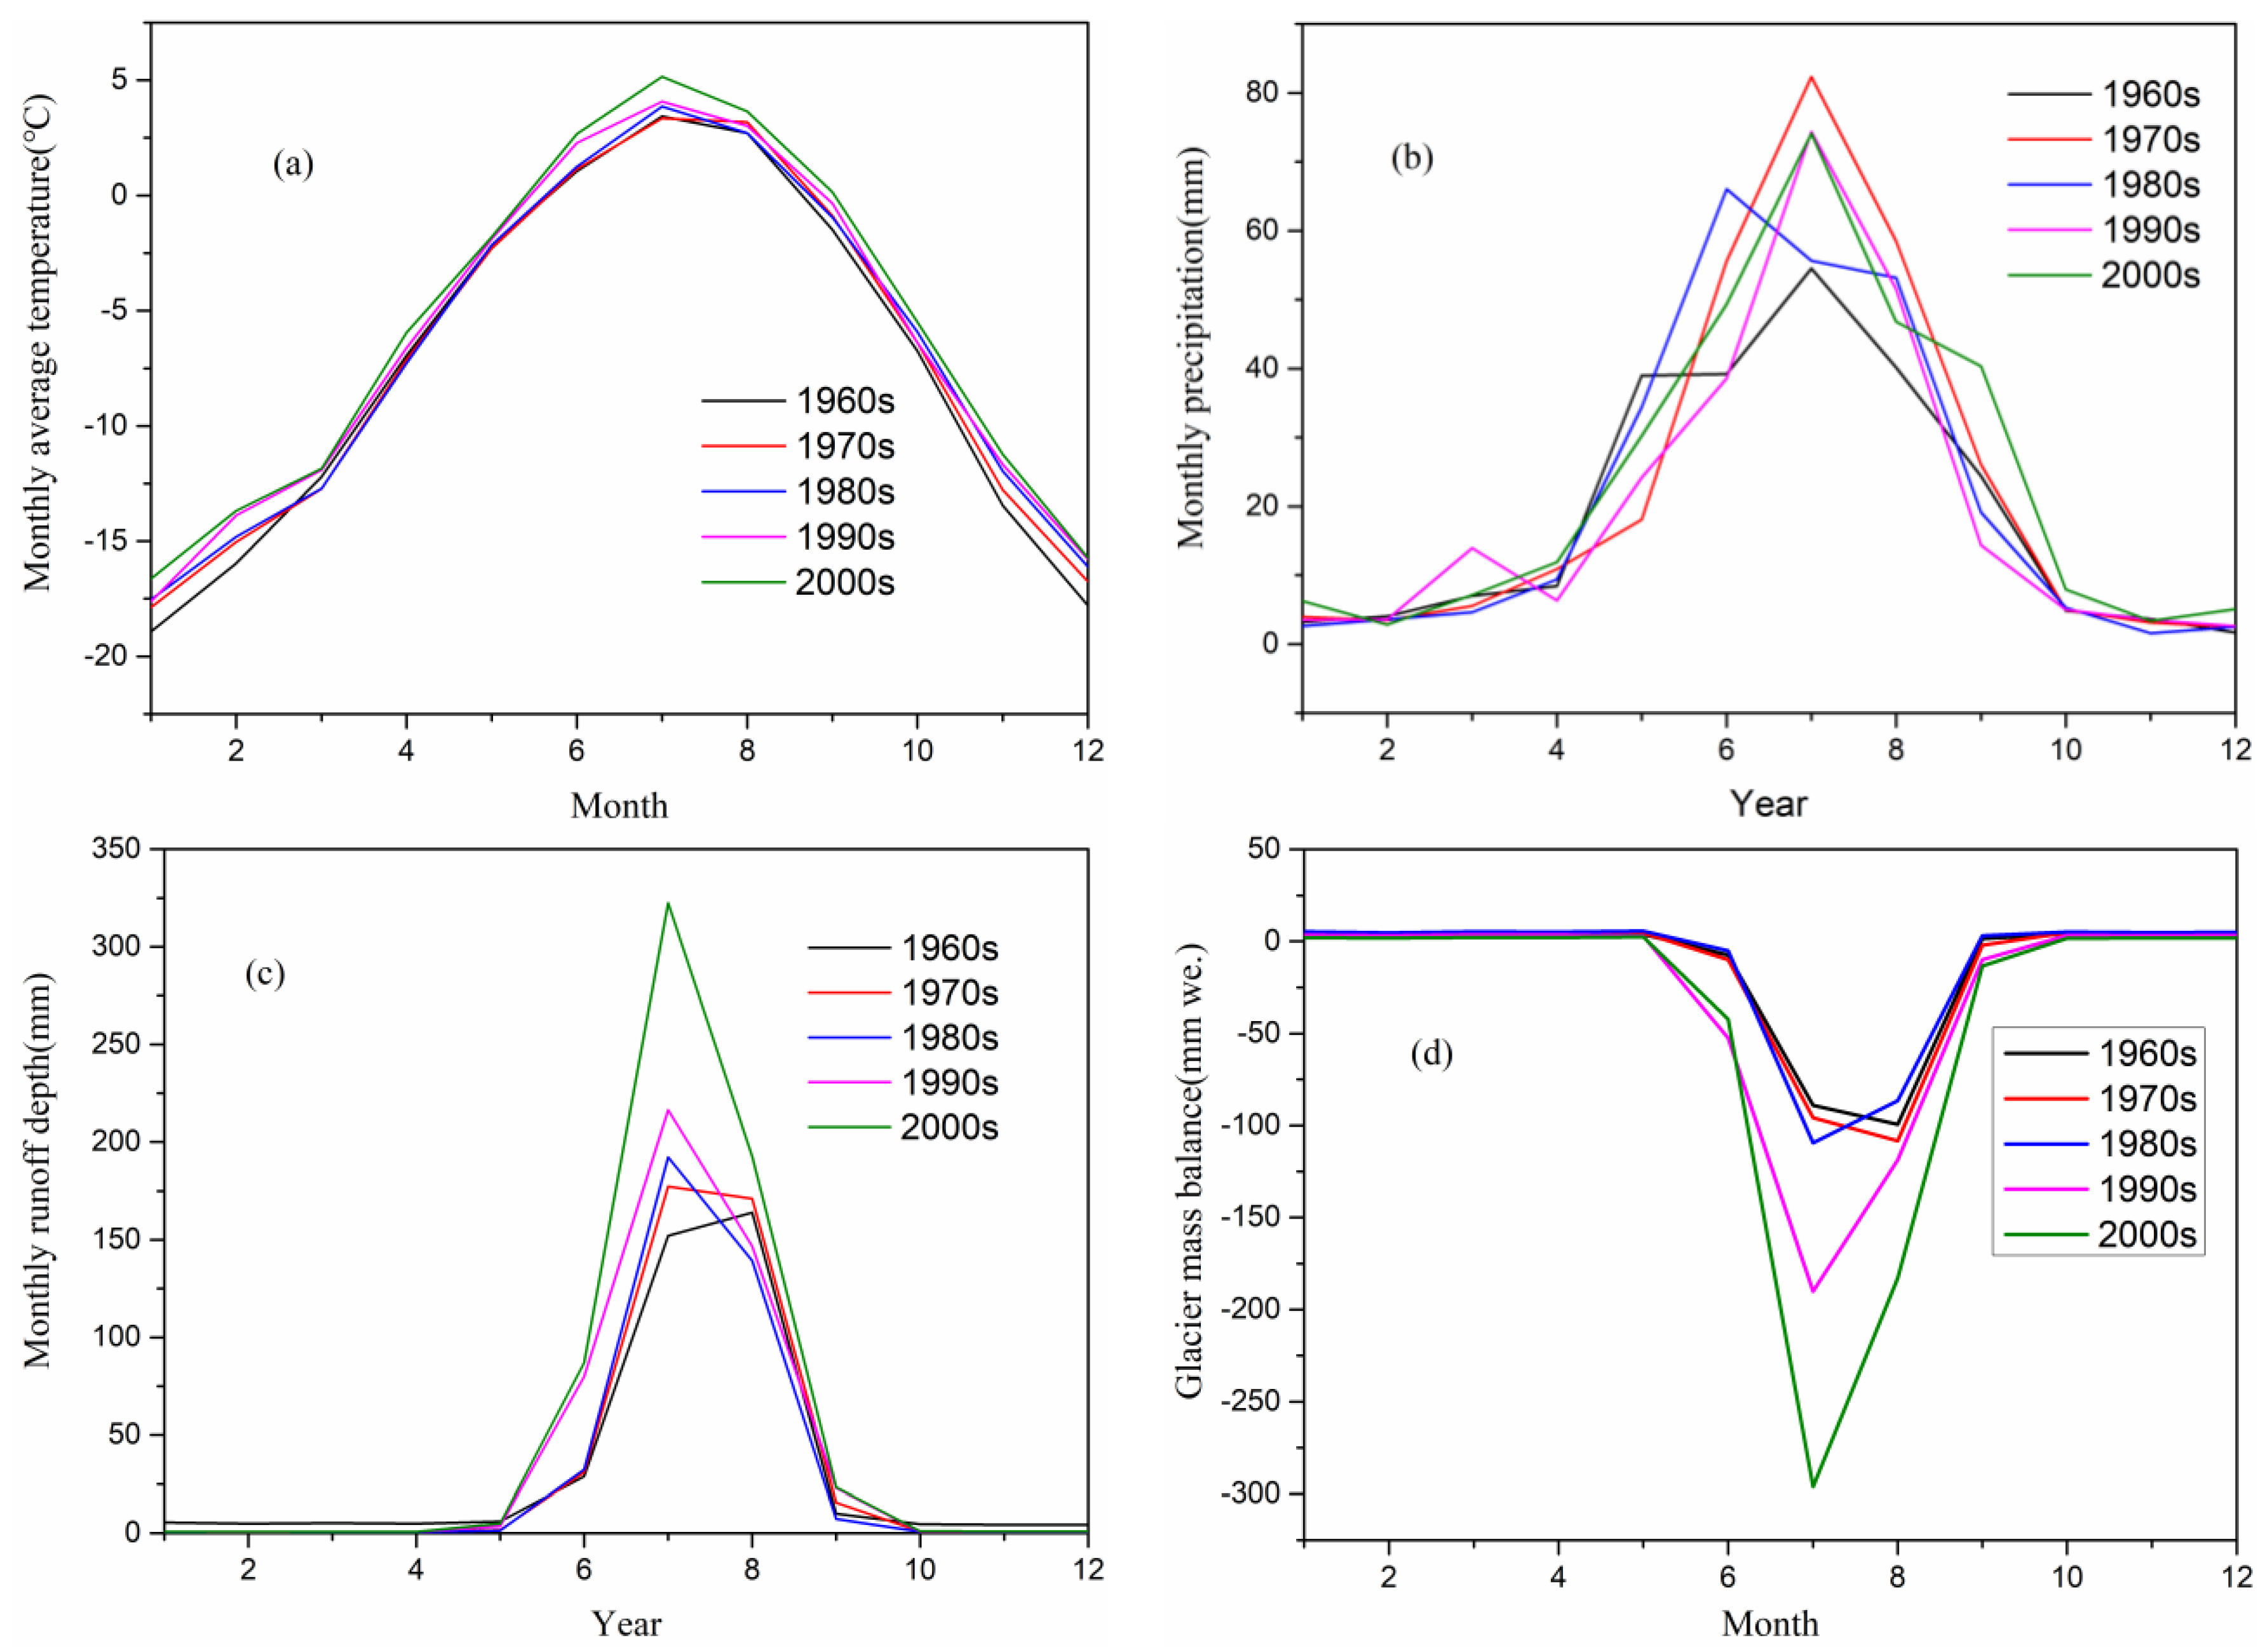
Temperature determines the melting and precipitation determines the accumulation of glaciers [40]. The temperature of each month shows an upward trend from 1959 to 2015, especially in June, July, August, and January, February, and December. In other words, the increase of temperature in summer (high-temperature season) and winter (low-temperature season) is larger than for the rest month of the year (Figure 11a). The precipitation in the 2000s has increased relative to the 1960s, especially in June, July, and August (Figure 11b). Under the overall influence of air temperature and precipitation, the runoff depth is bound to dramatically increase in June, July, and August from 1959 to 2015 in the LHGB (Figure 11c). The surface glacier mass balance becomes more negative in June, July, and August the 1960s to the 2000s (Figure 11d). An interesting phenomenon is that the average peak flow occurred in August in the 1960s. However, with an earlier snow- and ice-melt, the peak flow now occurs in July.
4.4. Sensitivity Analysis
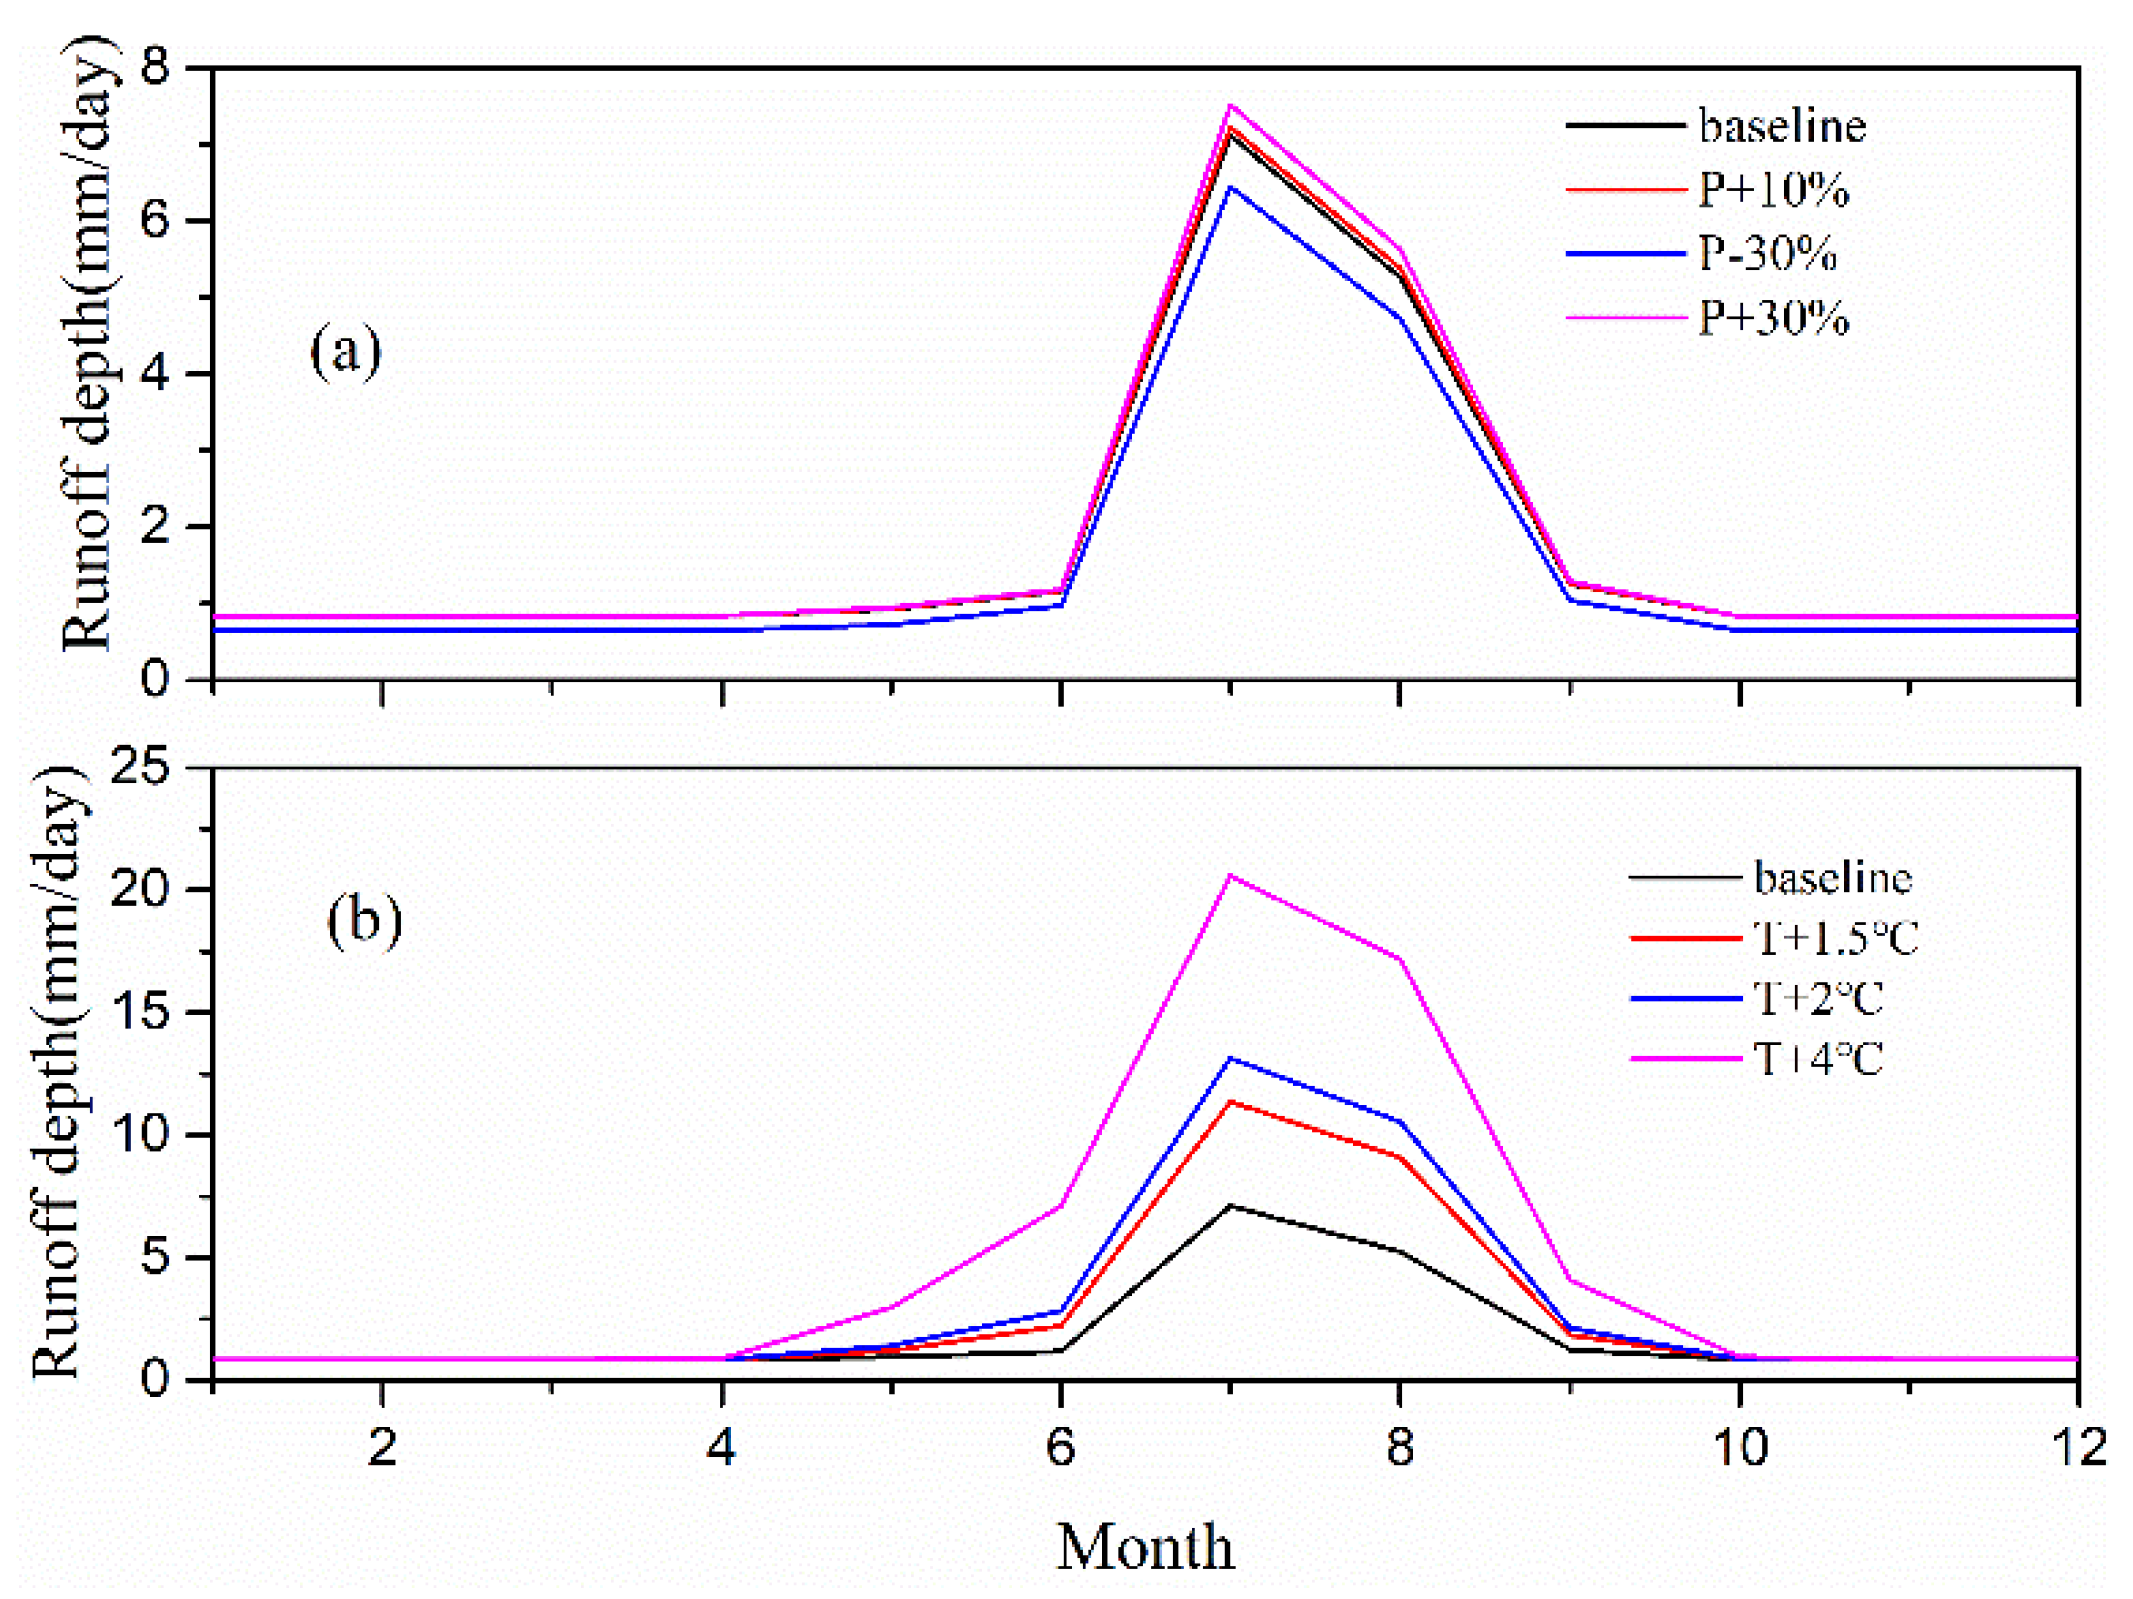
In order to estimate possible hydrological responses to climate change, a sensitivity analysis involving three steps of temperature, precipitation, and glaciers area changes was performed. The temperature was assumed to increase by 1.5 °C, 2 °C, and 4 °C for each day, based on the Fifth Assessment Report of the Intergovernmental Panel on Climate Change [41] and the Paris Climate Change Agreement [42] (the upper limit of acceptable warming that signatory countries committed to in the Paris Agreement is 2 °C), respectively. Precipitation is increased by 10%, 20%, and 30% on each day, the daily runoff depth was modelled, respectively.
Using precipitation as the only changed input variable to the model, the average annual runoff increases by 1.2%, and 3.9% as compared with the average annual runoff of the baseline after precipitation rises by 10% and 30%, respectively, while precipitation decreases by 30%, average annual runoff decreases by 14.4% compared with the average annual runoff of the baseline. When precipitation decreased, the runoff in each month decreased slightly. When precipitation rises, increased runoff mainly occurred in ablation period (June, July, and August), runoff does not show a significant increase as well (Figure 12a, Table 5). This is mainly due to the runoff that is controlled by temperature in LHGB where the glacier area ratio is high. When the altitude is above the altitude of the threshold air temperature, precipitation exists only in the form of solid precipitation. Another important reason is that a part of the liquid precipitation in the non-glacial areas evaporated, these two parts of the precipitation has limited contribution to the runoff. In high altitude areas where temperature never exceeded the threshold, snowfall accumulated and never melted. The phenomenon that glaciers, wind, and avalanches transport the snowfall to lower elevations, where melt conditions exist. However, these processes could not be considered in the model, they contribute to the surprisingly small runoff increase.
If using temperature as the only changed input variable to the model, the average annual runoff increases by 46.6%, 66.8%, and 169.0% when compared with the average annual runoff of the baseline, respectively, after the temperature increases by 1.5 °C, 2 °C, 4 °C. It is worth noting that the change of peak flow (July) is more drastic during the year. In the context of three sensitivity tests, the peak runoff increased by 59.9%, 84.6%, and 189.1% as compared with the peak runoff of the baseline, respectively (Figure 12b, Table 5).
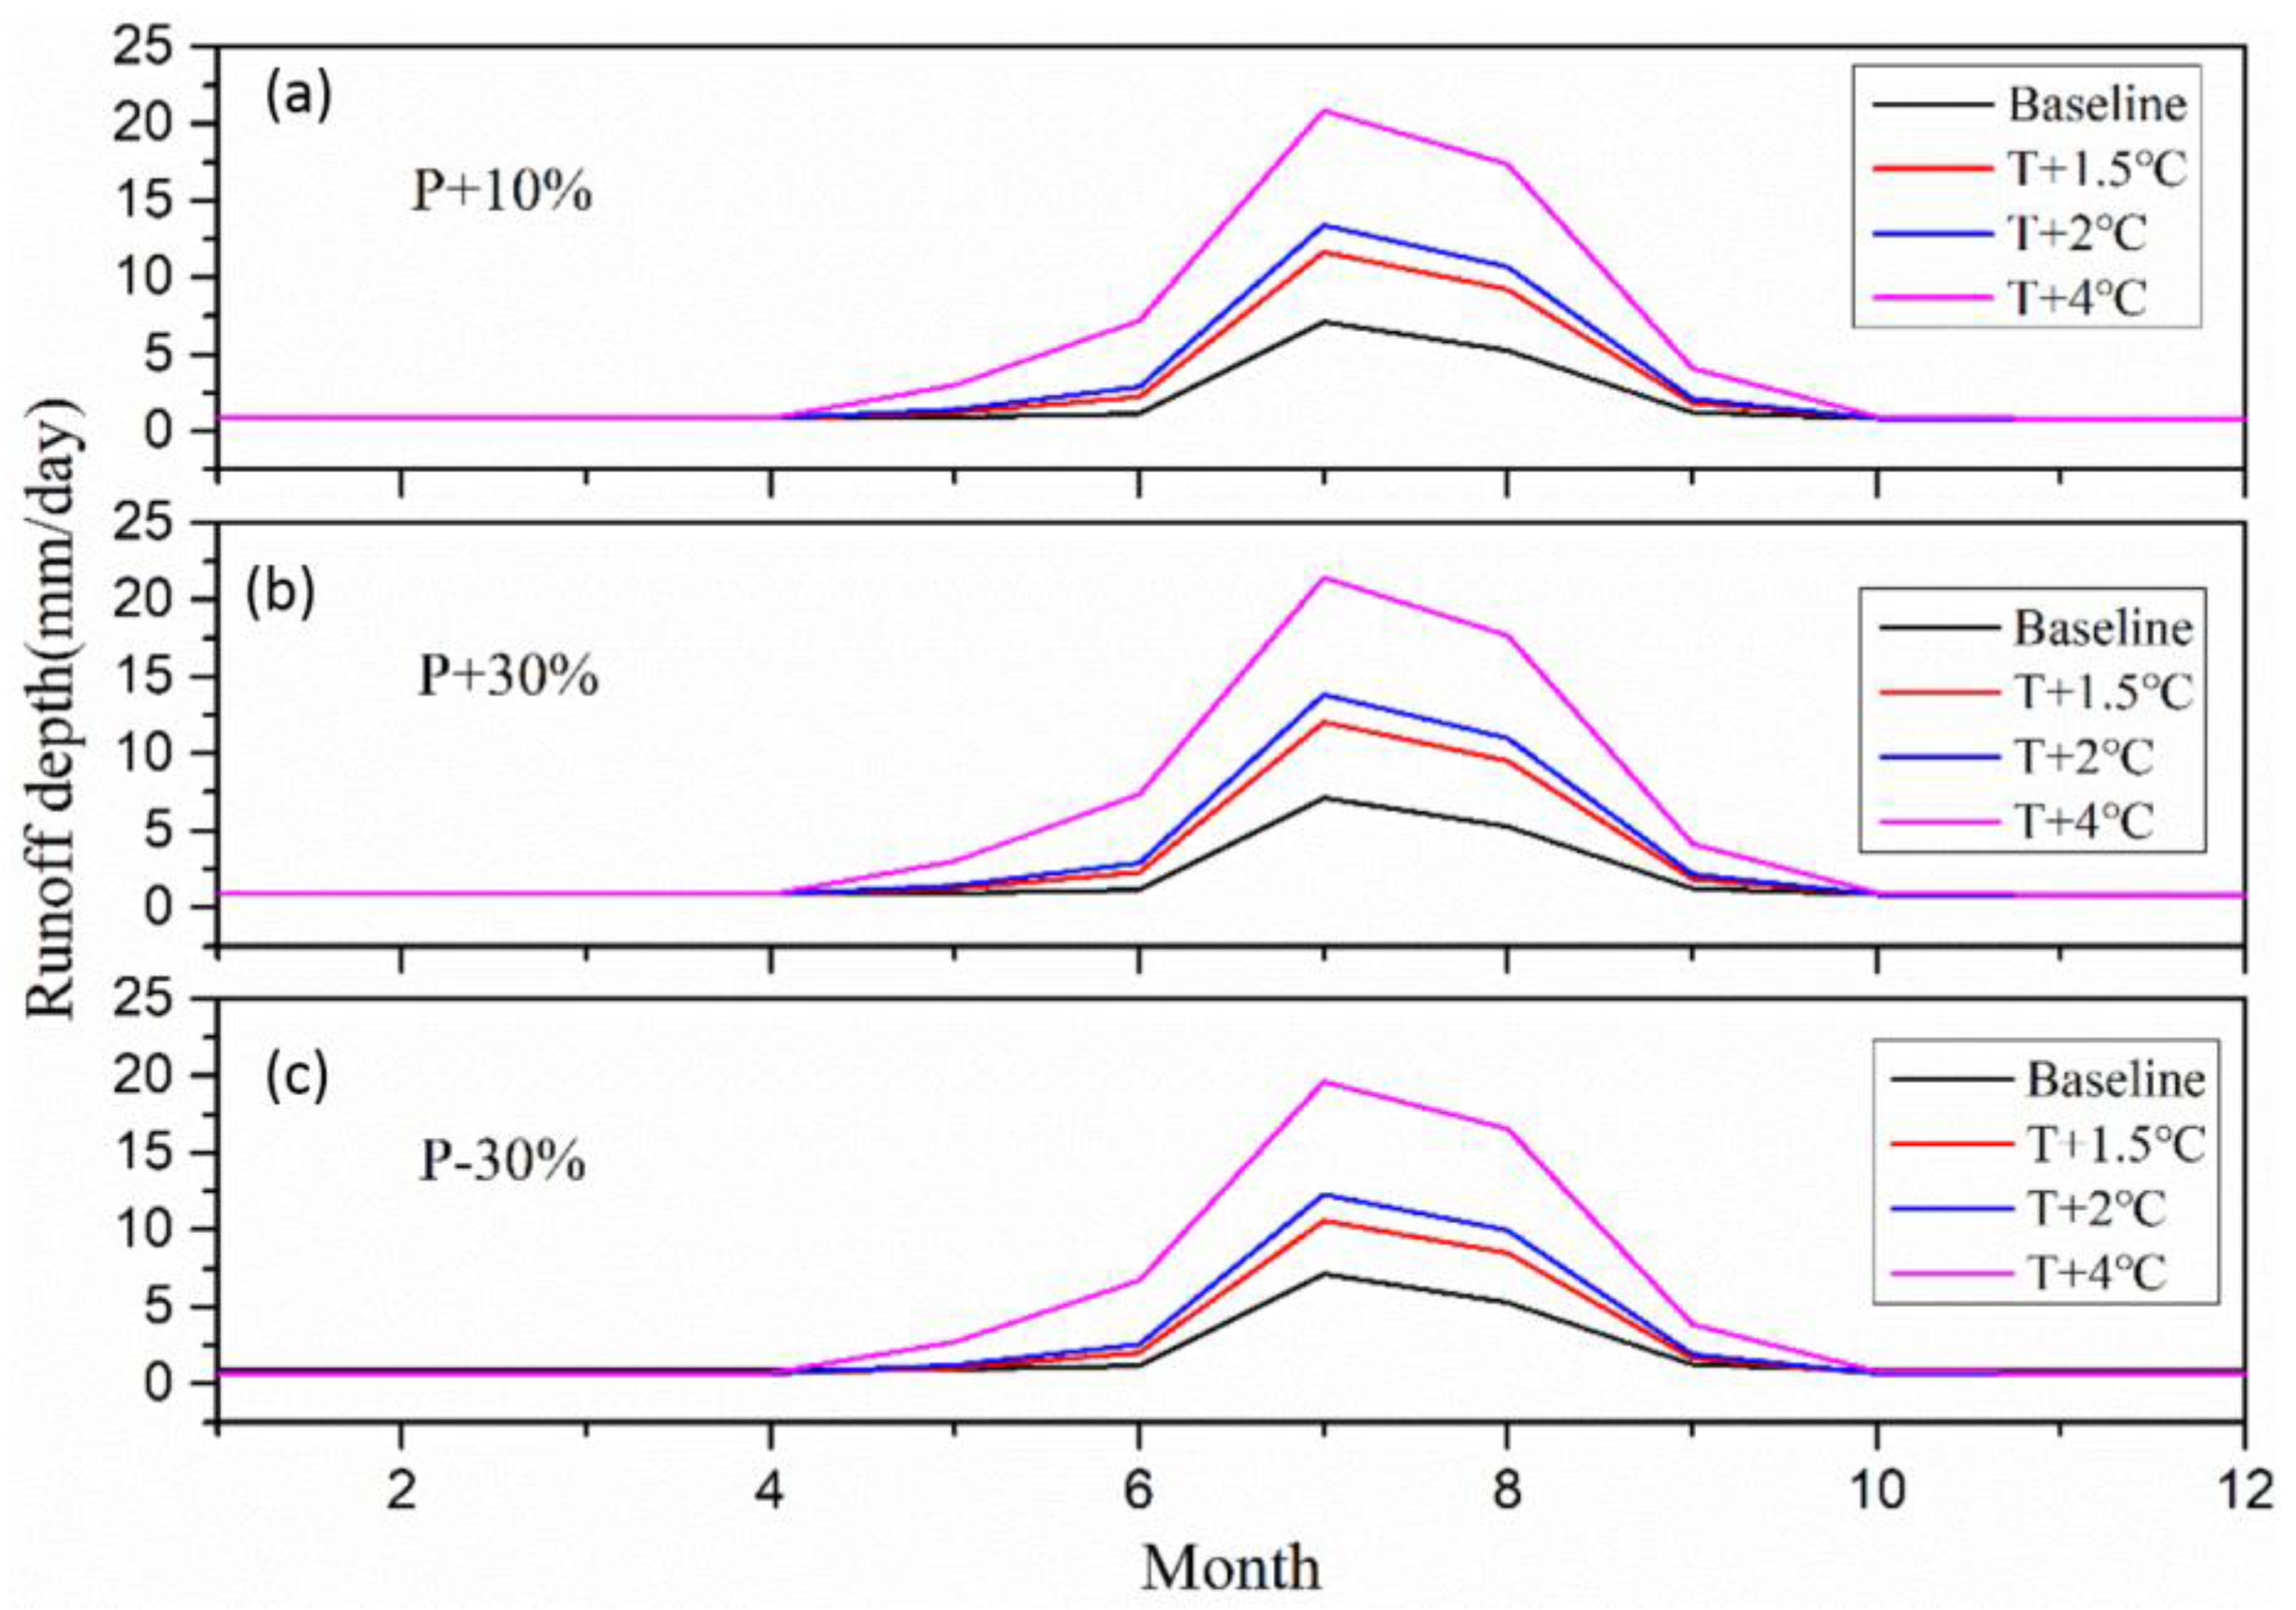
By combining the variations of temperature and precipitation sensitivities, it was concluded that the runoff in Laohugou basin is mainly controlled by glacier ablation under the influence of temperature. The contribution of precipitation to runoff was limited. When the temperature rises, the contribution of precipitation to runoff also increases, because the increase of temperature increases the ratio of liquid precipitation and the contribution of precipitation to runoff. A precipitation increases of 30%, combined with a temperature rise of 1.5 °C, 2 °C, and 4 °C cause a runoff surplus of 52.6%, 73.0%, 177.2% compared with the average annual runoff of the baseline, respectively. A precipitation decrease by 30%, combined with a temperature rise of 1.5 °C, 2 °C, and 4 °C cause a runoff increase by 31.4%, 51.0%, and 151.3% as compared with the average annual runoff of the baseline, respectively (Figure 13, Table 6).
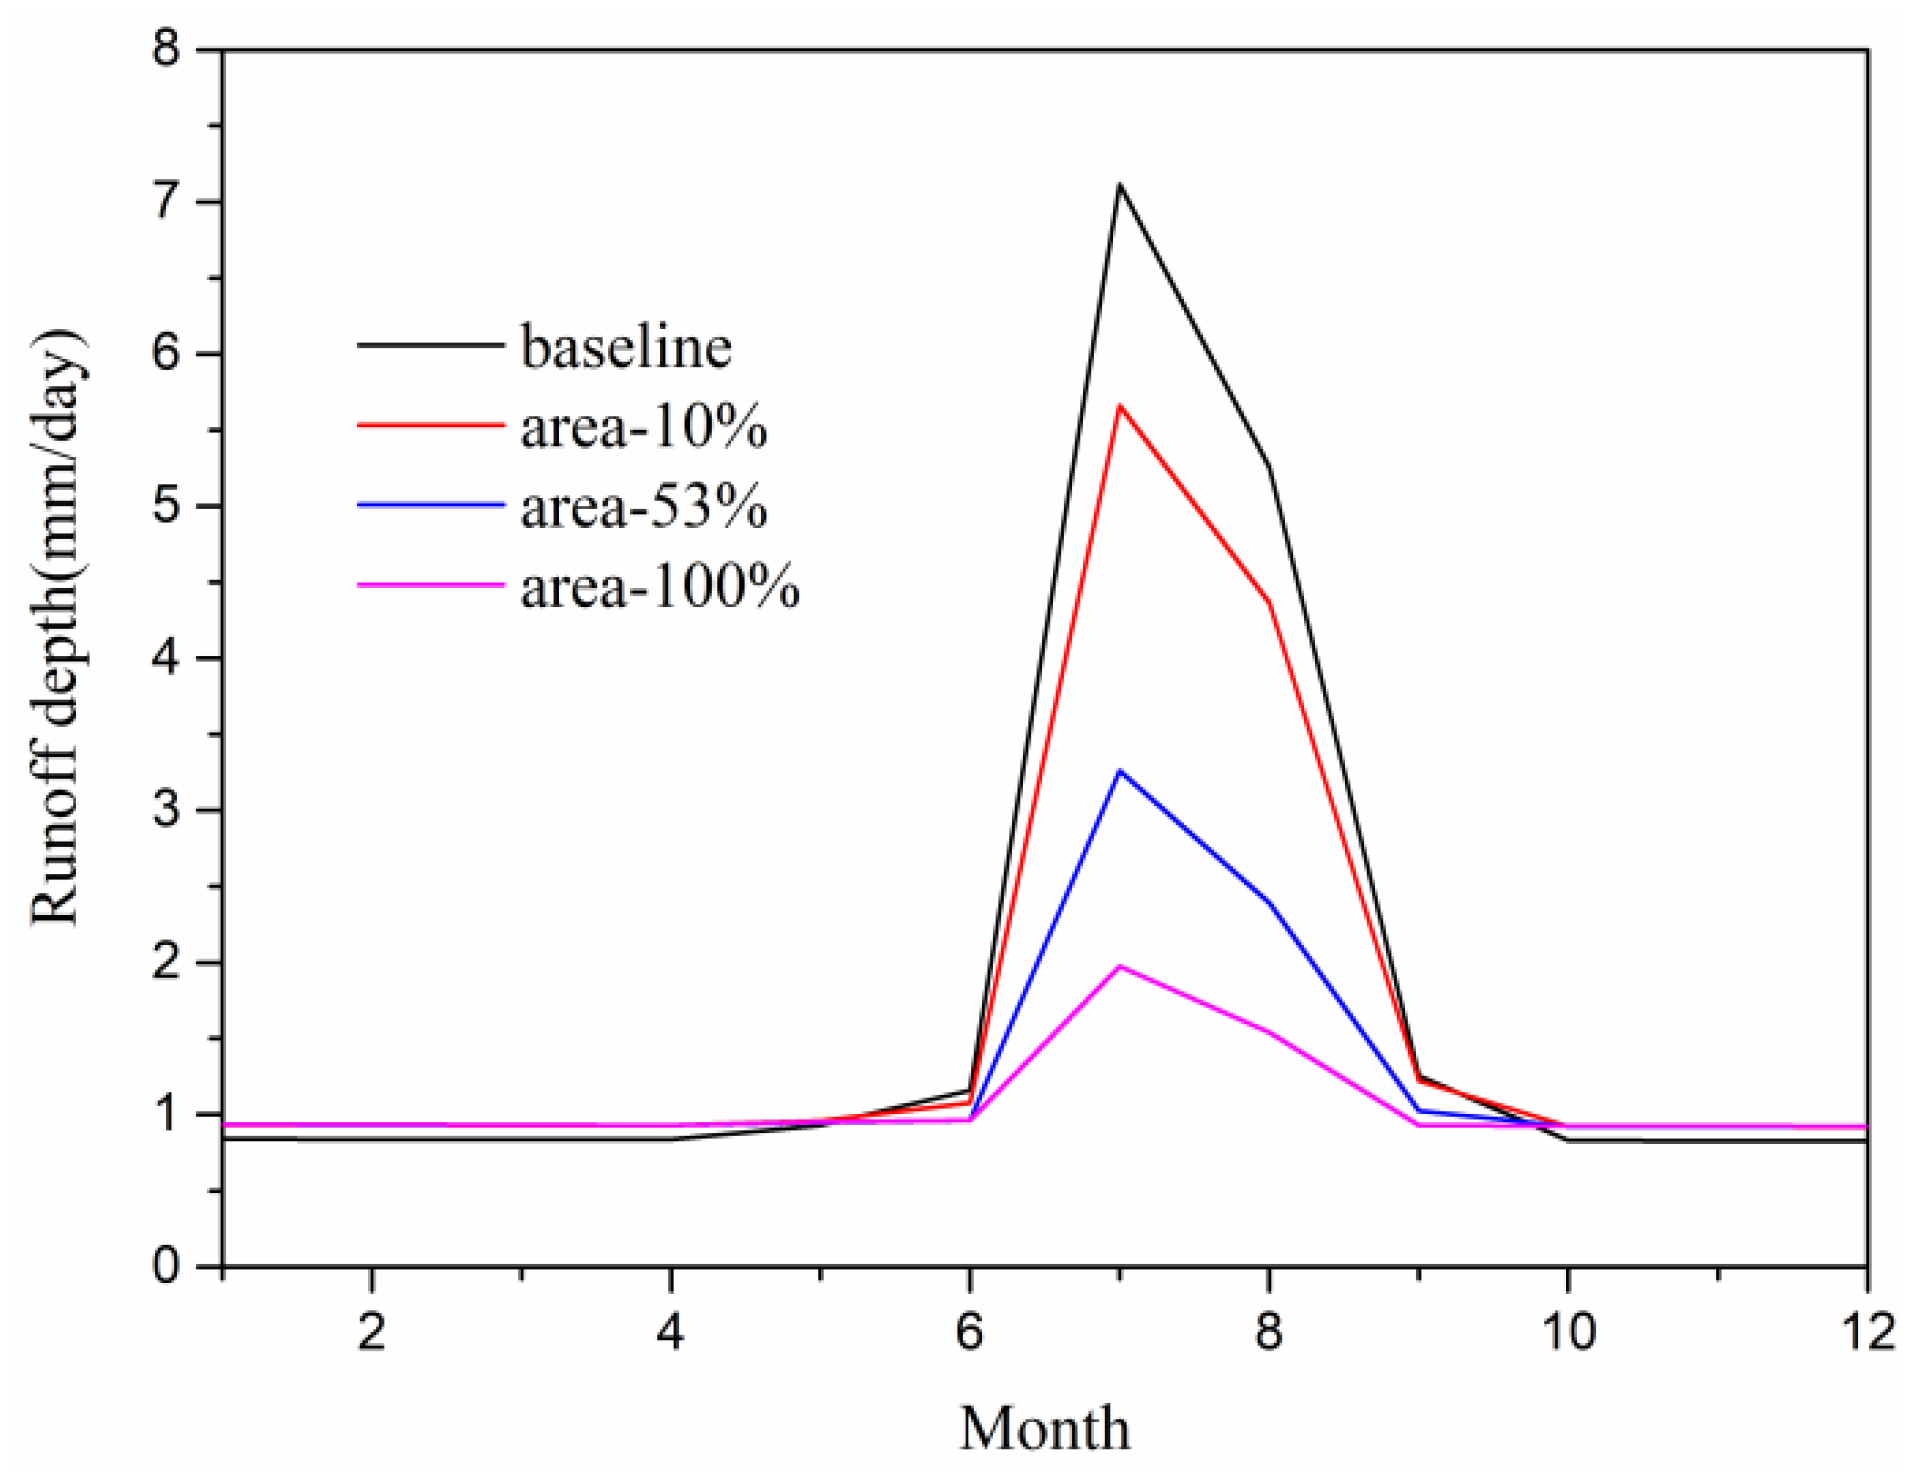
With the global warming, glaciers continue to retreat and the area of glaciers is sharply reduced, the retreat of glaciers is bound to cause changes in glacier runoff with glacier melt water as its supply source [43]. In order to study the influence of glacier area change on runoff depth, the sensitivity of runoff depth to changes of glacier area in the LHGB was carried out.
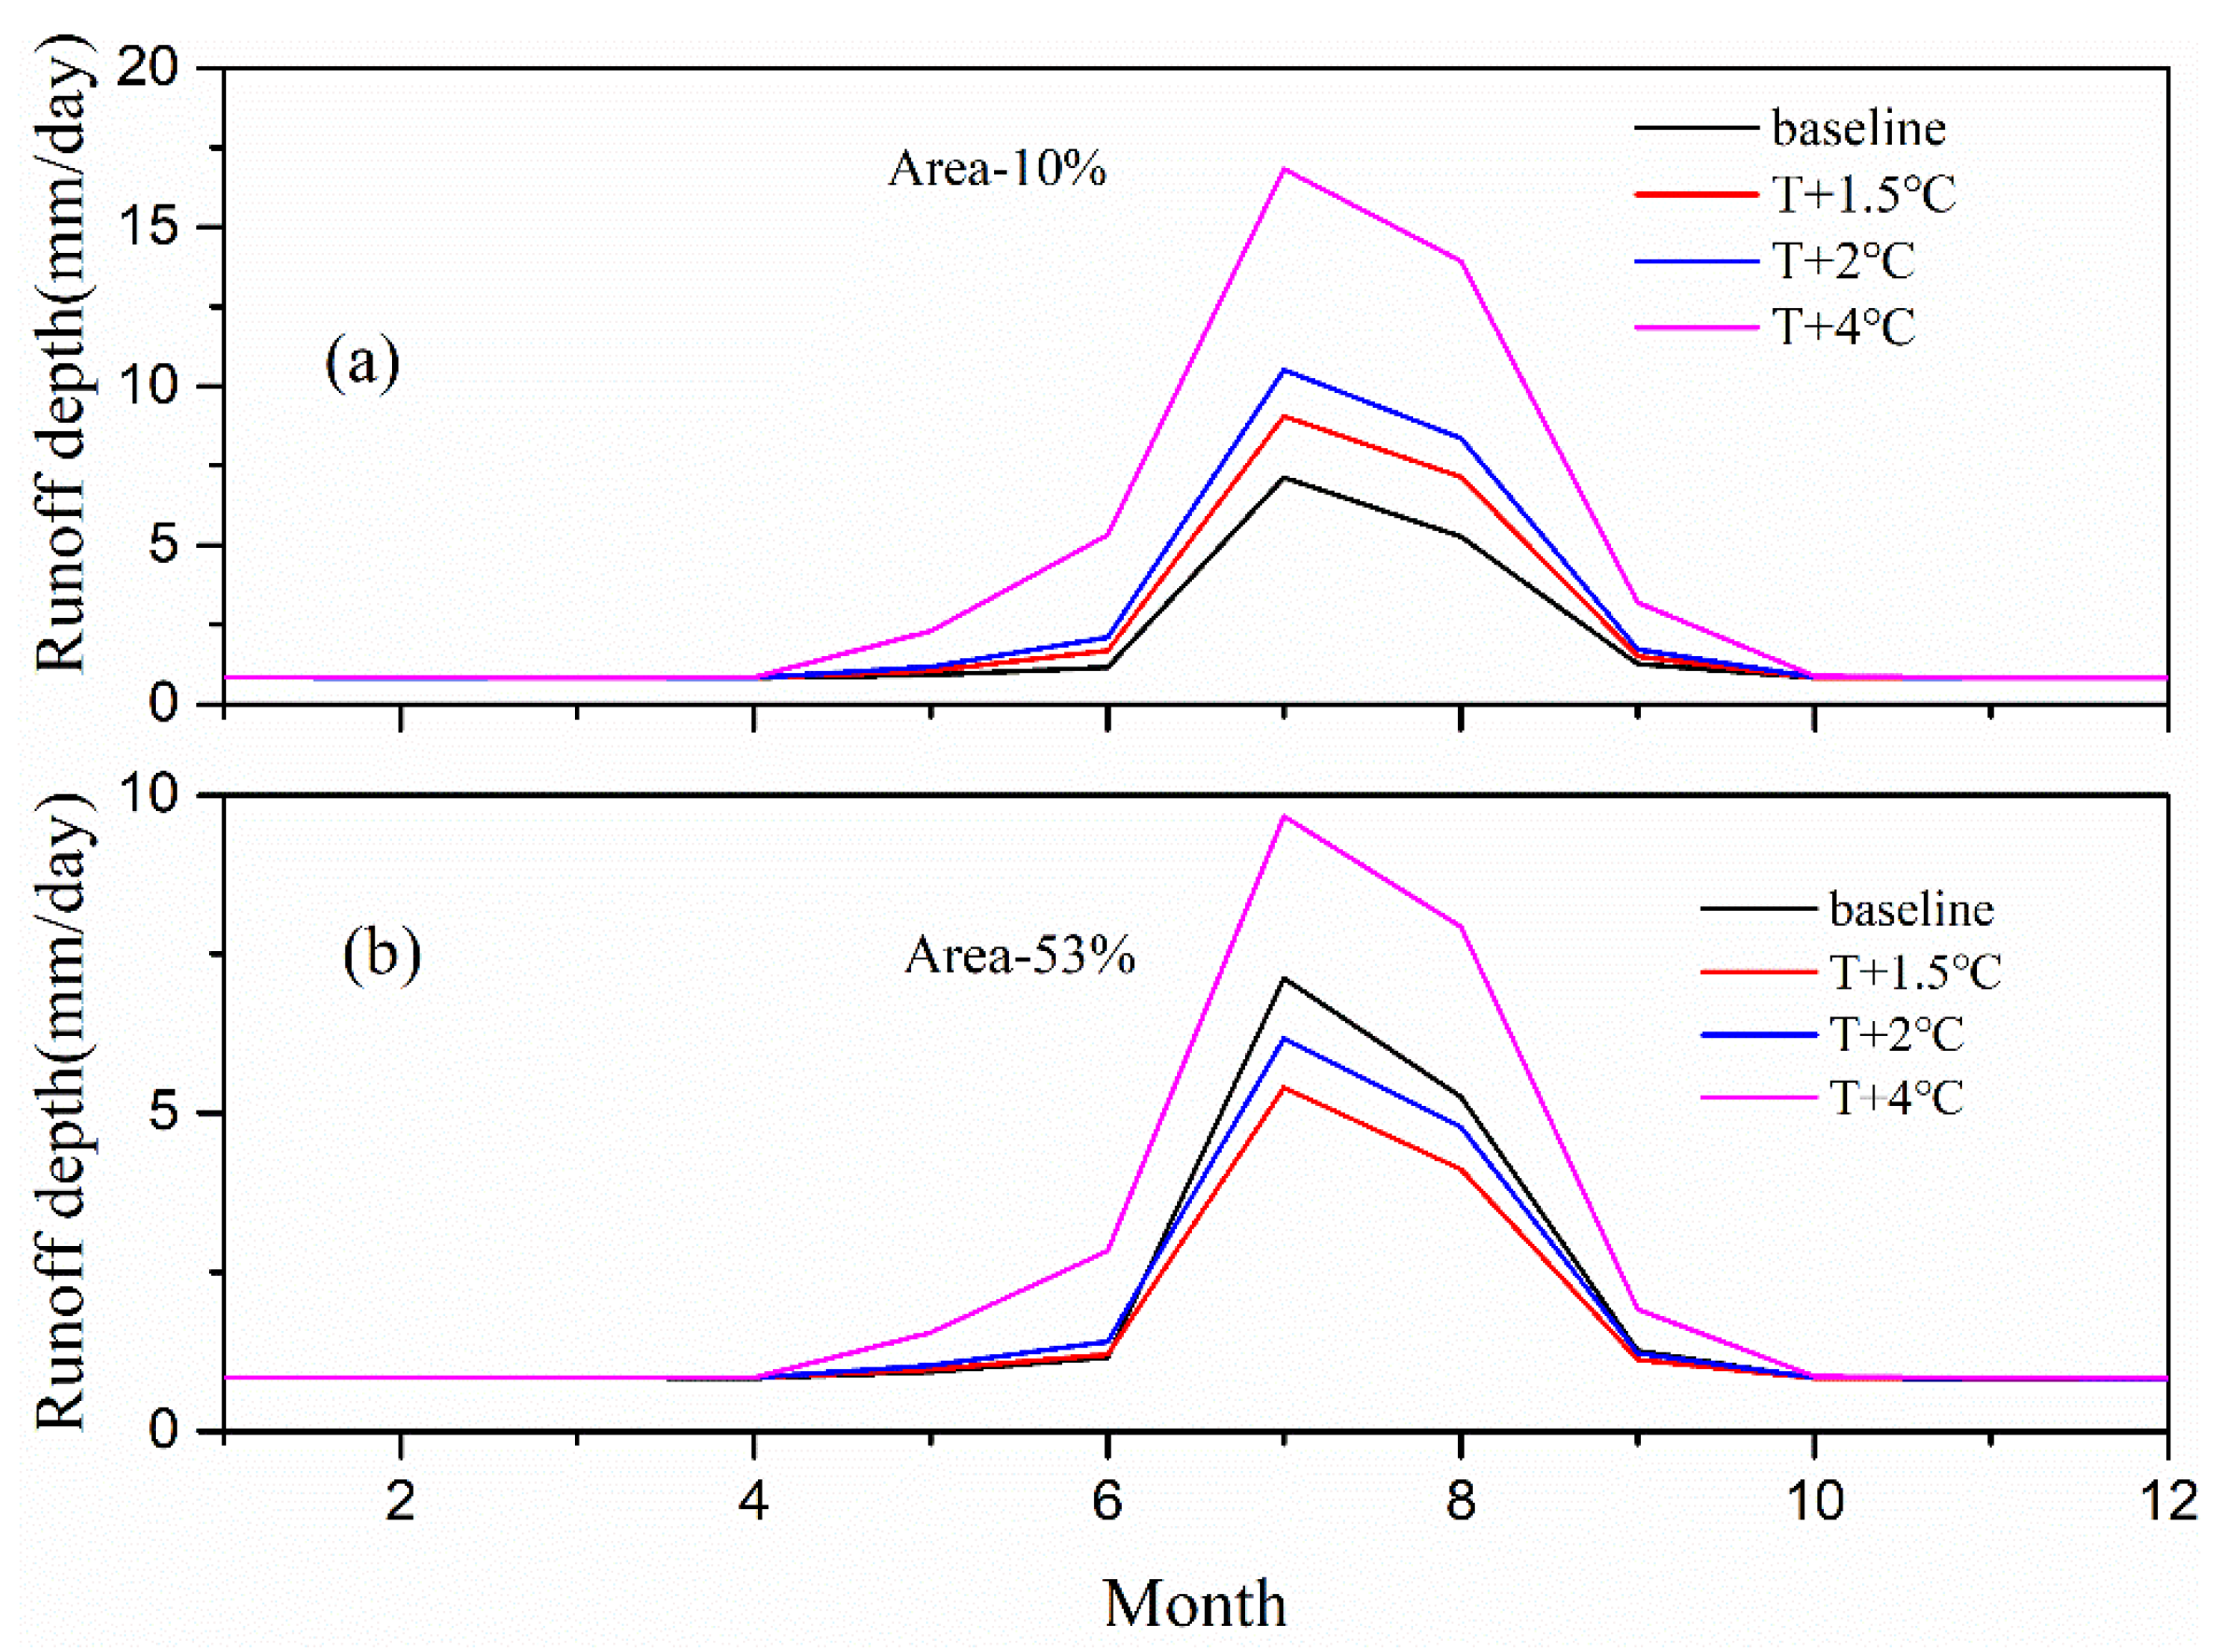
The monthly runoff depth under three glacier area scenarios was simulated by HBV model. When the glacier area decreased by 10% to 100% (10% characterizing glacier area below 4700 m a.s.l., 53% characterizing glacier area that is below 5000 m a.s.l., 100%), the major decrease in runoff occurred from July to August (Figure 14). Runoff decreased slightly in May and September, while increased slightly from September to June (Figure 14). When the glacier area decreased by 10% to 100% (10%, 53%, 100%), the peak runoff decreased by 20.4%, 54.2%, and 72.3% as compared with the peak runoff of the baseline, respectively (Figure 14, Table 7). It shows that the contribution of glacier ablation can even reach about 70% in July in LHGB. This means that with the decrease of glacier area to a certain extent, the runoff depth during the melting period will decrease sharply in watersheds with high glacier melt water supply during ablation season. With the further increase in temperature and the continuous decrease in glacier area, the peak regulation and compensation effect of glaciers may decrease [44]. Water resources in arid and semi-arid regions will be in risk.
By combining the variations of glacier area and temperature changes sensitivities, it was found that a glacier area decrease by 10% can be compensated for by a 1.5 °C warming in terms of runoff. When the glacier area decreased by 53%, a warming of 4 °C is necessary to compensate the area loss (Figure 15).
5. Discussion
We discuss the main uncertainties of the results in the following section. Uncertainties were considered in (1) the reconstructed temperature and precipitation; (2) the glacier area change; and, (3) the HBV model parameterization. Although we recognize that there is also uncertainty in the observed data, it is not considered in this study.
In this paper, temperature and precipitation were reconstructed using IDW and polynomial regression based on gradients in the LHGB from 1959 to 2015. The reconstructed temperature is more accurate than the reconstructed precipitation, because altitude is the most important influence factor of mountain temperature. We have fully considered this factor in the reconstruction process [45]. Precipitation in mountainous areas is affected by many factors, such as aspect, slope, elevation, and surface conditions [46]. Only the impact of altitude is taken into account, other factors have not been considered. It can be seen that in small watersheds where the glaciers cover more than 60%, the impact of temperature on runoff is much greater than the effect of precipitation on runoff.
The glacier area has changed over more than the past 50 years, the change of glacier area also has effect on the simulation [9]. Using a constant glacier area for runoff simulation will also introduce uncertainties. Therefore, we used sensitivity analysis under different glacier areas to estimate the uncertainties. Based on the First and Second Chinese Glacier Inventory, the loss of Glacier area is 8.9%. The impact of this area loss is more pronounced during the period of maximum runoff. According to the sensitivity analysis of glacier area change, the total runoff decreases by 8.4% and the peak flow decrease by 20.4% when the glacier area decreases by 10%. Therefore, we determine that the glacier area change has relatively small effect on total runoff simulation, while it has a larger effect on the peak runoff (July) in the simulation period.
The model parameters have different values in different regions, and change with time. The temperature and precipitation gradients were chosen single values for the convenience of the simulation; we did not take their spatial distribution into account. In fact, they have significant differences on different time scales and different altitudes. The gradients of temperature and precipitation in different months also show large differences [47]. Due to the limited data availability, it is impossible to obtain the temporal and spatial variations of Pg and Tg, which makes the simulation uncertain. The degree-day factor (DDF) is the most critical parameter in the temperature index model. The DDF shows differences in different spatial and temporal scales [48]. Because the effect of radiation on the glacial melting is not taken into consideration, the accuracy of ablation simulated by the DDF model decreases with increasing time resolution [49]. Since we do not know how model parameters will change over space and time, we assume that they do not change at all. This simplification introduces uncertainty. However, in the simulation of this study, the values of the DDF is constant. In general, our results should not be regarded as projections, but we have confidence that we have pointed into the right direction.
6. Conclusions
In this study, by simulating runoff using the HBV-light model for the LHGB in the upstream area of the Shule River basin, the long-term annual and monthly runoff depths from 1959 to 2015, and the sensitivities of runoff under different temperature, precipitation, and glacier area variations in the LHGB were analyzed. Our main findings are as follows.
In the past 51 years, the climate in Laohugou glacier basin revealed a trend towards warm and wet. As the runoff is mainly controlled by glacier melt that is caused by the rise in temperature, glacier runoff continues to increase and glacier mass balance is negative overall. Runoff depth was found to increased at 5.7 mm·a−1 (p < 0.01), the modelled glacier mass balance was −280.5 mm·a−1, the glaciers totally thinned 17.55 m w.e. from 1959 to 2015 in LHGB. With the increase of temperature, the contribution of precipitation to runoff increases simultaneously, which shows that the ratio of liquid precipitation will definitely increase with the further rise of temperature. With increase of temperature, the change of peak discharge is more severe than that of annual discharge, the possible crisis is the weakening of the glacier’s buffer effect on the drought in arid and semi-arid areas. It is found that an increase of 30% of precipitation could not offset the amount of glacier melt that is caused by the 1.5 °C increase in temperature. In the future climate, the function of glaciers in compensating a potential low flow and regulating peak flow will be weakened in the critical months.
For this region, several aspects of simulation need to be further improved, mainly including the use of space variable parameters and the dynamic development of glacier area change. In general, HBV model is a very good simulation tool for small watersheds with high glacier coverage, such as LHGB.
Author Contributions
X.Q. directed the article; Y.L. collected data; C.X. directed the method; X.Z. analyzed the data and wrote the paper.
Funding
This work is supported by the Project from the National Foundational Scientific and Technological Work Programs of the Ministry of Science and Technology of China (Grant No. 2013FY111400), the Chinese Academy of Sciences (KJZD-EW-G03-01), and the National Natural Science Foundation of China (41371091, 41690145, and 41671058).
Acknowledgments
We are very grateful to Jan Seibert for providing the HBV-light model. I also thank others for their suggestions and help. The authors thank all editors and anonymous reviewers very much for their valuable comments and suggestions.
Conflicts of Interest
The authors declare no conflict of interest.
References
- Intergovernmental Panel on Climate Change. Climate Change 2014 Synthesis Report. Environ. Policy Collect. 2014, 27, 408. [Google Scholar]
- Field, C.B.; Barros, V.R.; Mach, K.; Mastrandrea, M. Climate Change 2014: Impacts, Adaptation, and Vulnerability; Contribution of Working Group II to the Third Assessment Report; Cambridge University Press: Cambridge, UK, 2014; Volume 19, pp. 81–111. [Google Scholar]
- You, Q.L.; Min, J.Z.; Kang, S.C. Rapid warming in the Tibetan Plateau from observations and CMIP5 models in recent decades. Int. J. Climatol. 2016, 36, 2660–2670. [Google Scholar] [CrossRef]
- Qin, X.; Chen, J.Z.; Wang, S.J.; Sun, W.J.; Du, W.T.; Liu, Y.S. Reconstruction of surface air temperature in a glaciated region in the western Qilian Mountains, Tibetan Plateau, 1957–2013 and its variation characteristics. Quat. Int. 2015, 371, 22–30. [Google Scholar] [CrossRef]
- Immerzeel, W.W. Climate change will affect the Asian water towers. Science 2010, 328, 1382–1385. [Google Scholar] [CrossRef] [PubMed]
- Zhang, Y.; Hirabayashi, Y.; Liu, Q.; Liu, S.Y. Glacier runoff and its impact in a highly glacierized catchment in the southeastern Tibetan Plateau: Past and future trends. J. Glaciol. 2017, 61, 713–730. [Google Scholar] [CrossRef]
- Pelto, M.S. Impact of Climate Change on North Cascade Alpine Glaciers, and Alpine Runoff. Northwest Sci. 2009, 82, 65–75. [Google Scholar] [CrossRef]
- Huss, M.; Farinotti, D.; Bauder, A.; Funk, M. Modelling runoff from highly glacierized alpine drainage basins in a changing climate. Hydrol. Process. 2008, 22, 3888–3902. [Google Scholar] [CrossRef]
- Huss, M. Present and future contribution of glacier storage change to runoff from macroscale drainage basins in Europe. Water Resour. Res. 2011, 47, W07511. [Google Scholar] [CrossRef]
- Van Tiel, M.; Teuling, A.J.; Wanders, N.; Vis, M.J.P.; Stahl, K.; Van Loon, A.F. The role of glacier changes and threshold definition in the characterisation of future streamflow droughts in glacierised catchments. Hydrol. Earth Syst. Sci. 2018, 22, 463–485. [Google Scholar] [CrossRef] [Green Version]
- Wang, Y.J. Influence of climate change and human activity on water resources in arid region of Northwest China: An overview. Adv. Clim. Chang. Res. 2017, 8, 268–278. [Google Scholar] [CrossRef]
- Stokes, C.R.; Shahgedanova, M.; Evans, I.S.; Popovnin, V.V. Accelerated loss of alpine glaciers in the Kodar Mountains, south-eastern Siberia. Glob. Planet. Chang. 2013, 101, 82–96. [Google Scholar] [CrossRef] [Green Version]
- Barnett, T.P.; Adam, J.C.; Lettenmaier, D.P. Potential impacts of a warming climate on water availability in snow-dominated regions. Nature 2005, 438, 303–309. [Google Scholar] [CrossRef] [PubMed]
- Guo, W.Q.; Liu, S.Y.; Xu, J.L.; Wu, L.Z.; Shangguan, D.H.; Yao, X.J.; Wei, J.F.; Bao, W.J.; Yu, P.C.; Liu, Q. The second Chinese glacier inventory: Data, methods and results. J. Glaciol. 2015, 61, 357–372. [Google Scholar] [CrossRef]
- Yan, F.P.; Kang, S.C.; Li, C.L.; Zhang, Y.L.; Qin, X.; Li, Y.; Zhang, X.P.; Hu, Z.H.; Chen, P.F.; Li, X.F. Concentration, sources and light absorption characteristics of dissolved organic carbon on a typical glacier, the northeastern Tibetan Plateau. Cryosphere 2016, 10, 2611–2621. [Google Scholar] [CrossRef]
- Shi, Y.F.; Liu, C.H.; Kang, E. The Glacier Inventory of China. Ann. Glaciol. 2010, 50, 1–4. [Google Scholar] [CrossRef]
- Yang, Z.N. Chinese glacier water resources. Resour. Sci. 1987, 9, 46–55. [Google Scholar]
- Beven, K. A sensitivity analysis of the Penman-Monteith actual evapotranspiration estimates. J. Hydrol. 1979, 44, 169–190. [Google Scholar] [CrossRef]
- Gao, H.K.; He, X.B.; Ye, B.S.; Pu, J.C. Modeling the runoff and glacier mass balance in a small watershed on the Central Tibetan Plateau, China, from 1955 to 2008. Hydrol. Process. 2012, 26, 1593–1603. [Google Scholar] [CrossRef]
- Xu, M.; Han, H.D.; Kang, S.C. Modeling Glacier Mass Balance and Runoff in the Koxkar River Basin on the South Slope of the Tianshan Mountains, China, from 1959 to 2009. Water 2017, 9, 100. [Google Scholar] [CrossRef]
- Nash, J.E.; Sutcliffe, J.V. River flow forecasting through conceptual models part I—A discussion of principles. J. Hydrol. 1970, 10, 282–290. [Google Scholar] [CrossRef]
- Roth, A.; Hock, R.; Schuler, T.V.; Bieniek, P.A.; Pelto, M.; Aschwanden, A. Modeling Winter Precipitation Over the Juneau Icefield, Alaska, Using a Linear Model of Orographic Precipitation. Front. Earth Sci. 2018, 6, 20. [Google Scholar] [CrossRef]
- Lindström, G.; Johansson, B.; Persson, M.; Gardelin, M.; Bergström, S. Development and test of the distributed HBV-96 hydrological model. J. Hydrol. 1997, 201, 272–288. [Google Scholar] [CrossRef]
- Seibert, J.; Vis, M.J.P. Teaching hydrological modeling with a user-friendly catchment-runoff-model software package. Hydrol. Earth Syst. Sci. Discuss. 2012, 16, 5905–5930. [Google Scholar] [CrossRef]
- Konz, M.; Seibert, J. On the value of glacier mass balances for hydrological model calibration. J. Hydrol. 2010, 385, 238–246. [Google Scholar] [CrossRef] [Green Version]
- Zhang, Y.; Liu, S.; Ding, Y. Observed degree-day factors and their spatial variation on glaciers in western China. Ann. Glaciol. 2006, 43, 301–306. [Google Scholar] [CrossRef]
- Liu, J.F.; Chen, R.S. Discriminating types of precipitation in Qilian Mountains, Tibetan Plateau. J. Hydrol. Reg. Stud. 2016, 5, 20–32. [Google Scholar] [CrossRef]
- Broeke, M.V.D.; Bus, C.; Ettema, J.; Smeets, P. Temperature thresholds for degree-day modelling of Greenland ice sheet melt rates. Geophys. Res. Lett. 2010, 37, 1480–1493. [Google Scholar] [CrossRef]
- Woo, M.K. Consequences of Climatic Change for Hydrology in Permafrost Zones. J. Cold Reg. Eng. 1990, 4, 15–20. [Google Scholar] [CrossRef]
- Seibert, J. Multi-criteria calibration of a conceptual runoff model using a genetic algorithm. Hydrol. Earth Syst. Sci. 2000, 4, 215–224. [Google Scholar] [CrossRef] [Green Version]
- Seibert, J. Estimation of Parameter Uncertainty in the HBV Model. Hydrol. Res. 2008, 28, 247–262. [Google Scholar] [CrossRef]
- Rango, A. Worldwide testing of the snowmelt runoff model with applications for predicting the effects of climatic change. Hydrol. Res. 1992, 23, 155–172. [Google Scholar] [CrossRef]
- Sexstone, G.A.; Clow, D.W.; Stannard, D.I.; Fassnacht, S.R. Comparison of methods for quantifying surface sublimation over seasonally snow-covered terrain. Hydrol. Process. 2016, 30, 3373–3389. [Google Scholar] [CrossRef]
- Pekárová, P.; Halmová, D. Snow Water Equivalent Measurement and Simulation in Microbasins with Different Vegetation Cover. J. Hydrol. Hydromech. 2009, 57, 88–99. [Google Scholar] [CrossRef]
- Fujita, K.; Ohta, T.; Ageta, Y. Characteristics and climatic sensitivities of runoff from a cold-type glacier on the Tibetan Plateau. Hydrol. Process. 2010, 21, 2882–2891. [Google Scholar] [CrossRef]
- Seibert, J.; Uhlenbrook, S.; Leibundgut, C.; Halldin, S. Multiscale calibration and validation of a conceptual rainfall-runoff model. Phys. Chem. Earth 2000, 25, 59–64. [Google Scholar] [CrossRef]
- Seibert, J. Regionalisation of parameters for a conceptual rainfall-runoff model. Agric. For. Meteorol. 1999, 98–99, 279–293. [Google Scholar] [CrossRef]
- Zemp, M.; Nussbaumer, S.U.; Naegeli, K.; Gärtnerroer, I.; Paul, F.; Hoelzle, M.; Haeberli, W. WGMS 2013. Glacier Mass Balance Bulletin No. 12 (2010–2011); World Glacier Monitoring Service: Zürich, Switzerland, 2013. [Google Scholar]
- Yao, T.D.; Thompson, L.; Yang, W.; Yu, W.S.; Gao, Y.; Guo, X.J.; Yang, X.X.; Duan, K.Q.; Zhao, H.B.; Xu, B.Q. Different glacier status with atmospheric circulations in Tibetan Plateau and surroundings. Nat. Clim. Chang. 2012, 2, 663–667. [Google Scholar] [CrossRef]
- Eekhout, J.P.C.; Hunink, J.E.; Terink, W.; Vente, J.D. Why increased extreme precipitation under climate change negatively affects water security. Hydrol. Earth Syst. Sci. Discuss. 2018, 1–16. [Google Scholar] [CrossRef]
- Stocker, T.F.; Qin, D.H.; Plattner, G.K.; Tignor, M.M.B.; Allen, S.K.; Boschung, J.; Nauels, A.; Xia, Y.; Bex, V.; Midgley, P.M. IPCC 2013: Climate Change 2013: The Physical Science Basis. Contribution of Working Group I to the Fifth Assessment Report of the Intergovernmental Panel on Climate Change. Comput. Geom. 2013, 18, 95–123. [Google Scholar]
- Rogelj, J.; Den, E.M.; Höhne, N.; Fransen, T.; Fekete, H.; Winkler, H.; Schaeffer, R.; Sha, F.; Riahi, K.; Meinshausen, M. Paris Agreement climate proposals need a boost to keep warming well below 2 °C. Nature 2016, 534, 631–639. [Google Scholar] [CrossRef] [PubMed] [Green Version]
- White, C.J.; Tanton, T.W.; Rycroft, D.W. The Impact of Climate Change on the Water Resources of the Amu Darya Basin in Central Asia. Water Resour. Manag. 2014, 28, 5267–5281. [Google Scholar] [CrossRef]
- Huss, M.; Hock, R. Global-scale hydrological response to future glacier mass loss. Nat. Clim. Chang. 2018, 8, 135–140. [Google Scholar] [CrossRef] [Green Version]
- Rolland, C. Spatial and Seasonal Variations of Air Temperature Lapse Rates in Alpine Regions. J. Clim. 2010, 16, 1032–1046. [Google Scholar] [CrossRef]
- Zhang, A.; Shi, H.Y.; Li, T.J.; Fu, X.D. Analysis of the Influence of Rainfall Spatial Uncertainty on Hydrological Simulations Using the Bootstrap Method. Atmosphere 2018, 9, 71. [Google Scholar] [CrossRef]
- Van Beusekom, A.E.; González, G.; Rivera, M.M. Short-Term Precipitation and Temperature Trends along an Elevation Gradient in Northeastern Puerto Rico. Earth Interact. 2015, 19, 1–33. [Google Scholar] [CrossRef]
- Bhakta, K.R. Positive degree-day factors for ice ablation on four glaciers in the Nepalese Himalayas and Qinghai-Tibetan Plateau. Bull. Glaciol. Res. 2003, 20, 7–14. [Google Scholar] [CrossRef]
- Hock, R. Temperature index melt modelling in mountain areas. J. Hydrol. 2003, 282, 104–115. [Google Scholar] [CrossRef] [Green Version]
Figure 1.
Map of the location of the Laohugou Glacier Basin (LHGB) and meteorological and hydrological observation sites. (NAWS is the national weather stations).
Figure 1.
Map of the location of the Laohugou Glacier Basin (LHGB) and meteorological and hydrological observation sites. (NAWS is the national weather stations).

Figure 2.
Simulated and observed monthly temperature (T) at AWS1 from 2010 to 2013.

Figure 3.
Reconstructed annual temperature at AWS1 during 1959–2015.

Figure 4.
Simulated and observed monthly precipitation at AWS1 from 2010 to 2012.

Figure 5.
Reconstructed annual precipitation at AWS1 during 1959–2015.

Figure 6.
Observed precipitation, temperature, and runoff depth and simulated runoff depth. (Calibration periods from 1959 to 1961).
Figure 6.
Observed precipitation, temperature, and runoff depth and simulated runoff depth. (Calibration periods from 1959 to 1961).

Figure 7.
Observed precipitation, temperature, and runoff depth and simulated runoff depth (validation period from 2014 (a) to 2015 (b)).
Figure 7.
Observed precipitation, temperature, and runoff depth and simulated runoff depth (validation period from 2014 (a) to 2015 (b)).

Figure 8.
Comparison of observed and simulated monthly runoff depth.

Figure 9.
Simulated annual runoff depth in the LHGB from 1959 to 2015.

Figure 10.
Simulated annual glacier mass balance (black curve) and cumulative glacier mass balance (blue curve) in LHGB from 1959 to2015.
Figure 10.
Simulated annual glacier mass balance (black curve) and cumulative glacier mass balance (blue curve) in LHGB from 1959 to2015.

Figure 11.
Monthly average air temperature (a), monthly decade average precipitation (b), runoff depth (c), and glacier mass balance (d) in different decade.
Figure 11.
Monthly average air temperature (a), monthly decade average precipitation (b), runoff depth (c), and glacier mass balance (d) in different decade.

Figure 12.
Compared with baseline, sensitivity analysis of runoff depth under different precipitation (a) and temperature (b) change scenarios (1959–1961).
Figure 12.
Compared with baseline, sensitivity analysis of runoff depth under different precipitation (a) and temperature (b) change scenarios (1959–1961).

Figure 13.
Compared with baseline, sensitivity analysis of runoff depth under combination of different precipitation and temperature change scenarios (1959–1961). (a) Precipitation increased by 10% (b) Precipitation increased by 30% (c) Precipitation decreased by 30%
Figure 13.
Compared with baseline, sensitivity analysis of runoff depth under combination of different precipitation and temperature change scenarios (1959–1961). (a) Precipitation increased by 10% (b) Precipitation increased by 30% (c) Precipitation decreased by 30%

Figure 14.
Sensitivity of runoff depth under different glacier area variations (1959–1961).

Figure 15.
Sensitivity of runoff depth under different glacier area variations and temperature changes (1959–1961). (a) Glacier area decreased by 10% (b) Glacier area decreased by 53%
Figure 15.
Sensitivity of runoff depth under different glacier area variations and temperature changes (1959–1961). (a) Glacier area decreased by 10% (b) Glacier area decreased by 53%


Table 1.
Description of the AWS1 and four NAWS around the LHGB.
| Station Information | P1 Tuole | P2 Dachaidan | P3 Delingha | P4 Jiuquan | AWS1 |
|---|---|---|---|---|---|
| Available daily data | 1959–2015 | 1959–2015 | 1959–2015 | 1959–2015 | 2010–2012 |
| Altitude (m a.s.l) | 3368 | 3174 | 2982 | 1478 | 4192 |
| Latitude (°N) | 38.8 | 37.85 | 37.37 | 39.77 | 39.51 |
| Longitude (°E) | 98.42 | 95.37 | 97.37 | 98.62 | 96.51 |
| Precipitation (mm) | 290 | 88 | 179 | 89 | 355 |
| Distance to LHGB (km) | 185 | 209 | 249 | 185 | 0 |
Table 2.
Description statistic and goodness for calibration (1959–1961) and validation (2014–2015) periods for LHGB simulated while using HBV (Hydrologiska Byrans Vattenbalansavdelning) model.
Table 2.
Description statistic and goodness for calibration (1959–1961) and validation (2014–2015) periods for LHGB simulated while using HBV (Hydrologiska Byrans Vattenbalansavdelning) model.
| Time Scale | Calibration (1959–1961) | Validation (2014) | Validation (2015) |
|---|---|---|---|
| Reff | Reff | Reff | |
| Daily | 0.81 | 0.70 | 0.6 |
| Monthly | 0.91 | 0.80 | 0.91 |
Table 3.
Descriptions and optimized parameter sets of HBV for the LHGB.
| Parameters | Explanation | Range | Value | Method |
|---|---|---|---|---|
| Temperature and precipitation gradients | ||||
| Pg | Precipitation gradient (%·(100 m)−1) | 9.45(observed) | observed | |
| Tg | Temperature gradient (°C·(100 m)−1) | 0.5(observed) | observed | |
| Snow and glacier module | ||||
| TThreshold | Threshold air temperature (°C) | −1–2.7 | −0.46 | [27] and calibration |
| CFMAX | Degree-day factor (mm/°C·day) | 2.6–13.8 | 5.78 | [26,30] and calibration |
| SFCF | Snowfall correction factor | 0–1 | 0.56 | [27] and calibration |
| Rf | Refreezing coefficient | 0.05–0.3 | 0.05 | [33] and calibration |
| CHC | Water holding capacity | 0.1–0.5 | 0.29 | [34] and calibration |
| CFGlacier | Glacier correction factor | 1.2–1.6 | 1.20 | [33] and calibration |
| FSlope | Slope correction factor | 0.1–2 | 1.41 | [35] and calibration |
| KGmin | Minimum outflow coefficient (t−1) | 0.01–0.4 | 0.20 | [35] and calibration |
| dKG | Maximum minus minimum outflow coefficient (t−1) | 0.01–0.5 | 0.31 | [31] and calibration |
| AG | Calibration parameter (mm−1) | 0–10 | 2.57 | [31] and calibration |
| Soil and Evaporation module | ||||
| FC | Maximum soil box(mm) | 100–550 | 239.46 | [30] and calibration |
| LP | Threshold value | 0.3–1 | 0.3 | [30] and calibration |
| Beta | Shape coefficient | 1–5 | 5.00 | [30] and calibration |
| Response Routine | ||||
| K0 | Recession coefficient (day−1) (RC) | 0.1–0.5 | 0.50 | [36] and calibration |
| K1 | RC | 0.01–0.5 | 0.50 | [36] and calibration |
| K2 | RC | 0.001–0.1 | 0.00001 | [36] and calibration |
| Perc | Threshold parameter (mm·day−1) | 0–4 | 3.06 | [37] and calibration |
| Routing routine | ||||
| Maxbas | Length of triangular weighting function (d) | 1–5 | 1 | [37] and calibration |
Table 4.
Comparison of the accumulated mass balance between Laohugou glaciers simulated by the HBV model and the observed nearby glacier mass balance.
Table 4.
Comparison of the accumulated mass balance between Laohugou glaciers simulated by the HBV model and the observed nearby glacier mass balance.
| Key Elements | LHGB (Simulated) | NO.1 Glacier (Observed) | Qiyi Glacier (Observed and Reconstructed) |
|---|---|---|---|
| 1975–2010 glacier mass balance accumulation | −11,833 mm | −13,605 mm | −6310 mm |
| Distance to LHGB | 0 | 924 km | 107 km |
Table 5.
Runoff variation under different temperature variation scenarios.
| Relative to Baseline | T + 1.5 °C | T + 2 °C | T + 4 °C |
|---|---|---|---|
| Variations of runoff (%) | 46.6 | 66.8 | 169.0 |
| Variations of peak runoff (%) | 59.9 | 84.6 | 189.1 |
Table 6.
Runoff change under combinations of temperature and precipitation variation scenarios.
| Relative to Baseline | T + 1.5 °C | T + 2 °C | T + 4 °C |
|---|---|---|---|
| P + 10% | 48.8% | 66.8% | 171.7% |
| P + 30% | 52.6% | 73.0% | 177.2% |
| P − 30% | 31.4% | 51.0% | 151.3% |
Table 7.
Runoff variation under different glacier area variation scenarios. (Area - 10% indicate glacier area decreased by 10%, Area - 53% indicate glacier area decreased by 53%, Area - 100% indicate glacier area decreased by 100%.)
Table 7.
Runoff variation under different glacier area variation scenarios. (Area - 10% indicate glacier area decreased by 10%, Area - 53% indicate glacier area decreased by 53%, Area - 100% indicate glacier area decreased by 100%.)
| Relative to Baseline | Area-10% | Area-53% | Area-100% |
|---|---|---|---|
| Decrease of peak runoff (%) | 20.4 | 54.2 | 72.3 |
© 2018 by the authors. Licensee MDPI, Basel, Switzerland. This article is an open access article distributed under the terms and conditions of the Creative Commons Attribution (CC BY) license (http://creativecommons.org/licenses/by/4.0/).
Share and Cite
MDPI and ACS Style
Zhang, X.; Qin, X.; Xu, C.; Liu, Y. Simulation of Runoff and Glacier Mass Balance and Sensitivity Analysis in a Glacierized Basin, North-Eastern Qinhai-Tibetan Plateau, China. Water 2018, 10, 1259. https://doi.org/10.3390/w10091259
AMA Style
Zhang X, Qin X, Xu C, Liu Y. Simulation of Runoff and Glacier Mass Balance and Sensitivity Analysis in a Glacierized Basin, North-Eastern Qinhai-Tibetan Plateau, China. Water. 2018; 10(9):1259. https://doi.org/10.3390/w10091259
Chicago/Turabian StyleZhang, Xiaopeng, Xiang Qin, Chunhai Xu, and Yushuo Liu. 2018. "Simulation of Runoff and Glacier Mass Balance and Sensitivity Analysis in a Glacierized Basin, North-Eastern Qinhai-Tibetan Plateau, China" Water 10, no. 9: 1259. https://doi.org/10.3390/w10091259
Note that from the first issue of 2016, this journal uses article numbers instead of page numbers. See further details here.