Article

A Systematic Operation Program of a Hydropower Plant Based on Minimizing the Principal Stress: Haditha Dam Case Study

by
Jing Li
1,
Ameen Mohammed Salih Ameen
2,
Thamer Ahmad Mohammad
2,
Nadhir Al-Ansari
3,* and
Zaher Mundher Yaseen
4,*
1
Business School, Lanzhou City University, Lanzhou, China
2
Department of Water Resources, University of Baghdad, Baghdad, Iraq
3
Civil, Environmental and Natural Resources Engineering, Lulea University of Technology, 97187 Lulea, Sweden
4
Sustainable Developments in Civil Engineering Research Group, Faculty of Civil Engineering, Ton Duc Thang University, Ho Chi Minh City, Vietnam
*
Authors to whom correspondence should be addressed.
Water 2018, 10(9), 1270; https://doi.org/10.3390/w10091270
Submission received: 24 August 2018 / Revised: 4 September 2018 / Accepted: 13 September 2018 / Published: 18 September 2018
(This article belongs to the Section Water Resources Management, Policy and Governance)

Abstract

:
Dam operation and management have become more complex recently because of the need for considering hydraulic structure sustainability and environmental protect on. An Earthfill dam that includes a powerhouse system is considered as a significant multipurpose hydraulic structure. Understanding the effects of running hydropower plant turbines on the dam body is one of the major safety concerns for earthfill dams. In this research, dynamic analysis of earthfill dam, integrated with a hydropower plant system containing six vertical Kaplan turbines (i.e., Haditha dam), is investigated. In the first stage of the study, ANSYS-CFX was used to represent one vertical Kaplan turbine unit by designing a three-dimensional (3-D) finite element (FE) model. This model was used to differentiate between the effect of turbine units’ operation on dam stability in accordance to maximum and minimum reservoir upstream water levels, and the varying flowrates in a fully open gate condition. In the second stage of the analysis, an ANSYS-static modeling approach was used to develop a 3-D FE earthfill dam model. The water pressure pattern determined on the boundary of the running turbine model is transformed into the pressure at the common area of the dam body with turbines. The model is inspected for maximum and minimum upstream water levels. Findings indicate that the water stress fluctuations on the dam body are proportional to the inverse distance from the turbine region. Also, it was found that the cone and outlet of the hydropower turbine system are the most affected regions when turbine is running. Based on the attained results, a systematic operation program was proposed in order to control the running hydropower plant with minimized principal stress at selected nodes on the dam model and the six turbines.

1. Introduction

One of the major concerns of the dam and hydropower system operation is the post-design stage process [1]. As a matter of fact, large hydraulic infrastructures, such as earthfill dams, behave differently during the actual operation, because of the diverse load performances and the nature of in situ conditions. Hence, studying the physical effects like vibration, stress, and mechanical properties degradation are extremely vital for understanding the consequences of operation strategies on the sustainability goals of dam operations [2]. Power stations coupled with a large dam represent an important multipurpose hydraulic structure that are used mainly to store water for many water resources engineering requirements, in addition to hydroelectric power generation at low cost [3,4].
The seismic effect on dam bodies was studied by the civil engineering researchers in order to assess their dynamic behaviors. While, the vibrational effect produced by the hydraulic turbines was studied by mechanical engineering researchers to assess their hydraulic performance, due to powerhouse operation. Most of the studies were focused on the modeling and analysis of pressure distribution on turbine draft tube.
Thus, it is necessary to study the impact of vibrational effects due to the powerhouse operation on the dam body, taking into consideration the dam type, the powerhouse type and the turbine type. Studies focusing on the modeling of dynamic behaviors and the hydraulic performance of embankment dams are essential to improving dam safety. However, the effects of vibration, due to powerhouse operation on dam bodies were not found in a single study.
In practice, hydropower operations may yield several undesirable impacts, such as (i) disruption of aquatic ecosystem, (ii) high initial construction cost, (iii) uprooting of human population, (iv) requirement of high quality materials, (v) environmental impacts causes natural habitat loss, (vi) risk of drought, (vii) geological damage, and (viii) increase in unsafe conditions for dam operations [5,6,7]. In this research, we focus on the effects of a hydropower plant on dam operation safety and sustainability. The optimal operation of turbine units inside the powerhouse has the potential to reduce the generation of vibrations and stresses on the dam body, and the powerhouse infrastructure [8,9]. These stresses may vary based on the distance from turbine’s running effect, as well as due to control of the turbine units with total and partial loads. The existing literature in this area has primarily investigated the stability of power station with turbines [10,11], and the seismic influence on the dynamic behavior of the dams [12]. Yet, all studies have separately investigated these problems without linking the hydropower plant system represented by the turbines with the influence of operation on dam body. In this research, and for the first time, investigation and assessment for an integrated hydropower plant system with an earthfill dam is carried out.
Several attempts have been made over the past decade to use 3-D finite volume (FV) numerical modeling method for examining how cavitation in turbines [13,14,15,16,17]. These analyses conducted using the Reynolds Navier–Stokes Equation [18], coupled either with the combination of k-ω shear stress transport turbulence [19] or k-ε turbulence [14,20]. Continuity formulation is usually used to determine the pressure distribution, velocity, and frequency attributed at different water levels. By contrast, fewer studies have been conducted to reduce the cavitation in turbine draft tubes, improving the hydraulic performance [14]. Other researchers have aimed to reduce the vibration effects of a running powerhouse by creating a 3-D numerical model that represents a specific hydropower station system [8,21,22]. These studies have focused their investigations on examining the interactions between fluid and structure systems, under dynamic and kinematic conditions.
Many studies have discussed the dynamic behavior of earthfill dams by evaluating and analyzing the seismic effect on the interconnected dam–reservoir–foundation system. Such an analysis is performed by using either one or a combination of the following methods: field testing, theoretical analysis, or finite element modeling. One of the earliest attempts in this scope was conducted by [23], who analyzed and simplified the fundamental vibration mode response of the gravity dam by assuming that (a) concrete dams with full and empty reservoirs are supported on a rigid foundation rock bed, and that (b) concrete dams with full and empty reservoirs are supported on a flexible foundation rock. Watanabe et al. (1996) developed 2-D and 3-D model analyses for earthfill dams based on a finite element method to analyze the effect of the parameters (e.g., strain, stress, acceleration, and deformation) on the dam foundation [24]. Lotfi (2003) discussed the reservoir size effects on the dynamic behavior of concrete gravity dams [25]. Jafari and Davoodi (2004) created 2-D and 3-D models of embanked dam using ANSYS for dynamic analysis [26]. ANSYS software is an American engineering solution based in Canonsburg, Pennsylvania. The soil properties were calculated using level dynamic tests while the effects of other information such as water depth, abutments, and foundation parameters were considered in the modeling process.
The dam–foundation–rock interaction were analyzed by [27] using a 3-D FE numerical model that represents an earthfill dam, and by using IZIIS software to determine the dynamic behavior of the earthfill dam material. Previous studies were also conducted on the dynamic analysis of hydropower plant water system [14,28,29]. However, in these studies, the dynamic behavior of dams have been studied without including the influence of hydropower plants [30].
To date, no research has investigated the impact of vibration resulting from turbine operation on the stability of a hydropower plant integrated with the dam body. This study simulates the above problem taking Haditha dam in Iraq as a case study. The simulation includes two stages. The first stage focuses on using a finite volume technique to simulate turbine operation, while the second stage includes using 3-D FE to simulate the stability of the dam body, together with the powerhouse, taking into consideration the boundary pressure pattern obtained from the first simulation stage. The complex dam–powerhouse–reservoir–foundation system interactions were also considered.

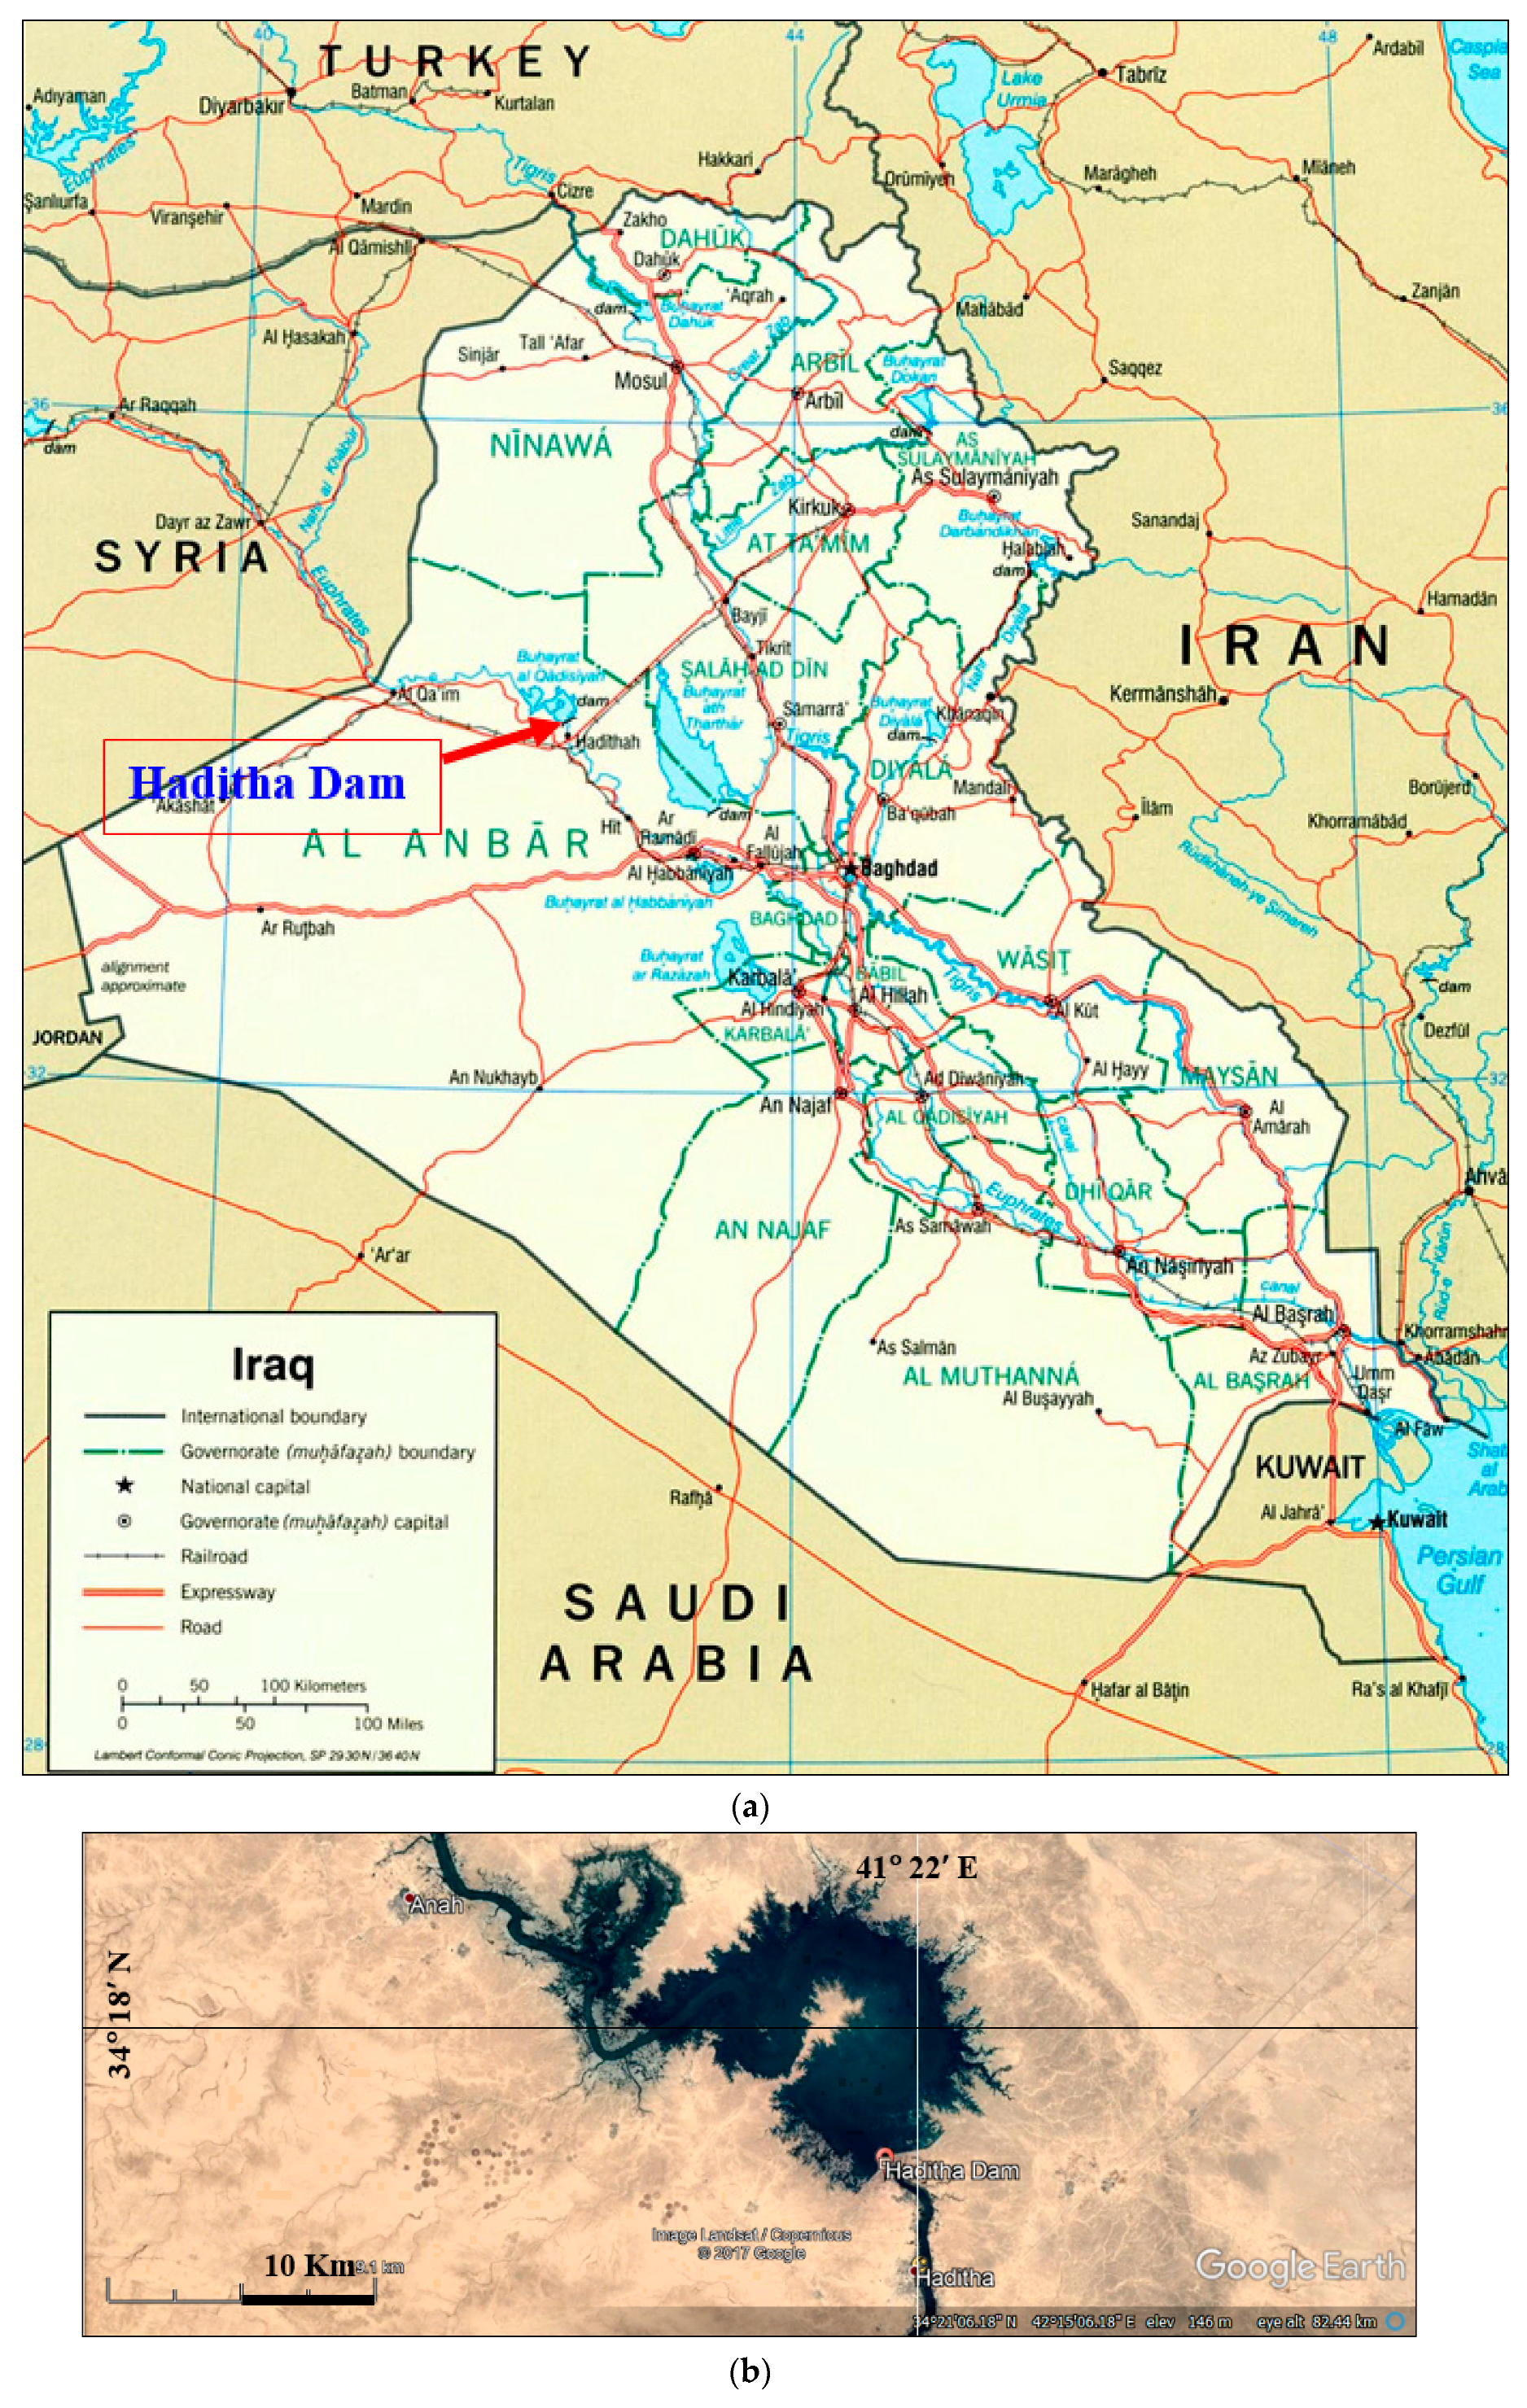
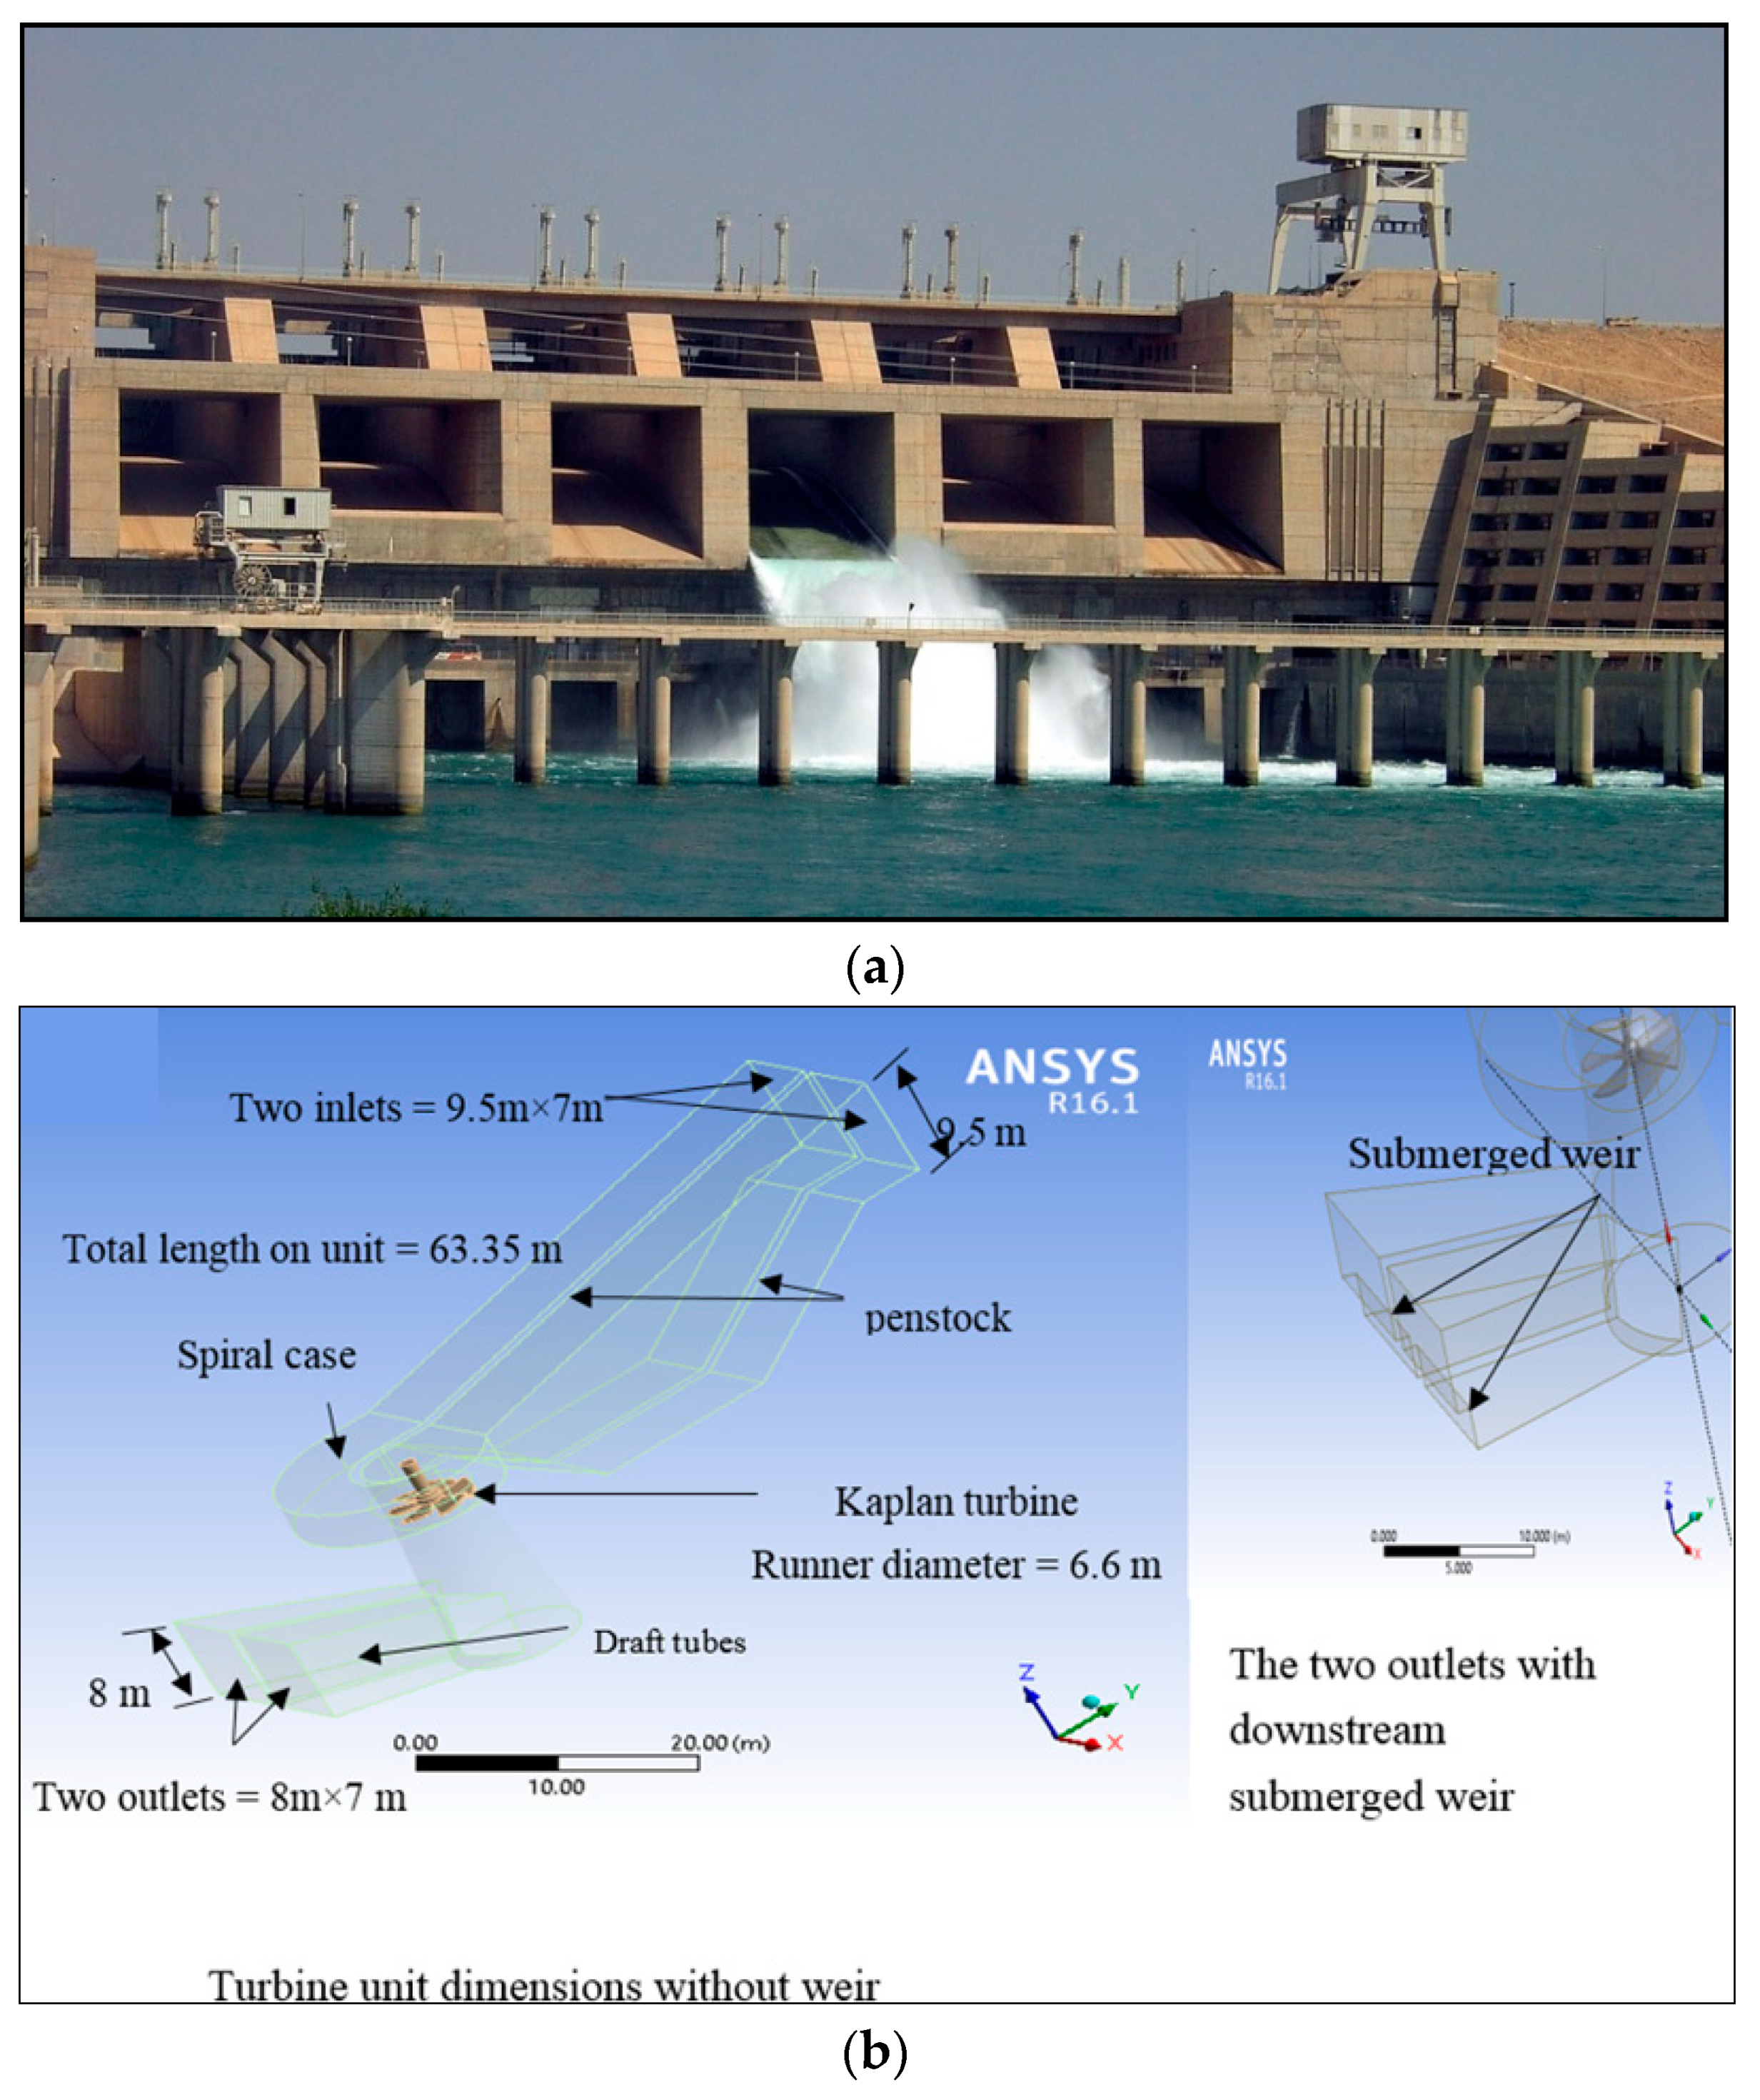
2. Description of the Dam with an Integrated Powerhouse

Haditha dam is an earthfill dam that is located on a narrow stretch of the Euphrates River at 34°12′ latitude and 42°21′ longitude, about 8 km northwest of Haditha town, which is about 270 km northwest of Baghdad (Figure 1). The construction of the dam started in 1977 and it was in operation in 1988. The maximum height of the dam is 57 m, and the total length is 9064 m. From the deepest point at the river channel and the dam crest level is 154 m above sea level (a.s.l.). The normal operation water level is 143 m (a.s.l.), while the maximum operation water level is 147 m (a.s.l.). The maximum flood water level is 152 m (a.s.l.). The total storage capacity of the dam is 6 billion cubic meters at 143 m (a.s.l.) [31,32].
The power station is an integral part of the dam, containing six vertical Kaplan turbines capable of producing 660 MW power. The turbines are installed in a hydro combined unit comprising both a spillway and a hydropower plant in one structure. The Haditha dam has a multipurpose structure and it is used to generate hydroelectricity, regulate the flow of the Euphrates, and provide water for irrigation. The Haditha dam is the second largest hydroelectric contributor to the power system in Iraq after the Mosul dam. Table 1 displays general information on the dam. Figure 2a,b exhibit a graphical presentation of the dam and the turbine system dimensions. This information is crucial toward constructing the 3-D FE model (Figure 2b).

3. 3-D Finite Element Modeling

The hydraulic structures were designed and analyzed using an approach that focuses on the affected forces on the embanked dam body, the powerhouse with the turbines, and changes in the upstream water level. In this study focuses on the dynamic analysis of hydraulic conditions was done by using FE modeling.

3.1. Numerical Method

Numerical analysis was conducted depending on finite element volume method by using ANSYS®. This program environment was based on a continuum finite element analysis. Every derivative in the set of governing equations was replaced directly by a set of algebraic matrices written in terms of the field variables (e.g., stress, displacement) at discrete points in 3-D. The formulation of the 3-D model involves the connection of the ANSYS-static structural component, which represents 3-D Haditha earthfill dam model with the ANSYS-CFX model component, including one vertical Kaplan turbine unit of the powerhouse.

3.2. Models Validation

Validation of ANSYS-CFX model was conducted in two stages. In the first stage, the pressure pattern and velocity distribution in a selected turbine unit were predicted by ANSYS-CFX model and compared with the predicted values obtained from Newmark numerical method. The comparison is shown in Table 2. Data used in running the ANSYS-CFX model were adopted from [8]. In the second stage, the predicted dam stability due to the vibration effect was conducted by using the ANSYS dam–powerhouse model, and the results were compared with the forced vibration test conducted by [26] on the Masjed–Soleiman (MS) embankment dam, and the results are shown in Table 2.

3.3. Hydraulic Analysis of a 3D Numerical Modeling of One Kaplan Turbine Unit

In this study, a vertical Kaplan turbine of the Haditha powerhouse was selected as the case study. A 3D FV numerical model was created and simulated using ANSYS-CFX to represent the turbine unit. The unit includes the runner with blades and shaft, and is defined as a submerged rotational body. The water field, which includes the inlets, penstocks, spiral case, and two draft tubes with its outlets, were also defined. Figure 2b outlines the dimension details of the turbine model.
The turbine model is built in ANSYS-CFX and it is based on the finite-volume technique. The flow simulation of the Kaplan turbine was employed by using several meshes to test the grid independence, and it converges after many iterations. The grid independence of the turbine is made using tetrahedral elements after performing several trials to determine the smallest possible aspect ratio under 150 and the minimum orthogonal over 0.15 as recommended by ANSYS-CFX code. Whereas, hexahedral elements analysis performed for the wall boundary layers. To obtain the required pressure fluctuation, the final mesh satisfied y + < 200 around the boundary wall, and this is in agreement with the previous research conducted by [33]. The runner, guide vanes, and the draft tube interactions were counted by using slip meshes. This slipping of meshes are toured each other in the interface sides. However, it is important to ensure that the velocity components, pressure, and flow flux are harmonious after interpolation.

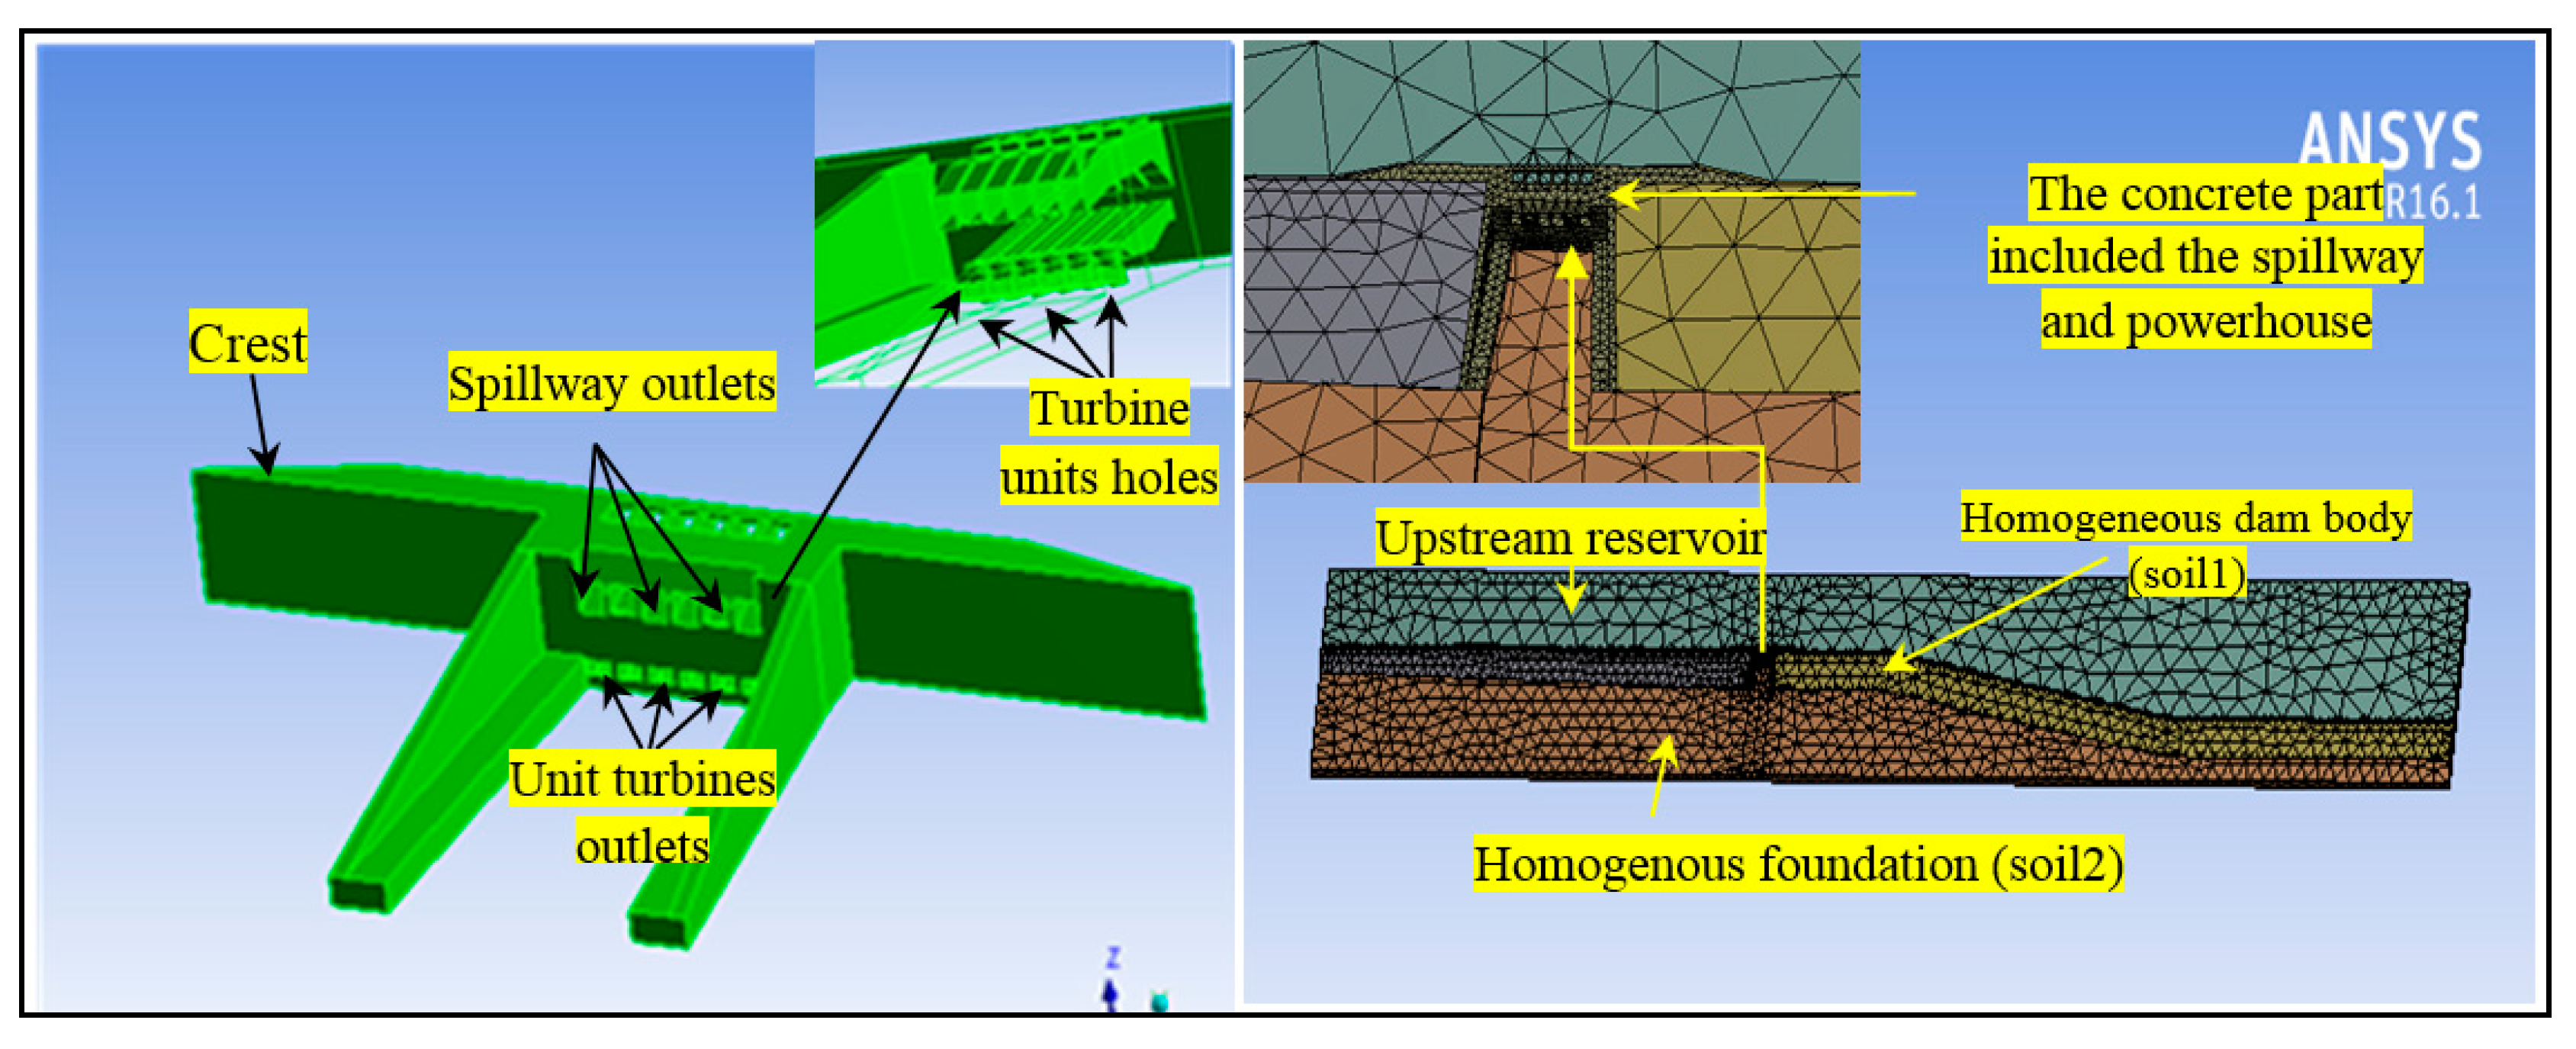
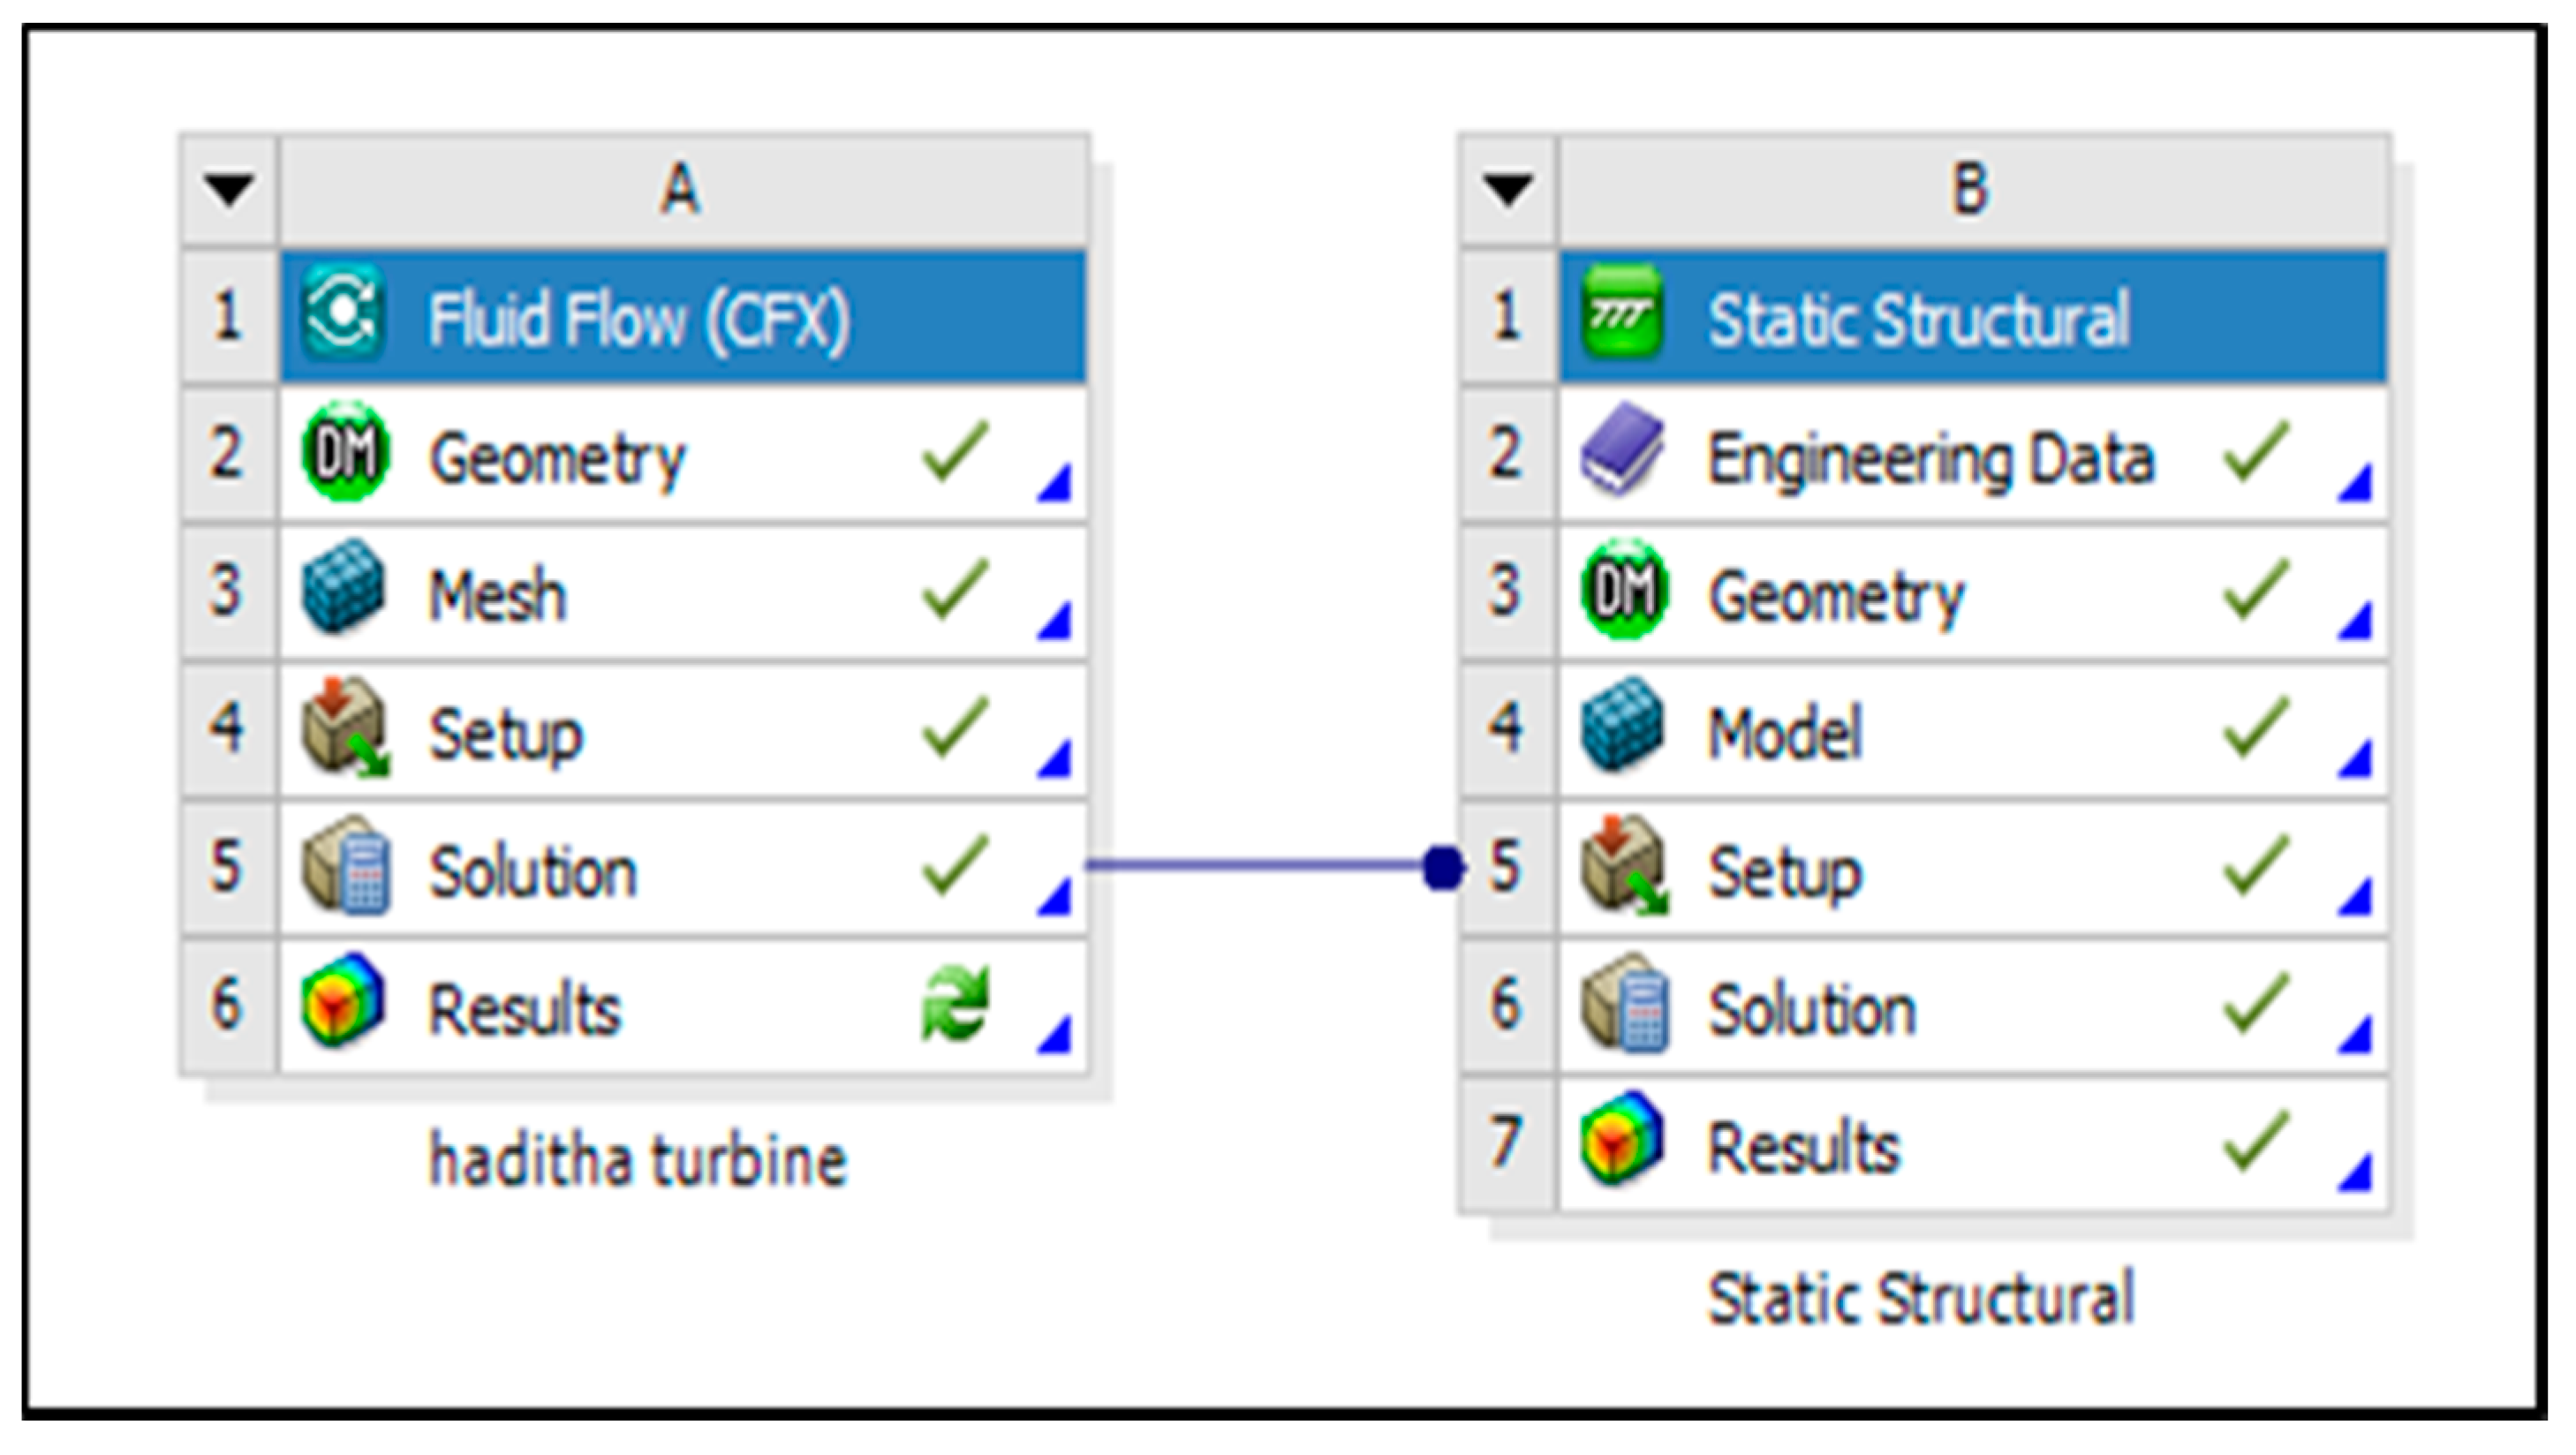
3.4. 3-D Numerical Modeling of the Dam–Powerhouse–Reservoir–Foundation System

The ANSYS-static structure was used to simulate its 3D form and behavior, based on the shape of the Haditha earthfill dam, and its connection to the six turbines that represent the powerhouse, foundation, and upstream reservoir. The model used assumptions of a 57 m long foundation depth, and with minimum and maximum upstream water levels, as listed in Table 1. Figure 3 illustrates the 3-D model of the Haditha dam with a 57 m foundation base in the full reservoir case.
The 3-D model of the Haditha dam–powerhouse (represented by six turbine units)–foundation–reservoir system was created and represented using a suitable mesh. The interface of the common area (turbine tunnel areas) interacts with different domains, such as fluid and solid domains with unique properties of dam body materials, upstream reservoir, and abutments with foundation soil. A 3D FE model used for ANSYS-static structural analysis to create the 3D Haditha dam model is described as follows [33]:
  • The 3D solid elements were used to model the earthfill dam body, foundation bed, and abutments in connection to the concrete part in the region near the turbine boundary and mesh was refined to represent the small details of the turbine boundary, as shown in Figure 4.
  • The upstream reservoir was represented by three-dimensional fluid elements.
  • The meshing details used in the Haditha Kaplan turbine model is shown in Table 3.

4. Application Results and Discussion

The results obtained from the application of the 3-D FE numerical model for the Haditha embankment dam integrated with the turbine model can be categorized into two summarized stages as listed below:
(1)
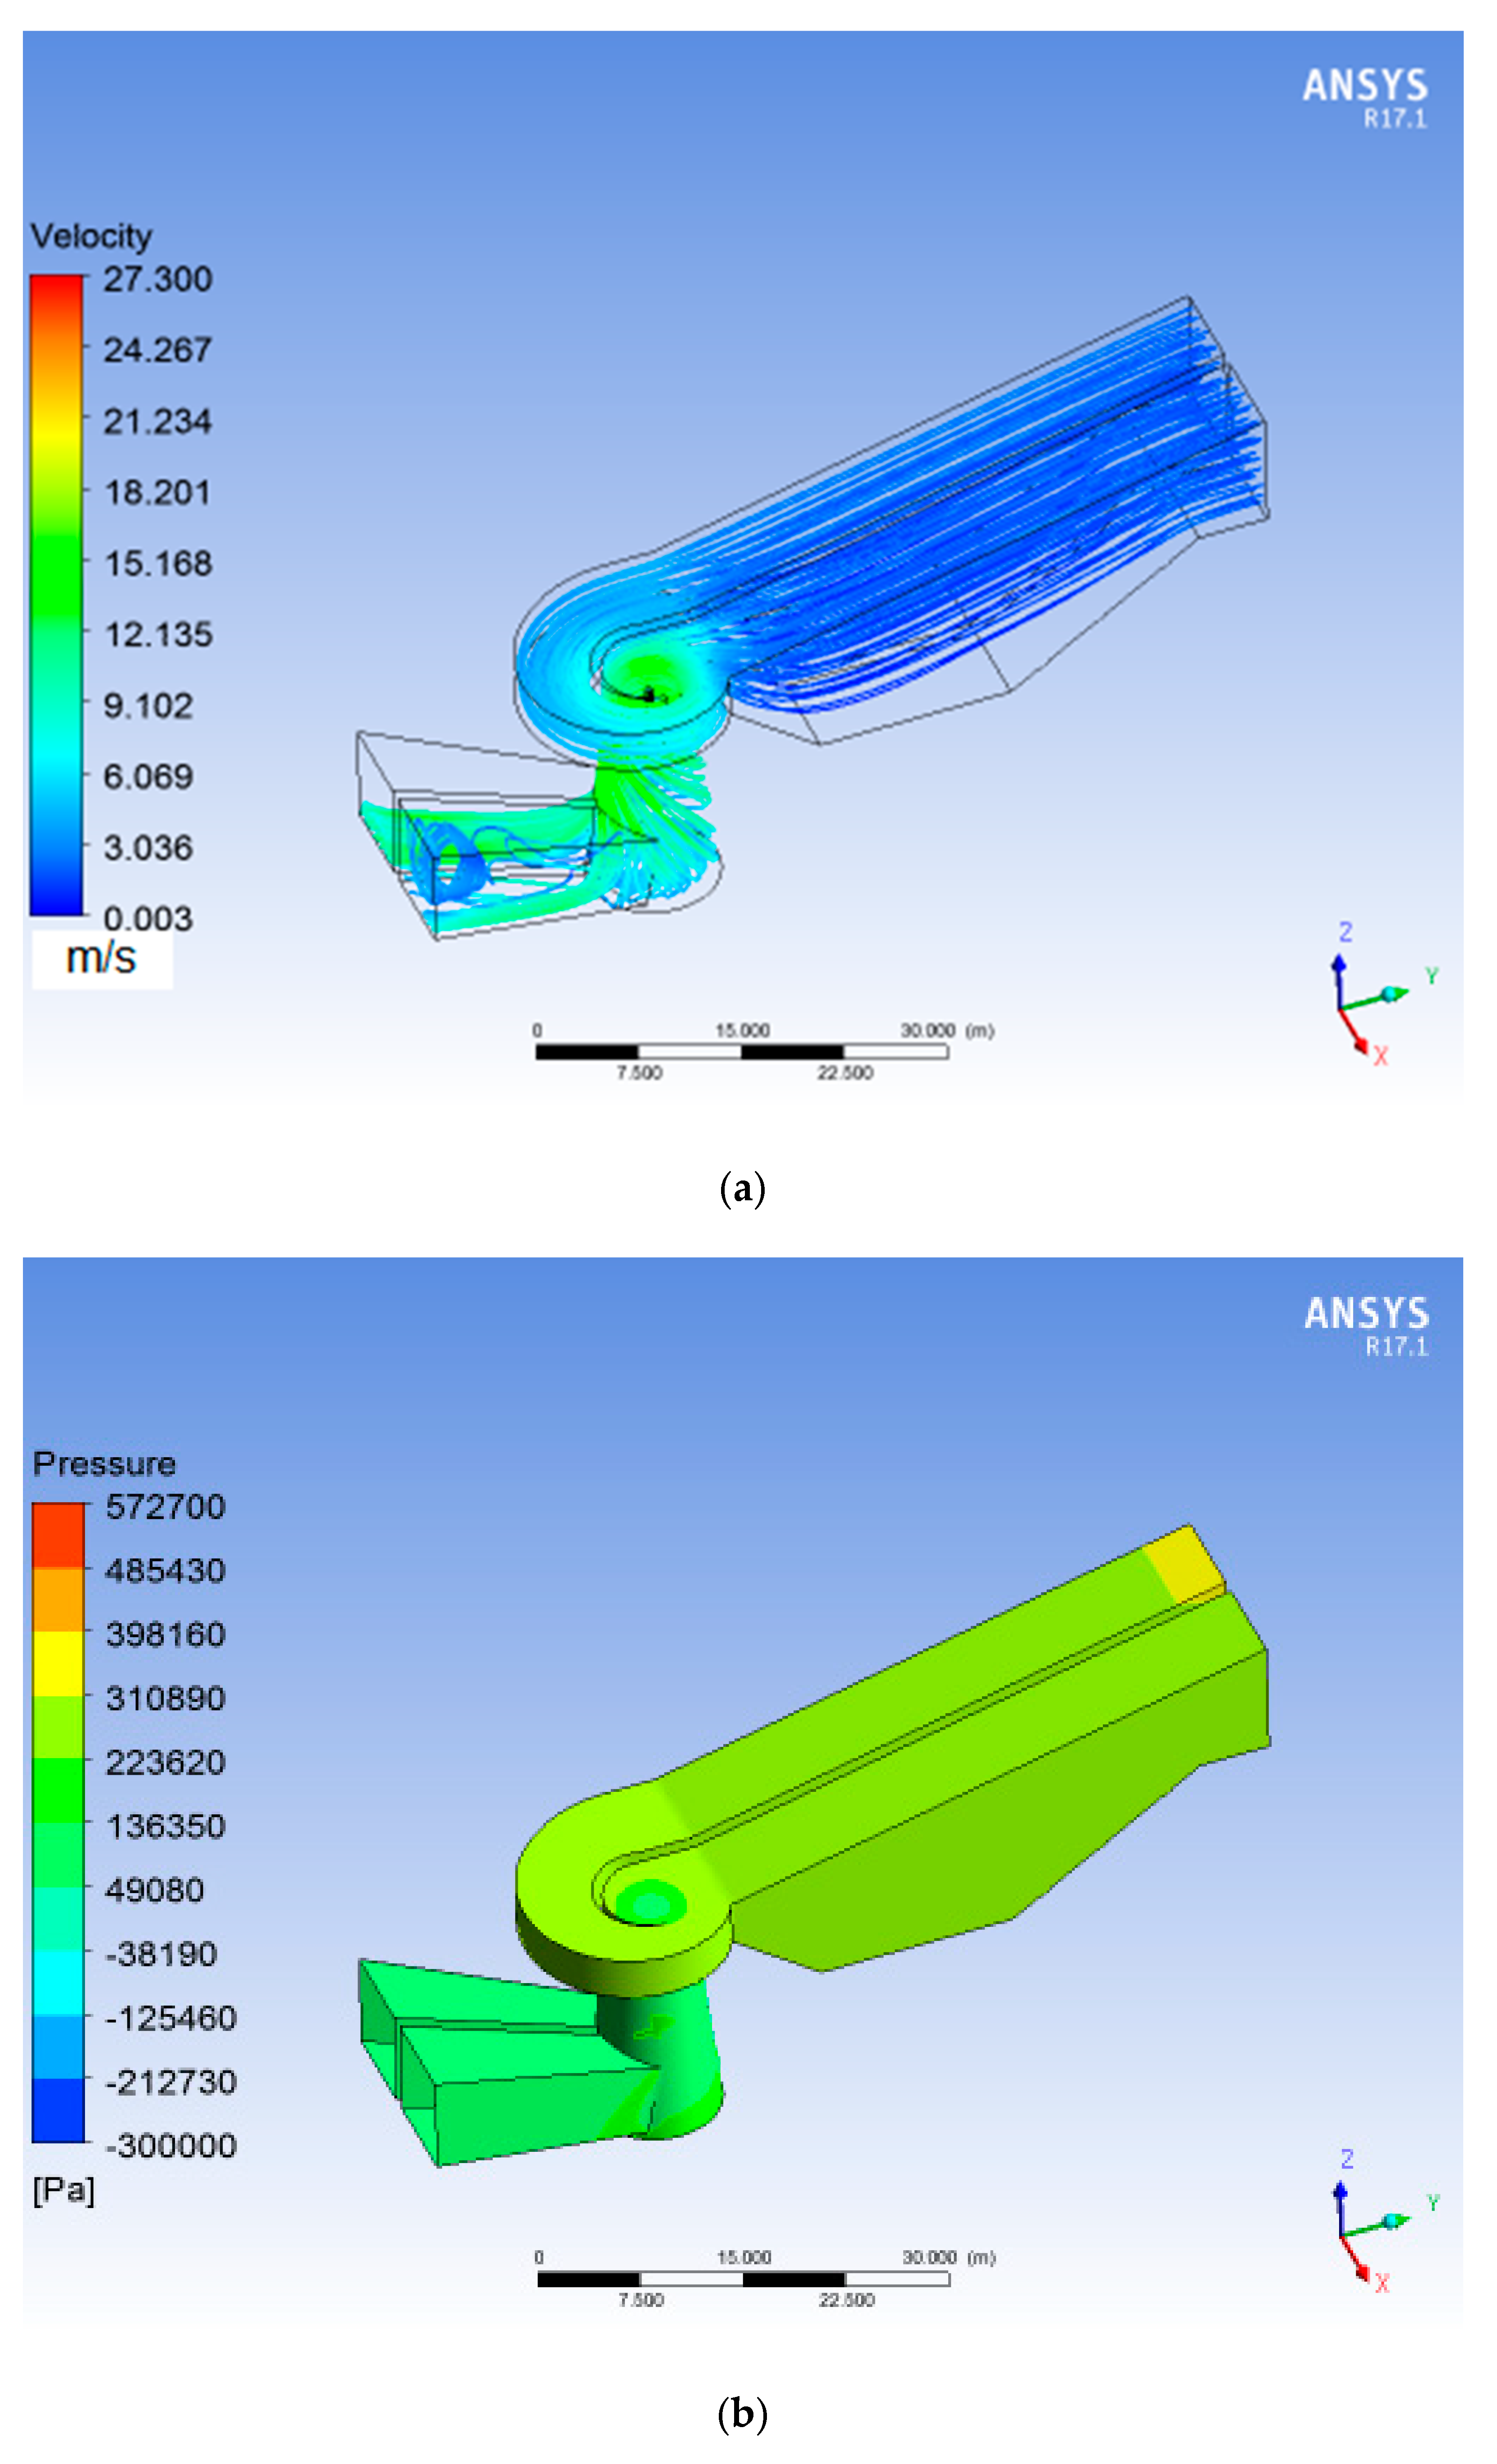
The first stage of the hydraulic performance results is related to the application of the 3-D numerical finite volume turbine model by considering the operation of one vertical Kaplan turbine unit in the powerhouse of the Haditha dam that runs in different water levels and discharge ranges. The results include velocity flow lines, pressure distribution in the turbines, and a total estimated head at the turbine inlet compared with the upstream water level.
(2)
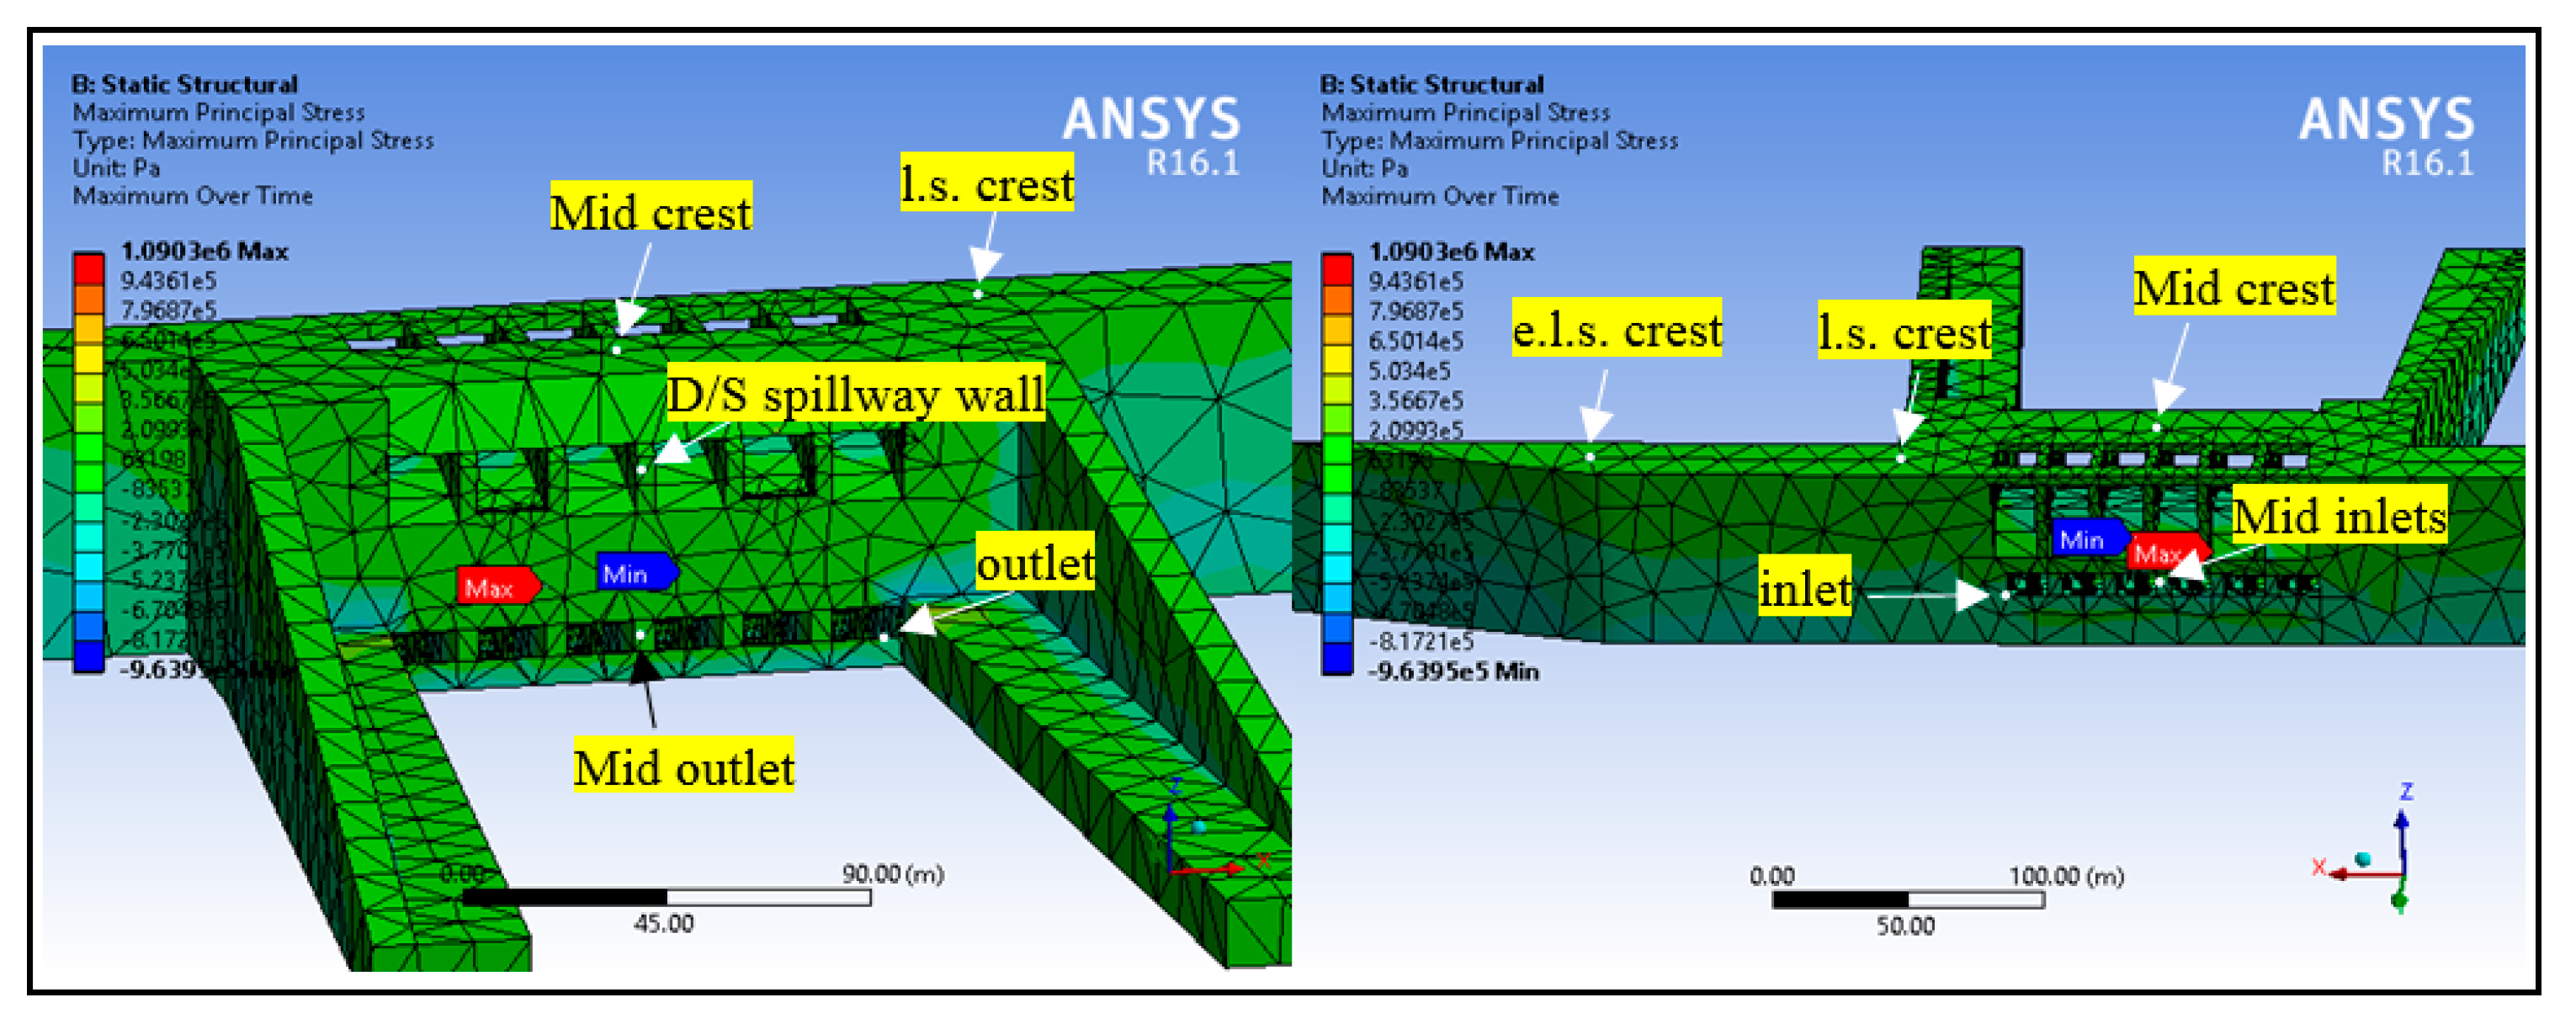
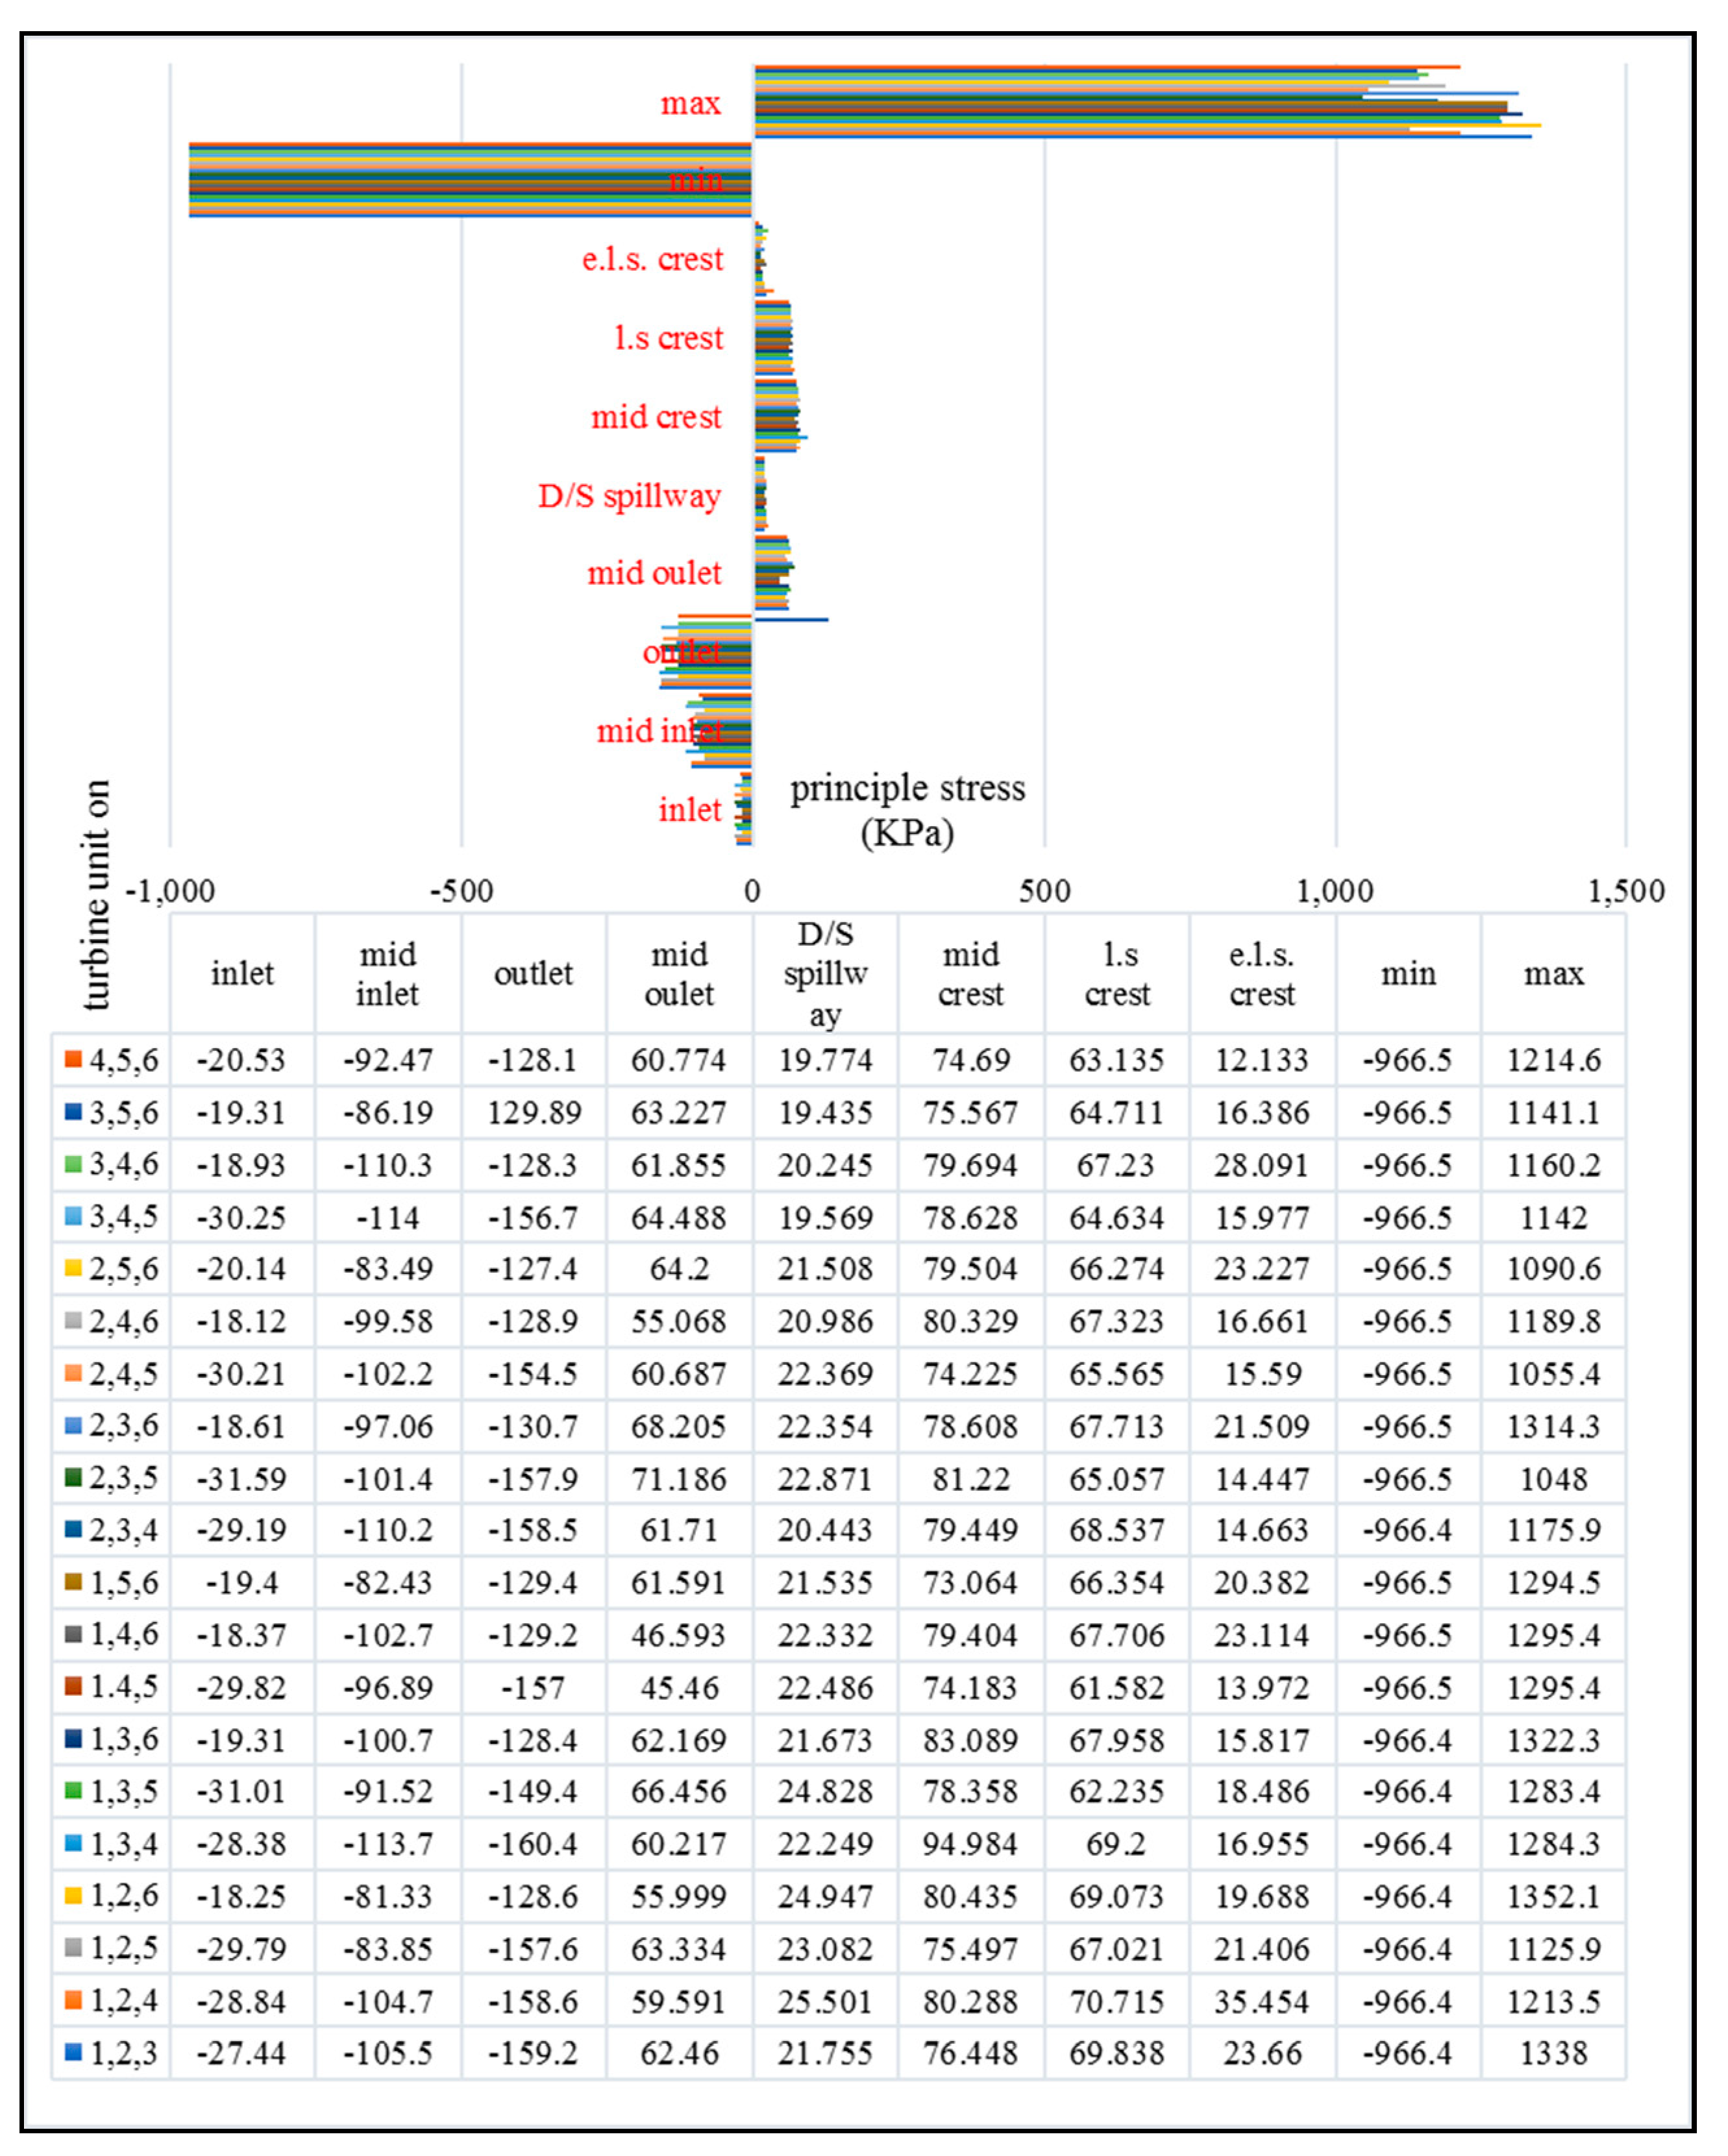
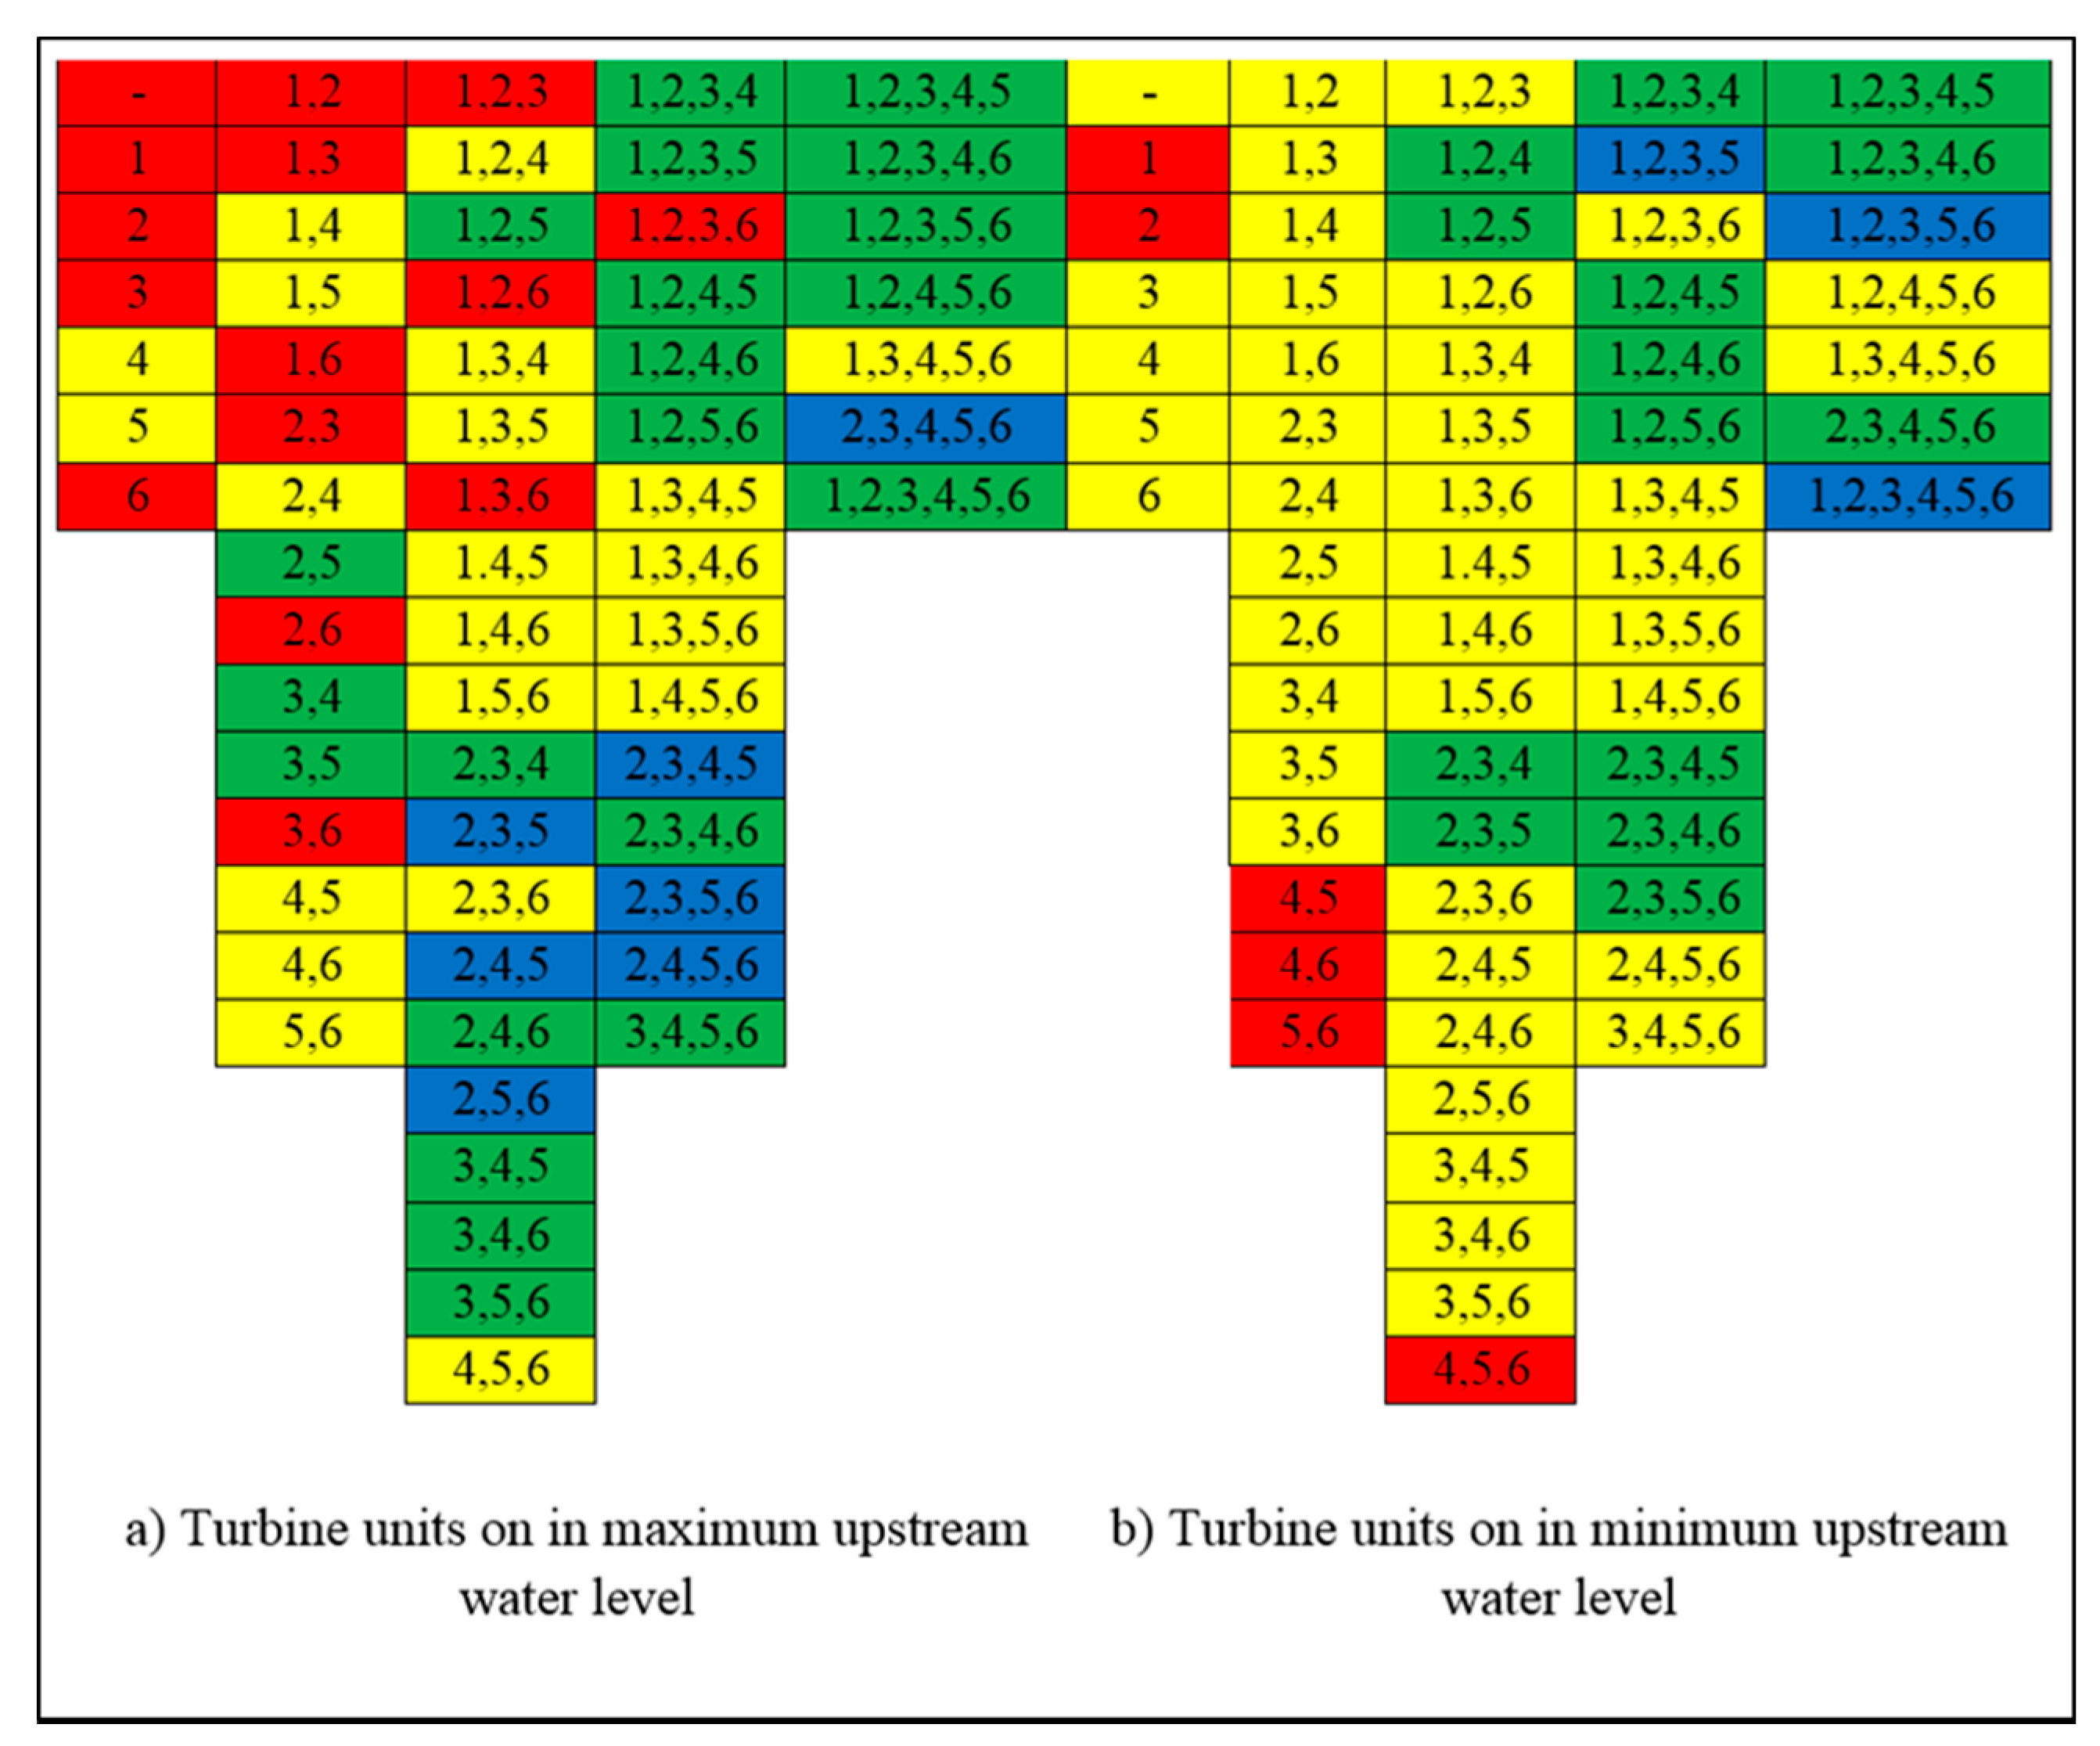
The second stage of the results is that obtained from the integration of 3-D numerical finite element dam models with 3-D numerical finite volume turbine models. The results cover all the possibilities that may arise from the operation of the powerhouses, including maximum and minimum water levels for the case of full inlet gates openings. The results of the 3-D dam models include principal stresses distributions in both dams and powerhouses.

4.1. Turbine Model Simulations

The k-ε turbulence 3D model and the finite volume method were used to distinguish the unsteady flow inside the Kaplan turbine unit. Input data (upstream water levels with discharges) used by the model were obtained from engineering reports and the dam site visits. The maximum drawdown and flood upstream water level with varying discharges, gravity weight, and the speed of the turbine were also considered. Table 4 outlines the hydraulic data of the Haditha powerhouse used in running the turbine model.
The boundary conditions for the steady flow computation are as follows. The 3D numerical model runs by inputting the inlet velocity that is calculated from the actual discharges listed in Table 4. The speed of the turbines is shown in Table 4. The outlet pressure was taken to be equal to (1 bar) according to the downstream water level. Also, the rotational speed of the turbine runner was defined. The turbine runner with a shaft was defined in the turbine model as a rotational body about its centroidal axis.
The results of the steady flow calculations were taken as the initial flow field for the complete unsteady flow passage. A time step of 0.001 s and runner rotating speeds of 3.352 and 3.2839 rad/s were chosen for the minimum and maximum upstream water levels shown in Table 2. For each time step, the turbine runner will rotate with angles of 1.53° and 1.5°, but for total time steps of 5000, the turbine runner should rotate by more than one cycle.
The reaction turbines represent one of the largest hydraulic structures. Water pressure applies force on the runner blades, and this pressure decreases throughout a running turbine; this phenomenon is presented in both the Francis and Kaplan turbines. The runner and the blades of the turbines are fully immersed in water, and they must be sufficiently strong to resist the operating pressure. The generated electric power of the turbine units is given in Formula (1) [34,35]:
  P = ρ · Q · g · H · η  
where P is the generated electric power(watt), ρ is the water mass density (kg/m3), Q is water discharge(m3/s), g is the acceleration due to gravity (9.81 m/s2), H is the water head(m), and η is the efficiency of the hydropower.
The energy of the turbines E is defined as can be seen in Equation (2) [36]:
  E = g · H t = ( p 1 p 2 ρ ) + ( V 1 2 V 2 2 2 ) + g · ( z 1 z 2 ) + g · h e a d   l o s s 1 2  
where Ht is the water head of turbine (m), g is the acceleration gravity (9.81 m/s2), p1 is the upstream pressure (pa), p2 is the downstream pressure (pa), V1 is the upstream velocity (m/s), V2 is the downstream velocity(m/s), z1 is the upstream elevation (m), and z2 is the downstream elevation (m). Section 1 and Section 2 are defined as the upstream and downstream measurements of the turbine, respectively. The determined behavior of the hydraulic turbine models is based on a dimensional analysis. Laboratory developments and model tests can guarantee the hydraulic behavior and the turbine efficiency (Iryo and Rowe 2003). The International Electrotechnical Commission standards 60193 and 60041 define all the simulation rules [37,38]. The specific speed of a turbine based on these standards is defined in the following formula [35,39]:
  n Q E = n · Q ( g H n ) 3 4  
where n is the rotational speed of turbine runner, and Hn is the net head of the turbine. The parameter nQE is known as the specific speed, which is a general relationship that combines the main parameters governing geometrically similar turbines operating under dynamic conditions.
Numerous statistical studies on reaction turbines have established a correlation between the speed and net head for each type of turbine. The Schweiger and Gregory correlation formulae for Kaplan turbines are defined as [40]:
  n Q E = 2.294 H n 0.486  
Table 5 shows the inlet total head results obtained by running the turbine model at different speeds (shown in Table 4), for each of the five trails where upstream water levels were different. The inlet head calculations were then used to evaluate the inlet pressure that provides the total head at penstock inlet closest to the upstream water level.
The differences between the upstream water levels and the total inlet head evaluated by operating the turbine model at five water levels are listed in Table 4. The results outlined that the maximum difference between the upstream water level and total head estimated at the inlet of Haditha turbine model was equal to 1.83 m, which was equivalent to the maximum relative error of 1.27%. The head loss varies according to the type of flow that is classified depending on the Reynolds number and the types of pipes (smooth or rough), indicating that there is no unique value for head loss in the turbulent. The rotational turbine speed also varies according to the gross head and discharge obtained from the dam site visit.
The velocity distribution along the penstock of turbine model unit varied with a change in cross-sectional area. Meanwhile, based on the continuity equation, the velocity gradually increased from the spiral case to the turbine runner, based on the cross-sectional area. The velocity flow lines followed a spiral shape in the draft tube because of the rotational motion of the turbine runner. Figure 5a illustrates the velocity flow lines inside the unit of Haditha Kaplan turbine. The results show that the maximum flow velocity occurred at the runner region, and it was found to be 50 m/s at the 150.2 m upstream water level.
The distribution of the boundary pressure in the units of the Haditha turbine are shown in Figure 5b. This represents the case of the turbine running under the maximum upstream water level. The results showed that pressure distribution was proportional to the inverse of velocity, and this was in line with the energy equation. However, the drop-in pressure occurring in the turbine shaft was greater than the cavitation pressure. The pressure distribution and velocity flow lines were in agreement with that found in the literature [38].

4.2. Dynamic Analysis Results of the Dam Model Connected with the Turbine Model

The actual stress situation in the body of the dam is complex, and it may differ from the calculated stress during the design stage. The differences may be too high and they may lead to extensive dam damage. This inconsistency can be attributed to the construction process, thermal stress during the construction and operating period, water pressure in the reservoir, penetration of turbine outlets in dam body, base deformation, or connections and differences between the actual values and predicted values of the mechanical and thermal properties of the materials. A comprehensive exploration of the hydropower plant operation was conducted in order to reduce the principal stress on the dam structure. Finite element computation and analysis was developed to investigate the optimal hydropower running with sustained long life for the earthfill dam by focusing on Haditah dam in Iraq as a case study.
The dam model was created to evaluate the principal stresses of the dam–turbine–reservoir foundation system with changing water levels from the maximum drawdown to the flood level. The fluid–solid connection, hydrostatic pressure, and gravity were defined. The latter was determined according to the water level and the foundation depths.
Figure 6 shows the ANSYS software GUI options (connection between CFX and STATIC STRUCTURAL parts), and Figure 7 illustrates the ANSYS-CFX solution that represents the 3D turbine model, and its connection with the ANSYS-static structural setup that represents the Haditha dam model. The holes in the structural model stand for the six turbine locations. This framework was used to transform the results of turbine model for the boundary-pressure pattern to the common area between the dam body and six holes that represent the turbine unit locations at the same water level.
The dam with turbine framework was run for maximum drawdown and flood upstream water levels, after considering all possibilities of the turbines operation (single, two, three, four, five, or six units) that minimizes the principal stresses in selected points of the dam body (as outlined in Figure 7a). The results and technique applied for the Haditha dam are compared with the related corresponding results.
Figure 7b illustrates the concrete part of the Haditha dam model with six holes, representing the region of the turbine units and the pressure pattern on one turbine hole, which was transformed from the 3D turbine model. The results show that the pressure is gradually decreased from the unit inlet to the unit outlet. This decrease includes friction losses that are governed by the energy equation.
Figure 8 shows the pattern of maximum principal stress at the selected nodes of the turbine concrete part when the turbine units are operating under full loading case. In order to cover all the possibilities of running the six turbines inside the powerhouse, the patterns of boundary pressure of Haditha dam with one Kaplan turbine framework were imported from the ANSYS-CFX turbine mode that was run 130 times (65 times with the flood upstream water level and 65 times with maximum drawdown upstream water level).
In this study, the six turbines in the power house of Haditha dam were numbered 1, 2, 3, 4, 5, and 6 (Figure 8). Figure 8 shows the critical points on the Haditha dam body, while Figure 9 shows the values of the maximum principal stresses at these points. The stresses resulted from the combined operation of any of the three turbines. The maximum value of the principal stress was found to be 1400.8 kPa, and it occurred on the region combining the turbine shaft with the outlet. A total of 130 turbine operation scenarios were conducted in order to determine the operation scenario that could give the minimum principal stress.
Table 6 indicates that the turbines’ operations had minimal effect on the values of minimum principal stress. This was attributed to the distance from the minimum stress region to the turbine locations. The percentage of the change of these values in the maximum drawdown and flood water levels were equal to 0.01% and 0.03%, respectively. Based on the fluctuation of the pressure values, the points in the base of the cone and the draft tube near the outlet of powerhouse were mostly affected by the turbines’ operation. For the various operation scenarios, the maximum difference in the principal stress due for the maximum water level was found to be 352.8 kPa, whereas it was 225 kPa for the minimum water level.
Table 7 shows the ranges of principal stresses associated with the best combination of turbine operation. Four colors were used to show the ranges of the principal stresses from minimum maximum and these colors are blue, green, yellow, and red.
Figure 10 shows the number and location of the operated turbines. The total operation scenarios were 130 (65 operation scenarios based on the maximum reservoir water level and another 56 operation scenarios based on the minimum reservoir water level). The best operation scenario is highlighted in blue, as shown in Figure 10.
The results from this study can help to understand the impact of the operation strategies on the load variations and the lifetime of the equipment of the hydropower plant. Therefore, the topics debated in this paper were more relevant and beneficial for research on dam engineering.

5. Conclusions

The efficiency of the powerhouse system is highly significant for dam stability and sustainability. Studying the seismic loading on the dam body in addition to the draft tube reaction turbine efficiency is extremely important for hydraulic and water resource engineering prospectives. The Draft tube is one of the essential components of the powerhouse system located downstream of the reaction turbines. The main goal of this draft tube is to convert the high impacted kinetic energy at the turbine runner outlet into pressure energy as gradually as possible. However, the constructed draft tube may initiate turbulent flows and pressure fluctuations during operation, and hence solving this problem is extremely significant for the sustainability of the dam body. This research provided a detailed analysis on the characteristics of the vertical Kaplan turbine influenced by changing water levels and discharge ranges. A case study located on the Euphrates river (i.e., Haditha dam) was selected for this work. Based on the analysis undertaken, several insights can be highlighted as follows:
  • Operation of the 3-D turbine model under various upstream water levels and discharge ranges enables a detailed analysis of the hydraulic characteristics of the reaction (Kaplan) turbines by evaluating the pressure pattern and velocity flowline distribution inside the turbine unit. A comparison of the total inlet head evaluated from running the turbine model with the upstream water level is used to validate the simulation from the turbine model.
  • The stress fluctuation in the dam body is proportional to the distance from the turbine region. Therefore, building the powerhouse as an integral part of the dam is more efficient than using a separate powerhouse. However, this condition affects the stress fluctuations, due to powerhouse operation on the dam body.
  • Running turbines had an insignificant effect on the values of the minimum principal stress. This is because the distance between the turbines is far from the region of the minimum stress value.
  • Due to the turbine running and fluctuations in principal stresses, the cone and outlet of the turbine unit of the powerhouse are the most affected regions.
  • Increasing the turbine outlet elevation with regard to the turbine blade elevations protects the turbine unit from cavitation.
  • Applying the control program for operating the six turbines in the powerhouse of Haditha dam shows that the minimum principal stresses can be obtained, and the operation scenario can increase the life time of Haditha dam–powerhouse–foundation system.

Author Contributions

Conceptualization, A.M.S.A.; Methodology, A.M.S.A.; Software, A.M.S.A.; Validation, A.M.S.A.; Formal Analysis, N.A.-A. and J.L.; Investigation, Z.M.Y.; Resources, Z.M.Y.; Data Curation, A.M.S.A.; Writing—Original Draft Preparation, Z.M.Y.; Writing—Review & Editing, T.A.M. and J.L.; Visualization, N.A.-A.; Supervision, T.A.M. and N.A.-A.

Funding

This research received no external funding.

Conflicts of Interest

The authors declare no conflict of interest.

References

  1. Lessard, J.; Murray Hicks, D.; Snelder, T.H.; Arscott, D.B.; Larned, S.T.; Booker, D.; Suren, A.M. Dam design can impede adaptive management of environmental flows: A case study from the Opuha Dam, New Zealand. Environ. Manag. 2013, 51, 459–473. [Google Scholar] [CrossRef] [PubMed]
  2. Aydan, Ö.; Uehara, F.; Kawamoto, T. Numerical Study of the Long-Term Performance of an Underground Powerhouse Subjected to Varying Initial Stress States, Cyclic Water Heads, and Temperature Variations. ASCE Int. J. Geomech. 2012, 12, 14–26. [Google Scholar] [CrossRef]
  3. Caetano de Souza, A.C. Assessment and statistics of Brazilian hydroelectric power plants: Dam areas versus installed and firm power. Renew. Sustain. Energy Rev. 2008, 12, 1843–1863. [Google Scholar] [CrossRef]
  4. Ledec, G.; Quintero, J.D. Good Dams and Bad Dams: Environmental Criteria for Site Selection of Hydroelectric Projects; Latin America and Caribbean Region Sustainable Development Working Paper Series, No. 16; World Bank Group: Washington, DC, USA, 2003; Volume 16, p. 21. [Google Scholar]
  5. Sousa Júnior, W.C.; Reid, J. Uncertainties in Amazon hydropower development: Risk scenarios and environmental issues around the Belo Monte dam. Water Altern. 2010, 3, 249–268. [Google Scholar]
  6. Locher, H. Environmental issues and management for hydropower peaking operations. Small Hydro Power News 2005, 22, 15–19. [Google Scholar]
  7. Akpinar, A.; Kömürcü, M.H.; Kankal, M. Development of hydropower energy in Turkey: The case of oruh river basin. Renew. Sustain. Energy Rev. 2011, 15, 1201–1209. [Google Scholar] [CrossRef]
  8. Wei, S.; Zhang, L. Vibration analysis of hydropower house based on fluid-structure coupling numerical method. Water Sci. Eng. 2010, 3, 75–84. [Google Scholar] [CrossRef]
  9. Al-Juboori, A.M.; Guven, A. Hydropower plant site assessment by integrated hydrological modeling, gene expression programming and visual basic programming. Water Resour. Manag. 2016, 30, 2517–2530. [Google Scholar] [CrossRef]
  10. Heckelsmueller, G.P. Application of variable speed operation on Francis turbines. Ing. Investig. 2015, 35, 12–16. [Google Scholar] [CrossRef] [Green Version]
  11. Palla, A.; Gnecco, I.; La Barbera, P.; Ivaldi, M.; Caviglia, D. An integrated GIS approach to assess the mini hydropower potential. Water Resour. Manag. 2016, 30, 2979–2996. [Google Scholar] [CrossRef]
  12. Gui, M.-W.; Chiu, H.-T. Seismic response of Renyitan earth-fill dam. J. Geoengin. 2009, 4, 41–50. [Google Scholar]
  13. Anup, K.C.; Thapa, B.; Lee, Y.H. Transient numerical analysis of rotor-stator interaction in a Francis turbine. Renew. Energy 2014, 65, 227–235. [Google Scholar] [CrossRef]
  14. Bahrami, S.; Tribes, C.; Devals, C.; Vu, T.C.; Guibault, F. Multi-fidelity shape optimization of hydraulic turbine runner blades using a multi-objective mesh adaptive direct search algorithm. Appl. Math. Model. 2016, 40, 1650–1668. [Google Scholar] [CrossRef]
  15. Bouaanani, N.; Paultre, P.; Proulx, J. A closed-form formulation for earthquake-induced hydrodynamic pressure on gravity dams. J. Sound Vib. 2003, 261, 573–582. [Google Scholar] [CrossRef]
  16. Qian, Z.; Yang, J.; Huai, W. Numerical simulation and analysis of pressure pulsation in Francis hydraulic turbine with air admission. J. Hydrodyn. Ser. B 2007, 19, 467–472. [Google Scholar] [CrossRef]
  17. Zhang, R.; Mao, F.; Wu, J.Z.; Chen, S.Y.; Wu, Y.L.; Liu, S.H. Characteristics and control of the draft-tube flow in part-load Francis turbine. J. Fluids Eng. 2009, 131, 21101. [Google Scholar] [CrossRef]
  18. Pennacchi, P.; Borghesani, P.; Chatterton, S. A cyclostationary multi-domain analysis of fluid instability in Kaplan turbines. Mech. Syst. Signal Process. 2015, 60, 375–390. [Google Scholar] [CrossRef]
  19. Zhang, H.; Zhang, L. Numerical simulation of cavitating turbulent flow in a high head Francis turbine at part load operation with OpenFOAM. Procedia Eng. 2012, 31, 156–165. [Google Scholar] [CrossRef]
  20. Kim, J.; Yoon, J.C.; Kang, B.-S. Finite element analysis and modeling of structure with bolted joints. Appl. Math. Model. 2007, 31, 895–911. [Google Scholar] [CrossRef]
  21. Yang, Y.; Chen, J.; Xiao, M. Analysis of seismic damage of underground powerhouse structure of hydropower plants based on dynamic contact force method. Shock Vib. 2014, 2014, 859648. [Google Scholar] [CrossRef]
  22. Dai, F.; Li, B.; Xu, N.; Zhu, Y.; Xiao, P. Stability evaluation on surrounding rocks of underground powerhouse based on microseismic monitoring. Shock Vib. 2015, 2015, 937181. [Google Scholar] [CrossRef]
  23. Fenves, G.; Chopra, A.K. Simplified earthquake analysis of concrete gravity dams: Separate hydrodynamic and foundation interaction effects. J. Eng. Mech. 1985, 111, 715–735. [Google Scholar] [CrossRef]
  24. Watanabe, H.; Kikuchi, K.; Cao, Z. Vibration modes of a rockfill dam based on the observations of microtremors and an earthquake. Thammasat Int. J. Sci. Technol. 1996, 1, 22–37. [Google Scholar]
  25. Lotfi, V. Seismic analysis of concrete gravity dams by decoupled modal approach in time domain. Electron. J. Struct. Eng. 2003, 3, 102–116. [Google Scholar]
  26. Jafari, M.K.; Davoodi, M. Dynamic characteristics evaluation of Masjed-soleiman embankment dam using forced vibration test. In Proceedings of the 13th World Conference on Earthquake Engineering, Vancouver, BC, Canada, 1–6 August 2004. [Google Scholar]
  27. Mircevska, V.J.; Bickovski, V.; Garevski, M. A 3D nonlinear dynamic analysis of a rock-fill dam based on IZIIS software. Acta Geotech. Slov. 2007, 4, 16–32. [Google Scholar]
  28. Lipej, A.; Jošt, D.; Meznar, P.; Djelic, V. Numerical prediction of pressure pulsation amplitude for different operating regimes of Francis turbine draft tubes. Int. J. Fluid Mach. Syst. 2009, 2, 375–382. [Google Scholar] [CrossRef]
  29. Jošt, D.; Lipej, A. Numerical prediction of non-cavitating and cavitating vortex rope in a francis turbine draft tube. Stroj. Vestn. J. Mech. Eng. 2011, 57, 445–456. [Google Scholar] [CrossRef]
  30. Dakoulas, P. Longitudinal vibrations of tall concrete faced rockfill dams in narrow canyons. Soil Dyn. Earthq. Eng. 2012, 41, 44–58. [Google Scholar] [CrossRef]
  31. Adamo, N.; Al-Ansari, N. Mosul dam full story: Safety evaluations of mosul dam. J. Earth Sci. Geotech. Eng. 2016, 6, 185–212. [Google Scholar]
  32. Sissakian, V.K.; Adamo, N.; Al-ansari, N. A comparative study of mosul and haditha dams, Iraq: Geological conditions. Earth Sci. Geotech. Eng. 2018, 9040, 35–52. [Google Scholar]
  33. Liu, S.; Li, S.; Wu, Y. Pressure fluctuation prediction of a model Kaplan turbine by unsteady turbulent flow simulation. J. Fluids Eng. 2009, 131, 101102. [Google Scholar] [CrossRef]
  34. Vilanova, M.R.N.; Balestieri, J.A.P. Modeling of hydraulic and energy efficiency indicators for water supply systems. Renew. Sustain. Energy Rev. 2015, 48, 540–557. [Google Scholar] [CrossRef]
  35. Samora, I.; Hasmatuchi, V.; Münch-Alligné, C.; Franca, M.J.; Schleiss, A.J.; Ramos, H.M. Experimental characterization of a five blade tubular propeller turbine for pipe inline installation. Renew. Energy 2016, 95, 356–366. [Google Scholar] [CrossRef]
  36. Temiz, A. Decision Making on Turbine Types and Capacities for Run-of-River Hydroelectric Power Plants a Case Study on Eglence-1 Hepp. Master’s Thesis, İzmir Institute of Technology, İzmir, Turkey, 2013. [Google Scholar]
  37. Feintuch, P. The international electrotechnical vocabulary of the international electrotechnical commission. Meta 1989, 34, 539–541. [Google Scholar] [CrossRef]
  38. Becker, D. Harmonizing the International Electrotechnical Commission Common Information Model (Cim) and 61850; Technical Report; Electric Power Research Institute (EPRI): Palo Alto, CA, USA, 2010. [Google Scholar]
  39. Muis, A.; Sutikno, P.; Soewono, A.; Hartono, F. Design optimization of axial hydraulic turbine for very low head application. Energy Procedia 2015, 68, 263–273. [Google Scholar] [CrossRef]
  40. Slootweg, J.G.; de Haan, S.W.H.; Polinder, H.; Kling, W.L. General model for representing variable speed wind turbines in power system dynamics simulations. IEEE Trans. Power Syst. 2003, 18, 144–151. [Google Scholar] [CrossRef] [Green Version]
Figure 1. (a) Location map of Haditha dam on the Euphrates river, (b) Haditha dam coordinates, and (c) Haditha dam layout.
Water 10 01270 g001aWater 10 01270 g001b
Figure 2. (a) Downstream of Haditha dam with a spillway and power station outlets, and (b) visualization of the 3-D model of the vertical Kaplan unit with full dimensional details.
Water 10 01270 g002
Figure 3. The dam–reservoir–foundation system of Haditha dam.
Water 10 01270 g003
Figure 4. The concrete part of Haditha dam includes the spillway and powerhouse, and the 3-D FE model of the Haditha dam, includes the turbine units.
Water 10 01270 g004
Figure 5. Example of the graphical presentation of (a) the velocity flow lines and (b) the pressure distribution in the Haditha turbine unit.
Water 10 01270 g005
Figure 6. The connection between the ANSYS-CFX solution and the STATIC-STRUCTURAL setup.
Water 10 01270 g006
Figure 7. (a) The concrete part of Haditha dam with numbering the turbines and (b) the 3-D numerical model transforming the pressure pattern from the Haditha turbine model to the boundary of turbine unit number 6.
Water 10 01270 g007
Figure 8. The selected points to measure the principal stress and its distribution in the concrete part of Haditha dam in maximum drawdown with six turbines operating.
Water 10 01270 g008
Figure 9. The principal stress values in the selected points of the Haditha dam body due to running three turbine units at a maximum upstream water level.
Water 10 01270 g009
Figure 10. Control program for the running turbines in the Haditha powerhouse based on minimizing the principal stress.
Water 10 01270 g010
Table 1. The dimensions and hydraulic information of Haditha dam.
Unit
Location of Haditha dam 34°12′25″ N 42°21′18″ E
Dam Dimensions
Dam heightm57
Lengthm9000
Hydraulic Information’s
Type of turbines Vertical Kaplan
Number of units 6
Install capacityMW6 × 110 = 660
Length of unitm67.35
Flood levelm150.2
Maximum drawdown in upstream water levelm129
Downstream water levelm107.3
Maximum powerhouse dischargem3/s6 × 339 = 2034
Table 2. The ANSYS-CFX turbine model validation compared with the Newmark numerical method results, and the ANSYS dam model validation compared with Masjed–Soleiman (MS) embankment dam (forced vibration test).
ANSYS-CFXNewmark Numerical MethodANSYS-CFXNewmark Numerical MethodANSYSForced Vibration Test
Velocity vector V (m/s)Velocity vector V’ (m/s)Pressure distribution P (kPa)Pressure distribution P’ (kPa)Frequency f’ (Hz)Frequency f’ (Hz)
00−475−4803.583.5
4.93755−160−1603.913.9
9.875101551604.384.4
14.8125154704804.754.7
19.75207858006.216.1
24.687525110011207.026.9
29.62530141514408.178.1
34.526253517301760
39.540
Table 3. The mesh details of the Haditha Kaplan turbine and dam models.
Mesh Details of Turbine and Dam ModelsNodesElementsMax. Aspect RatioMinimum Orthogonal Quality
Haditha Kaplan turbinewater9785833217463010.7060.23896
turbine180894640198810.7060.23896
Haditha damfoundation1596798967068
water572656315930
Left embankment side396880224558
Right embankment side12639471282
Concrete part includes powerhouse and spillway18427861215094
Table 4. Hydraulic data of the Haditha powerhouse turbine, including up-stream water levels (U/S.W. L), the flowrate (Q), the velocity (V), and the rotational speed of the turbine runner (N).
No.U/S.W. L (m)Net Head (m)NQEQ (m3/s)Veinlet (m/s)N (rad/s)
Haditha Turbine
112918.50.67791001.50383.3520
2134.325.50.58001181.77443.3586
3139.632.50.51551362.04513.3353
4144.939.50.46891512.27073.3326
5150.246.50.4331169.52.54893.2839
Table 5. Total head with the percent of error calculation at the inlet of the Haditha turbine unit.
No.U/S.W. L (m)Q (m3/s)Vinlet (m/s)v2/2g (m)p/γ (m)Z (m)Einlet = v2/2g + p/γ + ZError %
11291001.50380.1223.71105.25129.080.06
2134.31181.77440.1628.98105.25134.390.07
3139.61362.04510.2134.47105.25139.930.24
4144.91512.27070.2637.54105.25143.061.27
5150.2169.52.54890.3346.22105.25151.801.06
Note: 2/2g is the velocity head at the inlet of turbine, p/γ is the pressure head at the turbine inlet, Z in the average elevation head at the turbine inlet, and Einlet is the total head calculated at the turbine inlet.
Table 6. Statistical analysis of the principal stress results of the Haditha dam according to the running turbines at maximum and minimum upstream water levels.
Minimum Water LevelInletMid InletOutletMid OutletD/S Spillwaymid Crestl.s Creste.l.s. CrestMinMax
Maximum (kPa)−181−103−83673979.225.941−9631311
Minimum (kPa)−215−184−138412070.020.121−9641086
Difference (kPa)33.781.15526189.25.8200.1225
Percent (%)18.5478.496638471122490.0117
Maximum Water LevelInletMid InletOutletMid OutletD/S Spillwaymid Crestl.s Creste.l.s. CrestMinMax
Maximum (kPa)−17−68−1218029957735−9661400.8
Minimum (kPa)−39−125−160451873569−9661048.0
Difference (kPa)21563834102120260.3352.8
Percent (%)125813143372327740.0325.19
Note: l.s is the left side of the crest and e.l.s. is the end of the left side of crest.
Table 7. Haditha principal stress classification.
Principal Stress Range (kPa)RankingIndicator
1000 ≤ σmax ˂ 1100Excellent
1100 ≤ σmax ˂ 1200Good
1200 ≤ σmax ˂ 1300Acceptable
1300 ≤ σmax ˂ 1400Not acceptable
Note: σmax is the maximum Principal stress.

