1. Introduction
Built even in ancient times [
1,
2], green roofs have emerged as one of the most effective methods of distributed storm water control in contemporary cities, particularly where storm water runoff can cause flooding, sewer surcharges and overflows, and pollutant loading to receiving waters [
3,
4,
5,
6]. In dense cities with limited undeveloped space, one key advantage of green roofs over other types of green infrastructure (GI) is that they can be retrofitted onto existing buildings [
7]. As the pilot phase of GI implementation in many US cities comes to an end, street-level runoff capture sites are increasingly scarce, making rooftops, which typically account for 20–25% of impervious cover in American cities [
8,
9], one of the next big opportunities for decentralized urban storm water management. Precipitation incident to green roofs is intercepted, detained, and evapotranspired, reducing the volume of roof runoff while also delaying and lowering the peak rate of discharge [
10,
11,
12]. A review of some of the key hydrologic processes at work in green roofs was provided by Stovin et al. [
13].
Green roofs can be classified based on the thickness of the substrate layer as either intensive (substrate thickness > 150 mm) or extensive (substrate thickness < 150 mm) [
10,
14,
15]. Intensive green roofs with thicker soil layers can accommodate larger vegetation resulting in higher retention rates, but often require building reinforcements or retrofits to support the additional weight, which also increases the initial costs of installation. Extensive green roofs have much thinner substrate layers and can be installed at a lower cost, often without the need for reinforcements [
7,
16].
The hydrologic performance of green roofs has been extensively studied in both monitoring and modeling studies. Fifty of the more than 1200 Web of Science papers referencing green roofs investigated their hydrology [
10,
11,
12,
13,
14,
15,
16,
17,
18,
19,
20,
21,
22,
23,
24,
25]. Two decades of early European (mostly German) green roof monitoring was reviewed by Mentens et al. [
14]. A decade of literature from field and controlled experiments was reviewed by Berndtsson [
10] and later updated by Li and Babcock [
19] and Carson et al. [
20]. The most recent summary of studies on the hydrologic performance of green roofs was published in 2016 by Cipolla et al. [
21]. These studies generally suggest that the performance of individual systems varies widely due to differences in local climate and microclimate [
22]; incident precipitation amounts, intensities, and durations [
14]; the type [
23] and depth of the growing medium [
14,
23]; and the presence [
23] and type [
24,
19] of vegetation. Seasonal differences have also been observed, with more runoff leaving the systems during winter [
25,
14].
Many computer simulations of green roof hydrology have also been attempted. Modeling approaches have advanced in number and sophistication since 2007, when Elliot and Trowsdale [
26] reported that only one model (e.g., Water Balance Model) could be used to model green roof hydrology explicitly. Recent modeling efforts represent green roof storm water attenuation using runoff coefficients or curve numbers [
27,
28,
29,
30] and use more elaborate physically-based models such as HYDRUS-1D (Prague, Czech Republic) [
31,
32,
33] to represent saturated and unsaturated flow patterns.
Given its extensive use in contemporary urban storm water planning, the Environmental Protection Agency Storm Water Management Model (EPA-SWMM) has also been used to simulate green roof hydrology. In early versions of the software, green roofs could only be represented in ad hoc ways, for example, using storage nodes [
27]. SWMM 5.1 and subsequent versions, include the Low Impact Development Green Roof (LID-GR) module to explicitly represent the properties of a green roof’s various layers: surface, media, and drainage layer. Despite the widespread use of SWMM’s LID-GR in planning studies throughout the world [
34,
35,
36,
37], few attempts to validate it with actual monitoring data have been attempted. Burszta-Adamiak and Mrowiec [
38] used another SWMM LID control (the bio-retention control or LID-BR) to perform single-event simulations from a small-scale (~3 m
2) system, with mixed success. Calibration of the model to match the observed runoff volume greatly overestimated the peak rates of runoff, whereas calibration of the peak rates underestimated the volume. Though both the peak rate and total volume of runoff were underestimated, Palla and Gnecco [
39] had greater success. Their single-event simulations were also based on observations from small-scale systems (~2.5 m
2) but achieved Nash Sutcliff Errors of >0.78 using SWMM’s LID-GR.
In continuous simulations, additional provisions are required to adequately represent evapotranspiration between rain events. Cipolla et al. [
21] used the LID-BR in SWMM to model a full-scale (120 m
2) green roof in a one-year-long continuous simulation. Daily potential evapotranspiration was estimated using the Hargreaves equation based on local air temperature and radiation, modified to account for the sedum found at the site, using monthly soil recovery coefficients developed by the authors. Good agreement with experimental observations was found. Krebs et al. [
40] used SWMM’s LID-GR control to perform continuous simulations of small-scale (2 m
2) for growing seasons of two different years, including inter-event periods. SWMM’s Potential Evapotranspiration (PET) values were corrected using a coefficient to account for the influence of vegetation on evapotranspiration (ET) rates. Good agreement with the observations was found, though the model results were highly sensitive to the soil and drainage layer parameters and the ET coefficient, and hydrograph recession limbs were not well simulated. The authors suggested that crop coefficients for shorter periods of time should be attempted.
The goals of this paper were: (1) to present long-term rainfall-runoff observations from three 186 m
2 drainage areas of the Jacob K. Javits Convention Center (JJCC) green roof (40.7578° N, 74.0027° W) in New York City; (2) to further investigate the accuracy with which SWMM’s LID-GR control can be used to represent long-term rainfall-runoff relationships in continuous simulations when PET values are adjusted for moisture availability; and (3) to use the calibrated model to explore the storm water capture implications of different depths and configurations of green roofs in New York City. The research is novel for several reasons. First, the size of this green roof (currently the second largest in the United States) and its many internal roof drains required installation of a unique monitoring system to direct runoff from three 186 m
2 custom-designed rooftop drainage areas into Parshall flumes for runoff measurement. Second, to the best of our knowledge, no prior research has attempted to validate SWMM’s LID-GR control in continuous simulations of runoff from a large-scale green roof with ET rates adjusted for soil moisture availability. Finally, the study is novel because it is situated in New York City, which has a
$1.4 billion USD plan [
41] to capture 25 mm of precipitation over 10% of the city’s impervious surfaces using various forms of GI, including green roofs. As opportunities for street-level GI implementation become fewer, the city is interested in cost-effective strategies for managing stormwater from its more than 56 million m
2 of rooftops [
41]. It has been estimated that by greening all rooftop space in New York City air temperature could be reduced by an average 1.6 °C, annual stormwater reduced by 38 billion liters, and energy cost savings amounting to roughly
$130 million USD each year achieved [
12,
41]. Research documenting the hydrologic benefits of green roofs in New York City’s unique urban climate is a first step toward evaluating whether such goals are achievable.
2. Materials and Methods
2.1. Site Description
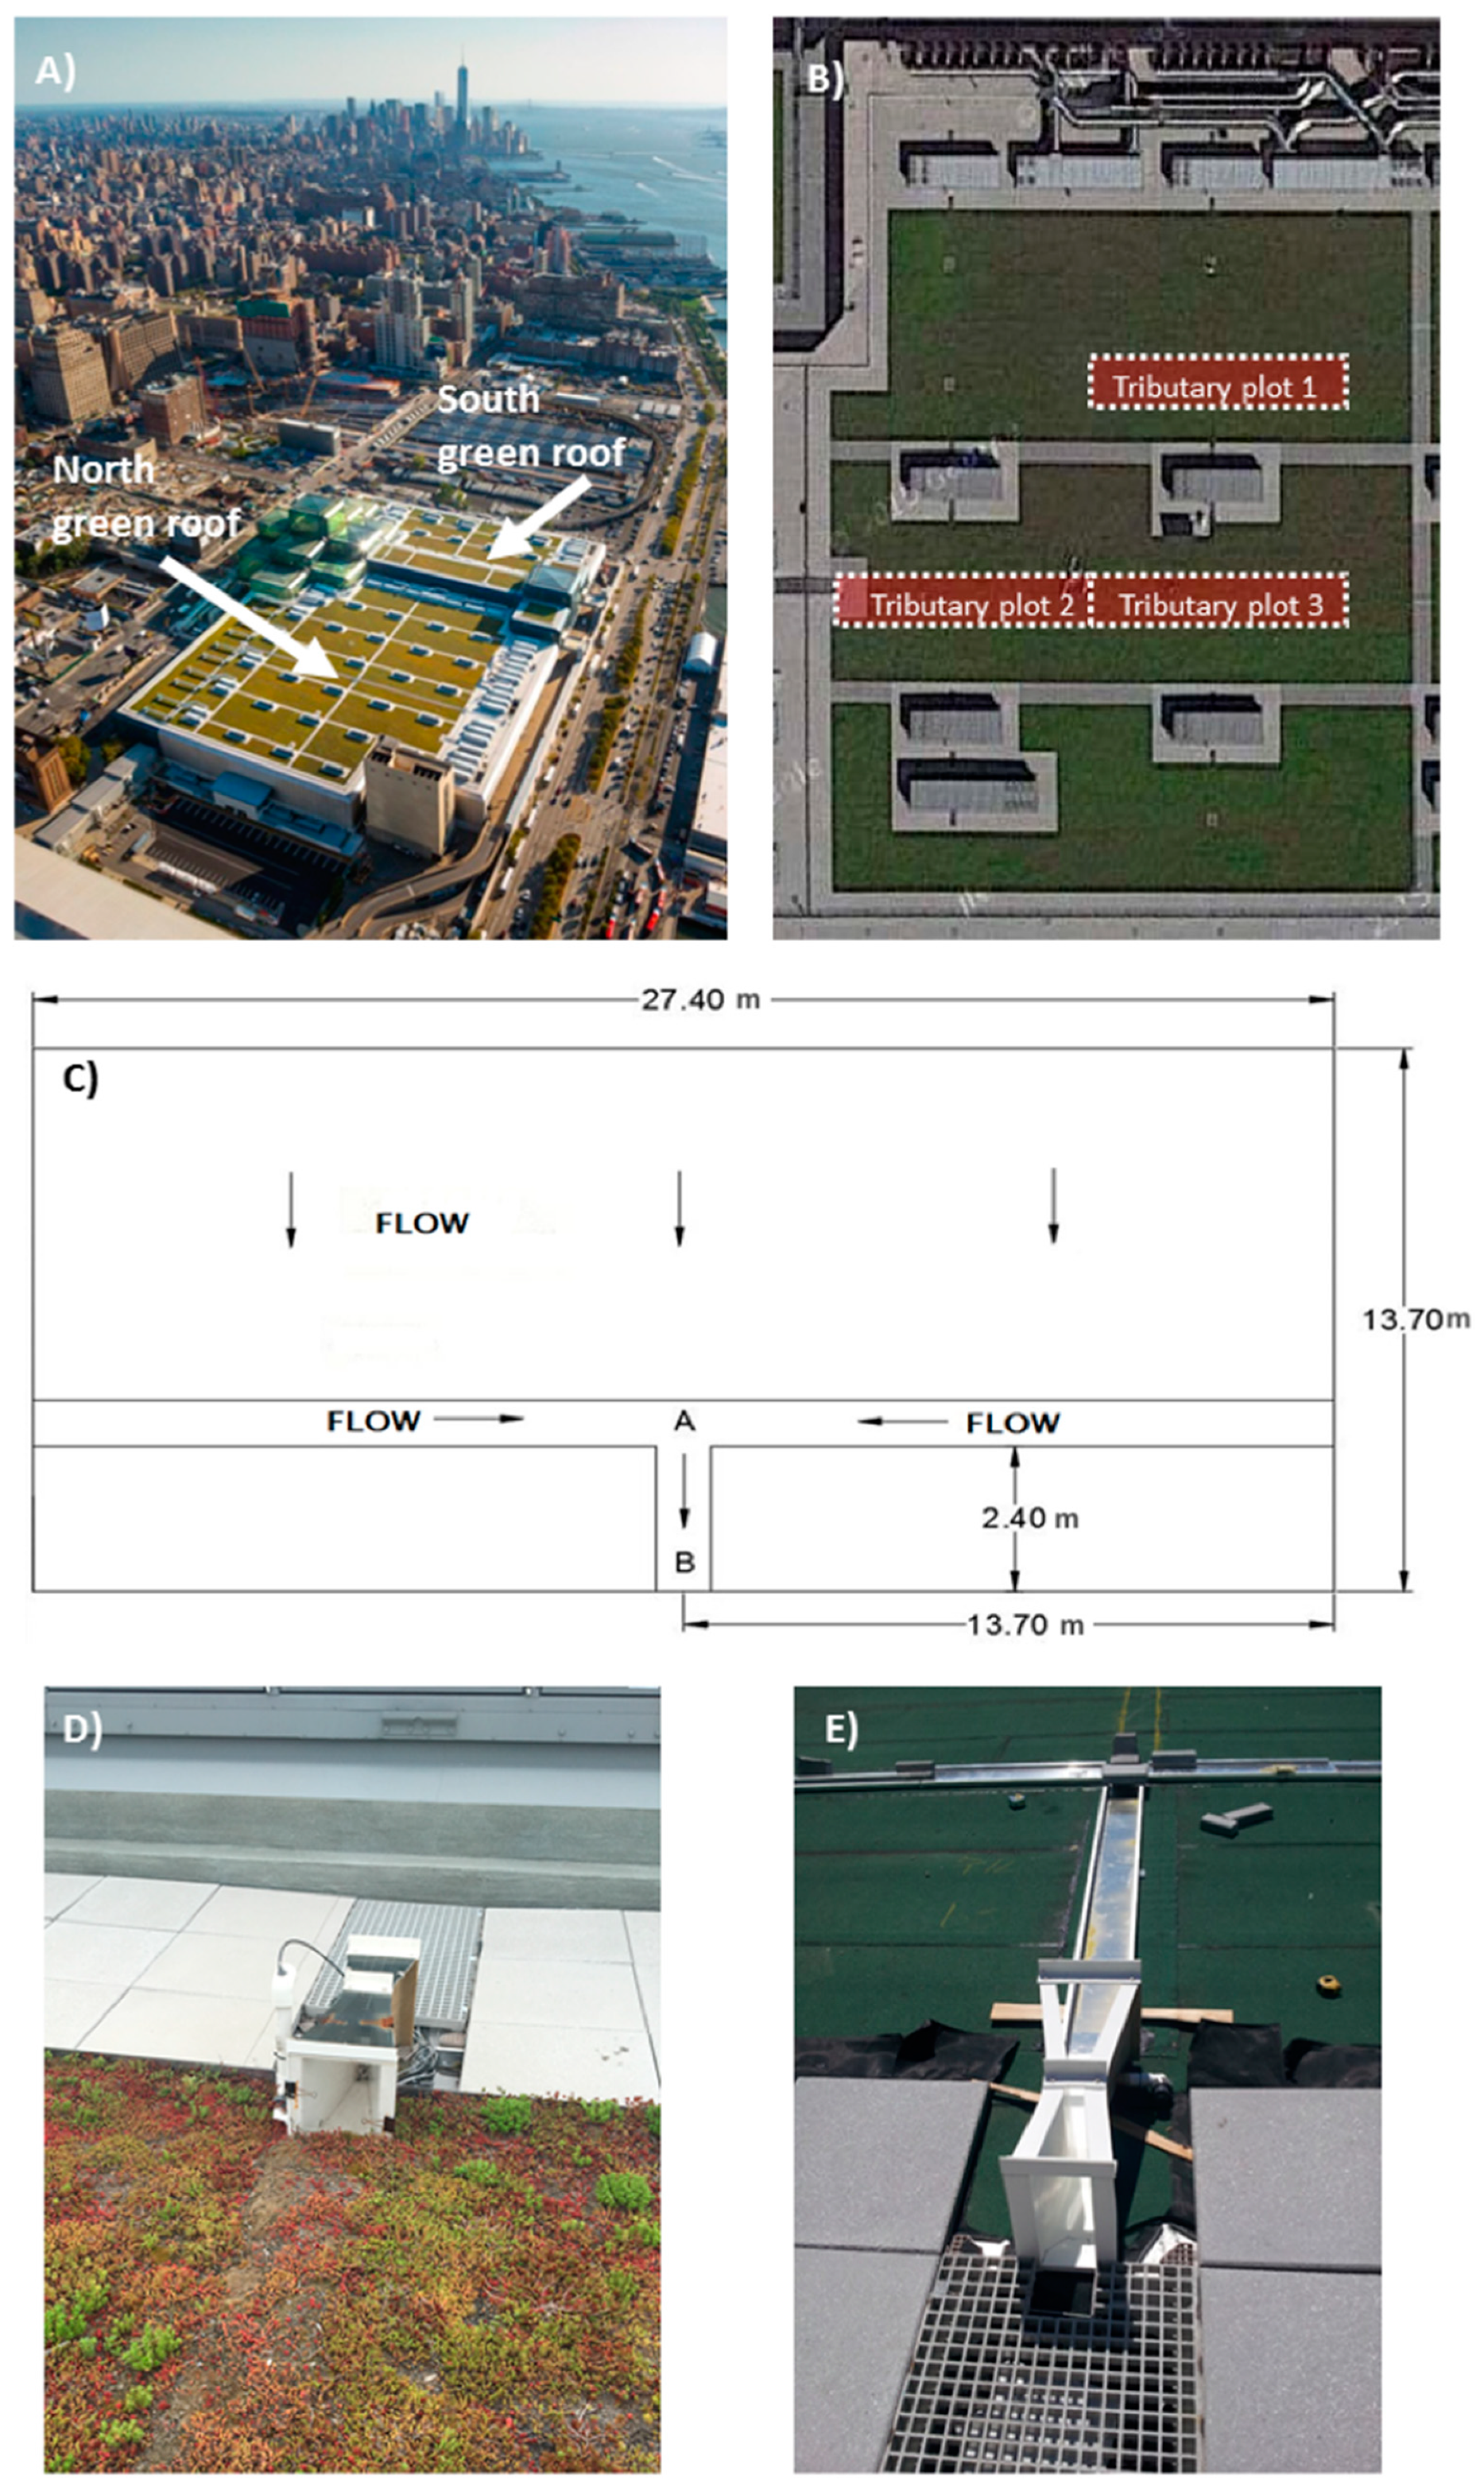
The Jacob K. Javits Convention Center’s 27,316 m
2 extensive green roof (JGR) was completed in the spring of 2014, stretching across both the northern and southern wings of the building (
Figure 1A). In section, the design consists of a pre-vegetated sedum mat installed on top of a 25.4 mm growing medium, a retention fleece layer, a drainage layer, and a root barrier, as described in Alvizuri et al. [
42]. The XF301 pre-vegetated sedum mat (XeroFlor, New York, NY, USA) was grown and obtained from various nursery farms in upstate New York, South Carolina, and the mid-west United States. The sedum mat is an integrated unit of plant materials and growing medium meshed onto a geotextile combing these components.
Per the manufacturer, the XeroTerr (XeroFlor, New York, NY, USA) growing medium is a low-organic/high-mineral content growing mix composed of composted plant materials and lightweight porous aggregate. Its mineral fraction includes heat-treated clay, slate, or shale and geologically-formed pumice. Its organic content, estimated at 7%, is formed from compost that is aged sufficiently to prevent unwanted microbial growth, weed seed survival, or re-sprouting of plant litter debris. Its grain size distribution can be represented by the percent of a typical batch passing the #4, #8, #16, #30, #50, and #100 sieves. These values are 75–95%, 35–80%, 15–50%, 10–25%, ≤10%, and ≤5%, respectively.
The XF157 (XeroFlor, New York, NY, USA) water retention fleece is a fabric composed of recycled fiber materials that provide a tough robust layer for plant roots to latch on and grow. The fleece also serves as a filter layer to screen water that may carry minerals from the growing medium layer or from the precipitation. The XF108H (XeroFlor, New York, NY, USA) drain mat is a geotextile layer attached to a mesh of polymeric fibers (2 mm thick) designed to create a clear space for excess water to drain out from the topmost layers.
Finally, the XF112 (XeroFlor, New York, NY, USA) root barrier is a nearly water-impermeable layer designed to deter the plant roots from establishing themselves any further down into the actual roof structure.
Runoff generated on the JGR flows into a series internal roof drains, spaced uniformly throughout the roof. Each roof drain conveys runoff generated by its associated tributary area to internal drain pipes, eventually discharging to the local combined sewer.
2.2. Overall Description of Monitoring Setup
A large number of sensors were installed on the JGR as part of a much broader investigation of its environmental performance, including a study of its ability to provide thermal buffering [
42]. Only those sensors used in the rainfall-runoff study conducted on the south roof are described here.
2.2.1. Weather Station, Drainage Channels, Flumes, and Weighing Lysimeters
A weather station positioned on the south roof logs climatic data at five-minute intervals on a Campbell Scientific, Inc. (Logan, UT, USA) CR1000 data logger. The station is equipped with a Texas Electronics, Inc. (Dallas, TX, USA) Series 525-Rainfall Sensor and other sensors to monitor temperature, net-radiation, relative humidity, wind speed, and wind direction, as summarized in
Table 1.
During installation of the JGR, custom-built aluminum drainage channels were affixed to the structural roof surface. The purpose of these channels was to clearly delineate three 186 m
2 tributary plots for runoff measurement (
Figure 1B). Each monitored tributary plot has a 27.4-m-long transverse and 2.4-m-long longitudinal section, forming a “T” in the plan view (
Figure 1C). Each transverse section was assembled from 2.4-long built-up aluminum box components with 11 boxes constituting the transverse section and one box for the longitudinal section (
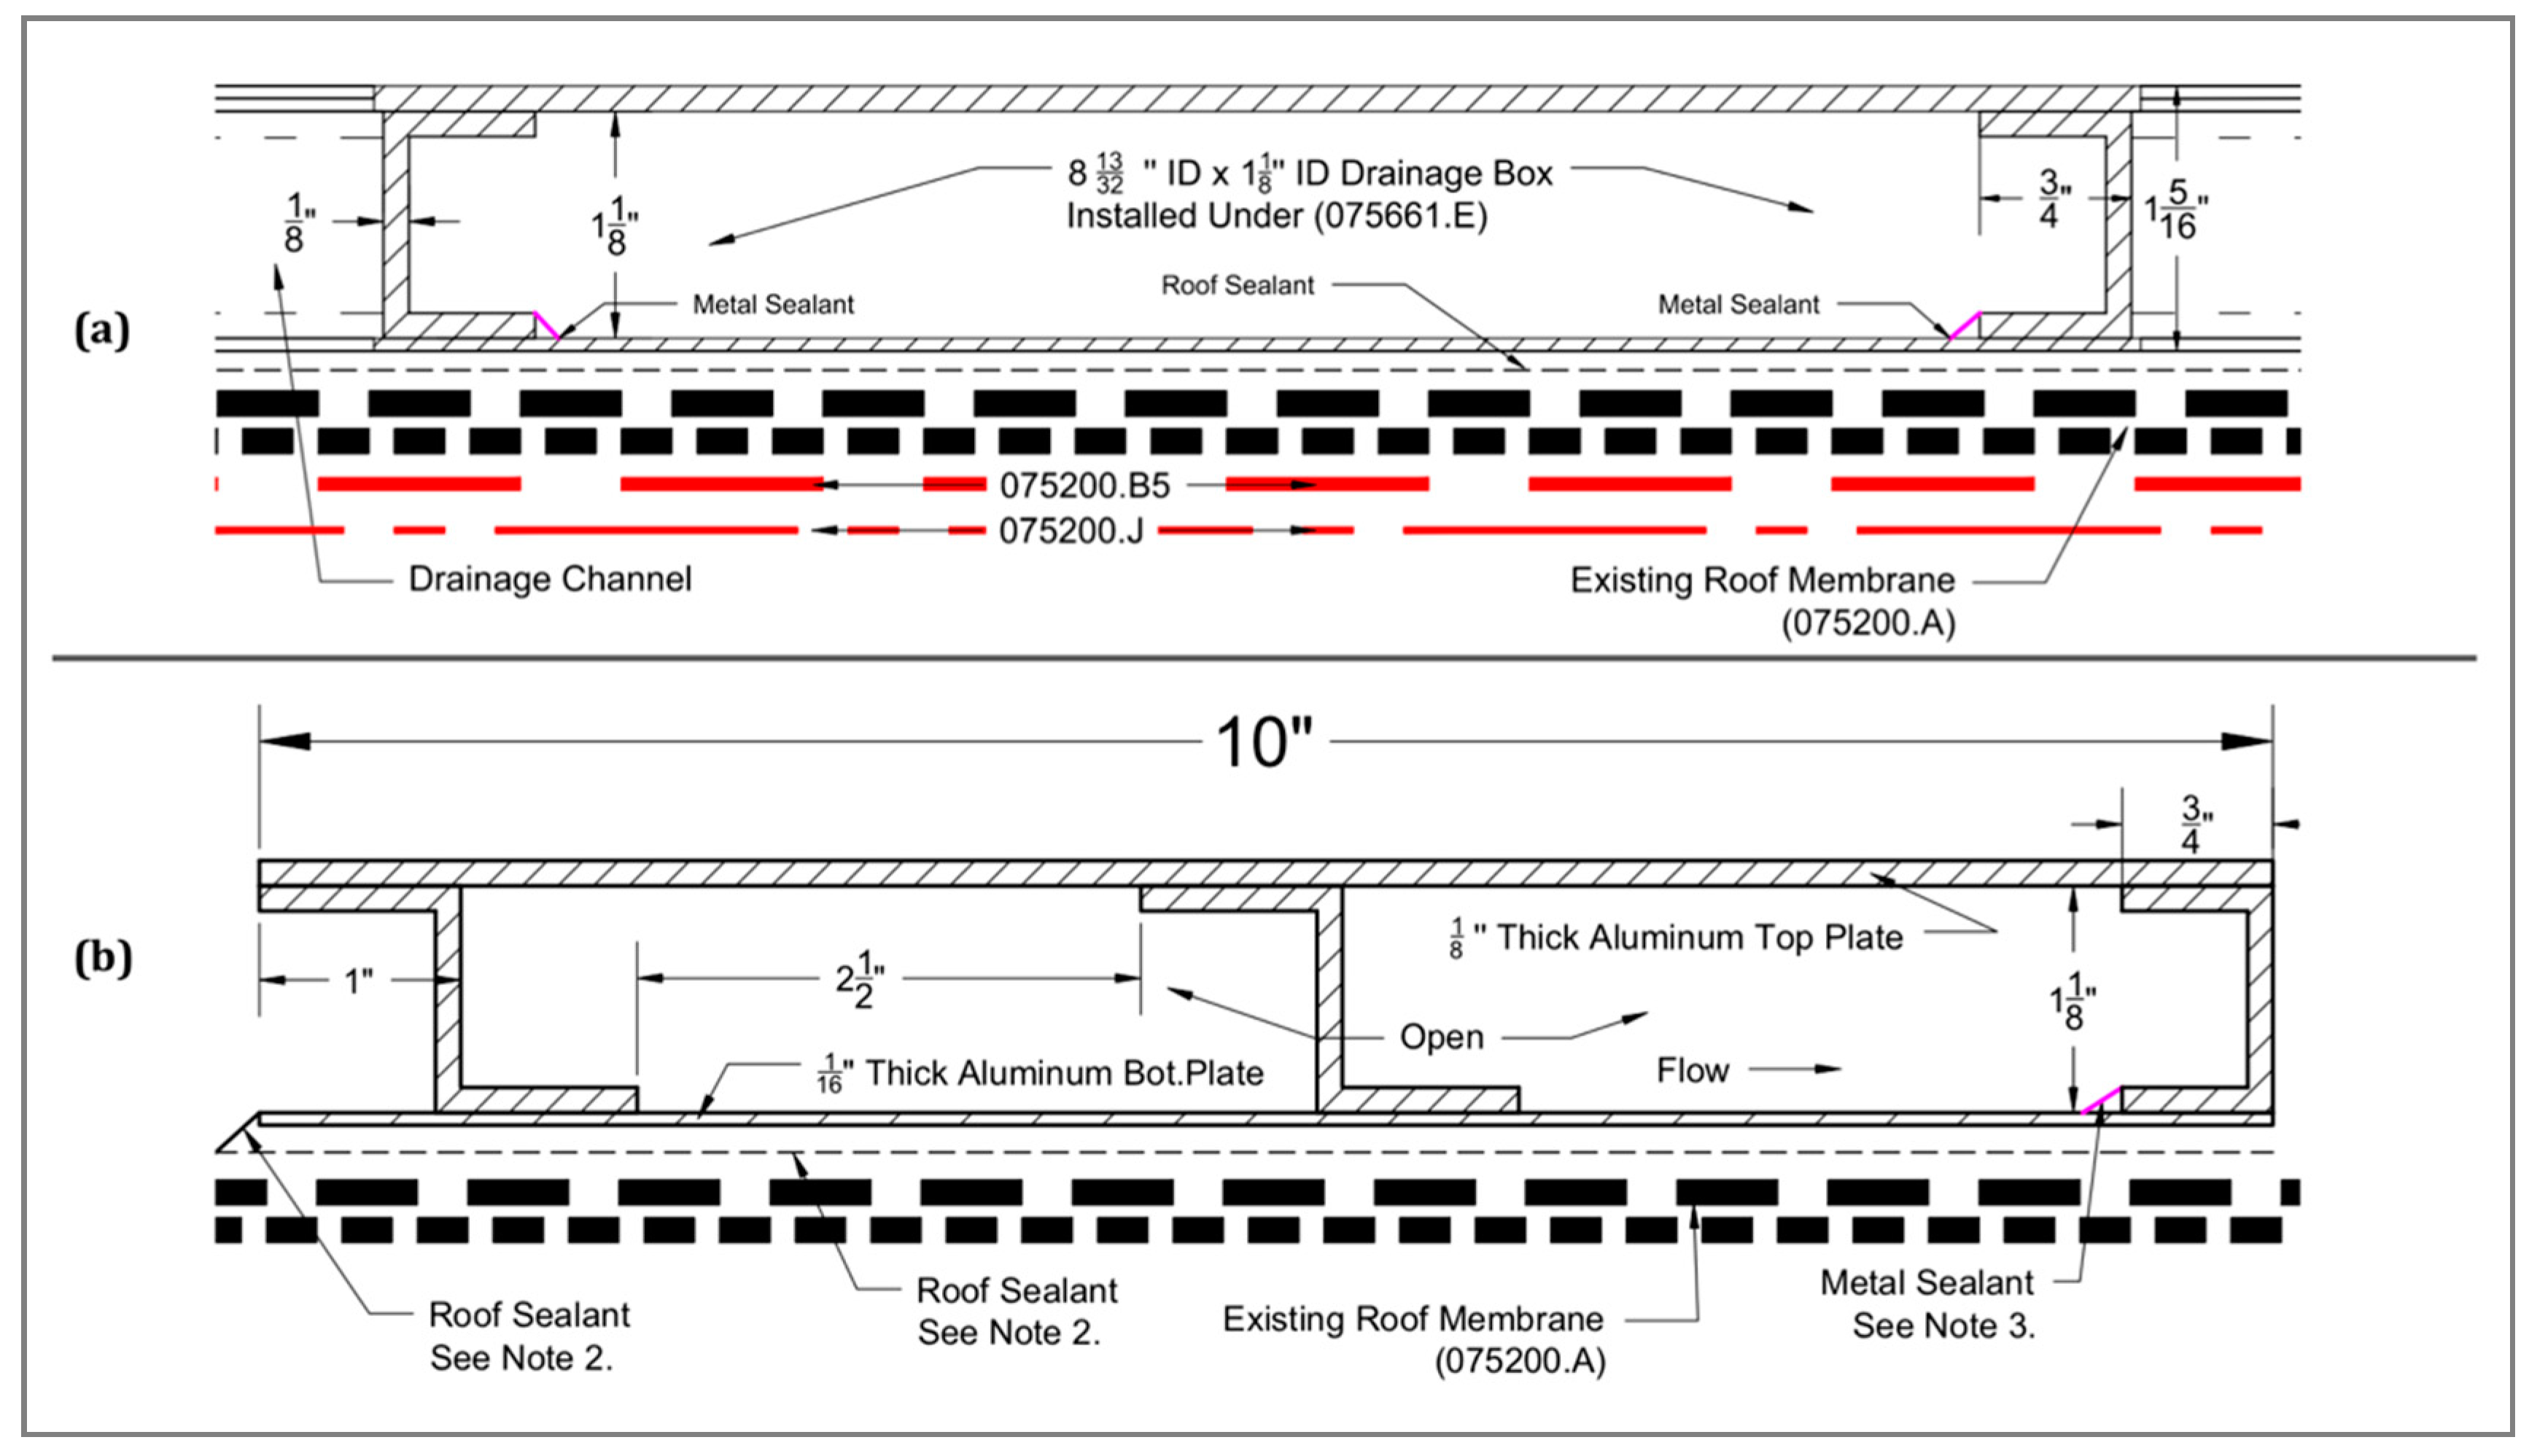
Figure 1E). This design allows the drainage channels to conform to the irregular slope of the roof top. The transverse section of each channel has a 30.5 × 2.86 cm cross section, whereas the longitudinal section has a 22.2 × 5.7 cm cross section (
Figure 2). These built-up boxes were constructed of aluminum 3003-H14 sheets and aluminum 6061-T6 sheets, 16 mm and 3.2 mm thick, respectively. The box sections are reinforced with aluminum 6063-T52 U-channels and aluminum Zee channel members. The Zee channel members are arranged with an offset to provide increased structural reinforcement of the box while allowing rain runoff to flow unimpeded within the box. The U channels are used to form the downstream edge of the boxes and are sealed tightly.
Parshall flumes (
Figure 3) equipped with pressure transducers were used to measure discharge from the end of each of the three channel systems (Point B in
Figure 1C). A Parshall flume imposes a critical flow condition within its throat so that the open channel discharge through it can be unequivocally obtained from measurements of the upstream water level. In this case, the upstream water level was measured continuously, also at 5 min intervals, with Campbell Scientific (Logan, UT, USA) CS451 pressure transducers, installed in a 51-mm-diameter polyvinyl chloride (PVC) well attached to the side of the Parshall flume. The pressure transducer was placed at the bottom of this well and continuously recorded the depth of water in the well to the data logger. The water level depths were converted to flow through the flume using a stage discharge curve obtained from the manufacturer:
where
Q is flow through the flume in m
3/s and
H is the upstream water level in meters.
The particular Parshall flume model selected for this study ((01-007) from Global Water (College Station, TX, USA), a division of Xylem (Rye Brook, NY, USA)) can measure flow rates between 2 × 10⁻⁵ and 1.92 × 10⁻² m3/s. This range was considered appropriate after estimating the peak flow rates expected from each 186 m2 plot under New York City’s 5-year, 15 cm/h design storm, which would yield 5.5 × 10⁻³ m3/s over each flume’s tributary catchment area. The flume is constructed of a durable, polyester resin, and fiberglass, has a 5.08 cm (2”) throat width, and is 77.5 cm long, 34.8 cm high, and 21.4 cm wide.
Three weighing lysimeters were installed in each of the flume’s three tributary areas. The weighing lysimeters consist of a square piece of green roof matrix enclosed in a 0.372 m2 metal box. The metal box rests on a custom 0.372 m2 Rice Lake Roughdeck (Rice Lake, WI, USA) mild steel platform scale equipped with four mild steel load cells. The maximum capacity of the scale is 227 kg with a 0.02 kg resolution. The lysimeter system extends 0.19 m above the bare roof, corresponding to a total extension of 0.089 m above the green roof. Although physically isolated from the green roof, each lysimeter is surrounded by four sloped transition sections of the green roof to minimize thermal and heat boundary effects. The metal box is tilted on the weighing scale at a similar slope as the green roof to allow drainage from the lysimeter during a rain event.
The entire rainfall and runoff monitoring system was fully operational by June 2014. Rainfall and runoff observations were recorded for four monitoring seasons, roughly extending from July 2014 (when the monitoring setup was complete) through the end of August 2017. Monitoring was not conducted during the winter months to avoid frost damage to the pressure transducers.
2.2.2. Data Analysis: Event Discretization and Percent Retained
The continuous precipitation time series was discretized into individual storm events using a four-hour inter-event period, following the approach described in Yu et al. [
43]. The four-hour inter-event period is the standard duration used in drainage studies in New York City. The individual rain events were then further classified into three categories based on the total rainfall: low rainfall (less than 6.35 mm), medium rainfall (6.35 to 12.7 mm), and heavy rainfall (greater than 12.7 mm), per the American Society of Civil Engineers (ASCE) Hydrology Handbook [
44].
Runoff events from each of the flumes were associated with each of the storm events by visual inspection. For each event, the percent retained (
%R) was computed as:
where the discharge volume is the sum of the incremental discharge computations made for every non-zero water level measurement in the flumes following the initiation of rainfall. Because each of the tributary areas were equivalent in size, data from all three flumes were pooled.
2.3. Rainfall-Runoff Modeling Approach
A model of the green roof was created using EPA-SWMM [
45], a dynamic hydrologic-hydraulic model that is used for long-term simulation of runoff quantity from impervious surfaces in urban areas. SWMM is an industry standard model, widely used in storm water planning in New York City and throughout the world. Recent versions of SWMM can be used to predict the performance of certain types of low impact development (LID) controls, including green roofs. In this application, and in contrast to several other recent attempts to model green roofs in SWMM [
38,
21], a single 186 m
2 subcatchment area was 100% occupied by a LID-GR (not bioretention) control to represent one of the three identical tributary areas. Subcatchment properties used in SWMM are shown in
Table 2.
SWMM requires two climate time series inputs: precipitation and ET. In this study, precipitation data were sourced from the onsite weather station. In continuous simulations, ET input data is especially critical because it establishes the initial moisture regime for each simulated event. Researchers [
39] have identified ET as a critical determinant of simulated storm water capture performance. Because actual ET rates in the Northeast U.S. are typically constrained by moisture availability and not energy, a two-step process was developed to generate a time series of Actual Evapotranspiration (AET) time series for use in the SWMM simulations. The first step involved computing a
PET time series by inserting the monitored rooftop air temperature (
T) and solar radiation (
Ra) values into the Hargreaves equation [
32]:
where
Tmax (°C) is the maximum daily air temperature,
Tmin (°C) is the minimum daily air temperature, and
Ra (MJ m
2/day) is the extra-terrestrial solar radiation
.Next, an intermediate SWMM run was performed using the
PET values, the goal of which was solely to export a predicted soil moisture (
θ) time series for the green roof growing media. These soil moisture values were then used to derive
AET values using the Thornthwaite-Mather equation [
48]:
where
θ is the soil moisture content,
WP is the wilting point (
Table 3), and
FC is the field capacity (
Table 3). The final model predictions were performed with this
AET time series uploaded into SWMM’s climate editor.
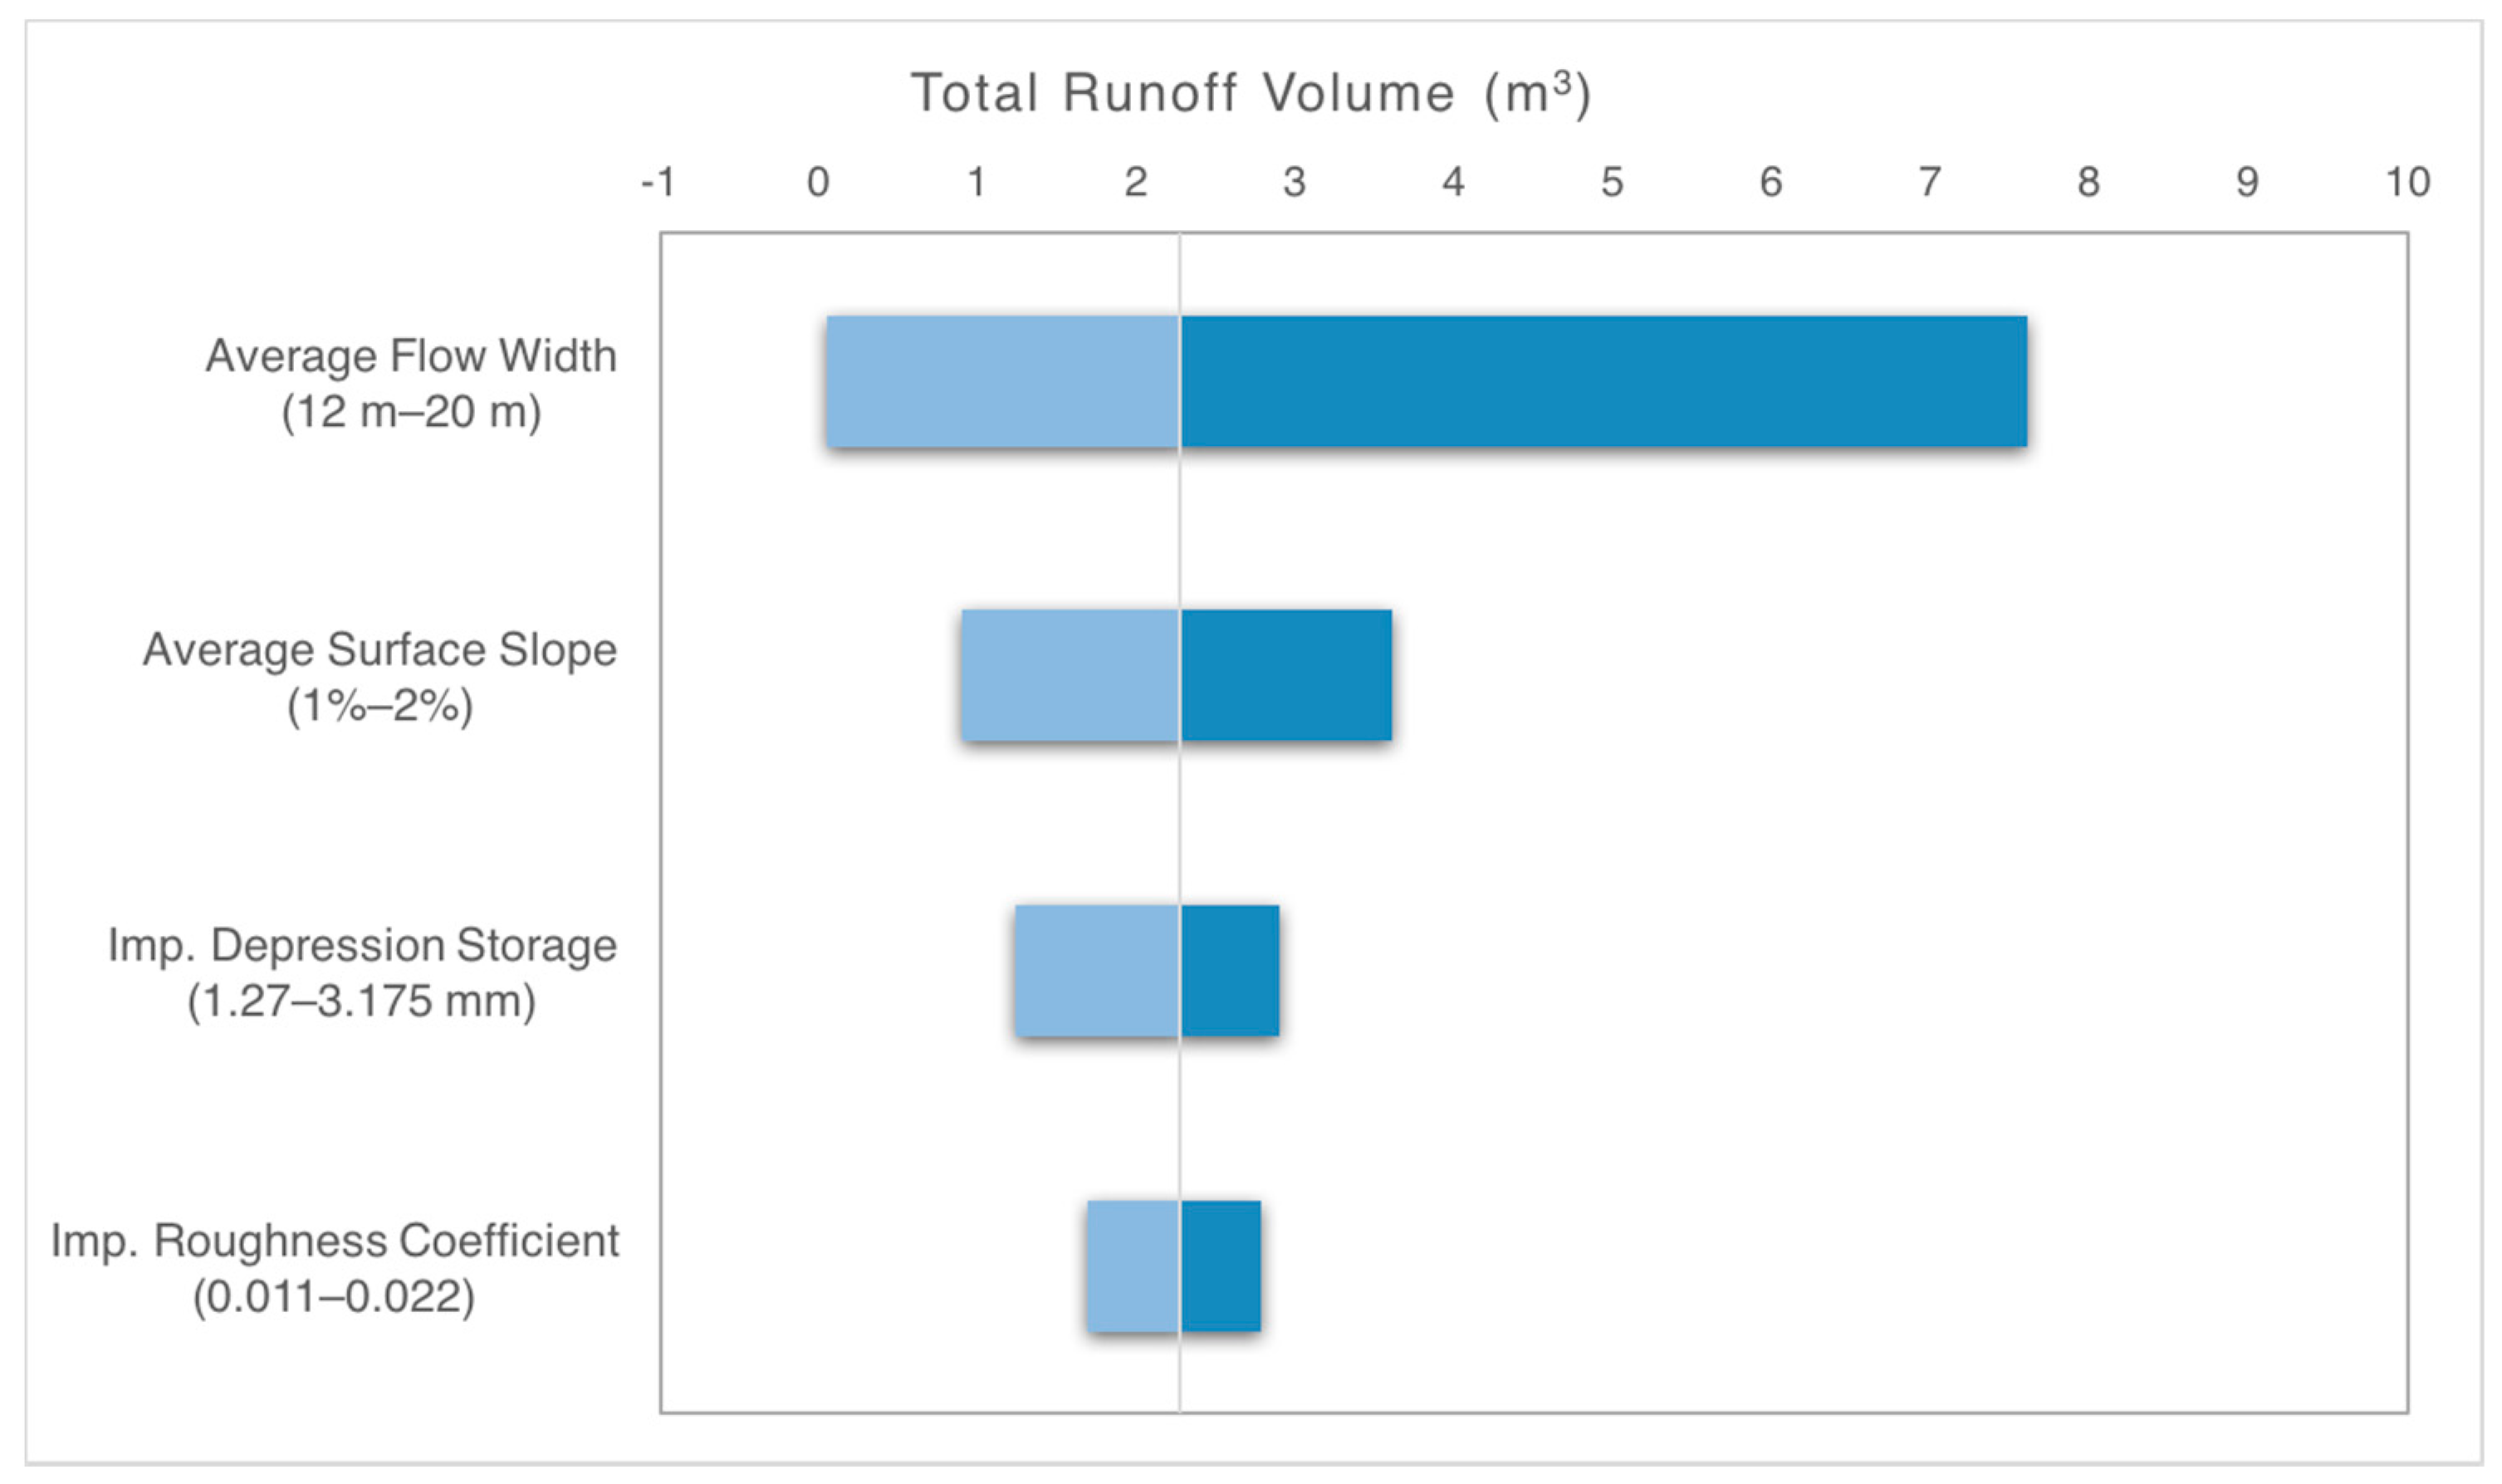
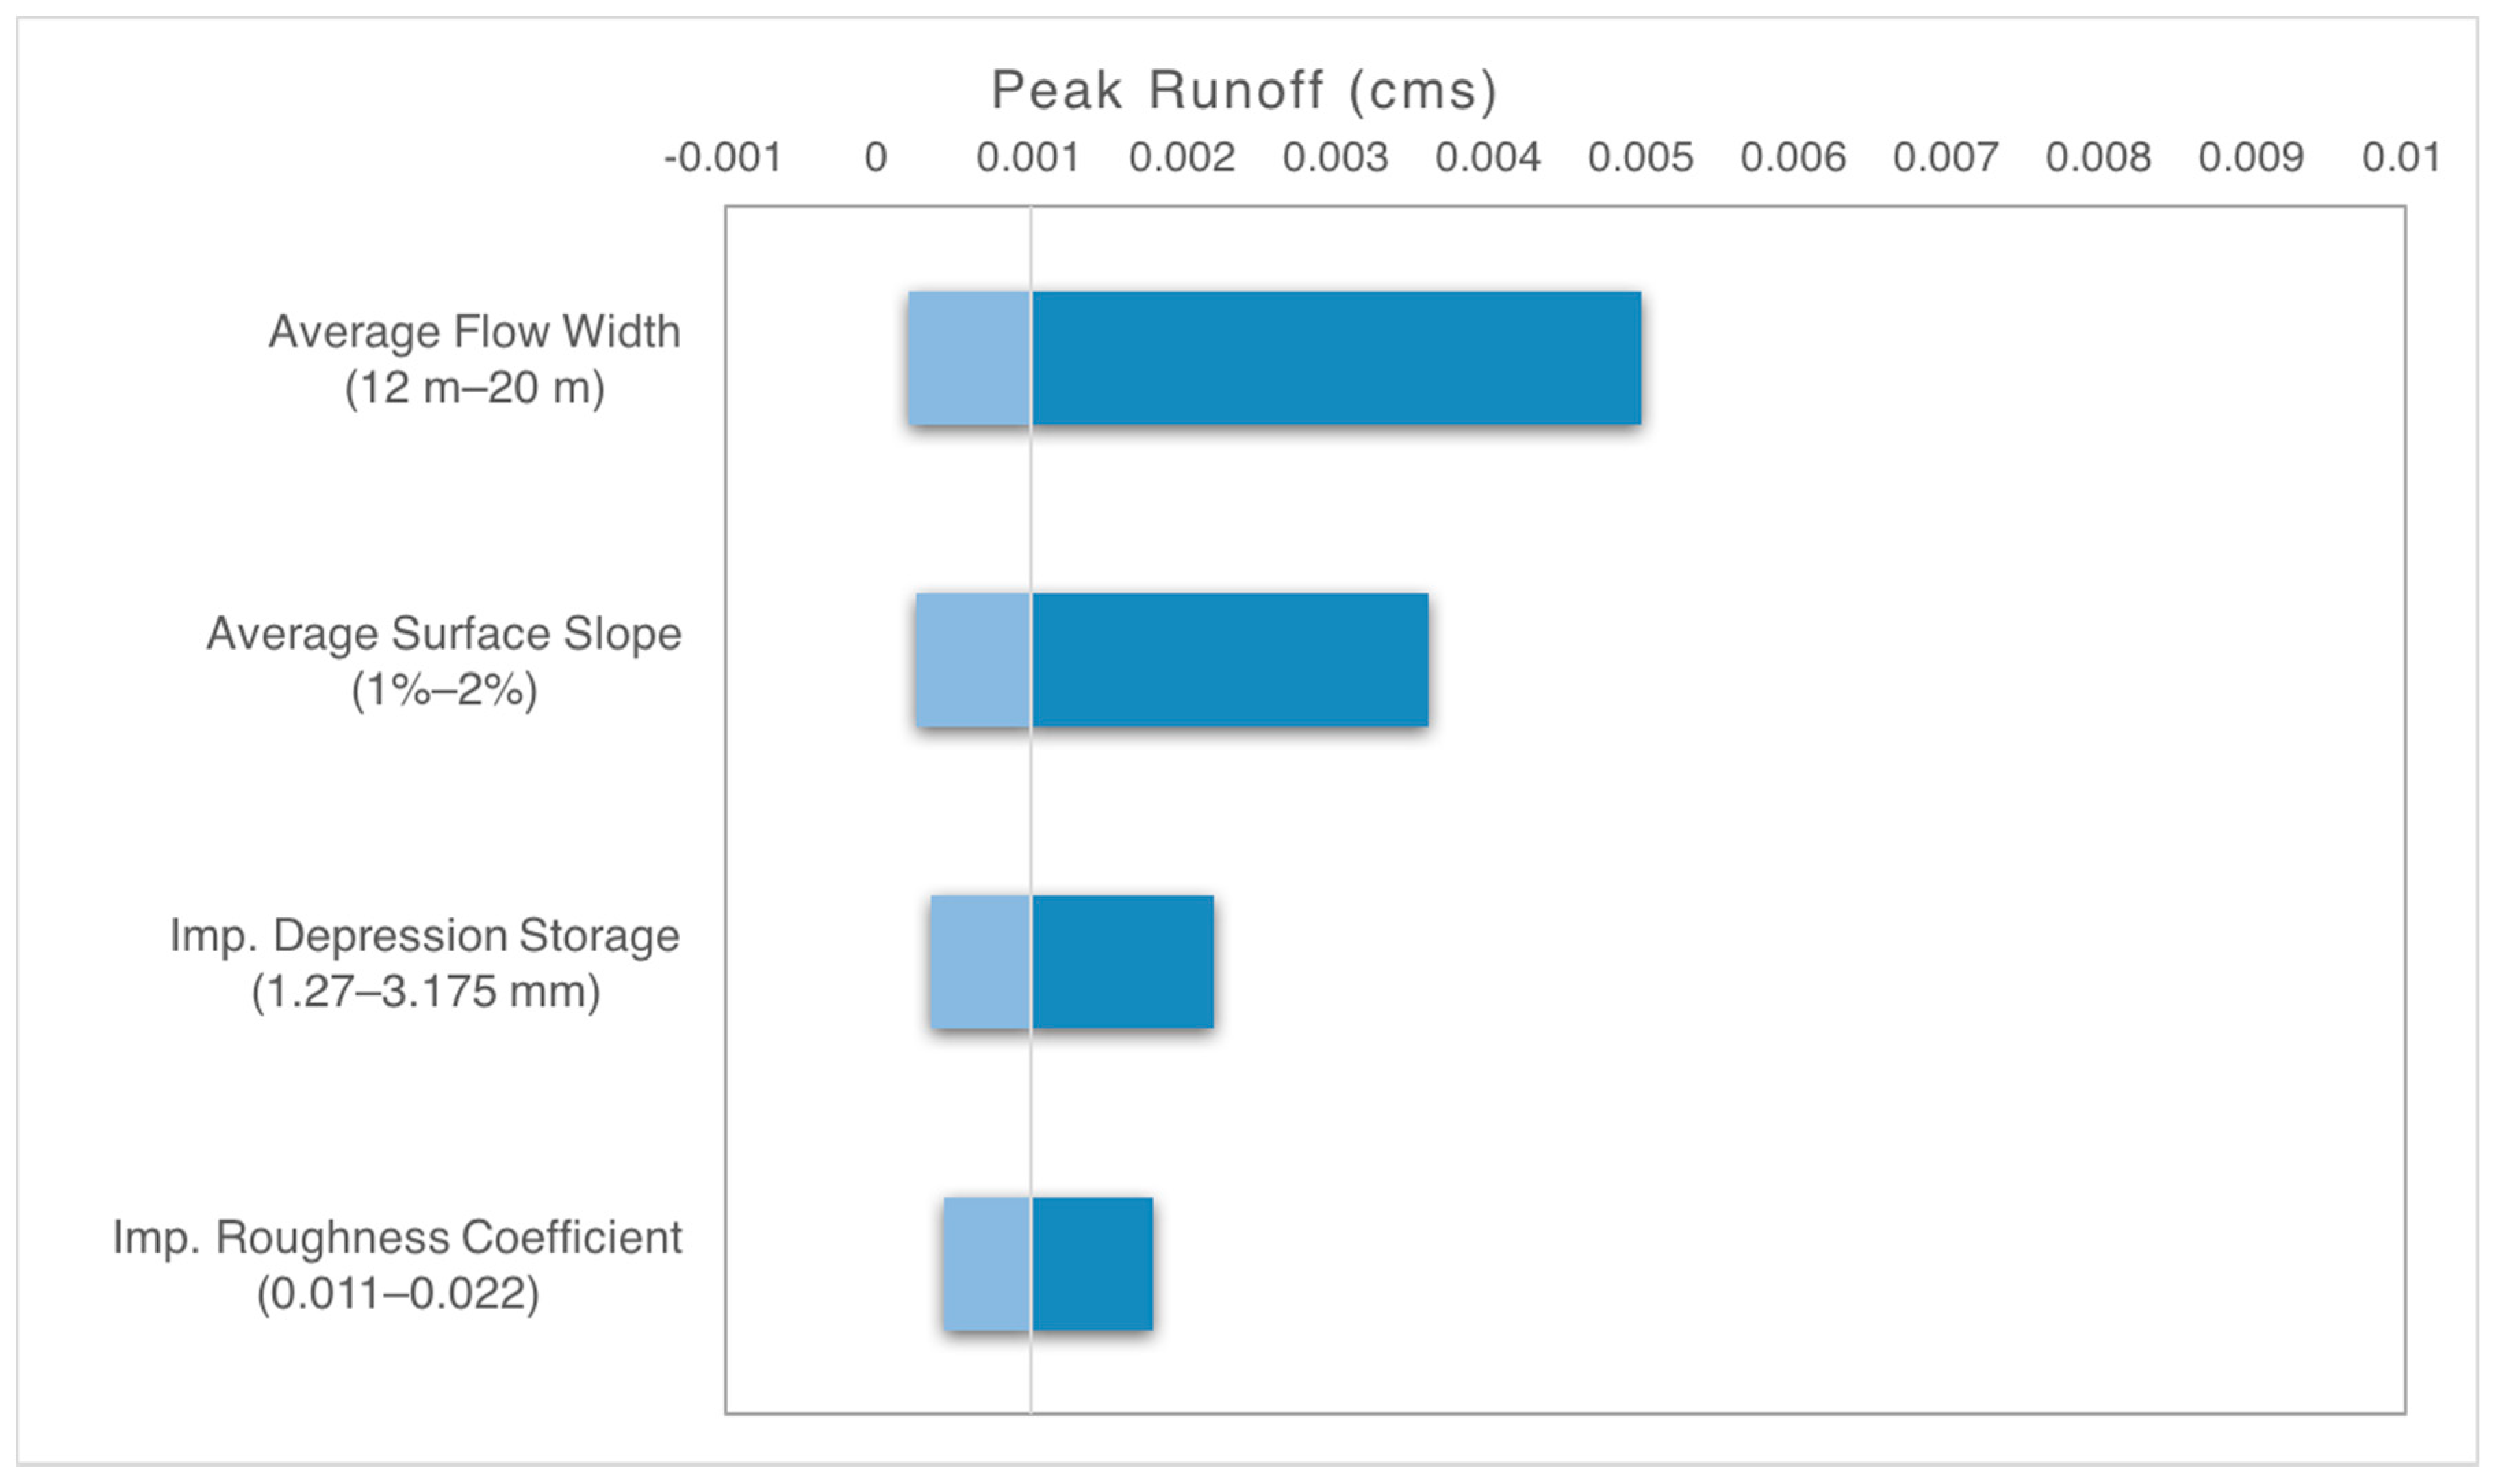
Other model properties were derived through a sensitivity analysis using the Comprehensive R Archive Network (CRAN) Sensitivity Package in R [
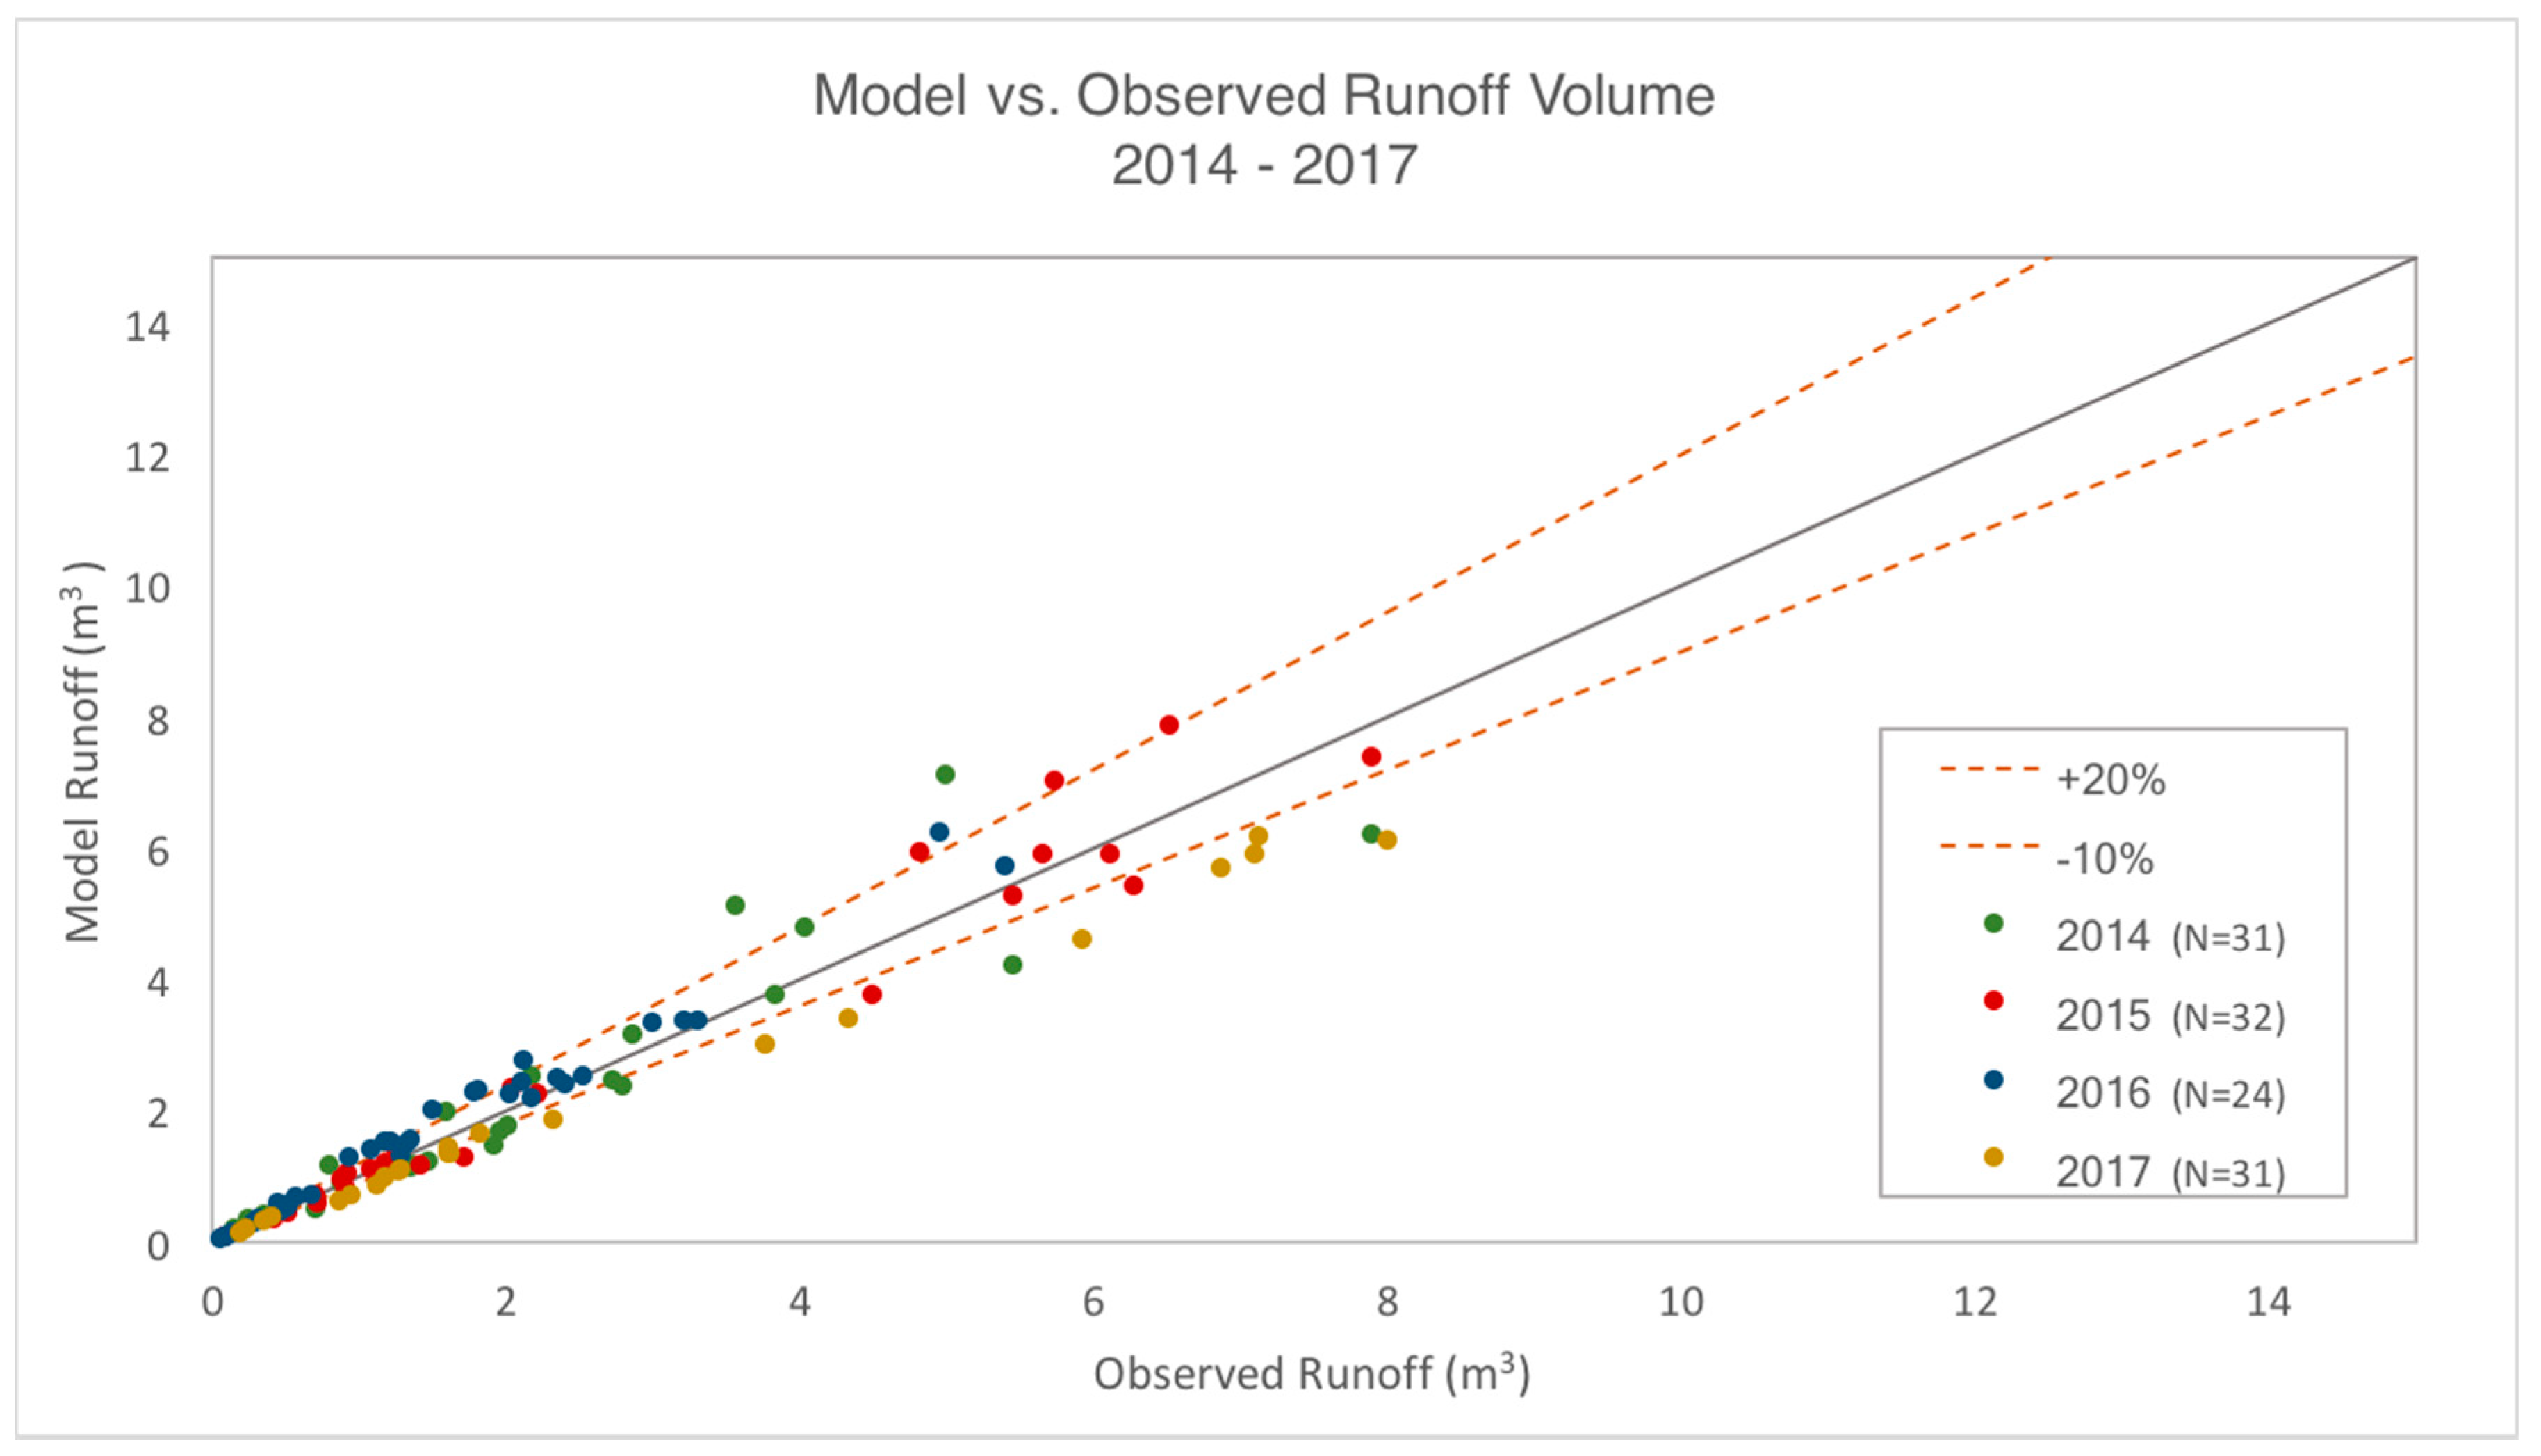
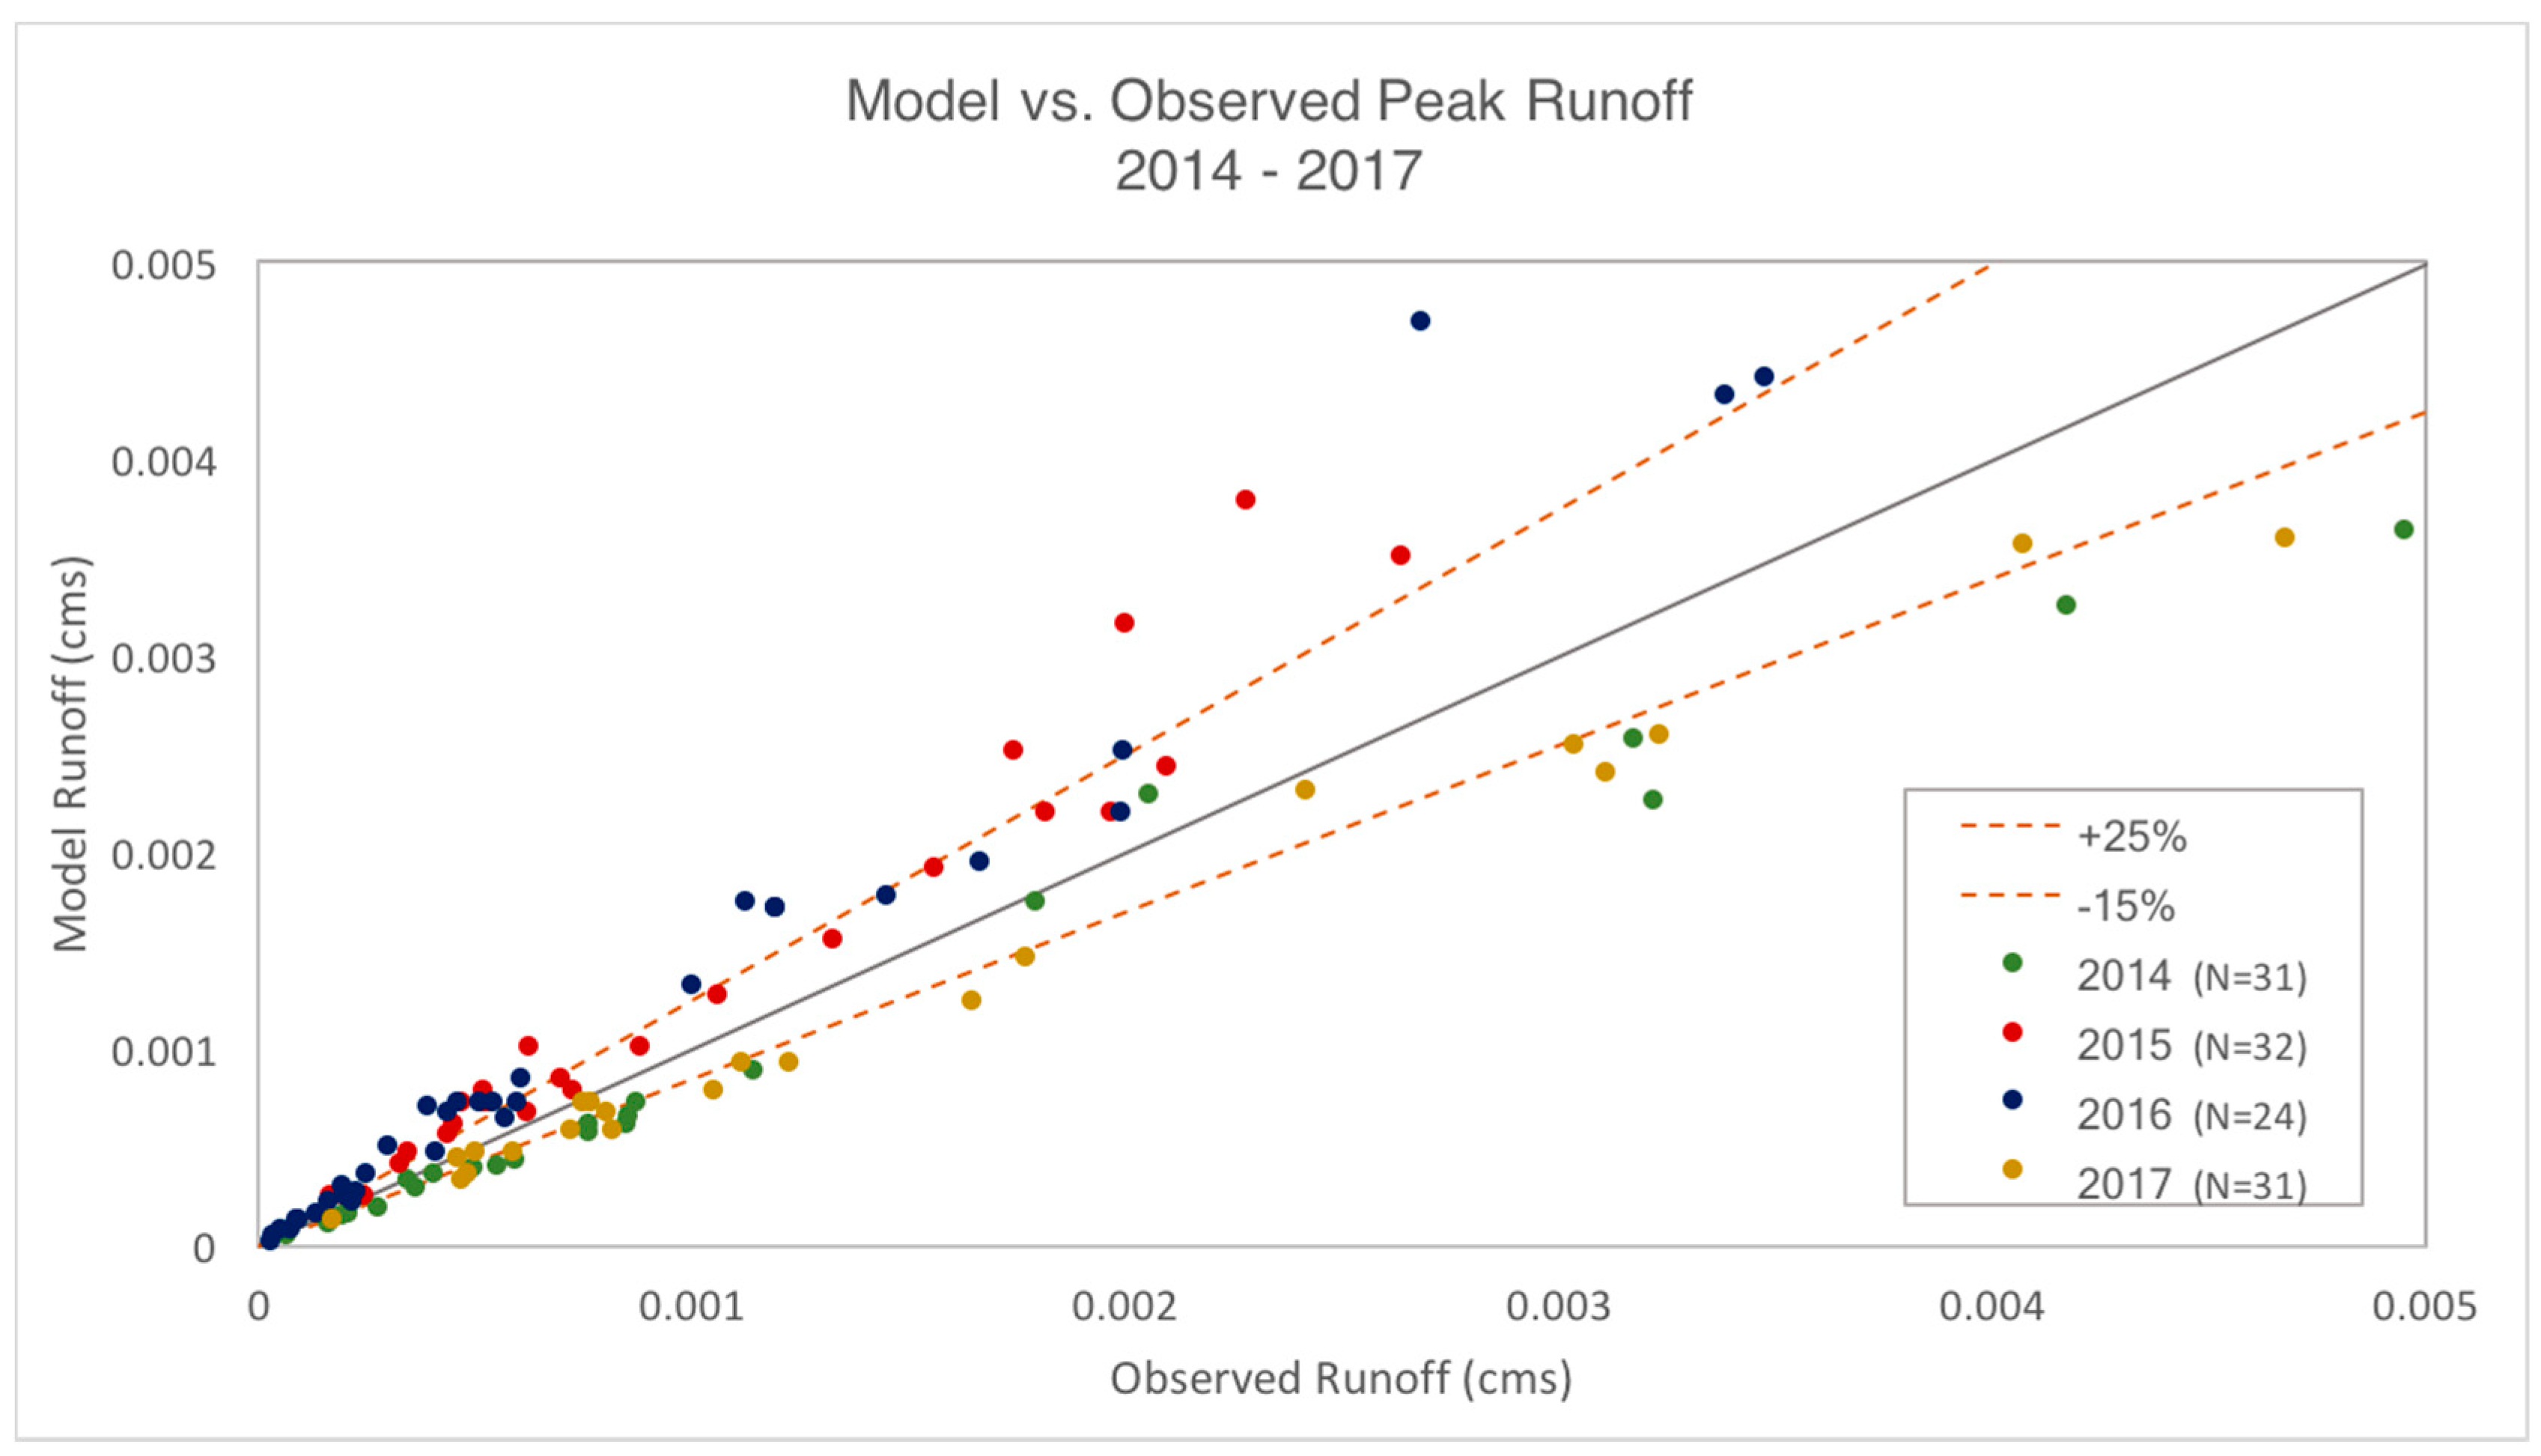
49]. The sensitivity analysis varied the flow width, depression storage, and roughness coefficients on a trial-and-error basis to maximize the number of predicted values of total volume and peak flow for each event were within ranges: +20% and −10%, and +25% and −15% of the observed values, respectively. These ranges are typically considered acceptable in urban drainage studies [
50]. The initially assumed, and final calibrated, parameter values presented are in
Table 3.
2.4. Model Validation
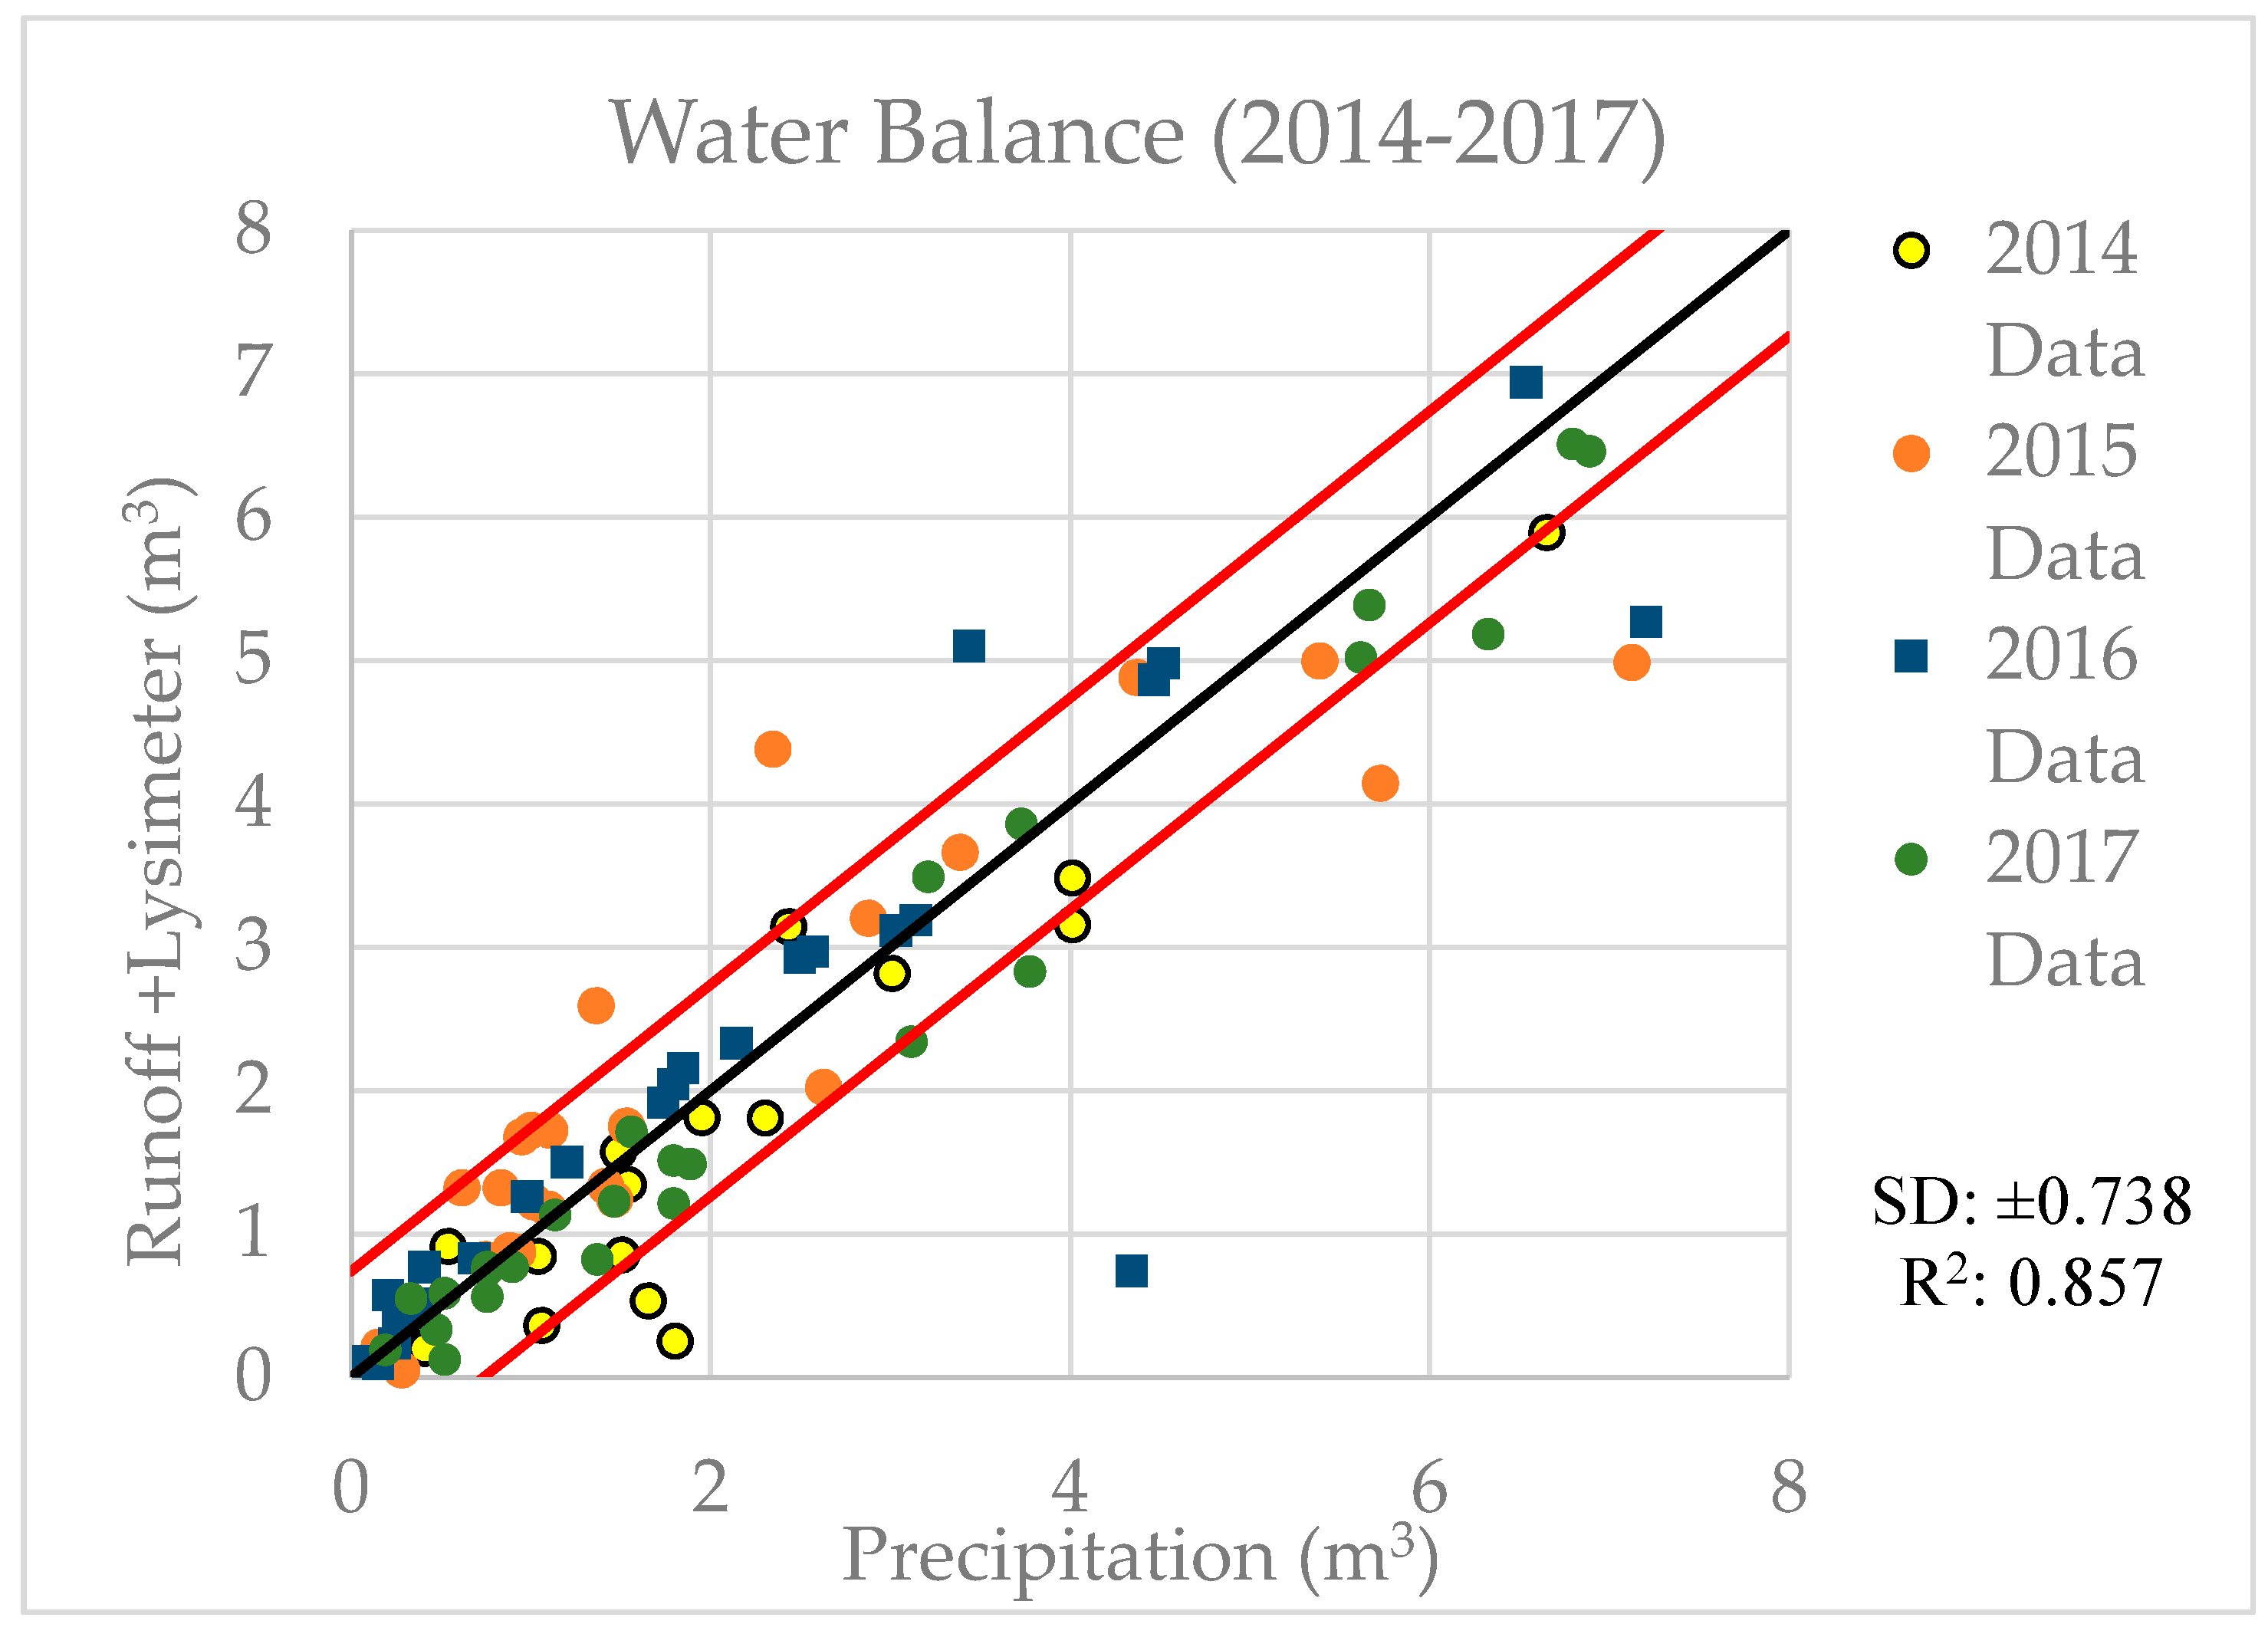
In addition to the parameter calibration described above, model validation was accomplished by performing a water budget analysis on each event. The purpose of this water budgeting exercise was to confirm that the volume of precipitation falling on the roof could be fully accounted for in the measured discharge, the change in soil moisture of the green roof (as represented by the increase in lysimeter mass over the event), and the evapotranspiration per Equation (5):
where
P is precipitation per event
, RO is runoff per event
, and
S is change in lysimeter mass, more extensively described in Smalls-Mantey et al. [
52]. Because conditions were saturated during the rain event,
ET in this case was computed using the Penman-Monteith equation [
36].
All values were calculated in volume per area of green roof bay (m
3 per green roof bay). A standard error of estimate equation was used to quantify the accuracy of the data collected. This model measures the level of scatter of
N data points about a regression line between two variables
X and
Y via:
where
Yest is the observed precipitation volume, and
Y is the sum of the observed storm runoff,
ET, and the storage change in the substrate.
Y and
Yest were plotted such that the 45° diagonal of the graph represents values that satisfy the water balance equation. Points that lie elsewhere indicate a discrepancy between
Y and
Yest and will have non-zero water balance.
2.4.1. Statistical Analysis
The SWMM model, calibrated to the observations, was then used to investigate which physical and climatic conditions were most strongly correlated with the roof’s storm water capture performance. New model runs were performed by incrementally changing individual parameter values. A binary logistic regression analysis of the impact of four independent variables on both annual and event-based performance was carried out using IBM SPSS [
53]. Logistic models are well suited for predictor variables that are a mix of categorical and continuous variables, or for variables that are not normally distributed. Binary logistic models are used for dependent variables that are dichotomous. In this analysis, the dependent variable was coded as a binary variable indicating whether there was an increase or a decrease in green roof performance. The variables defined are as follows.
Green Roof Performance (GRP) (dependent variable): defined as the change (increase or decrease) in the percent of runoff retained by the green roof.
Climatic Conditions (CC): precipitation and temperature data were varied in the model based on climate projections to represent different climate change scenarios. Projected climate datasets were obtained using the Climate Adjuster Tool (CAT) in SWMM [
54]. CAT allows for the incorporation of future climate change projection into a SWMM model by adding a set of monthly adjustment factors to each climatic time series. SWMM allows for the user to manually insert monthly adjustment factors to multiply to any climate data series; however, the CAT provides location-specific adjustment factors based on the World Climate Research Programme (WCRP) Coupled Model Intercomparison Project Phase 3 (CMIP3) archive. For this simulation, near-term (2020–2049) warm/wet climate projection adjustment factors were used, reflecting the climate model that represents the lowest annual temperature and the highest annual rainfall.
Design Parameters (DP): the depth of the soil layer was varied in the model within the thickness range for extensive green roofs (30–150 mm). Since SWMM allows users to add the depth of a fleece layer, its thickness is assumed to be included in the soil depth.
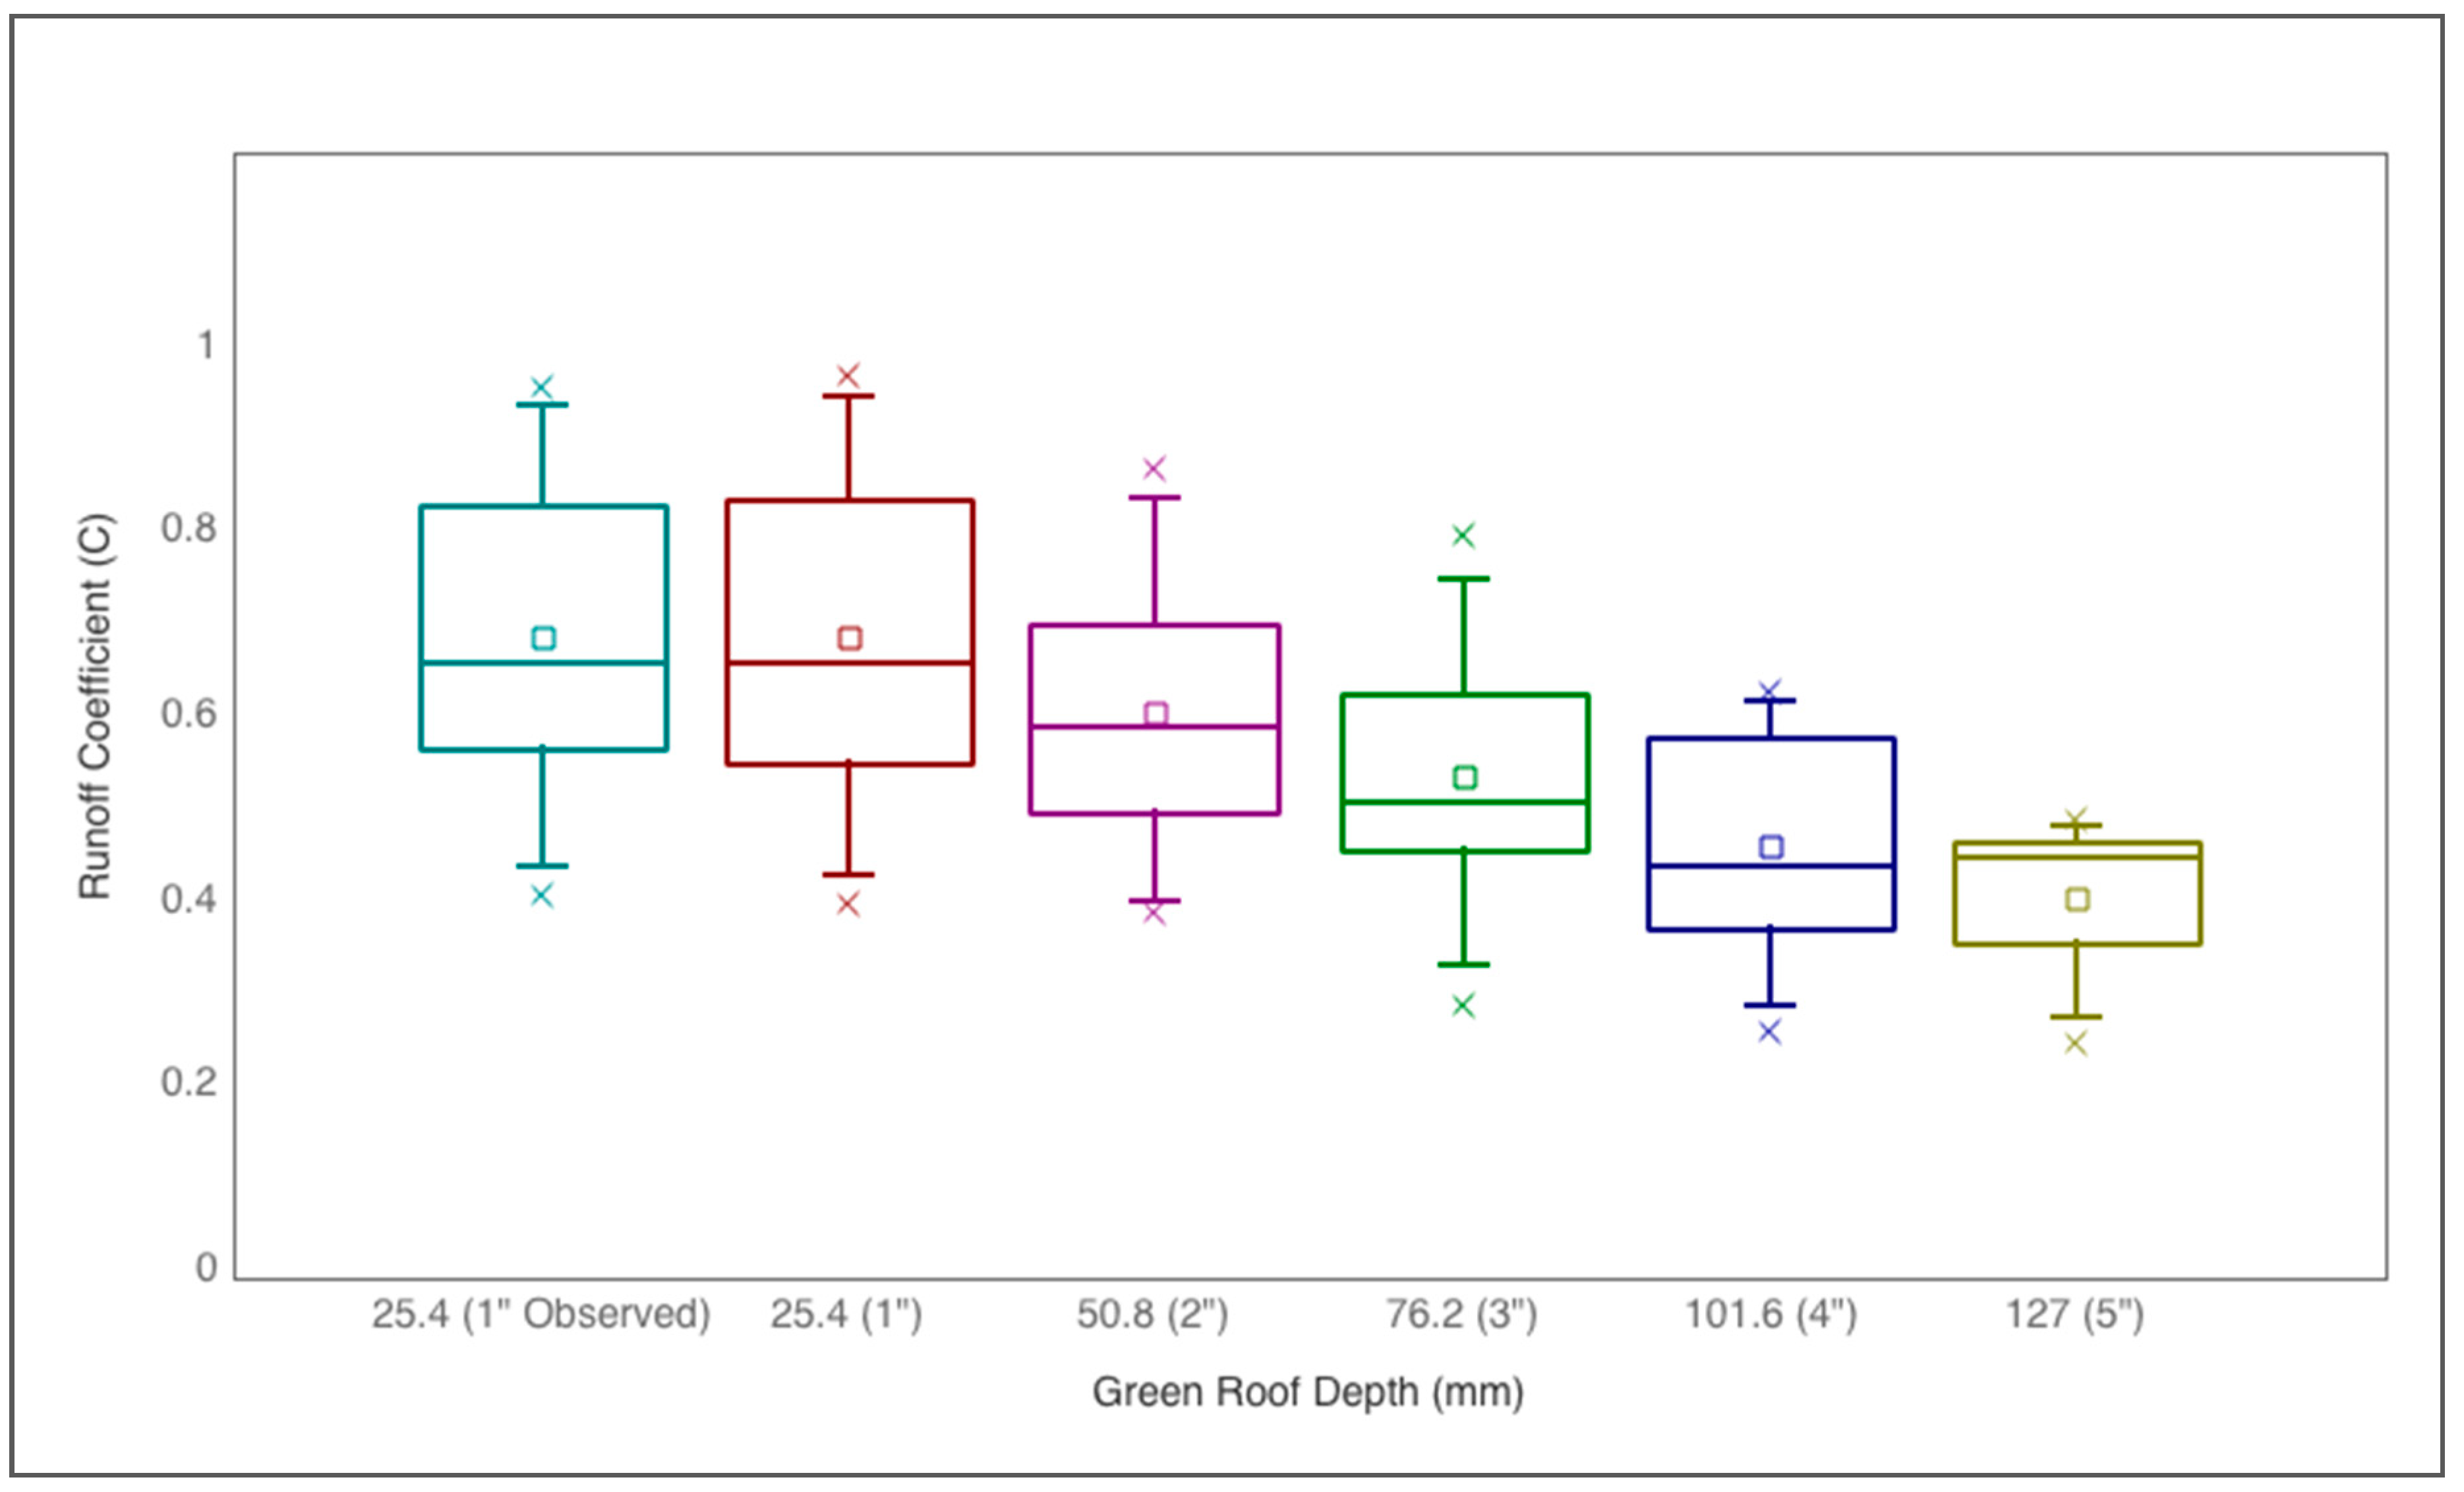
2.4.2. Runoff Coefficients and Green Infrastructure Equivalency
The validated model presented an opportunity to quantify the effective runoff coefficient for green roofs of different depths. Runoff coefficients were calculated from the observed peak flow rates for the actual JGR and for hypothetical green roofs with other depths obtained from the SWMM model by modifying the substrate depth property of the LID-GR control. For each of the observed and simulated events, the runoff coefficients were computed using the Rational Equation:
where
C is the runoff coefficient (dimensionless),
Q is peak runoff flow rate (cm/s),
A is area (ha), and
i is rainfall intensity (mm/h).
Individual C values were developed for each event and box plots used to represent the distribution of C values obtained for each green roof configuration (e.g., actual and simulated).
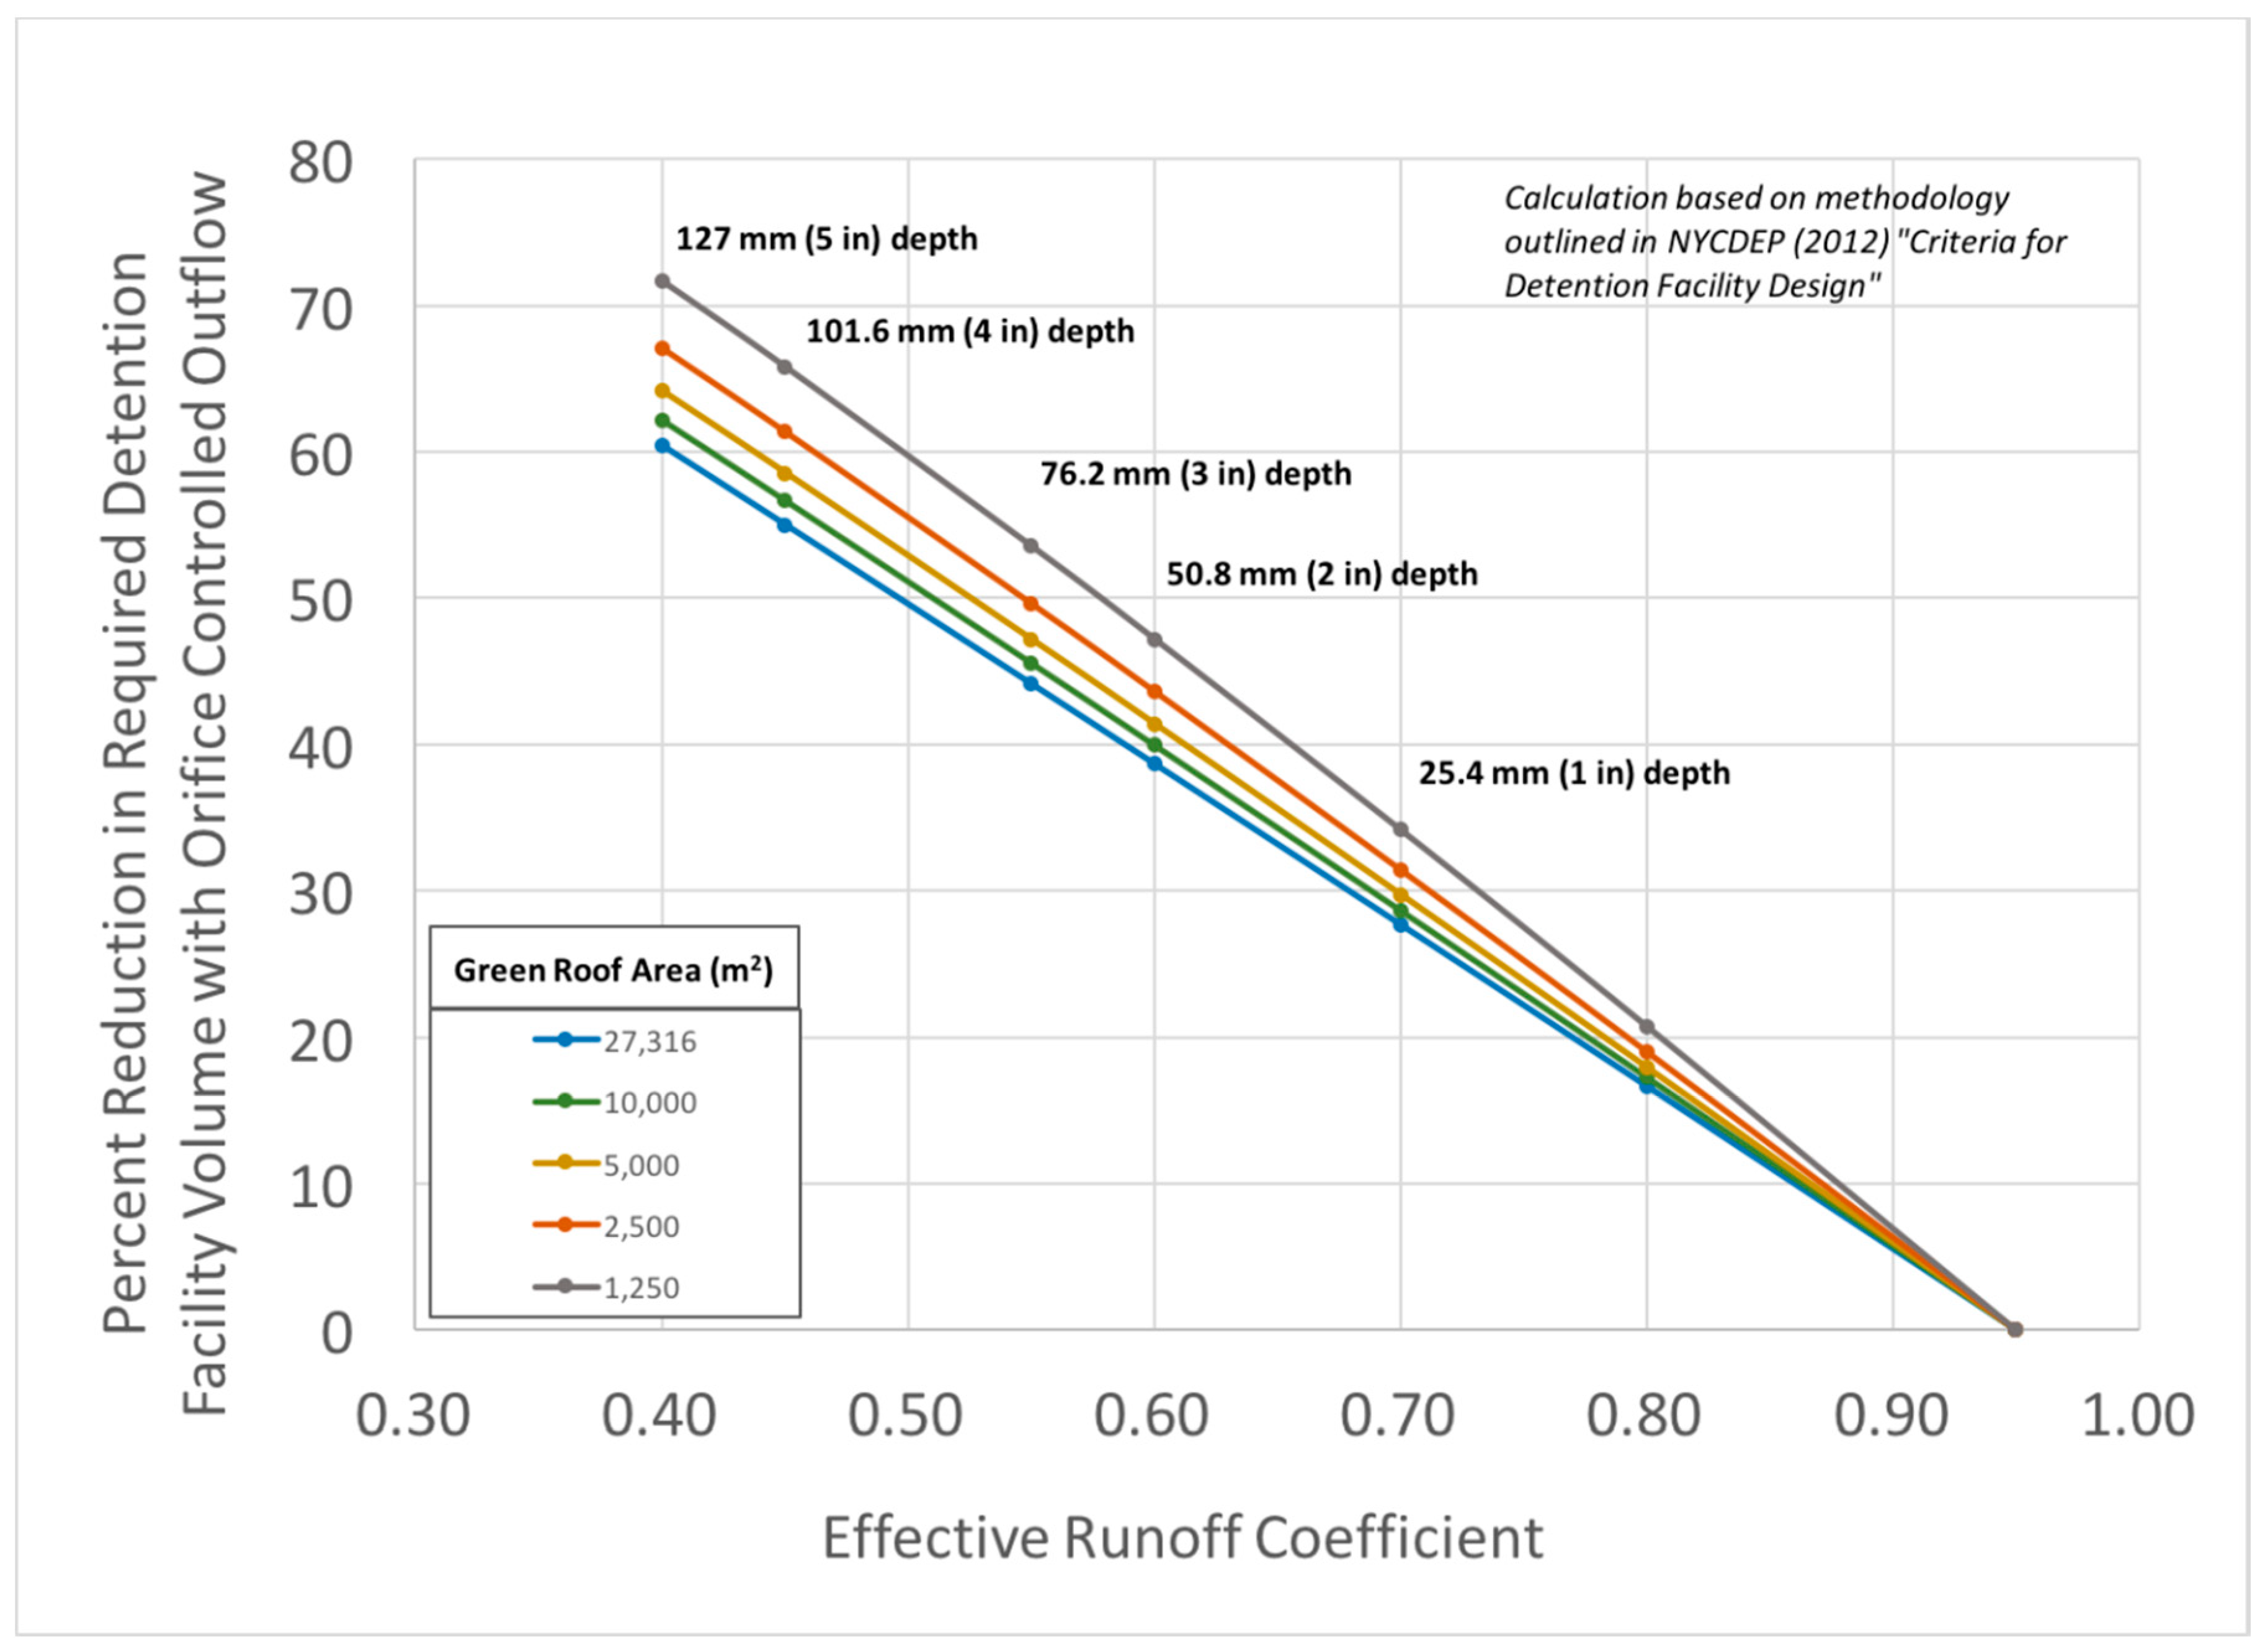
Because it is an existing building, the Javits Center technically is not required to manage any storm water onsite. However, a new building of this size would be required to detain storm water onsite following a procedure enforced by the New York City Department of Environmental Protection (NYCDEP) [
55]. The observed and predicted data sets offered a unique opportunity to quantify the percent reduction in required detention volume that could be achieved by green roof installation. This analysis was performed for different green roof depths and roof areas by following the procedure outlined in the NYCDEP guidelines [
55]. A series of empirical equations are provided that require the analysis be performed in English units. The first step is to calculate the duration of the storm in minutes with a 10-year return frequency requiring the maximum detention volume with a variable outflow,
TV:
where
C is the runoff coefficient (dimensionless),
A is roof area (ft
2), and
QDRR is detention facility maximum release rate (assumed to be 0.25 cfs [
40]).
Next, the maximum required detention facility volume is computed:
where
VV is the maximum required detention volume (ft
3). All other parameters are as defined previously.
The reduction in tank volume computes the percent reduction in
VV between a roof with
C of 0.95 (membrane roof), and a roof with a mean
C value corresponding to different depths of green roof. The maximum storage depth is then calculated as follows:
The floor area of a required detention tank is equal to VV/SDR.
4. Discussion
Despite the large area of the JGR, the rainfall retention values and runoff coefficients monitored on the three study plots are in the same range as reported for other green roofs [
10,
14,
57]. Overall, 55% of the cumulative precipitation that fell on the green roof during the monitoring period was retained. The mean percent of event precipitation retained ranged from 75.4% to 79.3% over the four years of observations. Carson et al. [
20] ran tests on three roof models at a slope of 2% and found that vegetated roofs retained 60.6% of rainfall, media-only roofs retained 50.4%, and a gravel ballast roof retained 27.2% of rainfall. For rain events resulting in less than 10 mm of precipitation, Simmons et al. [
58] found similar retention percentages to those presented here, with values varying from 26% to 88% depending on the rain size and intensity.
This modeling approach builds on previous efforts to model green roofs in SWMM [
21,
40], by comparing the results of a four-year continuous simulation performed using SWMM’s LID-GR control (not its bioretention control) with observations for a large-scale system (186 m
2). In contrast to previous work, we adjusted SWMM’s
ET time series to account for the regularly occurring moisture limited conditions found in this climate. This adjustment was accomplished using a unique two-step process and SWMM’s own soil moisture accounting routine.
Although this approach accounts for moisture limitations, it did not incorporate any vegetation-specific crop coefficients, as previously attempted by others [
40]. A potential next step would be to integrate both strategies. During high moisture conditions,
ET rates obtained using the rooftop weighing lysimeters could be compared to reference
ET measurements obtained using the ASCE standardized reference evapotranspiration equation to derive site specific crop coefficients. Next, these crop coefficients could be used to adjust the full time series of reference
ET values obtained from the weather station. By running the model with this
ET time series, interim soil moisture measurements could be exported from SWMM’s LID report and used to adjust the
ET values for moisture limitations. It would be interesting to compare the results of our approach as part of the present effort to this proposed new approach to determine whether further improvements in model accuracy could be achieved.
Additional research could validate SWMM’s simulated soil moisture time series with substrate moisture content observations obtained using soil sensors installed on the Javits green roof. The sensors would first need to be calibrated to the actual substrate and rooftop data loggers, since differences in the logger’s excitation frequencies can alter the sensor calibration curve. To validate SWMM’s predicted soil moisture routine over various seasons and moisture conditions, sensor calibrations would need to be repeated periodically because these relationships have a tendency to vary over time (author observation based on work at other locations). Although soil sensors were installed on the JGR prior to the reporting period described here, sensor calibration activities were not frequent enough to ensure data quality.
The regression analysis suggests that the simulated depth of the green roof substrate layer played a significant role in predicted storm water retention rates over the four-year continuous simulation. Predicted retention increased significantly with each initial 25.4 mm (1 inch) increase in substrate depth, with less dramatic improvements in performance when the depth increased above 101.6 mm. However, these findings need to be interpreted in the context of other research regarding the role of substrate depth. In their review of observations in a suite of European green roofs, Mentens [
14] found no relationship between seasonal runoff and substrate depth during the cold and transitional periods (November to April). However, they found that every 10 mm increase in substrate depth resulted in 2.5 mm less runoff (
p < 0.05) during the warm seasons. ANOVA indicated that green roofs with substrates <50 mm and >150 mm had statistically significant differences in warm season runoff. In their study of small-scale (62 cm
2) Midwest U.S. green roofs, Morgan et al. [
23] found no significant difference in retention over an 18-month study for green roofs ranging from 5 to 20 cm in depth. During a second study, they found a small and statistically insignificant difference in runoff retained from a five-cm green roof, when compared to the deeper roofs.
Additional research might focus on the variable role of substrate depth under different climatic conditions. Deeper substrates theoretically can store more water. However, during cold seasons (when ET is low) in climates with regular and frequent precipitation, the substrate is more likely to be wetter at the initiation of rain. If the moisture content is near or at its field capacity, runoff from the green roof surface could be expected to occur through saturation excess, regardless of substrate depth or precipitation depth or intensity. This phenomenon, which could not be investigated as part of this study since no data collection was performed during the winter, would serve to diminish the importance of substrate depth as a design parameter. Runoff could also occur regardless of substrate depth in regions subject to short bursts of high intensity precipitation through the process of Horton overland flow. Specifically, if the rainfall intensity exceeds the infiltration capacity of the substrate surface, the excess precipitation would pond and/or flow overland across the green roof surface and into a roof drain. Additional research on the importance of substrate depth would ideally measure (and not model) runoff from side-by-side, full-scale green roofs constructed with different substrate depths over the course of both warm and cold seasons. This study would ideally be reproduced in regions with different precipitation characteristics in an effort to disentangle the various independent variables.
In this study, climate change simulations (assuming warm/wet conditions) resulted in significant, (~5%), decreases in green roof storm water retention, regardless of substrate depth. Future mean event retention was reduced to between 58% and 86% (depending on substrate depth). In the Northeast U.S., climate change is expected to cause both increased precipitation intensity and higher temperatures, trends that were evident in the SWMM-CAT files. SWMM’s predicted net decrease in green roof retention under these conditions suggests that, even though higher temperatures might increase evapotranspiration, more rapidly removing water from the green roof substrate in between rain events, the more intense precipitation will generate more runoff (e.g., Horton overland flow) due to the substrate’s inability to infiltrate it before it runs off the green roof surface. Additional research would test this hypothesis by measuring the green roof substrate’s infiltration capacity, for example with a ring infiltrometer, and comparing this value to the intensity of future climate-changed precipitation in this region.
5. Conclusions
This study investigated the rainfall-runoff response of the Javits Center green roof, currently the second largest green roof in the U.S. A novel monitoring system, installed during construction of the green roof, generated four years of fine temporal resolution discharge measurements from three 186 m
2 rooftop tributary areas. Because the monitoring system was designed and installed in parallel to the green roof, we accurately delineated the three tributary areas using aluminum channels that were affixed to the structural roof surface. Pressure transducers installed in Parshall flumes yielded continuous measurements of discharge over the course of 118 events over four years. Storm water retention varied with event depth. The greatest retention rates (96% on average) were observed for light rainfall events (<6.35 mm). The average retention for medium rainfall events was 81.2%, whereas only 27% of heavy events were retained on average. These values, as well as the observed 55% of cumulative precipitation during the monitoring period, were consistent with the findings of other researchers working in other geographic regions with green roofs with other designs, who reported values between 65% and 85% for extensive green roofs in a review of several publications on water retention for intensive and extensive green roofs [
10,
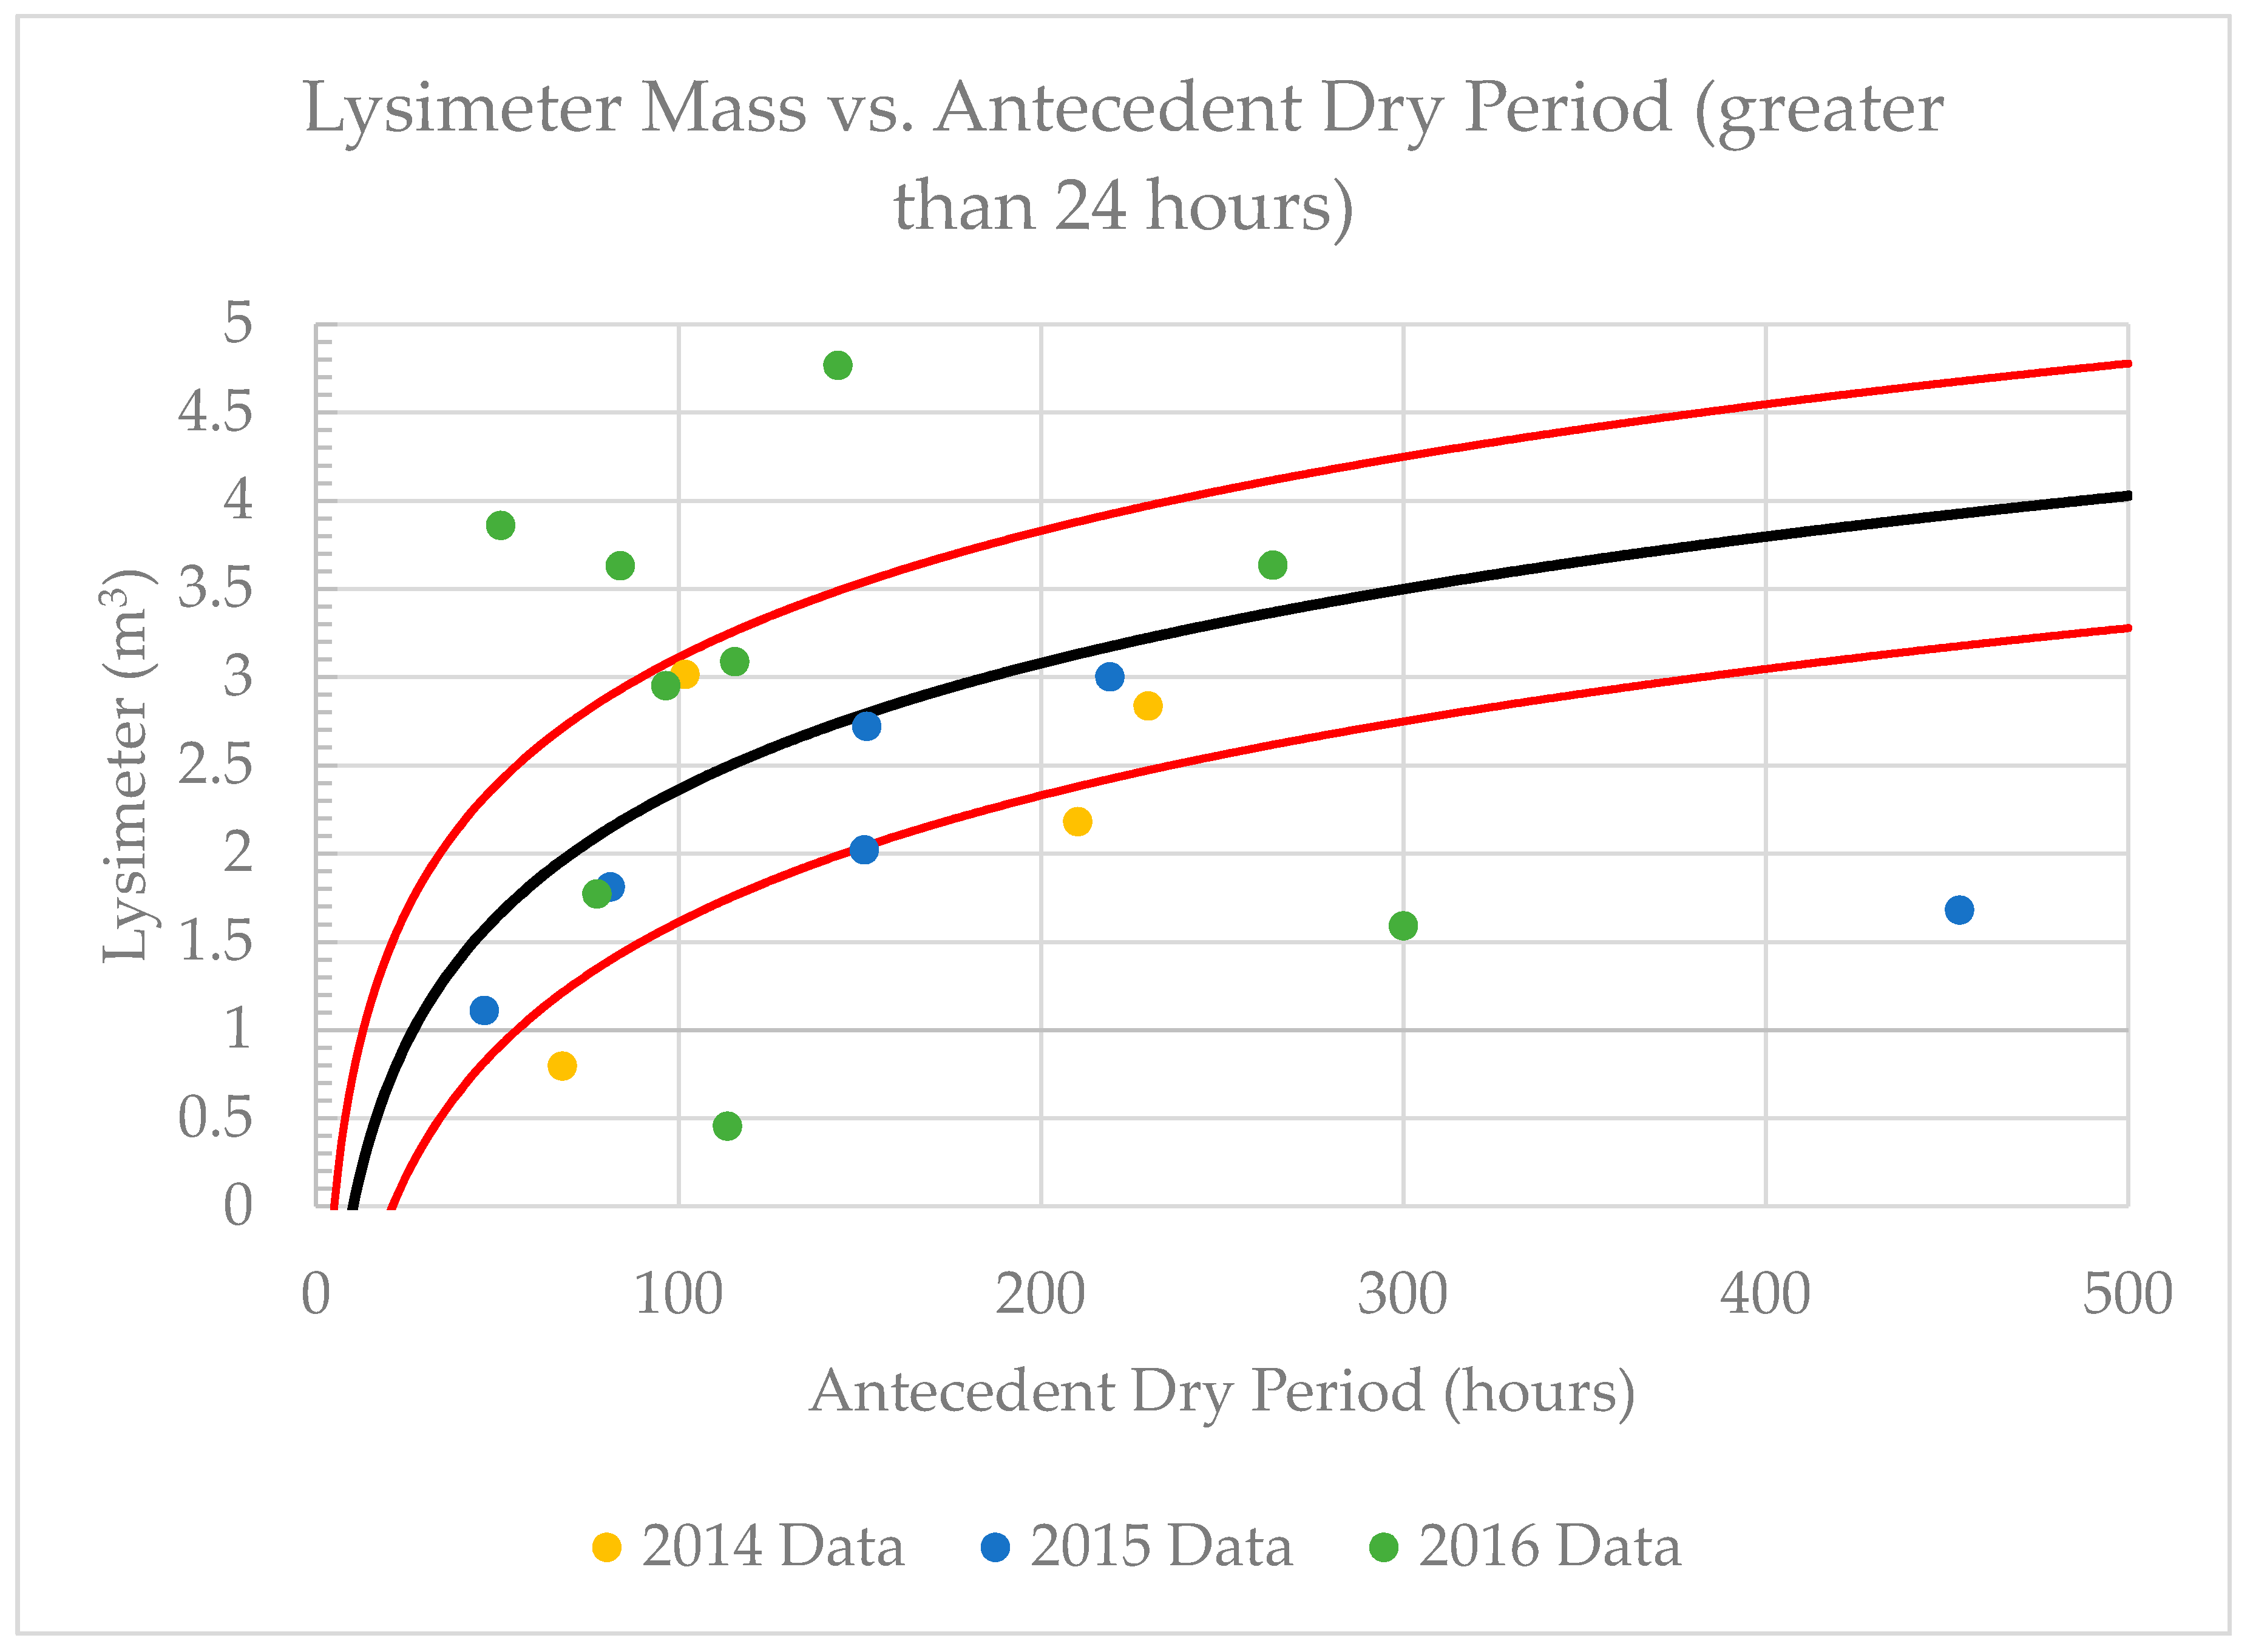
14]. No relationships between event performance and Julian date, air temperature, mean event intensity, or mean event duration were observed, though no winter observations were used in this study. Along with the flume discharge measurements, the weather station and weighing lysimeter enabled performing a full water balance on each of the observed events. Between the increased moisture storage measured with the lysimeters and the discharge measured with the flumes, all of the incident precipitation accounted for 80% of all the events. Empirical relationships suggested that the green roof’s ability to store moisture is closely related with the duration of the event’s antecedent dry period.
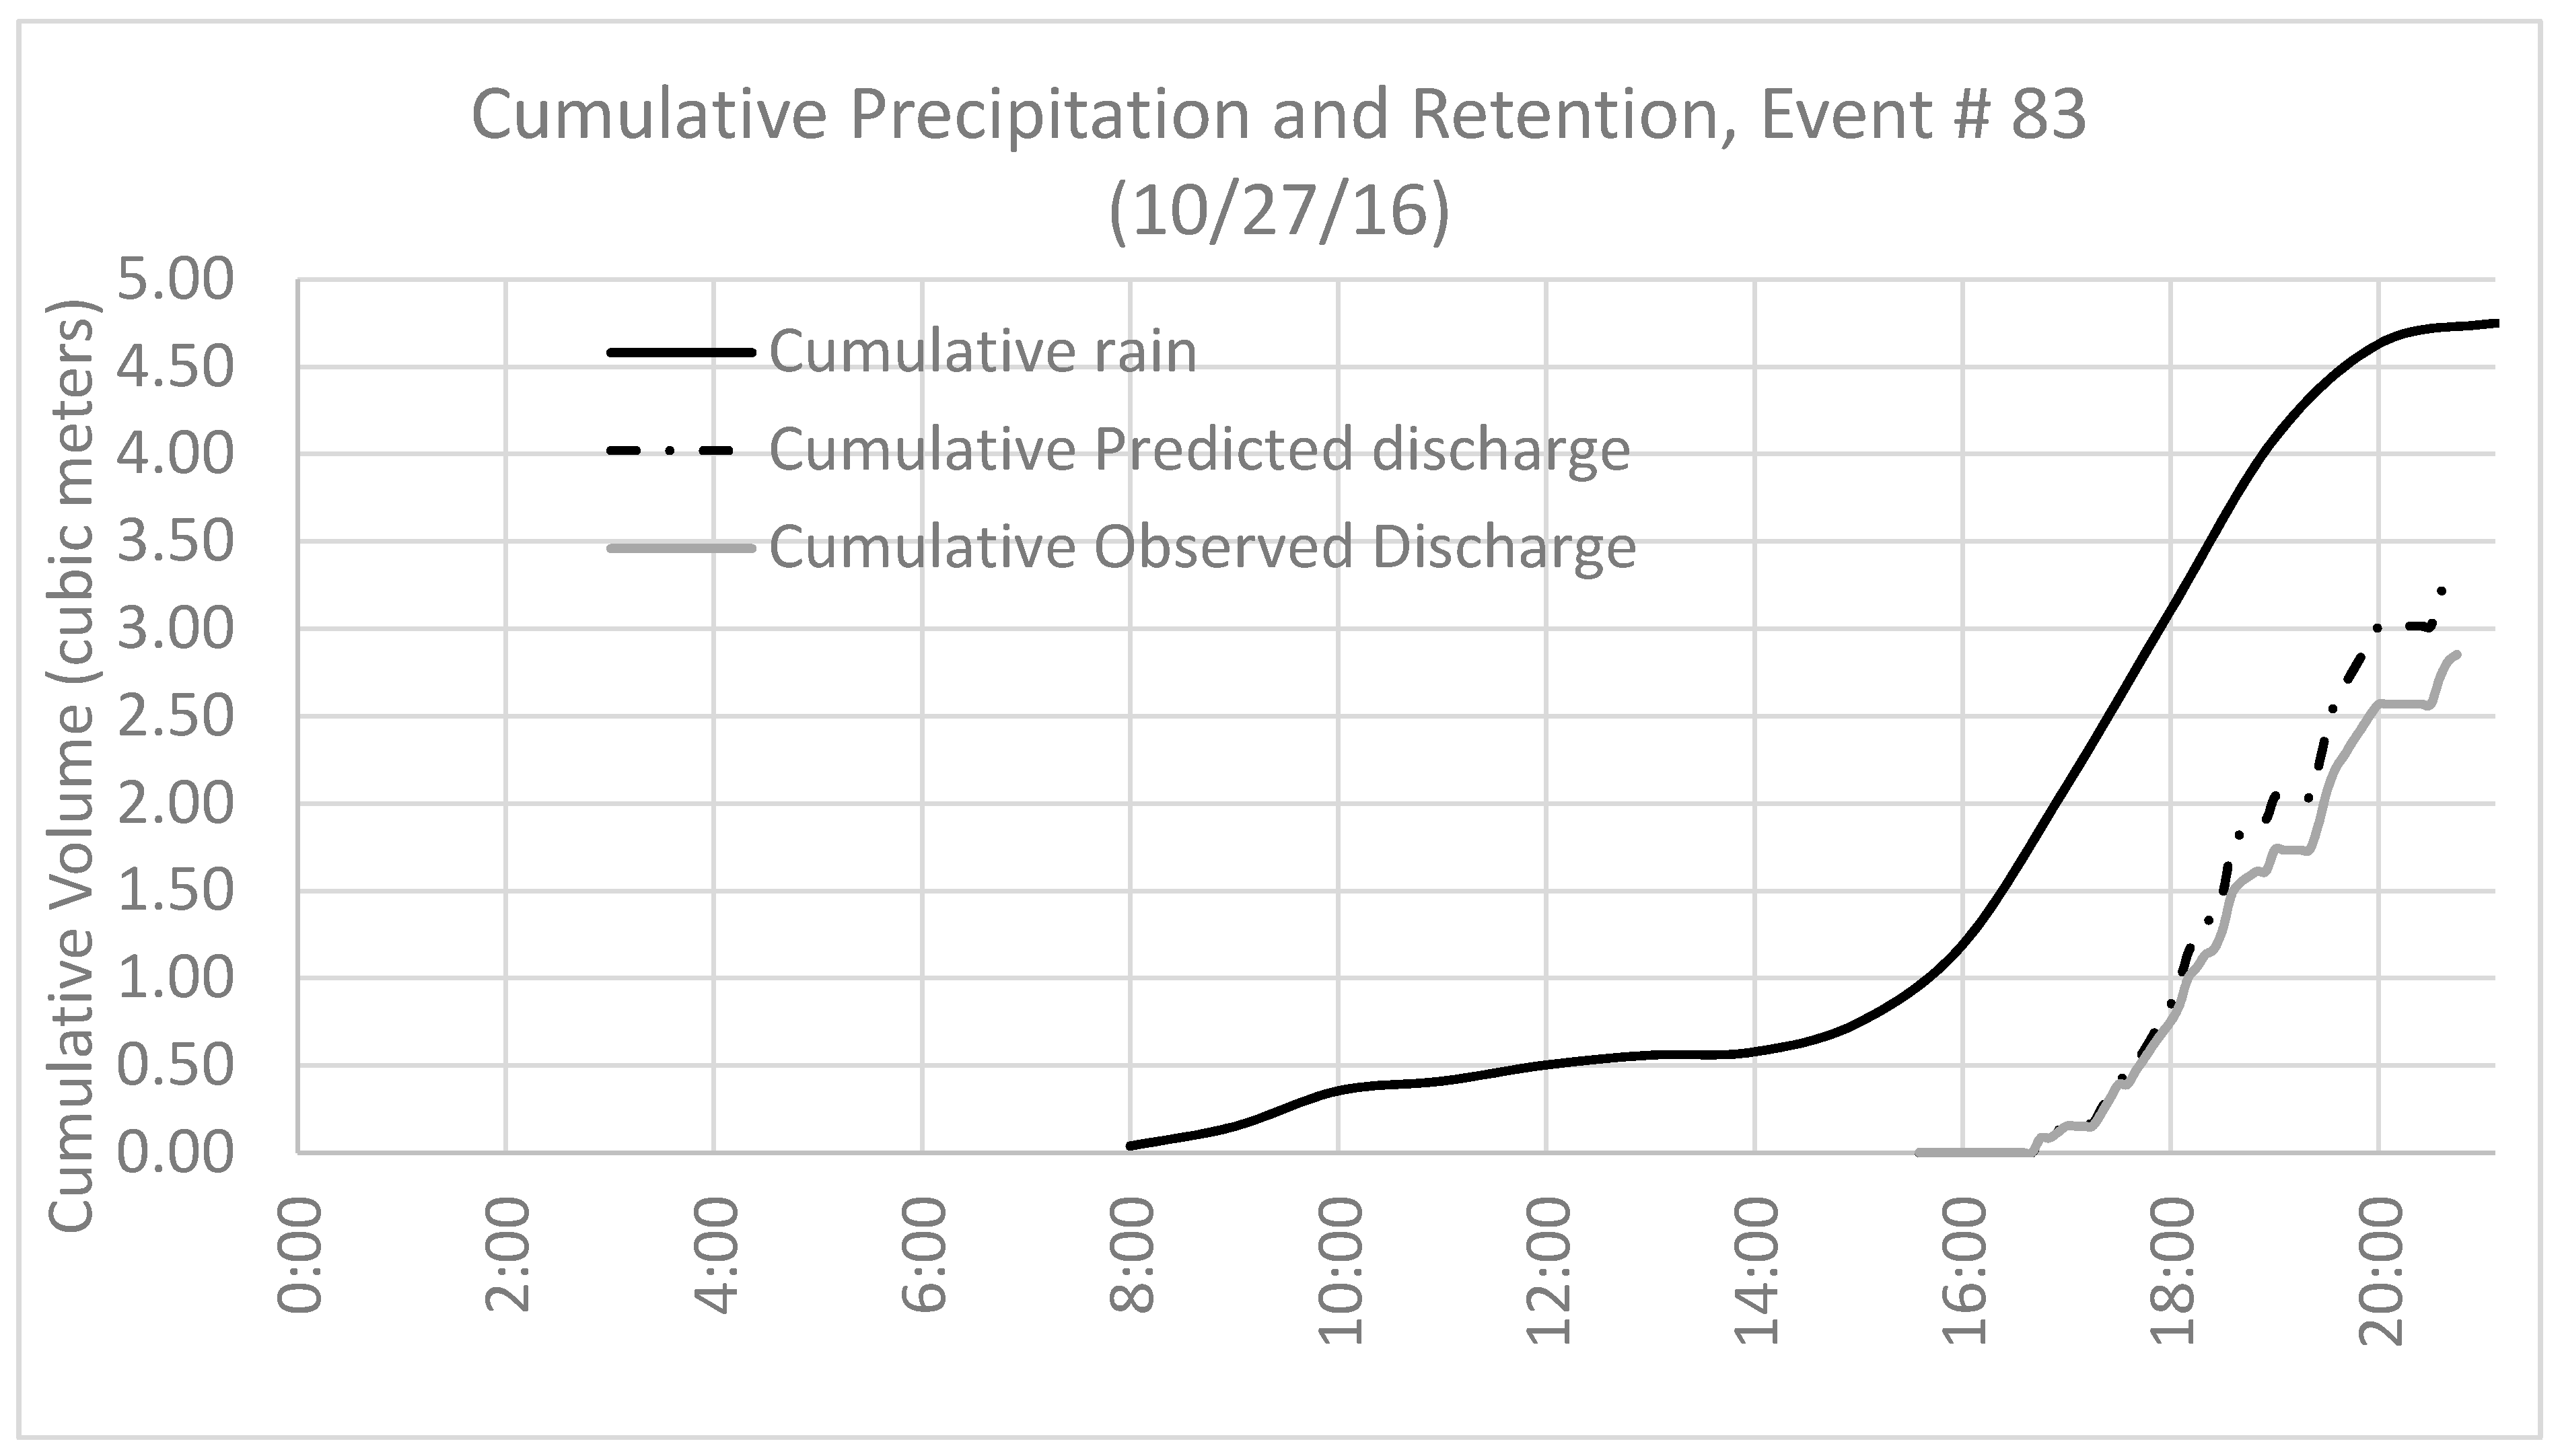
With calibration, the SWMM model with LID-GR control and simulated
AET values was able to predict the total volume and peak rate of discharge for most events to within the acceptable validation envelope in the four-year continuous simulation. The model tended to overestimate the peak rates, but not by much. Overall, this modeling exercise suggests that usage of the SWMM LID-GR control with
AET values can yield reasonable estimates of green roof discharge and retention, at least during the non-winter months in a temperate climate. Following the work of Krebs et al. [
40], future work further refining the
AET values with crop coefficients to account for specific vegetation characteristics is proposed.
The monitoring and modeling activities presented a unique opportunity to explore the ability of green roofs with different substrate depths to offset the storm water detention requirements of buildings with different roof areas in New York City. The SWMM model suggests that in New York City climate, storm water retention increases with increasing substrate depth, but with diminishing returns after about 100 mm. If the depth of the JGR substrate were halved, for example as a result of wind erosion, average event retention could decrease by about 9%.
Curves were developed to estimate the percent reduction in the required detention facility volume that could be achieved by installing green roofs of different depths on buildings of different areas. The Javits Center is not required to detain its storm water, since it predates this particular regulation. However, a new building of equivalent roof area would require a cistern of up to 974 m3. If this facility has an effective depth of 1.6 m, its floor area would be roughly 608 m2. With commercial real estate in the area surrounding the JJCC valued at $1 billion USD per city block (or roughly $50,000 USD/m2 assuming a city block in Manhattan is roughly 22,000 m2), the lost real estate value of the 608 m2 footprint could be $30 million USD. The estimated construction cost of a cistern with this footprint is $2.5 million USD, or more than eighteen times the average cost to construct a green roof that would retain the same quantity of stormwater, estimated at $100–350 USD per square meter. With these general assumptions, the initial investment in construction of the JGR appears easily justified.
The observations, modeling, and analysis of the JGR suggests that for some, building green roofs represent a win-win opportunity. By utilizing the building’s rooftop space to mitigate incident rainfall, building owners can maximize developable floor space inside the building, while minimizing the cost to comply with current stormwater management requirements in New York City. Simultaneously, this same strategy can help prepare the city for climate change, while enhancing the city with the other co-benefits of this recently rediscovered approach to urban storm water management.


