The Potential Utility of Satellite Soil Moisture Retrievals for Detecting Irrigation Patterns in China
by
 ,
,
Xiaohu Zhang
1,2, 
Jianxiu Qiu
3,4,*,
Guoyong Leng
5,
Yongmin Yang
6,7,*,
Quanzhou Gao
3,4,
Yue Fan
3,4 and
Jiashun Luo
3,4 1
National Engineering and Technology Center for Information Agriculture, Nanjing Agricultural University, Nanjing 210095, China
2
Jiangsu Collaborative Innovation Center for Modern Crop Production, Nanjing Agricultural University, Nanjing 210095, China
3
School of Geography and Planning, Sun Yat-sen University, Guangzhou 510275, China
4
Guangdong Provincial Key Laboratory of Urbanization and Geo-simulation, Sun Yat-sen University, Guangzhou 510275, China
5
Environmental Change Institute, University of Oxford, Oxford OX1 3QY, UK
6
State Key Laboratory of Simulation and Regulation of Water Cycle in River Basin, Beijing 100038, China
7
Institute of Water Resources and Hydropower Research, Beijing 100038, China
*
Authors to whom correspondence should be addressed.
Water 2018, 10(11), 1505; https://doi.org/10.3390/w10111505
Submission received: 8 September 2018
/
Revised: 17 October 2018
/
Accepted: 21 October 2018
/
Published: 24 October 2018
(This article belongs to the Special Issue Satellite Application on Support to Water Monitoring and Management)
Abstract
:Climate change and anthropogenic activities, including agricultural irrigation have significantly altered the global and regional hydrological cycle. However, human-induced modification to the natural environment is not well represented in land surface models (LSMs). In this study, we utilize microwave-based soil moisture products to aid the detection of under-represented irrigation processes throughout China. The satellite retrievals used in this study include passive microwave observations from the Advanced Microwave Scanning Radiometer for the Earth Observing System (AMSR-E) and its successor AMSR2, active microwave observations from the Advanced Scatterometer (ASCAT), and the blended multi-sensor soil moisture product from the European Space Agency (i.e., ESA CCI product). We first conducted validations of the three soil moisture retrievals against in-situ observations (collected from the nationwide agro-meteorological network) in irrigated areas in China. It is found that compared to the conventional Spearman’s rank correlation and Pearson correlation coefficients, entropy-based mutual information is more suitable for evaluating soil moisture anomalies induced by irrigation. In general, around 60% of uncertainties in the anomaly of “ground truth” time series can be resolved by soil moisture retrievals, with ASCAT outperforming the others. Following this, the potential utility of soil moisture retrievals in mapping irrigation patterns in China is investigated by examining the difference in probability distribution functions (detected by two-sample Kolmogorov-Smirnov test) between soil moisture retrievals and benchmarks of the numerical model ERA-Interim without considering the irrigation process. Results show that microwave remote sensing provides a promising alternative to detect the under-represented irrigation process against the reference LSM ERA-Interim. Specifically, the highest performance in detecting irrigation intensity is found when using ASCAT in Huang-Huai-Hai Plain, followed by advanced microwave scanning radiometer (AMSR) and ESA CCI. Compared to ASCAT, the irrigation detection capabilities of AMSR exhibit higher discrepancies between descending and ascending orbits, since the soil moisture retrieval algorithm of AMSR is based on surface temperature and, thus, more affected by irrigation practices. This study provides insights into detecting the irrigation extent using microwave-based soil moisture with aid of LSM simulations, which has great implications for numerical model development and agricultural managements across the country.
1. Introduction
Soil moisture plays a crucial role in regulating water and energy exchange between land surface and atmosphere, and is thus recognized as an essential climate variable in earth science [1]. It is of importance for understanding the hydrological cycle in the context of climate change and increasingly intensified human interference. In particular, accurate information on soil moisture is valuable for, among others, facilitating vegetation growth/restoration evaluation in semiarid environments [2], crop yield estimation [3,4], and soil erosion rate prediction [5].
To date, information on long-term soil moisture variations largely relies on simulations from land surface models [6,7,8,9]. Quantification of the uncertainties in simulated and observed (both ground-based and satellite-based) soil moisture has drawn increased attention [10,11,12]. For instance, Tian et al. [13] demonstrated the limitations of the conventional performance metrics and advocated the use of error modeling for uncertainty quantification, which can be correctly characterized during real-time application based on Bayes’ theorem. Moreover, under the cases when a suitable parametric error model cannot be found, nonparametric approaches which are fundamentally based on information theoretic concepts could be employed [14,15].
Generally, the accuracy of model-based soil moisture is constrained by the quality of model forcing and the large horizontal/vertical heterogeneity of soil properties that are not readily available [16]. In addition, it is found that the unmodeled process especially the anthropogenic activities, such as excessive groundwater-fed irrigation and cross-regional water diversion, could significantly affect local and regional water and energy budgets, as well as the hydrologic and biogeochemical processes [17,18,19].
Among them, irrigation is an important land management practice which leads to significant alteration of the global and regional hydrological cycle [20]. Specifically, the effects of irrigation include: (1) Altering land surface flux partitions [21,22]; (2) inducing land surface cooling [21]; (3) resulting in taller cloud masses and early peak cloud formation over croplands [23]. As found by [24], the overall impact of irrigation on regional climate could exceed those of greenhouse gases at seasonal timescales. Despite recent developments in numerical representations of irrigation in land surface models [18,25,26], the majority of land surface models lack the consideration of the irrigation effect on water redistribution in the terrestrial system, with simulated surface soil moisture being biased in irrigated areas [27]. Accurately capturing and representing the nature of irrigation practices remains a challenge.
Remote sensing measurements offer a potential alternative for capturing the effects of such unmodeled processes. Near-surface soil moisture observations from a number of passive microwave and scatterometer-based platforms have been accumulated in the past decades. They include the Advanced Microwave Scanning Radiometer-Earth Observing System (AMSR-E) aboard the Aqua satellite and the Advanced Scatterometer (ASCAT) aboard the Meteorological Operational (METOP) satellites. Recently, as initiated within the Water Cycle Multi-Mission Observation Strategy (WACMOS) project, the latest version of soil moisture product (ESA CCI) merging active and passive microwave observations has been released to the public. After minimizing the effects caused by sensor specifications and the inconsistencies in microwave frequency and spatial resolution, the ESA CCI product provides relatively consistent and reliable information on soil moisture worldwide. At the global scale, this ESA CCI data set has been extensively validated against in-situ network observations and various land surface model simulations [28,29,30,31]. Recently, the utility of the microwave-based soil moisture over irrigated areas has been evaluated in the United States [32] and in the northeast of the Iberian Peninsula [33]. Lawston et al. [34] investigated the potential of the Soil Moisture Active Passive (SMAP) enhanced 9 km soil moisture product to identify irrigation signals in three semi-arid regions in the western United States. Results showed that SMAP soil moisture carries a clear irrigation signal from rice irrigation in the Sacramento Valley (California), while the signals were less obvious in the Columbia River Basin, Washington, and Colorado. Through inversion of the soil water balance equation, Brocca et al. [35] incorporated different microwave soil moisture products into the proposed SM2RAIN algorithm and quantified the amount of water used for irrigation. Through integrating the differences between the temporal variations of satellite and model soil moisture over the growing season, Zaussinger et al. [36] also estimated the monthly irrigation using microwave soil moisture products. Nevertheless, detailed inter-comparison and evaluation of these soil moisture products in irrigated areas in China has received relatively little attention in the existing literature. In addition, current remote sensing methodology to map irrigated areas relies heavily on vegetation cycle information, which is typically more dependent on optical remote sensing and affected by cloud conditions [37].
In this study, we focus on the potential utility of the microwave-based soil moisture products in identifying irrigation patterns that are typically not well represented in land surface models. We first conduct general validations of the selected soil moisture products against the in-situ observations collected from the nationwide agro-meteorological network using various metrics including entropy-based mutual information, Spearman correlation, and Pearson correlation. The validation itself can contribute to our understanding of the performance of global-scale soil moisture retrievals in irrigated areas in China, which has great implications for guiding the applications in these specific regions. Then, we quantify the effectiveness of each soil moisture product in detecting irrigation intensities. Such quantification is performed by comparing the probability density functions of remote sensing data sets against those of benchmark land surface model simulations (i.e., ERA-Interim) which do not account for irrigation. Finally, the sensitivity of the discussed detection capabilities to two half-orbits is conducted.
2. Materials and Methods
2.1. Soil Moisture Data Sets
2.1.1. Passive Microwave Satellite-Based Retrievals of AMSR-E and AMSR2
The AMSR-E is onboard the National Aeronautics and Space Administration (NASA) Aqua platform and has provided soil moisture estimates since 2002. There are several versions of AMSR-E products which use different algorithms to solve the radiative transfer equations. Overall, the AMSR-E soil moisture data set based on the land parameter retrieval model (LPRM) [38] has shown relatively stable performance around the world compared to both in-situ observations [39,40,41], and simulated soil moisture [42,43,44]. Therefore, in this study, we choose the LPRM AMSR-E product to conduct the analysis. LPRM uses dual-polarized C- and X-band (6.925 and 10.65 GHz) brightness temperature for simultaneous retrieval of surface soil moisture and vegetation water content. The default retrieval band for LPRM data set is C-band, and is substituted by X-band when the signal at C-band frequency is contaminated by radio frequency interference (RFI). In this study, we use version 5 of the product. As the successor of AMSR-E, AMSR2 is a multi-frequency radiometer launched on board the GCOM-W1 satellite on May 2012. In order to extend the temporal coverage of passive microwave satellite-based retrievals to that of active remote sensing, we concatenate the datasets of AMSR-E and AMSR2, both of which are generated from the same LPRM algorithm and obtained from ftp://hydro1.sci.gsfc.nasa.gov/data/s4pa/. In the LPRM soil moisture data set, retrievals are screened under dense canopy (vegetation optical depth greater than 0.8).
2.1.2. Active Microwave Satellite-Based Retrievals of ASCAT
ASCAT is real aperture backscatter radar operating at C-band (5.255 GHz), and it orbits on EUMETSAT’s Meteorological Operational (METOP) satellite. The active microwave-based soil moisture product used in this study is derived using the empirical change-detection approach developed at the Vienna University of Technology (TU-Wien) by Wagner, Lemoine, and Rott [45]. Time series of soil moisture based on the change-detection method permit the discrimination of scattering processes at various time scales, and thus can differentiate the highly variable soil moisture process and seasonal vegetation patterns. The ASCAT data set used in this study is released by EUMETSAT Satellite Application Facility on Support to Operational Hydrology and Water Management (H-SAF), with a spatial resolution of 12.5 km. The product represents the relative measure of surface soil moisture ranging from 0 (dry condition) to 100 (wet condition) obtained by scaling normalized backscatter between the historically lowest and highest values. The ASCAT soil moisture product is introduced in more detail by [46,47].
2.1.3. ESA CCI Product
The ESA CCI product was supported under the framework of European Space Agency’s Water Cycle Multi-Mission Observation Strategy (WACMOS) project and Climate Change Initiative (http://www.esa-soilmoisture-cci.org). The ESA CCI data set was derived from passive products including observations from Scanning Multichannel Microwave Radiometer (SMMR), Special Sensor Microwave Imager (SSM/I), Tropical Rainfall Measuring Mission Microwave Imager (TMI), Advanced Microwave Scanning Radiometer for the Earth Observing System (AMSR-E), Advanced Microwave Scanning Radiometer-2 (AMSR2), and WindSat; and active products including the Advanced Scatterometer (ASCAT) observations and scatterometer observations on board the European Remote Sensing (ERS) satellite [31,48]. The ESA CCI data set provides surface soil moisture information in volumetric units (m3 m−3) on a daily basis at a spatial resolution of 0.25°. Besides the difference in the quality of the individual data source, uncertainties of ESA CCI product could result from the selected merging procedures in combining retrievals from different observation systems, different mission designs as well as different retrieval algorithms. Despite certain limitations, the ESA CCI product has demonstrated great potential for evaluating model performance [28,29,30,49], and for studying the global-scale land-atmosphere interactions [50]. In this study, the latest version (v04.2) of ESA CCI was used for analysis. Compared with the previous version, this version not only extends the temporal coverage by three years through including WindSat and AMSR2 data, but also improves the gap filling and other processing algorithms (http://www.esa-soilmoisture-cci.org/node/185).
2.1.4. ERA-Interim Product as Benchmark
The ERA-Interim has served as a benchmark for comparison against the microwave-based soil moisture products, as it does not account for any human-induced irrigation practice. It is a global land surface reanalysis data set covering the period 1979–2016. Although there are several improvements of the land surface parameterizations in ERA-Interim/Land compared to ERA-Interim [51], the latter has greater temporal overlap with above-mentioned satellite products which facilitates the intercomparison of analysis results. Therefore, soil moisture data from the ERA-Interim dataset are used in this study. Four layers of soil (0–7, 7–28, 28–100, and 100–289 cm) are represented in ERA-Interim reanalysis, and soil moisture is provided at 00:00, 06:00, 12:00, and 18:00 UTC with the unit of m3 m−3 [52]. In order to be comparable with the sensing depth of the satellite sensors, only the first layer (0–7 cm) of reanalysis data were used in the study.
2.1.5. In-situ Network Observations
In-situ soil moisture measurements were collected from the nationwide agro-meteorological network (http://data.cma.gov.cn/data/detail/dataCode/AGME_AB2_CHN_TEN.html), with quality control performed by the National Meteorological Center of the China Meteorological Administration (CMA). The locations of the stations are shown in Figure 1 (with high monitoring density across the irrigation hotspots in the Huang-Huai-Hai (HHH) Plain outlined by grey shading). To monitor the soil water status, measurements were taken on the 8th, 18th, and 28th day of each month since 1991 at each agro-meteorological site. Soil moisture was measured at the depth of 10, 20, 30, 50, 70, and 100 cm, and no measurements were recorded under frozen soil conditions. This data set of in-situ soil moisture measurements from the nationwide agro-meteorological network has been widely used for investigating soil moisture spatial and temporal characteristics and validation of microwave soil moisture in China [42,53]. Similar to ERA-Interim reanalysis, only the in-situ soil moisture observations of the first layer (10 cm) were used in the study. As soil moisture was measured by the gravimetric method and recorded as the relative ratio to field capacity, the 0.25-degree global porosity map provided along with ESA CCI v04.2 product was used to convert raw measurements to a volumetric unit.
2.2. Precipitation Data
In this study, the difference between the rainfall product obtained from satellite soil moisture through the SM2RAIN algorithm [54] and from model simulations was used to verify the occurrences of irrigation. The SM2RAIN product was applied to the ASCAT data [55] for the period from January 2007 to June 2015. The ASCAT-derived rainfall dataset (in mm/day) is gridded over a 0.5-degree grid on a global scale, and represents the cumulated rainfall between the 00:00 UTC until the 23:59 UTC of the indicated day. The other rainfall product was derived from ERA-Interim model without the irrigation module representing the same cumulative period of the indicated day.
2.3. Irrigation Data
2.3.1. Areas Equipped for Irrigation (AEI) from FAOSTAT
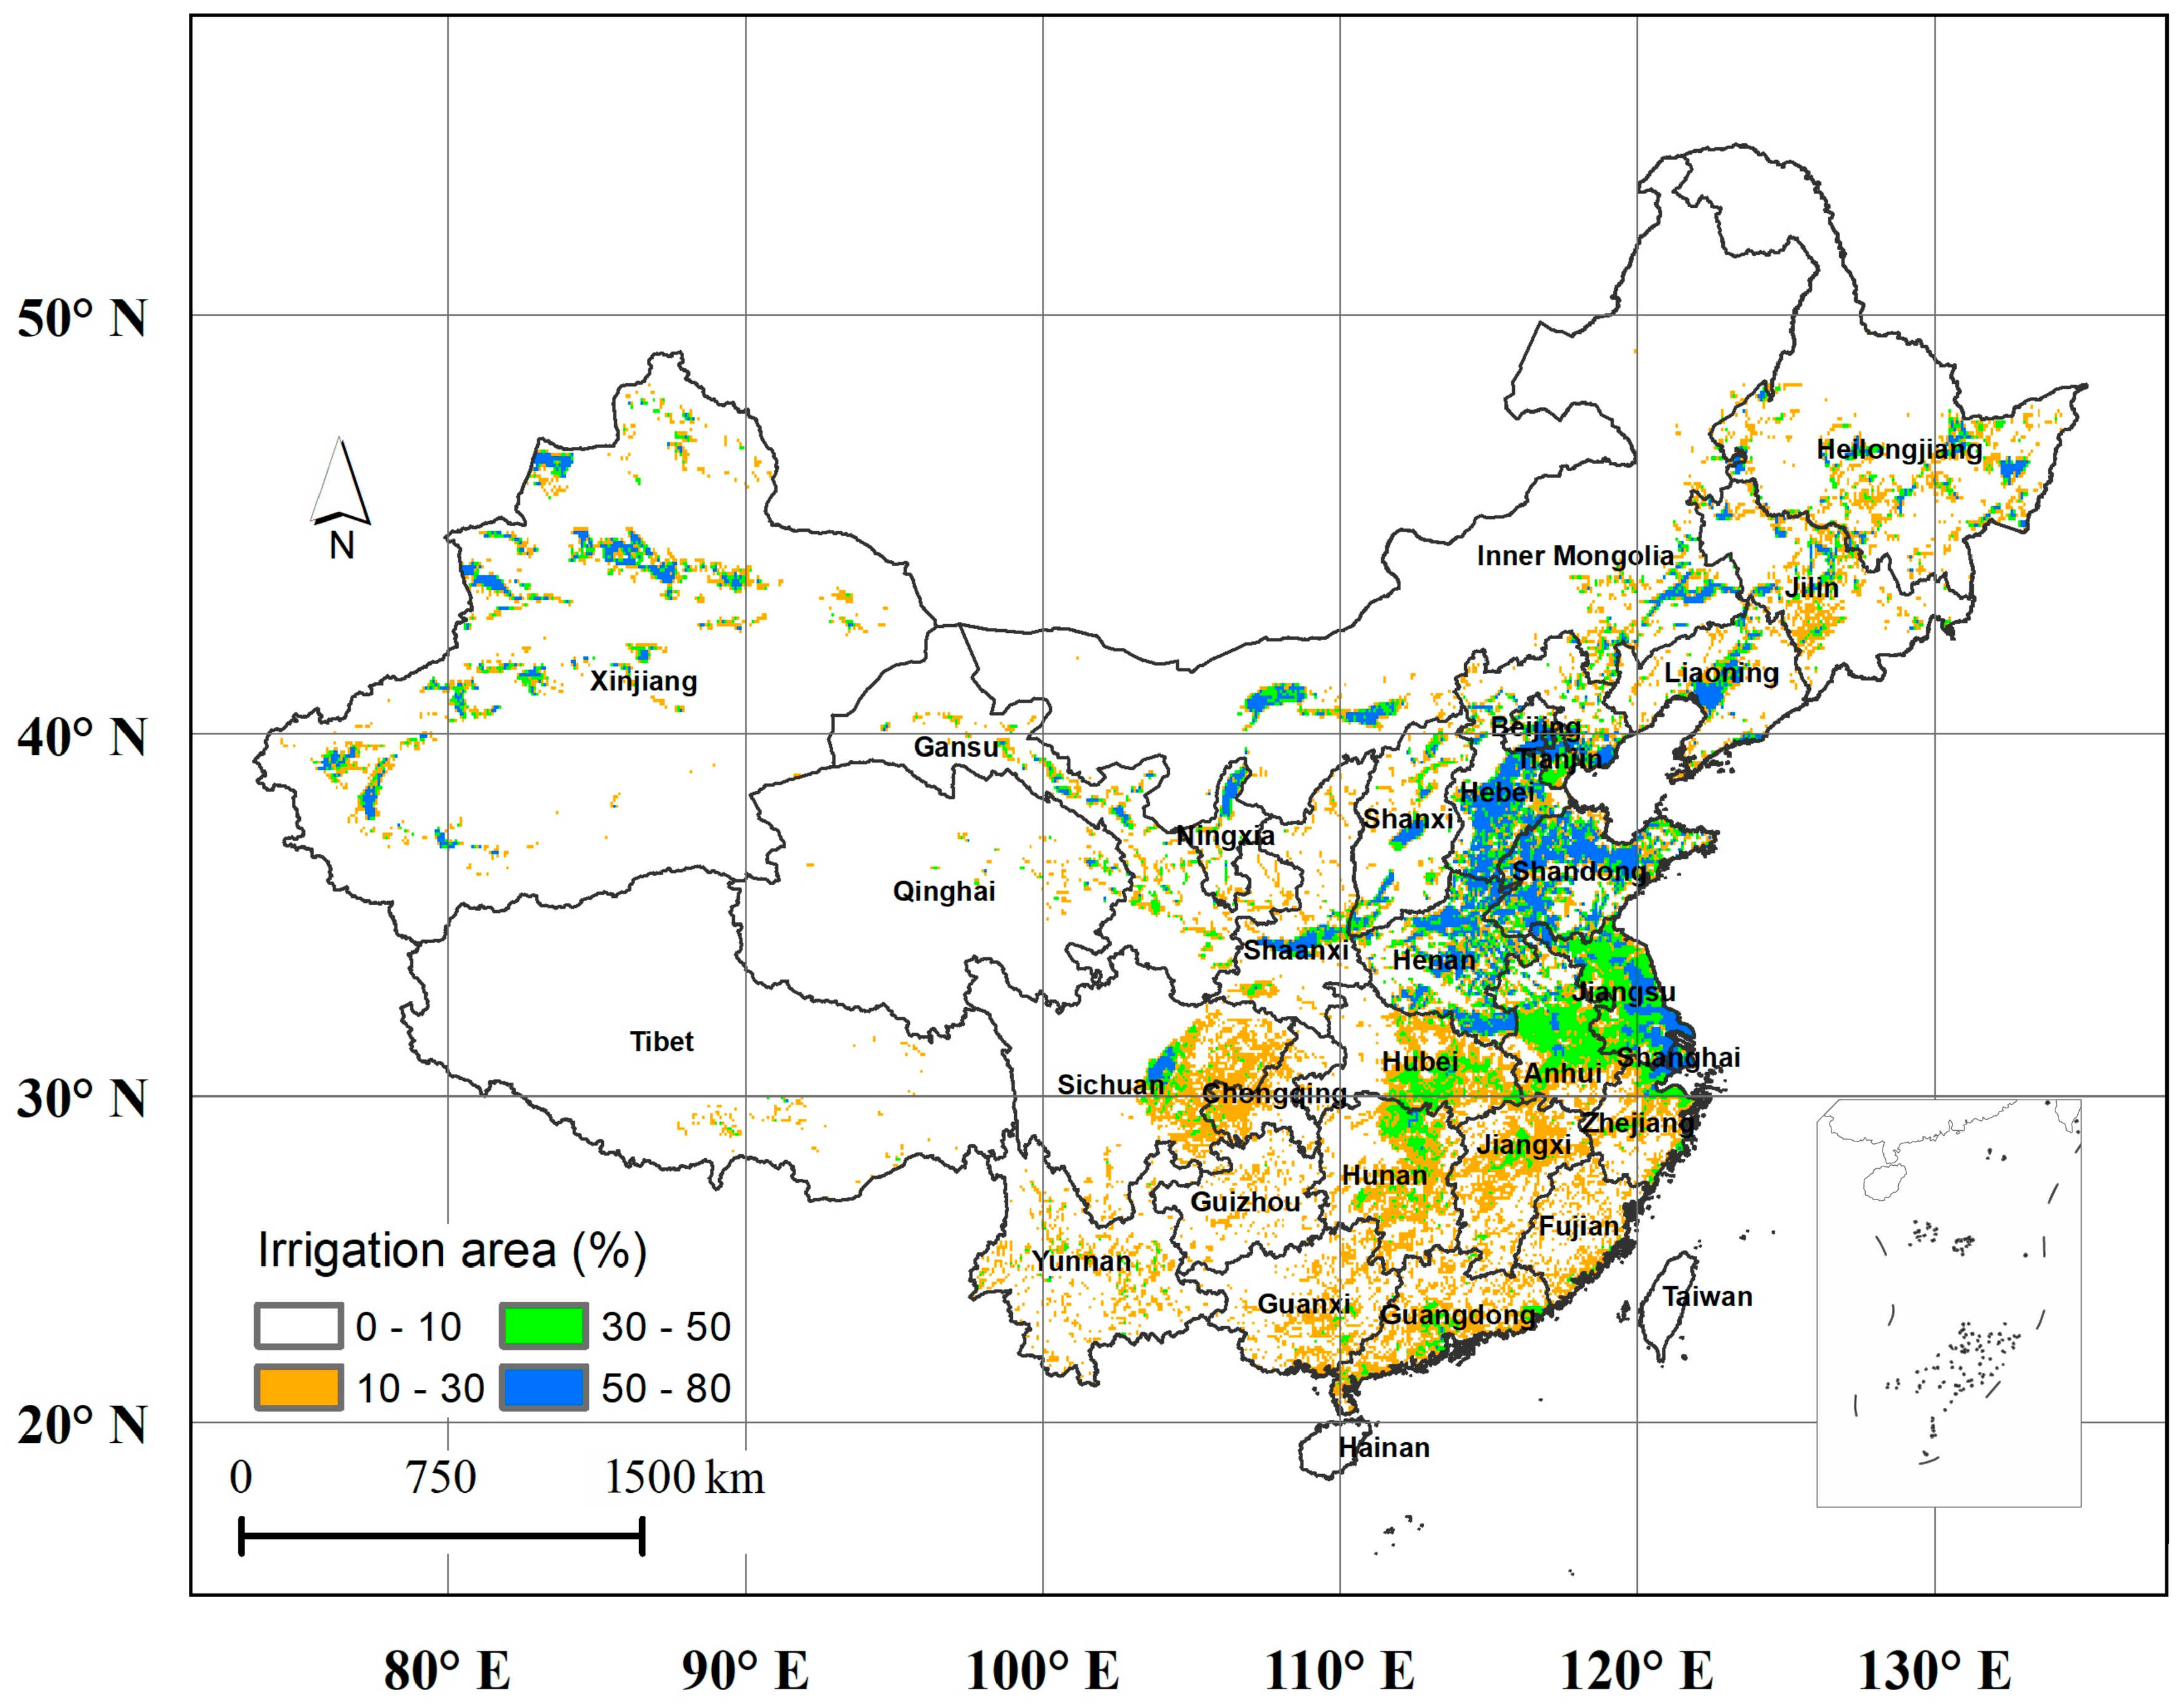
We used a gridded data set on the areas equipped for irrigation (AEI) from Statistics Division of the FAO (FAOSTAT) around the year 2005 [56]. The data set is available at 5 arc minute × 5 arc minute grid cells, and is further aggregated to 0.25 degree to be consistent with microwave soil moisture products. The quality of the irrigation data set is considered reliable compared to sub-national irrigation statistics [57]. In addition, its quality is also positively assessed by comparing records on irrigation equipment and real practices at the agro-meteorological sites in Hebei Province collected and processed by the National Meteorological Center [58]. The spatial distribution of irrigation areas is shown in Figure 2, it is obvious that the HHH Plain (including Tianjin, Beijing, and five provinces: Anhui, Hebei, Henan, Jiangsu, and Shandong), which is regarded as the ‘Granary of China’, is one of the most important irrigation hotspots in China. There are also important irrigation districts in Ningxia and Inner Mongolia with irrigation water withdrawn from Yellow River, and irrigation oases distributed between the two inland arid basins in Xinjiang. It should be noted that the map refers to the areas equipped with irrigation rather than area actually irrigated. Typically, the spatial extent with actual irrigation was smaller than area equipped with irrigation [57].
2.3.2. Areas with Actual Irrigation by GRIPC
The areas with actual irrigation are represented using Irrigated Area Map Asia and Africa by International Water Management Institute (IWMI-IAMAA). This product utilizes the hierarchical classification procedure to map phenological changes in agriculture areas using 16-day MODIS 250 m NDVI composites images (MOD13Q1). The agricultural areas were categorized into irrigated and rain-fed by analyzing the seasonal vegetation trends. Furthermore, agricultural areas with multiple cropping cycles were identified by analyzing the cyclic nature of vegetation change in agricultural systems. Based on the cropping intensity, agriculture areas were further categorized into single, double and continuous crops. In comparison with other irrigated cropland inventories, IWMI-IAMAA showed general agreement with other available global irrigation data sets, such as FAOSTAT and the database of Global Rain-fed, Irrigated and Paddy Croplands (GRIPC) [59]. In this study, IWMI-IAMAA is also served as a benchmark for identifying the actual irrigation (Figure 3).
2.4. Discerning Difference in Probability Distributions of Two Time Series
The two-sample Kolmogorov-Smirnov (K-S) test [60] is used in this study to quantitatively compare the probability distributions of two data sets, and to test if the two samples come from the same continuous distribution (Ho), against the alternative that they do not come from the same distribution (Ha). The K-S test statistic quantifies the distance Dm,n between empirical cumulative distribution functions (CDF) of two samples (F(x) and G(x) where x is the sampled variable) and is computed as follows:
where m and n are the sample sizes of F and G.
The null distribution of the K-S statistic is calculated under the null hypothesis that samples are drawn from the same distribution. The null hypothesis is rejected at the confidence level α if
where c(α) is the inverse of the Kolmogorov distribution at α.
The K-S test is applied to the probability distributions of the surface soil moisture retrievals from different microwave sensors and the ERA-Interim. Values of D closer to zero indicate that the soil moisture distributions from the comparison pair are similar. Conversely, higher D values indicate larger differences between the soil moisture distributions from the two integrations. In this study, we focus on the probability distributions of soil moisture during the irrigation period. This method has been successfully applied in similar investigations [32,61].
2.5. Metrics Evaluating the Accuracy of Soil Moisture Products
Besides the conventional Pearson’s and Spearman’s correlation, we also employed the entropy-based mutual information (MI) [62] to measure the correlation between two random variables. The MI between two variables represents the amount of entropy (uncertainty) in either of the two variables that can be reduced by knowing the other. It is more rigorous compared to the commonly-used metrics such as Spearman’s rank correlation coefficient and Pearson product-moment correlation coefficient, the latter being an approximation of MI under certain conditions [14].
MI and the related Shannon-type entropy [63] are calculated as follows. Entropy about a random variable ζ can be interpreted as a measure of uncertainty according to its distribution pζ, and is estimated as the expected amount of information from pζ sample:
MI between ζ and another variable ψ can be thought of as the expected amount of information about variable ζ contained in a realization of ψ, and is measured by the expected Kullback-Leibler (KL) divergence [64] between the conditional and marginal distributions over ζ:
In this study, we calculated the MI content between various soil moisture products and in-situ measurements in each grid. All the estimated MI is normalized by the entropy of the corresponding in-situ measurements to remove the effect of inter-site variation on the magnitude of difference, and the normalized MI (NMI) represents the fraction of uncertainty in ground observations that is resolvable given knowledge of the soil moisture retrievals or simulations. The details on the MI estimation can be referred to Qiu et al. [65] and Qiu, Crow, and Nearing [53].
3. Results and Discussions
3.1. Validation of Satellite Soil Moisture Products
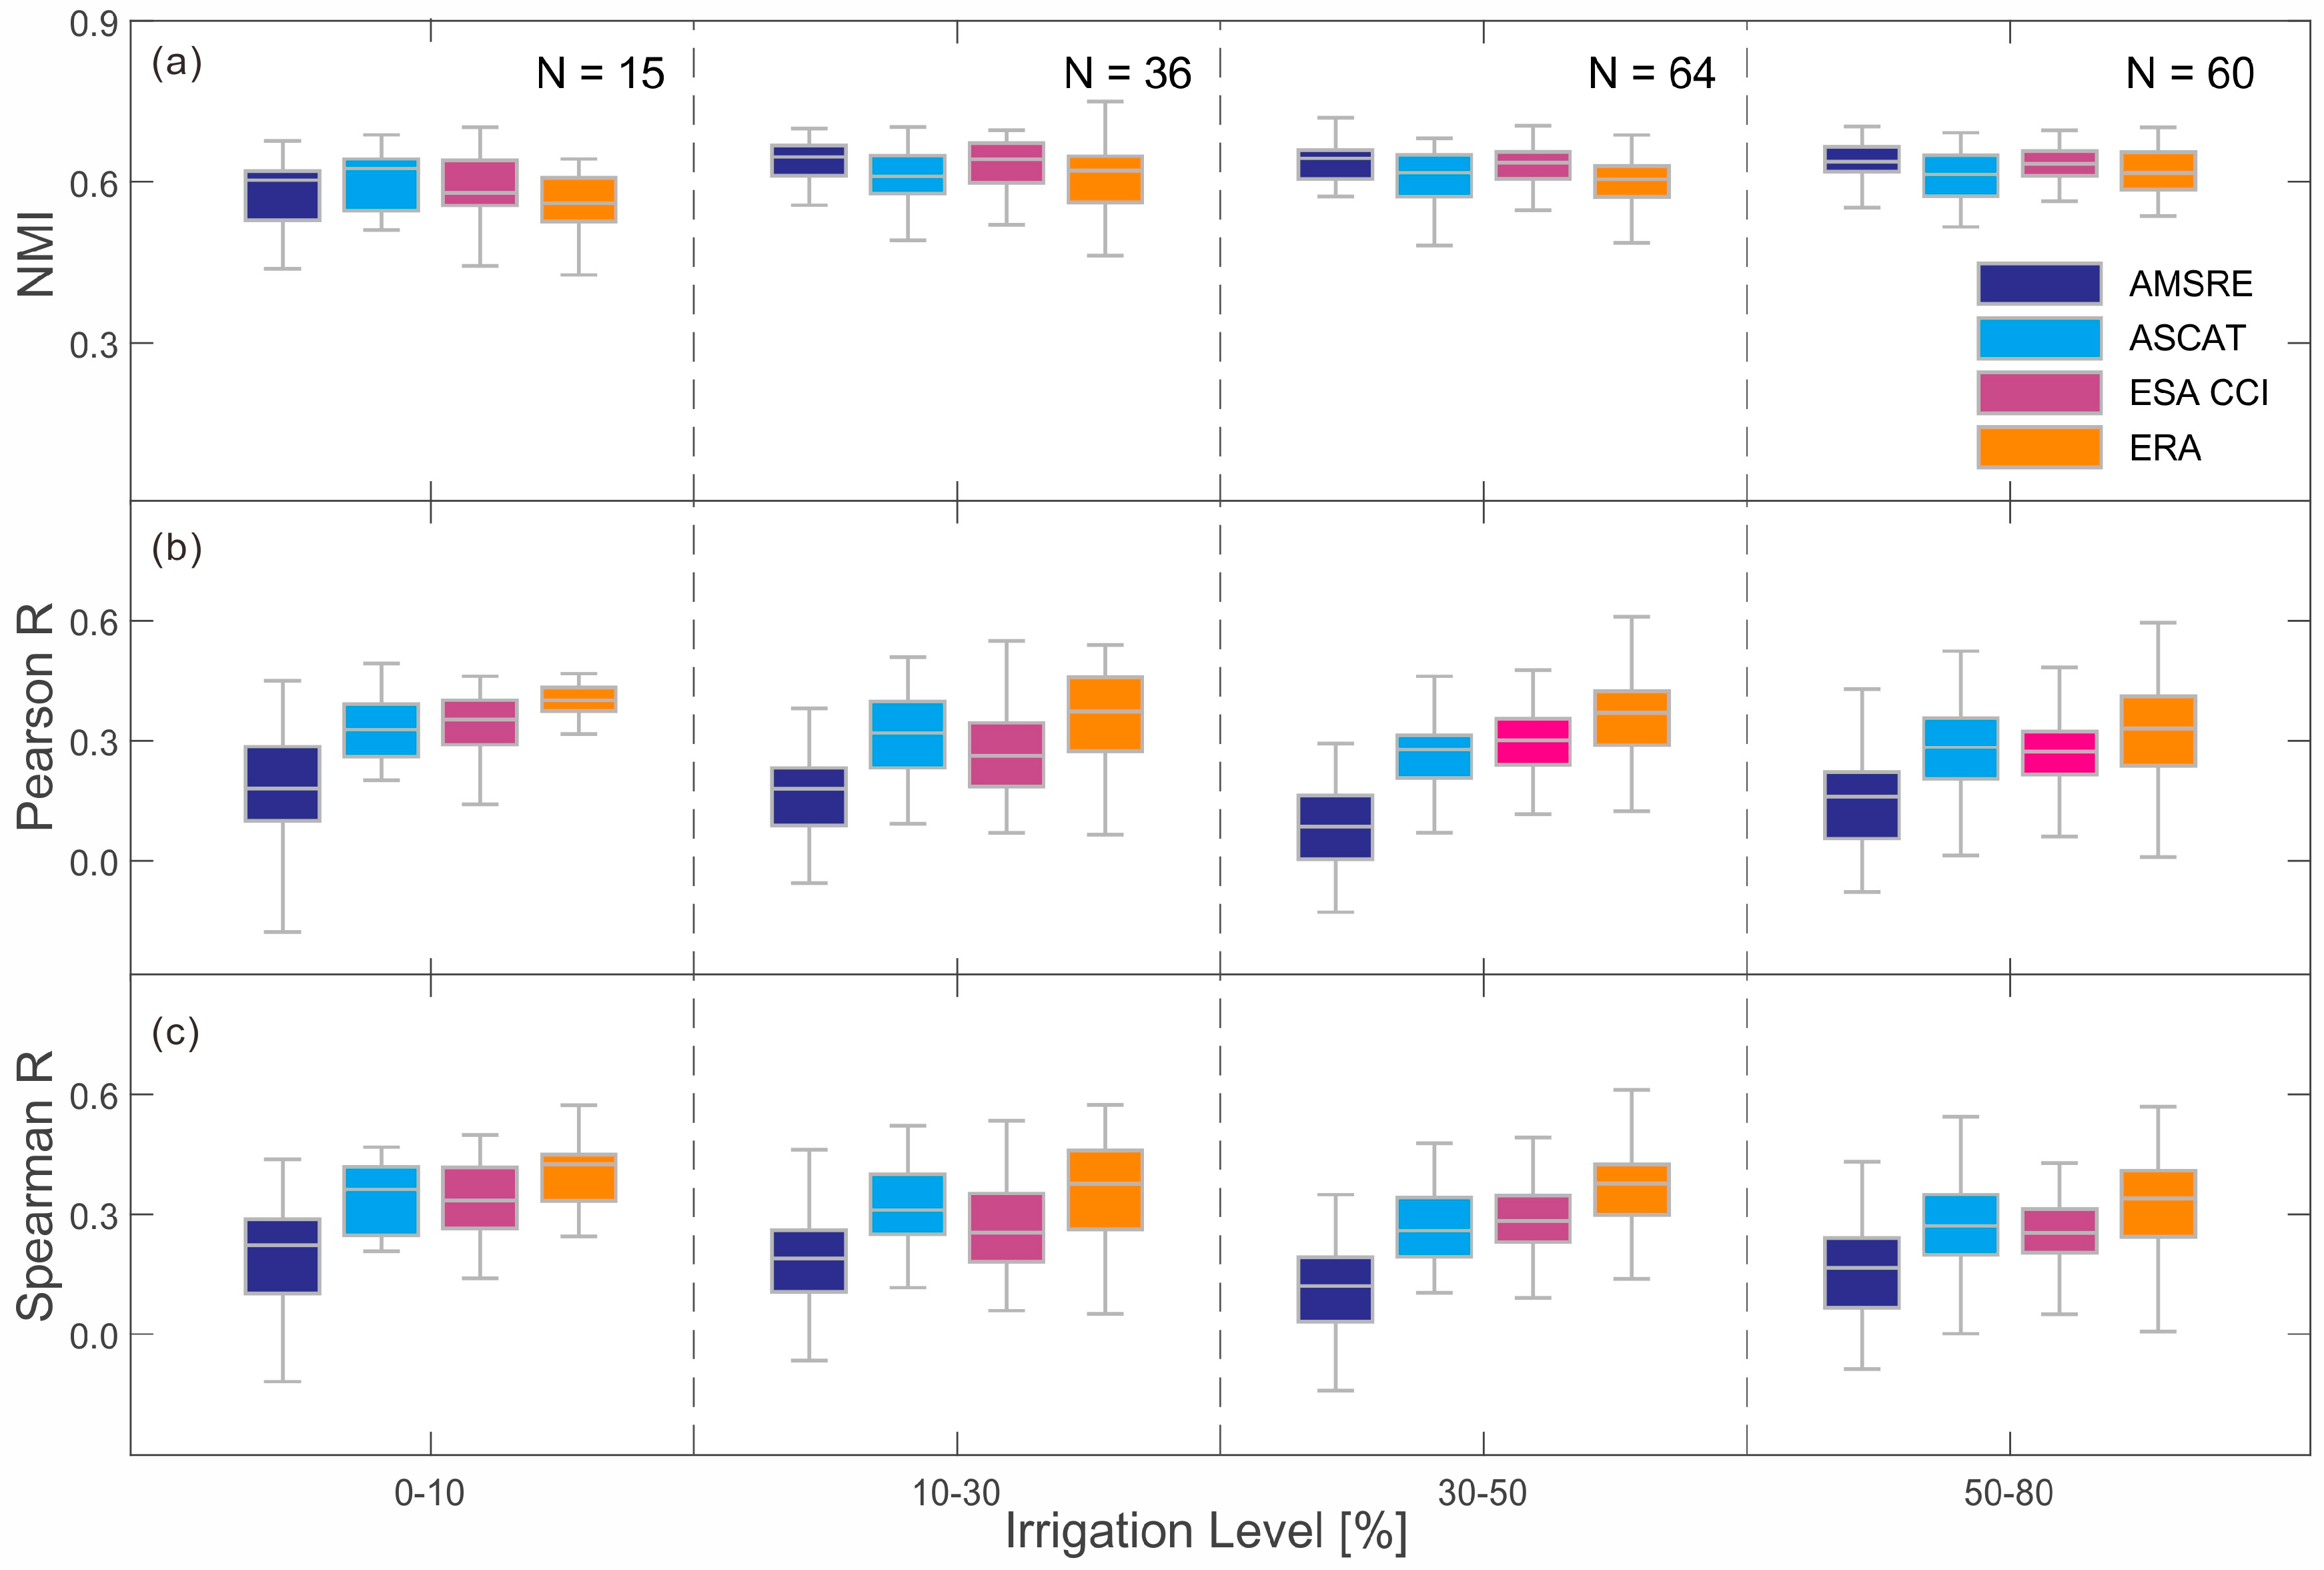
In this section, both satellite-based and model-based soil moisture data sets during 2007–2012 (limited by the temporal coverage of in-situ measurements) were validated against ground observations from agro-meteorological sites. Three statistical metrics, i.e., the normalized mutual information (NMI), and two conventional correlation coefficients (Spearman’s rank correlation and Pearson’s correlation), are adopted in the validations. The evaluation is conducted using all agro-meteorological sites with complete soil moisture record, and grouped based on different AEI levels of the grid cell, i.e., 0–10%, 10–30%, 30–50%, and 50–80% (see Figure 4). In order to capture the short-term variability of surface soil moisture, anomalies were calculated relative to seasonal varying soil moisture climatology by using the 31-day moving window to normalize the time series [66].
High consistency between satellite-based soil moisture and in-situ measurements is found using the NMI statistics with median NMI up to 0.6, indicating 60% of uncertainties in soil moisture anomaly (based on ground observations) can be resolved by knowing the satellite-based soil moisture retrievals. The high consistency is robust across different irrigation intensity levels, and demonstrates stable performance across various irrigation levels. However, the linear relationship between satellite-based and ground-based soil moisture using Pearson correlation or Spearman correlation indicates that all microwave soil moisture products have median R around 0.3, while ERA Interim has the highest linear relationship with in-situ measurements. In addition, with increasing AEI levels, there is a notable decrease in the lower quantile and minimum value (negative correlations) of Pearson and Spearman correlations for all three microwave soil moisture products. The results based on conventional correlation coefficients are in marked contrast to NMI statistics. This implies that, under anomalously wetter conditions (i.e., increasing AEI levels), neither Spearman nor Pearson correlation is appropriate for identifying the full coupling strength between satellite/simulation data sets and ground observations. Instead, the NMI statistic has comparative advantage over the other two metrics in validating soil moisture time series, especially when the soil moisture significantly exceeds the norm. Overall, our results suggest that satellite-based retrievals can well reproduce the variations of observed soil moisture content over irrigated regions in China.
3.2. Utility of Satellite Soil Moisture Retrievals in Mapping Irrigation Pattern
After validating the satellite-based and model-based soil moisture estimates against ground observations, we investigate the potential utility of satellite retrievals in identifying: (1) Spatial distribution of irrigation extent; (2) temporal impulse response from irrigation.
3.2.1. Identification of Spatial Distribution and Irrigation Intensity of Major Irrigation Regions
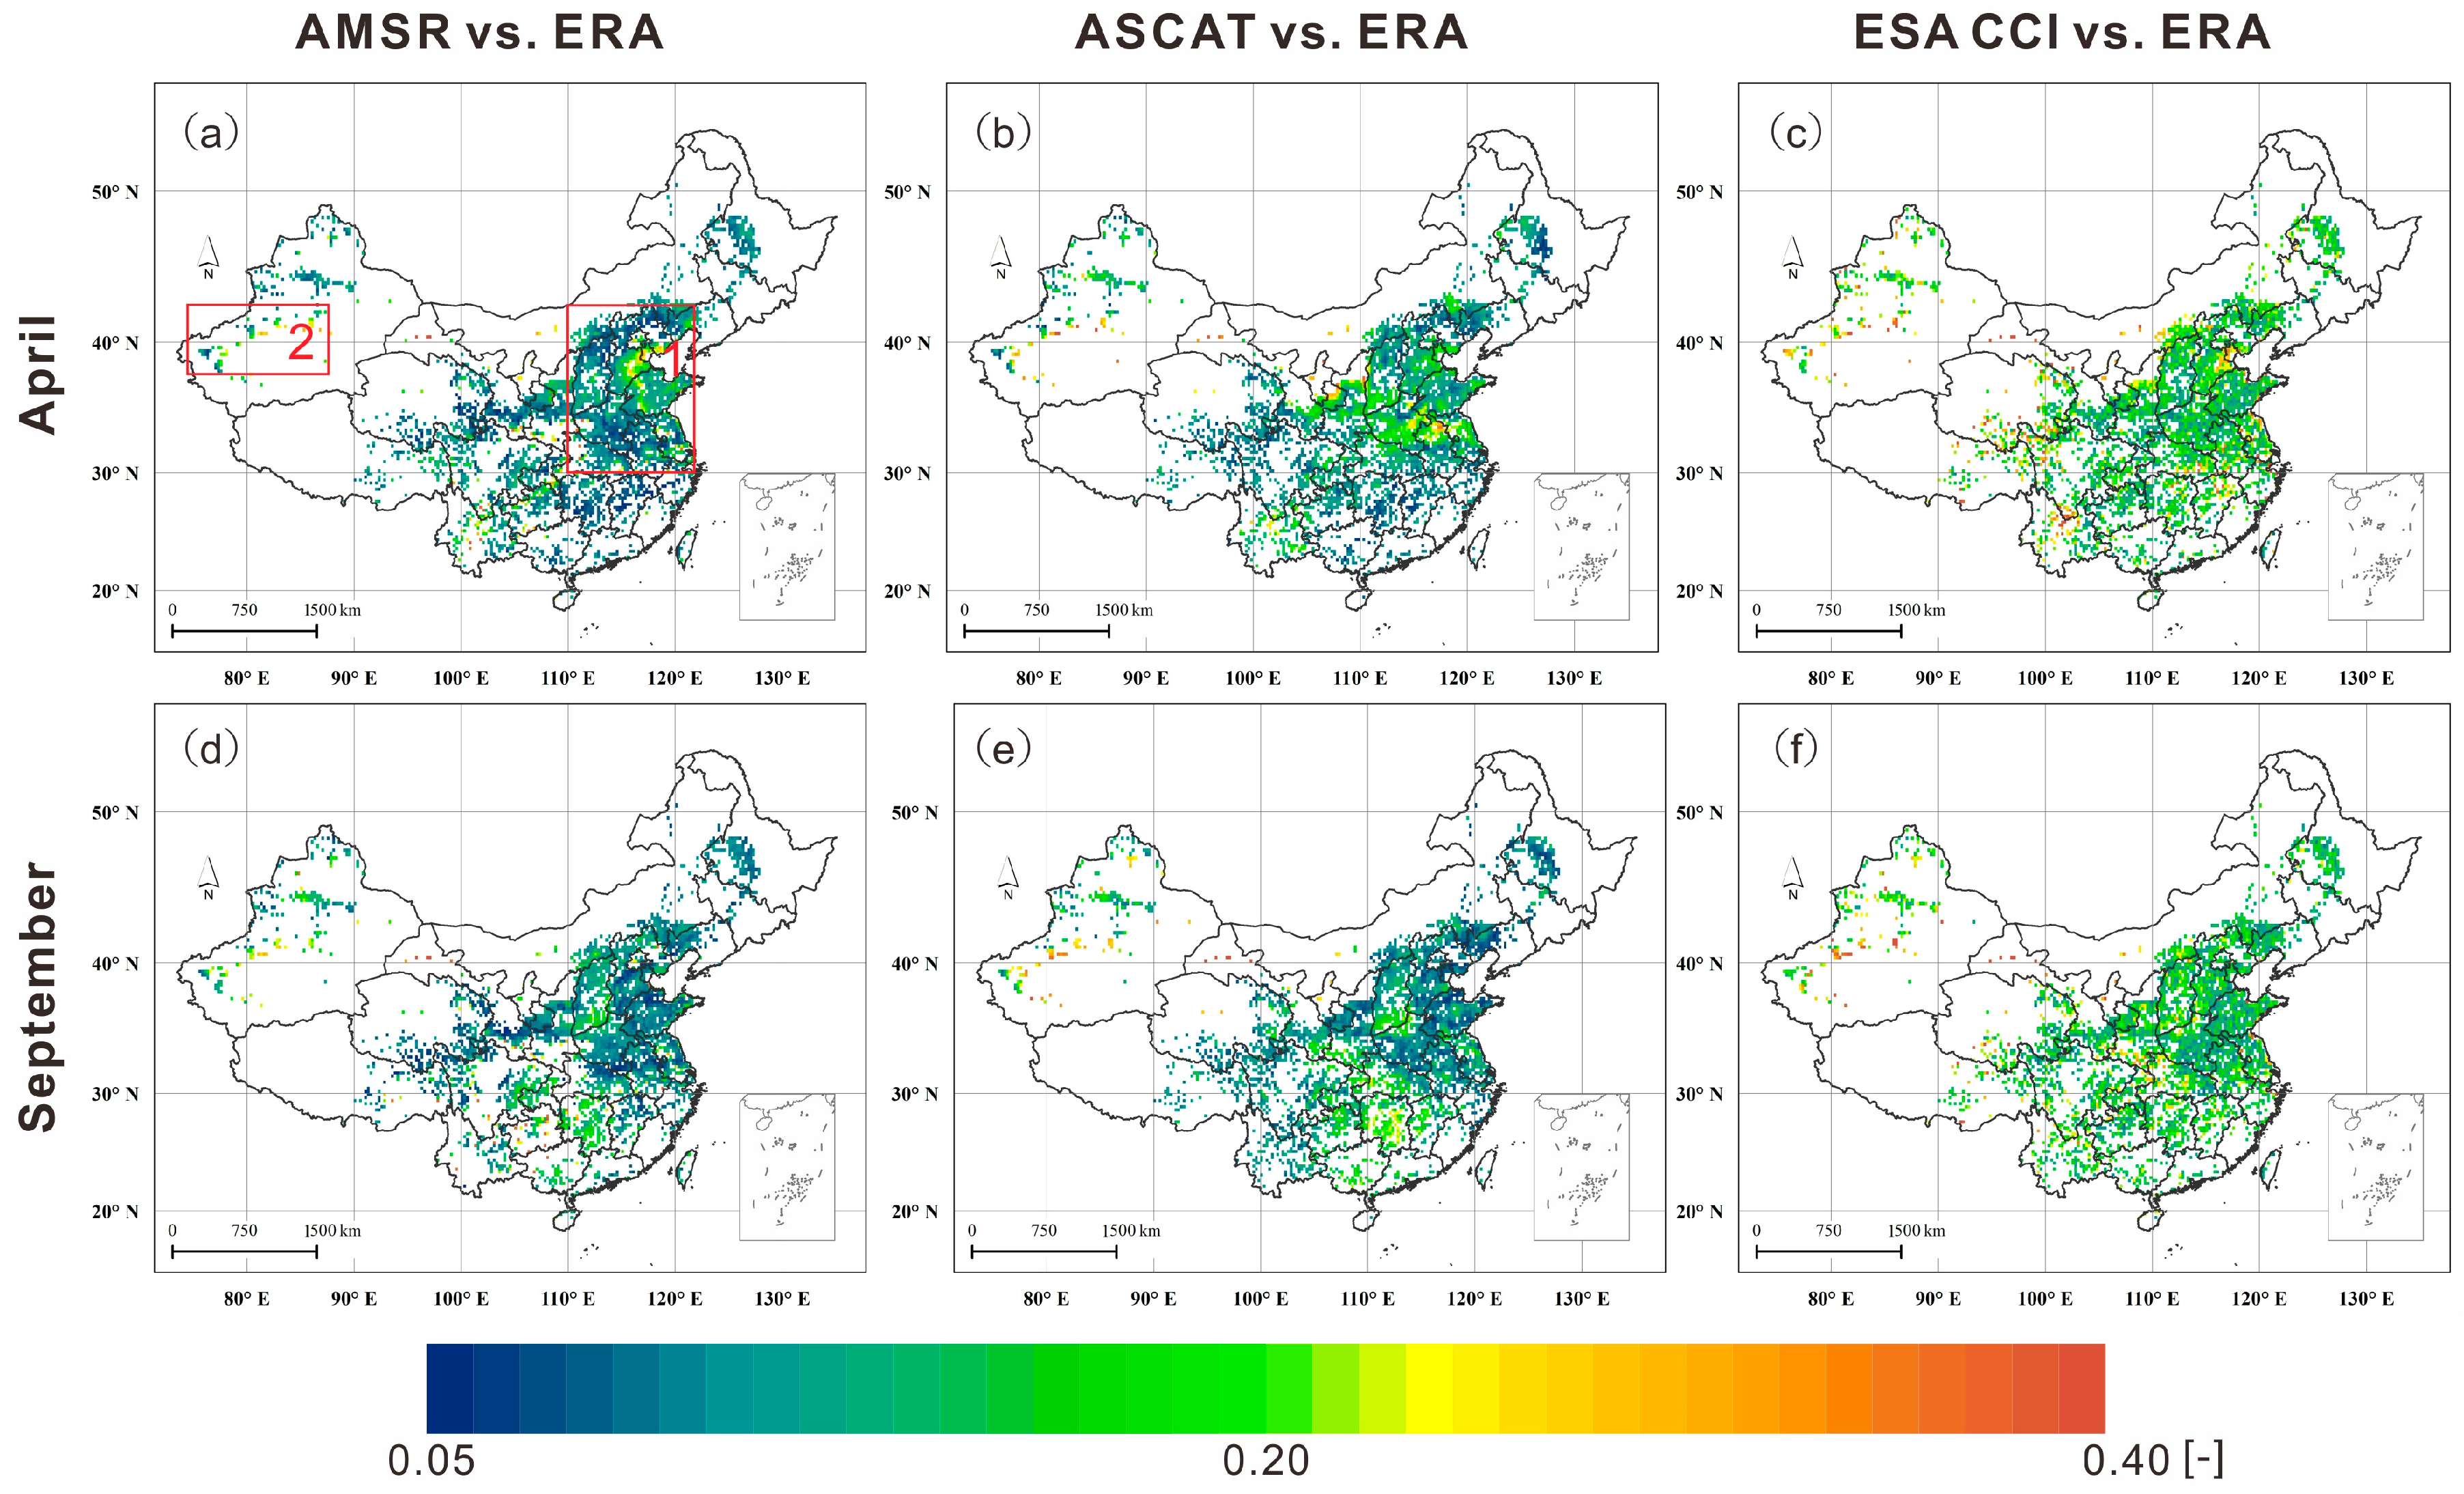
Prior to conducting the K-S analysis, ASCAT product was resampled to 0.25° to be consistent with other microwave-based soil moisture data sets. In order to ensure maximum temporal overlap of three microwave products, the analysis period is selected as 2007–2014. For a better illustration of the distinctively different features in K-S statistics between irrigation and non-irrigation situations, we contrast our spatial identification results for months with and without prevailing irrigation across the nation. As precipitation in the HHH Plain is concentrated during July to August, regional-scale agricultural irrigation is commonly conducted at critical growing stages for winter wheat outside the rainy season, i.e., early April (during the green-up stage), early May (during the milking stage), and October (before the planting of winter wheat) [67]. Therefore, we selected irrigation month of April and non-irrigation month of September for spatial pattern contrast. Figure 5 shows the quantitative comparison of the differences in soil moisture distributions between three remote sensing soil moisture retrievals and that from ERA-Interim over cropland areas. We removed the differences in mean and variance (for the entire time series) of each pair of soil moisture products prior to calculating the K-S metrics.
It is found that the K-S metrics calculated from all microwave-based soil moisture have successfully discerned the irrigation areas. The hotspots with sufficient samples include the irrigated oases to the north and west rims of Tarim Basin in Xinjiang (Region 2 in red rectangle in Figure 5a). This is consistent with the results from trend analysis in [53], who compared ESA CCI with soil moisture estimates from ERA-Interim/Land and ground sites, and found that the deviations between the land surface model (without irrigation modules) and satellite retrievals may result from the effects of heavy irrigation in the area.
The most prominent irrigation hotspot identified by the three microwave-based soil moisture products is located in the HHH Plain (Region 1 in red rectangle shown in Figure 5a). In particular, the K-S map from the Advanced Microwave Scanning Radiometer (AMSR) retrievals is featured with high value in the north of the HHH Plain, especially in the Hebei Irrigation District (AEI level 50–80%). The K-S test also suggests that the distribution of advanced microwave scanning radiometer (AMSR) is significantly different from that of ERA Interim over Region 1 (p < 0.05). Comparatively, the ASCAT highlighted the intensively irrigated areas in the mid-south of the HHH Plain, which is the paddy area in eastern Henan and northern Jiangsu Provinces. This is due to the fact that ASCAT seems to be more sensitive to specular reflection of the active radar signal from the flooded rice fields [36], leading to very low backscatter and, hence, deviating CDF of soil moisture from ERA Interim.
In addition, ESA CCI successfully detected the irrigation hotspot in Hebei Province that conforms to AMSR detection. This resemblance can also be explained by the similar accuracies of these two products as shown in Figure 4. It is noted that the ESA CCI K-S map in irrigated April (Figure 5c) is more homogenous compared to AMSR and ASCAT (Figure 5a,b). This is likely due to the generation procedures of ESA CCI in that both passive and active data sets are CDF matched against the GLDAS-1-Noah simulation before merging, which consequently reduces the maximum CDF distance between ESA CCI and the selected benchmark. For the non-irrigated September, three products all showed mainly homogenous patterns, with seldom highlights in K-S maps.
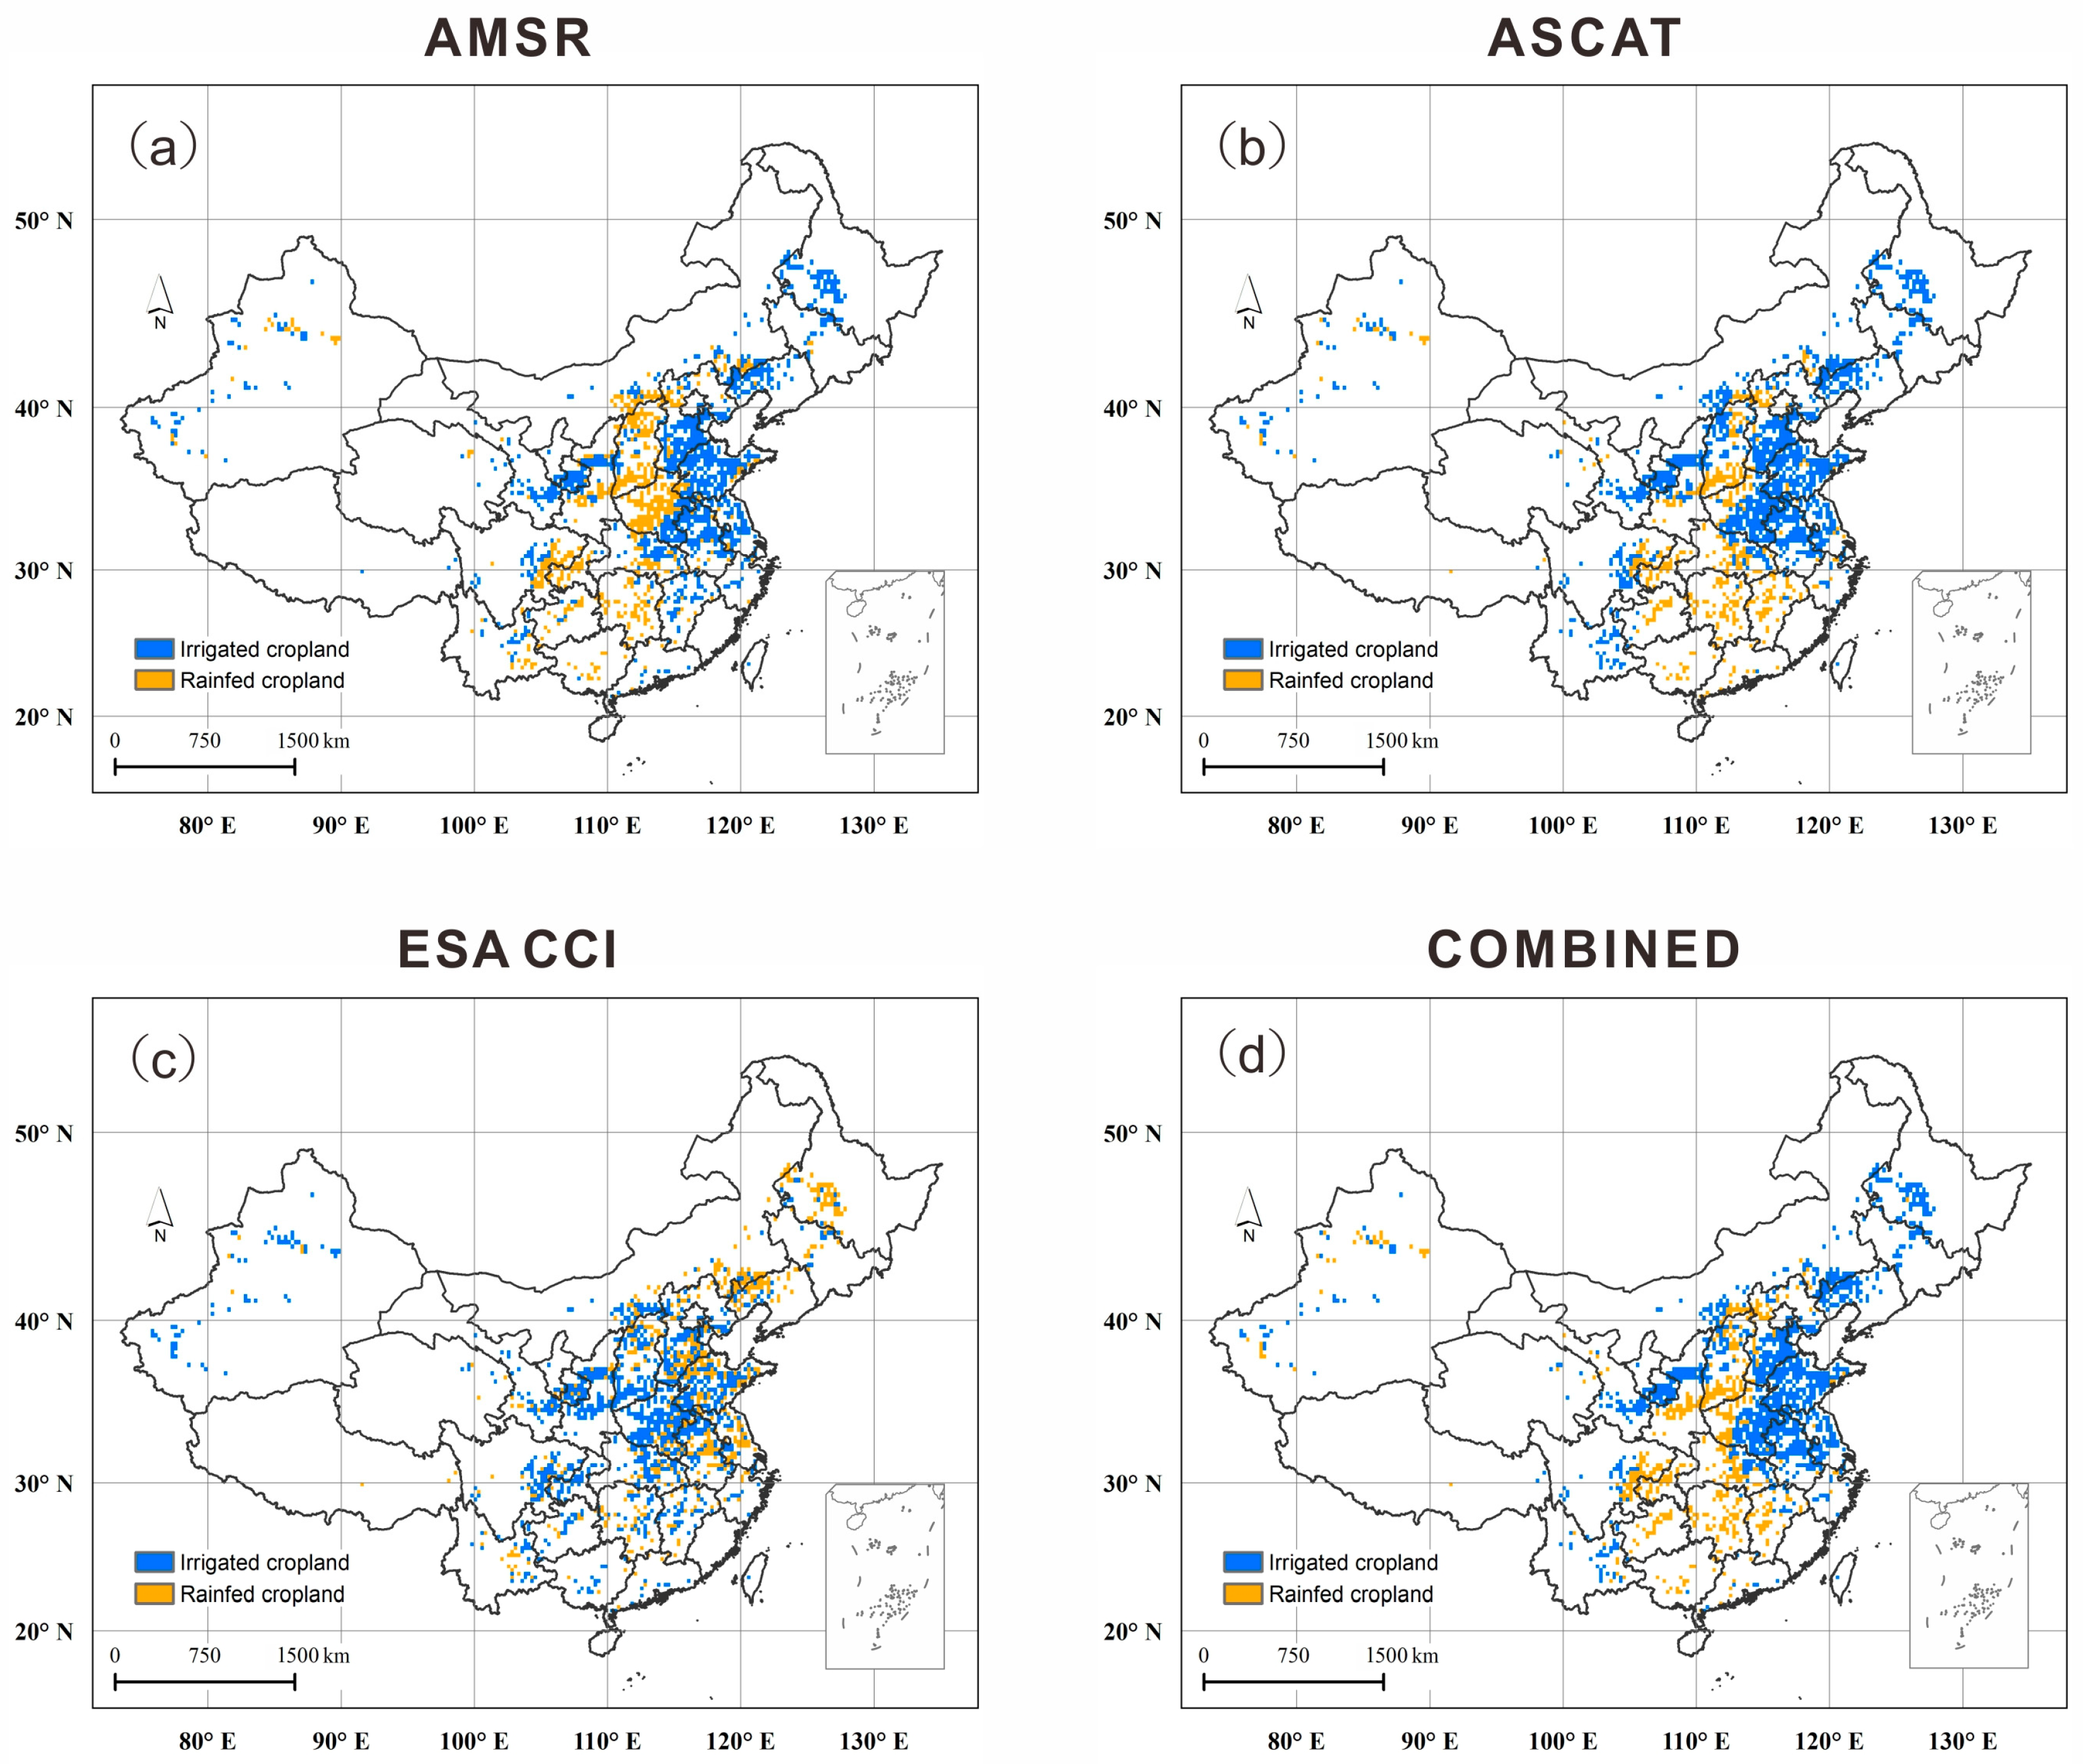
To further demonstrate the abilities of satellite products in detecting irrigation intensities, we use the K-S statistics generated by each product to discern the irrigated areas from the rain-fed cropland. Considering the wide variation in irrigation practice across the nation (different onset time and amount), we incorporate all information of 12-month K-S statistics into an ISODATA clustering analysis, a classic and reliable method of pattern classification [68], and illustrate the clustering results in Figure 6, the discerned cluster with higher K-S statistics is classified as irrigation cropland. Comparing to IWMI-IAMAA irrigation map (Figure 3, considered as ground truth), all three products demonstrated various degrees of success in identifying irrigation areas. Specifically, AMSR is more reliable in the northwest of the HHH Plain (i.e., northern Shanxi and southern Inner Mongolia), while ASCAT better captures the heavy irrigation features in the southwest of the HHH Plain (Henan Province). The more isolated and scattered irrigation pattern produced by ESA CCI is also likely due to the pixel-wise CDF matching in its generation process. In order to verify this assumption, we simply combined all 12-month K-S samples of both AMSR and ASCAT in the clustering analysis, and show the results in Figure 6d. It is evident that detection success of simple combination closely resembles that of ASCAT, with only a slight discrepancy in southern Henan, which is also confirmed by the indices in the confusion matrix (Figure 7).
In order to further quantify the clustering accuracies of three products, we calculated the confusion matrices of classification using IWMI-IAMAA irrigation map as a benchmark (Figure 7). It is seen that all three data sets demonstrate excellent irrigation detection accuracy. Generally, above 70% of actual irrigation areas can be detected using microwave soil moisture, with highest detection performance exhibited in ASCAT (88%), which is consistent with the investigation of Kumar [32]. Meanwhile, the producer’s accuracy in rain-fed areas classification is highest in AMSR (48%). It should be pointed out that numerous factors including vegetation density, RFI, along with irrigation can attribute to the deviation of empirical CDF between microwave-based and reanalysis soil moisture, whereas this clustering process identifies irrigation areas only based on the maximum CDF distance, i.e., K-S statistics. This will inevitably introduce uncertainties, which can be quantified in the user’s accuracy. Overall, the miss-classification of rain-fed areas into irrigation is within the range of (27–36%). In addition, the statistics of ASCAT and simple combination are in high consistency (Figure 7b,d). Through increasing the K-S samples, the producer’s accuracy in rain-fed areas classification has slightly increased from 35% to 38%.
3.2.2. Reproducing the Temporal Evolutions of Soil Moisture in Irrigated Regions
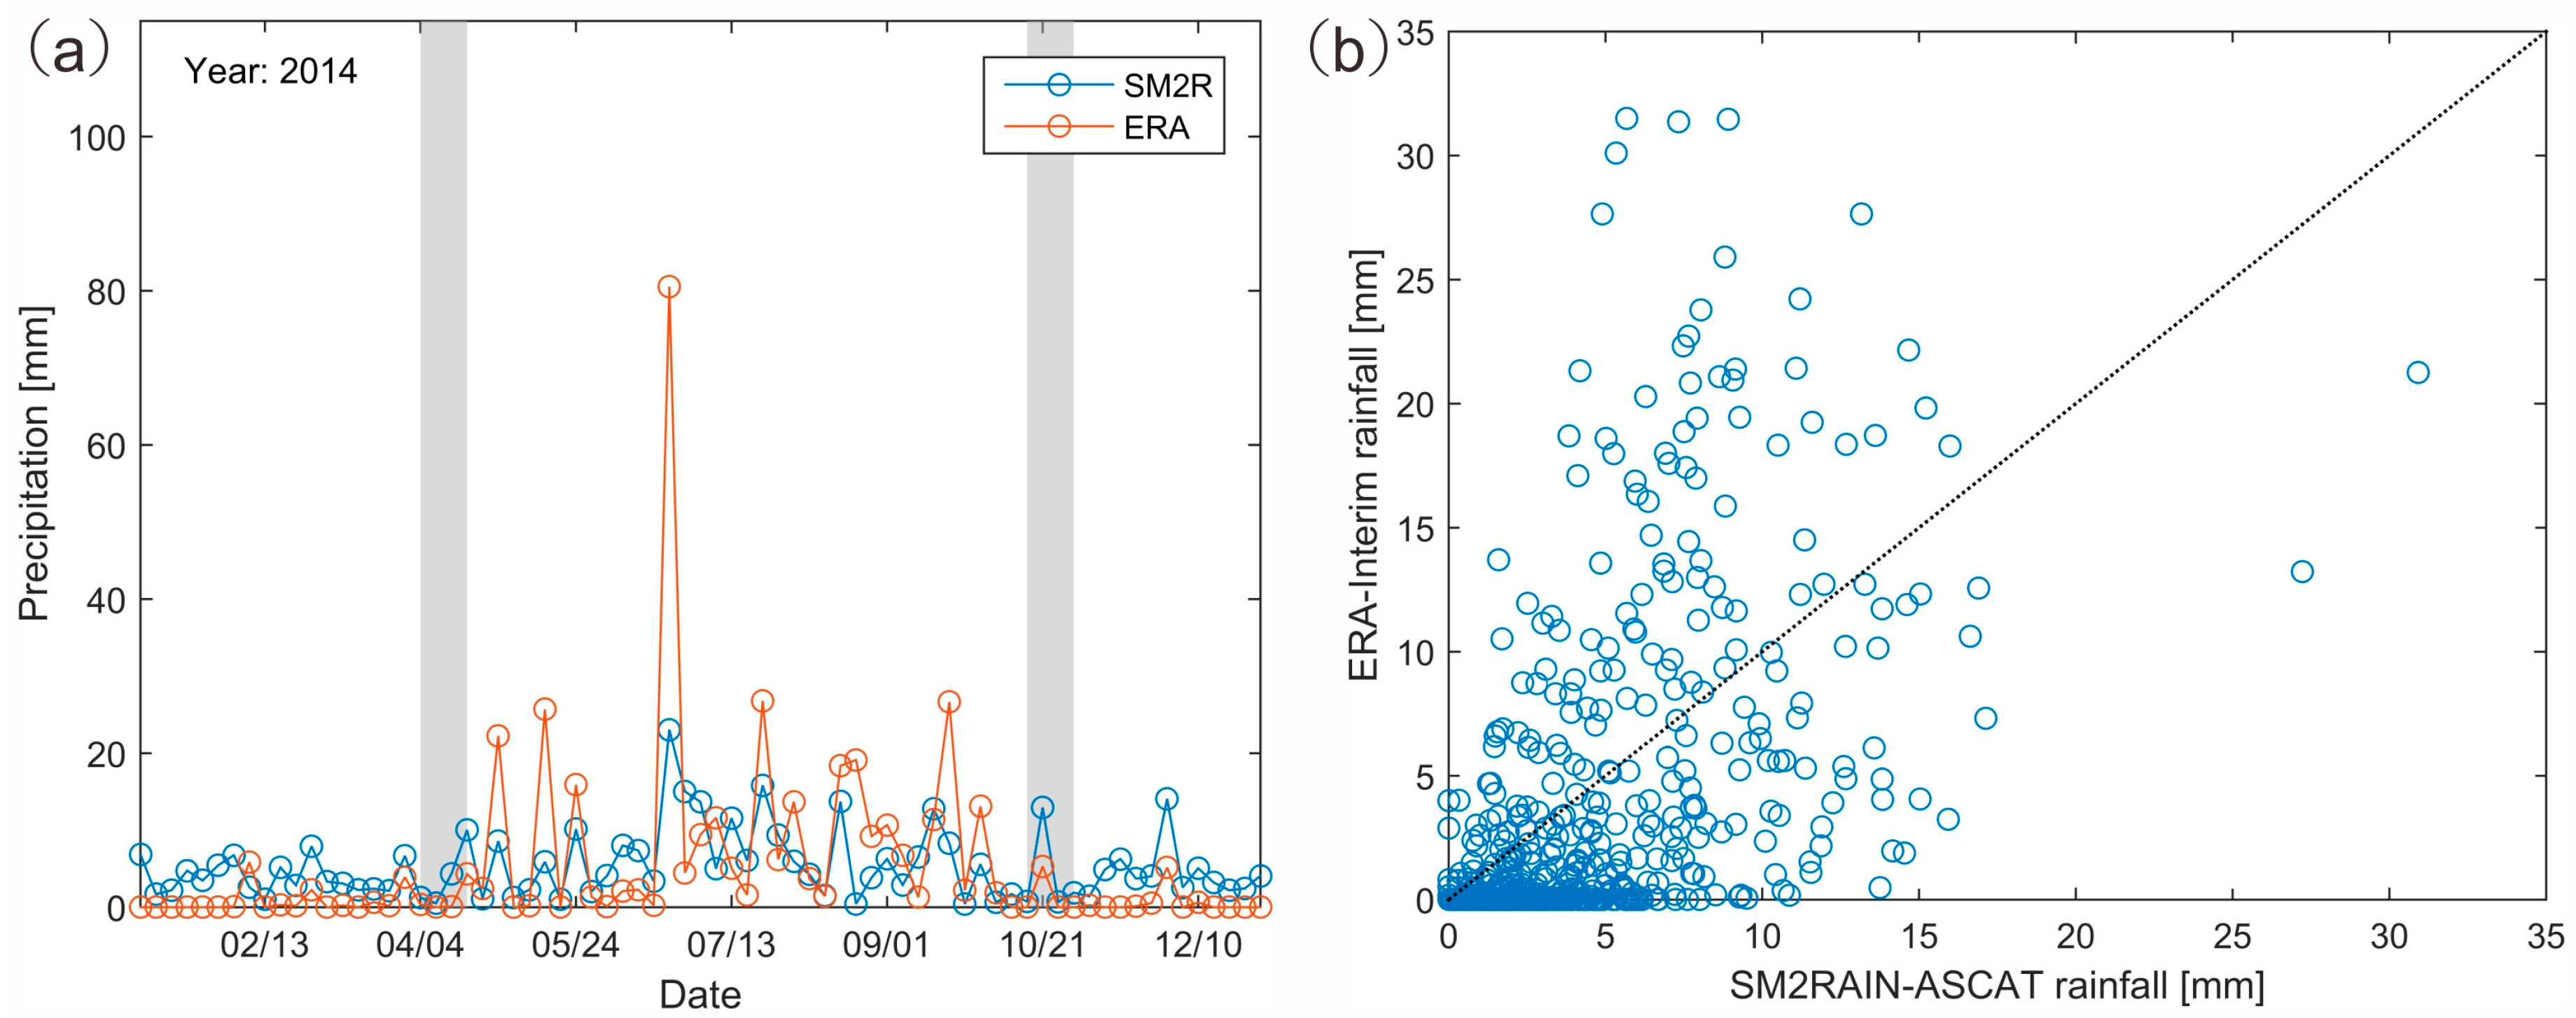
Following the analysis of spatial distribution on irrigation pattern, this sub-section focuses on identifying the temporal dynamics of the irrigation process. Firstly, we used the difference between ASCAT-based (SM2RAIN) rainfall and model-simulated rainfall (ERA-Interim, without irrigation module) to demonstrate the feasibility of using microwave soil moisture data for detecting irrigation processes. The underlying assumption in this sub-section is that rainfall estimated from microwave soil moisture has incorporated signals of both precipitation and irrigation, and thus can be used to calculate irrigation along with precipitation product. Figure 8a shows the results (use 2014 for illustration) in typical Weishan irrigation district in the center of the HHH Plain (fifth largest irrigation district in China, 115.4–116.5° E, 36.2–37.0° N, [69]). The daily values of two data sets were aggregated to 5-day accumulations, and the start and end time of possible irrigation period (April–October) in this region were shown with grey shading. It is seen from Figure 8a that there is an obvious discrepancy between the 5-day accumulation time series of two rainfall data sets, with most of the SM2RAIN rainfall higher than ERA simulation for the irrigation periods during 2007–2015 (Figure 8b). In addition, the annual irrigation amount deduced from the accumulated difference between both data sets (during irrigation periods and excluding rainy seasons of 2007–2015) was 201.9 mm, very close to the recorded irrigation amount of 196 mm in Weishan irrigation district [69] (scatter plot not shown). This indicates that the footprint and corresponding accumulative effect of unmodeled irrigation could be identified by microwave remote sensing. However, this is also affected by the complexity of crop situations and the rainfall variations, e.g., it is clear that ASCAT signal is better for detecting irrigation in October than in April (Figure 8a). During April to May, the winter wheat grows at vigorous stage (from jointing stage to heading stage), and consumes about 50 m3/hm2 water each day, while it only consumes about 10 m3/hm2 water each day during seeding stage in October [70]. Moreover, this will reduce irrigation effect during April to May. Nevertheless, the microwave remote sensing has the ability to detect or quantify the irrigation, but needs further studies.
3.3. Sensitivity to Ascending and Descending Retrievals
To date, applications of microwave-based soil moisture in detecting irrigation patterns is commonly considered to be a relatively innovative topic. As stated in the introduction section, different approaches have been employed to achieve this goal [32,33,34,35,36]. In this study, we investigate the potential utility of soil moisture retrievals in detecting irrigation intensity in China by examining the difference in probability distribution functions (detected by two-sample Kolmogorov-Smirnov test) between satellite-based soil moisture retrievals (with irrigation signals) and those from benchmarking numerical model (without irrigation signals). The rationale of this study lies in that the difference between two soil moisture information sources: time series with irrigation signals and the other without irrigation signals can be attributed to the effects of irrigation. There is a critical assumption underlying this logic, i.e., the background factors are the same except that from irrigation. However, this may not be valid given the fact that noises (i.e., factors not considered in this study) exist and could dampen the irrigation signal. Therefore, preprocessing procedures are required to maximize the irrigation signal. Specifically, we focus the analysis on cropland as soil moisture retrievals are more affected by irrigation than other localized human activities. In addition, we select the irrigation month rather than the whole year for examinations in order to maximize the irrigation signal. In the following sub-section, we will further consider the effect of the different satellite overpass time on their corresponding capabilities in irrigation detection.
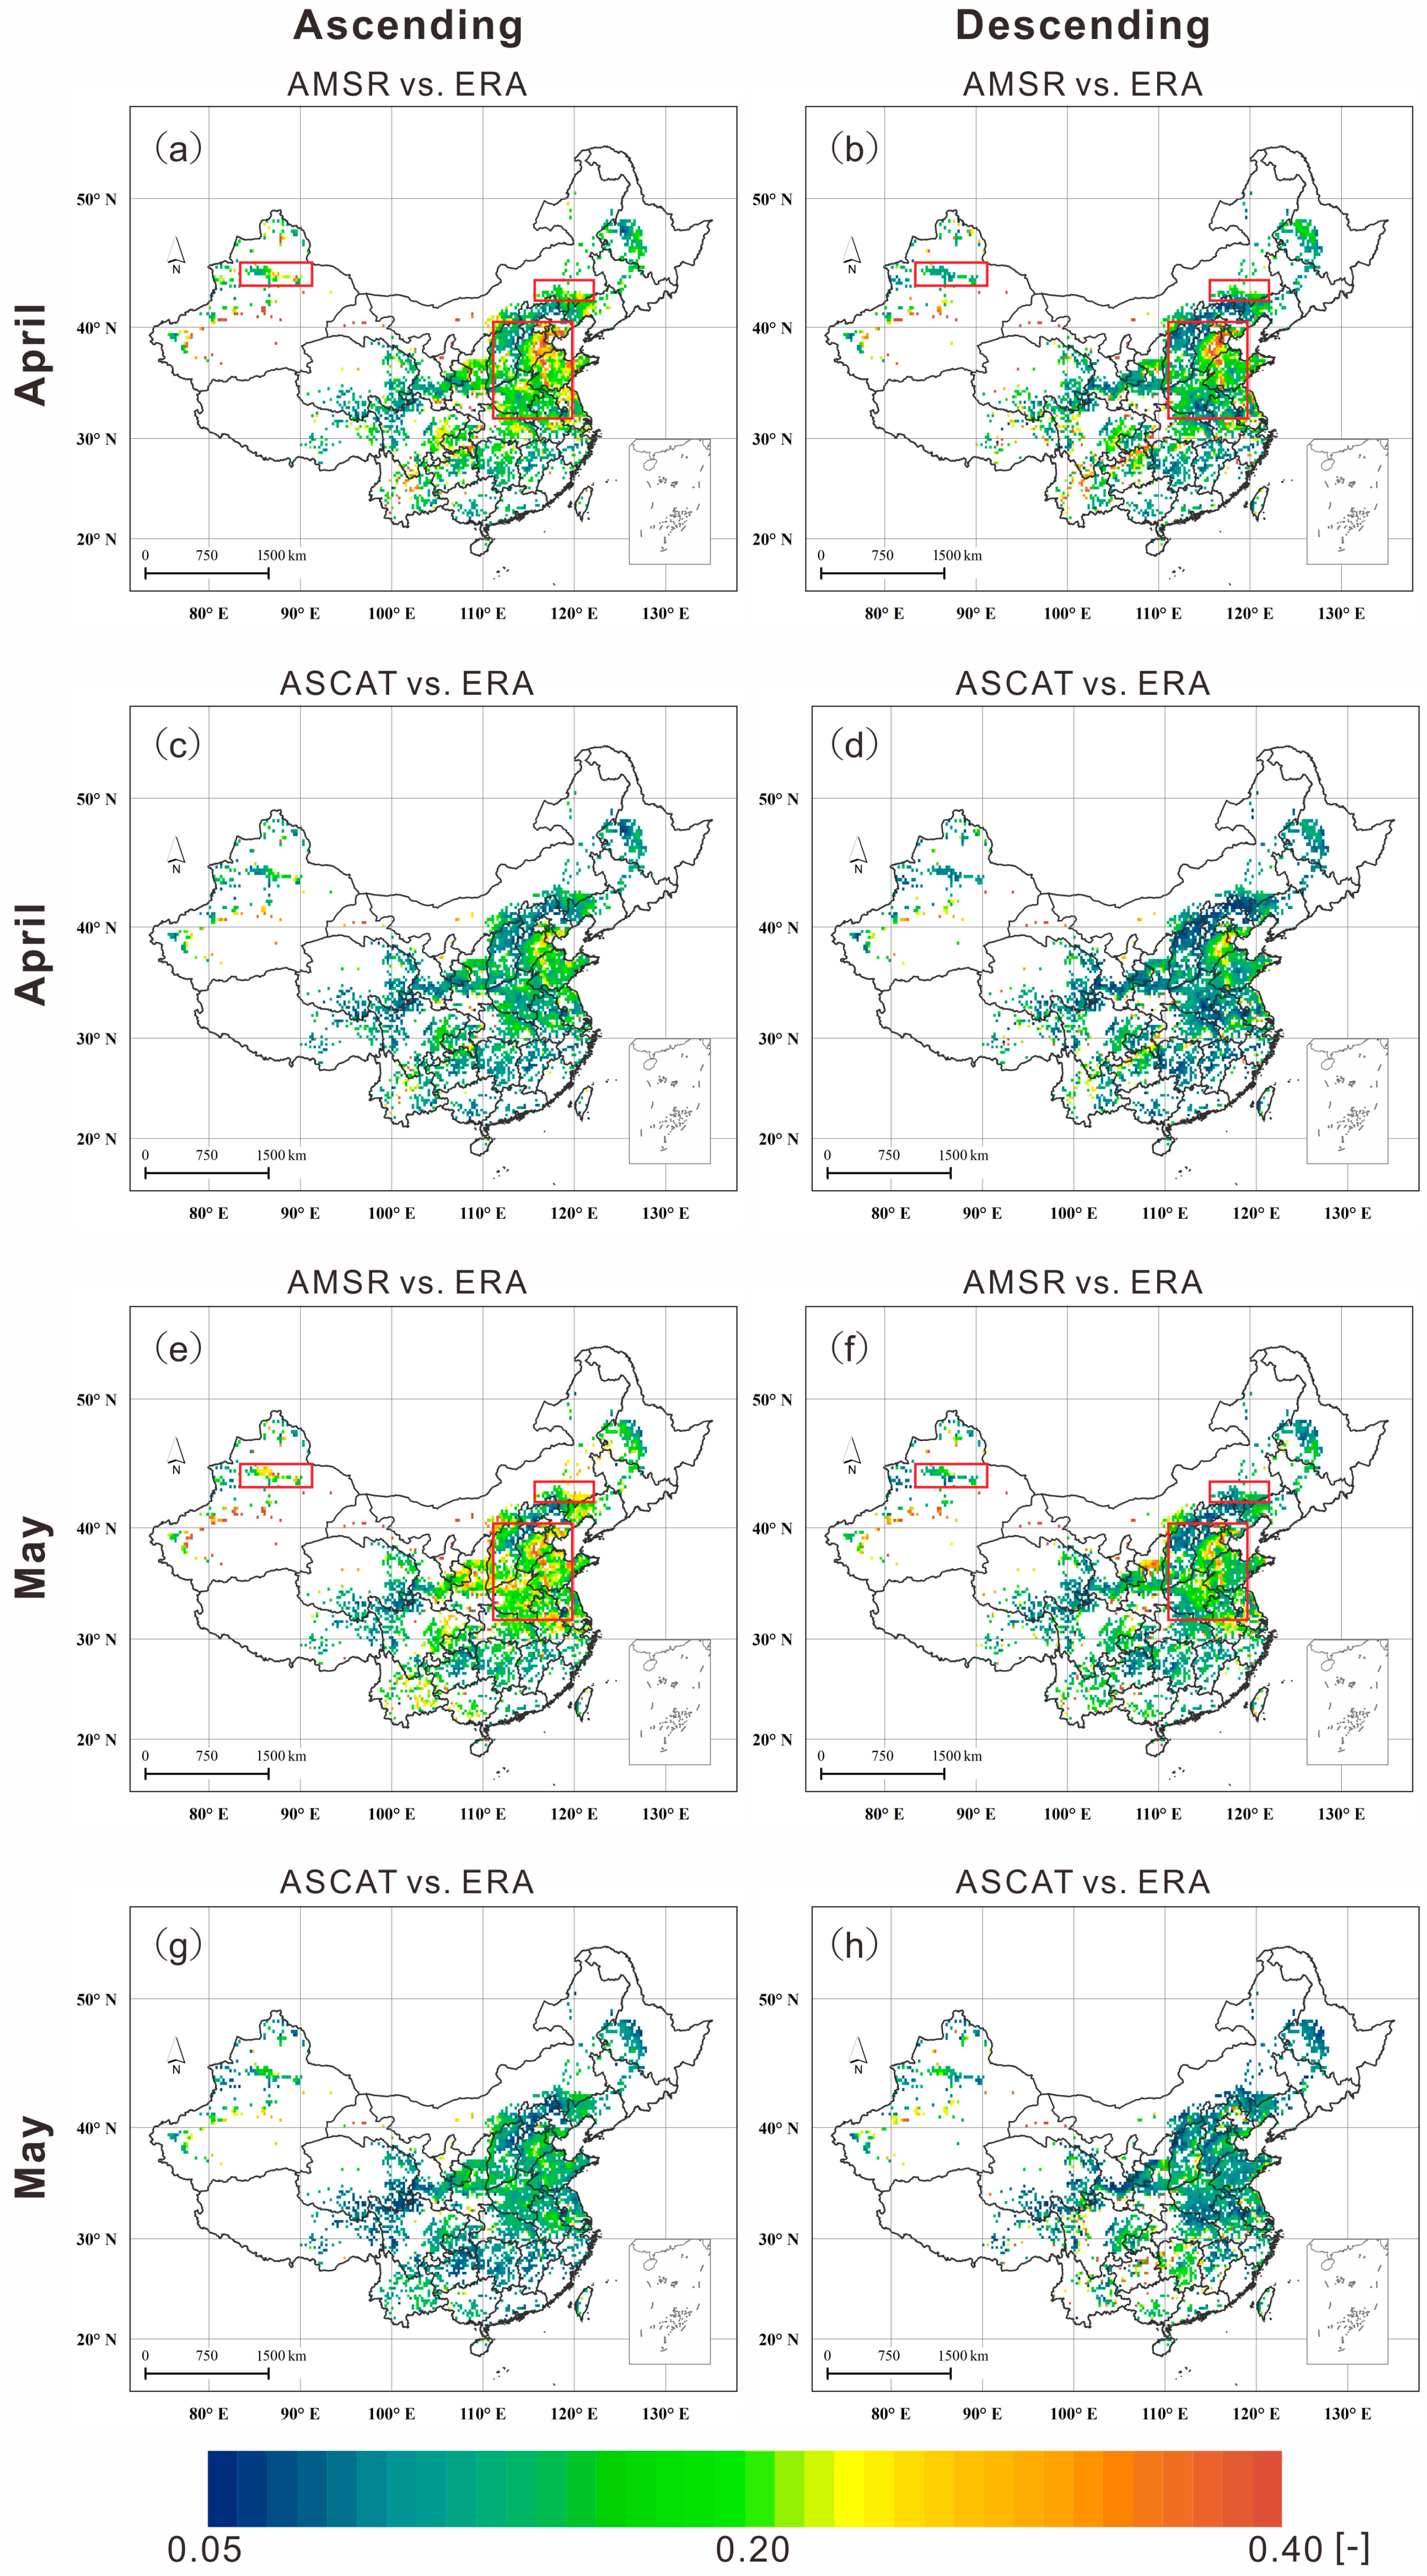
For satellites with sun-synchronous orbits, their products are typically derived separately for ascending and descending overpasses with different local acquisition times. In addition, diurnal variations in land surface conditions, and the extent to which they are accurately characterized in retrieval algorithms, may lead to distinct systematic and random error characteristics in ascending versus descending soil moisture products. Here, we apply the identical evaluation techniques (K-S metric) to quantify the sensitivity of the analysis to different local acquisition times. As the ESA CCI is a merged microwave product from both descending and ascending orbits, it is removed in this comparison. The spatial patterns of metrics derived from both orbits during April and May are shown in Figure 9.
Comparing Figure 9e and Figure 9f, a slight difference between the ascending and descending orbits of AMSR-E is found, especially in the Huang-Huai-Hai Plain, the natural oasis to the northern slope of the Tianshan Mountain in Xinjiang, and Northeast China (red rectangle in Figure 9e,f) where the diurnal range of retrieved land surface temperature is significant and the evaporation demand is relatively high during daytime. As expected, the D values estimated from AMSR-E ascending orbits (1:30 pm) is relatively higher than those from the corresponding descending orbits (1:30 am). This is associated with the different retrieval accuracies between half orbits, as reported in [40,42,44,48,71]. Specifically, during night-time, the difference between canopy temperature and surface soil temperature as well as the temperature gradient of soil profile is reduced. Irrigation during daytime also decreases the impact on the vertical soil temperature gradient. In addition, diurnal transpiration affects vegetation optical depth, which is also a factor influencing the accuracy of soil moisture retrievals at daytime versus nighttime. As for the ASCAT, there is a less noticeable discrepancy between the ascending and descending orbits, with difference mainly observed in the mid-south HHH Plain. The magnitude of the difference between the different orbits of ASCAT is relatively lower mainly because neither of the overpass times for ASCAT (9:30 pm for ascending orbits and 9:30 am for descending orbits) is close to the irrigation application time. Overall, the analysis suggests that our conclusions are robust to the ascending and descending orbits.
4. Conclusions
Anthropogenic activities, including massive groundwater-fed irrigation, could significantly alter the coupling strength between precipitation and soil moisture [18,50]. Previous studies showed that irrigation, as an additional water supply source, has the impact of reducing soil albedo, increasing soil heat capacity, increasing local soil moisture content, and affecting the water/energy budget by transforming the evapotranspiration regime from water-limited to energy-limited [26,72]. China is one of the most intensively irrigated regions in the world [54,55], and yet this human-induced modification to regional hydrological cycle is largely under-represented in most land surface models. Thus, mapping irrigation patterns across China based on satellite retrievals has substantial implications for agricultural management. In this study, we intended to evaluate the potential utility of microwave-based soil moisture in capturing the unmodeled irrigation practice. The soil moisture products used in this study are AMSR-E (passive microwave), ASCAT (active microwave), and ESA CCI (combined data set from both passive and active microwave).
The microwave-based soil moisture product and land surface models (ERA-Interim/Land reanalysis) are first validated against in-situ measurements in irrigated areas across China, using the entropy-based normalized mutual information (NMI), and conventional correlation coefficients, i.e., Spearman’s rank correlation and Pearson’s correlation. The NMI metrics suggested that approximately 60% of uncertainties in the anomaly of “ground truth” time series can be resolved by the satellite-based soil moisture retrievals, while the fraction of uncertainties resolved by ERA are relatively lower. However, such features cannot be measured by the conventional correlation coefficients, i.e., Spearman’s rank and Pearson’s correlation. Therefore, metrics based on mutual information should be employed under anomalous wet soil conditions.
Using ERA-Interim reanalysis which does not account for irrigation practice as the benchmark, we analyzed the difference in probability distributions of ERA-Interim and each microwave product based on two-sample Kolmogorov-Smirnov (K-S) test. The difference during irrigation months of April and May are examined to investigate the potential utility of satellite-based soil moisture products to map irrigation patterns. Results showed that all three satellite-based soil moisture products have the potential to detect the intensity of the major irrigation areas in semi-arid to arid regions of north China, including the major Yellow River irrigation district in Ningxia Province, Hetao irrigation district in Inner Mongolia, and the oasis in the west and north rim of Tarim Basin in Xinjiang. However, discrepancies exist in the spatial distribution of the detected irrigation hotspots by the three products. For example, the AMSR-E detected the north HHH Plain as an intensive irrigation area, while the ASCAT identified the mid-south HHH Plain as the irrigation hotspot based on the K-S D values. Compared to other two products, the ESA CCI product was less sensitive in detecting irrigation hotspots, while ASCAT better captured the heavy irrigation features. In addition to the spatial pattern, AMSR-E and ASCAT showed disagreement in the irrigation timing over areas such as Hetao irrigation district. light differences in K-S D values were also found when using different ascending or descending orbit retrievals.
As previously discussed, agricultural irrigation is one of the possible contributing factors for the observed differences in K-S metrics. Constraining analysis over major irrigated areas during the irrigation period can largely remove other background factors and thus amplify the irrigation signal. The fact that the irrigation hotspots identified by both AMSR-E and ASCAT are only obvious during irrigation months rather than the rest of year does indicate that irrigation practice is the most likely reason underlying the observed differences. Results indicate that for regions with significant human interference, it is crucial to parameterize irrigation in numerical models or assimilate satellite retrievals that capture such unmodeled process. Furthermore, this study highlights that microwave soil moisture products have the potential for detecting irrigation patterns throughout China, although more efforts are required towards reducing the involved uncertainties and developing algorithms for quantifying the amount of water used for irrigation. Nevertheless, it is important to bear in mind the uncertainty and limitation, which help better understand the implication of these results.
Author Contributions
Conceptualization, X.Z. and J.Q.; Methodology, J.Q.; Software, X.Z.; Formal Analysis, X.Z. and J.Q.; Data Curation, Y.F. and J.L.; Writing—Original Draft Preparation, X.Z. and, J.Q.; Writing—Review & Editing, J.Q. and G.L.; Visualization, X.Z. and Q.G.; Funding Acquisition, X.Z., J.Q. and Y.Y.
Funding
This work was supported by the National Natural Science Foundation of China under Grant No. 41501450, 31401292, 41501415, 41371410; the Natural Science Foundation of Guangdong Province, China under Grant No. 2016A030310154; the Fundamental Research Funds for the Central Universities under Grant No. 16lgpy06, KJQN201503, KYZ201810; Key Laboratory of Water Cycle and Related Land Surface Processes, Institute of Geographic Sciences and Natural Resources Research, Chinese Academy of Sciences (No. 2015A006); Project for Team of Innovators around the Modern Agriculture Industrial Technology Development (Rice & Wheat) in Jiangsu (No. JATS[2018]290); and the Open-end Fund of Jiangsu Key Laboratory of Information Agriculture (No. KLIAKF201703).
Conflicts of Interest
The authors declare no conflict of interest.
References
- Mason, P.J.; Zillman, J.W.; Simmons, A.; Lindstrom, E.J.; Harrison, D.E.; Dolman, H.; Bojinski, S.; Fischer, A.; Latham, J.; Rasmussen, J. Implementation plan for the global observing system for climate in support of the UNFCCC (2010 Update). Lect. Notes Phys. 2010, 275, 287–306. [Google Scholar]
- Ahmad, S.; Kalra, A.; Stephen, H. Estimating soil moisture using remote sensing data: A machine learning approach. Adv. Water Res. 2010, 33, 69–80. [Google Scholar] [CrossRef]
- Green, T.R.; Erskine, R.H. Measurement, scaling, and topographic analyses of spatial crop yield and soil water content. Hydrol. Process. 2004, 18, 1447–1465. [Google Scholar] [CrossRef]
- Jaynes, D.; Kaspar, T.; Colvin, T.; James, D. Cluster analysis of spatiotemporal corn yield patterns in an Iowa field. Agron. J. 2003, 95, 574–586. [Google Scholar] [CrossRef]
- Wei, L.; Zhang, B.; Wang, M. Effects of antecedent soil moisture on runoff and soil erosion in alley cropping systems. Agric. Water Manag. 2007, 94, 54–62. [Google Scholar] [CrossRef]
- Ma, Z.; Fu, C. Some evidence of drying trend over northern China from 1951 to 2004. Chin. Sci. Bull. 2006, 51, 2913–2925. [Google Scholar] [CrossRef]
- Wang, A.; Lettenmaier, D.P.; Sheffield, J. Soil moisture drought in China, 1950–2006. J. Clim. 2011, 24, 3257–3271. [Google Scholar] [CrossRef]
- Zou, X.; Zhai, P.; Zhang, Q. Variations in droughts over China: 1951–2003. Geophys. Res. Lett. 2005, 32, 353–368. [Google Scholar] [CrossRef]
- Zuo, Z.; Zhang, R. The spring soil moisture and the summer rainfall in eastern China. Chin. Sci. Bull. 2007, 52, 3310–3312. [Google Scholar] [CrossRef]
- Crow, W.T.; Miralles, D.G.; Cosh, M.H. A quasi-global evaluation system for satellite-based surface soil moisture retrievals. IEEE Trans. Geosci. Remote Sens. 2010, 48, 2516–2527. [Google Scholar] [CrossRef]
- Nearing, G.S.; Mocko, D.M.; Peters-Lidard, C.D.; Kumar, S.V.; Xia, Y. Benchmarking NLDAS-2 soil moisture and evapotranspiration to separate uncertainty contributions. J. Hydrometeorol. 2016, 17, 745–759. [Google Scholar] [CrossRef] [PubMed]
- Wu, Q.; Liu, H.; Wang, L.; Deng, C. Evaluation of AMSR2 soil moisture products over the contiguous United States using in situ data from the International Soil Moisture Network. Int. J. Appl. Earth Obs. Geoinf. 2016, 45, 187–199. [Google Scholar] [CrossRef]
- Tian, Y.; Nearing, G.S.; Peters-Lidard, C.D.; Harrison, K.W.; Tang, L. Performance metrics, error modeling, and uncertainty quantification. Mon. Weather Rev. 2016, 144, 607–613. [Google Scholar] [CrossRef]
- Nearing, G.S.; Gupta, H.V. The quantity and quality of information in hydrologic models. Water Resour. Res. 2015, 51, 524–538. [Google Scholar] [CrossRef]
- Weijs, S.; Schoups, G.; Giesen, N. Why hydrological predictions should be evaluated using information theory. Hydrol. Earth Syst. Sci. 2010, 14, 2545–2558. [Google Scholar] [CrossRef] [Green Version]
- Hain, C.R.; Crow, W.T.; Mecikalski, J.R.; Anderson, M.C.; Holmes, T. An intercomparison of available soil moisture estimates from thermal infrared and passive microwave remote sensing and land surface modeling. J. Geophys. Res. Atmos. 2011, 116, D15107. [Google Scholar] [CrossRef]
- Chen, C.; Wang, E.; Yu, Q.; Zhang, Y. Quantifying the effects of climate trends in the past 43 years (1961–2003) on crop growth and water demand in the North China Plain. Clim. Chang. 2010, 100, 559–578. [Google Scholar] [CrossRef]
- Leng, G.; Huang, M.; Tang, Q.; Gao, H.; Leung, L.R. Modeling the effects of groundwater-fed irrigation on terrestrial hydrology over the conterminous United States. J. Hydrometeorol. 2014, 15, 957–972. [Google Scholar] [CrossRef]
- Zou, J.; Xie, Z.; Yu, Y.; Zhan, C.; Sun, Q. Climatic responses to anthropogenic groundwater exploitation: A case study of the Haihe River Basin, Northern China. Clim. Dyn. 2014, 42, 2125–2145. [Google Scholar] [CrossRef]
- Leng, G.; Huang, M.; Tang, Q.; Leung, L.R. A modeling study of irrigation effects on global surface water and groundwater resources under a changing climate. J. Adv. Model. Earth Syst. 2015, 7, 1285–1304. [Google Scholar] [CrossRef] [Green Version]
- Cook, B.I.; Puma, M.J.; Krakauer, N.Y. Irrigation induced surface cooling in the context of modern and increased greenhouse gas forcing. Clim. Dyn. 2011, 37, 1587–1600. [Google Scholar] [CrossRef]
- Ozdogan, M.; Rodell, M.; Beaudoing, H.K.; Toll, D.L. Simulating the effects of irrigation over the United States in a land surface model based on satellite-derived agricultural data. J. Hydrometeorol. 2010, 11, 171–184. [Google Scholar] [CrossRef]
- Adegoke, J.O.; Pielke, R., Sr.; Carleton, A.M. Observational and modeling studies of the impacts of agriculture-related land use change on planetary boundary layer processes in the central US. Agric. For. Meteorol. 2007, 142, 203–215. [Google Scholar] [CrossRef]
- Bonfils, C.; Lobell, D. Empirical evidence for a recent slowdown in irrigation-induced cooling. Proc. Natl. Acad. Sci. USA 2007, 104, 13582–13587. [Google Scholar] [CrossRef] [PubMed] [Green Version]
- Lawston, P.M.; Santanello, J.A., Jr.; Zaitchik, B.F.; Rodell, M. Impact of irrigation methods on land surface model spinup and initialization of WRF forecasts. J. Hydrometeorol. 2015, 16, 1135–1154. [Google Scholar] [CrossRef]
- Leng, G.; Huang, M.; Tang, Q.; Sacks, W.J.; Lei, H.; Leung, L.R. Modeling the effects of irrigation on land surface fluxes and states over the conterminous United States: Sensitivity to input data and model parameters. J. Geophys. Res. Atmos. 2013, 118, 9789–9803. [Google Scholar] [CrossRef] [Green Version]
- Drewniak, B.; Song, J.; Prell, J.; Kotamarthi, V.; Jacob, R. Modeling agriculture in the community land model. Geosci. Model Dev. 2013, 6, 495–515. [Google Scholar] [CrossRef]
- Albergel, C.; Dorigo, W.; Balsamo, G.; Muñoz-Sabater, J.; de Rosnay, P.; Isaksen, L.; Brocca, L.; de Jeu, R.; Wagner, W. Monitoring multi-decadal satellite earth observation of soil moisture products through land surface reanalyses. Remote Sens. Environ. 2013, 138, 77–89. [Google Scholar] [CrossRef]
- Dorigo, W.; de Jeu, R.; Chung, D.; Parinussa, R.; Liu, Y.; Wagner, W.; Fernández-Prieto, D. Evaluating global trends (1988–2010) in harmonized multi-satellite surface soil moisture. Geophys. Res. Lett. 2012, 39, L18405. [Google Scholar] [CrossRef]
- Dorigo, W.; Gruber, A.; De Jeu, R.; Wagner, W.; Stacke, T.; Loew, A.; Albergel, C.; Brocca, L.; Chung, D.; Parinussa, R. Evaluation of the ESA CCI soil moisture product using ground-based observations. Remote Sens. Environ. 2015, 162, 380–395. [Google Scholar] [CrossRef]
- Liu, Y.Y.; Dorigo, W.A.; Parinussa, R.; de Jeu, R.A.; Wagner, W.; McCabe, M.F.; Evans, J.; Van Dijk, A. Trend-preserving blending of passive and active microwave soil moisture retrievals. Remote Sens. Environ. 2012, 123, 280–297. [Google Scholar] [CrossRef]
- Kumar, S.V.; Peterslidard, C.D.; Santanello, J.A.; Reichle, R.H.; Draper, C.S.; Koster, R.D.; Nearing, G.; Jasinski, M.F. Evaluating the utility of satellite soil moisture retrievals over irrigated areas and the ability of land data assimilation methods to correct for unmodeled processes. Hydrol. Earth Syst. Sci. 2015, 19, 4463–4478. [Google Scholar] [CrossRef] [Green Version]
- Escorihuela, M.J.; Quintana-Seguí, P. Comparison of remote sensing and simulated soil moisture datasets in Mediterranean landscapes. Remote Sens. Environ. 2016, 180, 99–114. [Google Scholar] [CrossRef]
- Lawston, P.M.; Santanello, J.A., Jr.; Kumar, S.V. Irrigation signals detected from SMAP soil moisture retrievals. Geophys. Res. Lett. 2017, 44, 11860–11867. [Google Scholar] [CrossRef]
- Brocca, L.; Tarpanelli, A.; Filippucci, P.; Dorigo, W.; Zaussinger, F.; Gruber, A.; Prieto, D.F. How much water is used for irrigation? A new approach exploiting satellite soil moisture observations. Int. J. Appl. Earth Obs. Geoinf. 2018, 73, 752–766. [Google Scholar] [CrossRef]
- Zaussinger, F.; Dorigo, W.; Gruber, A.; Tarpanelli, A.; Brocca, L. Estimating irrigation water use over the contiguous united states by combining satellite and reanalysis soil moisture data. Hydrol. Earth Syst. Sci. 2018. [Google Scholar] [CrossRef]
- Ozdogan, M.; Yang, Y.; Allez, G.; Cervantes, C. Remote sensing of irrigated agriculture: Opportunities and challenges. Remote Sens. 2010, 2, 2274–2304. [Google Scholar] [CrossRef]
- Owe, M.; de Jeu, R.; Holmes, T. Multisensor historical climatology of satellite-derived global land surface moisture. J. Geophys. Res. Earth Surf. 2008, 113, F01002. [Google Scholar] [CrossRef]
- Gruhier, C.; Rosnay, P.D.; Hasenauer, S.; Holmes, T.; Jeu, R.D.; Kerr, Y.; Mougin, E.; Njoku, E.; Timouk, F.; Wagner, W. Soil moisture active and passive microwave products: Intercomparison and evaluation over a Sahelian site. Hydrol. Earth Sys. Sci. 2010, 14, 141–156. [Google Scholar] [CrossRef] [Green Version]
- Wagner, W.; Naeimi, V.; Scipal, K.; de Jeu, R.; Martínez-Fernández, J. Soil moisture from operational meteorological satellites. Hydrogeol. J. 2007, 15, 121–131. [Google Scholar] [CrossRef]
- Zeng, J.; Li, Z.; Chen, Q.; Bi, H.; Qiu, J.; Zou, P. Evaluation of remotely sensed and reanalysis soil moisture products over the Tibetan Plateau using in-situ observations. Remote Sens. Environ. 2015, 163, 91–110. [Google Scholar] [CrossRef]
- Qiu, J.; Mo, X.; Liu, S.; Lin, Z.; Yang, L.; Song, X.; Zhang, G.; Naeimi, V.; Wagner, W. Intercomparison of microwave remote-sensing soil moisture data sets based on distributed eco-hydrological model simulation and in situ measurements over the North China Plain. Int. J. Remote Sens. 2013, 34, 6587–6610. [Google Scholar] [CrossRef]
- Qiu, J.; Crow, W.T.; Nearing, G.S.; Mo, X.; Liu, S. The impact of vertical measurement depth on the information content of soil moisture times series data. Geophys. Res. Lett. 2014, 41, 4997–5004. [Google Scholar] [CrossRef] [Green Version]
- Rüdiger, C.; Calvet, J.-C.; Gruhier, C.; Holmes, T.R.; De Jeu, R.A.; Wagner, W. An intercomparison of ERS-Scat and AMSR-E soil moisture observations with model simulations over France. J. Hydrometeorol. 2009, 10, 431–447. [Google Scholar] [CrossRef]
- Wagner, W.; Lemoine, G.; Rott, H. A method for estimating soil moisture from ERS scatterometer and soil data. Remote Sens. Environ. 1999, 70, 191–207. [Google Scholar] [CrossRef]
- Bartalis, Z.; Wagner, W.; Naeimi, V.; Hasenauer, S.; Scipal, K.; Bonekamp, H.; Figa, J.; Anderson, C. Initial soil moisture retrievals from the METOP-A Advanced Scatterometer (ASCAT). Geophys. Res. Lett. 2007, 34, L20401. [Google Scholar] [CrossRef]
- Naeimi, V.; Scipal, K.; Bartalis, Z.; Hasenauer, S.; Wagner, W. An improved soil moisture retrieval algorithm for ERS and METOP scatterometer observations. IEEE Trans. Geosci. Remote Sens. 2009, 47, 1999–2013. [Google Scholar] [CrossRef]
- Liu, Y.Y.; Parinussa, R.; Dorigo, W.A.; De Jeu, R.A.; Wagner, W.; Van Dijk, A.; McCabe, M.F.; Evans, J. Developing an improved soil moisture dataset by blending passive and active microwave satellite-based retrievals. Hydrol. Earth Syst. Sci. 2011, 15, 425–436. [Google Scholar] [CrossRef] [Green Version]
- Loew, A.; Stacke, T.; Dorigo, W.; de Jeu, R.; Hagemann, S. Potential and limitations of multidecadal satellite soil moisture observations for selected climate model evaluation studies. Hydrol. Earth Syst. Sci. 2013, 17, 3523–3542. [Google Scholar] [CrossRef] [Green Version]
- Hirsch, R.M.; Slack, J.R.; Smith, R.A. Techniques of trend analysis for monthly water quality data. Water Resour. Res. 1982, 18, 107–121. [Google Scholar] [CrossRef]
- Balsamo, G.; Albergel, C.; Beljaars, A.; Boussetta, S.; Brun, E.; Cloke, H.; Dee, D.; Dutra, E.; Muñoz-Sabater, J.; Pappenberger, F. ERA-Interim/Land: A global land surface reanalysis data set. Hydrol. Earth Syst. Sci. 2015, 19, 389–407. [Google Scholar] [CrossRef]
- Albergel, C.; Dorigo, W.; Reichle, R.; Balsamo, G.; De Rosnay, P.; Muñoz-Sabater, J.; Isaksen, L.; De Jeu, R.; Wagner, W. Skill and global trend analysis of soil moisture from reanalyses and microwave remote sensing. J. Hydrometeorol. 2013, 14, 1259–1277. [Google Scholar] [CrossRef]
- Qiu, J.; Crow, W.T.; Nearing, G.S. The impact of vertical measurement depth on the information content of soil moisture for latent heat flux estimation. J. Hydrometeorol. 2016, 17, 2419–2430. [Google Scholar] [CrossRef]
- Brocca, L.; Ciabatta, L.; Massari, C.; Moramarco, T.; Hahn, S.; Hasenauer, S.; Kidd, R.; Dorigo, W.; Wagner, W.; Levizzani, V. Soil as a natural rain gauge: Estimating global rainfall from satellite soil moisture data. J. Geophys. Res. Atmos. 2014, 119, 5128–5141. [Google Scholar] [CrossRef] [Green Version]
- Wagner, W.; Hahn, S.; Kidd, R.; Melzer, T.; Bartalis, Z.; Hasenauer, S.; Figa-Saldaña, J.; de Rosnay, P.; Jann, A.; Schneider, S. The ASCAT soil moisture product: A review of its specifications, validation results, and emerging applications. Meteorol. Z. 2013, 22, 5–33. [Google Scholar] [CrossRef]
- Siebert, S.; Henrich, V.; Frenken, K.; Burke, J. Update of the Digital Global Map of Irrigation Areas to Version 5; Rheinische Friedrich-Wilhelms-Universität: Bonn, Germany, 2013. [Google Scholar]
- Siebert, S.; Döll, P.; Hoogeveen, J.; Faures, J.-M.; Frenken, K.; Feick, S. Development and validation of the global map of irrigation areas. Hydrol. Earth Syst. Sci. Discuss. 2005, 2, 1299–1327. [Google Scholar] [CrossRef]
- Shi, W.; Tao, F.; Liu, J. Regional temperature change over the Huang-Huai-Hai Plain of China: The roles of irrigation versus urbanization. Int. J. Climatol. 2014, 34, 1181–1195. [Google Scholar] [CrossRef]
- Salmon, J.M.; Friedl, M.A.; Frolking, S.; Wisser, D.; Douglas, E.M. Global rain-fed, irrigated, and paddy croplands: A new high resolution map derived from remote sensing, crop inventories and climate data. Int. J. Appl. Earth Obs. Geoinf. 2015, 38, 321–334. [Google Scholar] [CrossRef]
- Chakravarti, I.; Laha, R.; Roy, J. Handbook of Methods of Applied Statistics; John Wiley and Sons: New York, NY, USA, 1967; Volume I. [Google Scholar]
- Jaeger, E.B.; Seneviratne, S.I. Impact of soil moisture-atmosphere coupling on European climate extremes and trends in a regional climate model. Clim. Dyn. 2011, 36, 1919–1939. [Google Scholar] [CrossRef]
- Cover, T.M.; Thomas, J.A. Elements of Information Theory; Tsinghua University Press: Beijing, China, 1991; pp. 155–183. [Google Scholar]
- Shannon, C.E. A mathematical theory of communication. Bell Labs Tech. J. 1948, 27, 379–423. [Google Scholar] [CrossRef]
- Kullback, S.; Leibler, R.A. On information and sufficiency. Ann. Math. Stat. 1951, 22, 79–86. [Google Scholar] [CrossRef]
- Qiu, J.; Mo, X.; Liu, S.; Lin, Z. Exploring spatiotemporal patterns and physical controls of soil moisture at various spatial scales. Theor. Appl. Climatol. 2014, 118, 159–171. [Google Scholar] [CrossRef]
- Albergel, C.; Rüdiger, C.; Carrer, D.; Calvet, J.-C.; Fritz, N.; Naeimi, V.; Bartalis, Z.; Hasenauer, S. An evaluation of ASCAT surface soil moisture products with in-situ observations in Southwestern France. Hydrol. Earth Syst. Sci. 2009, 13, 115–124. [Google Scholar] [CrossRef] [Green Version]
- Wang, H.; Yang, Z.; Saito, Y.; Liu, J.P.; Sun, X. Interannual and seasonal variation of the Huanghe (Yellow River) water discharge over the past 50 years: Connections to impacts from ENSO events and dams. Glob. Planet. Chang. 2006, 50, 212–225. [Google Scholar] [CrossRef]
- Ball, G.H.; Hall, D.J. ISODATA, a Novel Method of Data Analysis and Pattern Classification; Stanford Research Institute: Menlo Park, CA, USA, 1965. [Google Scholar]
- Lei, H. Ecohydrological Processes in a Large Irrigated Area of the North China Plain: Filed Observation and Modeling. Ph.D. Thesis, Tsinghua University, Beijing, China, 2011. [Google Scholar]
- Yu, Z. Crop Cultivation in Northen China; China Agriculture Press: Beijing, China, 2013; pp. 54–56. (In Chinese) [Google Scholar]
- Draper, C.S.; Walker, J.P.; Steinle, P.J.; de Jeu, R.A.M.; Holmes, T.R.H. An evaluation of AMSR-E derived soil moisture over Australia. Remote Sens. Environ. 2009, 113, 703–710. [Google Scholar] [CrossRef]
- Taylor, R.G.; Scanlon, B.; Döll, P.; Rodell, M.; Van Beek, R.; Wada, Y.; Longuevergne, L.; Leblanc, M.; Famiglietti, J.S.; Edmunds, M. Ground water and climate change. Nat. Clim. Chang. 2013, 3, 322–329. [Google Scholar] [CrossRef] [Green Version]
Figure 1.
Spatial distribution of agro-meteorological sites in China.

Figure 2.
Gridded irrigation data based on the areas equipped for irrigation from FAOSTAT circa 2005.
Figure 2.
Gridded irrigation data based on the areas equipped for irrigation from FAOSTAT circa 2005.

Figure 3.
Actual irrigation area from the Irrigated Area Map Asia and Africa by International Water Management Institute (IWMI-IAMAA) circa 2010.
Figure 3.
Actual irrigation area from the Irrigated Area Map Asia and Africa by International Water Management Institute (IWMI-IAMAA) circa 2010.

Figure 4.
Validation of the remote sensing data sets against observations from agro-meteorological sites that located in grids with four different AEI levels of 0–10%, 10–30%, 30–50% and 50–80%, using metrics of (a) normalized mutual information, (b) Pearson correlation, (c) Spearman correlation. Numbers of agro-meteorological sites used for each irrigation levels are shown in the first row.

Figure 5.
K-S metrics calculated from three remote sensing soil moisture retrievals and ERA-Interim: the first and second rows are for irrigation month of April and non-irrigation month of September, respectively, while the first to third columns show results for pairs of the Advanced Microwave Scanning Radiometer (AMSR) vs. ERA, the Advanced Scatterometer (ASCAT) vs. ERA, and ESA CCI vs. ERA respectively.

Figure 6.
The spatial patterns of discerned irrigated cropland from rain-fed areas by (a) AMSR; (b) ASCAT; (c) ESA CCI; and (d) combination of both AMSR and ASCAT.
Figure 6.
The spatial patterns of discerned irrigated cropland from rain-fed areas by (a) AMSR; (b) ASCAT; (c) ESA CCI; and (d) combination of both AMSR and ASCAT.

Figure 7.
Confusion matrices of clustering from three microwave-based soil moisture products and the simple combination of both AMSR and ASCAT.
Figure 7.
Confusion matrices of clustering from three microwave-based soil moisture products and the simple combination of both AMSR and ASCAT.

Figure 8.
The difference between SM2RAIN-ASCAT and ERA simulation in typical Weishan irrigation district in the center of the Huang-Huai-Hai (HHH) Plain. (a) the 5-day accumulation time series in 2014; (b) the scatter plot of SM2RAIN-ASCAT vs. ERA-Interim rainfall during 2007–2015.
Figure 8.
The difference between SM2RAIN-ASCAT and ERA simulation in typical Weishan irrigation district in the center of the Huang-Huai-Hai (HHH) Plain. (a) the 5-day accumulation time series in 2014; (b) the scatter plot of SM2RAIN-ASCAT vs. ERA-Interim rainfall during 2007–2015.

Figure 9.
K-S metrics comparison of the differences in soil moisture distributions from microwave soil moisture retrievals and ERA-Interim: the left column is for ascending orbits of AMSR vs. ERA pair and ASCAT vs. ERA pair; the right column is for descending orbits of the same pairs. Results from April are shown in the first two rows, while results from May are shown in the last two rows.

© 2018 by the authors. Licensee MDPI, Basel, Switzerland. This article is an open access article distributed under the terms and conditions of the Creative Commons Attribution (CC BY) license (http://creativecommons.org/licenses/by/4.0/).
Share and Cite
MDPI and ACS Style
Zhang, X.; Qiu, J.; Leng, G.; Yang, Y.; Gao, Q.; Fan, Y.; Luo, J. The Potential Utility of Satellite Soil Moisture Retrievals for Detecting Irrigation Patterns in China. Water 2018, 10, 1505. https://doi.org/10.3390/w10111505
AMA Style
Zhang X, Qiu J, Leng G, Yang Y, Gao Q, Fan Y, Luo J. The Potential Utility of Satellite Soil Moisture Retrievals for Detecting Irrigation Patterns in China. Water. 2018; 10(11):1505. https://doi.org/10.3390/w10111505
Chicago/Turabian StyleZhang, Xiaohu, Jianxiu Qiu, Guoyong Leng, Yongmin Yang, Quanzhou Gao, Yue Fan, and Jiashun Luo. 2018. "The Potential Utility of Satellite Soil Moisture Retrievals for Detecting Irrigation Patterns in China" Water 10, no. 11: 1505. https://doi.org/10.3390/w10111505
Note that from the first issue of 2016, this journal uses article numbers instead of page numbers. See further details here.