Detecting Snowfall Events over Mountainous Areas Using Optical Imagery
by
Jiangeng Wang
1,2,*, 
Yonghong Zhang
1,*,
Yinyi Cheng
3,
Xueliang Zhang
4,
Xuezhi Feng
4,
Wei Huang
1 and
Hao Zhou
2 1
Key Laboratory of Meteorological Disaster, Ministry of Education (KLME)/Joint International Research Laboratory of Climate and Environment Change (ILCEC)/Collaborative Innovation Center on Forecast and Evaluation of Meteorological Disasters(CIC-FEMD)/Key Laboratory for Aerosol-Cloud-Precipitation of China Meteorological Administration, Nanjing University of Information Science & Technology, Nanjing 210044, China
2
School of Atmospheric Physics, Nanjing University of Information Science & Technology, Nanjing 210044, China
3
Xinjiang Research Center for Mineral Resources, Xinjiang Institute of Ecology and Geography, Chinese Academy of Science, Urumqi 830011, China
4
Department of Geographic Information Science, Nanjing University, Nanjing 210023, China
*
Authors to whom correspondence should be addressed.
Water 2018, 10(11), 1514; https://doi.org/10.3390/w10111514
Submission received: 16 August 2018
/
Revised: 16 October 2018
/
Accepted: 21 October 2018
/
Published: 25 October 2018
(This article belongs to the Special Issue Applications of Remote Sensing and GIS in Hydrology)
Abstract
:Snowfall over mountainous areas not only has important implications on the water cycle and the Earth’s radiation balance, but also causes potentially hazardous weather. However, snowfall detection remains one of the most difficult problems in modern hydrometeorology. We present a method for detecting snowfall events from optical satellite data for seasonal snow in mountainous areas. The proposed methodology is based on identifying expanded snow cover or suddenly declined snow grain size using time series images, from which it is possible to detect the location and time of snowfall events. The methodology was tested with Moderate Resolution Imaging Spectroradiometer (MODIS) daily radiance data for an entire hydrologic year from July 2014 to June 2015 in the mountainous area of the Manas River Basin, Northwest China. The study evaluated the recordings of precipitation events at eighteen meteorological stations in the study area prove the effectiveness of the proposed method, showing that there was more liquid precipitation in the second and third quarter, and more solid precipitation in the first and fourth quarter.
1. Introduction
Mountainous areas provide water for drinking purposes to approximately half the world’s population. In addition, water resources originating in mountains are managed in reservoirs for hydropower production and/or irrigation purposes [1]. In many mountain watersheds, the seasonal evolution of snowpack is a key parameter for understanding stream-flow dynamics in mountains, foothills and lowlands. The two processes that control snowpack dynamics in mountains are snow accumulation and ablation. Snow accumulation and ablation contribute widely to their water budgets. The discharge of rivers is sensitive to long-term changes in both precipitation and temperature, particularly in snow-dominated regions [2,3]. During winter, a large portion of precipitation over mountain areas takes the form of snowfall, which not only has important implications for the hydrological cycle and the Earth’s radiation balance, but also causes potentially hazardous weather. Thus, obtaining precise snowfall information for mountainous areas is vitally important for understanding climate change, and for performing water circulation and water resource investigations, as well as predicting and preventing snow-related disasters [4,5,6].
The traditional routine observation of snowfall or snow accumulation have thus far mostly been restricted to in situ stations. The spatial distribution is spotty and almost nonexistent in mountainous areas. For hydrological and climate studies, satellite observations have therefore become highly desirable. However, satellite snowfall detection is still at an early developmental stage and mostly occurs using passive microwave (PMW) satellite sensors. As the snow signal below 90 GHz is quite weak, passive satellite sensors with relatively high frequency (>90 GHz) have been used to detect snowfall events [7]. In particular, there have been multiple satellites that carry high-frequency passive microwave sensors, such as Advanced Microwave Sounding Unit–B (AMSU-B), Microwave Humidity Sounder (MHS), Advanced Technology Microwave Sounder (ATMS), Special Sensor Microwave Imager Sounder (SSMIS), and the recently Global Precipitation Mission Microwave Imager (GPM) [8,9,10,11,12]. Meanwhile, the coarse spatial–temporal resolution of PMW images makes them unsuitable for studying spatial and temporal snowfall at the watershed scale [11].
Optical images are an appropriate source of data for seasonal snow mapping and snow dynamics monitoring at the watershed scale that require sufficient spatial and temporal resolutions. The Moderate Resolution Imaging Spectroradiometer (MODIS) data is one of the most widely used optical images. The MODIS sensor measures radiation in 36 spectral bands, including the visible, near-infrared and infrared parts of the electromagnetic spectrum, with spatial resolutions of 1 km, 500 m and 250 m at nadir [13,14,15]. NASA provides a hierarchy of snow products based on MODIS observations, designed to satisfy the needs of a variety of users, available since 2000. These include daily, eight-day composite and monthly snow products. Due to the nature of the interactions between snow cover and the electromagnetic radiation of different frequencies, the MODIS snow-mapping algorithm uses a normalized difference between MODIS band 4 (0.545–0.565 μm) and 6 (1.628–1.652 μm) and several additional thresholds to distinguish snow from other terrestrial surfaces [16,17,18]. The MODIS snow products provide binary values indicating either the presence or absence of snow and fractional snow cover. However, such information cannot indicate the status of the snowpack. Specially, the information of snowfall events is not provided by MODIS snow product [14,19].
From optical satellite images, we can obtain information on snow-covered area (SCA) as well as snow grain size (SGS). SGS is a key parameter for characterizing snowpack properties, especially the thermodynamic state of a snowpack [20]. Generally, field-measured SGS is classified into three types, i.e., fine, medium and coarse; the corresponding range of the grain sizes are ≤250 μm, 250–500 μm, and 500–1000 μm, respectively [21]. Once snow falls to the ground, it begins a process of metamorphism, which is thermodynamically active. Snow undergoes rapid changes in grain size under the influence of liquid water content, temperature and/or temperature gradient. According to the vapor and temperature gradients, snow is metamorphosed through three processes: equi-temperature, temperature gradient and melt–freeze metamorphism. All of these forms of metamorphism result in the increase of snow grain size [22,23]. Nowadays, space-borne sensors in the visible, near infrared, and shortwave infrared spectrums have been used to estimate SGS at large spatial scales with moderate-to-high spatial resolutions [24,25,26,27]. The change of SGS over a region may provide information on snowfall events through a sudden decrease in grain size as new snow apparently has smaller grains.
To obtain the location and time of snowfall events at the watershed scale, we present a method for the detection of snowfall events using sequential optical remote sensing images over mountainous areas. The method is based on the two facts that indicate a snowfall event, namely that a pixel with no snow on the previous day has snow the next day, and that a pixel had snow the previous day but the next day the snow grain size has suddenly decreased.
The Manas River Basin (MRB, see Section 2) is a typical inland river basin in an arid area of western China. It has rich water resources in the form of snow, which represent the majority of the water resources for the entire basin [28]. The spatial and temporal distribution of snowfall in the mountainous areas greatly affect the water and energy budget of MRB, thus triggering a chain reaction that affects the environment in the entire basin area. However, there are no in situ stations to record snowfall in the mountainous areas of MRB. Therefore, the detection of snowfall events is very urgent and important to the hydrological process of Manas River.
In this paper, we chose an entire hydrological year (July 2014 to June 2015)—covering snow accumulation, stabilization, and ablation periods—as an example to test the validity of the proposed snowfall detecting method. The rest of the paper is organized as follows. In Section 2, the study area and the used data are described. Section 3 introduces the details of methodology. The results are shown in Section 4. The discussion and conclusions are presented in Section 5 and Section 6, respectively.
2. Study Area and Data
2.1. Study Area
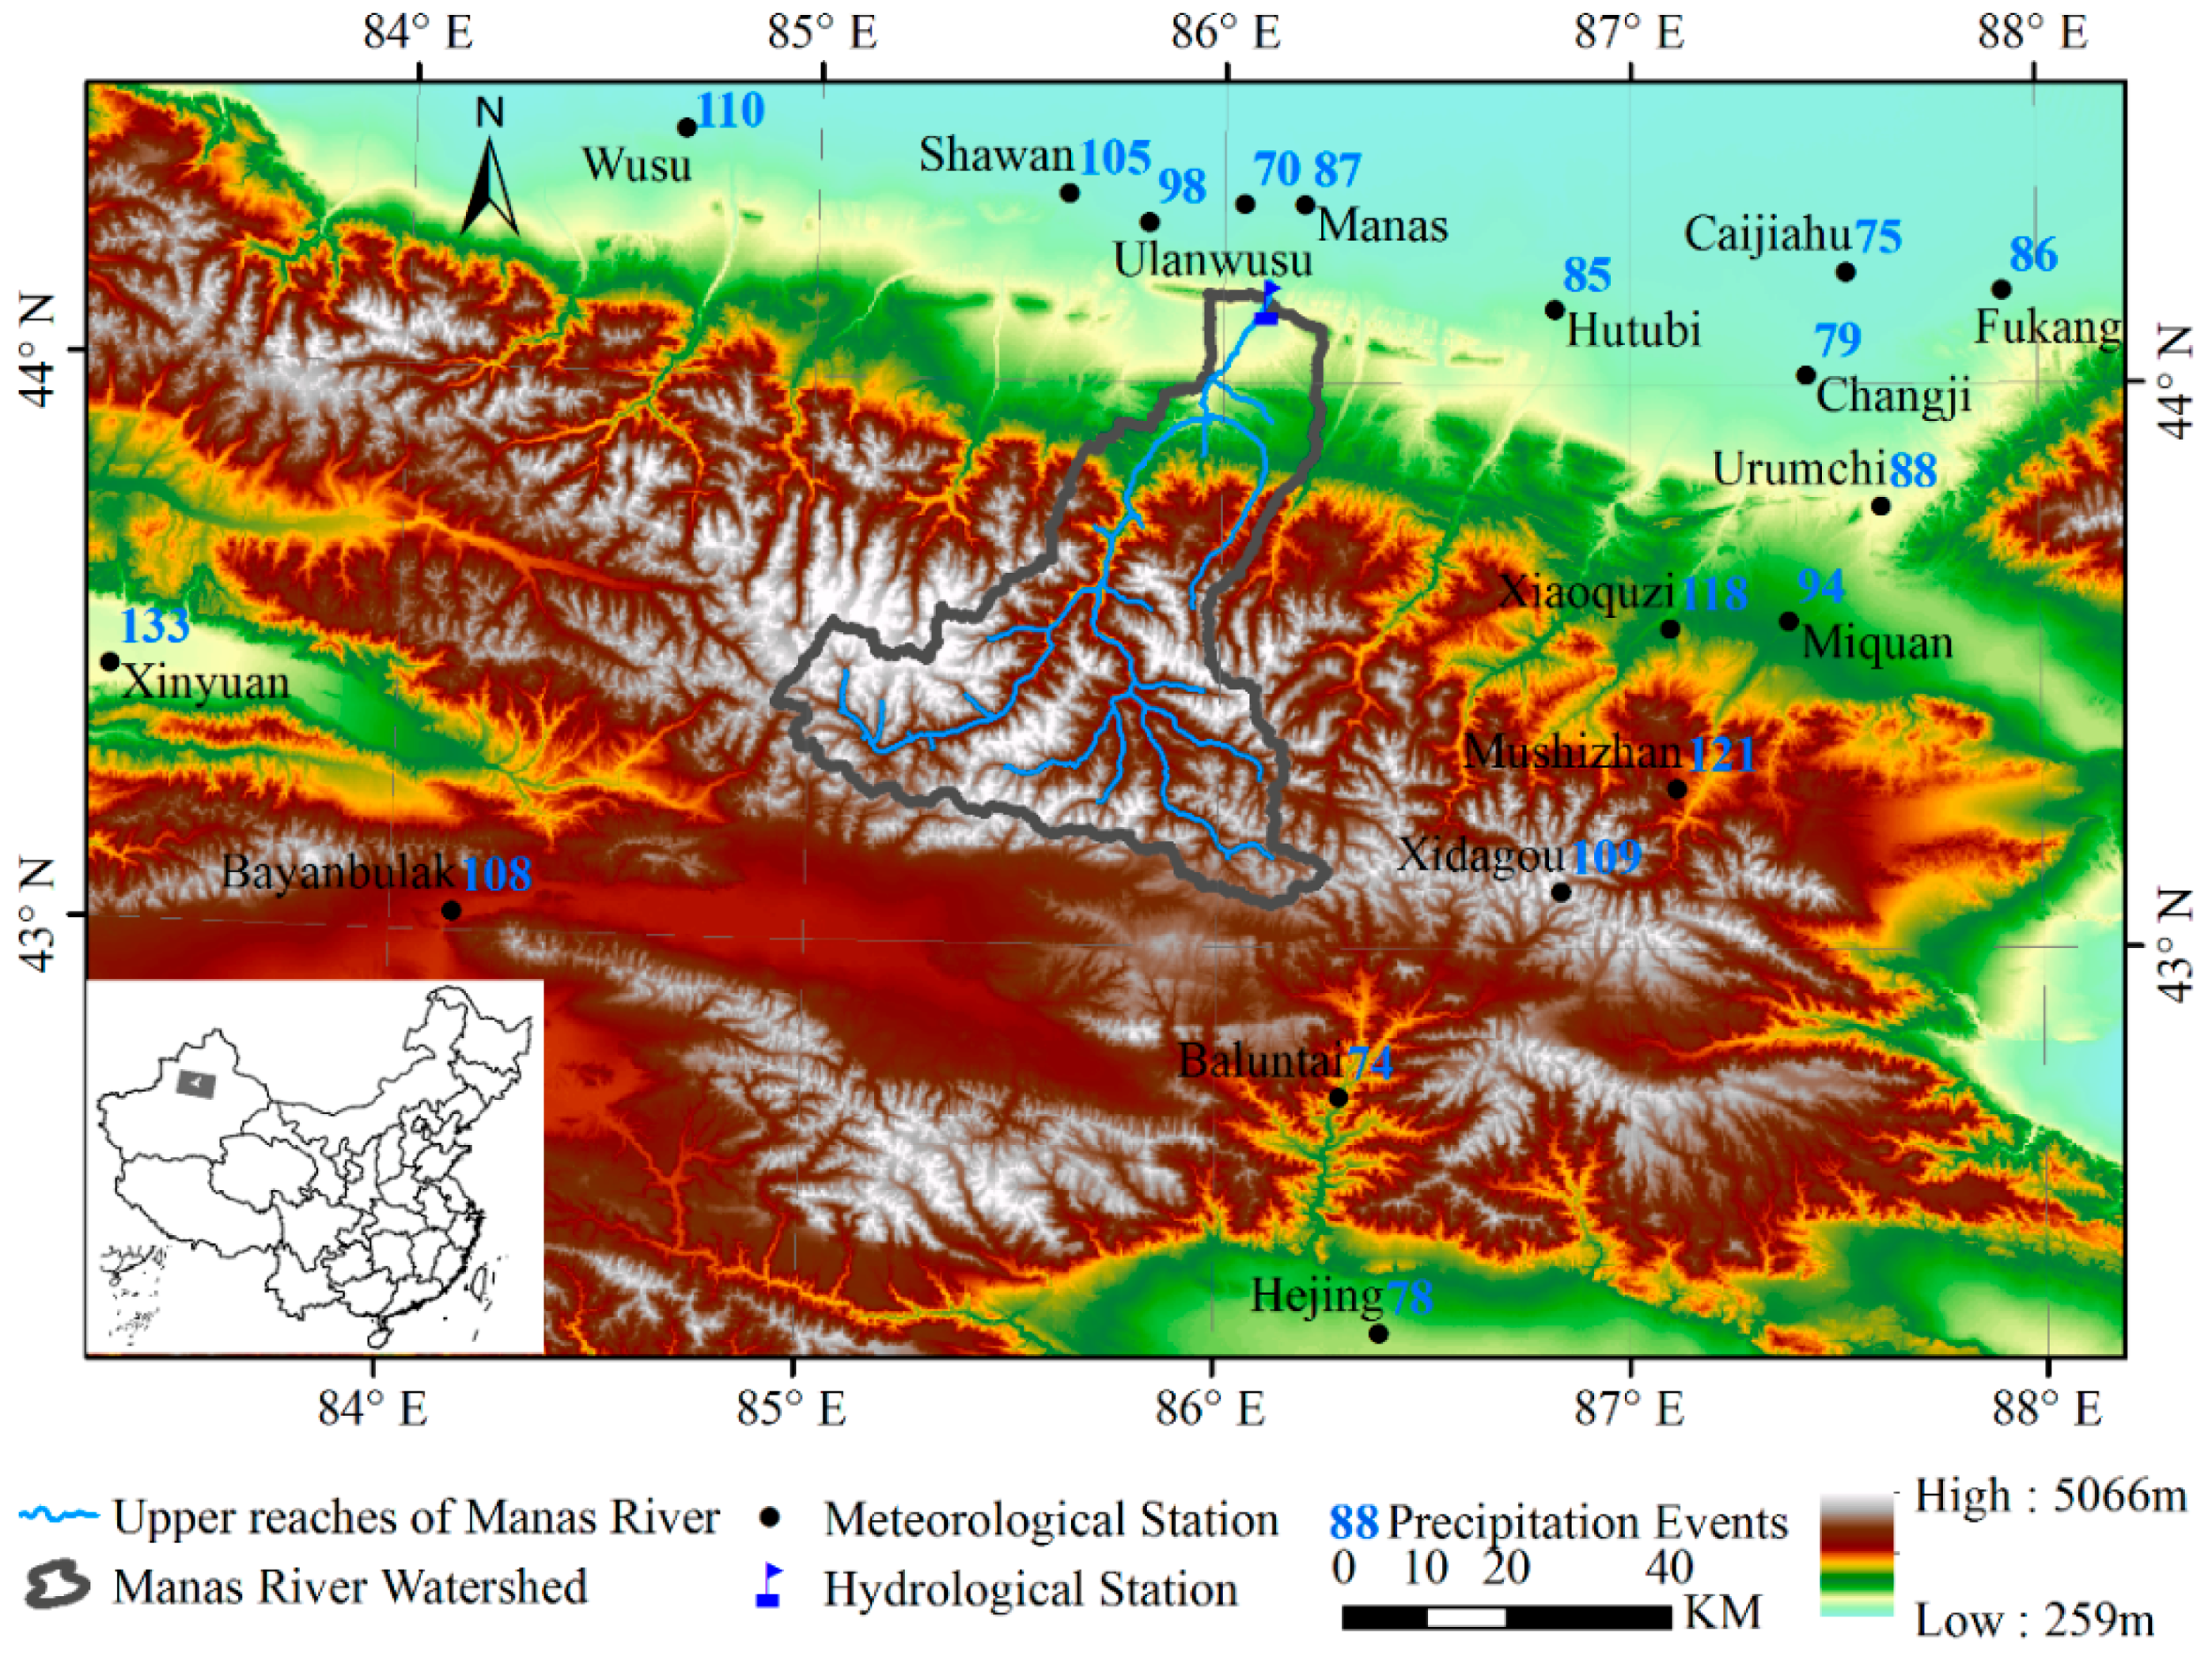
The Manas River Basin (43°5′–44°10′ N, 84°55′–86°15′ E), located on the north slope of the Tianshan Mountains in the arid and semi-arid northwestern region of China (Figure 1), covers an area of approximately 5963 km2. The elevation ranges between 649 to 5066 m above sea level (m a.s.l.), increasing from north to south. According to the vertical elevation, the study area was divided into four altitudinal zones: the foothill zone (elevation between 600 to 1500 m a.s.l.), montane zone (elevation between 1500 to 2700 m a.s.l.), alpine zone (elevation from 2700 to 3600 m a.s.l.) and snow zone (elevation greater than 3600 m a.s.l.). The mean annual temperature for each zone is 5 °C, 3 °C, 1 °C and below 0 °C and the annual precipitation is 200–300 mm, 300–400 mm, 400–500 mm and more than 500 mm, respectively [28]. Most of the spring runoff and streamflow in the Manas River is attributed to melting snow and ice. The average annual runoff volume is 1.28 × 10⁹ m3 at Hongshankou hydrometric station, of which the ice and snow runoff makes up about 34.6% [29]. The study area lies in regions of complex topography where elevation and aspect govern the snow melt processes. Typically, the snow accumulation period starts from early October. The snow in this region begins to melt in early April.
2.2. Topography
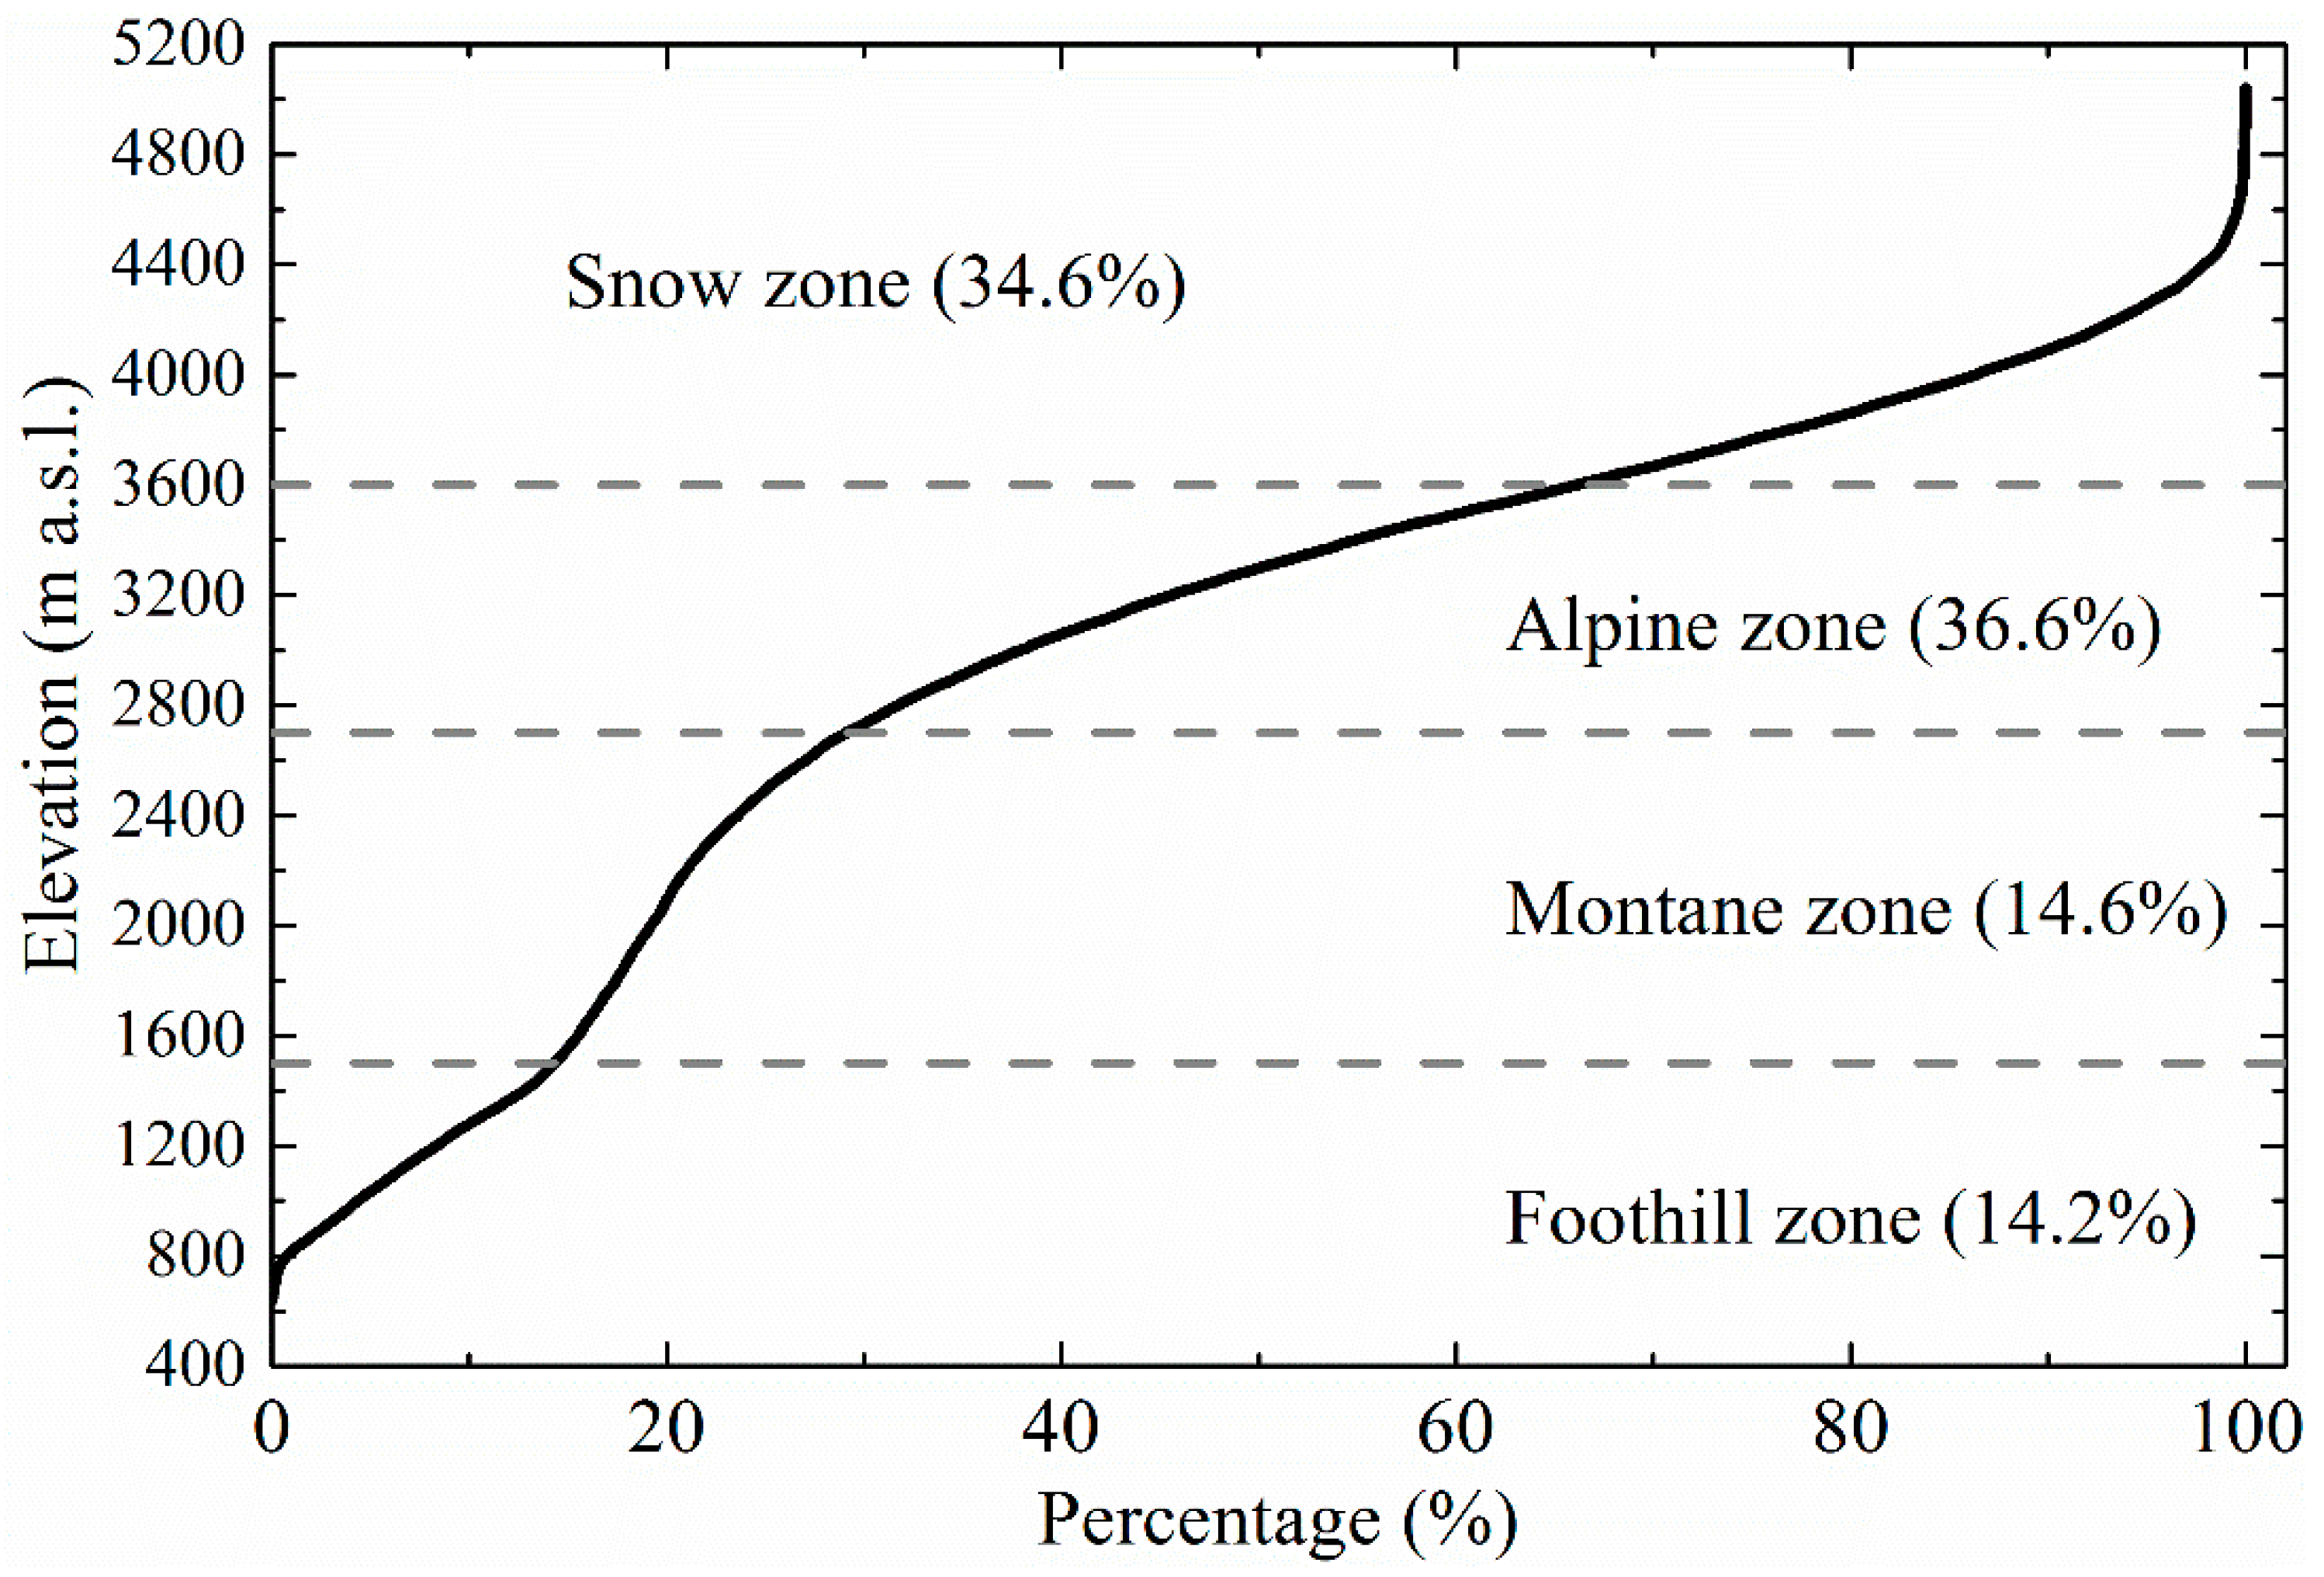
Topographic data was retrieved from the Shuttle Radar Topography Mission (SRTM) digital elevation model (DEM), version 4.1 acquired at the full 90 m spatial resolution. The data were in the Geotiff format, in decimal degrees and datum World Geodetic System 1984 (WGS84). All SRTM data are freely available from: http://srtm.csi.cgiar.org/SELECTION/inputCoord.asp [30]. The original DEM data were resampled with nearest-neighbor interpolation to a spatial resolution of 500 m. Figure 2 highlights the main topographic features of the study area. Figure 2 shows the hypsometric curve of the study area. The foothill zone, montane zone, alpine zone, and snow zone covered 14.2%, 14.6%, 36.6%, and 34.6% of the study area, respectively.
2.3. MODIS Data
As an element of the National Aeronautics and Space Administration’s Earth Observing System (NASA’s EOS), the Terra satellite (EOS AM-1 orbiting at a 10:30 a.m. local time descending node) was launched in December, 1999. The satellite carries the MODIS sensor, retrieving near daily data globally. MODIS has 36 bands with spatial resolutions varying from 250 m (2 bands), 500 m (5 bands), to 1 km (29 bands). Three MODIS V006 products were used in this study: radiometrically calibrated products (MOD02HKM), geolocation products for latitude, longitude and viewing geometry data (MOD03), and cloud mask products (MOD35). The MOD02HKM product contains top of atmosphere (TOA) radiometric information for the first seven solar reflective bands of MODIS (i.e., bands 1–7) in the visible and near-infrared portion of the electromagnetic spectrum. The spatial resolution is 500 m. MOD03 products contain geolocation coordinates, surface elevation, and solar and satellite zenith and azimuth angles with a spatial resolution of 1 km. The MOD35 cloud mask product indicates a level of confidence that the MODIS is observing clear skies with a spatial resolution of 1 km. The geolocation longitude and latitude were used as ancillary data to reproject the MOD02HKM and MOD35 products from the MODIS sinusoidal projection to the geographic projection. All the used MODIS products were downloaded from the web page of Level 1 and the Atmosphere Archive and Distribution System (https://ladsweb.modaps.eosdis.nasa.gov). In this study, the MODIS data for July 2014 to June 2015 were used to validate the proposed method.
2.4. Meteorological Data
There are 18 meteorological stations in the study area (Figure 1 and Table 1). The elevation of these stations ranges from 441 to 3544 m. The daily mean precipitation data (mm) were obtained from the China Meteorological Data Sharing Network (http://data.cma.cn/en). We used the 24-h precipitation, starting from 8 a.m. of the previous day. The meteorological data for July 2014 to June 2015 was used in this study to validate the snowfall detection results. In Table 1, it can be seen that the precipitation events (PE) had no obvious regularity from north to south or from west to east, because PE is not only affected by geographical location, but also greatly affected by terrain.
3. Methodology
3.1. Preprocessing Optical Data
All MODIS products were projected to Lambert Conformal Conical at a 500 m spatial resolution using the MODIS Conversion Toolkit (MCTK), Version 2.1.4, which is available from GitHub (https://github.com/dawhite/MCTK/releases). The exact position of individual MODIS swath images varied geographically for each image. The calibration and radiometric terrain correction were conducted with the SRTM DEM product. Due to the lack of atmospheric parameters, the second simulation of the satellite signal in the solar spectrum (6S) was used to calculate radiation parameters required for atmospheric correction [31]. Since the elevation difference was approximately 4500 m in the study area, we calculated the parameters of the radiance transfer with 300 m intervals. The MODIS calibrated, geolocated, and the atmospherically-corrected radiances were the planned input data for snow cover extraction and snow grain size retrieval.
3.2. Extracting Snow Cover
The basic idea behind using optical sensors to map snow is that snow has a distinctive spectral signature, as it reflects visible radiation more strongly than that in the middle-infrared part of the spectrum. The SNOWMAP algorithm is effective in terms of distinguishing snow from other forms of land cover. The automated MODIS snow mapping algorithm uses at-satellite reflectance in MODIS bands 4 and 6 to calculate the Normalized Difference Snow Index (NDSI) [16,17,18]. For MODIS, the SNOWMAP algorithm is defined as:
where is the reflectance of MODIS band.
3.3. Estimating Snow Grain Size
The snow grain size and pollution amount (SGSP) algorithm was adopted to estimate the snow grain size [25,26]. The SGSP algorithm uses a snow reflectance model based on an analytical asymptotic solution of the radiative transfer theory and on geometrical optics for the optical properties of snow. The basic equation of light reflected by a semi-infinite snow layer was considered a multiply scattering medium with randomly-oriented, irregularly-shaped, and closely-packed grains [32], as shown in Equation (2):
where R is snow reflectance, is the effective optical snow grain size (radius), is the solar zenith angle, is the viewing zenith angle, and is the relative azimuth angle between the incident and reflected light. is the bidirectional reflection function without absorption, which is approximated as Koch-fractal particles by:
where a = 1.247, b = 1.186, and c = 5.157. is the phase function, dependent on the scattering angle x (in degrees) and can be approximated by:
where .
is the escape function determining the angular distribution of light escaping from a semi-infinite, non-absorbing medium given by:
γ is the absorption coefficient. The absorption coefficient of pure ice is , and for a mixture of ice and soot, it is , where λ is the wavelength, is the imaginary part of the complex refractive index of ice, and is the relative volumetric soot concentration.
is the shape-dependent parameter factor. In this study, the Koch-fractal model was used with [25].
Snow has distinct characteristics in the optical (visible and near infrared) wavelength for different grain sizes. Moreover, the reflectance of MODIS Channel 5 presents a larger changing range caused by different snow grain sizes compared to that of other channels and is thus used to estimate the snow grain size in this study [27].
3.4. Detecting Snowfall Events
Since the time series information from SCA and SGS would contain signatures on the snowfall event over land, the task of our algorithm was to extract this signature at each pixel and convert it to a distribution of snowfall events. However, the cloud contamination limited the capability to monitor the SCA and SGS through optical satellite images, especially over mountainous areas. This is because the air will arise and be cooled over mountainous areas, and this cooled air is no longer able to hold all of the water vapor as warm air. The extra water vapor begins to condense out of the air parcel in the form of liquid water droplets and to form clouds. These clouds formed due to the influence of topography are known as orographic clouds [33]. Therefore, in this study, we took an approach that relates the snowfall event to sequential variation of SCA and SGS that can overcome the effect of clouds. The snowfall event detecting rules based on the SCA and SGS time series were defined as follows:
where n represents the original day with no clouds. CPC is the cloud persistence count representing the number of following consecutive days of cloud obscuration since the current view of the surface, which depends on the observations themselves and is adaptively calculated according to the MOD35 product. ThresholdSGS is the threshold of declined snow grain size for detecting snowfall event. We set ThresholdSGS as 100 μm to avoid the influence of retrieval errors, due to the root mean squared error (RMSE) of the estimated snow grain size from MODIS image being 80.42 μm [27]. If one of the rules is satisfied, it indicates that there was a snowfall event at the pixel between day n and day n + CPC + 1. For example, CPC = 0 means that the pixel of surface was observed on the adjacent two days. In this case, if one of the rules is satisfied, a snowfall event happened between day n and n + 1, such as 1 and 2 January 2015. Similarly, CPC = 7 means that a view of that surface pixel was not possible to observe on the adjacent seven days because of cloud contamination, but was obtained on day n + 7 + 1. In this case, if one of the rules was satisfied, a snowfall event happened between day n and n + 7 + 1, such as 1 and 9 January 2015.
4. Results
4.1. Single Snowfall Detection Results
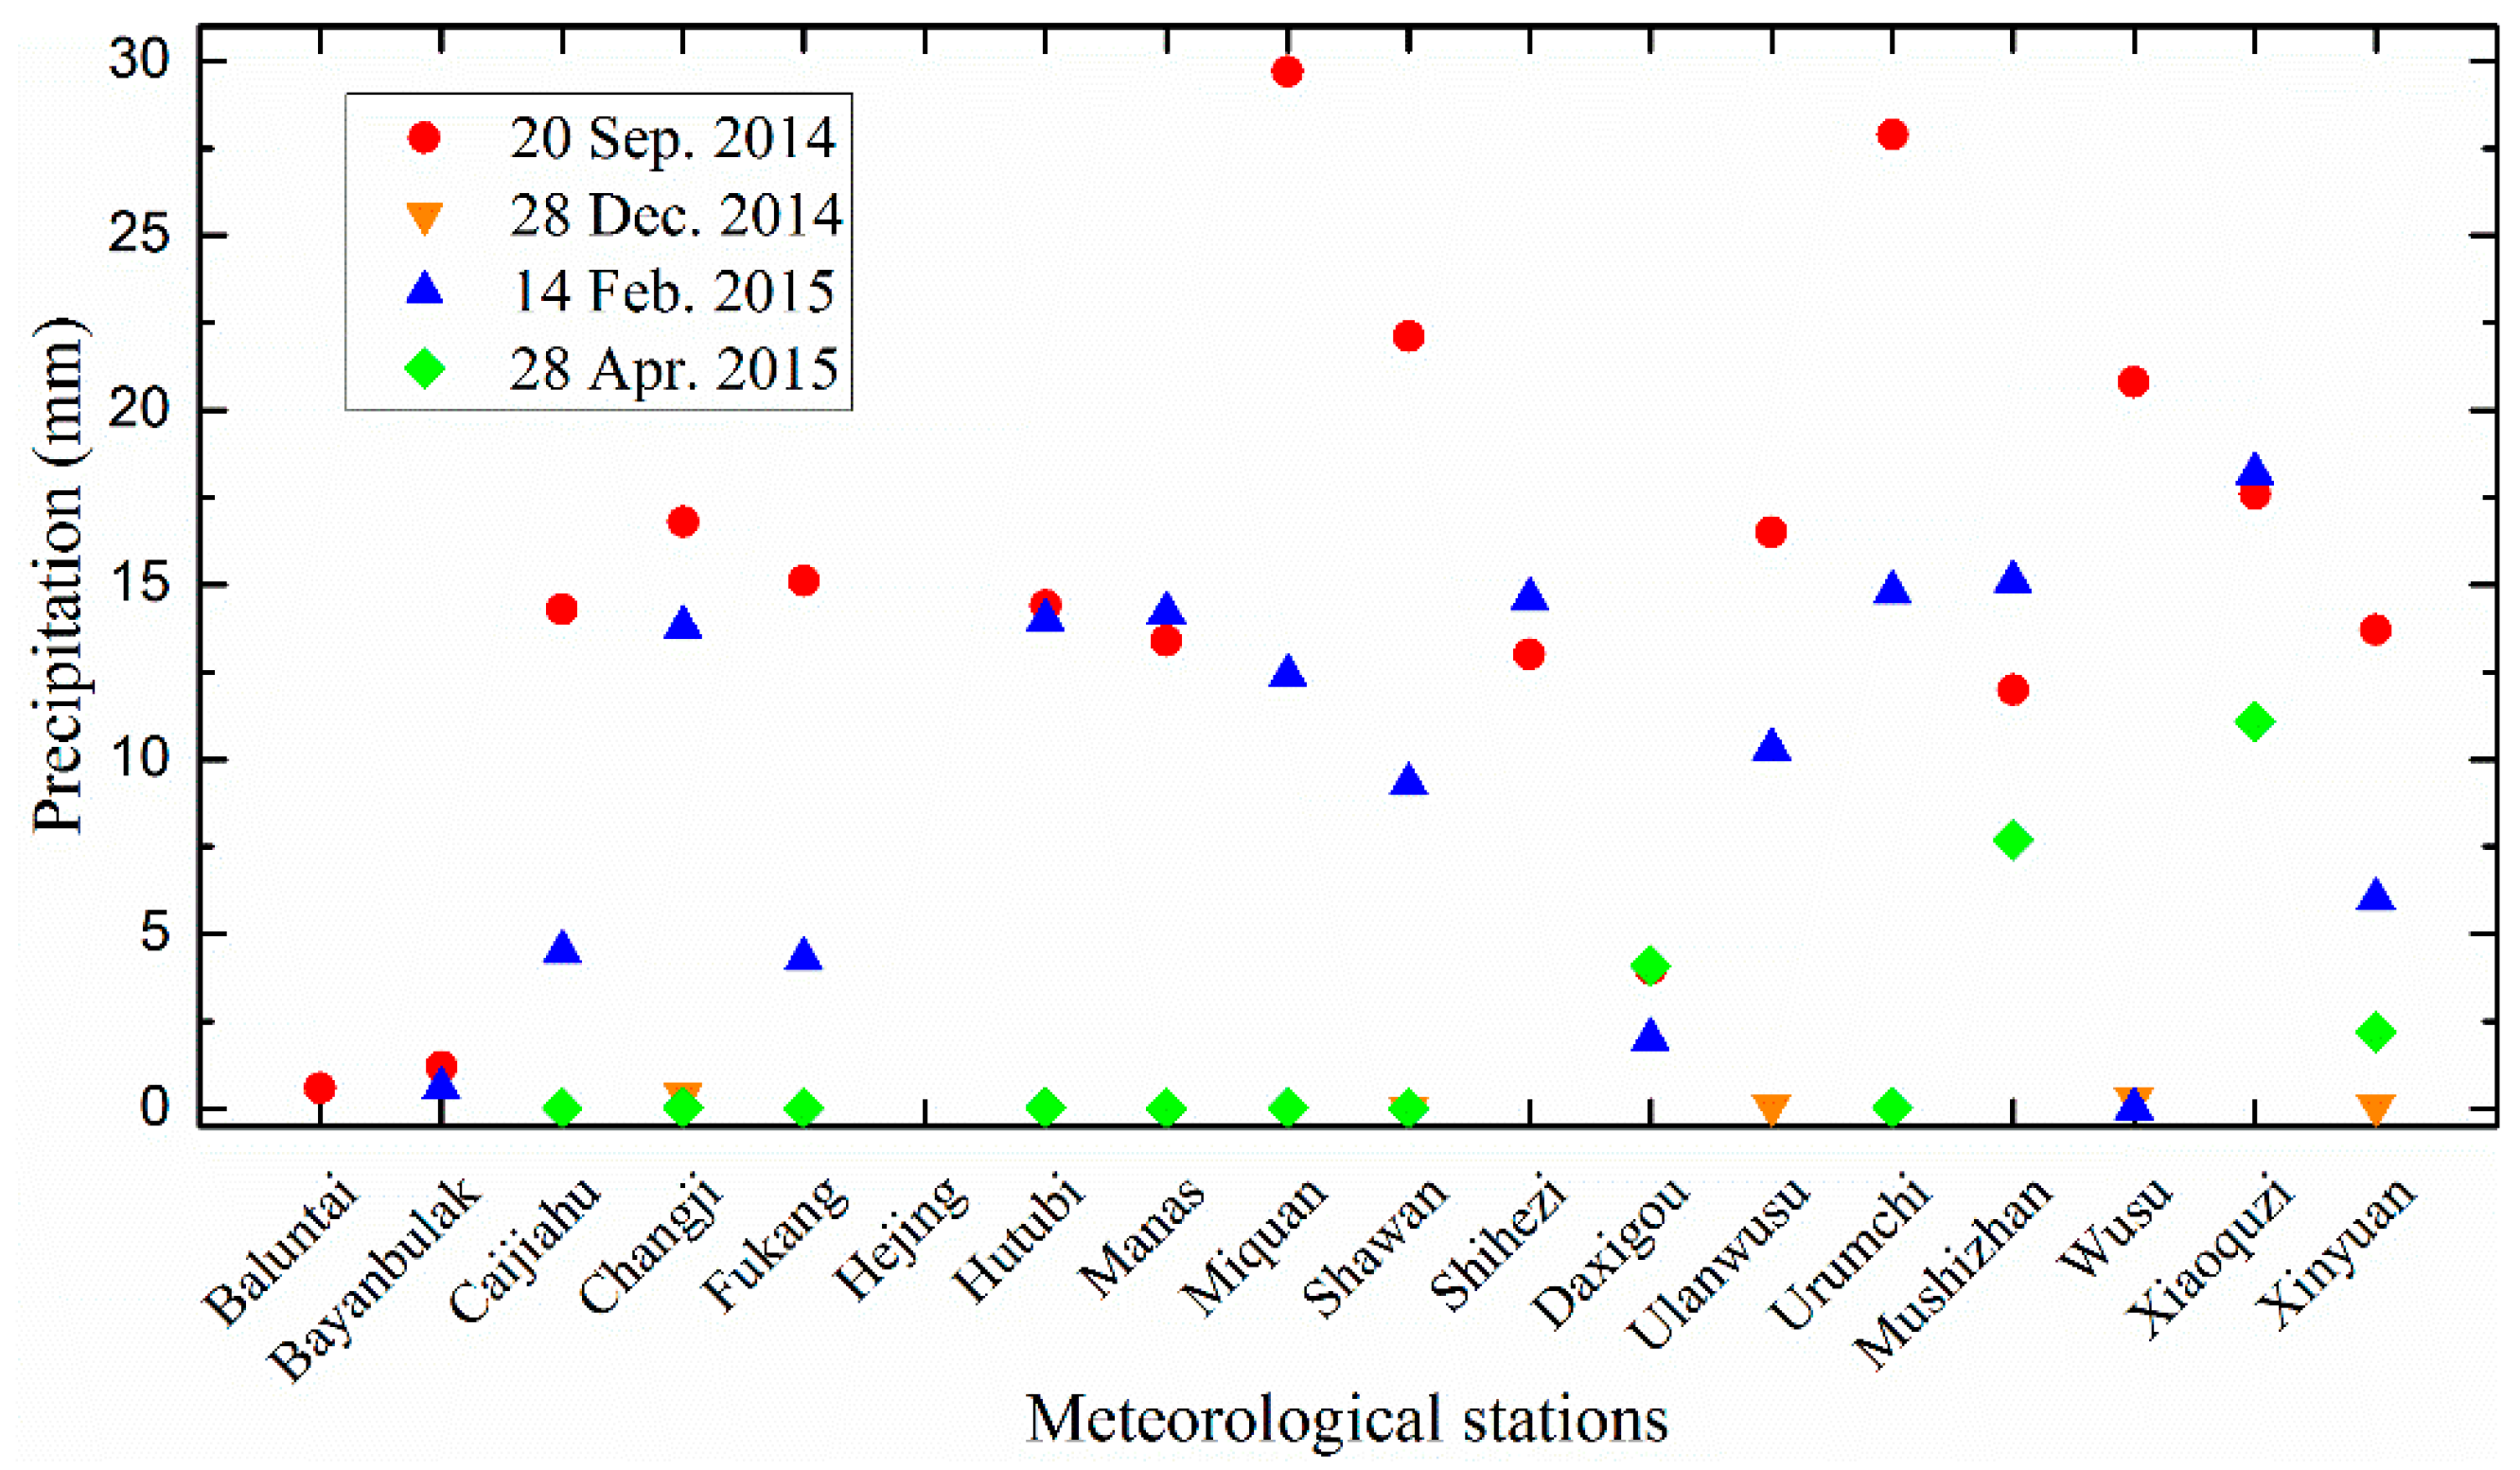
In order to test the snowfall detection method, we first picked four days as examples of single snowfall detection. The precipitation records of 18 meteorological stations in the study area (Figure 3) showed that there was wide-range precipitation on 20 September 2014 (beginning of the snow accumulation period), 28 December 2014 (snow accumulation period), 14 February 2015 (snow stabilization period), and 29 April 2015 (snow ablation period). On 20 September 2014, precipitation was recorded at all meteorological stations except for Hejing station at levels ranging from light, and moderate, to heavy rain. On 28 December 2014, light rain was recorded at five meteorological stations (Changji, Shawan, Ulanwusu, Wusu and Xinyuan). On 14 February 2015, precipitation was recorded at all meteorological stations, except for Hejing and Baluntai stations, at levels ranging from light to moderate rain. On 29 April 2015, light rain was recorded at 11 meteorological stations and moderate rain was recorded at Xiaoquzi station. Noting that the elevation of these stations range dfrom 441 to 3544 m a.s.l., the assumption was made that there was liquid or solid precipitation over MRB based on the theory of forming orographic precipitation, because the elevation in the MRB ranges from 649 to 5035 m a.s.l.
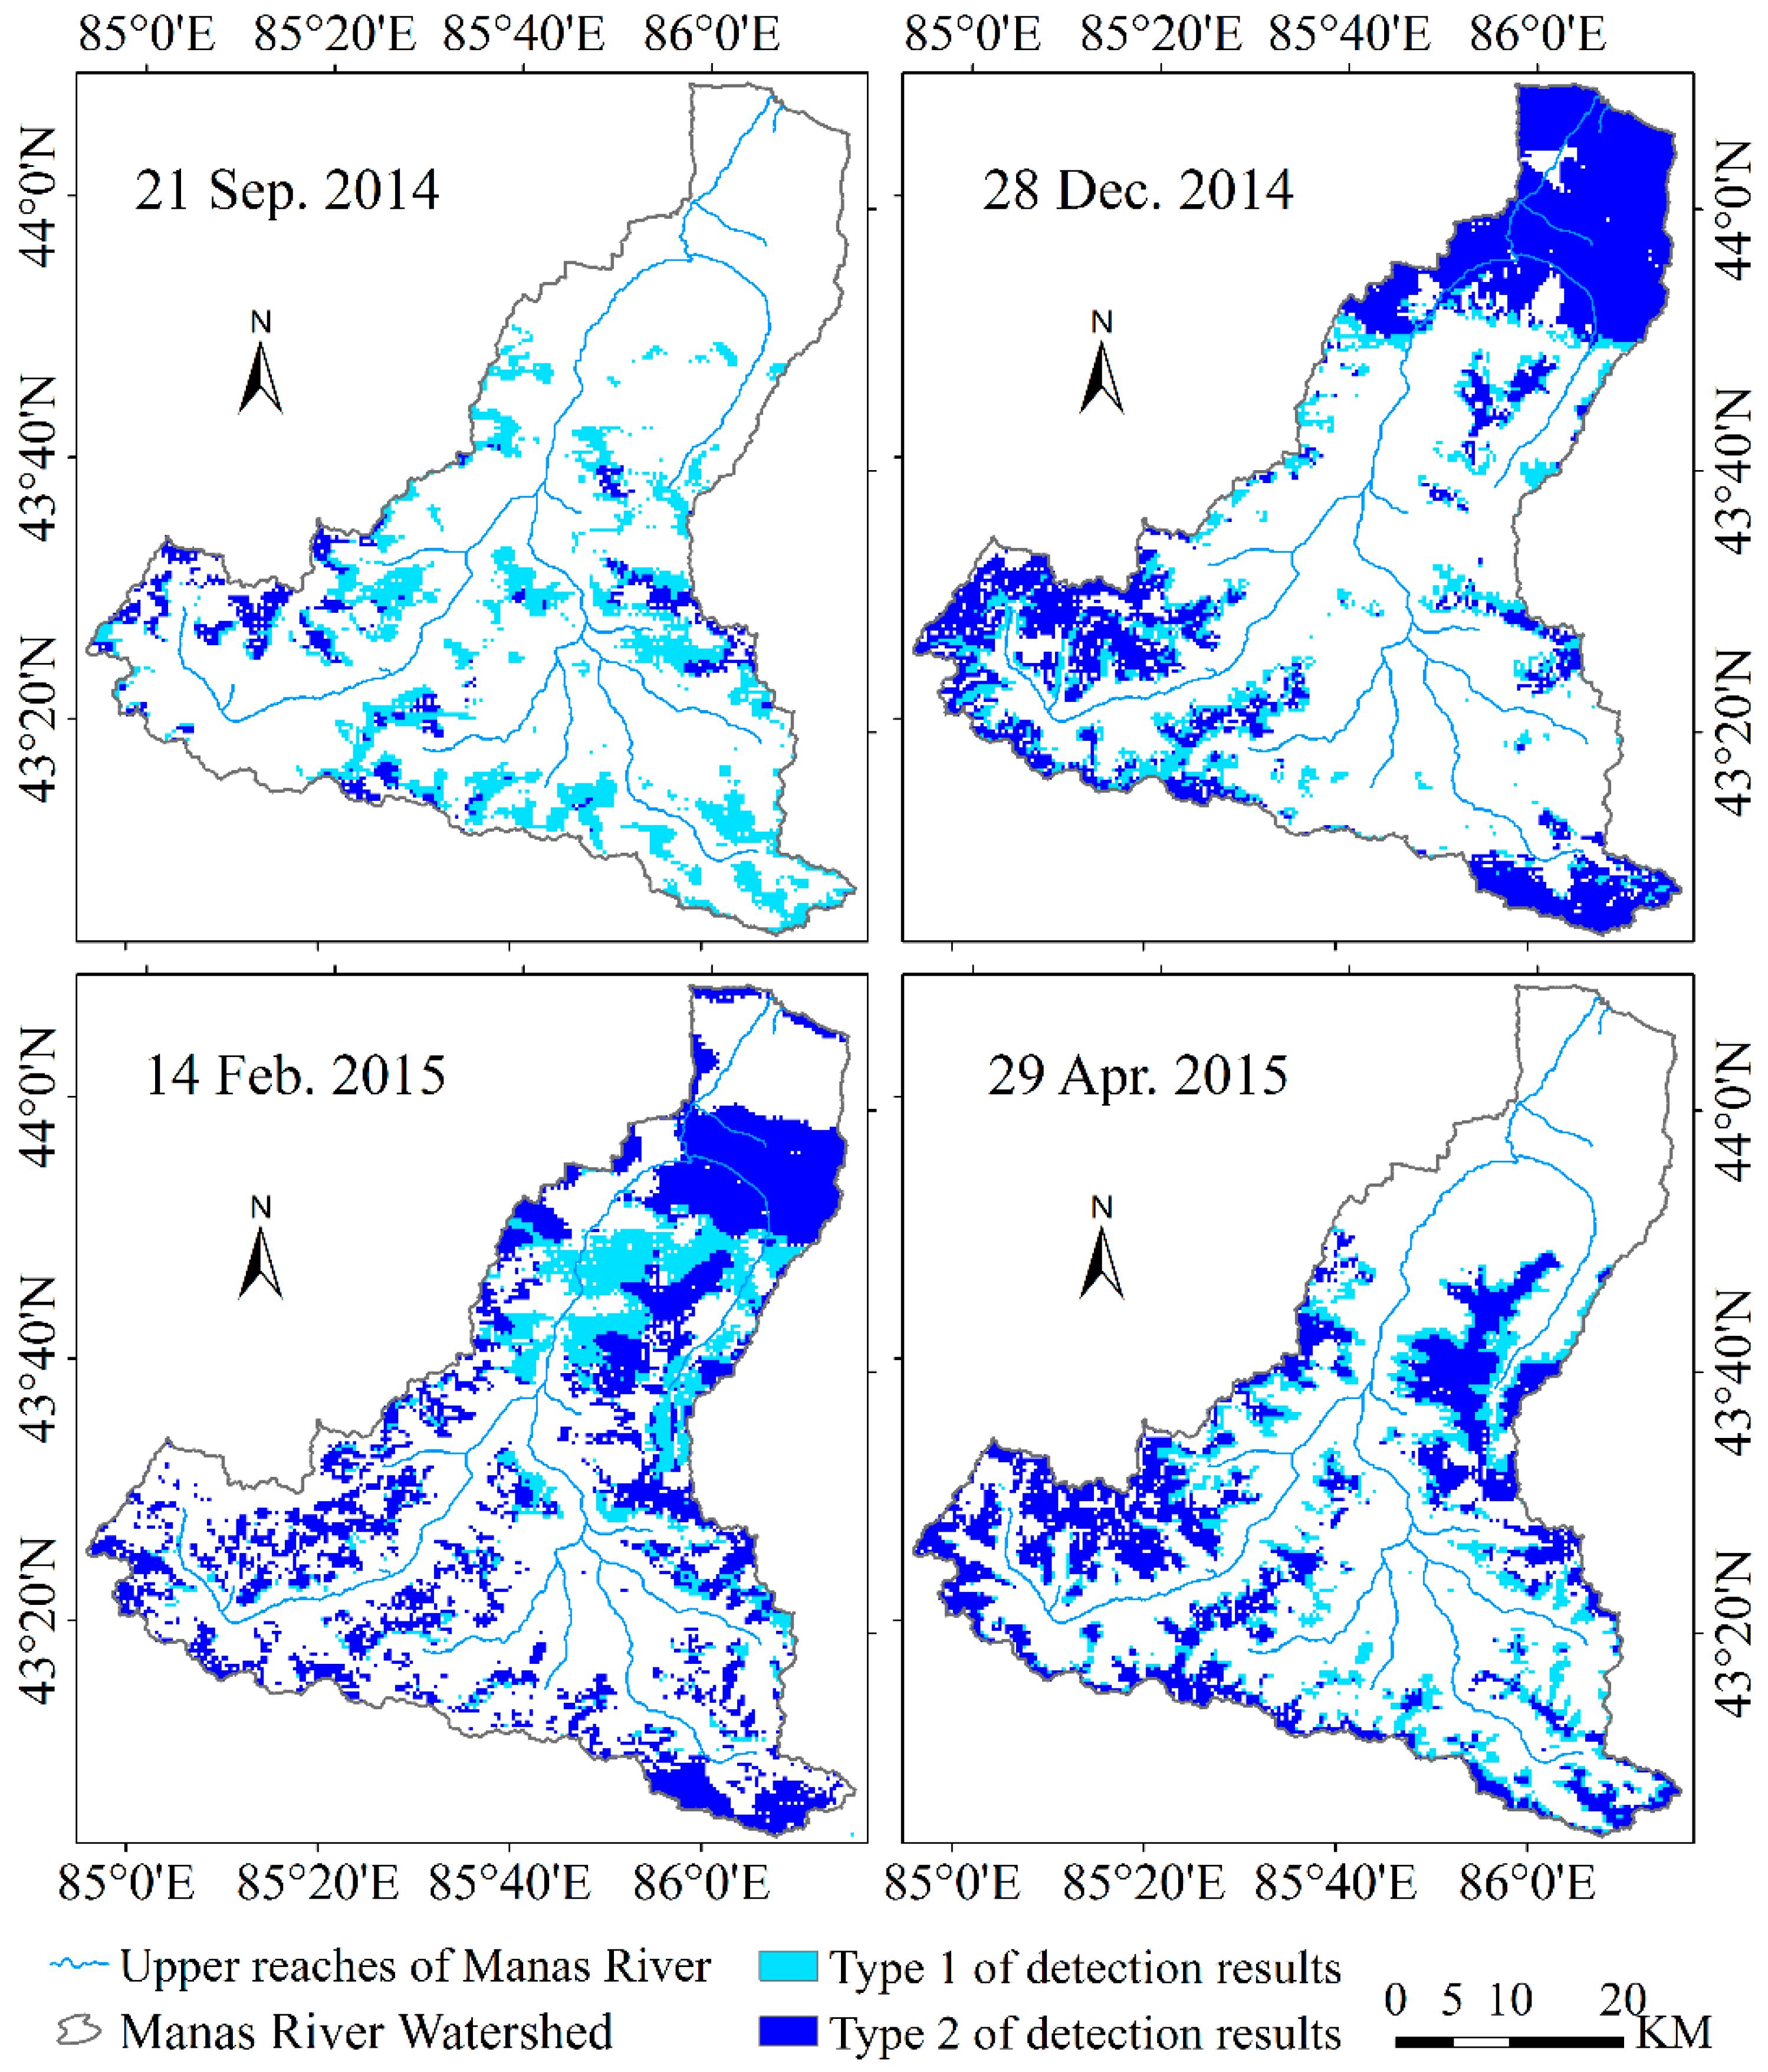
The single snowfall event detection results for the four selected days are presented in Figure 4. The Type 1 and Type 2 detection results were obtained by expanded snow cover (cyan) and declined snow grain size (blue), respectively. Combining the two types of results, we obtained the distribution of the selected snowfall events, showing that the location and time of the snowfall events were effectively detected not only by the expanded snow cover but also by the sudden decline in snow grain size.
On 20 September 2014, there was no snowfall in the foothill zone. In the montane and alpine zone, the snowfall event was detected as Type 1 because there was no snow on 19 September 2014, but the snow cover percentage on 21 September 2014 was 2.21% and 9.62% in the two zones, respectively. In the snow zone, both Type 1 and Type 2 snowfall events were detected as the snow cover was expanded from 17.27% to 47.76%, and the median snow grain size declined from 601 μm to 255 μm. The snowfall pixels count was 3307 (41.35%), of which Type 1 and Type 2 pixels made up 2303 (28.80%) and 1004 (12.55%), respectively. In this case, the snow cover obviously expanded after this snowfall event because the Type 1 snowfall accounted for most of the new snow, which means that the most solid precipitation fell on the no-snow surface in the beginning of the snow accumulation period.
On 28 December 2014, in the foothill, montane, alpine and snow zone, the snowfall pixel count was 2972 (90.23%), 664 (19.59%), 1365 (16.12%), and 3558 (44.49%), of which the Type 1 pixels were 46 (1.40%), 228 (6.73%), 563 (6.65%), and 1257 (15.72%) as the snow cover expanded from 90.53 to 97.94%, 16.99 to 24.57%, 13.07 to 19.69%, and 39.81 to 52.39% from 27 to 28 December 2014, respectively. The number of Type 2 pixels was 2926 (88.83%), 436 (12.86%), 802 (9.47%), and 2301 (28.77%) as the median snow grain size declined from 1000 μm to 360 μm, 1000 μm to 750 μm, 1000 μm to 474 μm and 997 μm to 403 μm, respectively.
On 14 February 2015, the snowfall pixel count was 1637 (49.70%), 1531 (45.16%), 1691 (19.96%) and 2584 (32.31%) in the foothill, montane, alpine and snow zone, of which the number of Type 1 pixels was 58 (1.76%), 1059 (31.24%), 634 (7.48%) and 590 (7.38%) and the number of Type 2 pixels was 1579 (47.94%), 472 (13.92%), 1057 (12.48%) and 1994 (24.93%), respectively. From 12 to 14 February 2015, the snow cover percentage changed from 38.17 to 46.65%, 14.25 to 56.78%, 17.81 to 24.66%, and 50.73 to 58.93%, and the median snow grain size declined from 416 μm to 77 μm, 727 μm to 210 μm, 551 μm to 247 μm and 366 μm to 213 μm, respectively. In this case, the snow grain size obviously declined after this snowfall event and the Type 2 snowfall accounted for most of the new snow, which meant that the most solid precipitation fell on the snow surface in the snow stabilization period.
On 28 April 2015, there was no snowfall in the foothill zone. In the montane, alpine and snow zone, the snow cover respectively expanded from 0.15 to 1.68%, 11.27 to 20.07% and 61.22 to 72.43% and the median snow grain size declined from 1000 μm to 642 μm, 964 μm to 401 μm and 709 μm to 326 μm from 25 to 29 April 2015. Accordingly, the number of snowfall pixels was 56 (1.65%), 1727 (20.39%) and 5256 (65.72%), of which the number of Type 1 pixels was 52 (1.53%), 931 (10.99%) and 1283 (16.04%), and the number of Type 2 pixels was 4 (0.12%), 796 (9.40%) and 3973 (49.68%), respectively. In this case, the number of Type 1 snowfall pixels was roughly equal to the number of Type 2 pixels, which means that the snow cover showed obvious changes in the snow ablation period.
4.2. Snowfall Distribution Pattern of Each Quarter
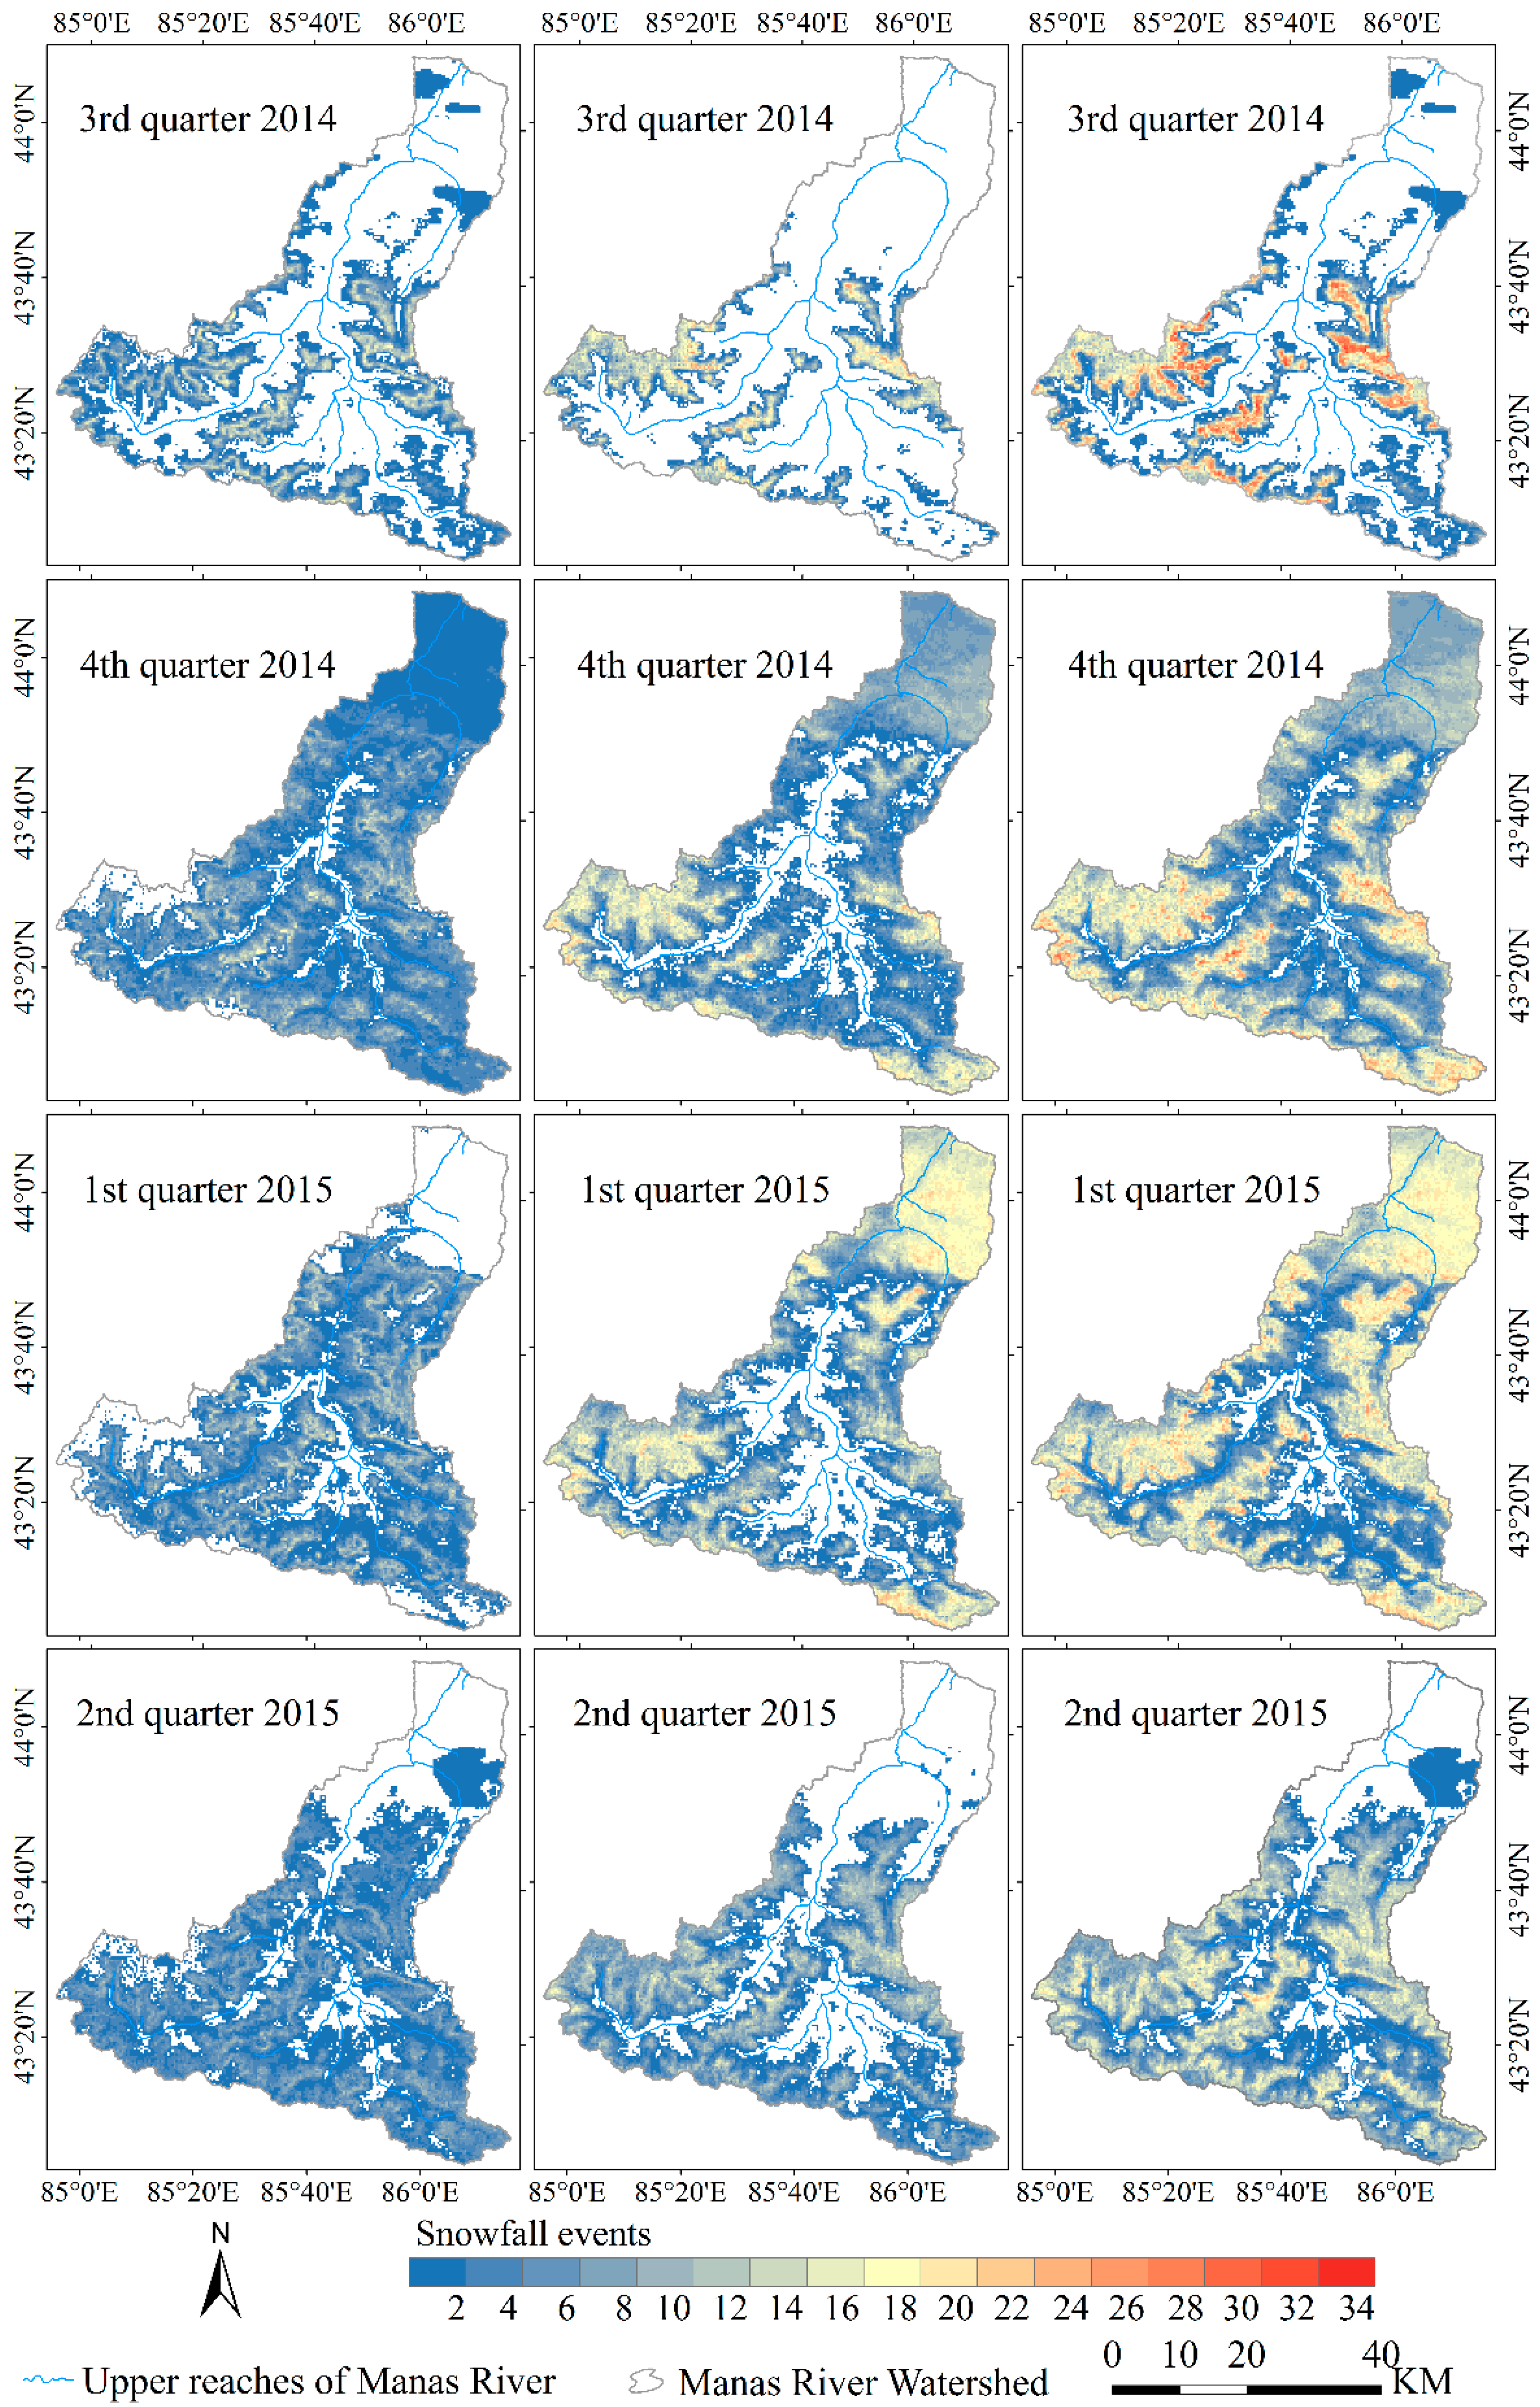
The spatial and temporal distribution of snowfall events exhibited a large heterogeneity over the study area. Figure 5 presents the spatial distribution of the number of snowfall events for each pixel over the study area in each quarter from July 2014 to June 2015.
In the third quarter of 2014 (from July to September), which is the beginning of the snow accumulation period, about 43.62% of the pixels with at least one snowfall event occurred. In the foothill and montane zone, there were approximate 10.53% and 11.83% of the total area with snowfall, in which all of the detection results were Type 1. The maximum values for snowfall events were 1 and 2, respectively. The number of precipitation events at Miquan (601.2 m a.s.l.), Urumchi (918.7 m a.s.l.), Xinyuan (929.1 m a.s.l.), Hejing (1102.0 m a.s.l.), Baluntai (1737.3 m a.s.l.), Xiaoquzi (2161.0 m a.s.l.), Mushizhan (2355.6 m a.s.l.) and Bayanbulak (2458.9 m a.s.l.) meteorological stations were 17, 22, 30, 28, 34, 34, 32 and 44, respectively, showing that most of the precipitations were in liquid format in the two zones. In the alpine zone, approximately 25.22% of the total area had snowfall, with detection results for Type 1 and Type 2 of 25.22% and 4.23%, respectively. The medium and maximum number of snowfall events was 1 and 21. The number of precipitation events at Xidagou (3543.8 m a.s.l.) meteorological station was 40, showing that there were still many liquid precipitation events in this zone. In the snow zone, approximately 90.23% of the total area had snowfall, with detection results of Type 1 and Type 2 of 86.02% and 66.90%, respectively. The medium and maximum number of snowfall events were 10 and 34, respectively.
In the fourth quarter of 2014 (from October to December), which is the snow accumulation period, at least one snowfall event occurred in about 94.21% of the pixels. In foothill zone, approximately 99.73% of the total area had snowfall, and the detection results for Type 1 and Type 2 were 99.73% and 99.30%, respectively. The medium and maximum number of snowfall events was 9 and 17. The number of precipitation events at Miquan (601.2 m a.s.l.), Urumchi (918.7 m a.s.l.), Xinyuan (929.1 m a.s.l.) and Hejing (1102.0 m a.s.l.) meteorological stations were 20, 23, 32 and 10, respectively. In the montane zone, approximately 75.19% of the total area had snowfall, with detection results of Type 1 and Type 2 of 75.19% and 48.64%, respectively. The medium and maximum number of snowfall events were 4 and 19, respectively. The number of precipitation events at the Baluntai (1737.3 m a.s.l.), Xiaoquzi (2161.0 m a.s.l.), Mushizhan (2355.6 m a.s.l.) and Bayanbulak (2458.9 m a.s.l.) meteorological stations were 4, 25, 21 and 11, respectively. In the alpine zone, approximately 94.22% of the total area had snowfall, and the detection results for Type 1 and Type 2 were 94.20% and 71.73%, respectively. The medium and maximum number of snowfall events were 5 and 27, respectively. The number of precipitation events at Xidagou (3543.8 m a.s.l.) meteorological station was 5. In the snow zone, approximately 99.99% of the total area had snowfall, with detection results of Type 1 and Type 2 of 86.83% and 98.26%, respectively. The medium and maximum number of snowfall events were 14 and 31, respectively.
In the first quarter of 2015 (from January to March), which is the snow stabilization period, at least one snowfall event occurred in about 92.45% of the pixels. In the foothill zone, approximately 99.88% of the total area had snowfall, and the detection results for Type 1 and Type 2 were 14.91% and 99.45%, respectively. The medium and maximum number of snowfall events were 16 and 22, respectively. The number of precipitation events at the Miquan (601.2 m a.s.l.), Urumchi (918.7 m a.s.l.), Xinyuan (929.1 m a.s.l.) and Hejing (1102.0 m a.s.l.) meteorological stations were 29, 17, 29 and 18, respectively. In the montane zone, approximately 79.12% of the total area had snowfall, and the detection results of Type 1 and Type 2 were 70.12% and 55.66%, respectively. The medium and maximum values of the snowfall events were 6 and 25, respectively. The number of precipitation events at the Baluntai (1737.3 m a.s.l.), Xiaoquzi (2161.0 m a.s.l.), Mushizhan (2355.6 m a.s.l.) and Bayanbulak (2458.9 m a.s.l.) meteorological stations were 7, 21, 23 and 10, respectively. In the alpine zone, approximately 88.02% of the total area had snowfall, with detection results for Type 1 and Type 2 of 83.64% and 59.87%, respectively. The medium and maximum values of the snowfall events were 5 and 28, respectively. The number of precipitation events at the Xidagou (3543.8 m a.s.l.) meteorological station was 13. In the snow zone, approximately 99.74% of the total area had snowfall, and the detection results for Type 1 and Type 2 were 78.62% and 96.07%, respectively. The medium and maximum values of the snowfall events were 13 and 30, respectively.
In the second quarter of 2015 (from April to June), which is the snow ablation period, about 75.09% of the pixels had at least one snowfall event. In the foothill zone, approximately 18.85% of the total area had snowfall, with detection results of Type 1 and Type 2 of 18.85% and 1.43%, respectively. The medium and maximum values of the snowfall events were 1 and 2, respectively. The number of precipitation events at the Miquan (601.2 m a.s.l.), Urumchi (918.7 m a.s.l.), Xinyuan (929.1 m a.s.l.) and Hejing (1102.0 m a.s.l.) meteorological stations were 28, 26, 42 and 22, respectively. In the montane zone, approximately 43.92% of the total area had snowfall, with detection results of Type 1 and Type 2 of 42.98% and 13.42%, respectively. The medium and maximum values of the snowfall events were 1 and 10, respectively. The number of precipitation events at the Baluntai (1737.3 m a.s.l.), Xiaoquzi (2161.0 m a.s.l.), Mushizhan (2355.6 m a.s.l.) and Bayanbulak (2458.9 m a.s.l.) meteorological stations were 29, 38, 45 and 43, respectively. In the alpine zone, approximately 86.01% of the total area had snowfall, and the detection results of Type 1 and Type 2 were 84.71% and 62.37%, respectively. The medium and maximum values of the snowfall events were 4 and 20, respectively. The number of precipitation events at the Xidagou (3543.8 m a.s.l.) meteorological station was 51. In the snow zone, approximately 99.89% of the total area had snowfall, and the detection results for Type 1 and Type 2 were 89.12% and 99.04%, respectively. The medium and maximum number of snowfall events was 11 and 25. The comparison with meteorological station records showed that many precipitation events in this period were in the liquid format.
4.3. Snowfall Distribution Pattern for the Entire Hydrological Year
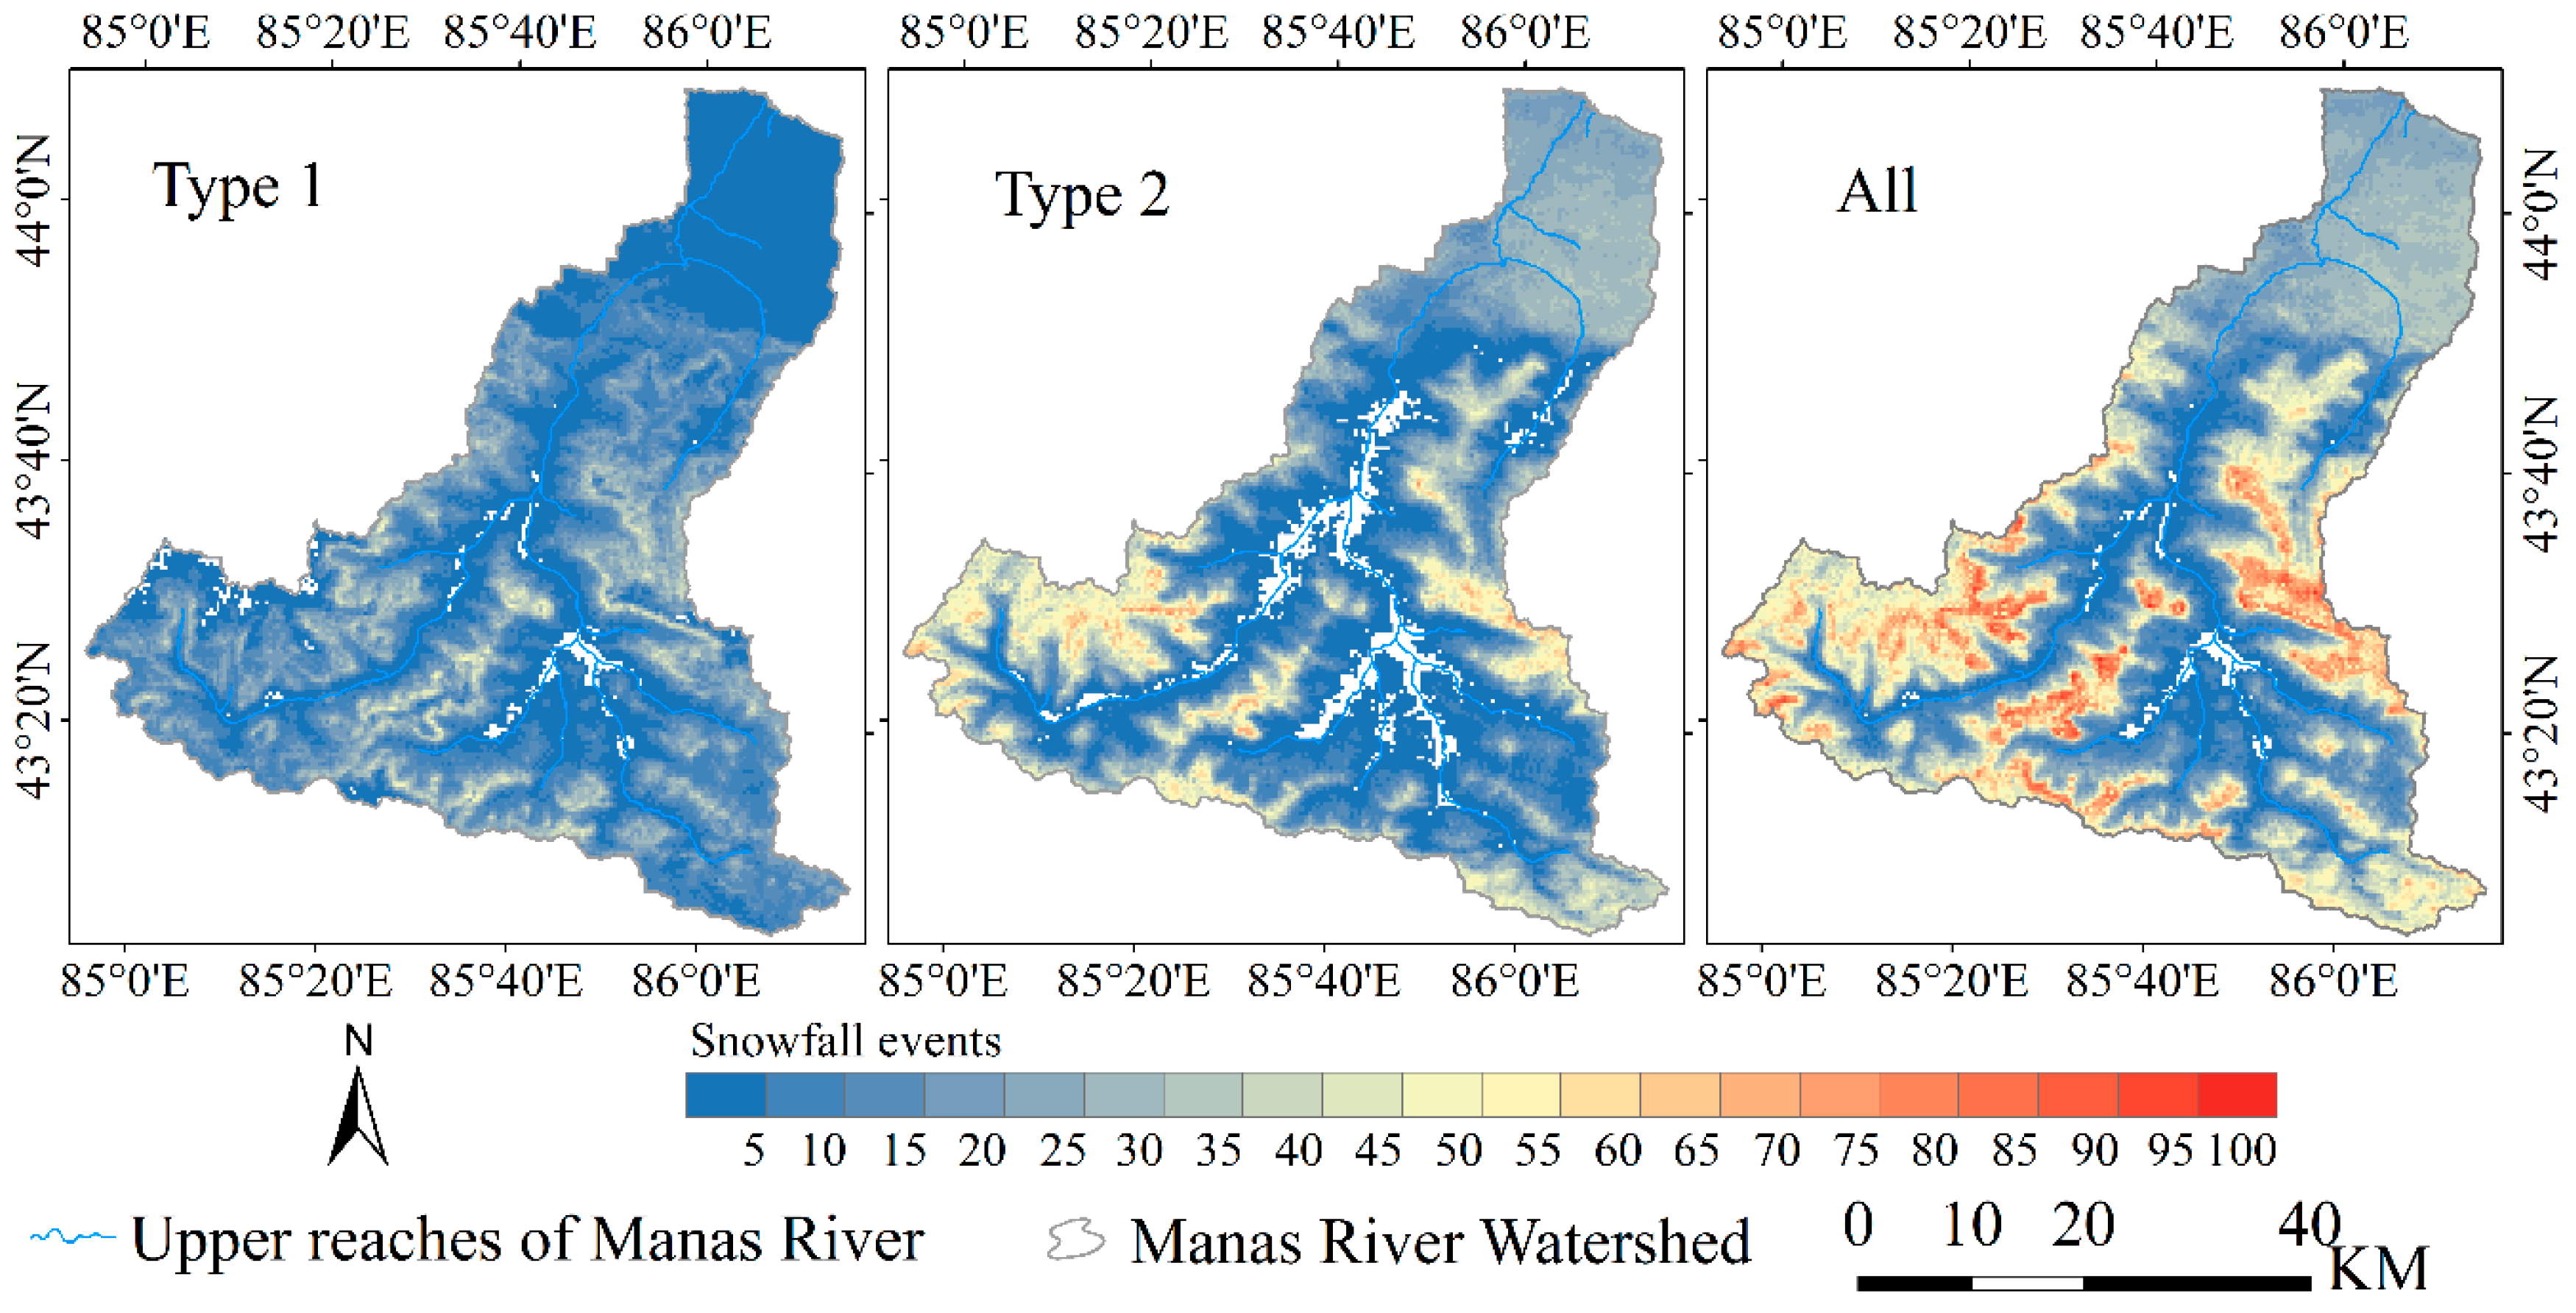
Figure 6 presents the spatial distribution of the number of snowfall events for each pixel in the study area for the entire hydrological year from July 2014 to June 2015. At least one snowfall event occurred in about 98.85% of the pixels. The spatial and temporal distribution of the snowfall events exhibited a large heterogeneity over the study area. In the foothill zone, approximately 100% of the total area had snowfall, and the detection results for Type 1 and Type 2 were 100% and 99.76%, respectively. The medium and maximum values of the snowfall events were 26 and 38, respectively. The number of precipitation events at the Miquan (601.2 m a.s.l.), Urumchi (918.7 m a.s.l.), Xinyuan (929.1 m a.s.l.) and Hejing (1102.0 m a.s.l.) meteorological stations were 94, 88, 133 and 78, respectively. In the montane zone, approximately 94.34% of the total area had snowfall, for which the detection results of Type 1 and Type 2 were 94.34% and 77.29%, respectively. The medium and maximum values of the snowfall events were 10 and 50, respectively. The number of precipitation events at the Baluntai (1737.3 m a.s.l.), Xiaoquzi (2161.0 m a.s.l.), Mushizhan (2355.6 m a.s.l.) and Bayanbulak (2458.9 m a.s.l.) meteorological stations were 74, 118, 121 and 108, respectively. In the alpine zone, approximately 99.13% of the total area had snowfall, and the detection results of Type 1 and Type 2 were 99.13% and 94.05%, respectively. The medium and maximum values of the snowfall events were 15 and 80. The number of precipitation events at the Xidagou (3543.8 m a.s.l.) meteorological station was 109. In snow zone, approximately 100% of the total area had snowfall, and the detection results of Type 1 and Type 2 were 98.39% and 99.99%, respectively. The medium and maximum number of snowfall events were 50 and 99, respectively. It is known that precipitations in mountainous areas depends on the altitude and tends to increase with the rising altitude [34]. Accordingly, our detection results were consistent with the snowfall in nature.
5. Discussion
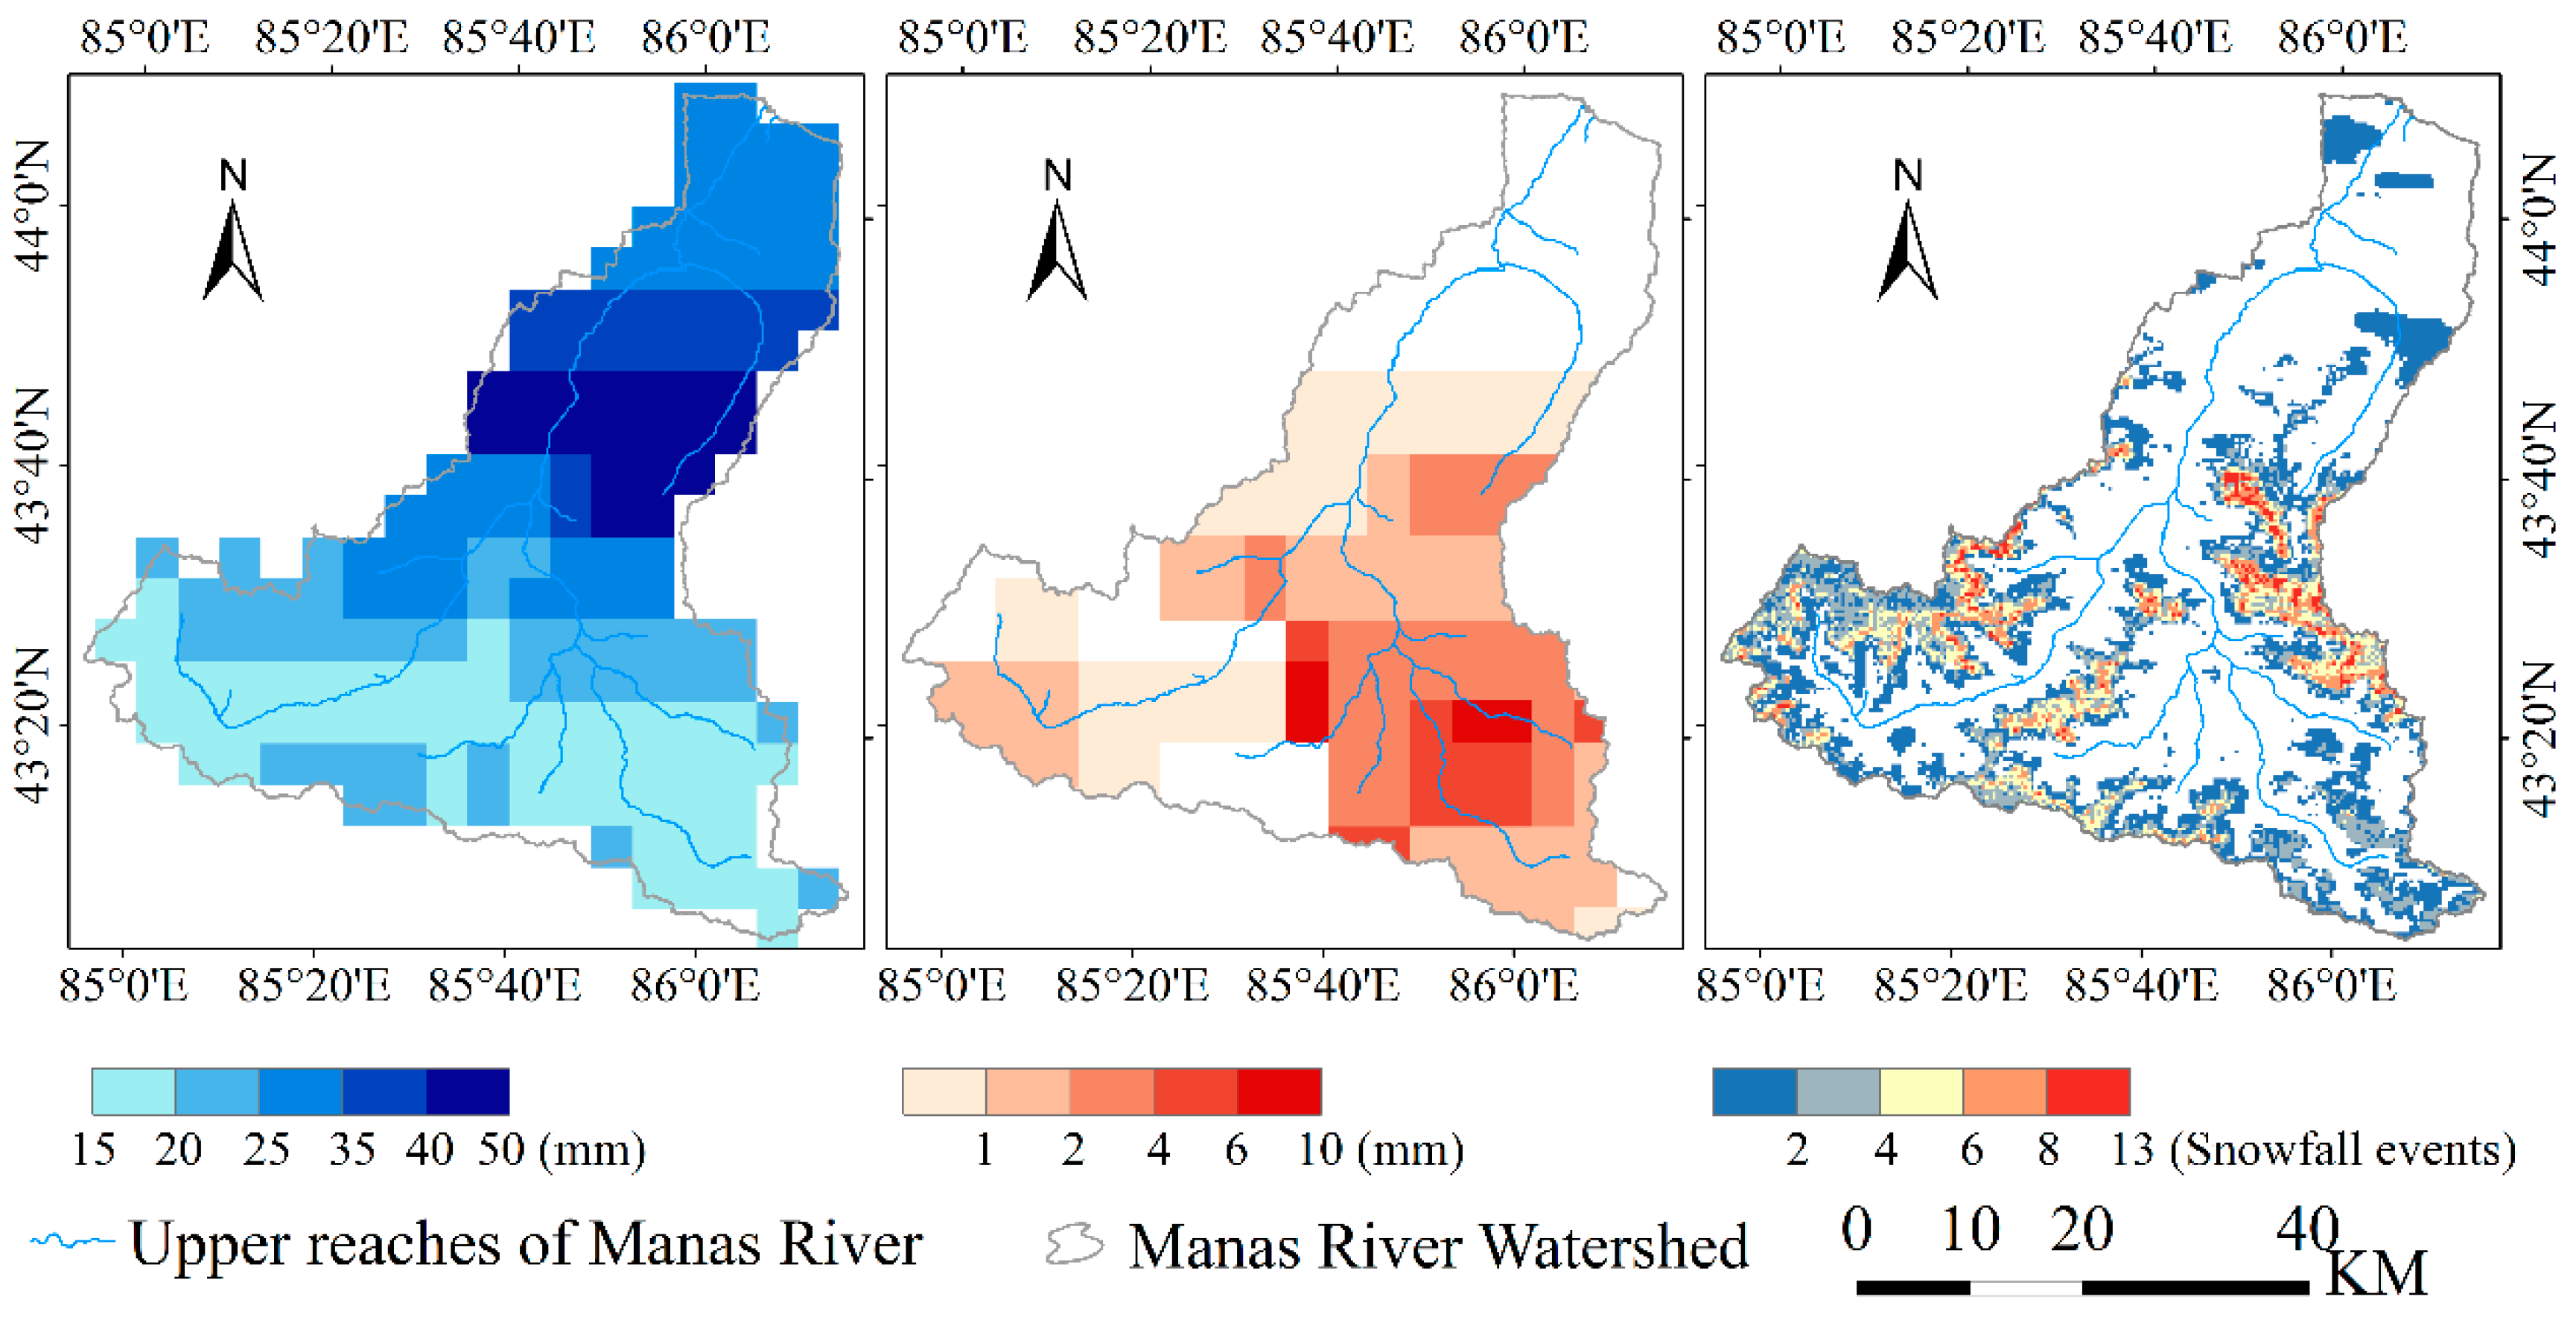
Snowfall is the key part of the water cycle, especially over mountainous areas in arid and semi-arid regions. New snowfall has an important impact on water resources and albedo. Due to the lack of in situ observation data, we do not know much about the spatial–temporal distribution of new snowfall events over mountainous areas. Remote sensing technology provides an extremely important advantage for in-depth exploration and research into snow monitoring over mountainous areas. Compared with the GPM precipitation product (https://pmm.nasa.gov/GPM), as shown in Figure 7, the snowfall events detected by our method from the MODIS data show more detail. The detection results for snowfall events can be used in climate and hydrological models. For example, the method can be applied to the Tibetan Plateau, which covers an area of 2572.4 × 103 km2, but only has 106 meteorological stations [35].
In nature, snow and clouds have a strong correlation, especially over mountainous regions. On the one hand, clouds are formed when masses of air pushed by wind are forced up the side of an elevated altitude, resulting in adiabatic cooling, and ultimately condensation and precipitation. On the other hand, the sublimation of snowpack leads to the formation of clouds over mountain ridges. Optical sensors are easily affected by clouds because clouds prevent land information from being received by the optical sensors [15,20]. The proposed method for the detection of snowfall events considers the effects of cloud. The CPC represents the number of consecutive days of cloud obscuration since the last view of the surface. It is useful for removing cloud effects. In this study, we used the MOD35 v6 cloud mask product to identify clouds. However, the MOD35 product has issues related to persistent errors due to snow/cloud confusion and cloud overdetection, especially in mountain/forest areas [36]. In future, the advanced algorithm for removing clouds, e.g., the snow line algorithm [37] and meteorological interpolation [38], can be added to the present method to improve the accuracy of detection of snowfall events.
The snowmelt can also affect the results of snowfall detection. After deposition, snow begins an endless process of metamorphism, which is thermodynamically active. The speed of the metamorphism process is controlled by solar radiation. Over mountainous areas, the distribution of solar radiation is affected by topography, including elevation, slope, and aspect [39], which affect the snow accumulation and snowmelt owing to the different radiation and energy balances. Therefore, snow distribution is controlled by the terrain in an alpine watershed [40]. The present snowfall detection algorithm compares pixels with a time interval of at least one day. During the gap in the satellite revisit, a lot of snow may disappear due to melting, especially for the snow with a southern and eastern aspect, which would result in fewer detected snowfall pixels.
6. Conclusions
A general method for detecting snowfall events over mountainous areas using optical remote sensing data was proposed in this study, based on the fact of expanded snow cover areas and sudden declines in snow grain size caused by newly fallen snow. The proposed method not only detected the time of the snowfall, but also obtained the spatial distribution of the snowfall. After comparing the detection results with the precipitation records of meteorological stations around the study area, the accuracy of the snowfall detection method was found to be satisfactory, as snowfall events were effectively detected by the proposed method. It was further demonstrated that the distribution pattern of the snowfall events was closely related to the topography. Specifically, snowfall events tended to increase over mountainous areas with the increase in altitude.
In this study, the methodology was tested for an entire hydrological year (July 2014 to June 2015) over the MRB. The type of precipitation can affect the results of snowfall detection. In different quarters, there were different percentages of liquid and solid precipitation. There was more liquid precipitation than solid precipitation in the second and third quarter, and more solid precipitation than liquid precipitation in the first and fourth quarter. The number of snowfall and precipitation events tended to increase with the increase in altitude. Below the alpine zone, there was more liquid precipitation. Therefore, the number of detected snowfall events was lower than that recorded by the meteorological stations. Most precipitation was solid in higher alpine zones. Therefore, the value of detected snowfall events was close to that of the precipitation events recorded by the meteorological stations. Meanwhile, the validity of the snowfall event detection algorithm was further proved by comparing the number of detected snowfall events with the amount of recorded precipitation. In order to further confirm the validity of the proposed discriminating rules, more periods and more sites should be involved to perform verification in the future. We also plan to further improve the snowfall detection method in the future by embedding advanced algorithms for cloud removal.
Author Contributions
J.W. designed and performed the experiment and finished the manuscript writing. Y.Z., X.Z. and X.F. offered guidance to complete the work. Y.C., W.H. and H.Z. carried out data processing and data analysis.
Funding
This work was supported by the National Natural Science Foundation of China (Grant No. 41871238, 41661144039, 41875027, 41401481), and the Natural Science Foundation of Jiangsu Province (Grant No. BK20140997).
Conflicts of Interest
The authors declare no conflict of interest.
References
- Barnett, T.P.; Adam, J.C.; Lettenmaier, D.P. Potential impacts of a warming climate on water availability in snow-dominated regions. Nature 2005, 438, 303–309. [Google Scholar] [CrossRef] [PubMed]
- Dedieu, J.P.; Lessard-Fontaine, A.; Ravazzani, G.; Cremonese, E.; Shalpykova, G.; Beniston, M. Shifting mountain snow patterns in a changing climate from remote sensing retrieval. Sci. Total Environ. 2014, 493, 1267–1279. [Google Scholar] [CrossRef] [PubMed] [Green Version]
- IPCC. Climate Change 2013: The Physical Science Basis. Contribution of Working Group I to the Fifth Assessment Report of the Intergovernmental Panel on Climate Change; IPCC: Cambridge, UK; New York, NY, USA, 2013. [Google Scholar]
- Fayad, A.; Gascoin, S.; Faour, G.; López-Moreno, J.I.; Drapeau, L.; Page, M.L.; Escadafal, R. Snow hydrology in mediterranean mountain regions: A review. J. Hydrol. 2017, 551, 374–396. [Google Scholar] [CrossRef]
- Stoffel, M.; Wyżga, B.; Marston, R.A. Floods in mountain environments: A synthesis. Geomorphology 2016, 272, 1–9. [Google Scholar] [CrossRef]
- Stephens, G.L.; O’Brien, D.; Webster, P.J.; Pilewski, P.; Kato, S.; Li, J.-L. The albedo of earth. Rev. Geophys. 2015, 53, 141–163. [Google Scholar] [CrossRef]
- Levizzani, V.; Laviola, S.; Cattani, E. Detection and measurement of snowfall from space. Remote Sens. 2011, 3, 145–166. [Google Scholar] [CrossRef]
- You, Y.; Wang, N.-Y.; Ferraro, R.; Rudlosky, S. Quantifying the snowfall detection performance of the gpm microwave imager channels over land. J. Hydrometeorol. 2017, 18, 729–751. [Google Scholar] [CrossRef]
- Liu, G.; Seo, E.-K. Detecting snowfall over land by satellite high-frequency microwave observations: The lack of scattering signature and a statistical approach. J. Geophys. Res. Atmos. 2013, 118, 1376–1387. [Google Scholar] [CrossRef]
- Milani, L.; Kulie, M.S.; Casella, D.; Dietrich, S.; L’Ecuyer, T.S.; Panegrossi, G.; Porcù, F.; Sanò, P.; Wood, N.B. Cloudsat snowfall estimates over antarctica and the southern ocean: An assessment of independent retrieval methodologies and multi-year snowfall analysis. Atmos. Res. 2018, 213, 121–135. [Google Scholar] [CrossRef]
- Panegrossi, G.; Rysman, J.-F.; Casella, D.; Marra, A.; Sanò, P.; Kulie, M. Cloudsat-based assessment of gpm microwave imager snowfall observation capabilities. Remote Sens. 2017, 9, 1263. [Google Scholar] [CrossRef]
- Kim, J.; Jung, I.; Park, K.; Yoon, S.; Lee, D. Hydrological utility and uncertainty of multi-satellite precipitation products in the mountainous region of South Korea. Remote Sens. 2016, 8, 608. [Google Scholar] [CrossRef]
- Dozier, J.; Painter, T.H. Multispectral and hyperspectral remote sensing of alpine snow properties. Annu. Rev. Earth Planet. Sci. 2004, 32, 465–494. [Google Scholar] [CrossRef]
- Frei, A.; Tedesco, M.; Lee, S.; Foster, J.; Hall, D.K.; Kelly, R.; Robinson, D.A. A review of global satellite-derived snow products. Adv. Space Res. 2012, 50, 1007–1029. [Google Scholar] [CrossRef] [Green Version]
- Dozier, J.; Green, R.O.; Nolin, A.W.; Painter, T.H. Interpretation of snow properties from imaging spectrometry. Remote Sens. Environ. 2009, 113, S25–S37. [Google Scholar] [CrossRef]
- Hall, D.K.; Riggs, G.A.; Salomonson, V.V.; DiGirolamo, N.E.; Bayr, K.J. Modis snow-cover products. Remote Sens. Environ. 2002, 83, 181–194. [Google Scholar] [CrossRef]
- Hall, D.K.; Riggs, G.A. Accuracy assessment of the modis snow products. Hydrol. Processes 2007, 21, 1534–1547. [Google Scholar] [CrossRef]
- Hall, D.K.; Riggs, G.A.; Foster, J.L.; Kumar, S.V. Development and evaluation of a cloud-gap-filled modis daily snow-cover product. Remote Sens. Environ. 2010, 114, 496–503. [Google Scholar] [CrossRef]
- Marchane, A.; Jarlan, L.; Hanich, L.; Boudhar, A.; Gascoin, S.; Tavernier, A.; Filali, N.; Le Page, M.; Hagolle, O.; Berjamy, B. Assessment of daily modis snow cover products to monitor snow cover dynamics over the moroccan atlas mountain range. Remote Sens. Environ. 2015, 160, 72–86. [Google Scholar] [CrossRef]
- Domine, F.; Albert, M.; Huthwelker, T.; Jacobi, H.-W.; Kokhanovsky, A.A.; Lehning, M.; Picard, G.; Simpson, W.R. Snow physics as relevant to snow photochemistry. Atmos. Chem. Phys. 2008, 8, 171–208. [Google Scholar] [CrossRef] [Green Version]
- Fierz, C.; Armstrong, R.L.; Durand, Y.; Etchevers, P.; Greene, E.; McClung, D.M.; Nishimura, K.; Satyawali, P.K.; Sokratov, S.A. The International Classification for Seasonal Snow on the Ground; IHP-VII Technical Documents in Hydrology No. 83, IACS Contribution No. 1; UNESCO-IHP: Paris, France, 2009. [Google Scholar]
- Colbeck, S.C. An overview of seasonal snow metamorphism. Rev. Geophys. Space Phys. 1982, 20, 45–61. [Google Scholar] [CrossRef]
- Flanner, M.G.; Zender, C.S. Linking snowpack microphysics and albedo evolution. J. Geophys. Res. 2006, 111. [Google Scholar] [CrossRef] [Green Version]
- Lyapustin, A.; Tedesco, M.; Wang, Y.J.; Aoki, T.; Hori, M.; Kokhanovsky, A. Retrieval of snow grain size over greenland from modis. Remote Sens. Environ. 2009, 113, 1976–1987. [Google Scholar] [CrossRef]
- Zege, E.P.; Katsev, I.L.; Malinka, A.V.; Prikhach, A.S.; Heygster, G.; Wiebe, H. Algorithm for retrieval of the effective snow grain size and pollution amount from satellite measurements. Remote Sens. Environ. 2011, 115, 2674–2685. [Google Scholar] [CrossRef]
- Wiebe, H.; Heygster, G.; Zege, E.; Aoki, T.; Hori, M. Snow grain size retrieval sgsp from optical satellite data: Validation with ground measurements and detection of snow fall events. Remote Sens. Environ. 2013, 128, 11–20. [Google Scholar] [CrossRef]
- Wang, J.; Feng, X.; Xiao, P.; Ye, N.; Zhang, X.; Cheng, Y. Snow grain-size estimation over mountainous areas from modis imagery. IEEE Geosci. Remote Sens. Lett. 2018, 15, 97–101. [Google Scholar] [CrossRef]
- Hu, R.J. The Natural Geography of Tianshan Mountain in China; China Environmental Science Press: Beijing, China, 2004. [Google Scholar]
- Yang, Z.N. Glacier Water Resources in China; Gansu Science and Technology Press: Lanzhou, China, 1991. [Google Scholar]
- Reuter, H.I.; Nelson, A.; Jarvis, A. An evaluation of void filling interpolation methods for srtm data. Int. J. Geogr. Inf. Sci. 2007, 21, 983–1008. [Google Scholar] [CrossRef]
- Vermote, E.F.; Tanré, D.; Deuze, J.L.; Herman, M.; Morcrette, J.J. Second simulation of the satellite signal in the solar spectrum, 6s: An overview. IEEE Trans. Geosci. Remote Sens. 1997, 35, 675–686. [Google Scholar] [CrossRef]
- Kokhanovsky, A.A.; Zege, E.P. Scattering optics of snow. Appl. Opt. 2004, 43, 1589–1602. [Google Scholar] [CrossRef] [PubMed]
- Barth, E.L. Cloud formation along mountain ridges on Titan. Planet. Space Sci. 2010, 58, 1740–1747. [Google Scholar] [CrossRef]
- Chow, F.K.; Wekker, S.F.J.D.; Snyder, B.J. Mountain Weather Research and Forecasting; Springer: Dordrecht, The Netherlands, 2013. [Google Scholar]
- Huang, X.; Deng, J.; Wang, W.; Feng, Q.; Liang, T. Impact of climate and elevation on snow cover using integrated remote sensing snow products in Tibetan Plateau. Remote Sens. Environ. 2017, 190, 274–288. [Google Scholar] [CrossRef]
- Wilson, A.M.; Parmentier, B.; Jetz, W. Systematic land cover bias in collection 5 modis cloud mask and derived products—A global overview. Remote Sens. Environ. 2014, 141, 149–154. [Google Scholar] [CrossRef]
- Deng, J.; Huang, X.; Feng, Q.; Ma, X.; Liang, T. Toward improved daily cloud-free fractional snow cover mapping with multi-source remote sensing data in China. Remote Sens. 2015, 7, 6986–7006. [Google Scholar] [CrossRef]
- Dong, C.; Menzel, L. Producing cloud-free modis snow cover products with conditional probability interpolation and meteorological data. Remote Sens. Environ. 2016, 186, 439–451. [Google Scholar] [CrossRef]
- Laiti, L.; Giovannini, L.; Zardi, D.; Belluardo, G.; Moser, D. Estimating hourly beam and diffuse solar radiation in an alpine valley: A critical assessment of decomposition models. Atmosphere 2018, 9, 117. [Google Scholar] [CrossRef]
- Tong, J.; Déry, S.J.; Jackson, P.L. Topographic control of snow distribution in an alpine watershed of western Canada inferred from spatially-filtered modis snow products. Hydrol. Earth Syst. Sci. 2009, 13, 319–326. [Google Scholar] [CrossRef]
Figure 1.
Geographical location and topographic relief of the study area.

Figure 2.
Hypsometric curve of the study area.

Figure 3.
Precipitation records at 18 meteorological stations around the study area on selected days.
Figure 3.
Precipitation records at 18 meteorological stations around the study area on selected days.

Figure 4.
Detection results for single snowfall events.

Figure 5.
Detecting the results of Type 1 (left), Type 2 (center) and combined (right) snowfall events in each quarter during July 2014 to June 2015.
Figure 5.
Detecting the results of Type 1 (left), Type 2 (center) and combined (right) snowfall events in each quarter during July 2014 to June 2015.

Figure 6.
Snowfall events detection results for Type 1 (left), Type 2 (center) and combined (right) for the entire hydrological year, July 2014 to June 2015.
Figure 6.
Snowfall events detection results for Type 1 (left), Type 2 (center) and combined (right) for the entire hydrological year, July 2014 to June 2015.

Figure 7.
GPM precipitation product (left), GPM ice precipitation product (center) and detected snowfall events (right) in September 2014.
Figure 7.
GPM precipitation product (left), GPM ice precipitation product (center) and detected snowfall events (right) in September 2014.


Table 1.
Location and elevation of meteorological stations around the study area, and the number of recorded precipitation events (PE) from July 2014 to June 2015.
Table 1.
Location and elevation of meteorological stations around the study area, and the number of recorded precipitation events (PE) from July 2014 to June 2015.
| Station | Longitude (°N) | Latitude (°E) | Altitude (m) | PE | Station | Longitude (°N) | Latitude (°E) | Altitude (m) | PE |
|---|---|---|---|---|---|---|---|---|---|
| Caijiahu | 44.20 | 87.53 | 441.0 | 75 | Miquan | 43.58 | 87.39 | 601.2 | 94 |
| Shihezi | 44.32 | 86.05 | 443.7 | 70 | Urumchi | 43.78 | 87.62 | 918.7 | 88 |
| Ulanwusu | 44.28 | 85.82 | 469.0 | 98 | Xinyuan | 43.45 | 83.30 | 929.1 | 133 |
| Manas | 44.32 | 86.20 | 472.2 | 87 | Hejing | 42.32 | 86.40 | 1102.0 | 78 |
| Wusu | 44.43 | 84.67 | 478.3 | 110 | Baluntai | 42.73 | 86.30 | 1738.3 | 74 |
| Shawan | 44.33 | 85.62 | 523.2 | 105 | Xiaoquzi | 43.57 | 87.10 | 2161.0 | 118 |
| Hutubi | 44.13 | 86.82 | 523.5 | 85 | Mushizhan | 43.28 | 87.12 | 2355.6 | 121 |
| Fukang | 44.17 | 87.92 | 567.9 | 86 | Bayanbulak | 43.03 | 84.15 | 2458.9 | 108 |
| Changji | 44.02 | 87.43 | 579.3 | 79 | Xidagou | 43.10 | 86.83 | 3543.8 | 109 |
© 2018 by the authors. Licensee MDPI, Basel, Switzerland. This article is an open access article distributed under the terms and conditions of the Creative Commons Attribution (CC BY) license (http://creativecommons.org/licenses/by/4.0/).
Share and Cite
MDPI and ACS Style
Wang, J.; Zhang, Y.; Cheng, Y.; Zhang, X.; Feng, X.; Huang, W.; Zhou, H. Detecting Snowfall Events over Mountainous Areas Using Optical Imagery. Water 2018, 10, 1514. https://doi.org/10.3390/w10111514
AMA Style
Wang J, Zhang Y, Cheng Y, Zhang X, Feng X, Huang W, Zhou H. Detecting Snowfall Events over Mountainous Areas Using Optical Imagery. Water. 2018; 10(11):1514. https://doi.org/10.3390/w10111514
Chicago/Turabian StyleWang, Jiangeng, Yonghong Zhang, Yinyi Cheng, Xueliang Zhang, Xuezhi Feng, Wei Huang, and Hao Zhou. 2018. "Detecting Snowfall Events over Mountainous Areas Using Optical Imagery" Water 10, no. 11: 1514. https://doi.org/10.3390/w10111514
Note that from the first issue of 2016, this journal uses article numbers instead of page numbers. See further details here.