Estimation of River Management Flow Considering Stream Water Deficit Characteristics


1
Han River Flood Control Office, Ministry of Environment, Seoul 06501, Korea
2
Institute of Engineering Research, Seoul National University, Seoul 08826, Korea
*
Author to whom correspondence should be addressed.
Water 2018, 10(11), 1521; https://doi.org/10.3390/w10111521
Submission received: 5 September 2018
/
Revised: 24 October 2018
/
Accepted: 25 October 2018
/
Published: 26 October 2018
(This article belongs to the Special Issue Water Allocation in Rural Area: Economic Influences and Better Management)
Abstract
:South Korea endured extreme drought through 2015 and 2016. This hydrological drought led to a socio-economic drought which is a restriction on stream water use. Previous studies have explored streamflow drought using a threshold level based on flow duration curves, but streamflow drought does not necessarily lead to stream water deficit, which is related to water demand. Therefore, this study introduced a threshold for stream water deficit in South Korea, which is termed as river management flow, and was applied to Geum River Basin where a severe drought recently occurred. The stream water coordination council has restricted the use of stream water to cope with the stream water deficit. The deficit characteristics for the upstream and downstream river management flow should be similar in order to ensure the feasibility of stream water restrictions. Thus, upstream and downstream river management flows, which reproduced similar deficit characteristics to those of the reference site, were estimated. The deficit characteristics of Bugang and Gyuam were estimated from their river management flows for the 2015 drought and were comparable to those of Gongju. We expect this study to minimize the conflict between upstream and downstream water users in future.
1. Introduction
Hydrological drought is defined as a significant decrease in the availability of water in all its forms appearing in the land phase of the hydrological cycle [1]. To cope with the risk of droughts, a variety of hydrological drought indices are used to identify the start and end times of a drought and to evaluate drought phenomena such as severity and frequency [1,2,3,4,5,6,7,8]. Similarly, streamflow drought is generally defined by a threshold level based on the run theory by Yevjevich [9], which identifies the characteristics (duration, deficit, and magnitude) of droughts [10,11,12,13]. The seasonal, monthly, and daily threshold levels obtained from flow duration curves (FDCs) were associated with an anomalous deficit [7]. Because drought is defined as the condition when streamflow falls below the threshold, a cautious approach for the appropriate threshold level is required [12,14,15].
Streamflow and socio-economic droughts are closely related to the deficit in stream water necessary for socio-economic activities. In particular, stream water deficit (SWD) has an influence on socio-economic activities such as hydroelectricity production and recreation [16]. Thus, assessment of SWD is necessary not only for estimation of the statistical threshold using FDCs, but also for that of the threshold considering stream water use (SWU). Sung and Chung [13] proposed a severity-duration-frequency curve for SWD using threshold levels based on water demand. In their study, Sung and Chung [13] calculated SWD assuming that the desired yield of the dam was based on the demand of stream water [17]. However, the use of stream water in South Korea depends on contracts with dams and the permission of users of the stream water. Because the permission for stream water comprises more than 70% of the total SWU, SWU must be considered in the calculation of SWD.
The permission for SWU is given based on a standard watershed. River management flow (RMF), which is the threshold level for SWDs, is also calculated for each standard watershed. However, SWD is related to streamflow and RMF, such that the RMF at a site where streamflow is observed is necessary. Therefore, at a site where the outlet of the standard watershed and that of the observation site do not coincide, the RMF should be appropriately processed at a nearby observation site. A stream is continuous from upstream to the downstream, and a deficit or surplus in the upstream is propagated downstream, thereby creating the need for a balanced operation of upstream and downstream flows.
A stream is public property, and everyone has the right to use it equitably. In South Korea, the stream water coordination council (SWCC) has the authority to adjust SWU upstream and downstream to cope with SWD. Therefore, to secure the reliability and validity of adjusting SWU, the SWD should be managed equitably via RMF to reproduce similar deficit upstream and downstream. For this purpose, it is necessary to utilize RMFs at other sites because of their spatial limit. To study adjustments in stream water flow, it is necessary to revisit the point-to-point transition of RMFs.
In this study, RMF was estimated, which is similar with the SWD characteristics at sites along a stream that are at high risk of drought. The RMFs were calculated based on permission for the use of stream water in a standard watershed, and the upstream and downstream flows, which have characteristics similar to those of SWDs, were applied to expanding the RMF at the observation site corresponding to the outlet of the standard watershed. Section 2 of this paper summarizes background theories on drought and deficit and introduces SWU and deficit management in South Korea. In Section 3 of this paper, calculation of RMF, considering stream water demand and transfer of the deficit characteristics, is presented.
2. Materials and Methods
2.1. Procedure
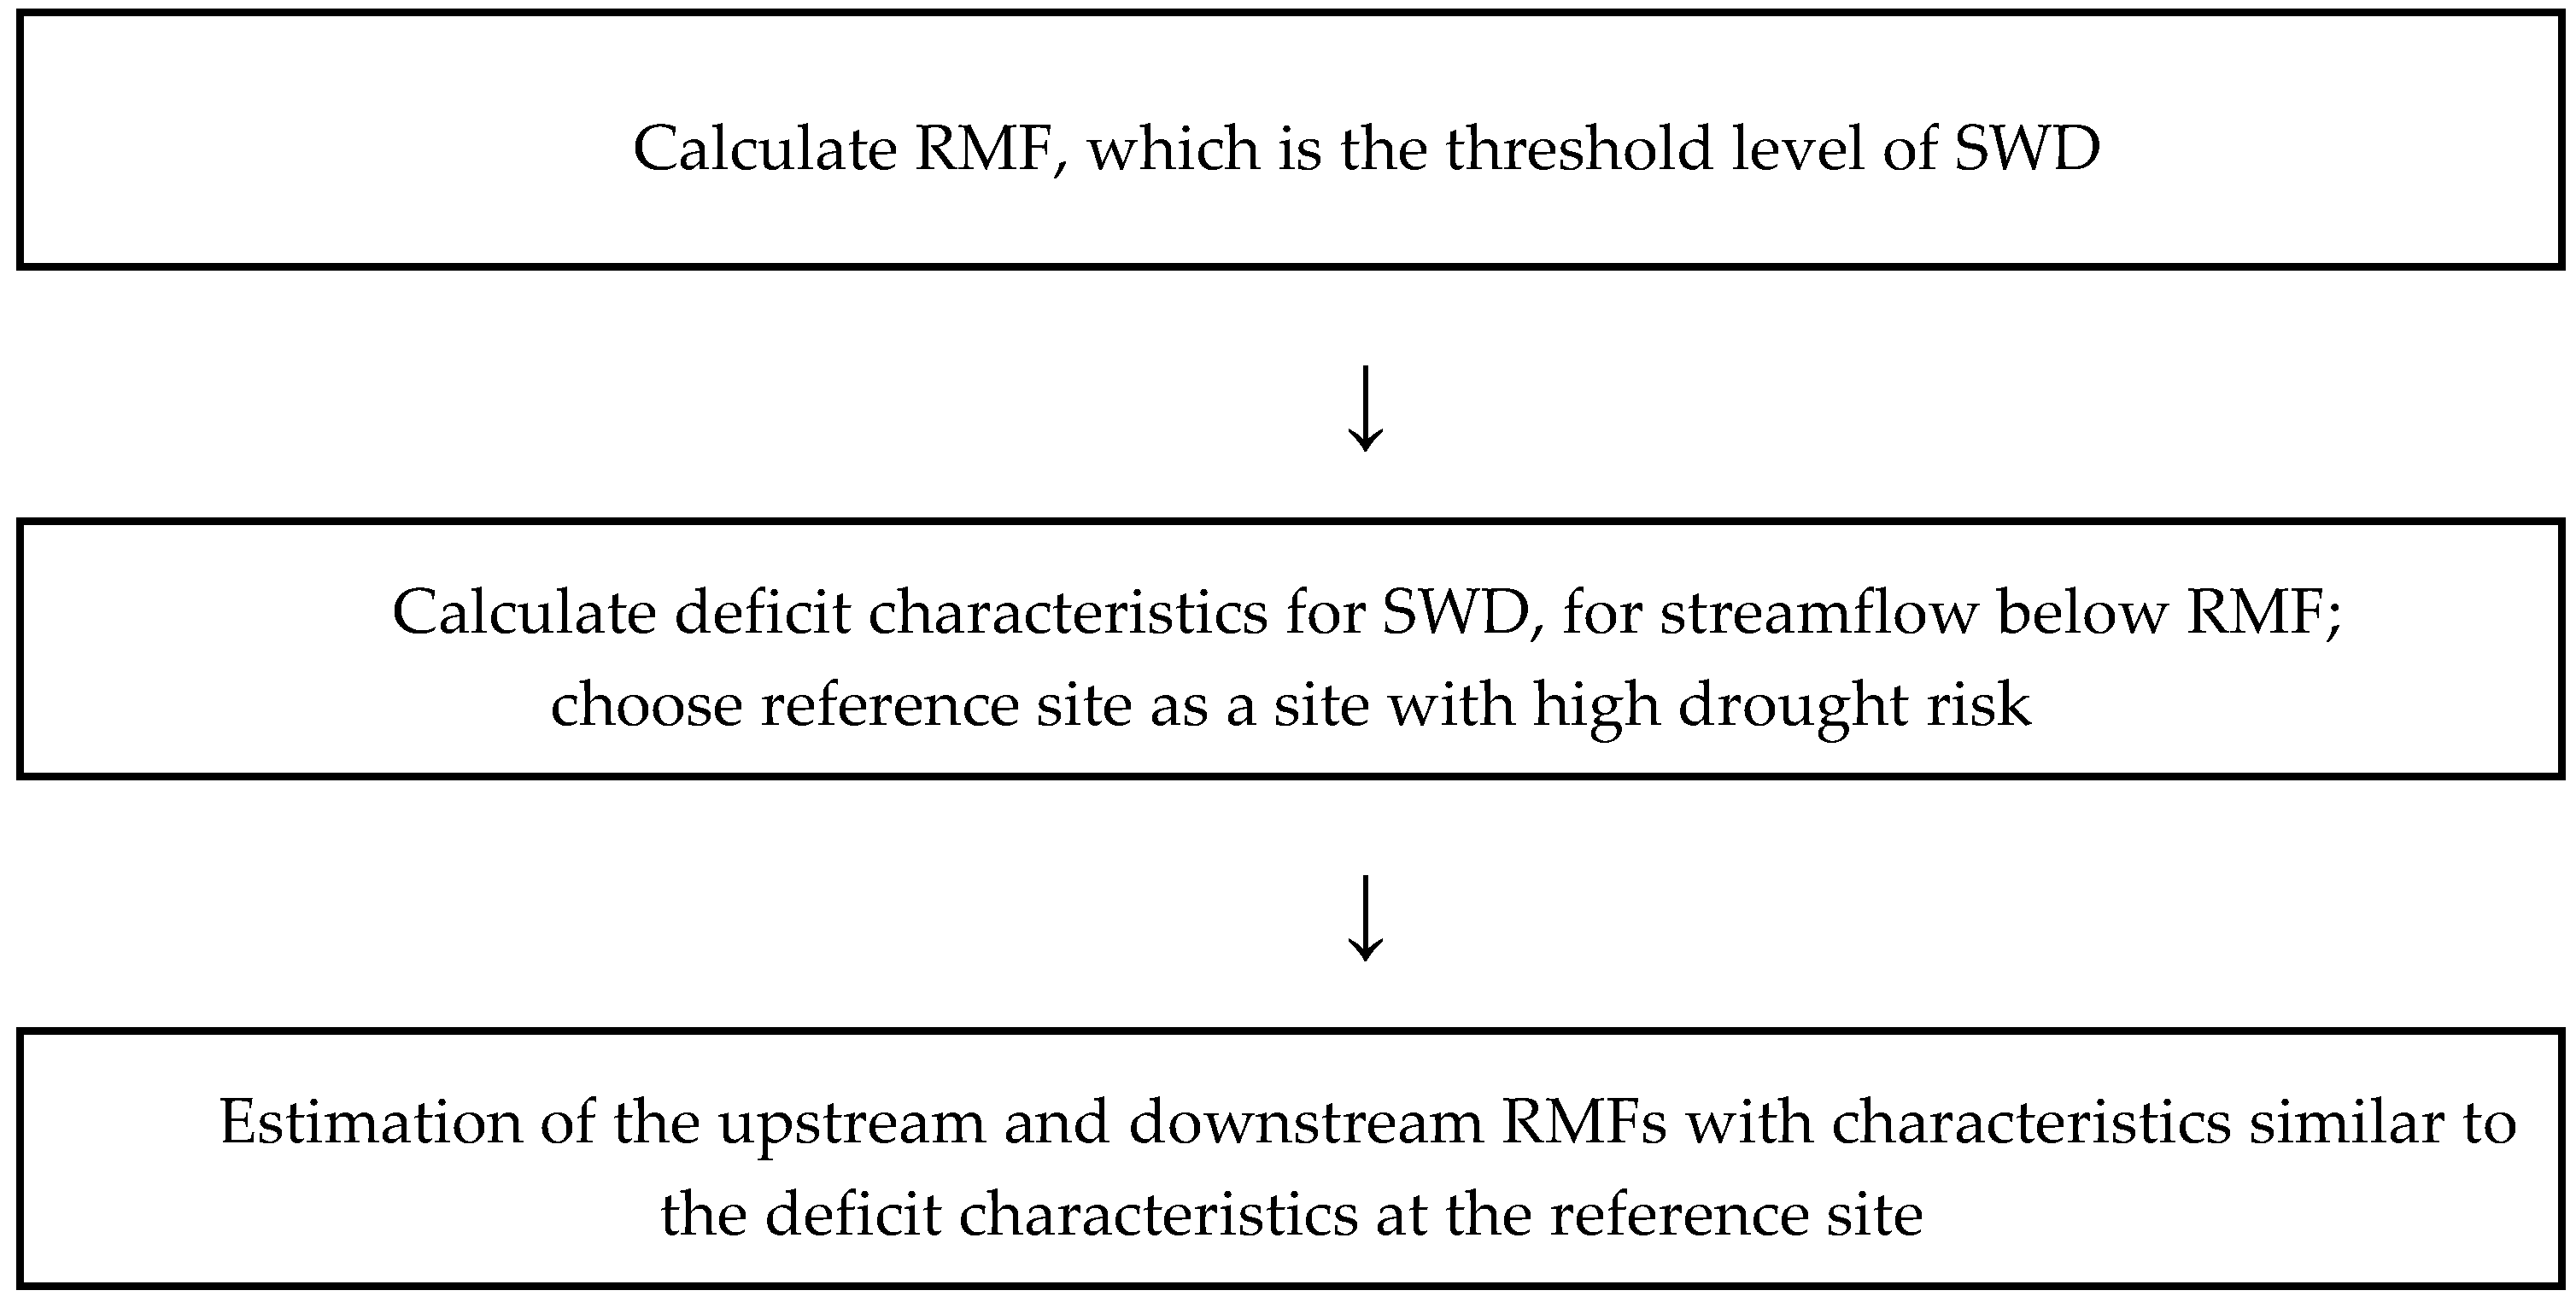
The methodology adopted in this study for the estimation of RMF by considering the characteristics of an SWD is represented by the flow chart in Figure 1.
The procedure is outlined below:
- The RMFs were calculated based on the permission for SWU of a standard watershed in Geum River Basin.
- The RMFs of other sites were estimated by transferring the deficit characteristics of the site at high risk. First, the Drought Severity Index (DSI), representing the deficit characteristics, was calculated for a standard watershed. Second, a site with high drought risk was chosen as the reference site.
- The upstream and downstream RMFs of the reference site were estimated such that the characteristics of the reference site could be similarly reproduced. The RMF during either the irrigation or non-irrigation period was fixed, and the RMF during the other non-irrigation or the irrigation period was changed, which minimized the difference in the DSI of the reference site.
2.2. Study Area
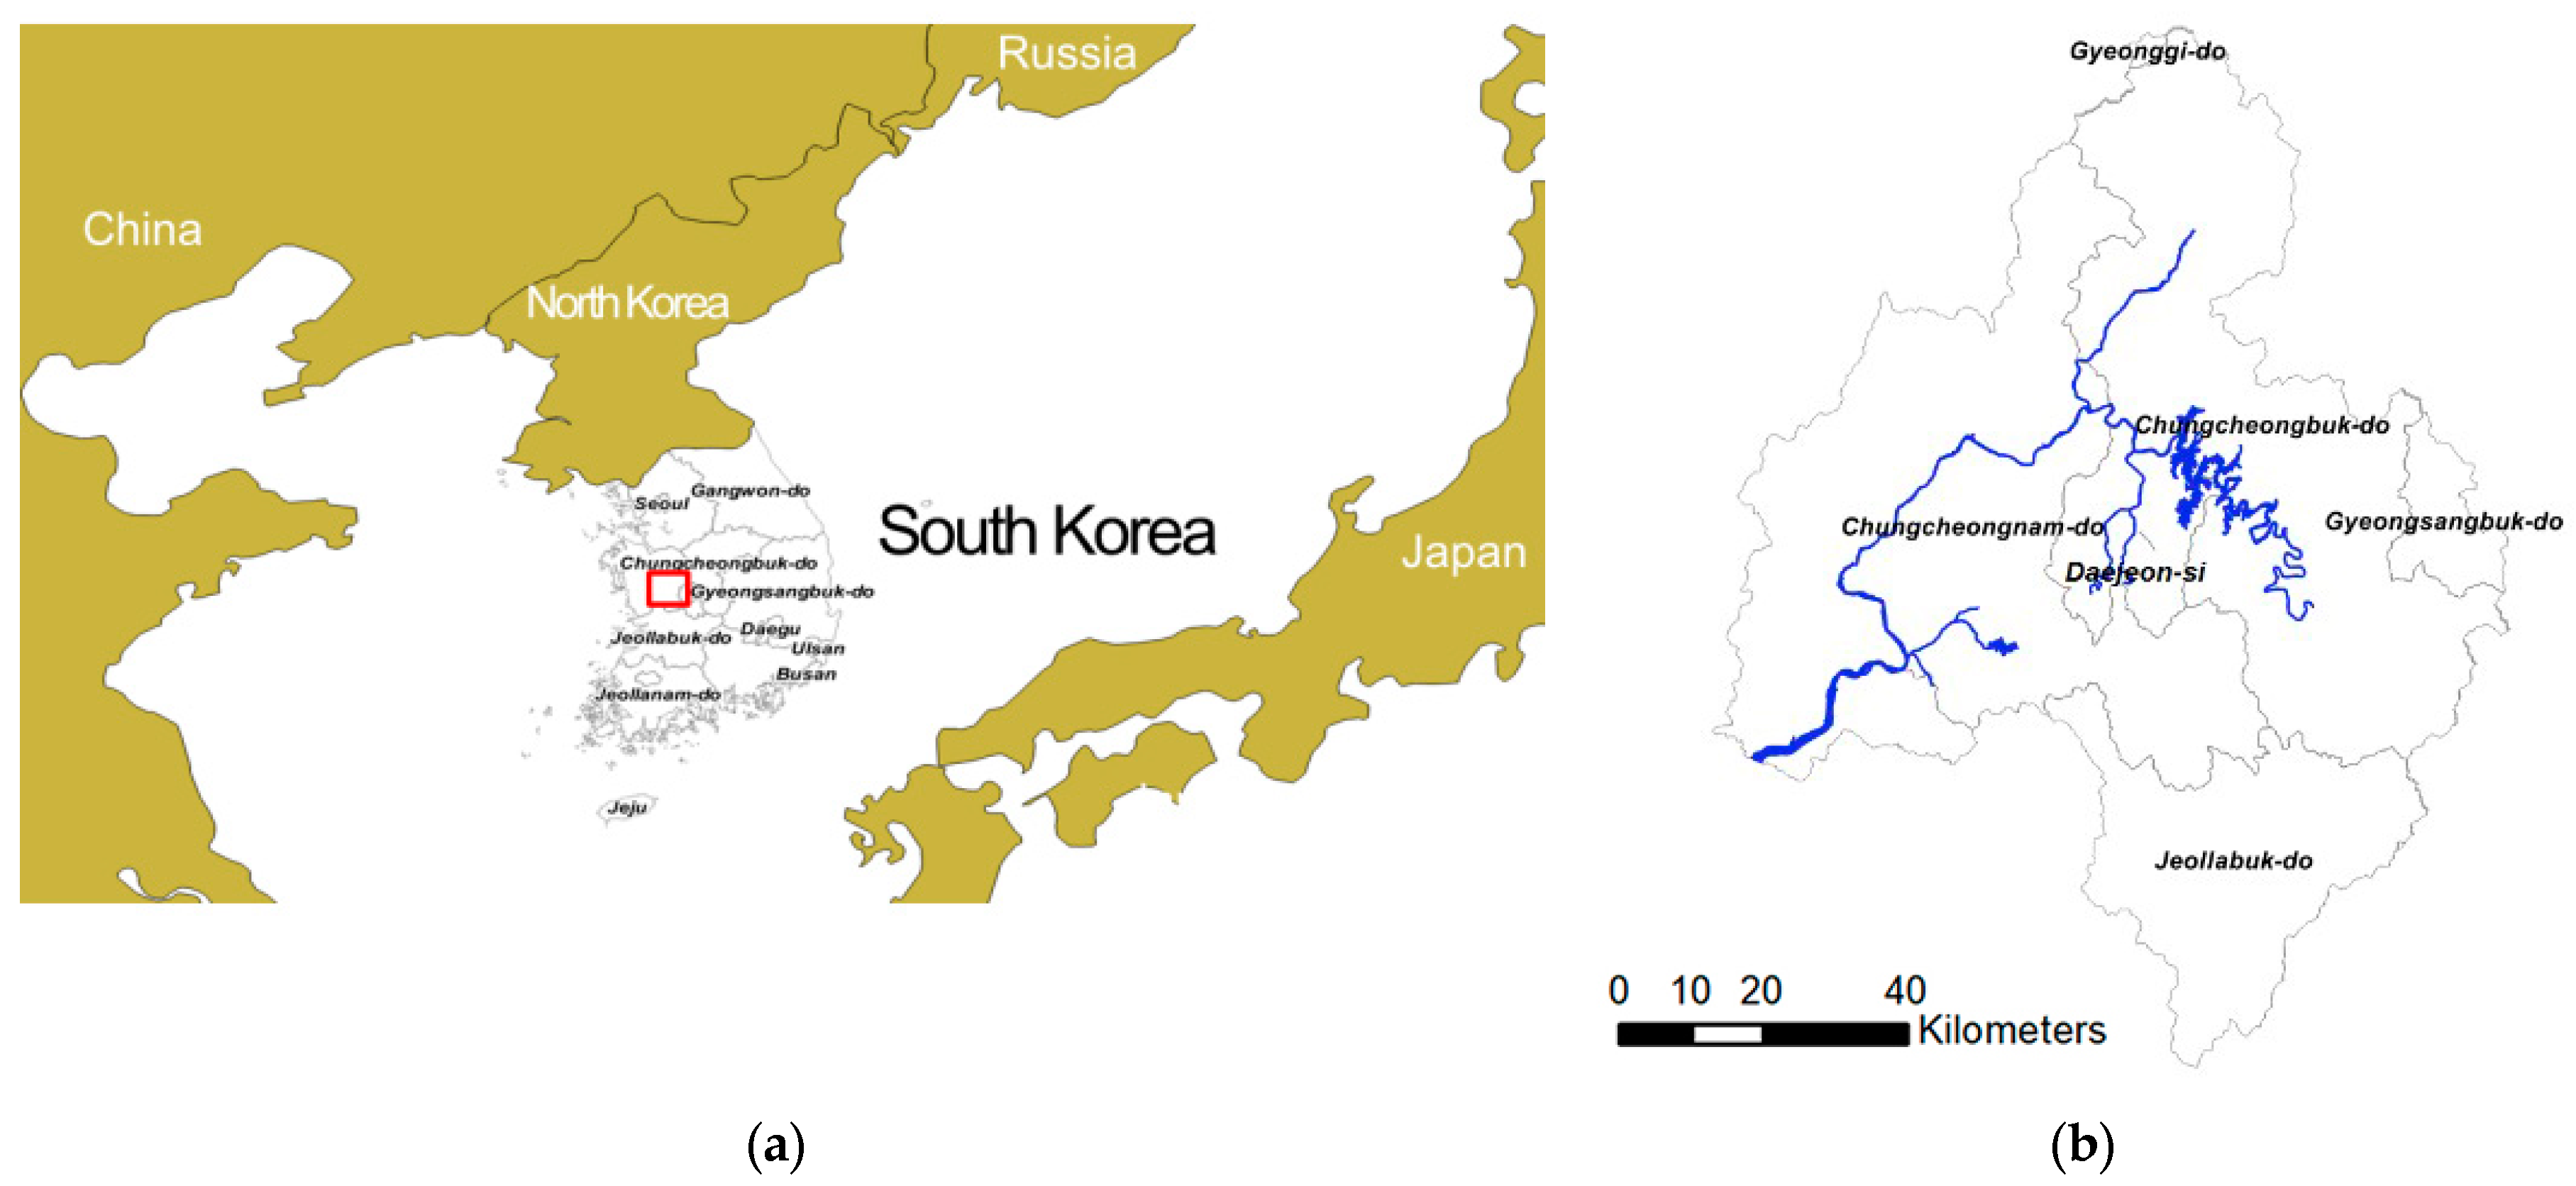
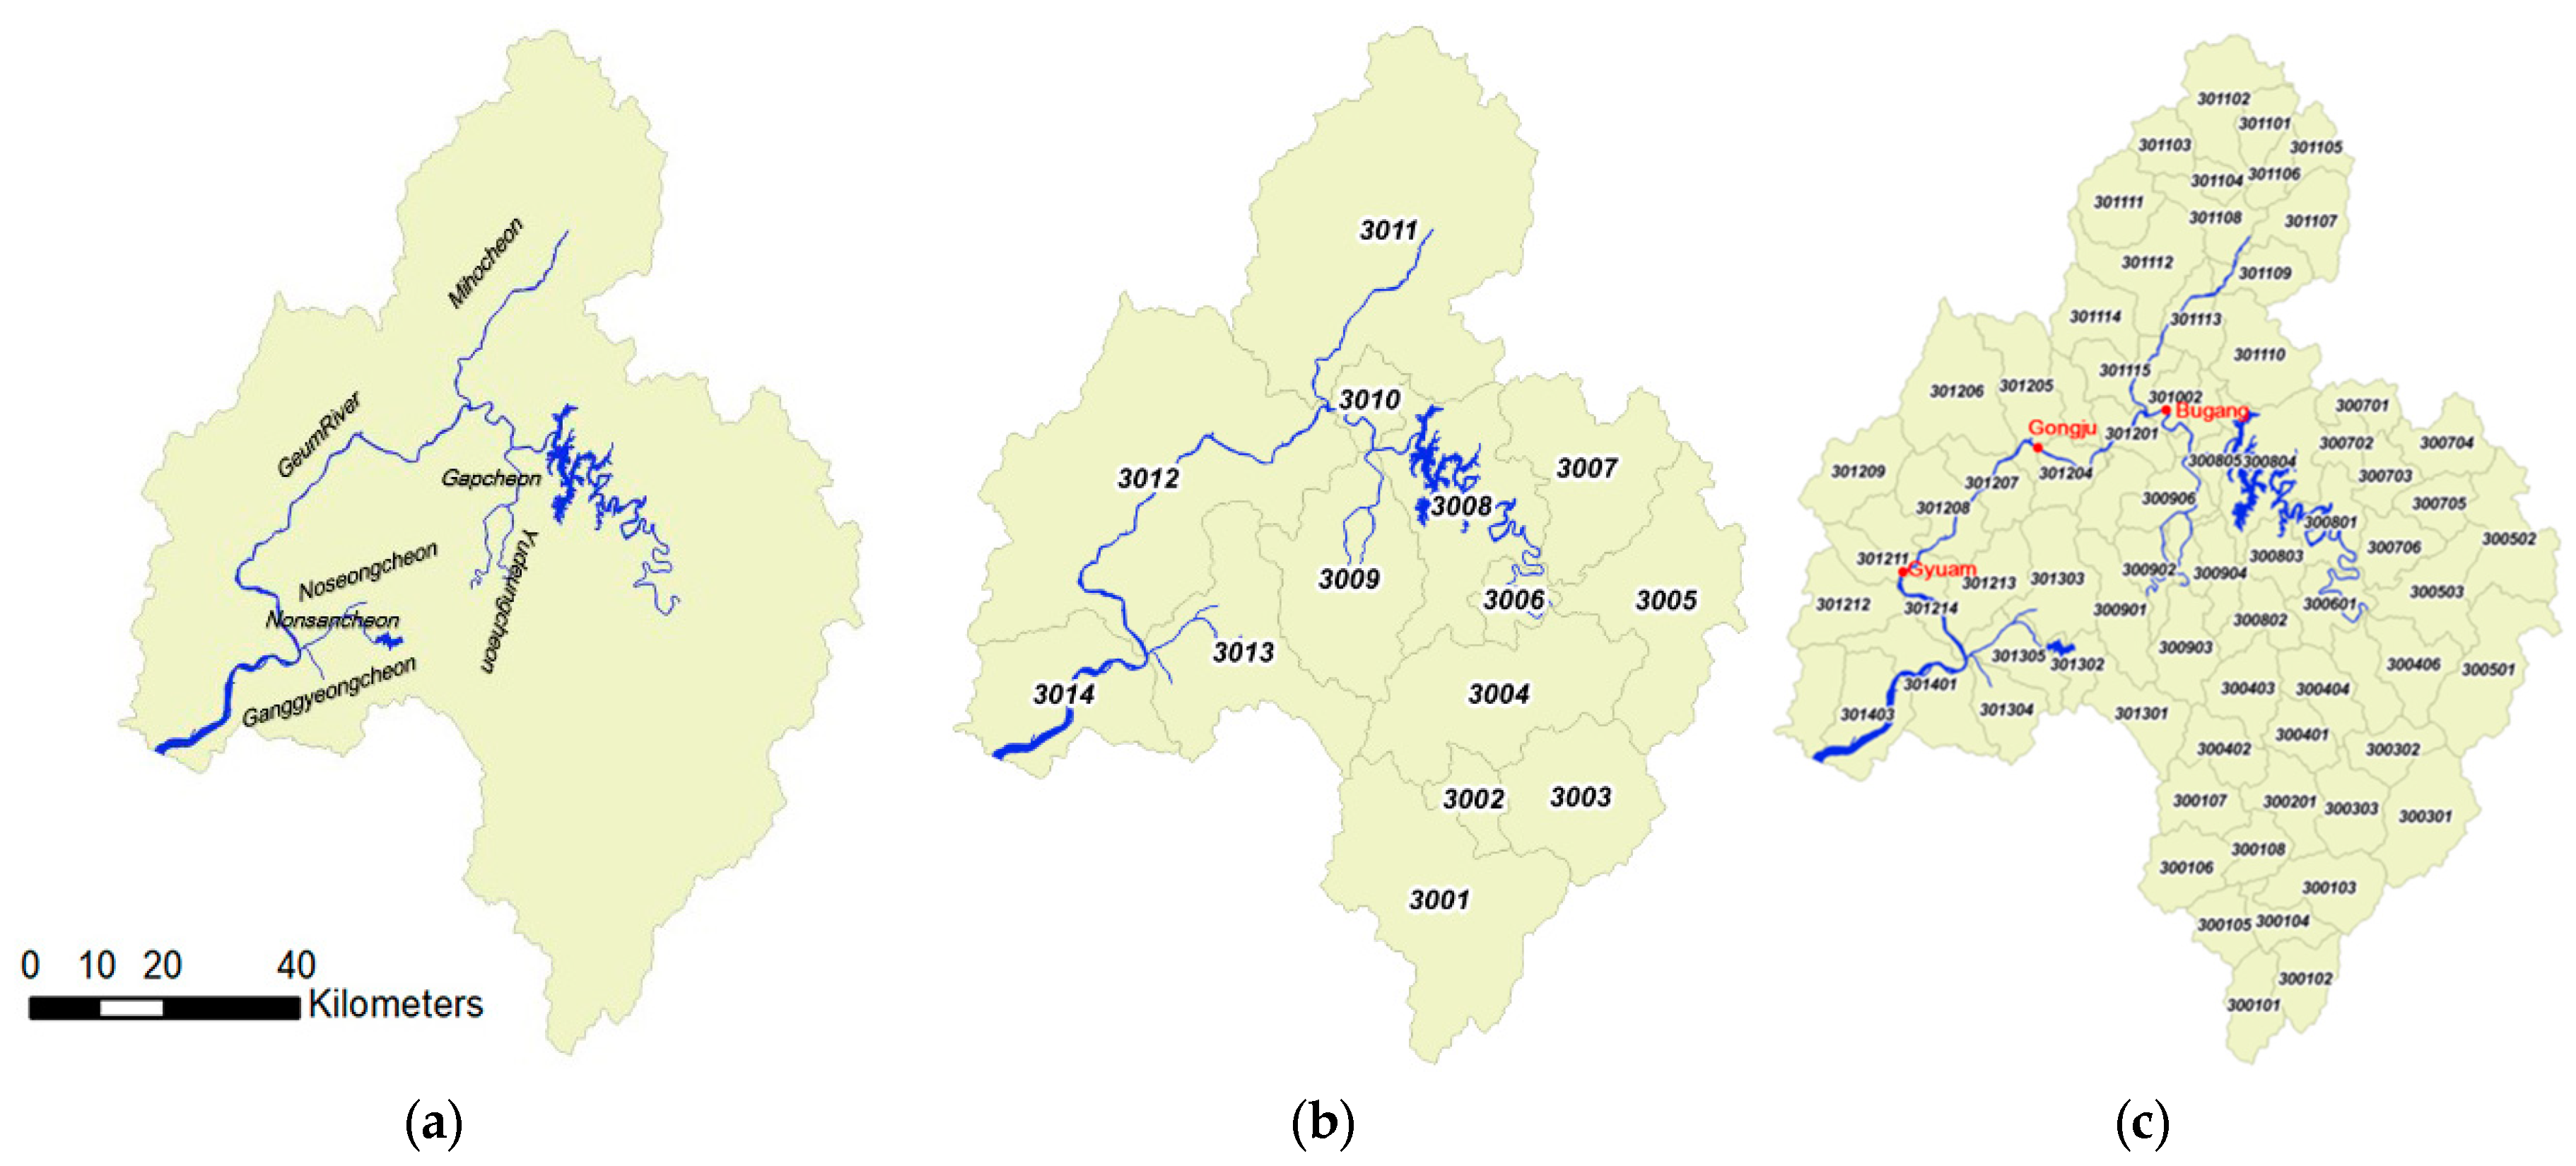
In South Korea, 50–60% of the annual precipitation is concentrated in the summer, which results in floods during the summer and droughts during other seasons. The Geum River Basin is in central South Korea (Figure 2a). The watershed area of the basin is 9911.8 km2 (Figure 2b). Although streamflow is typically high in the river, there is growing concern regarding drought because of the recent decrease in precipitation (Figure 3a). The average annual precipitation in the Geum River Basin is 1271.5 mm, and precipitation during the last 2 years has been 830.5 and 1163.1 mm, respectively. Particularly, precipitation during the summer is decreasing. The precipitations in August 2015 and August 2016 were 68.8 and 68.3 mm, respectively, which was about 28% of the normal level (246.7 mm), and the precipitations in July 2015 and July 2016 were 54% and 45% of the normal level, respectively. The monthly streamflow at Gongju along the Geum River Basin varies considerably, and the streamflow during August 2015 and August 2016 was approximately 21% of the normal streamflow (Figure 3b). This was because precipitation during the rainy season was very low during August 2015 and 2016, and typhoons did not make landfall. In South Korea, for the purpose of common use amongst government agencies and individuals, the whole country is divided into large, medium, and standard watersheds. Figure 4a–c shows the large, medium, and standard watersheds of the Geum River Basin. The Geum River Basin is composed of 1 large, 14 medium, and 78 standard watersheds.
2.3. Threshold Level Method
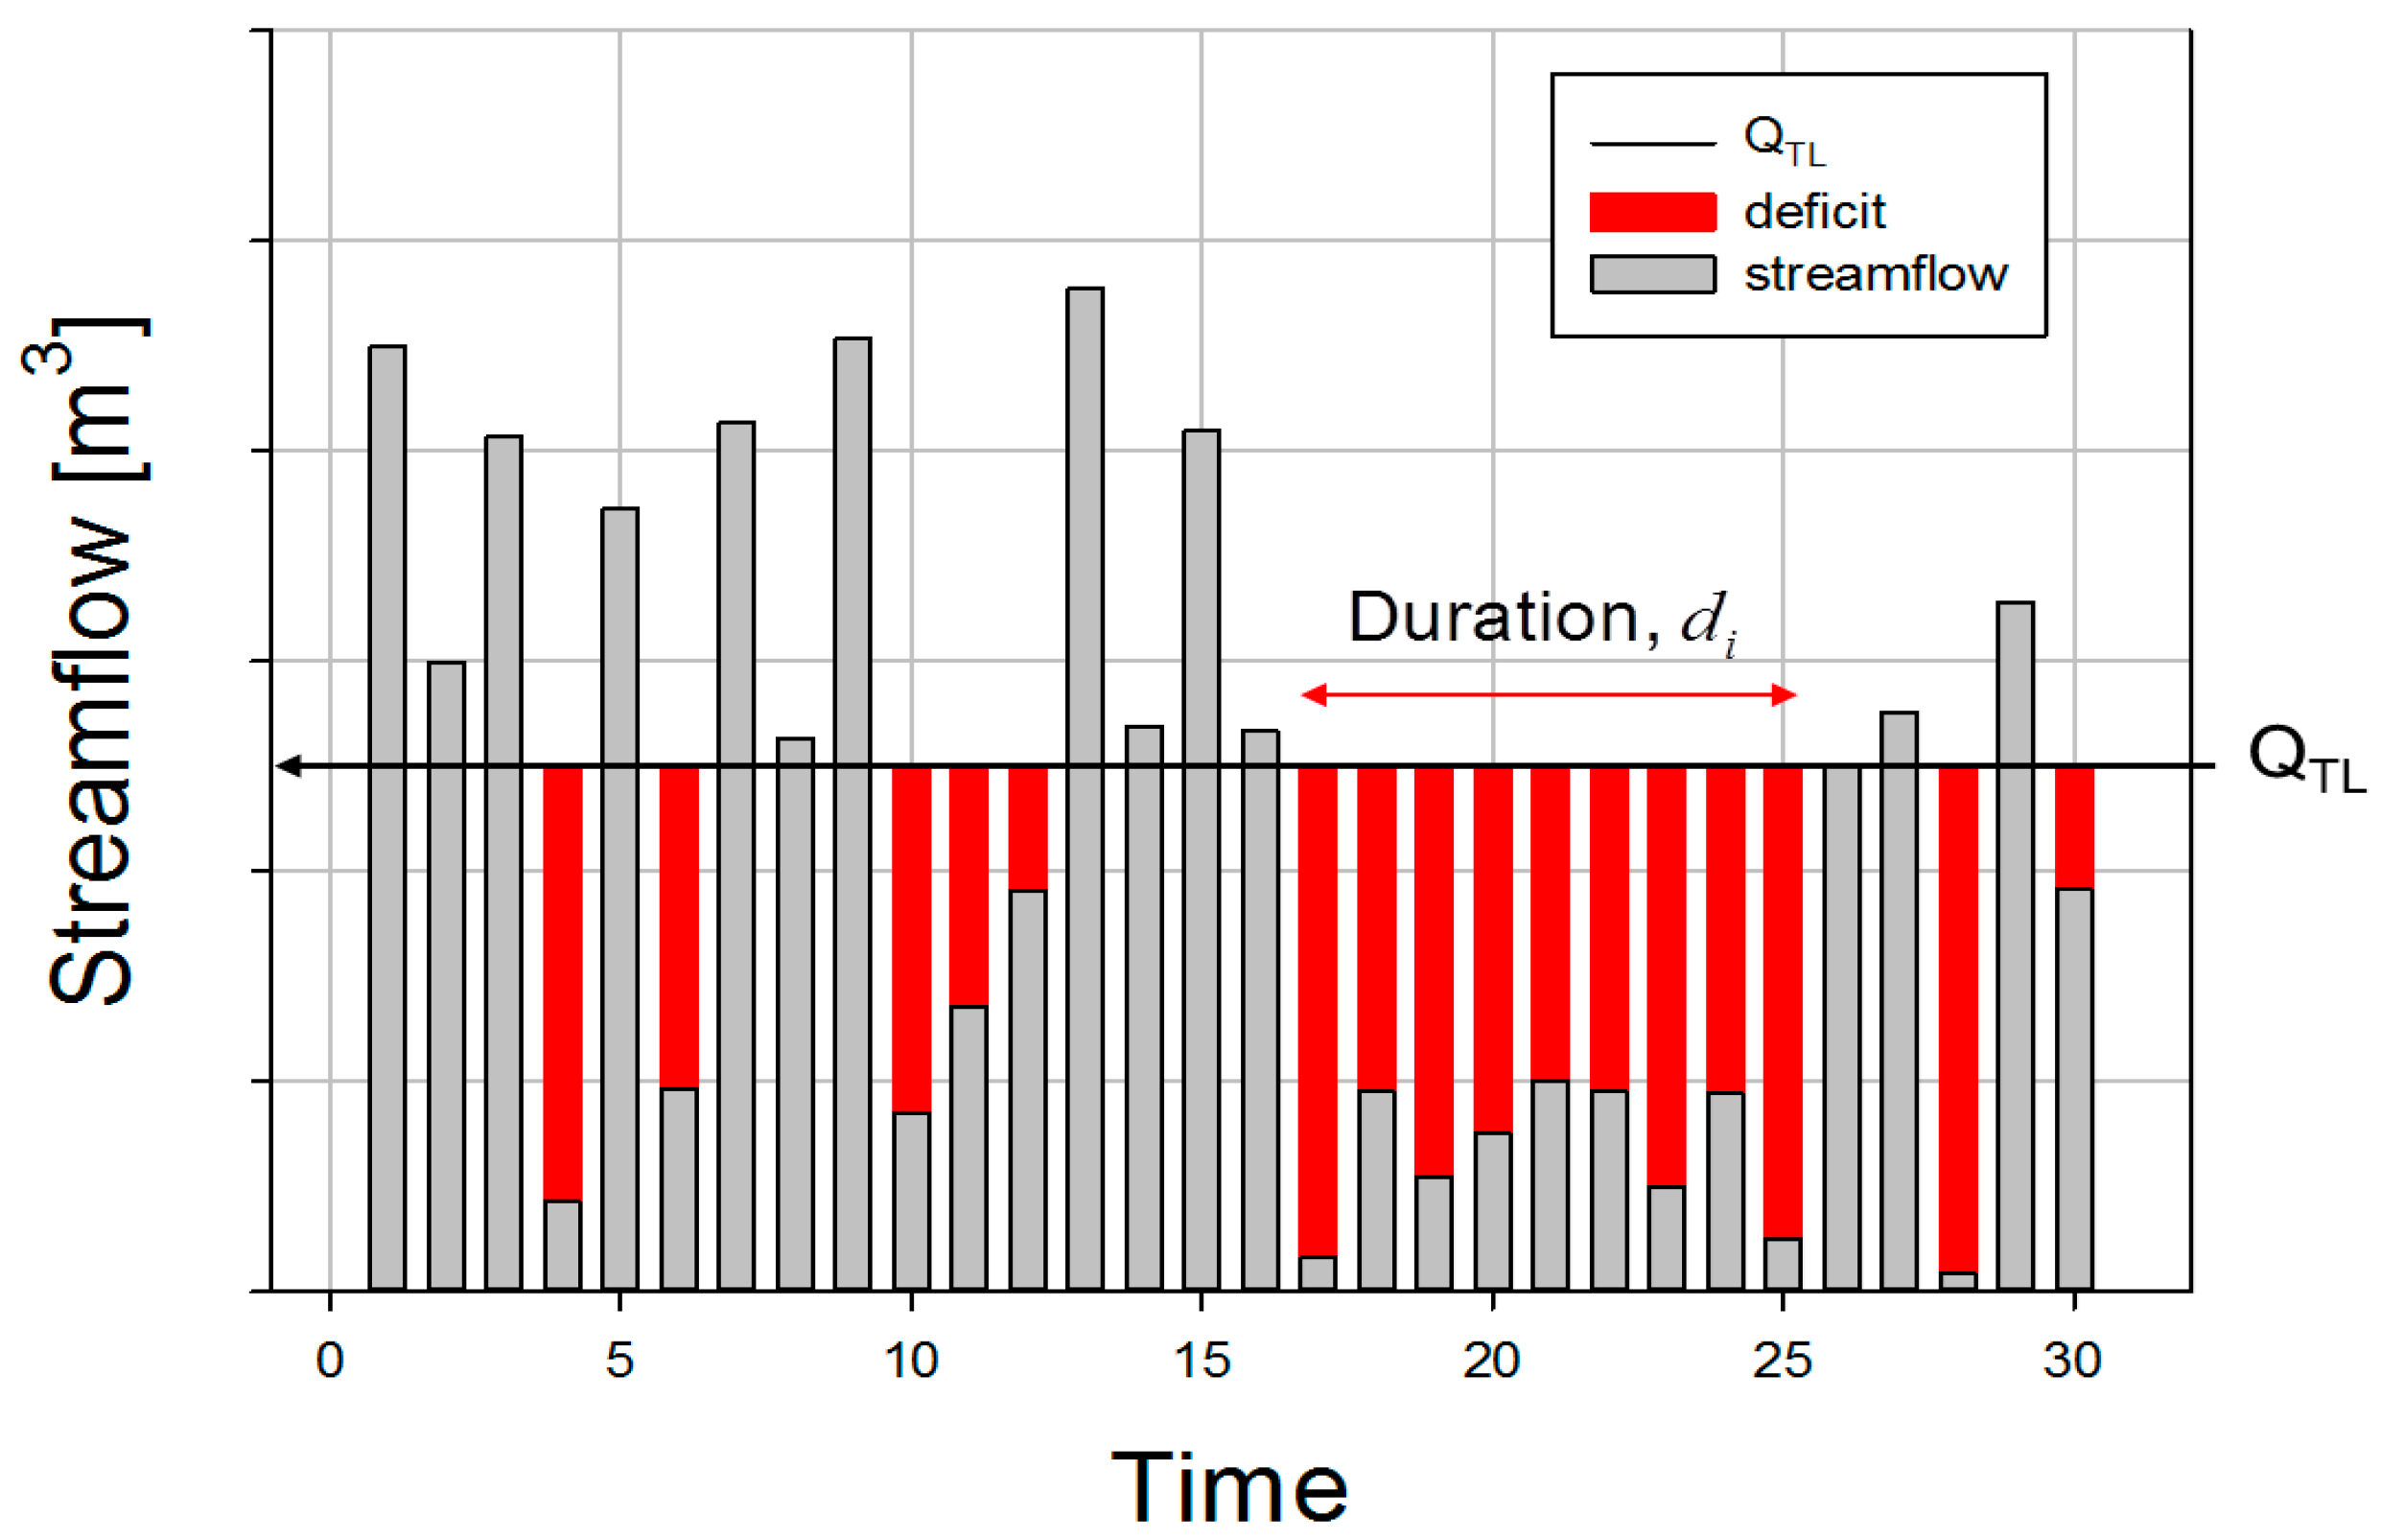
The threshold level method can easily obtain the start and the end times of a drought or streamflow deficit period, and has been used to define streamflow droughts or deficits (Figure 5). A drought starts when the streamflow falls below a threshold level, and the drought recovers when the streamflow returns above the threshold level. The duration (run-length, di), total deficit (run-sum, vi) which is the sum of the monthly deficits, and magnitude (vi/di) of each drought event can be readily obtained (Figure 5). Because South Korea has a large monthly variation in streamflow, the temporal resolution for drought analysis should be shorter than 1 month, but measuring the daily streamflow makes it difficult to ensure independence among droughts. Thus, for independence, pooling methods, such as moving average (MA), sequential peak algorithm, and inter-event time and volume criterion, were necessary [10].
To assess the severity of drought events, Pandey et al. [12] proposed the drought severity index (DSI) (Equation (1)). Generally, the main characteristics of drought are magnitude and duration. The DSI is categorized using the severity of a drought estimated based on its magnitude and duration. Equation (1) is as follows:
where Vd is the deficit streamflow volume for the duration of the drought event, VTL is the expected streamflow volume at the threshold level for the duration of the drought event, de is the duration of the independent drought event, and dm is the maximum duration of an independent drought event. In this study, DSI was used to define droughts as mild, moderate, severe, or extreme (Table 1).
2.4. Permission for SWU and RMF in South Korea
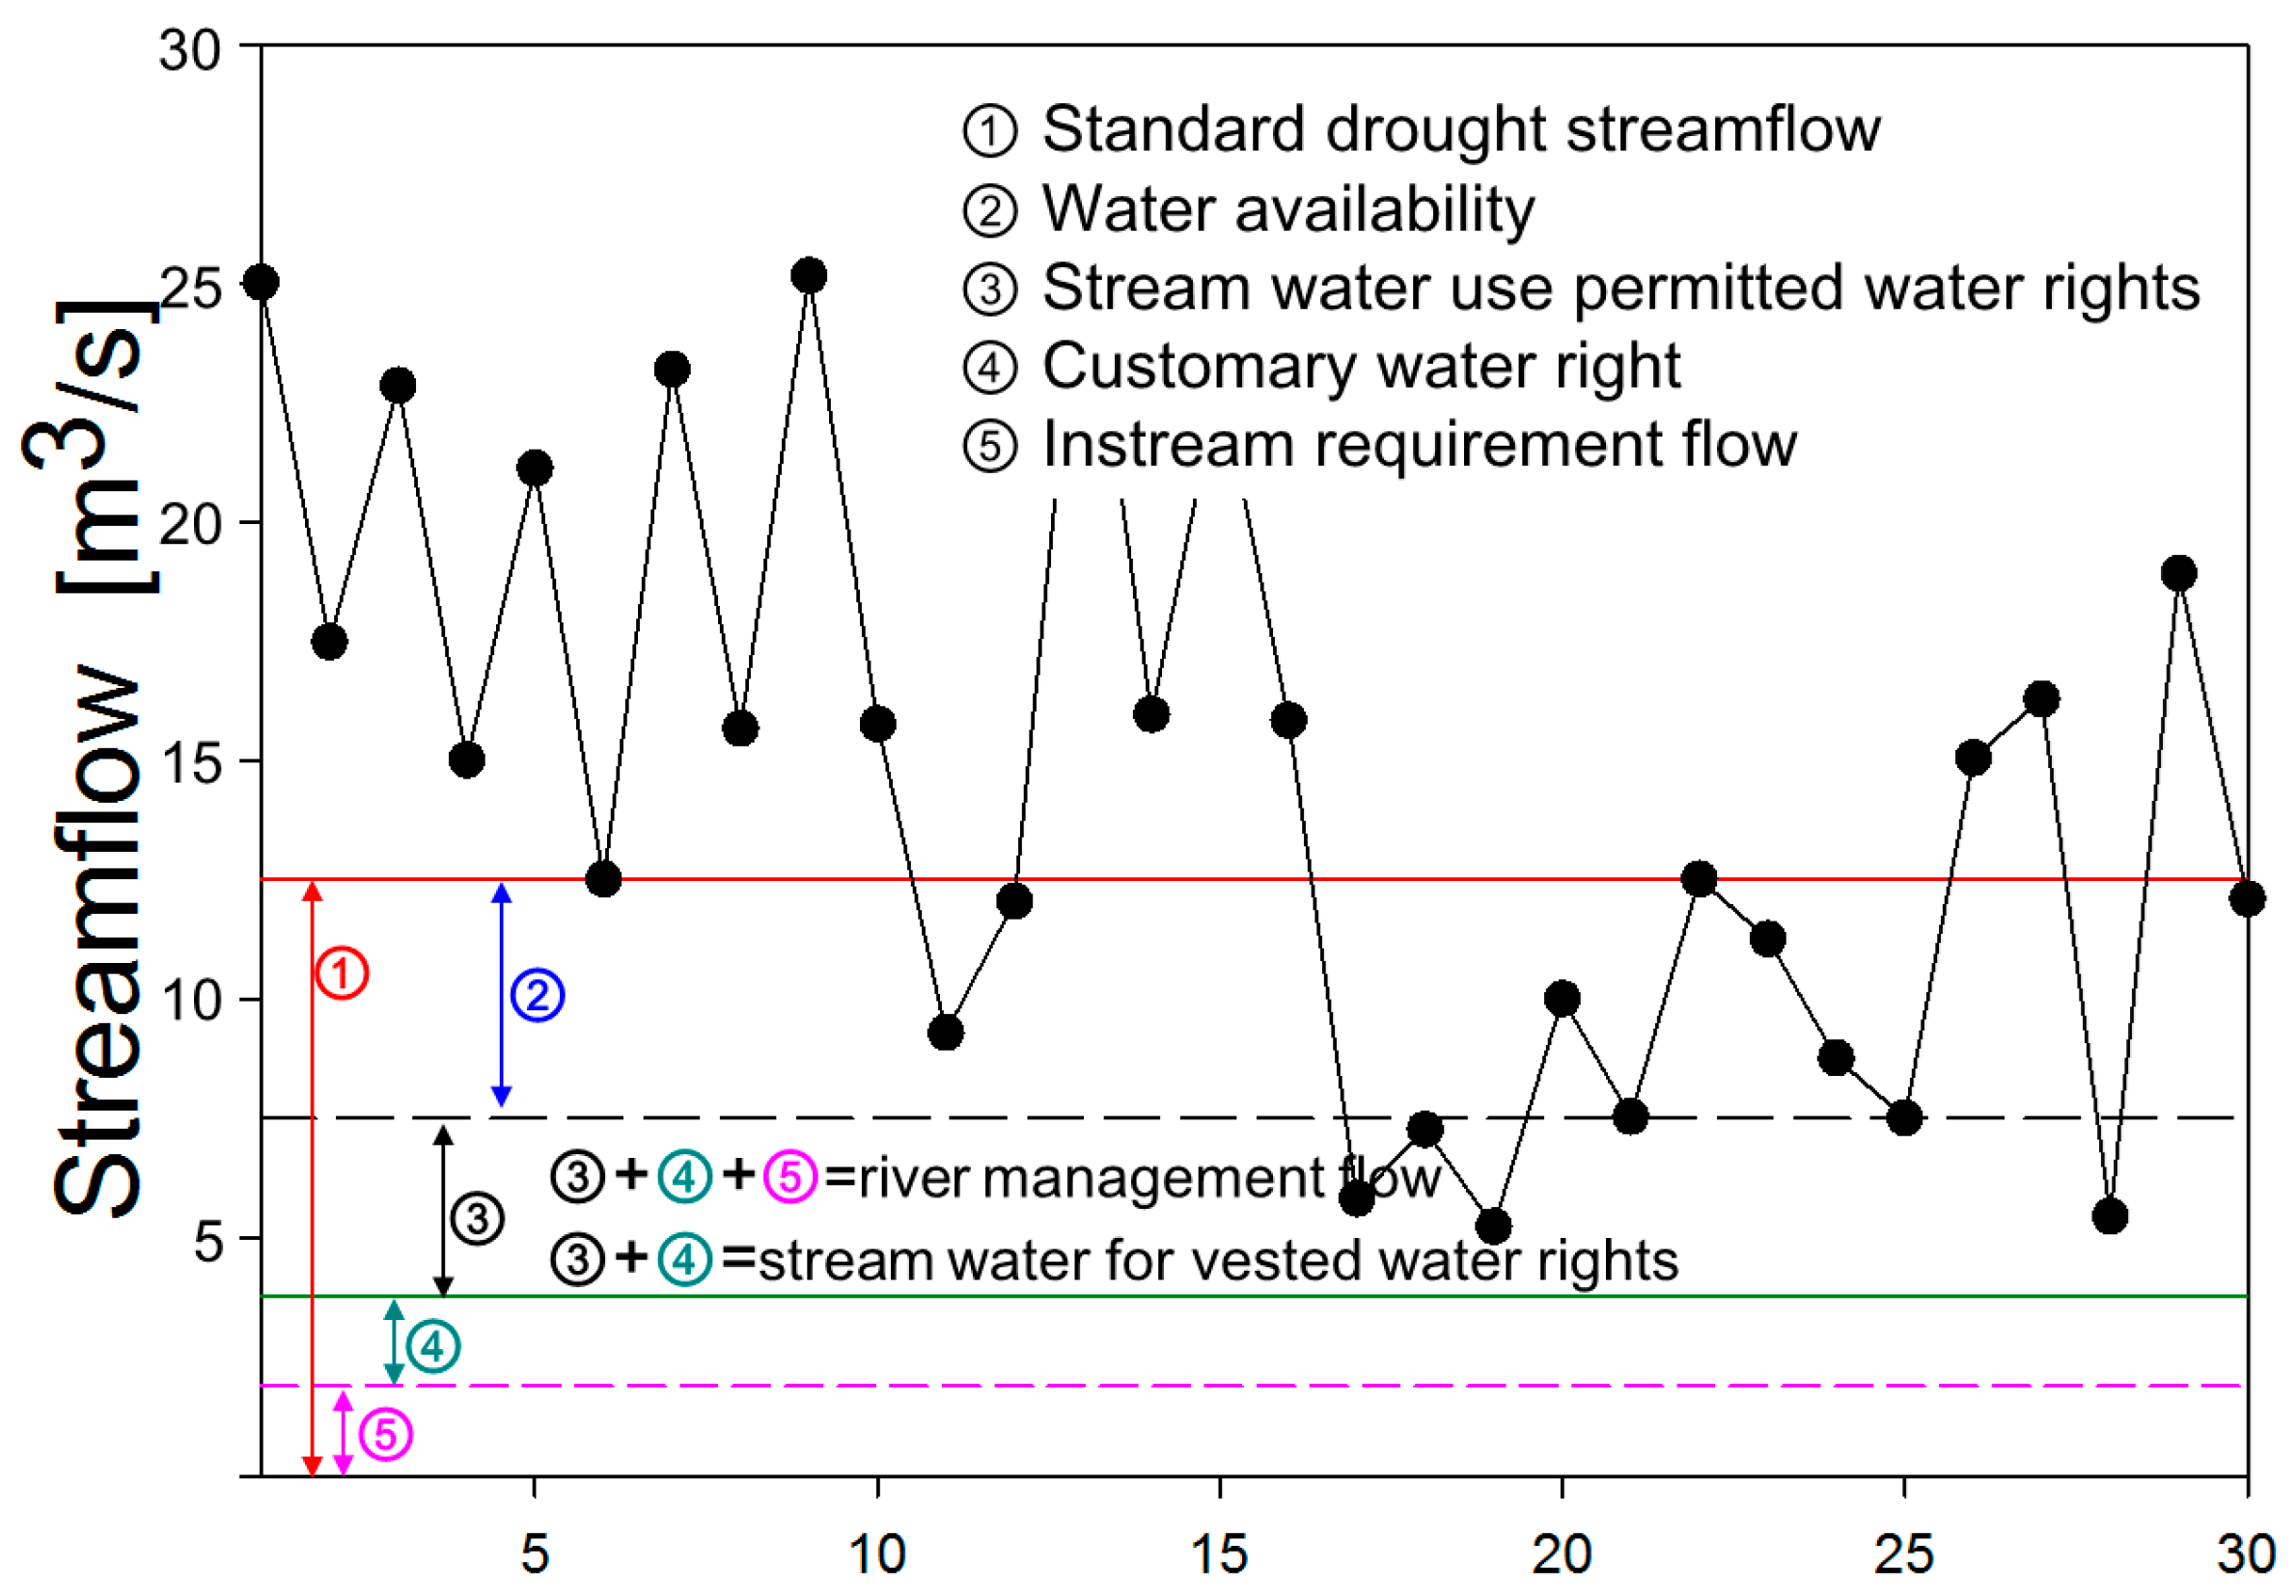
In this section, the river management system and the system of permission for SWU in South Korea is reviewed. The instream requirement flow (IRF; ⑤ in Figure 6) is the minimum streamflow required to maintain normal functioning of the river. The stream water intake is defined as the streamflow for vested water rights and is the sum of the customary water rights (④) and SWU permitted water rights (③). The standard drought streamflow (SDS; ①) is the 10-year frequency of the streamflow maintained for more than 355 days per year. The RMF (③ + ④ + ⑤) is the minimum streamflow required to meet the demand of SWU and maintain the normal functioning of the river, which is the threshold level for SWD. Water availability (② = ① − (③ + ④ + ⑤)) represents the new water rights, and is calculated by subtracting the RMF from the SDS, as shown in Equations (2)–(6).
IRF (m3/s) = minimum streamflow required to maintain the normal functioning of the river
Streamflow for vested water rights (m3/s) =
customary water rights + SWU permitted water rights
customary water rights + SWU permitted water rights
RMF (m3/s) = IRF + streamflow for vested water rights
SDS (m3/s) = 10-year frequency streamflow maintained for more than 355 days per year
Water availability (m3/s) = SDS − RMF
In South Korea, because of climatic variations, if stream water use is permitted based on Q95 (the 95-day exceedance flow) or Q185 (the 185-day exceedance flow), then an SWD is likely to occur for more than 9 months during the year. Thus, the upper limit of permission for SWU must be equal to the SDS for water use to ensure a stable supply. Japan is very similar to Korea in terms of water rights, and normal streamflow is the sum of the RMF and water use. Water availability is the difference between the SDS and normal streamflow. However, the data used for SDS calculations are different in the two countries: South Korea uses simulated natural flow due to short record length while Japan considers observed data.
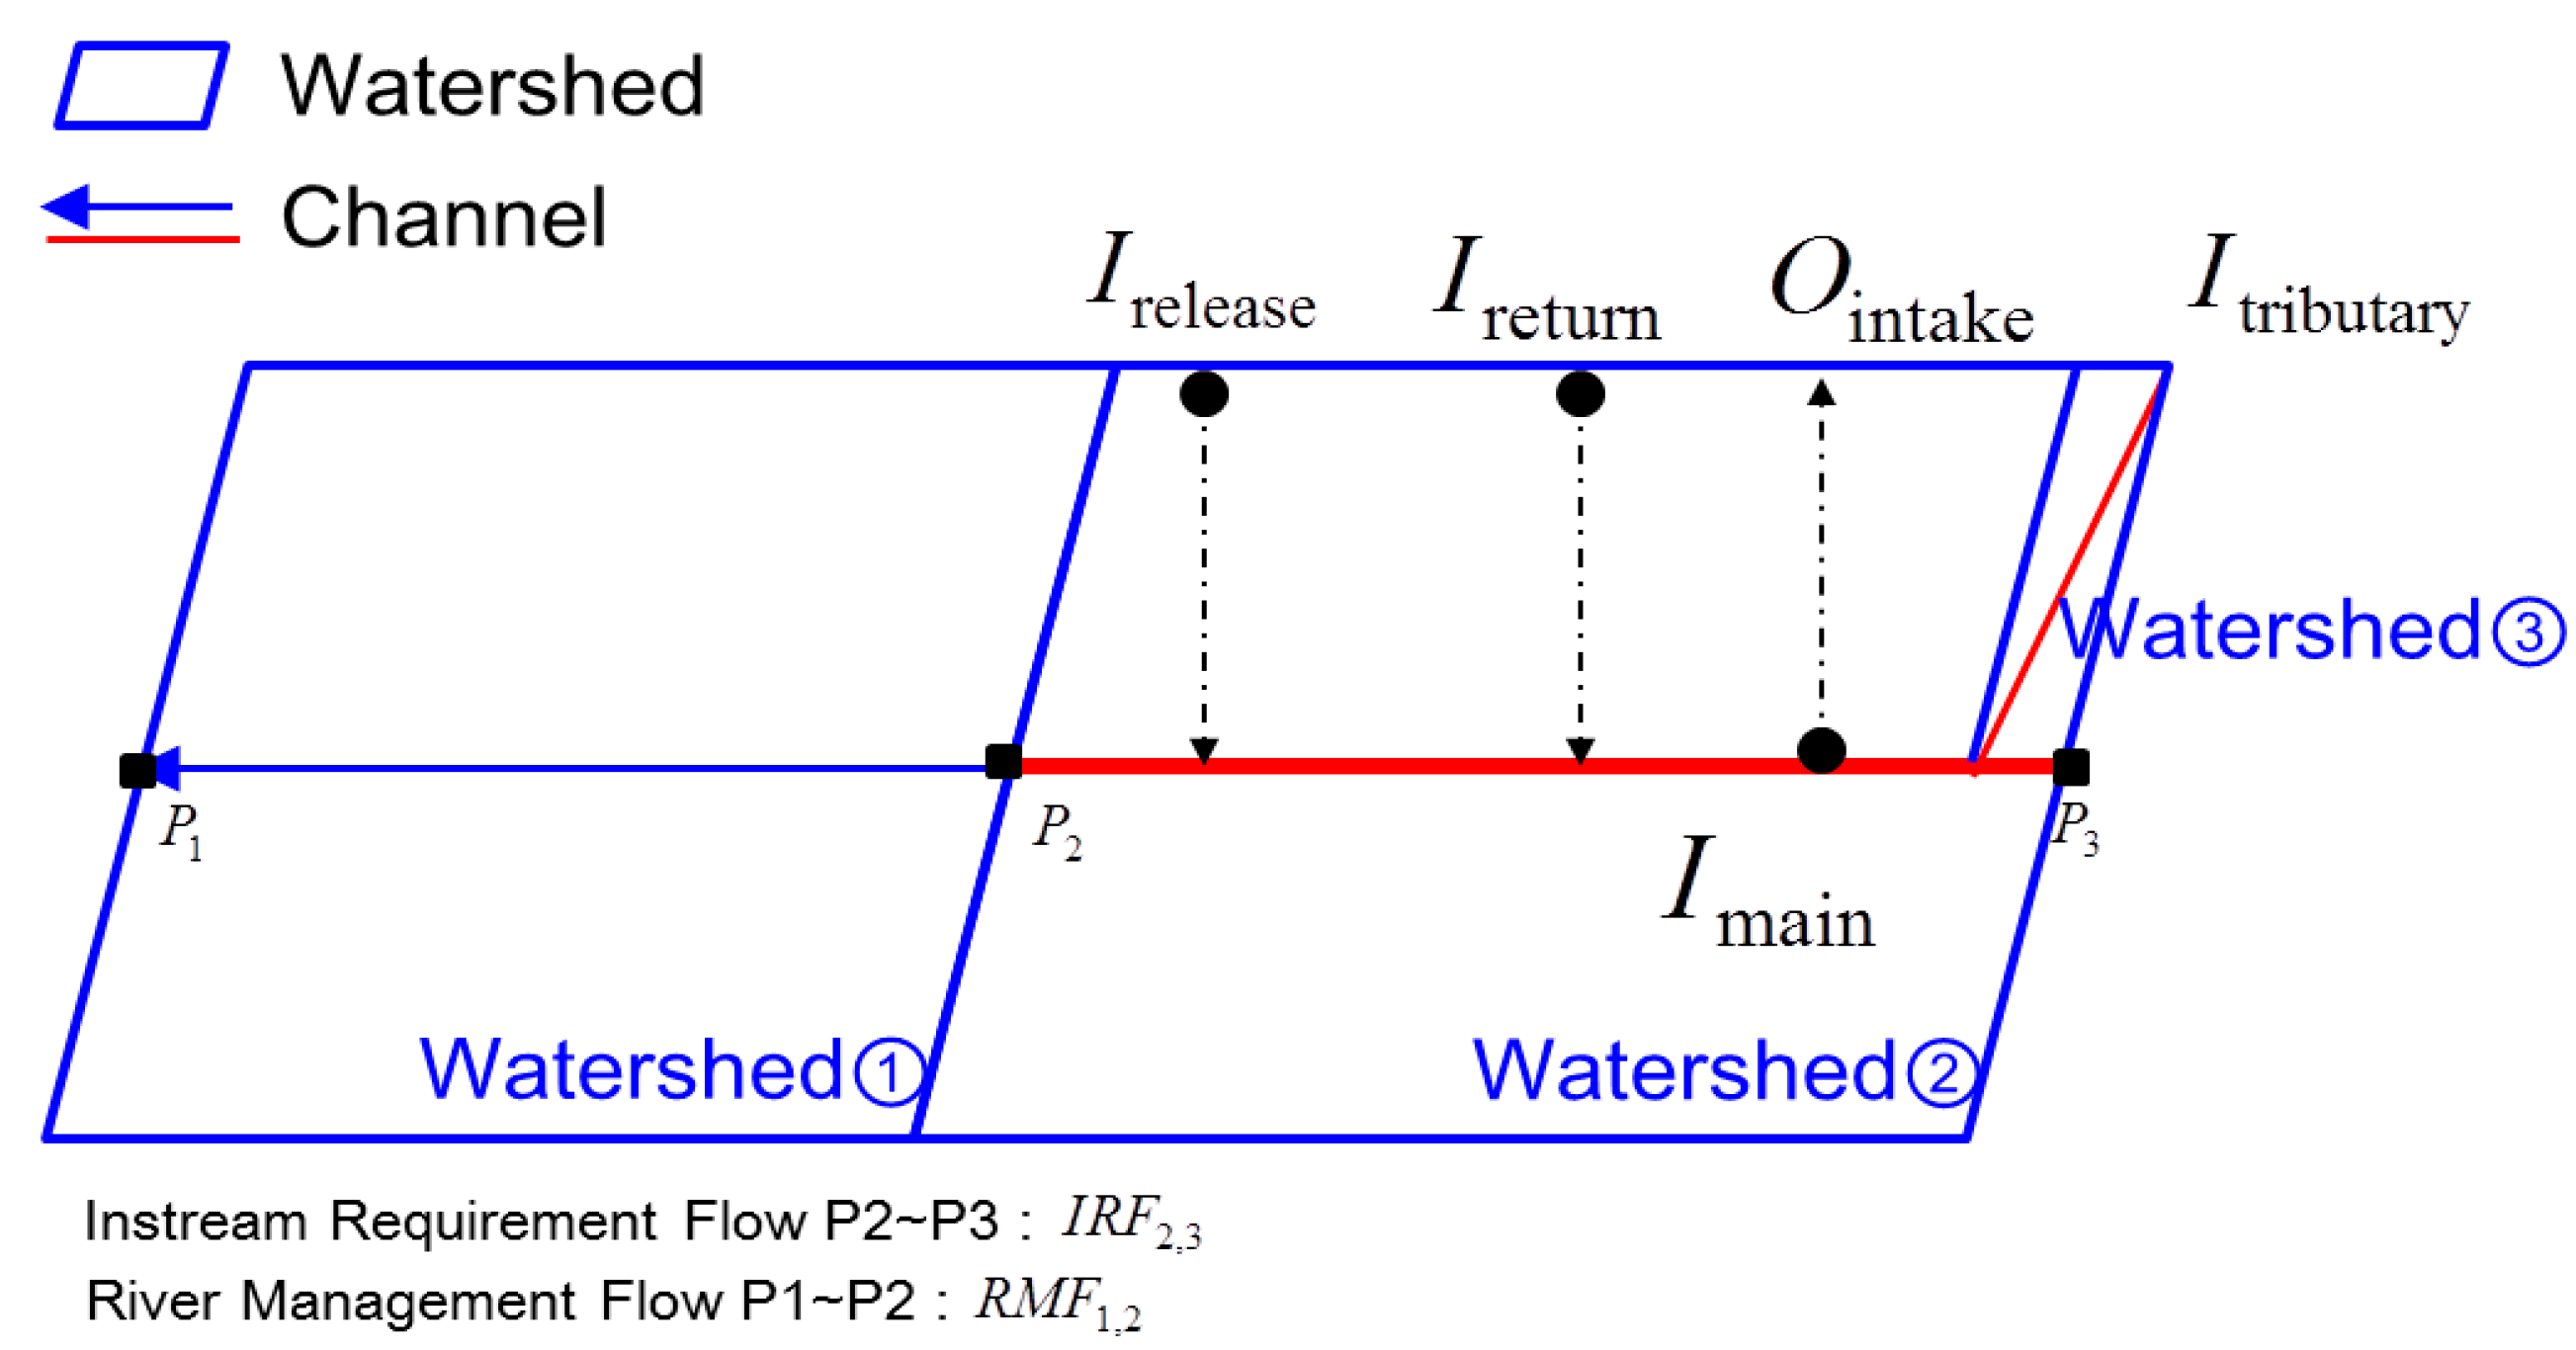
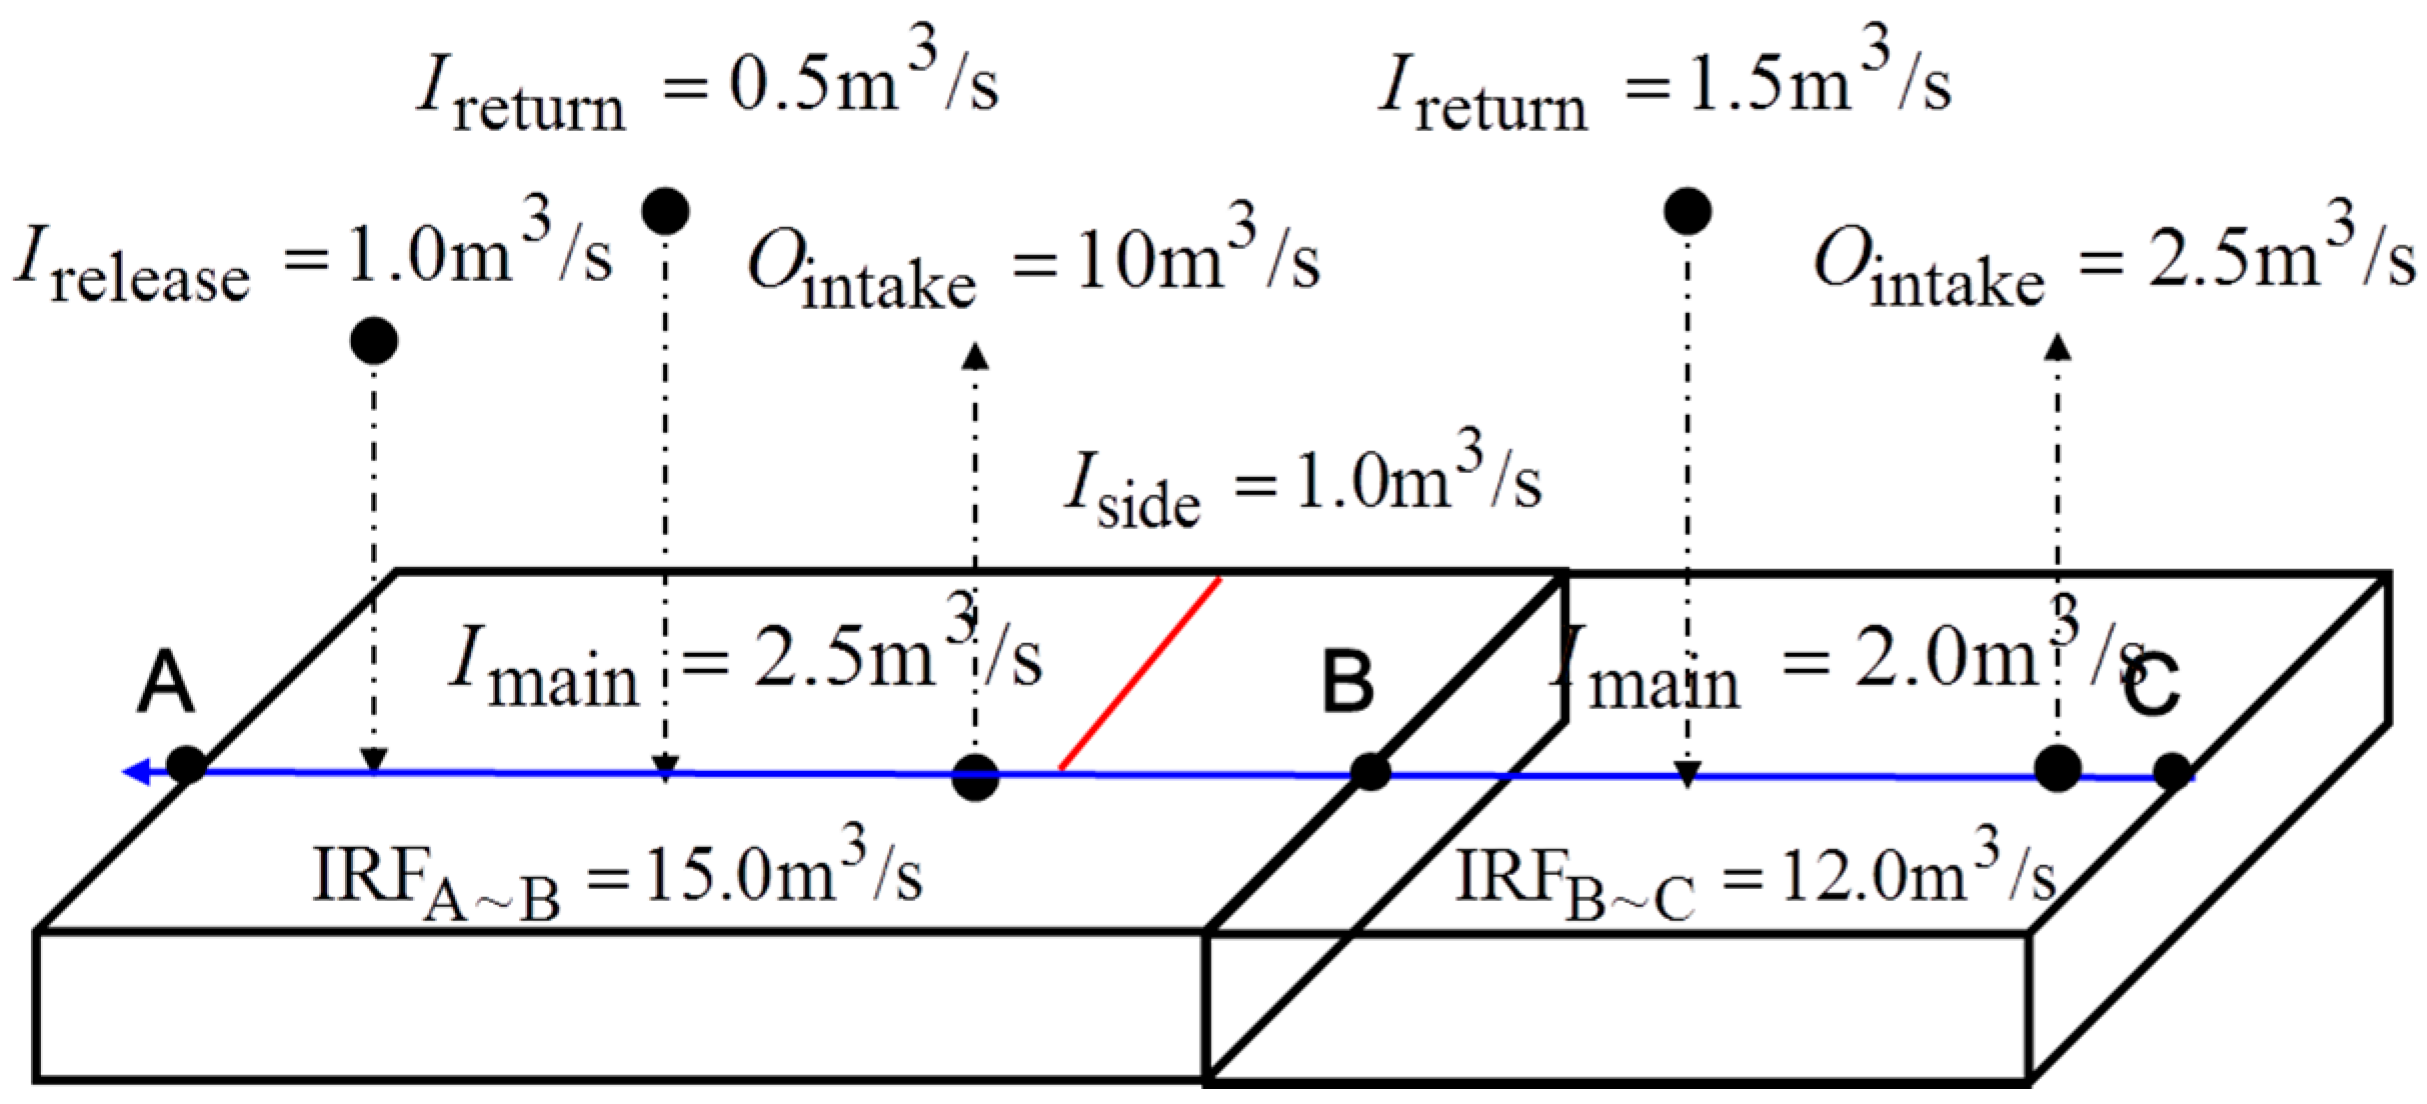
The RMF is estimated based on the water budget of supply and demand from downstream to upstream. The supply is the main (Imain) and tributary inflow (Iside), return flow (Ireturn), and wastewater (Irelease) for a standard watershed. The demand is the IRF (Ointake) and SWU (Ointake). Here, the main and tributary inflow for a standard watershed is the SDS (Equation (7)). However, when there is a water resource facility upstream, such as a dam, the dam supply contracted downstream becomes the SDS. To estimate the RMF, the end of the river should satisfy the IRF at all times, such that the RMF at the end of the river is equal to the IRF. Therefore, we estimate RMF from the initial IRF at the end of the river to the RMF upstream. Because the RMF upstream should be greater than that downstream, to estimate the RMF upstream, the RMF downstream was first compared to the IRF of the corresponding basin. A larger value was chosen, thereby adding the demand to the chosen value and subtracting the supply, which became the RMF of the corresponding basin. This is necessary to guarantee the RMF downstream in the upstream (Figure 7). An example of the abovementioned calculation is shown in Figure 8 and Equations (8)–(10). This method was proposed by the Ministry of Land, Infrastructure and Transport in Japan, and South Korea employed the same method for the estimation of RMF.
3. Results
3.1. Estimation of RMF
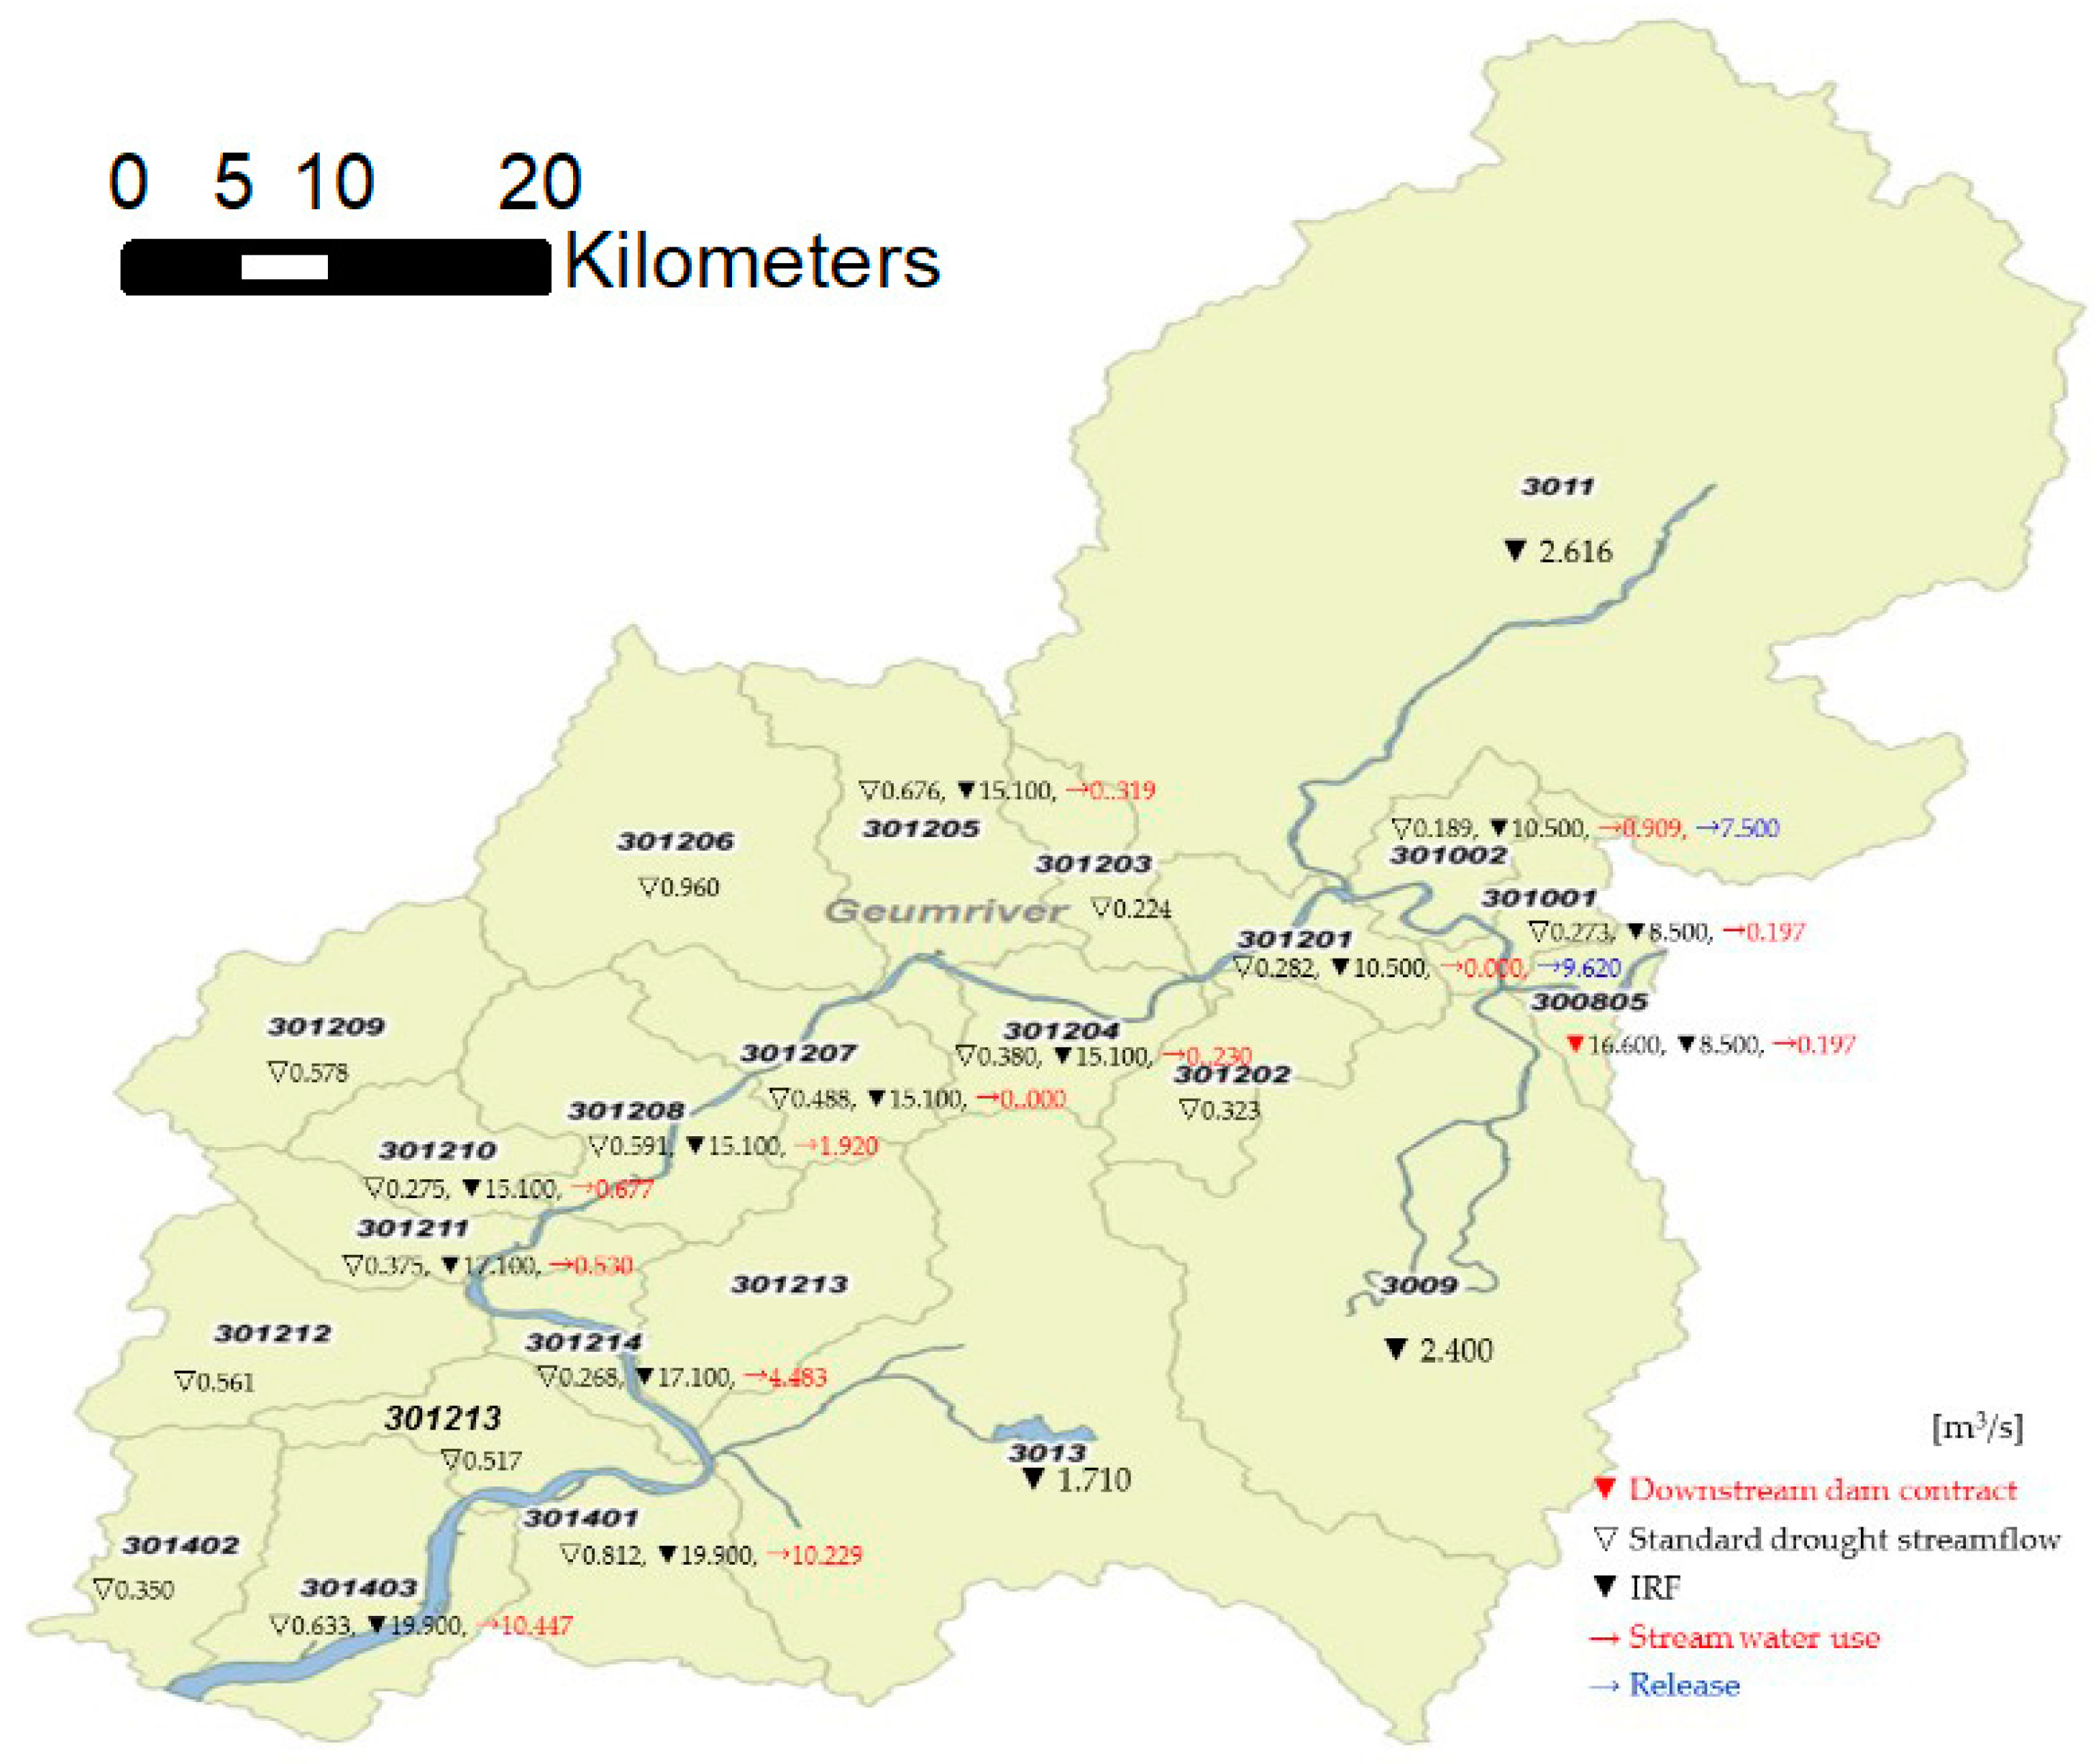
In this section, the RMF estimation based on water use permission from standard watersheds is described. By establishing the RMF at the upstream and downstream sites that had similar risk based on a site at which the deficit risk was highest, the restriction of stream water users at the upstream and downstream sites was equally distributed. Agricultural use accounted for 89.3% of the streamflow use in the Geum River Basin, and the remaining use was for residences, industries, and environmental improvement. The stream water used in the standard watershed of the Geum River is shown in Figure 9; the permission of SWU was concentrated downstream. In addition, because agricultural water is primarily needed between May and October (i.e., the irrigation period), it was confirmed that the RMF needed to be divided into irrigation and non-irrigation values to ensure stable water supply.
The RMF for the main stream of the Geum River Basin was estimated considering the tributaries flowing into the main stream (Geum River). In the Geum River, the RMFs at five sites, as enacted by the River Law, are 8.5, 10.5, 15.1, 17.1, and 19.9 m3/s for Bugang, Maepo, Gongju, Gyuam, and Gangyeong, respectively. The Daecheong Dam (3008), Geum River Estuary (3014), Gapcheon (3009), Mihocheon (3011), Nonsancheon (3013) (a national river), Yongsucheon (301202), Daegyocheon (301203), Yugucheon (301206), Jicheon (301209), Seokseongcheon (301213), Geumcheon (301212), and Gilsancheon (301402) are the local tributaries that flow into the Geum River. Here, national rivers are “rivers managed by the central government for important national conservation or the national economy.” Local rivers are “rivers managed by metropolitan or local governments that are closely related to the public wealth of the province.”
Iside (2.400, 2.600, and 1.710 m3/s, respectively) values were used for the IRF of Gapcheon, Mihocheon, and Nonsancheon, which are tributaries that flow into the main stream. The remaining tributary inflow, which was not identified in the IRF, used SDS (Figure 9). The main inflow of Daecheong Dam 1 (300805) was 16.600 m3/s, which was the value specified in the dam water supply contract. The inflow supply was high in the 301002 and 301201 standard watersheds because of sewage treatment plants. The RMF in the main stream of the Geum River was the highest. The RMF was 41.516 m3/s in the 301208 watershed, and the RMF downstream was high overall because of the high water demand downstream. However, because tributary inflow was high in 301401 and 301214, the RMFs were small (Table 2). The RMF during the non-irrigation period was estimated excluding agricultural water (Table 2).
The RMFs of other sites were estimated by transferring the deficit characteristics of the site at high risk. First, the flow observation site must coincide with the standard watershed outlet, such that the streamflow and the RMF can be compared. Second, the flow observation data should be sufficient for a SWD. Third, to conservatively cope with the SWD, a site with high water demand should be chosen. The RMF during the irrigation period in the 301208 standard watershed was the highest. The flow observation site and outlet of the standard watershed were coincident, but the flow data were affected by the operation of a multi-purpose weir. In addition, the outlet of the 301211 standard watershed coincided with the Gyuam observation site, and the RMF during the irrigation period was also high. Owing to tidal influences, the flow data contained considerable uncertainty. On the other hand, it was confirmed that Gongju coincided with the outlet of the 301204 standard watershed (Figure 9), and the RMF of the standard watershed was comparable to that of Gyuam. Therefore, Gongju was chosen as the representative site for the RMF transition.
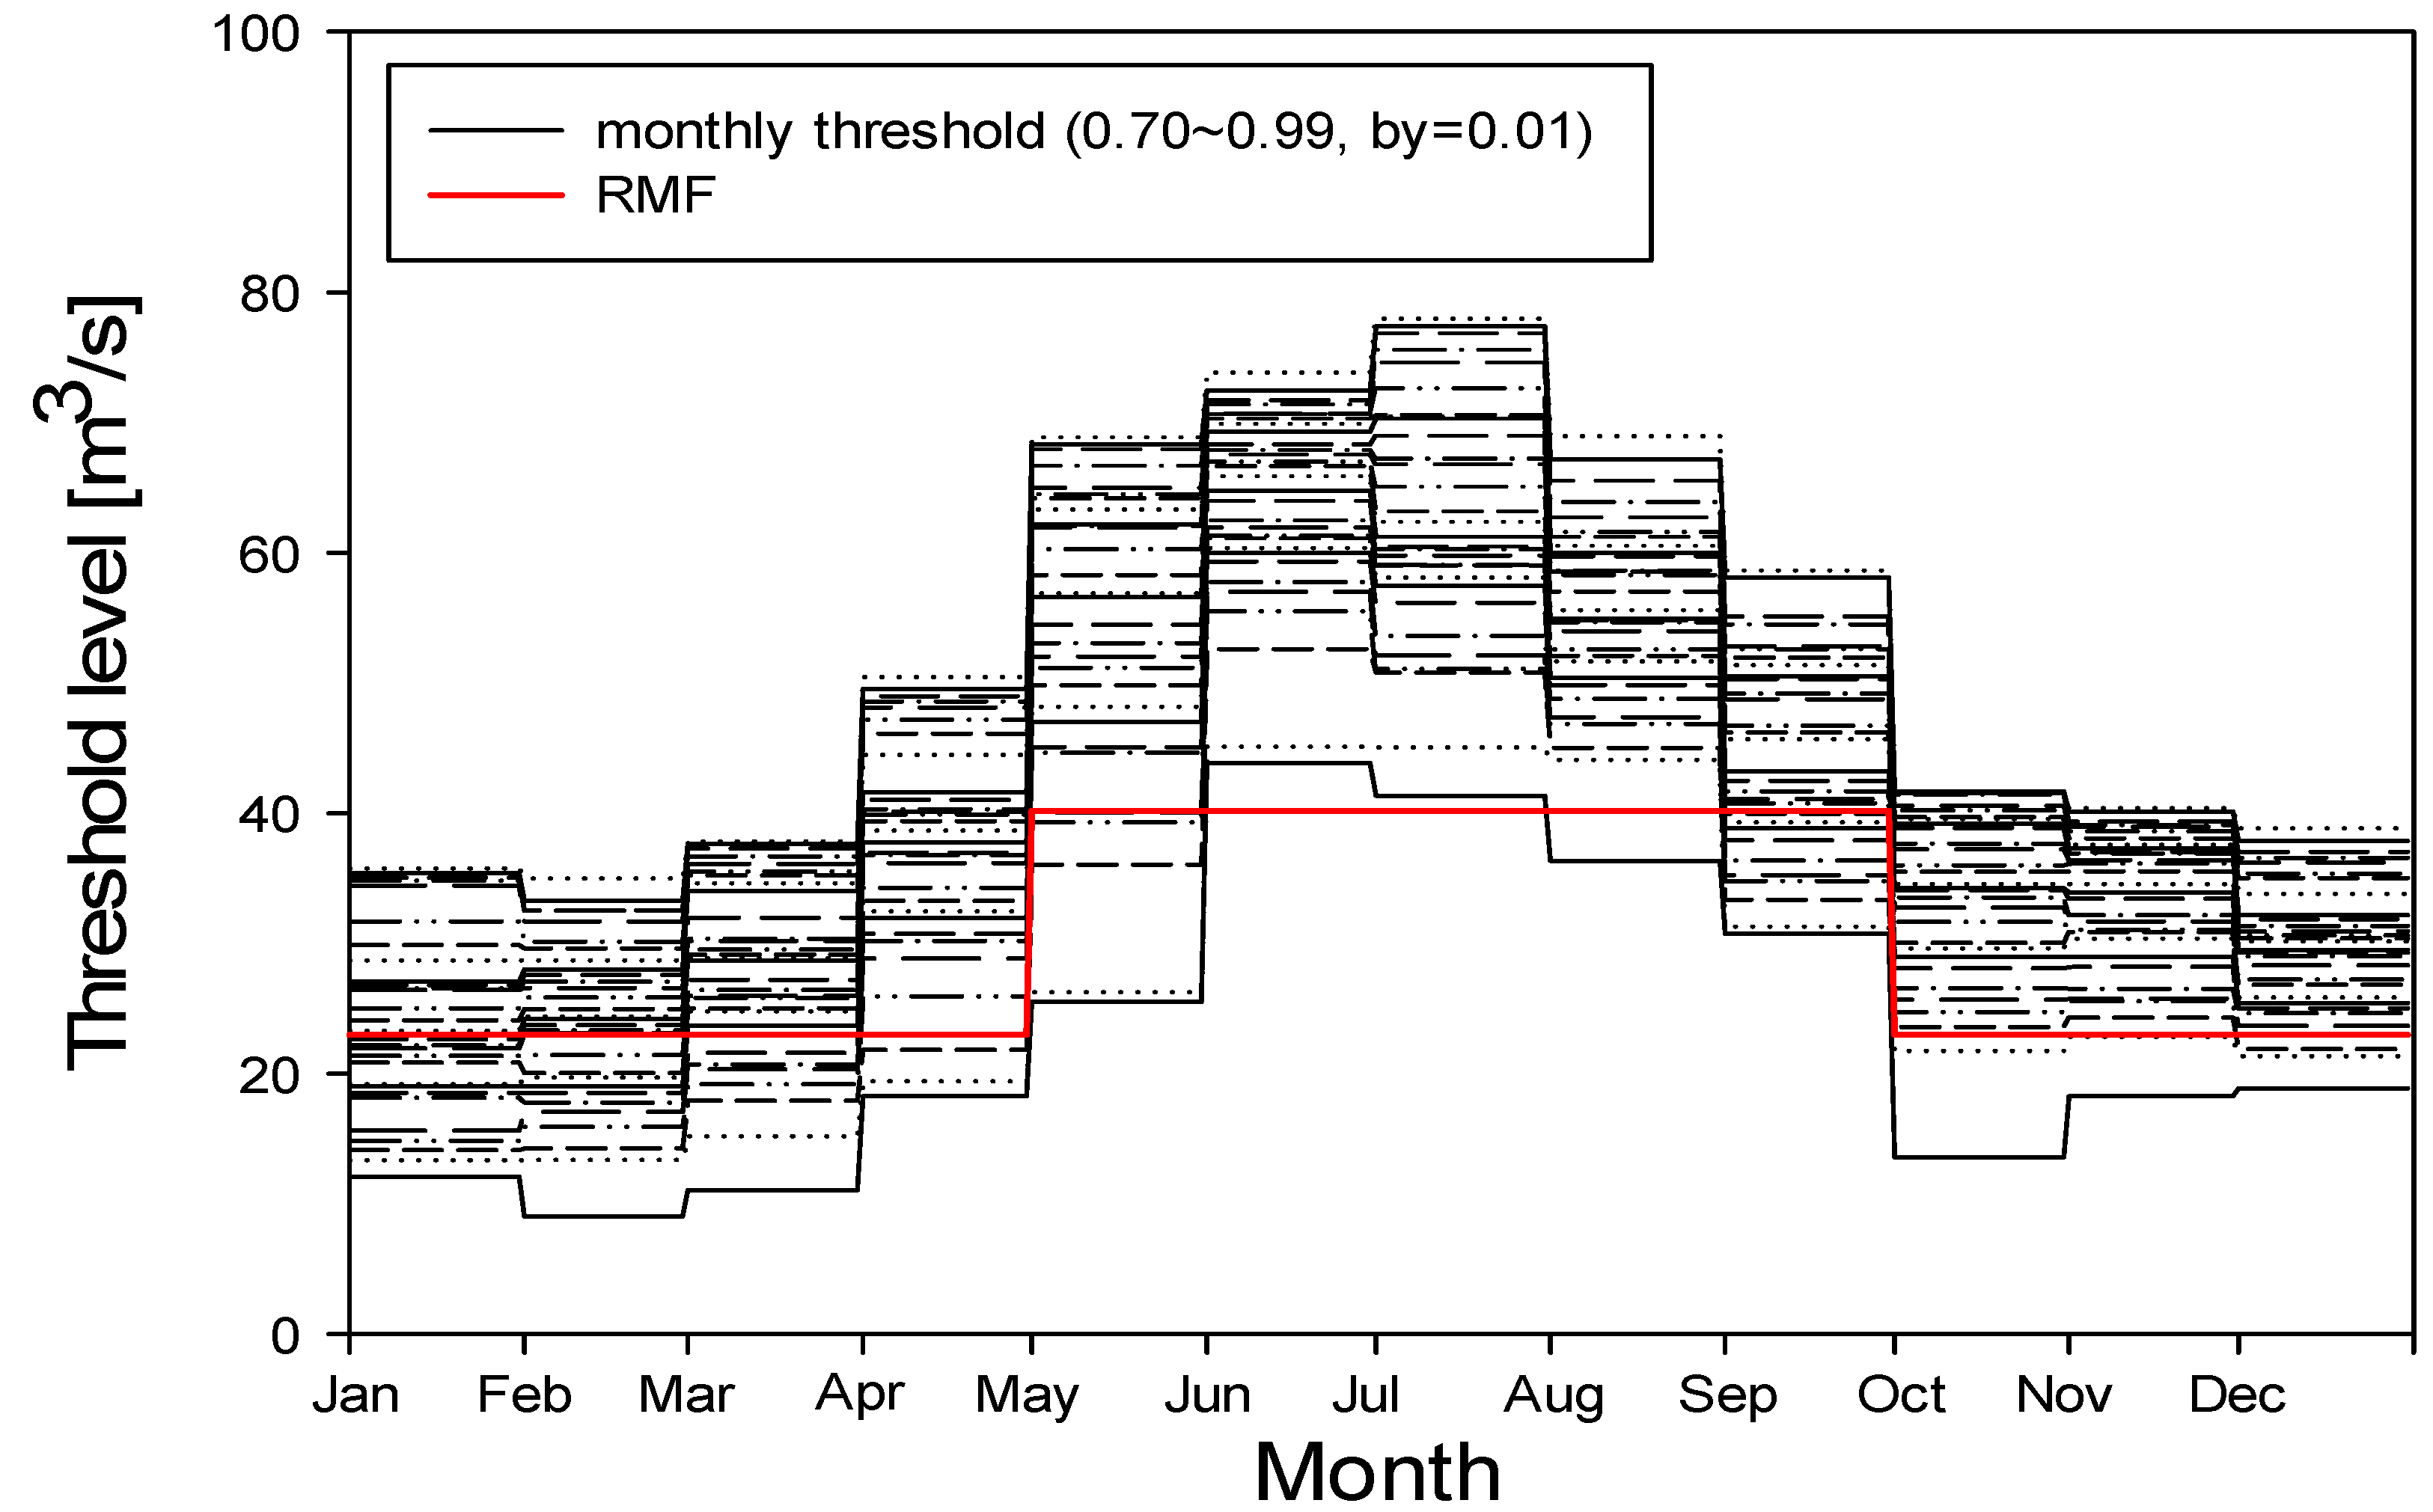
The RMFs at Gongju were 40 m3/s and 22.927 m3/s (Table 2), which were lower than the statistical monthly threshold Q70 recommended by Sung and Chung [13]. Their threshold level was derived as the 70th percentile of the FDC for each month. They recommended that the Q70 should consider the monthly or seasonal variation in streamflow in their study. Thus, the statistical threshold levels of Gongju, which are defined as the 70–99th percentile value of each month’s FDCs, were compared with the RMF. In general, the threshold levels defined the SWD conservatively as compared to the RMF. The RMF was larger than Q99 and smaller than Q95. Furthermore, the threshold levels in January, February, and August were similar to Q90 (Figure 10).
3.2. Estimation of RMF Using the Drought Severity Index
The RMF upstream and downstream of the reference site were estimated such that the characteristics of the reference site could be reproduced in a similar manner. To do this, the RMF during either the irrigation or non-irrigation period was fixed, and that during the other non-irrigation or the irrigation period was changed, which minimized the difference in the DSI of the reference site. The independence of the SWDs should be ensured to calculate the deficit characteristics. Tallaksen et al. [10] recommended a 10-day MA. The SWDs at Gongju from 2007–2009 were determined by taking the 10-day MA for SWDs from 2012–2016. For the last 2 years, the streamflow at Gongju was less than the RMF once and twice during the irrigation and non-irrigation periods, respectively. A review of the results of the DSI shows that the SWD from the end of December 2015 to the beginning of February 2016 was the most severe event (Table 3).
Gongju experienced an SWD from 17 to 26 September 2015, which was an irrigation period. The RMF of Gyuam, downstream of Gongju, was changed from 40.0 m3/s to 50 m3/s, and DSIs were calculated for these RMFs. We found that at a rate of 40–41 m3/s, there was no beginning or ending for the SWD at Gongju. The RMF from 42 m3/s to 43 m3/s was the most similar to the DSI for Gongju (Table 4). It lasted 9 days, which was not very different from the 10 days for Gongju, and the deficit was adequate. We determined that the RMF during the irrigation period was 42 m3/s or 43 m3/s.
During the non-irrigation period, SWDs occurred from 26 December 2015 to 10 February 2016 (event 1); from 20–24 February 2012 (event 2); and from 24 March to 4 April 2014 (event 3) at Gongju. The RMF at Gyuam during the non-irrigation period was determined based on the three DSIs at Gongju. The three Euclidean distances were assumed to be the same, and the Euclidean distances for the three DSIs were calculated for each RMF (Table 5). For calculation of the DSI, the irrigation RMF was fixed at 43 m3/s; the Euclidean distance of the DSI corresponding to 33 m3/s was the shortest. The DSI, according to the change in the RMF at Gyuam, was compared to RMF at Gongju (Table 6). The RMFs at Gyuam were generally in the order of event 1, event 3, and event 2, but 34 m3/s was slightly different. Comparing each event, it was found that the deficit of event 1, which was the highest at 33 m3/s, was the most similar to that at Gongju, such that it would be appropriate as the non-irrigation RMF.
The RMF at Bugang, upstream of Gongju, was estimated in the same manner as that at Gyuam. Compared to the SWD at Gongju during the irrigation period, the SWD because of RMFs of less than 20 m3/s occurred 1 month later than that at Gongju. Therefore, it increased by 1 m3/s from 20 m3/s compared to the deficit at Gongju. As the RMF increased, the SWD increased in severity as well. At an RMF of 20 m3/s or greater, there were deficit events twice during September 2015. On the other hand, at 24 m3/s, SWDs occurred once, but the RMF was too high to evaluate the deficit. Therefore, it was concluded that the RMF during the irrigation period was 20 m3/s. The RMF at Bugang was determined based on the deficit events 1–3 at Gongju. The Euclidean distances of the three DSIs were calculated by fixing the irrigation RMF at 20 m3/s and varying the non-irrigation RMF from 9 m3/s to 1 m3/s. During the same period as events 1–3 at Gongju, the RMF, which resulted in a lack of stream water, was 10–13 m3/s, and the Euclidean distance was relatively short at 12 m3/s (Table 7).
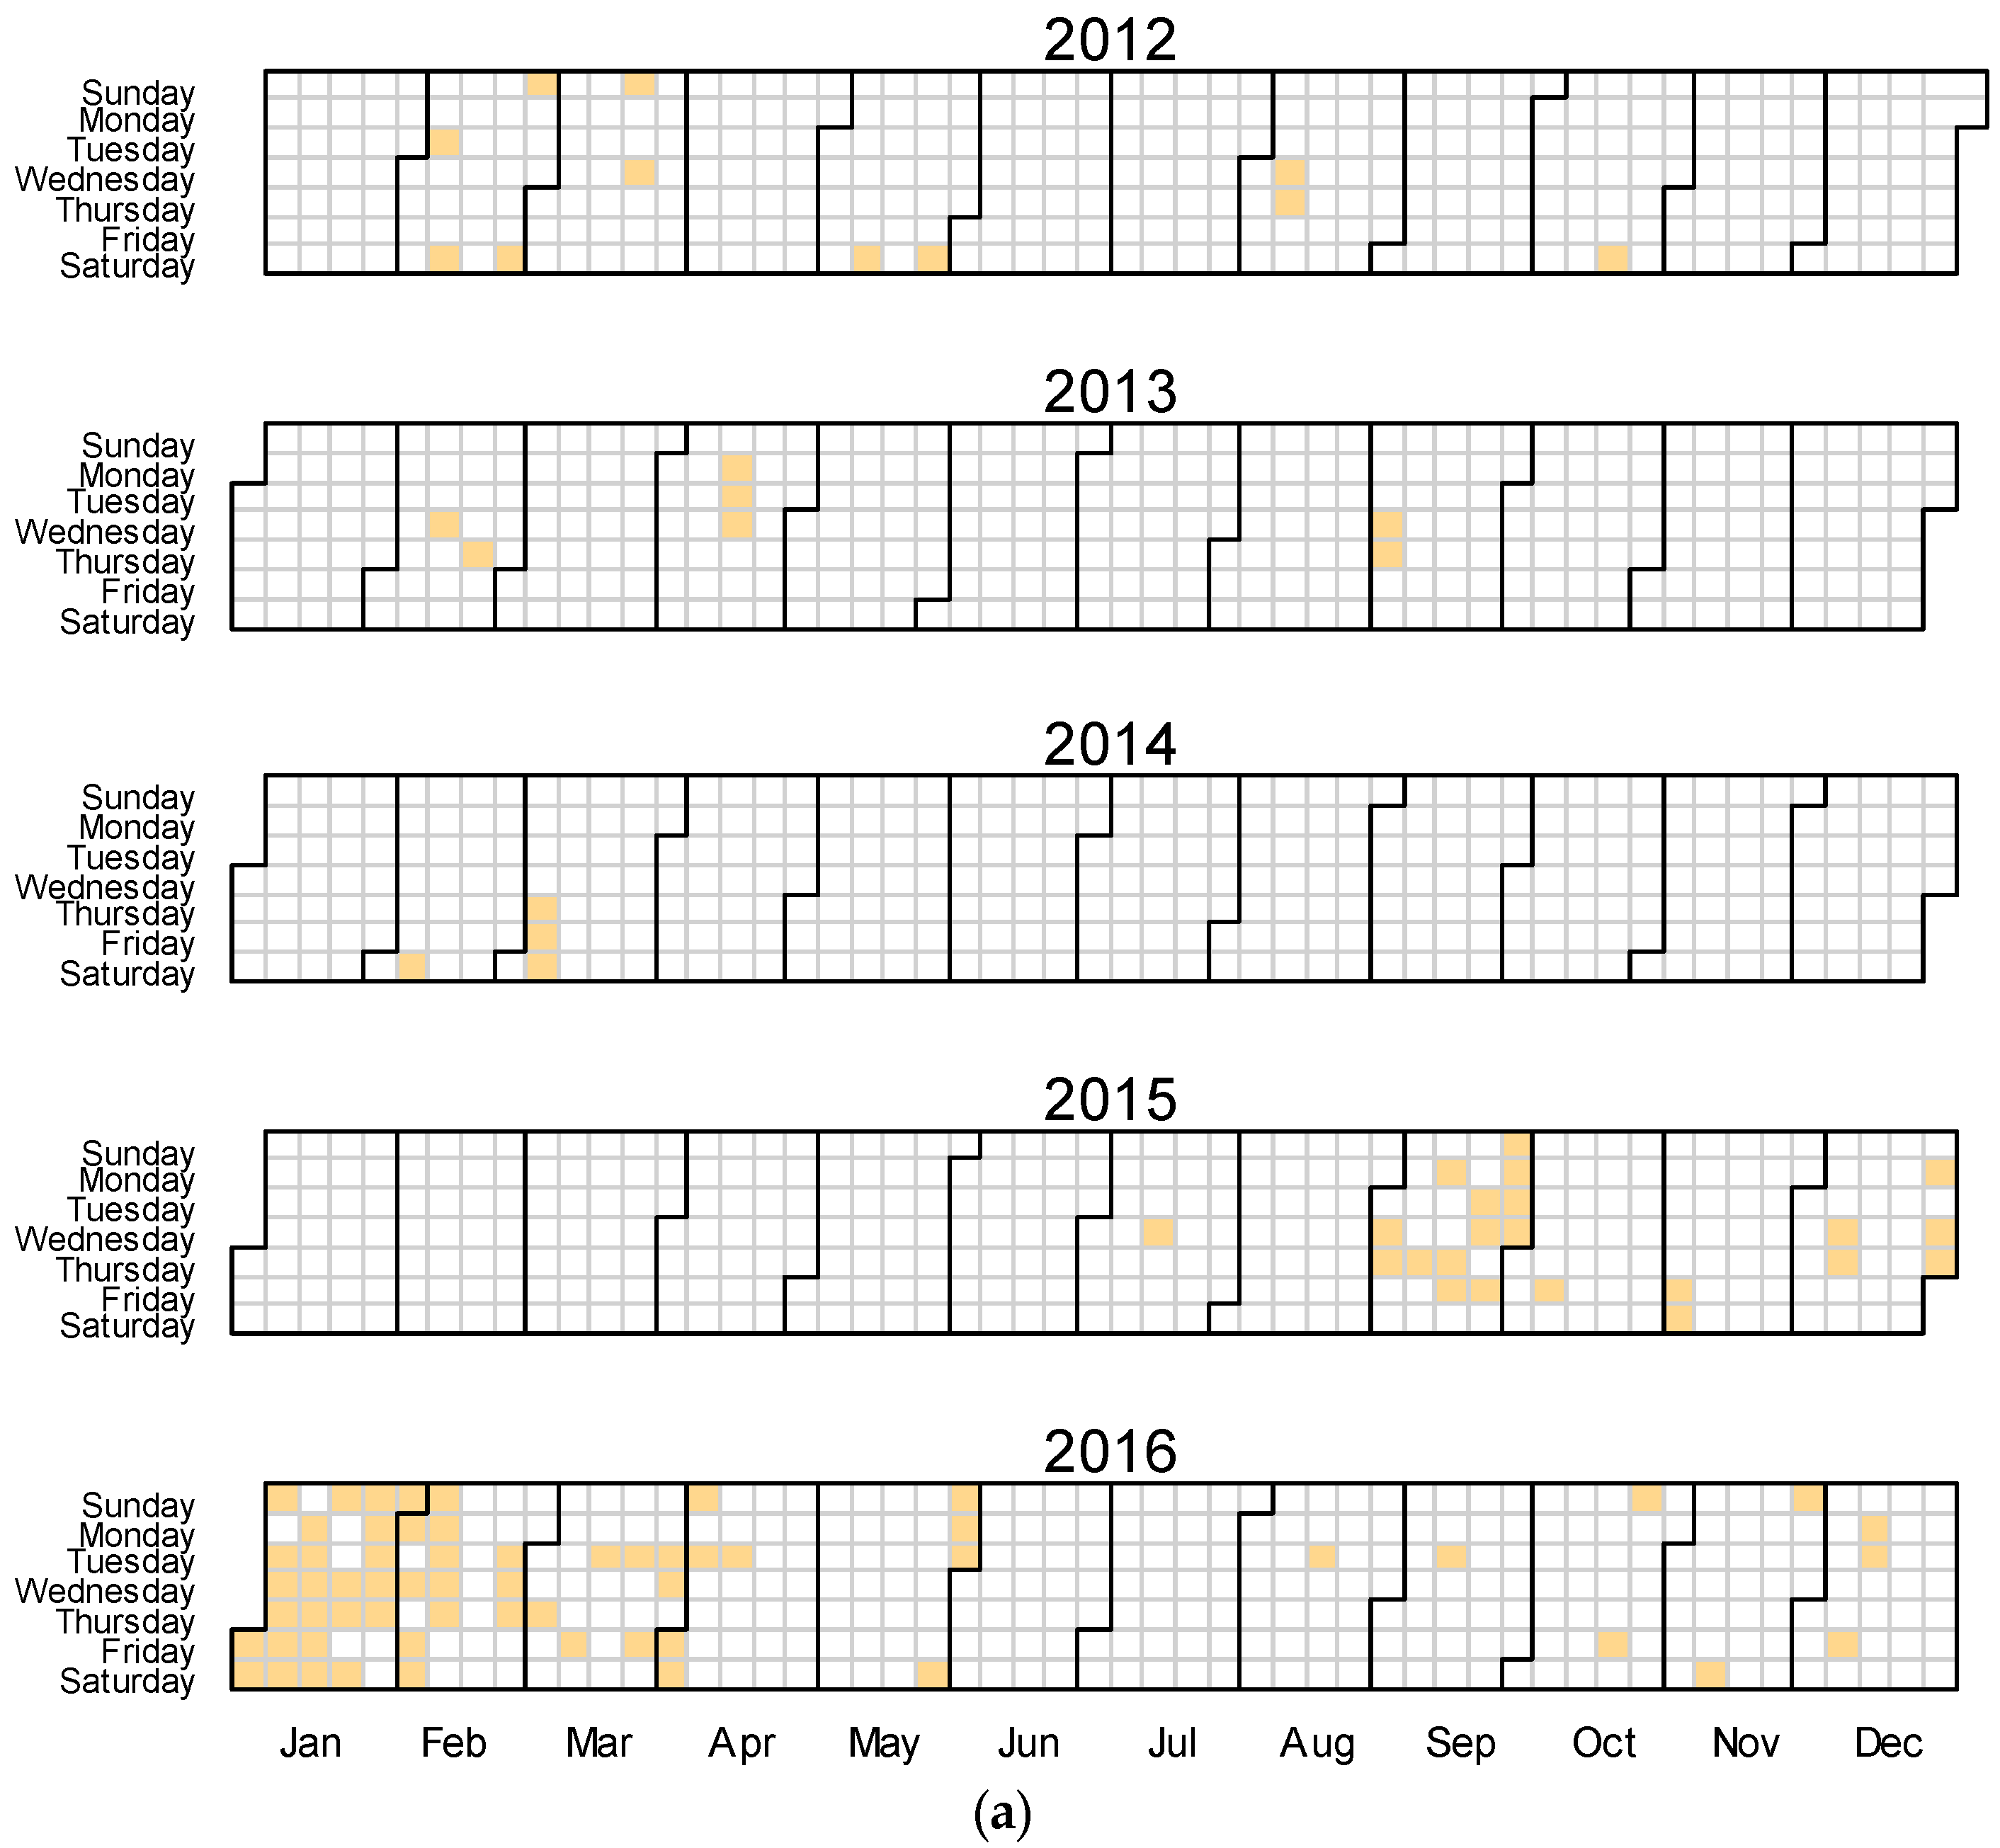
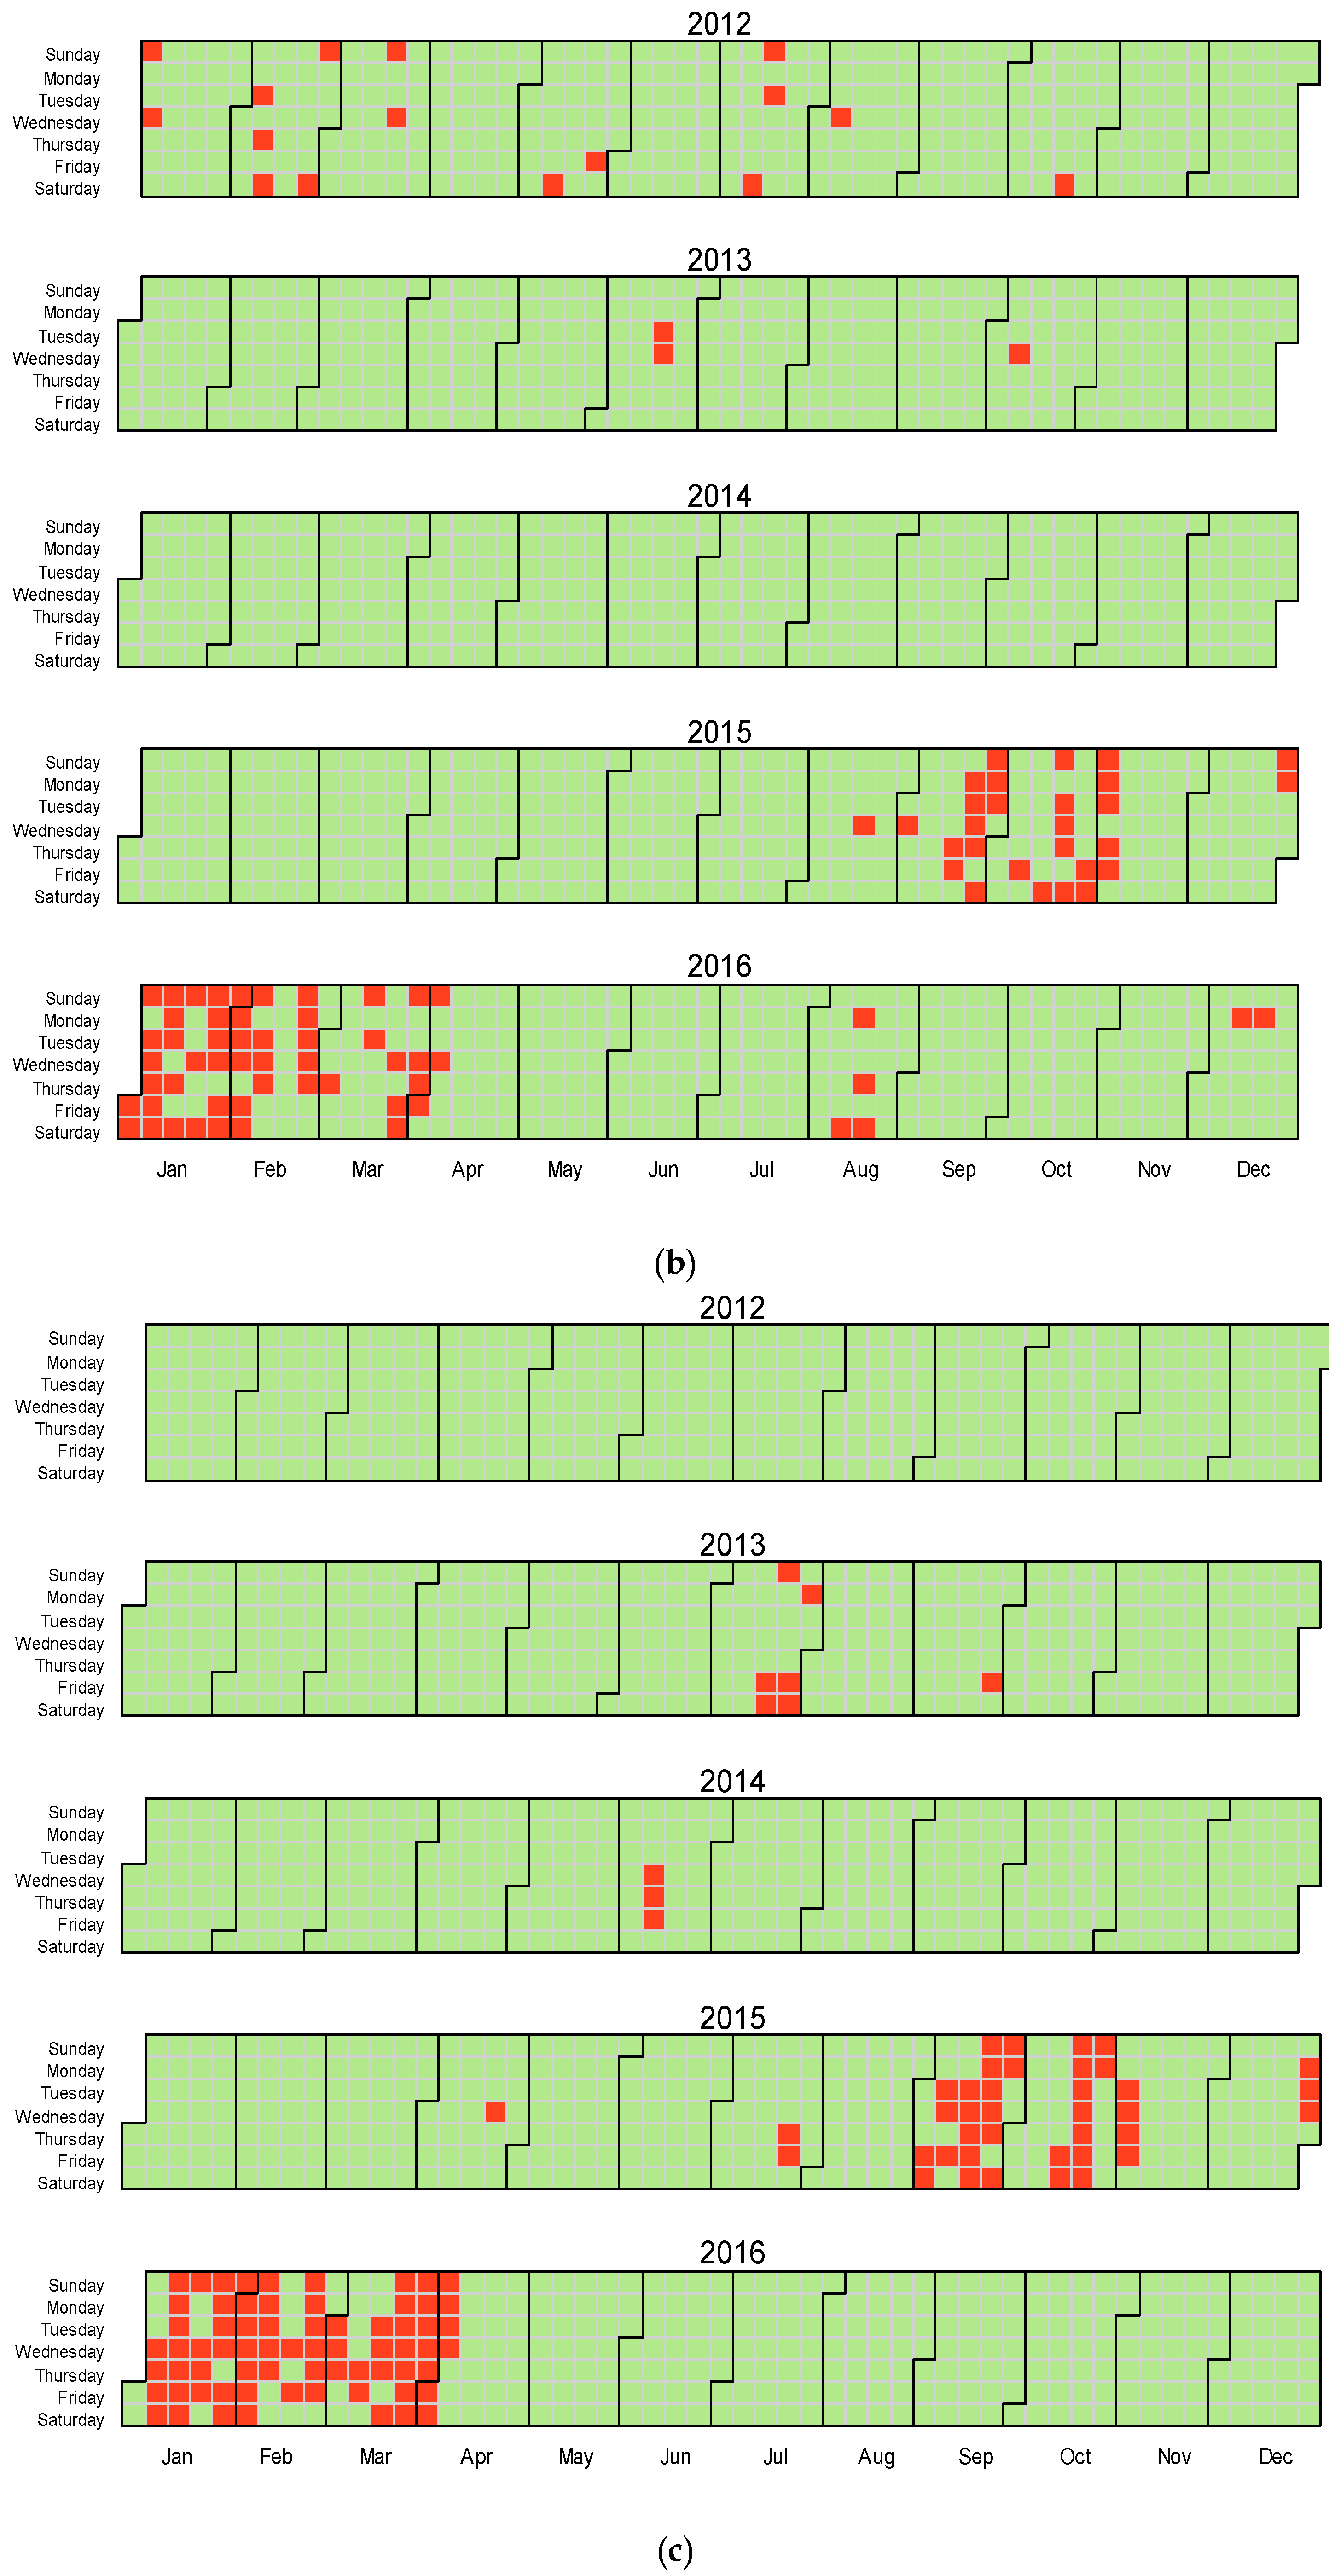
The SWD, compared to the RMF, at Gyuam and Bugang, based on the RMF at Gongju, is shown in Figure 11. The red and orange boxes in Figure 11 indicate the occurrence of SWDs. It was confirmed that SWDs occurred at Gyuam and Bugang when an SWD occurred at Gongju. As a result, the start and end of the deficits were similar at Gyuam and Bugang. Thus, the estimation of an RMF that results in similar SWD upstream and downstream in a river may lead to the implementation of fair water restrictions by the SWCC.
4. Conclusions
South Korea has been responding to SWDs using a RMF based on the River Law. When a SWD is expected, the SWCC restricts the SWU regardless of location (e.g., upstream or downstream). Through this study, we revisited South Korea’s response to SWDs. The SWCC should manage the RMF so that the upstream and downstream users face similar risks. First, because SWU in South Korea has been managed by standard watershed units, the RMF has also been estimated based on standard watershed units. Second, it is necessary to ensure consensus and reliability regarding the restriction of SWU because of SWDs through balanced management of rivers.
To estimate the RMF based on standard watershed units, considering the SWD as a result of a survey of SWU, we found that the demand for agricultural water was dominant in the Geum River Basin and agricultural water was mostly extracted from the downstream section of the river. Results of the estimation of the RMF considering SWU and the IRF showed that the RMF during the irrigation period was the highest in the 301208 standard watershed, which had a higher RMF than the 301204 standard watershed even during the non-irrigation period. Sung and Chung [13] suggested that Q70–Q95 was the appropriate threshold level for streamflow drought, but we found that the threshold for the SWD at Gongju was less than Q90. Therefore, we could conclude that even if streamflow is less than normal, it does not necessarily lead to an SWD; SWDs occur only after a streamflow drought becomes extreme. Therefore, Q70, as proposed by Sung and Chung [13], can be utilized for the purpose of monitoring movement from stream water drought to deficit.
RMFs were estimated such that the characteristics of the SWDs upstream and downstream were similar. Applying the RMF at Gongju to the upper and lower sites, we found the RMF of Bugang and Gyuam, which minimized the difference in Gongju’s DSI. The estimated RMF simulated the main characteristics of the SWD, such as the deficit and duration upstream and downstream, which were similar to those at Gongju. In South Korea, a serious drought occurred from 2015 to 2016 and stream water users suffered from restrictions on the use of stream water based on the SWD. According to the results of the application of the proposed methodology, the characteristics of the SWD were similar upstream and downstream. It was determined that balanced river management is possible.
This study, thus, (i) suggested a threshold level considering water demand, (ii) compared the threshold level to a threshold related to anomalies, and (iii) suggested the utilization of the described method. However, for calculating RMF, we used SDS (10-year frequency of the streamflow), in which the streamflow is a fixed flow that is maintained for more than 355 days per year. This method has a limitation in that the seasonal and monthly variations cannot be considered. Tallaksen et al. [10] and Sung and Chung [13] suggested that FDC should be calculated monthly or seasonally to consider the monthly variation. With the use of monthly or seasonal FDCs, the SDS during summer increased to a value greater than the fixed SDS, such that the available stream water for use also increased. This led to reasonable permissions for SWU. The SDS, considering the variation in streamflow, leads to changes in the main river and tributary inflow and allows a reasonable RMF to be calculated.
Author Contributions
J.H.S. conducted the study and made the first draft of the article. S.B.S. supervised the study and helped in preparation of the first draft of the article.
Funding
This research was funded by the National Research Foundation of Korea (grant number is NRF-2017R1A6A3A11031800).
Conflicts of Interest
The authors declare no conflicts of interest.
Abbreviations
| DSI | Drought Severity Index |
| FDC | Flow Duration Curve |
| IRF | Instream Requirement Flow |
| MA | Moving Average |
| RMF | River Management Flow |
| SDS | Standard Drought Streamflow |
| SWCC | Stream Water Coordination Council |
| SWD | Stream Water Deficit |
| SWU | Stream Water Use |
References
- Nalbantis, I.; Tsakiris, G. Assessment of Hydrological Drought Revisited. Water Resour. Manag. 2008, 23, 881–897. [Google Scholar] [CrossRef]
- Spiliotis, M.; Angelidis, P.; Papadopoulos, B.K. Assessment of annual hydrological drought based on fuzzy estimators. In Proceedings of the 4th IAHR Europe Congress, Liege, Belgium, 27–29 July 2016. [Google Scholar] [CrossRef]
- Dracup, J.A.; Lee, K.S.; Paulson, E.G., Jr. On the definition of droughts. Water Resour. Res. 1980, 16, 297–302. [Google Scholar] [CrossRef]
- Wilhite, D.A.; Glantz, M.H. Understanding the drought phenomenon: The role of definitions. Water Int. 1985, 10, 111–120. [Google Scholar] [CrossRef]
- Tate, E.L.; Gustard, A. Drought definition: A hydrological perspective. In Drought and Drought Mitigation in Europe; Vogt, J.V., Somma, F., Eds.; Kluwer Academic Publishers: Dordrecht, The Netherlands, 2000; pp. 23–48. [Google Scholar]
- Smakhtin, V.U. Low flow hydrology: A review. J. Hydrol. 2001, 240, 147–186. [Google Scholar] [CrossRef]
- Tallaksen, L.M.; Van Lanen, H.A. Hydrological Drought: Processes and Estimation Methods for Streamflow and Groundwater; Elsevier: Amsterdam, The Netherlands, 2004. [Google Scholar]
- Mishra, A.K.; Singh, V.P. A review of drought concepts review article. J. Hydrol. 2010, 391, 202–216. [Google Scholar] [CrossRef]
- Yevjevich, V. An Objective Approach to Definition and Investigation of Continental Hydrological Droughts; Hydrology Paper No. 23; Colorado State University: Fort Collins, CO, USA, 1967. [Google Scholar]
- Tallaksen, L.M.; Madsen, H.; Clausen, B. On the definition and modelling of streamflow drought duration and deficit volume. Hydrol. Sci. J. 1997, 42, 15–33. [Google Scholar] [CrossRef] [Green Version]
- Tallaksen, L.M.; Hisdal, H.; van Lanen, H.A.J. Space-time modelling of catchment scale drought characteristics. J. Hydrol. 2009, 375, 363–372. [Google Scholar] [CrossRef]
- Pandey, R.P.; Mishra, S.K.; Singh, R.; Ramasastri, K.S. Streamflow drought severity analysis of Betwa river system (India). Water Resour. Manag. 2008, 22, 1127–1141. [Google Scholar] [CrossRef]
- Sung, J.H.; Chung, E.S. Development of streamflow drought severity-duration-frequency curves using the threshold level method. Hydrol. Earth Syst. Sci. 2014, 18, 3341–3351. [Google Scholar] [CrossRef]
- Wu, J.; Soh, L.K.; Samal, A.; Chen, X.H. Trend analysis of streamflow drought events in Nebraska. Water Resour. Manag. 2007, 22, 145–164. [Google Scholar] [CrossRef]
- Seo, S.B.; Mahinthakumar, G.; Sankarasubramanian, A.; Kumar, M. Conjunctive management of surface water and groundwater resources under drought conditions using a fully-coupled hydrological model. J. Water. Res. Plan. Manag. 2018, 144, 04018060. [Google Scholar] [CrossRef]
- Heim, R.R., Jr. A review of twentieth-century drought indices used in the United States. Bull. Am. Meteorol. Soc. 2002, 83, 1149–1165. [Google Scholar] [CrossRef]
- Razmkhah, H. Preparing stream flow drought severity–duration–frequency curves using threshold level method. Arab. J. Geosci. 2016, 9, 513. [Google Scholar] [CrossRef]
Figure 1.
Flow chart of the proposed methodology.

Figure 2.
Location of the Geum River Basin. (a) Korean Peninsula; (b) Geum River Basin.

Figure 3.
Changes in annual precipitation (Geum River Basin) and monthly streamflow (Gongju). (a) Monthly precipitation [mm]. (b) Monthly streamflow at Gongju (m3/s).
Figure 3.
Changes in annual precipitation (Geum River Basin) and monthly streamflow (Gongju). (a) Monthly precipitation [mm]. (b) Monthly streamflow at Gongju (m3/s).

Figure 4.
Large, medium, and standard watersheds of the Geum River Basin. (a) Large; (b) Medium; (c) Standard.
Figure 4.
Large, medium, and standard watersheds of the Geum River Basin. (a) Large; (b) Medium; (c) Standard.

Figure 5.
Definition of streamflow drought and deficit based on the threshold level method.

Figure 6.
Concept of water rights in South Korea.

Figure 7.
Schematic showing calculation of the RMF for the main stream.

Figure 8.
Example of the calculation of RMF.

Figure 9.
Status of the Geum River for RMF calculation.

Figure 10.
RMF and monthly threshold calculated by the FDC.

Figure 11.
Deficits at Gongju, Gyuam, and Bugang. (a) Gongju; (b) Gyuam; (c) Bugang.


Table 1.
Drought classification based on Drought severity index (DSI).
| DSI | Drought Strength |
|---|---|
| <0.01 | Weak |
| 0.01 to 0.05 | Mild |
| 0.05 to 0.2 | Moderate |
| 0.2 to 0.5 | Severe |
| >0.5 | Extreme |
Table 2.
Calculation of RMF (m3/s).
| Standard Watershed | ① Downstream (RMF[i–i–1]) | ② Use (Ointake) | ③ Side Inflow (Insider) | ④ Main Inflow (Imain) | ⑤ IRF (IRF[i–i+1]) | ⑥ RMF = max(①, ⑤) + ② − ③ − ④) (RMF[i–i+1]) | |
|---|---|---|---|---|---|---|---|
| Irrigation | Non-Irrigation | ||||||
| 301403 | 19.900 | 10.447 | 0.350 | 0.633 | 19.900 | 29.364 | 26.678 |
| 301401 | 29.364 | 10.229 | 1.710 | 0.812 | 19.900 | 37.071 | 24.456 |
| 301214 | 37.071 | 4.483 | 1.078 | 0.268 | 17.100 | 40.208 | 26.350 |
| 301211 | 40.208 | 0.530 | 0.000 | 0.375 | 17.100 | 40.363 | 26.378 |
| 301210 | 40.363 | 0.677 | 0.578 | 0.275 | 15.100 | 40.187 | 26.888 |
| 301208 | 40.187 | 1.920 | 0.000 | 0.591 | 15.100 | 41.516 | 27.898 |
| 301207 | 41.516 | 0.000 | 0.960 | 0.488 | 15.100 | 40.068 | 25.940 |
| 301205 | 40.068 | 0.319 | 0.000 | 0.676 | 15.100 | 39.711 | 23.723 |
| 301204 | 39.711 | 0.380 | 0.547 | 0.339 | 15.100 | 39.205 | 23.927 |
| 301201 | 39.205 | 0.000 | 9.620 | 0.282 | 10.500 | 29.303 | 16.582 |
| 301002 | 29.303 | 0.909 | 7.500 | 0.189 | 10.500 | 22.523 | 13.456 |
| 301001 | 22.523 | 0.197 | 2.400 | 0.273 | 8.500 | 20.047 | 11.039 |
| 300805 | 20.047 | 0.197 | 0.000 | 16.600 | 8.500 | 3.644 | 8.920 |
Table 3.
Streamflow deficit events and severity indexes at Gongju (2007–2009, 2012–2016).
| Start | End | Volume (86,400 m3) | Duration (day) | DSI |
|---|---|---|---|---|
| 09-17-2015 | 09-26-2015 | 25.5 | 10 | 0.00186 |
| 12-26-2015 | 02-10-2016 | 234.0 | 47 | 0.08034 |
| 02-20-2016 | 02-24-2016 | 4.2 | 5 | 0.00015 |
| 03-24-2016 | 04-04-2016 | 28.8 | 12 | 0.00253 |
Table 4.
Streamflow deficit events and severity indexes for Gyuam (2012–2016, irrigation period).
| RMF | Start | End | Volume (86,400 m3) | Duration (day) | DSI |
|---|---|---|---|---|---|
| 42 | 09-21-2015 | 09-29-2015 | 43.2 | 9 | 0.00234 |
| 43 | 09-21-2015 | 09-29-2015 | 43.2 | 9 | 0.00234 |
| 44 | 09-21-2015 | 09-29-2015 | 52.2 | 9 | 0.00282 |
| 45 | 09-21-2015 | 09-29-2015 | 61.2 | 9 | 0.00331 |
| 46 | 09-21-2015 | 09-29-2015 | 70.2 | 9 | 0.00380 |
| 47 | 09-20-2015 | 09-29-2015 | 79.4 | 10 | 0.00477 |
| 48 | 09-20-2015 | 09-29-2015 | 89.4 | 10 | 0.00537 |
| 49 | 09-20-2015 | 09-29-2015 | 99.4 | 10 | 0.00597 |
| 50 | 09-16-2015 | 09-29-2015 | 131.6 | 14 | 0.01107 |
Table 5.
Streamflow deficit events and their severity indexes for Gyuam (2012–2016, non-irrigation period).
Table 5.
Streamflow deficit events and their severity indexes for Gyuam (2012–2016, non-irrigation period).
| RMF | Start | End | Volume (86,400 m3) | Duration (day) | DSI | Euclidean Distance |
|---|---|---|---|---|---|---|
| 29 | 01-01-2016 | 02-11-2016 | 135.7 | 42 | 0.03423 | 0.04614 |
| 02-21-2016 | 02-25-2016 | 22.8 | 5 | 0.00068 | ||
| 03-30-2016 | 04-03-2016 | 34.1 | 5 | 0.00102 | ||
| 30 | 01-01-2016 | 02-11-2016 | 177.7 | 42 | 0.04483 | 0.03554 |
| 02-21-2016 | 02-25-2016 | 27.8 | 5 | 0.00083 | ||
| 03-25-2016 | 04-06-2016 | 48.2 | 13 | 0.00376 | ||
| 31 | 01-01-2016 | 02-11-2016 | 219.7 | 42 | 0.05543 | 0.02515 |
| 02-21-2016 | 02-25-2016 | 32.8 | 5 | 0.00099 | ||
| 03-23-2016 | 04-06-2016 | 65.5 | 15 | 0.00590 | ||
| 32 | 01-01-2016 | 02-11-2016 | 261.7 | 42 | 0.06603 | 0.01510 |
| 02-21-2016 | 02-25-2016 | 37.8 | 5 | 0.00114 | ||
| 03-23-2016 | 04-06-2016 | 80.5 | 15 | 0.00725 | ||
| 33 | 01-01-2016 | 02-11-2016 | 303.7 | 42 | 0.07662 | 0.00721 |
| 02-21-2016 | 02-25-2016 | 42.8 | 5 | 0.00129 | ||
| 03-23-2016 | 04-06-2016 | 95.5 | 15 | 0.00860 | ||
| 34 | 02-21-2016 | 02-25-2016 | 47.8 | 5 | 0.00144 | 0.07938 |
| 03-23-2016 | 04-12-2016 | 68.6 | 21 | 0.00866 | ||
| 12-10-2016 | 12-14-2016 | 17.2 | 5 | 0.00052 |
Table 6.
Streamflow deficit events and their severity indexes for Gongju (2012–2016, irrigation period).
Table 6.
Streamflow deficit events and their severity indexes for Gongju (2012–2016, irrigation period).
| RMF | Start | End | Volume (86,400 m3) | Duration (day) | DSI |
|---|---|---|---|---|---|
| 20 | 09-15-2015 | 09-28-2015 | 13.7 | 14 | 0.00256 |
| 21 | 09-04-2015 | 09-11-2015 | 9.8 | 8 | 0.00102 |
| 09-14-2015 | 09-30-2015 | 30.2 | 17 | 0.00669 | |
| 22 | 09-04-2015 | 09-11-2015 | 25.8 | 8 | 0.00263 |
| 09-14-2015 | 09-30-2015 | 47.2 | 17 | 0.01022 | |
| 23 | 09-04-2015 | 09-11-2015 | 25.8 | 8 | 0.00257 |
| 09-14-2015 | 09-30-2015 | 64.2 | 17 | 0.01358 | |
| 24 | 09-04-2015 | 09-30-2015 | 107.6 | 27 | 0.03537 |
Table 7.
Streamflow deficit events and their severity indexes for Bugang (2012–2016, non-irrigation period).
Table 7.
Streamflow deficit events and their severity indexes for Bugang (2012–2016, non-irrigation period).
| RMF | Start | End | Volume (86,400 m3) | Duration (day) | DSI | Euclidean Distance |
|---|---|---|---|---|---|---|
| 10 | 01-12-2016 | 01-16-2016 | 3.2 | 5 | 0.00026 | 0.08011 |
| 02-06-2016 | 02-11-2016 | 4.2 | 6 | 0.00040 | ||
| 03-25-2016 | 03-30-2016 | 2.4 | 6 | 0.00023 | ||
| 11 | 10-16-2015 | 10-26-2015 | 7.1 | 11 | 0.00121 | 0.07899 |
| 01-09-2016 | 01-17-2016 | 9.9 | 9 | 0.00138 | ||
| 01-31-2016 | 02-11-2016 | 13.8 | 12 | 0.00255 | ||
| 03-23-2016 | 04-05-2016 | 13.7 | 14 | 0.00296 | ||
| 12 | 10-16-2015 | 10-26-2015 | 18.1 | 11 | 0.00296 | 0.051829 |
| 01-06-2016 | 02-11-2016 | 53.6 | 37 | 0.02952 | ||
| 02-21-2016 | 02-26-2016 | 12.3 | 6 | 0.00110 | ||
| 03-15-2016 | 04-06-2016 | 37.1 | 23 | 0.01269 | ||
| 13 | 10-15-2015 | 10-26-2015 | 29.8 | 12 | 0.00513 | 0.18401 |
| 12-26-2015 | 03-04-2016 | 104.1 | 70 | 0.10449 | ||
| 03-14-2016 | 04-06-2016 | 60.7 | 24 | 0.02089 | ||
| 14 | 10-13-2015 | 11-06-2015 | 45.5 | 25 | 0.01575 | |
| 12-26-2015 | 04-11-2016 | 192.9 | 108 | 0.28819 |
© 2018 by the authors. Licensee MDPI, Basel, Switzerland. This article is an open access article distributed under the terms and conditions of the Creative Commons Attribution (CC BY) license (http://creativecommons.org/licenses/by/4.0/).
Share and Cite
MDPI and ACS Style
Sung, J.H.; Seo, S.B. Estimation of River Management Flow Considering Stream Water Deficit Characteristics. Water 2018, 10, 1521. https://doi.org/10.3390/w10111521
AMA Style
Sung JH, Seo SB. Estimation of River Management Flow Considering Stream Water Deficit Characteristics. Water. 2018; 10(11):1521. https://doi.org/10.3390/w10111521
Chicago/Turabian StyleSung, Jang Hyun, and Seung Beom Seo. 2018. "Estimation of River Management Flow Considering Stream Water Deficit Characteristics" Water 10, no. 11: 1521. https://doi.org/10.3390/w10111521
Note that from the first issue of 2016, this journal uses article numbers instead of page numbers. See further details here.