Article

Determination of Removal Efficiencies for Escherichia coli, Clostridial Spores, and F-Specific Coliphages in Unit Processes of Surface Waterworks for QMRA Applications

1
Expert Microbiology Unit, Department of Health Security, National Institute for Health and Welfare, P.O. Box 95, FI-70701 Kuopio, Finland
2
Impact Assessment Unit, Department of Public Health Solutions, National Institute for Health and Welfare, P.O. Box 95, FI-70701 Kuopio, Finland
3
Environmental Technology Teaching and Research Unit, Savonia University of Applied Sciences, P.O. Box 6, FI-70201 Kuopio, Finland
4
Environmental Health Unit, Department of Health Security, National Institute for Health and Welfare, P.O. Box 95, FI-70701 Kuopio, Finland
*
Author to whom correspondence should be addressed.
Water 2018, 10(11), 1525; https://doi.org/10.3390/w10111525
Submission received: 17 September 2018 / Revised: 12 October 2018 / Accepted: 18 October 2018 / Published: 26 October 2018
(This article belongs to the Section Wastewater Treatment and Reuse)

Abstract

:
The removal efficiencies of bacteria, bacterial spores, and viruses after a change in source water and water pH in coagulation were studied at pilot scale in coagulation with flotation, rapid sand filtration, and disinfection with UV and chlorine. The results were compared to the treatment efficiencies of full-scale waterworks and data from literature. A quantitative microbial risk assessment (QMRA)-method was applied to estimate the numbers of illness cases caused by Campylobacter and norovirus after simulation of six operational malfunction scenarios. Coagulation with flotation and disinfection were more efficient in removing Clostridium spp. spores and MS2 coliphages than sand filtration in the pilot scale experiments (p < 0.001–0.008). The removal of E. coli was more efficient in sand filtration and in disinfection compared to coagulation with flotation (p = 0.006 and 0.01). Source water or pH change in coagulation had not significant effects on the removal efficiency of microbes. In QMRA, when disinfection was not in use, an increase in the number of illness cases compared to the normal situation was noticed. The variability in the number of illness cases demonstrated the importance of site-specific data in QMRA. This study provides new information on applying QMRA in both pilot and full-scale waterworks.

Graphical Abstract

1. Introduction

Delivering safe drinking water to consumers is the main objective of water treatment. Typically, the quality of source water determines the treatment processes used in purification [1]. The drinking water produced from surface water must be adequately treated before distribution. Conventional treatments used worldwide for production of drinking water from surface waters include chemical and physical processes such as coagulation, flocculation, and rapid sand filtration [2]. Some chemical adjustments and disinfection are also employed as final processes to ensure the safety and good aesthetic quality of drinking water [3].
Fecal indicator microbes are widely used in estimation of the microbial health risks in drinking water [4]. E. coli is used as the primary fecal indicator in water safety assessments, since all mammalian feces contain high levels of these bacteria [5]. The challenge of E. coli indication is associated with its poor survival in water treatment and disinfection processes as compared to many other microbes. The group of sulphite-reducing and spore forming clostridia—including e.g., Clostridium perfringens—has an outstanding survival capacity in different environments and also high resistance against disinfection [6,7]. In water and soil, the spores of Clostridium perfringens are regarded as a sign of old or transmitted fecal contamination [5,8]. Coliphages have been proposed to indicate the presence of enteric viruses in water and are often used as model organisms when evaluating the efficiency of water treatment, mainly chlorination [8,9]. Especially, F-specific RNA coliphages, such as MS2, have similar size and shape and comparative persistence in environmental conditions to many enteric viruses infecting humans, such as noroviruses [5,8,9].
The World Health Organization (WHO) has constructed comprehensive guidelines for assessing the safety and risks of drinking water production, purification, disinfection, and distribution [10]. In Europe, the European drinking water directive [11] sets minimum requirements for drinking water quality. As additional national recommendations, a Water Safety Plan approach (based on guidelines of WHO [12]) has been taken into use in Finland and elsewhere [13] to help risk assessment and management in waterworks to guarantee the safety of drinking water to consumers. Quantitative microbial risk assessment (QMRA) is a method to estimate the health burden of waterborne infections [14]. The QMRA approach combines the information of source water quality with values of treatment efficiency, dose–response relationships of pathogenic microbes and exposure data in order to obtain the magnitude of risk, e.g., estimated infections per person per year. Computational QMRA-tools, as developed in the Netherlands, can be utilized in the risk assessment for a whole drinking water production chain from surface water to potable water [15,16].
In most cases in the developed world, the assessment of drinking water treatment process removal efficiency for fecal microbes is not possible at full-scale waterworks due to the low numbers of microbes in source water, even before any processes. Therefore, pilot scale or laboratory scale experiments in which the test microbes are added to the system are used to study the removal efficiencies of microbes in the drinking water treatment processes. In this study, log10 removal efficiencies of coagulation with flotation, rapid sand filtration, UV treatment, and chlorination were determined at a pilot scale waterworks (PWW) for bacteria, bacterial spores, and viruses in normal and altered circumstances assuming that individual treatment process has different removal efficiency against studied microbes. Furthermore, the performance of ozonation and activated carbon filtration was evaluated at a full-scale waterworks (FWW) and QMRA was used to check whether the FWW processes are fit for their purpose in terms of water safety assuming QMRA to be suitable tool for risk management purposes. The treatment efficiencies and our estimates of potential health risks for water consumers can be used in evaluations of possible consequences of water treatment malfunctions at waterworks.

2. Material and Methods

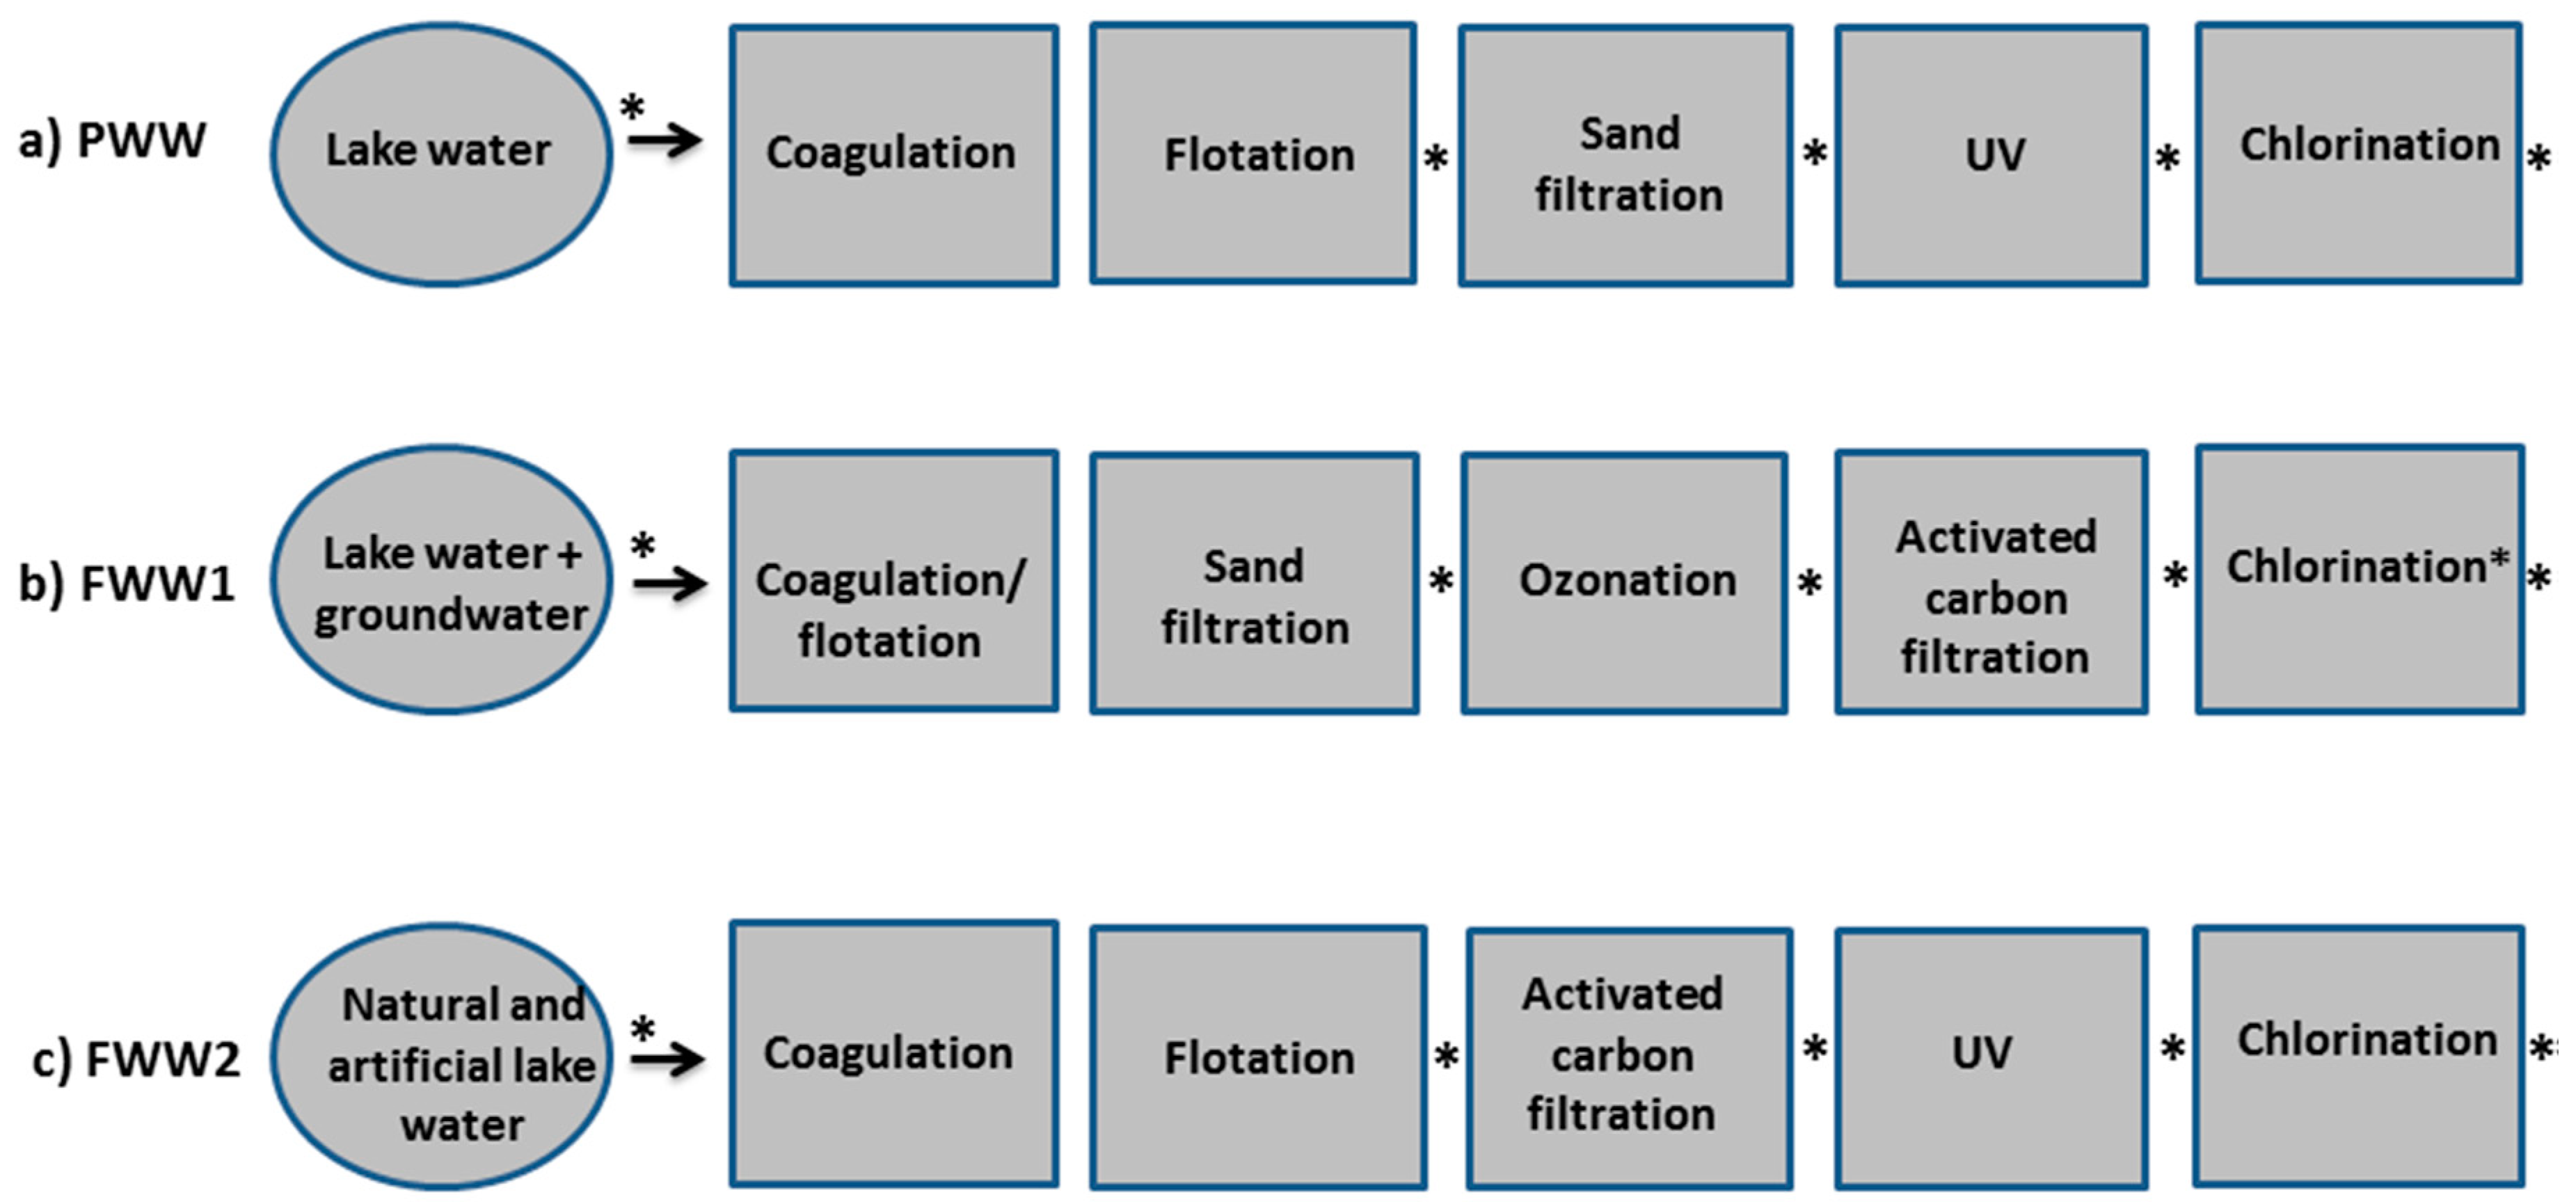
2.1. Pilot Scale Waterworks

The PWW used in this study is a surface waterworks with a drinking water production capacity of about 29 m3/day. The PWW utilizes a total of five treatment processes units in line for water treatment (Figure 1a). The process begins with mixing of the coagulation chemical (ferric sulphate) at the rate of 1200 rpm to the source water. Adjustment of pH is also made at this point. Three water tanks are reserved for flock formation immediately after the mixing and the flock is removed in a flotation process using dispersion water and a surface scraper. After flotation, the water goes to the rapid sand filter composed of both quartz sand and anthracite layers (grain size 0.7–1.2 mm and 2.5–4.0 mm, respectively). The sand filter is backwashed for 15 min once a day. The last step in the water treatment is disinfection with UV light irradiation and chlorination. For UV disinfection, low-pressure mercury vapor lamps are used with a wavelength ca. 253.7 nm and the flow of water through the UV chamber is 1.1 m3/h (dose 60 mWs/cm2). Finally, sodium hypochlorite (NaOCl) solution is fed at doses between 0.1 and 0.5 mg/L into the water leaving the PWW.

2.2. Full-Scale Waterworks 1 and 2

The two FWW included in this study are located in southern Finland. The source water for the full-scale waterworks 1 (FWW1) is mostly lake water but occasionally the source water also includes a minor proportion of groundwater. The conventional water treatment steps (coagulation, flotation, sand filtration) are accompanied at FWW1 with ozonation and activated carbon filtration. However, UV-treatment was not in use before chlorination (Figure 1b). Full-scale waterworks 2 (FWW2) is located in connection with a food factory. FWW2 uses lake water as its source water with a few percent addition of water from another (artificial) lake. Most of the produced water (in 2009–2010 on average 1600 m3/day) is used for the purposes of the food factory. In addition, the FWW2 serves ca. 4000 household customers [17]. FWW2 uses typical processes for surface waterworks but has activated carbon filtration instead of sand filtration before disinfection (Figure 1c).

2.3. Experimental Design at the Pilot Scale Waterworks

The PWW source water was taken from two locations in Lake Kallavesi, Kuopio, Finland. The water taken from Ritisenlahti contained more humus and had higher turbidity, color, and amount of total organic carbon than the Savilahti water representing good quality lake water in this study (Table S1). Three test series with microbial spikes were conducted at the PWW (Table 1). In addition to changing of source water, the effects of different pH conditions in coagulation were also tested to the removal of microbes.
The microbial spike in the PWW test series included Escherichia coli (environmental strain from a waterborne outbreak in the Finnish town of Nokia [18]), Clostridium bifermentas (NCTC 506) and MS2 coliphage (NCTC 12487). The bacterial spike preparation procedure was adapted from Schjiven et al. [19]. A loopful of E. coli, which had been grown overnight on tryptone soya agar (TSA, Oxoid, Hampshire, UK), was re-suspended into 2000 mL buffered peptone water (BPW) and incubated in a shaking incubator for 24 h at 36 ± 2 °C, 100 rpm. The E. coli cells in BPW were separated by centrifugation (4500 rpm, 10 min), the supernatant was decanted away and the cells were re-suspended into the test water. C. bifermentas was cultured in anaerobic conditions on Columbia agar base medium (Oxoid, Hampshire, UK) for 24 h at 37 °C and colony material from several plates was streaked into the test water. MS2 coliphage was produced using an E. coli host (ATCC 700891) following the principles presented in ISO 10705-1 [20]. Chloroform (1:10 v/v) was used to extract phages from the solution. Aqueous phase was centrifuged at 5000 g for 20 min at 4 °C and then filtered through a 0.45 µM filter (Acrodisc, Pall Corporation, Hampshire, UK). Phage stock solution was stored at 4 °C until use. E. coli, C. bifermentas and MS2 spikes were combined into 20 L of source water just before pumping into the PWW.
In each test series, microbial spike was injected to the side stream of the waterworks at the rate of 6 L/h (total discharge ca. 1.2 m3/h). The time taken for the injection of 20 L was three hours, after which Savilahti water was again used as source water regardless of the source water used during the injection. Three replicate samples were taken from sampling points during the predetermined period of highest counts of injected microbes (Figure S1) and analyzed on the same or following day (Supplementary Materials S1.1 and S1.2). In PWW1, samples were also taken after 6, 9, 24, and 48 h to determine the retention times of the microbes in the PWW processes.
Disinfection chemical was neutralized from the chlorinated samples with sodium thiosulphate (Na2S2O3 × 5 H2O, 18 mg/mL). The background contamination level was determined from control samples taken after every unit process before each test series when Savilahti water was used as the source water.

2.4. Full-Scale Monitoring

The monitoring of water quality at the FWW was performed during the winters of two consecutive years. The presence of noroviruses, Campylobacter spp., E. coli, spores of C. perfringens, and F-specific coliphages were analyzed from the samples (Supplementary Materials S1.1). Physico-chemical parameters such as temperature, pH, electric conductivity, and turbidity were also analyzed (Supplementary Materials S1.2).
In total, 15 sampling events in the FWW1 were conducted about once a month. The samples were taken from source waters (surface and groundwater merged into one or as separated samples), and after different purification steps (Figure 1b). Three out of 15 sampling events in FWW1 were conducted after failures to meet the water quality standards during basic monitoring or after process malfunction situations. As an example, FWW1 suffered from problems with ozonation during the study, and an additional sampling event was organized after a breakdown of flotation and ozonation.
There were a total of 16 sampling events at the FWW2. The samples were taken from source water (both source waters pooled into one or separate samples), after flotation, after activated carbon filtration, after UV-disinfection, and after chlorination (Figure 1c). Three of the 16 sampling events were after finding spores of C. perfringens either after UV-treatment or after chlorination.

2.5. Data Analysis

In all data analyses, quantitative results below the detection limit were reported as 0.5 cfu, pfu, or GC per studied sample volume. Qualitative results (F-specific coliphages) were reported as 1 pfu per studied sample volume in the case of presence and as 0.5 pfu per studied sample volume in the case of absence. In the PWW test series, if control samples taken before the microbial injection contained the studied microbes, the background level was subtracted from the actual test results.
Based on the flow of microbial spike (Figure S1) in PWW, log10 removal was calculated pairwise from parallel samples one by one with formula log10 = number of microbes after the unit process/number of microbes before unit processes. Single log10 removal values of treatment steps were used in further data analyses (statistics and QMRA). As in PWW, in FWW single log10 removal values of different treatment steps were calculated for every sampling day. Total removal in PWW and FWW was calculated as a sum of mean removals of included treatment processes.
Microsoft Excel 2010 software was used for recording all the individual results. Statistical analyses were performed with the IBM Statistical Package for Social Sciences (SPSS) 22 (IBM Corp., Armonk, NY, USA). The risk of infection and illness per person per day was calculated with Monte Carlo simulations using Analytica version 4.3.3.4, Educational Professional edition (Lumina Decision Systems, Inc., Los Gatos, CA, USA) with 10000 iterations. In QMRA tool comparison, QMRAspot with Wolfram CDF player 11.3 (Wolfram Research, Inc., Oxfordshire, UK) was used.
The significances of differences in log10 removal efficiencies between the test series and between the unit processes of PWW were tested with the non-parametric Kruskal–Wallis test and pairwise comparisons using the Dunn-Bonferroni approach. The significances of differences between log10 removals of E. coli, spores of Clostridium spp., and MS2 coliphages in each unit process of PWW were tested using the non-parametric Friedman’s two-way ANOVA rank test. p < 0.05 was used to indicate a statistically significant difference between the groups in all tests.

2.6. QMRA at Pilot Scale and Full-Scale Waterworks

The QMRA method [14,21] was applied to investigate the applicability of the log10 removal results obtained from PWW experiments and from the literature in order to estimate possible health effects after operational malfunction situations in waterworks. Business as usual (BAU) and six malfunction scenarios were chosen to simulate situations in the treatment processes of PWW and FWW2:
  • Coagulation + flotation 50%: removal efficiency of coagulation with flotation 50% lower compared to BAU
  • Rapid sand filtration 50%: removal efficiency of rapid sand filtration 50% lower compared to BAU
  • Activated carbon 50%: removal efficiency of activated carbon filtration 50% lower compared to BAU
  • UV + chlorination 50%: UV and chlorination 50% lower compared to BAU
  • UV + chlorination 0%: UV and chlorination not in use
  • No treatment: source water used directly for human consumption without any treatment
Health estimates were calculated using counts of Campylobacter spp. and noroviruses detected in the source water of FWW2 during the two-year monitoring (Table S2). In addition, an imaginary source water contamination with minimum 50, mean 100, and maximum 150 microbes/100 mL was used (Table S2). Log10 removal efficiencies of PWW unit processes for E. coli and MS2 were supplemented with values from the literature and used in three different treatment process data sources to estimate the exposure to Campylobacter spp. and noroviruses via drinking water (Table S2). The literature-based data source (1) and the PWW data source (2) were comparable with regard to the treatment processes; the literature-based data source used literature-based removal data, whereas the PWW data source applied the removal data obtained from the PWW in this study. The third data source (3) included the same treatment processes as in FWW2, with removal efficiencies based on PWW waterworks except that the activated carbon removal data was from the literature. Consumption estimate, i.e., the volume of unboiled drinking water consumed per person per day, was 0.87 L and was obtained from a Finnish dietary study [22]. Dose responses used for Campylobacter spp. and noroviruses were based on literature data [23,24,25] (Table S2) and results were presented as number of illness cases per day per 100,000 population.
For comparison to QMRA calculations used in this study, Campylobacter spp. infection risks were calculated with QMRAspot [15,16]. Comparison was using scenarios BAU, UV + chlorination 0% and no treatment and calculations were based on PWW and literature removal efficiencies (treatment process data sources 1–3) as described earlier. Mean number of Campylobacter spp. in the source water (measured and contamination) and mean log10 removals were imported to QMRAspot (Table S2). Water consumption volume of two liters (included in QMRAspot, [10]) was used in the comparison.

3. Results

3.1. Microbial Counts in Full-Scale Waterworks

In FWW1, low numbers of indicator microbes were present in the source water in most samples (Table S3). Further, a low count of spores of C. perfringens was detected during a single sampling event after sand filtration, ozonation, activated carbon filtration, and chlorination (<1 cfu/100 mL; Table S3). During the same sampling event, E. coli was detected after activated carbon filtration (0.02 cfu/100 mL; Table S3). In other sampling events, pre-determined or additional indicator microbes were not studied or detected in unit processes after the source water. Campylobacter spp. was analyzed from source water of FWW1 seven times and noroviruses five times out of 15 sampling events. Low count (ca. 0.5 cfu/L) of Campylobacter spp. was detected once and noroviruses were not detected at all.
In FWW2, in addition to counts enumerated in the source water, low spore counts of C. perfringens (maximum 2.5 cfu/100 mL) and plaques of F-specific coliphages (maximum 2 pfu/100 mL) were detected after flotation in almost all samples (Table S3). F-specific coliphages were detected qualitatively in five out of 11 samples and spores of C. perfringens in six out of 13 samples (maximum 0.8 cfu/100 mL) after activated carbon filtration (Table S3). At one occasion spores of C. perfringens after UV treatment were found (0.8.cfu/100 mL). Two more samplings were conducted after finding spores of C. perfringens after chlorination (Table S3). However, C. perfringens was not detected during the additional samplings. Campylobacter spp. was detected from source water of FWW2 (5–500 cfu/L) 9 out of 10 times tested and noroviruses (below limit of quantification, estimation ca. 17 GC/L) 4 out of 13 times tested.

3.2. Physico-Chemical Results in Pilot Scale and Full-Scale Waterworks

The PWW results indicate that the increase of pH in PWW3 was successful: the pH was higher after flotation and sand filtration in PWW3 (mean pH 5.6 and 5.7, respectively) than in PWW1 (mean pH 5.1 and 5.3, respectively) and PWW2 (mean pH 4.5 in both processes) (Table S1). The difference between PWW2 and PWW3 was significant in both process locations, after flotation and after sand filtration (p = 0.05 and p = 0.021, respectively).
During water treatment in PWW, CODMn decreased more in PWW1 and PWW2 than in PWW3 (Table S1). Total log10 removal of TOC was the most efficient in PWW3: 0.8 versus 0.4 and 0.6 in PWW1 and PWW2, respectively. For color and turbidity the best total log10 removals were observed in PWW2 (1.9 and 1.9, respectively).
Mean electric conductivity and turbidity were higher in the source water of FWW2 than in FWW1 (Table S1). In one sampling of FWW2, turbidity was notably higher in source water (25 NTU) and also throughout the treatment process up to the disinfection, compared to other sampling events. In FWW1, the wide standard deviation in pH and turbidity after disinfection can be explained by two sampling events when problems in lime feeding occurred (Table S1). In the FWW, seasonal variation was seen as wide standard deviation in water temperature (Table S1).

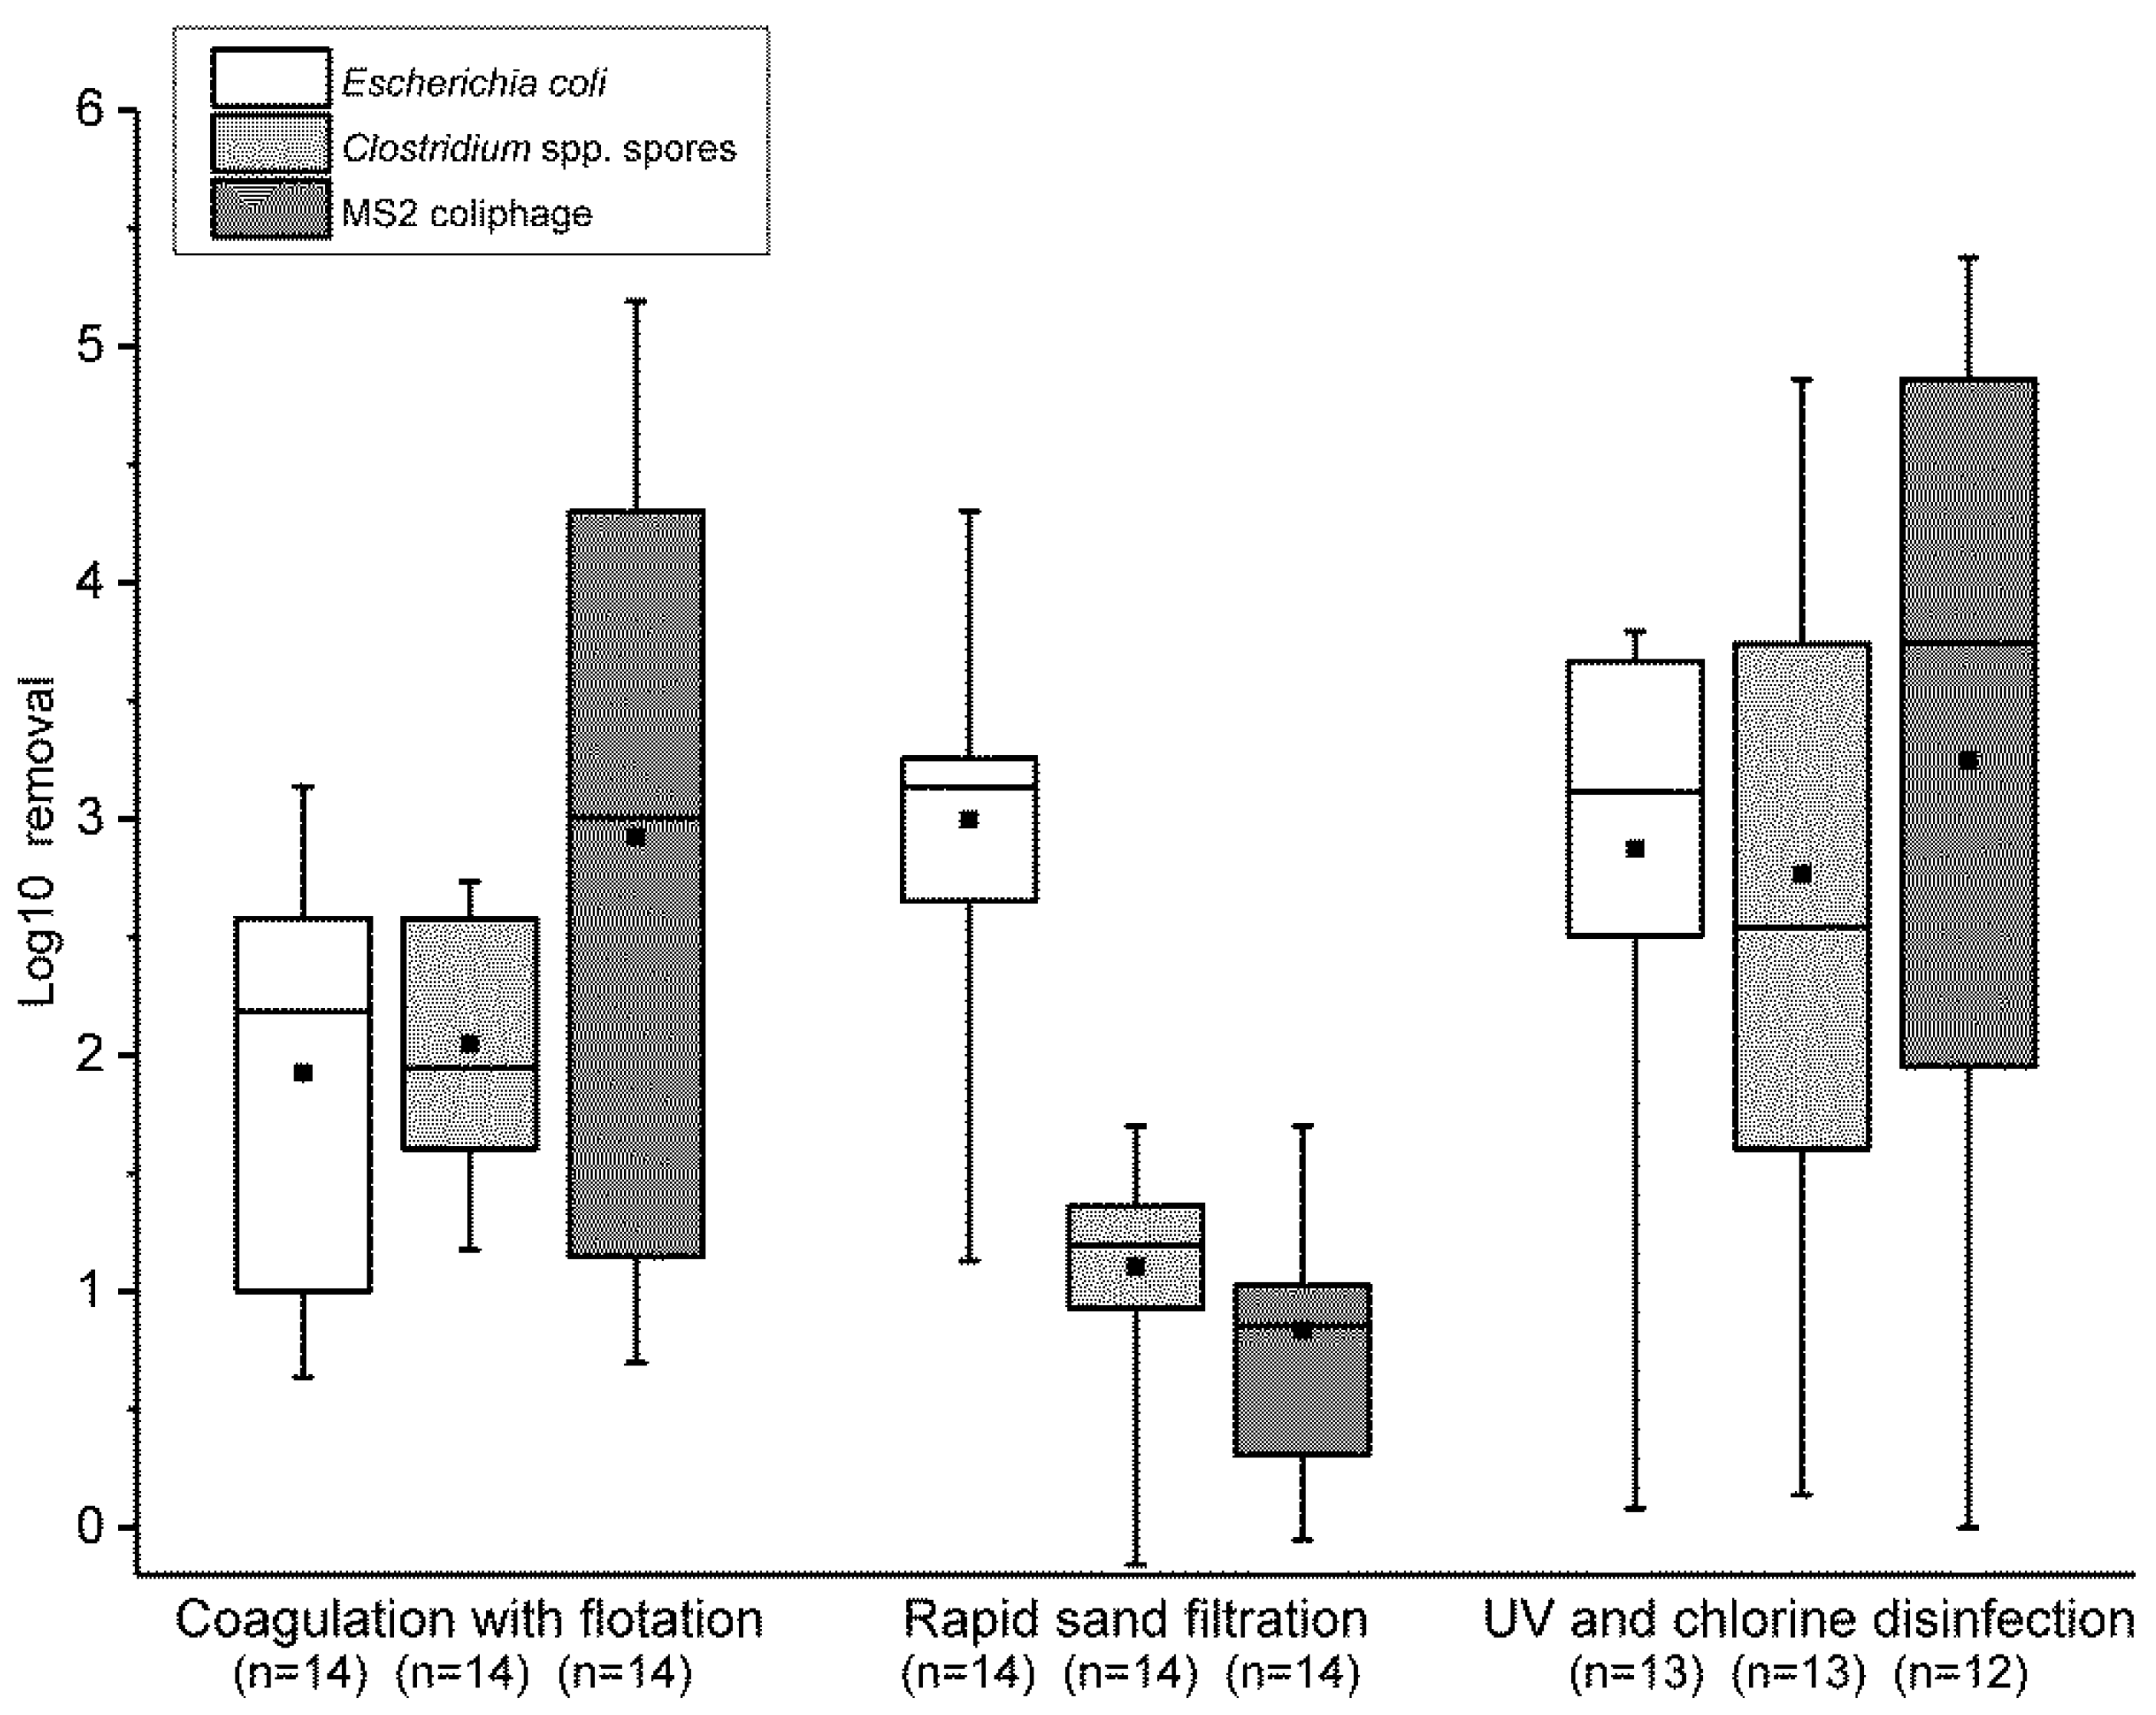
3.3. Microbial Log10 Removals of Treatment Processes in Pilot Scale and Full-Scale Waterworks

3.3.1. Microbial Log10 Removals in the PWW Test Series

The most efficient removal of E. coli, Clostridium spp. spores, and MS2 coliphages in coagulation with flotation were in PWW2 (mean removals 2.8, 2.6, and 4.2, respectively; Table S4). Sand filtration removed MS2 coliphage significantly better in PWW3 (mean removal 1.5) than in PWW1 (mean removal 0.6) (p = 0.026; Table S4). For Clostridium spp. spores and E. coli, the highest removal rates during sand filtration were in PWW2 (mean removals 1.4 and 3.5, respectively; Table S4). After UV and chlorine disinfection, Clostridium spp. spores were significantly better removed in PWW3 (mean removal 4.4) than in PWW2 (mean removal 1.2) (p = 0.010; Table S4). Disinfection removed E. coli and MS2 coliphage significantly more efficiently in PWW3 (mean removals 3.8 and 5.3, respectively) than in PWW1 (mean removals 2.5 and 2.0, respectively) (p = 0.037 and 0.026, respectively; Table S4).
Total log10 removal of the whole treatment process in PWW was less efficient for spores of Clostridium spp. than for E. coli or MS2 coliphage, especially in PWW2 (mean total removals 5.2, 9.2, and 8.8, respectively) (Table 2). Total mean log10 removal of E. coli was at approximately the same level in all test series (Table 2). MS2 coliphage was removed most efficiently in PWW3; on average log10 removal was more than 9, although the maximum value was over 10 in PWW1 (Table 2).

3.3.2. Microbial Log10 Removals in PWW Treatment Processes

The treatment efficiency of coagulation with flotation was significantly better for MS2 coliphage than for E. coli (mean removals 3.0 and 1.9, respectively) (p = 0.014; Figure 2). Sand filtration was significantly more efficient in removal of E. coli (mean removal 3.0) than of Clostridium spp. spores (mean removal 1.1) or MS2 coliphage (mean removal 0.84) (p = 0.002 and p < 0.001, respectively; Figure 2). There were no significant differences between microbes in removal capacity of UV and chlorine disinfection, but on average the disinfection was the most efficient against MS2 coliphage (mean removal 3.2; Figure 2).
The treatment efficiency of coagulation with flotation was significantly better than that of sand filtration for the Clostridium spp. spores (mean removals 2.1 and 1.1, respectively; p = 0.003) and MS2 coliphage (mean removals 3.0 and 0.8, respectively; p = 0.008) (Figure 2). Furthermore, the removal efficiency of UV and chlorine disinfection was significantly better for Clostridium spp. spores (mean removal 2.9) and MS2 coliphage (mean removal 3.2) than the efficiency of sand filtration (p < 0.001 and p = 0.006, respectively; Figure 2). Sand filtration and UV and chlorine disinfection (mean removals 3.0 and 2.9, respectively) removed E. coli significantly better than coagulation with flotation (mean removal 1.9) (p = 0.006 and 0.01, respectively; Figure 2).
As presented in Tables S3 and S4, almost all the E. coli and MS2 coliphage results after disinfection were below the limit of detection, and log10 removals were calculated as estimates. Further, log10 removals of Clostridium spp. spores after disinfection were also calculated as estimates in PWW1 and PWW2 (Tables S3 and S4). In PWW1, log10 removals of MS2 coliphages after coagulation with flotation, and of E. coli and MS2 coliphages after sand filtration are also estimates because of results below the detection limit and the use of qualitative results (Tables S3 and S4).

3.3.3. Microbial Log10 Removals in FWW Treatment Processes

Microbial counts of E. coli, C. perfringens spores, and F-specific coliphages were low or below detection limit after unit processes in FWW (Table S3). Therefore, the removal efficiencies of treatment processes are probably underestimated (Table 2 and Table 3). In FWW1, low microbial counts (<1 cfu/100 mL) gave the impression that ozonation and activated carbon filtration increased microbial counts in water (Table 3). In FWW2, removal efficiency of activated carbon filtration was less than 1 log (Table 3). Although only low microbial counts were detected in FWW, similarities were observed in the mean removals of Clostridium spp. spores after coagulation with flotation in PWW1 (mean removal 1.9), PWW3 (mean removal 1.9) and FWW2 (mean removal 1.9) (Table 3 and Table S4). In PWW2, mean removal was higher (2.6), and in FWW1 the first sample after the source water was taken after sand filtration.
In FWW2, spores of E. coli and C. perfringens exhibited better total log10 removals than F-specific coliphages (mean removals 3.4, 3.1, and 2.4, respectively; Table 2). Because of low microbial counts in FWW, the results are not in line with the PWW experiments (see Section 3.3.1 and Table 3).

3.4. QMRA-Results

Based on scenarios where coagulation + flotation and sand filtration removal efficiencies were 50% lower compared to BAU situation and when treatment process data sources 1 and 2 were used, the operational malfunction in waterworks seemed not endanger significantly the drinking water safety (Table 4). When using treatment data source 3, Campylobacter spp. illness cases were noted in all scenarios (Table 4). However, the scenario in which UV + chlorination were not in use (UV + chlorination 0%) showed a notable increase in illness cases (at the most 5 200 norovirus and 3 300 Campylobacter illness cases/100,000 population per day) compared to BAU. The increase of illness cases in coagulation + flotation 50%, sand filtration 50%, and activated carbon 50% scenarios was at the most four for norovirus and 380 for Campylobacter/100,000 population per day (Table 4). UV and chlorination appears to ensure drinking water quality even when not working properly, as was indicated by the malfunction scenario UV and chlorination 50% (Table 4). In this malfunction scenario, not more than five norovirus and 100 Campylobacter illness cases per population of 100,000 per day were estimated if the source water was contaminated (Table 4). As anticipated, the numbers of illness cases were highest (6400–99,900 cases/100,000 population per day) in the scenario in which the source water was consumed without any treatment (Table 4).
The number of illness cases per population of 100,000 per day for noroviruses was higher than for Campylobacter spp. in the scenario in which the source water was consumed without any treatment due to higher infectivity of norovirus (Table 4). In other scenarios, the dominant microbe causing the illnesses varies between treatment process data sources and source water, indicating differences in removal efficiencies of unit processes based on PWW and literature. However, in the treatment process data source 3, the number of Campylobacter illness cases was higher than of norovirus illness cases in all scenarios (Table 4), probably due to lack of sand filtration in the treatment process chain.
The number of illness cases was higher when calculations were based on contamination situation in source water (Table S2) compared to calculations based on measured numbers of studied pathogens in the source water of FWW2 (Table S2) indicating the important meaning of microbiological quality of source water in regards of human health in drinking water production.
In other processes than UV and chlorine disinfection, the removal efficiencies were generally better in PWW experiments than described in the literature (Table S2). Literature-based removal efficiency of UV and chlorination (treatment process data source 1; Table S2) is remarkably higher compared to the removal efficiency detected in PWW experiments (treatment process data source 2; Table S2), which causes remarkable differences in the results of UV + chlorination 0%—scenario between treatment process data sources 1 and 2 (e.g., in contamination situation in source water 5 200 and 95 norovirus illness cases/100,000 population per day, respectively) (Table 4). In this scenario, treatment efficiency of previous processes can reduce the number of microbes better in calculations based on PWW experiments (treatment process data source 2) than in those based on literature data (treatment process data source 1), emphasizing the importance of disinfection.
The comparison of Campylobacter spp. infection risks per person per day calculated in this study were mostly congruent with infection risks calculated with QMRAspot indicating the reliability of both models (Table S5). In treatment process data source 1, the infection risks in this study were at the most one logarithm lower than those of QMRAspot (Table S5). In treatment process data sources 2 and 3, the infection risks in this study were higher than results of QMRAspot. The only exception was scenario UV + chlorination 0% calculated with treatment process data source 3 and contamination in source water, when results were almost the same (Table S5).

4. Discussion

This study provides further evidence that the use of multiple drinking water treatment processes protects the water safety and process malfunction does not always endanger the effective removal of microbes. A single unit process—such as coagulation and flotation, sand filtration, or disinfection—may have differential removal efficiencies for different microbes, such as E. coli, spores of Clostridium spp. and MS2 coliphages. QMRA calculations in this study demonstrated that disinfection with UV and chlorination is an essential step in ensuring the supply of safe drinking water to consumers. Discrepancies in available data caused variability in the QMRA results, demonstrating the importance of site-specific data in estimating the health impacts of drinking water.
Log10 removals are difficult to study in full-scale waterworks due to the low number of target microbes in source water. The counts are even lower after the water treatment, which indeed reflects the main aim of water treatment, which is to reduce impurities in water. When microbial results are below the detection limit, only estimates of removal rates can be achieved. This is a limitation in QMRA, which can be handled by using assumptions of removal efficiencies, based either on pilot scale experiments or on existing literature [21]. In this study, values from the literature are presented in comparison to the pilot scale and full-scale values in Table 3.
Pilot experiments in this study showed better maximum removals in coagulation with flotation for coliphages compared to bacterial spores and bacteria, confirming earlier observations [2,10]. This was not the case in FWW2, where E. coli was removed most efficiently. However, qualitative results and results below the detection limit in FWW2 hamper the reliability of results. In the PWW of this study, average log10 removals after iron-based coagulation with flotation in three different test series for spores of Clostridium spp. and for E. coli were about 2.5 logarithms, and for MS2 coliphage about 4 logarithms, representing better removal efficiencies than presented in the literature [2,10]. For example, the review of LeChevallier et al. [32] concluded that coagulation, flocculation and sedimentation can result in 1–2 log10 removals of bacteria, viruses and protozoa. One explanation for this discrepancy is that depending on the virus, there may be high variation in removal efficiency of coagulation, e.g., MS2 is typically removed efficiently but enteric echovirus at much lower rates [32]. Bell et al. [33] reported iron-based coagulation to be more efficient in removal of E. coli, C. perfringens spores, Giardia cysts, and Cryptosporidium oocyst than aluminum-based coagulation. Furthermore, they concluded that coagulation conditions such as pH and source water quality had a greater effect on removal efficiency than the coagulant itself. In this study, only iron-based coagulation was in use and effect of coagulant was not studied.
Rapid sand filtration is known to be purely physical treatment process, which remove suspended solids from water by size exclusion and adsorption most efficiently after for example coagulation or sedimentation [34,35]. The removal efficiency of sand filtration for E. coli has shown discrepant results depending on the study. The removal efficiency of sand filtration in our study was the highest for E. coli compared to spores of Clostridium spp. and MS2 coliphages, in accordance with the maximum removals reported in WHO’s document [10]. This deviates from the values reported by Hijnen & Medema [2], who reported that sand filtration was not very efficient in removing E. coli. However, Hijnen & Medema [2] reported removal figures for sand filtration for bacterial spores and viruses that are in accordance with the values from our PWW experiments. In another study, Rajala et al. [26] found sand filtration to be more efficient in removing fecal coliforms and spores of sulphite-reducing Clostridia than coliphages in laboratory scale experiments performed with treated sewage. They concluded that mechanical sand filtration is not very effective, and that the maximum log10 removal achieved was 0.48. In pilot scale experiments the removals were better (0.66–2), but typically bacteria had higher removal than coliphages [26]. Log10 removal of MS2 coliphages during sand filtration in our PWW experiments was on average 0.8 and for spores of Clostridium spp. and E. coli the average removals were 1.1 and 3.0, respectively, which indicates that sand filtration is an effective treatment step especially for removing bacteria from water. Sokolova et al. [36] reported E. coli log10 removal during rapid sand filtration in Swedish full-scale waterworks to be between 1.8 and 3.2, which is close to the removals of E. coli found in our PWW experiments. The discrepancy in E. coli results might be explained by different study set-ups; both full-scale and pilot scale experiments and sewage treatment results are included in the reviews of WHO [10] and Hijnen & Medema [2]. Another reason could be the vulnerability and loss of cultivability of E. coli cells compared to spores of bacteria and coliphages under conditions of environmental stress such as disinfection or other water treatment processes [8]. Therefore, the removal efficiency of sand filtration might be overestimated in PWW experiments if only cultivable counts of E. coli are investigated.
Ozonation and activated carbon filtration are not efficient methods for the removal of spores of Clostridium spp. [27,28,29]. Ozonation is more efficient for E. coli and coliphages than for spores of Clostridium spp. [27,28,29]. In our study, ozonation and activated carbon filtration were studied in FWW1, where they increased the numbers of spores of Clostridium spp., E. coli, and F-specific coliphages in water. In FWW2, the removal efficiency of activated carbon filtration for the same microbes was below 1 log. It has also been shown elsewhere that activated carbon filtration is more efficient in removing nutrients than heterotrophic microbes from water [37]. Ozone and activated carbon filtration cannot be used alone for water treatment; they need other processes in order to produce safe drinking water.
As anticipated, the removal results of this study confirm the effectiveness of UV and chlorine disinfection, as reported earlier [28,30,31]. We found that disinfection reduces microbial counts mostly to below the detection limit. The spores of Clostridium spp. were seen as an exception, confirming the Clostridia survival capacity and resistance against disinfection [6,7]. Zyara et al. [38] reported that the resistance of MS2 coliphage to UV was higher compared to many other coliphage isolates even at UV doses of 117 mWs/cm2 with log10 removal of 3.35. Combined treatment with chlorine made disinfection more efficient. In our PWW study, there were no significant differences between studied microbes in the efficiency of disinfection. Clostridium spp. spores were most resistant to UV at a dose of 60 mWs/cm2, with only minor differences compared to E. coli. Chlorination did not improve the disinfection efficiency after UV, probably due to the experimental set-up, in which the microbial counts were mostly below the detection limit and therefore no log10 could be calculated for chlorination. The most important factor in drinking water production is the removal efficiency of the whole chain of treatment processes. In our PWW experiments, total log10 removal of the whole treatment process in all test series was poorer for Clostridium spp. spores than for E. coli or MS2 coliphages.
In this study, the Savilahti and Ritisenlahti lake waters were used as source waters in PWW test series. Water from Ritisenlahti had higher color index, turbidity, and amount of total organic carbon than water from Savilahti. Overall, it was observed that except for CODMn and spores of Clostridium spp. the highest average total removals were observed when Ritisenlahti (PWW2 and PWW3) water was used instead of Savilahti (PWW1). The most significant differences in microbial removal efficiencies between the test series were seen after disinfection. After the pH increase in coagulation in PWW3, a significant difference in removals compared to normal pH in PWW2 was observed only for spores of Clostridium spp. after disinfection. All in all, in our study with only two different raw waters, pH values, and a limited number of repeats, source water quality had more effect on removal capacity than pH in coagulation. This result is well in line with the results of Bell et al. [33], who observed in their study that the optimum pH in coagulation was between about 5.6 and 6.0, depending more on the quality of studied source water than for example on the coagulant.
The highest numbers of Campylobacter and norovirus illness cases in the malfunction scenario of UV and chlorine disinfection in the QMRA calculations demonstrates the crucial role of disinfection in ensuring the safe hygienic quality of drinking water [28,30,31]. As was seen in the QMRA results in our study, removal efficiencies varied between the PWW experiment and the literature especially in UV and chlorine disinfection. These results therefore support the fact that each waterworks has its own individual processes with individual removal efficiencies of microbes, and that without real data QMRA results are only estimates [39]. This highlights the importance of carrying out pilot scale experiments in local conditions and confirming the applicability of literature values prior use. In our study, the counts of Campylobacter and noroviruses were enumerated in source water of FWW2, but we did not have information about the removal efficiency of these pathogens in water treatment and therefore had to use removal information of indicator microbes, which is a very typical and well recognized situation in QMRA [14,21]. However, risk-based water management, such as the Water Safety Plan [12,13], offers possibility to steer monitoring resources towards more relevant needs of health risk assessment. For example, human adenovirus has been successfully used as index pathogen in QMRA studies [40]. Although the obvious and known science gaps in QMRA, Bichai and Smeets [41] have concluded, that these gaps do not compromise the added-value of QMRA as it helps to enforce cost-effective decisions in water safety.
Furthermore, discrepancies in risk assessment models used may cause variability in the QMRA results as noted herein when comparing Campylobacter spp. infection rates calculated using QMRA-model (this study) and QMRAspot [15,16]. Indeed, comparisons between QMRA tools are needed to ensure reliability of results for risk management purposes. Infection risks per person per day calculated in this study were compared to infection risks calculated with QMRAspot [15,16] and some small differences were noticed. Unfortunately, QMRAspot does not include noroviruses, so we were able to perform the comparison only for one pathogen, Campylobacter spp. In our hands, QMRAspot resulted in both lower and higher results than our in-house model, but overall the both models showed in general similar trends when different scenarios and data sources were tested. The comparison ensured the reliability of QMRA results of our in-house model provided in Finland as an open source web-tool Vesiopas (http://fi.opasnet.org/fi/Vesiopas).

5. Conclusions

The quality of source water determines the treatment processes and operation conditions needed for drinking water production. This study provides further evidence indicating that conventional treatment processes like coagulation with flotation, rapid sand filtration, and disinfection with UV and chlorination remove E. coli, spores of Clostridium spp. and MS2 coliphage efficiently. However, an individual unit process may have different removal efficiency against these microbes. Coagulation with flotation and disinfection with UV and chlorination were the most efficient in removing Clostridium spp. spores and MS2 coliphages. For E. coli, the most efficient treatments were rapid sand filtration and disinfection with UV and chlorination. QMRA proved to be practical tool in comparing treatment efficiencies by means of health effects among water consumers. In QMRA estimations of this study, the malfunction in disinfection caused the most illness cases highlighting the importance of disinfection with UV and chlorination as an essential step to secure safe drinking water for consumers. The number of illness cases varied depending on the source data in QMRA, indicating the crucial role of site-specific data in estimating health risks to drinking water consumers. Furthermore, this study provides new information on utilizing indicator and pathogen data in pilot and full-scale waterworks encouraging the use of QMRA tools in water safety and risk management.

Supplementary Materials

The following are available online https://www.mdpi.com/2073-4441/10/11/1525/s1. Supplemental File with: Table S1: Physicochemical water quality in pilot scale and full-scale waterworks. Figure S1: Electric conductivity (eC, µS/cm) in the salt tracer experiment and sampling scheme in PWW based on salt experiment. Chapters S1.1 and S1.2: Description of microbial and physicochemical analysis. Table S2: Variable descriptions, data values and their probability distributions, treatment process data sources and references used in the QMRA. Table S3: The counts of E. coli, Clostridium spp. spores and F-specific coliphages in water samples in pilot scale and full scale waterworks. Table S4: Mean and range of log10 removals for E. coli, Clostridium spp. spores, and F-specific coliphages of the unit processes in pilot scale waterworks. Table S5: Comparison of Campylobacter spp. infection risks (/person/day) calculated in this study and QMRAspot.

Author Contributions

Conceptualization, I.T.M.; Formal analysis, P.M. and A.V.; Funding acquisition, I.T.M.; Investigation, A.H., T.P., A.K., V.M., S.K., and I.T.M.; Methodology, T.P. and P.M.; Project administration, I.T.M.; Supervision, I.T.M.; Visualization, A.H.; Writing—original draft, A.H.; Writing—review & editing, T.P., P.M., A.K., V.M., S.K., A.V., and I.T.M.

Funding

This research was funded by the Finnish funding agency (TEKES) (grant number 70027/09) and the KAUTE Foundation (grant number 201700085).

Acknowledgments

Special thanks are expressed to the research group of the Polaris-project (Development of comprehensive water management system), especially to coordinator Janne Kankkunen (National Institute for Health and Welfare/Geological Survey of Finland). The laboratory personnel of the Expert Microbiology Unit (formerly Water and Health Unit) are also sincerely acknowledged. Minna Pyykkö and Tero Kuhmonen (Savonia University of Applied Sciences) are thanked for help in maintaining the pilot scale waterworks and for taking and analyzing the samples. The full-scale waterworks involved in the project are acknowledged for taking care of sampling.

Conflicts of Interest

The authors declare no conflict of interest.

Abbreviations

BAUBusiness as usual
CFUColony forming unit
CODMnChemical oxygen demand
FWWFull-scale waterworks
PFUPlaque forming unit
PWWPilot scale waterworks
QMRAQuantitative microbial risk assessment

References

  1. Crittenden, J.C.; Trussels, R.R.; Hand, D.W.; Howe, K.J.; Tchobanoglous, G. Water Treatment, Principles and Design, 2nd ed.; John Wiley & Sons, Inc.: Hoboken, NJ, USA, 2005; ISBN 978-0471110187. [Google Scholar]
  2. Hijnen, W.A.M.; Medema, G.J. Elimination of Micro-Organisms by Drinking Water Treatment Processes. A Review; KWR Watercycle Research Institute, IWA Publishing: London, UK, 2010; 102p, ISBN 9781843393733. [Google Scholar]
  3. Bonton, A.; Bouchard, C.; Barbeau, B.; Jedrzejak, S. Comparative life cycle assessment of water treatment plants. Desalination 2012, 284, 42–54. [Google Scholar] [CrossRef]
  4. Payment, P.; Locas, A. Pathogens in Water: Value and Limits of Correlation with Microbial Indicators. Ground Water 2011, 49, 4–11. [Google Scholar] [CrossRef] [PubMed]
  5. Edberg, S.C.; Rice, E.W.; Karlin, R.J.; Allen, M.J. Escherichia coli: The best biological drinking water indicator for public health protection. J. Appl. Microbiol. 2000, 88, S106–S116. [Google Scholar] [CrossRef]
  6. Medema, G.; Bahar, M.; Schets, F. Survival of Cryptosporidium parvum, Escherichia coli, faecal enterococci and Clostridium perfringens in river water: Influence of temperature and autochthonous microorganisms. Water Sci. Technol. 1997, 35, 249–252. [Google Scholar] [CrossRef]
  7. Payment, P. Poor efficacy of residual chlorine disinfectant in drinking water to inactivate waterborne pathogens in distribution systems. Can. J. Microbiol. 1999, 45, 709–715. [Google Scholar] [CrossRef] [PubMed]
  8. Payment, P.; Waite, M.; Dufour, A. Introducing parameters for the assessment of drinking water quality. In Assessing Microbial Safety of Drinking Water–Improving Approaches and Methods; Dufour, A., Snozzi, M., Köster, W., Bartram, J., Ronchi, E., Fewtrell, L., Eds.; IWA Publishing: London, UK, 2003; pp. 47–77. [Google Scholar]
  9. Figueras, M.; Borrego, J.J. New perspectives in monitoring drinking water microbial quality. Int. J. Environ. Res. Public Health 2010, 7, 4179–4202. [Google Scholar] [CrossRef] [PubMed]
  10. WHO. Guidelines for Drinking-Water Quality, 4th ed.; WHO: Geneve, Switzerland, 2011; 564p, ISBN 978-92-4-154815-1. [Google Scholar]
  11. European Union. Commission Directive (EU) 2015/1787 of 6 October 2015 Amending Annexes II and III to Council Directive 98/83/EC on the Quality of Water Intended for Human Consumption. Off. J. EU 2015, L 260/6–L 260/17. Available online: https://eur-lex.europa.eu/legal-content/EN/TXT/?uri=uriserv%3AOJ.L_.2015.260.01.0006.01.ENG (accessed on 18 October 2018).
  12. WHO. Water Safety Plan Manual, Step-by-Step Risk Management for Drinking-Water Suppliers; WHO: Geneva, Switzerland, 2009; 108p, ISBN 978-92-4-156263-8. [Google Scholar]
  13. Kløve, B.; Kvitsand, H.M.L.; Pitkänen, T.; Gunnarsdottir, M.J.; Gaut, S.; Gardarsson, S.M.; Rossi, P.M.; Miettinen, I. Groundwater and Microbial Pollution: Overview of groundwater sources and water supply systems in the Finland, Norway and Iceland. Invited review. Hydrol. J. 2017, 25, 1033–1044. [Google Scholar] [CrossRef]
  14. Haas, C.N.; Rose, J.B.; Gerba, C.P. Quantitative Microbial Risk Assessment; John Wiley & Sons Inc.: New York, NY, USA, 1999; 453p, ISBN 0-471-18397-0. [Google Scholar]
  15. Schijven, J.F.; Teunis, P.F.M.; Rutjes, S.A.; Bouwknegt, M.; de Roda Husman, A.M. QMRAspot: A tool for Quantitative Microbial Risk Assessment from surface water to potable water. Water Res. 2011, 45, 5564–5576. [Google Scholar] [CrossRef] [PubMed]
  16. Schijven, J.; Rutjes, S.; Smeets, P.; Teunis, P. QMRAspot: A Tool for Quantitative Microbial Risk Assessment for Drinking Water; Manual QMRAspot Version 2.0. RIVM Report 2014-0020; National Institute for Public Health and the Environment: Bilthoven, The Netherlands, 2014; Available online: http://www.rivm.nl/dsresource?objectid=1fae75e3-e08d-402b-b4df-becea0ae8bdc&type=org&disposition=inline (accessed on 15 May 2018).
  17. Koivisto, J. Personal communication, 25 August 2016.
  18. Laine, J.; Huovinen, E.; Virtanen, M.; Snellman, M.; Lumio, J.; Ruutu, P.; Kujansuu, E.; Vuento, R.; Pitkänen, T.; Miettinen, I.; et al. An extensive gastroenteritis outbreak after drinking-water contamination by sewage effluent, Finland. Epidemiol. Infect. 2011, 139, 1105–1113. [Google Scholar] [CrossRef] [PubMed]
  19. Schjiven, J.F.; Medema, G.J.; Vogelaar, A.J.; Hassanizadeh, S.M. Removal of microorganisms by deep well injection. J. Contam. Hydrol. 2000, 44, 301–327. [Google Scholar] [CrossRef]
  20. ISO 10705-1. Water Quality—Detection and Enumeration of F-Specific RNA-Bacteriophages, 1, Method by Incubation with a Host Strain; International Organization for Standardization (ISO): Geneva, Switzerland, 1995.
  21. WHO. Quantitative Microbial Risk Assessment: Application for Water Safety Management; WHO: Geneva, Switzerland, 2016; 187p, ISBN 978-92-4-156537-0. [Google Scholar]
  22. Männistö, S.; Ovaskainen, M.; Valsta, L. The National Findiet 2002 Study; National Public Health Institute: Helsinki, Finland, 2003; ISBN 951-740-338-0. Available online: http://urn.fi/URN:NBN:fi-fe2014030615904 (accessed on 15 May 2018).
  23. Teunis, P.; Van den Brandhof, W.; Nauta, M.; Wagenaar, J.; Van den Kerkhof, H.; Van Pelt, W. A reconsideration of the Campylobacter dose–response relation. Epidemiol. Infect. 2005, 133, 583–592. [Google Scholar] [CrossRef] [PubMed] [Green Version]
  24. Teunis, P.F.; Moe, C.L.; Liu, P.; E Miller, S.; Lindesmith, L.; Baric, R.S.; Le Pendu, J.; Calderon, R.L. Norwalk virus: How infectious is it? J. Med. Virol. 2008, 80, 1468–1476. [Google Scholar] [CrossRef] [PubMed]
  25. Nauta, M.J.; Jacobs-Reitsma, W.F.; Havelaar, A.H. A risk assessment model for Campylobacter in broiler meat. Risk Anal. 2007, 27, 845–861. [Google Scholar] [CrossRef] [PubMed]
  26. Rajala, R.; Pulkkanen, M.; Pessi, M.; Heinonen-Tanski, H. Removal of microbes from municipal waste water effluent by rapid sand filtration and subsequent UV irradiation. Water Sci. Technol. 2003, 47, 157–162. [Google Scholar] [CrossRef] [PubMed]
  27. Tyrrell, S.A.; Rippey, S.R.; Watkins, W.D. Inactivation of bacterial and viral indicators in secondary sewage effluents, using chlorine and ozone. Water Res. 1995, 29, 2483–2490. [Google Scholar] [CrossRef]
  28. Gehr, R.; Wagner, M.; Veerasubramanian, P.; Payment, P. Disinfection efficiency of peracetic acid, UV and ozone after enhanced primary treatment of municipal wastewater. Water Res. 2003, 37, 4573–4586. [Google Scholar] [CrossRef]
  29. Hijnen, W.; Suylen, G.; Bahlman, J.; Brouwer-Hanzens, A.; Medema, G. GAC adsorption filters as barriers for viruses, bacteria and protozoan (oo) cysts in water treatment. Water Res. 2010, 44, 1224–1234. [Google Scholar] [CrossRef] [PubMed]
  30. Hijnen, W.; Beerendonk, E.; Medema, G.J. Inactivation credit of UV radiation for viruses, bacteria and protozoan (oo) cysts in water: A review. Water Res. 2006, 40, 3–22. [Google Scholar] [CrossRef] [PubMed]
  31. Petterson, S.; Stenström, T. Quantification of pathogen inactivation efficacy by free chlorine disinfection of drinking water for QMRA. J. Water Health 2015, 13, 625–644. [Google Scholar] [CrossRef] [PubMed]
  32. LeChevallier, M.W.; Kwok-Keung, A. Water Treatment and Pathogen Control. Process Efficiency in Achieving Safe Drinking Water; IWA Publishing: London, UK, 2004; 112p, ISBN 92-4-156255-2. [Google Scholar]
  33. Bell, K.; LeChevallier, M.; Abbaszadegan, M.; Arny, G.; Sinha, S.; Benjamin, M. Enhanced and Optimizes Coagulation for Particulate and Microbial Removal; Awwa Research Foundation and American Water Works Association: Denver, CO, USA, 2002. [Google Scholar]
  34. Spellman, F.R. Handbook of Water and Wastewater Treatment Plant Operations, 3rd ed.; CRC Press, Taylor & Francis Group: Boca Raton, FL, USA, 2014; ISBN 1466553375. [Google Scholar]
  35. Bar-Zeev, E.; Belkin, N.; Liberman, B.; Berman, T.; Berman-Frank, I. Rapid sand filtration pretreatment for SWRO: Microbial maturation dynamics and filtration efficiency of organic matter. Desalination 2012, 286, 120–130. [Google Scholar] [CrossRef]
  36. Sokolova, E.; Petterson, S.R.; Dienus, O.; Nyström, F.; Lindgren, P.; Petterson, T.J.R. Microbial risk assessment of drinking water based on hydrodynamic modelling of pathogen concentrations in source water. Sci. Total Environ. 2015, 526, 177–186. [Google Scholar] [CrossRef] [PubMed] [Green Version]
  37. Lehtola, M.J.; Miettinen, I.T.; Vartiainen, T.; Martikainen, P.J. Changes in content of microbially available phosphorus, assimilable organic carbon and microbial growth potential during drinking water treatment processes. Water Res. 2002, 36, 3681–3690. [Google Scholar] [CrossRef]
  38. Zyara, A.M.; Torvinen, E.; Veijalainen, A.M.; Heinonen-Tanski, H. The Effect of UV and Combined Chlorine/UV Treatment on Coliphages in Drinking Water Disinfection. Water 2016, 8, 130. [Google Scholar] [CrossRef]
  39. Petterson, S.; Ashbolt, N. QMRA and water safety management: Review of application in drinking water systems. J. Water Health 2016, 14, 571–589. [Google Scholar] [CrossRef] [PubMed]
  40. Verani, M.; Federigi, I.; Donzelli, G.; Cioni, L.; Carducci, A. Human adenoviruses as waterborne index pathogens and their use for Quantitative Microbial Risk Assessment. Sci. Total Environ. 2018, 651, 1469–1475. [Google Scholar] [CrossRef]
  41. Bichai, F.; Smeets, P.W. Using QMRA-based regulation as a water quality management tool in the water security challenge: Experience from the Netherlands and Australia. Water Res. 2013, 47, 7315–7326. [Google Scholar] [CrossRef] [PubMed]
Figure 1. Water treatment unit processes in (a) pilot scale waterworks (PWW), (b) full-scale waterworks 1 (FWW1), and (c) full-scale waterworks 2 (FWW2). * Sampling point.
Water 10 01525 g001
Figure 2. Log10 removals of Escherichia coli, Clostridium spp. spores, and MS2 coliphages in PWW of three test series after coagulation with flotation, rapid sand filtration, and UV and chlorine disinfection presented as boxplot including mean (small box), median (line), and range. n = number of samples.
Water 10 01525 g002
Table 1. Description of pilot scale test series and sampling points. PWW = pilot scale waterworks. (1) I = incoming water, II = after flotation, III = after sand filtration, IV = after UV-disinfection, V = after UV and chlorine-disinfection (Figure 1).
Test SeriesSource WaterDescription of the Test SeriesSampling Points (1)
PWW1SavilahtiNormal settings + microbial spike + follow-up of spike reductionI, II, III, V
PWW2RitisenlahtiNormal settings + microbial spikeI, II, III, IV, V
PWW3RitisenlahtipH increased in coagulation about 0.5 units + microbial spikeI, II, III, V
Table 2. Mean and range of total log10 removals of water treatment processes in pilot scale (PWW) and full-scale (FWW) waterworks. n = number of samples
StudyE. coliClostridium spp. SporesF-Specific Coliphages
PWW19.2 (8.80–9.56) (n = 3)7.5 (7.29–7.57) (n = 3)9.0 (7.54–10.27) (n = 3)
6.7 (1.84–9.69) * (n = 3)5.7 (2.55–8.05) * (n = 3)5.2 (0.65–10.58) * (n = 3)
PWW29.2 (8.00–10.55) (n = 3)5.2 (3.93–6.71) (n = 3)8.8 (7.83–9.77) (n = 3)
PWW39.2 (8.73–9.57) (n = 3)7.3 (6.85–7.88) (n = 3)9.7 (8.84–10.44) (n = 3)
FWW10.6 (−0.44–2.37) (n = 4)0.8 (−0.48–2.98) (n = 4)NA
FWW23.4 (2.67–5.99) (n = 3)3.1 (1.16–5.29) (n = 3)2.4 (0.00–3.86) (n = 3)
* Follow-up samples included.
Table 3. Mean and range log10 removals of the unit processes in PWW and FWW waterworks. Log10 removals are estimates if calculation includes results below the detection limit. For more detailed results of PWW and FWW see Tables S3 and S4. Also data from the literature is added into table. n = number of results.
Unit ProcessStudyE. coliClostridium spp. SporesF-Specific Coliphages
Coagulation and flotationPWW1–3 (1)2.5 (1.88–3.14) (n = 9)2.4 (1.85–2.73) (n = 9)4.0 (2.57–5.19) (n = 9)
PWW1–31.9 (0.64–3.14) (n = 14)2.1 (1.18–2.73) (n = 14)3.0 (0.70–5.19) (n = 14) * (0)
FWW23.8 (2.68–5.91) (n = 10) (0)1.9 (1.28–2.73) (n = 12) (0)1.3 (−0.30–2.26) (n = 12) * (0)
(a) [2]1.5 (0.6–3.7) (n = 101) 1.4 (0.8–3.2) (n = 92)1.8 (0.2–4.3) (n = 89)
[10] (5)NA (0.2–2.0) (n = NA)NA (1.0–2.0) (n = NA)NA (0.1–3.4) (n = NA)
Sand filtrationPWW1–3 (1)3.3 (2.94–4.30) (n = 9)1.2 (0.86–1.52) (n = 9)0.9 (-0.05–1.70) (n = 9)
PWW1–33.0 (1.13–4.30) (n = 14) (0)1.1 (−0.16–1.70) (n = 14)0.8 (−0.05–1.70) (n = 14) * (0)
FWW1 (2)0.6 (0.03–1.68) (n = 12) (0)1.0 (−0.18–2.23) (n = 13) (0)NA
(a) [2] **0.9 (0.4–1.5) (n = 60) 1.6 (0.5–2.9) (n = 123)1.1 (0.2–2.5) (n = 33)
(a) [2] (2) **2.1 (1.0–3.4) (n = 54)2.4 (1.4–4.7) (n = 62)3.0 (1.2–5.3) (n = 69)
[10] (5)NA (0.2–4.4) (n = NA)NA (0.4–3.3) (n = NA)NA (0.0–3.5) (n = NA)
[26] **0.6 (0–1.7) (n = 6) 0.6 (0–2.0) (n = 6)0.6 (0.1–1.7) (n = 12)
OzonationFWW1NA−0.2 (−0.78–0.00) (n = 11) (0)NA
[27] **1.4 (1.1–1.5) (n = 10)0.1 (0.1–0.2) (n = 10)>2.5 (>2.2–>2.8) (n = 10)
[28] (3) **ca. 1.7 (n = 3) (7)ca.0.5 (n = 3) (7)ca. 3.0 (n = 3) (7)
Activated carbon filtrationFWW1−0.02(−0.36–0.04) (n = 11) (0)−0.03(−0.30–0.00) (n = 11) (0)NA
FWW2NA0.9(−0.04–1.56) (n = 12) (0)0.9 (0.00–1.30) (n = 11) * (0)
[29]0.5 (0.0–1.1) (n = 8)0.6 (0.4–1.1) (n = 8)0.0 (0.0–0.0) (n = 4)
UV + chlorine disinfectionPWW1–3 (1)(3) 3.4 (2.70–3.79) (n = 9) (0)(3) 3.1 (0.14–4.86) (n = 9) (0)(3) 4.2 (2.90–5.38) (n = 9) * (0)
PWW1–3(3) 2.9 (0.08–3.79) (n = 13) (0)(3) 2.8 (0.14–4.86) (n = 13) (0)(3) 3.2 (0.00–5.38) (n = 12) * (0)
PWW2(4) 2.9 (2.40–3.19) (n = 3) (0)(4) 2.2 (1.62–2.46) (n = 3) (0)(4) 4.3 (4.21–4.47) (n = 3) * (0)
FWW2NA(3) 0.3 (−0.08–1.00) (n = 10) (0)(3) 0.3 (n = 1) * (0)
(4) 0.3 (−0.08–1.06) (n = 12) (0)(4) 0.1 (0.00–0.30) (n = 10) * (0)
(b) [30] **(4) max 6.0 (n = 41)(4) max 3.0 (n = 9)(4) max 4.9 (n = 109)
[28] **(4) ca. 3.5 (n = 13) (6)(4) ca. 1.0 (n = 11) (6)(4) ca. 1.5 (n = 10) (6)
Chlorine disinfectionFWW10.04 (−0.07–0.65) (n = 13) (0)0.05 (0.00–0.76) (n = 14) (0)NA
[31]max. 3.39–5.20 (n = 6)NAmax. 4.0–5.3 (n = 5)
* Includes qualitative results. ** Includes sewage treatment results. (a) Removal as micro-organism elimination credit (MEC). (b) Removal as micro-organism inactivation credit (MIC). (0) Includes results below the detection limit. (1) Without follow-up samples. (2) Including removal of coagulation + flotation + sand filtration. (3) After UV and chlorine-disinfection. (4) After UV disinfection. (5) Results for protozoa, bacteria, and viruses. (6) UV-fluence 30 mJ/cm2. (7) Ozone dose 30 mg/L. NA = Not available.
Table 4. Number of Campylobacter (C) and norovirus (N) illness cases in population of 100,000 per day under the waterworks malfunction situations. Results are calculated based on literature, PWW or PWW + literature removal efficiency with two source waters (Table S2).
Treatment Process Data Source 1 **Treatment Process Data Source 2 **Treatment Process Data Source 3 **
Malfunction Scenario PathogenSource Water of FWW2 C/NContamination in Source Water C/NSource Water of FWW2 C/NContamination in Source Water C/NSource Water of FWW2 C/NContamination in Source Water C/N
Business as usual0/00/00/00/07/036/0
Coagulation + flotation 50%0/00/00/01/196/0380/4
Sand filtration 50%0/00/01/04/0NANA
Activated carbon 50%NANANANA16/076/0
UV + chlorination 50%0/00/20/20/122/0100/5
UV + chlorination 0%2000/713300/520014/169/951400/52600/530
* No treatment6400/18,0007600/99,900
* No removal at all. NA = Not available, process not included in calculations. ** Treatment process data sources taken into QMRA: (1) Literature removal efficiencies: Coagulation with flotation, rapid sand filtration, UV-treatment, chlorination. (2) PWW removal efficiencies: Coagulation with flotation, rapid sand filtration, UV-treatment, chlorination. (3) PWW + literature removal efficiencies, correspond to unit processes of FWW2: Coagulation with flotation, activated carbon filtration, UV-treatment, chlorination.

