Configuring Green Infrastructure for Urban Runoff and Pollutant Reduction Using an Optimal Number of Units

 ,
,
Abstract
:
1. Introduction
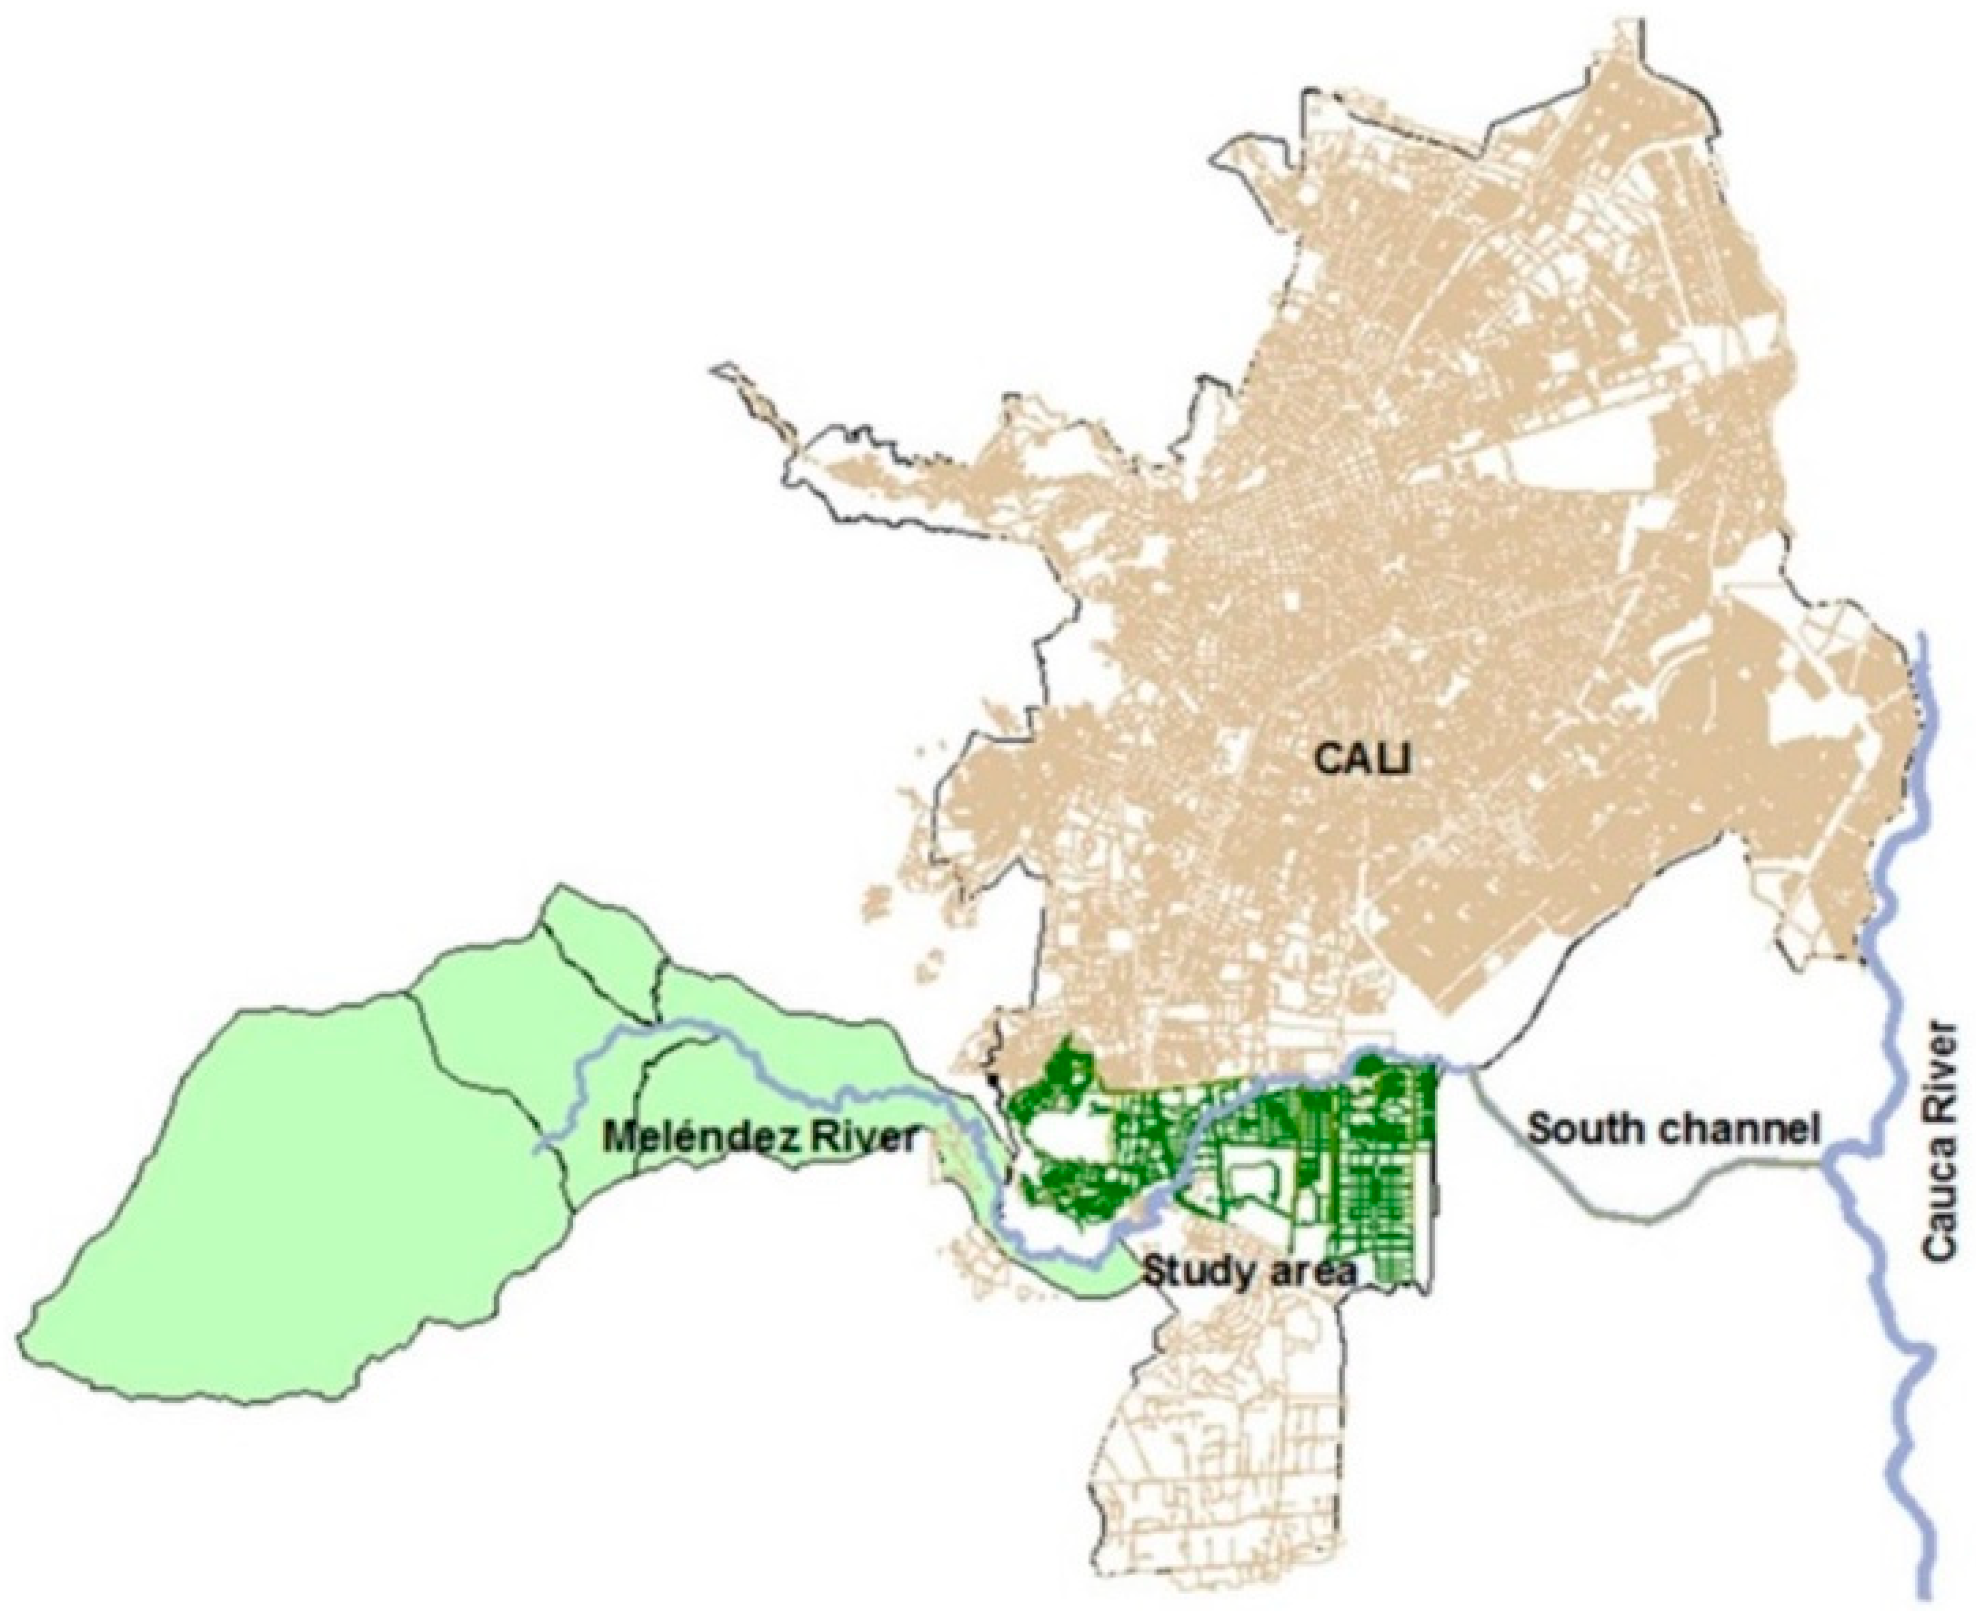
2. Case Study
3. Methodological Framework
3.1. Data Input
3.2. GI Selection and Placement
3.2.1. GI Selection
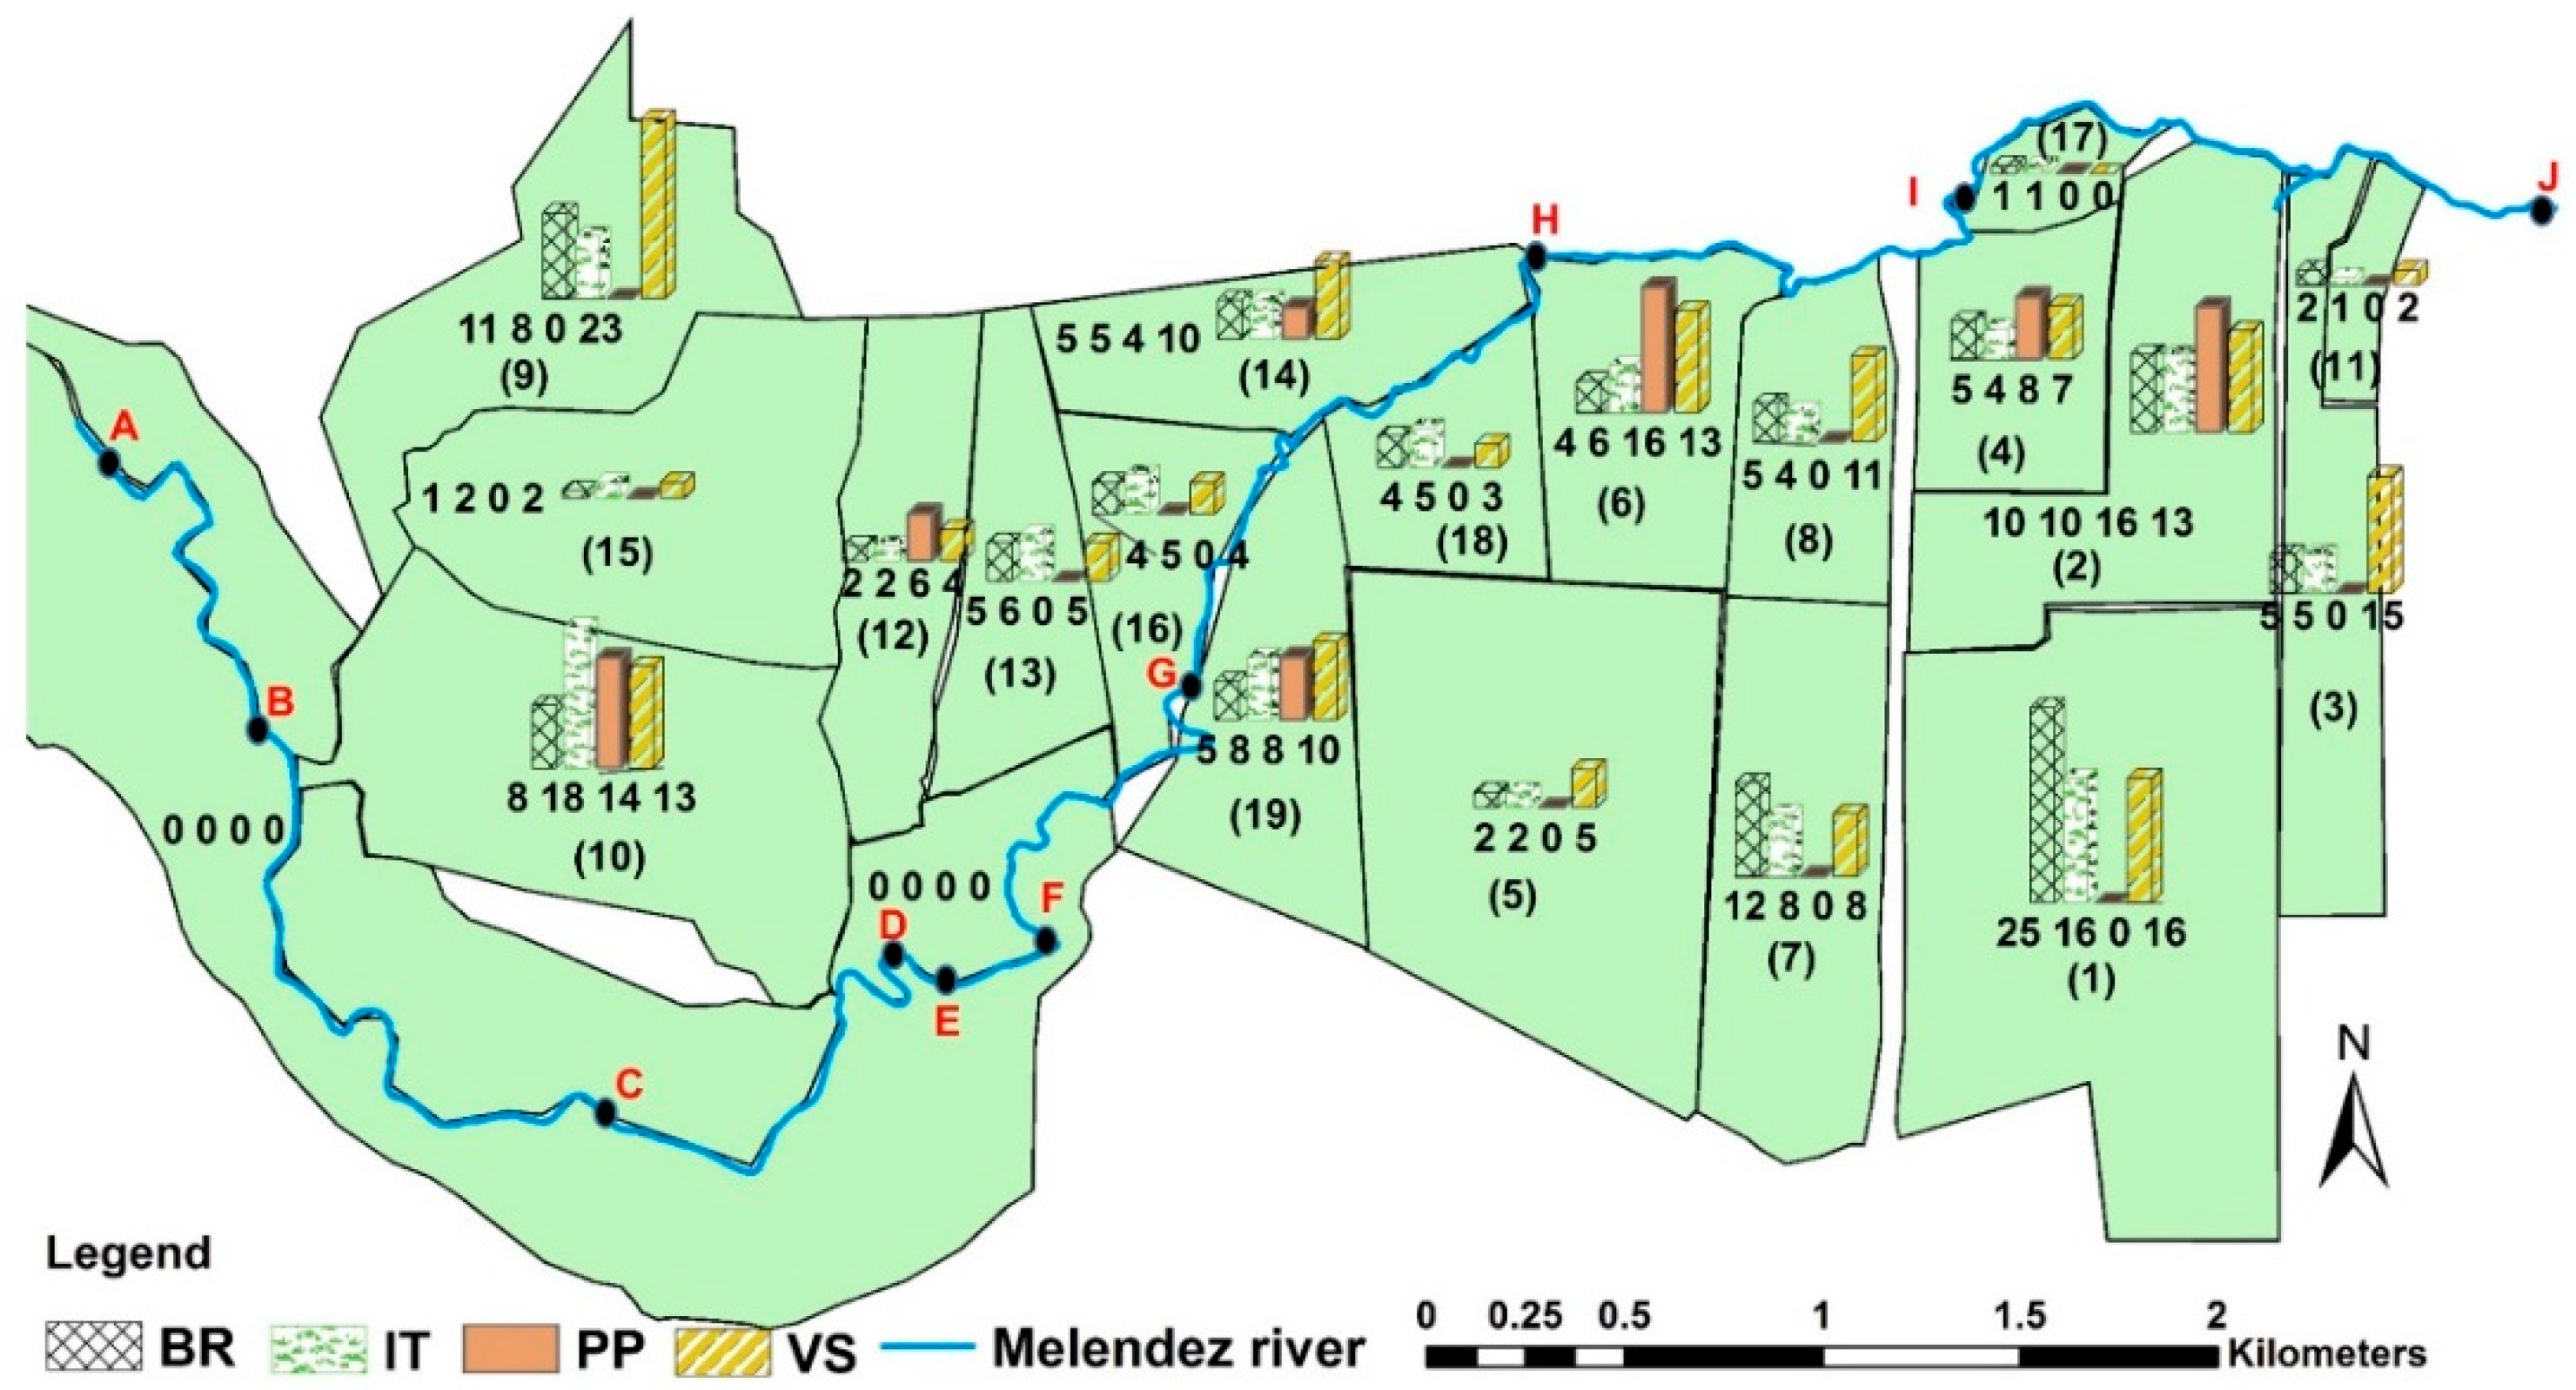
3.2.2. GI Placement
3.3. Hydraulic and Water Quality Modelling
3.4. Assessing Optimal GI Measures
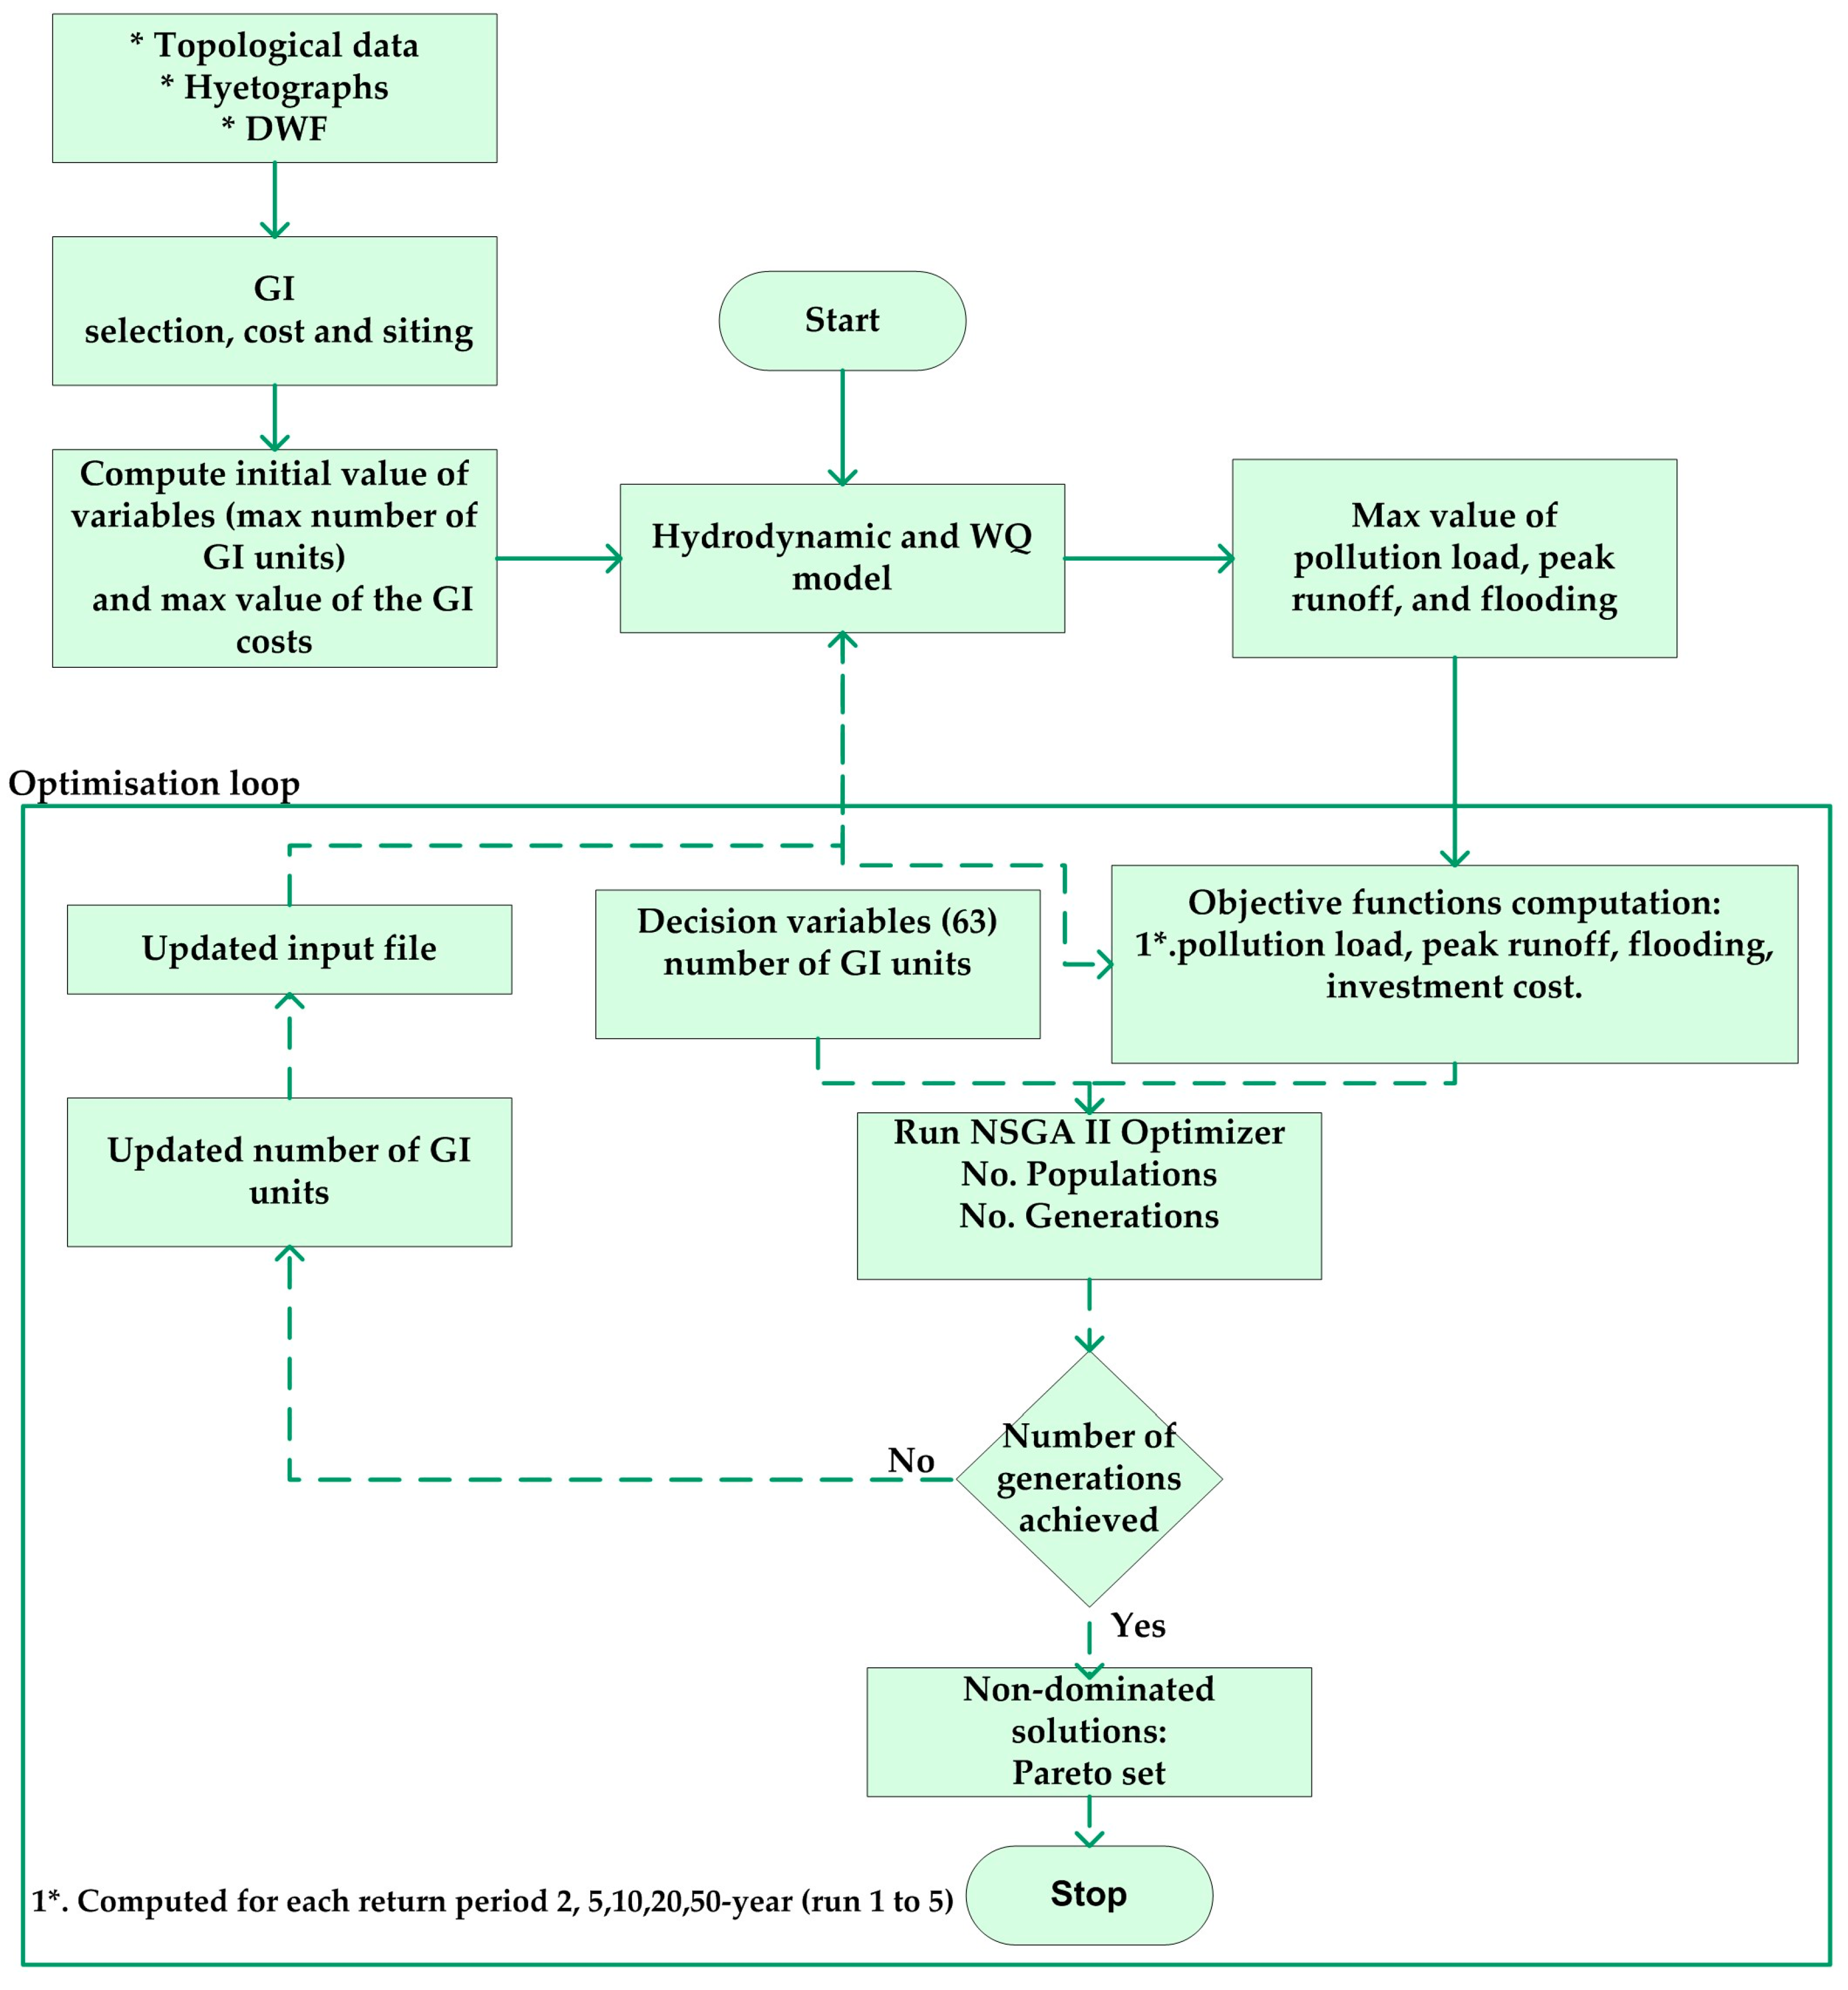
3.4.1. Optimisation Procedure
3.4.2. Linkage between the Hydrodynamic Model and NSGA-II Optimiser
3.4.3. Objective Functions
Pollution Load Reduction
Peak Runoff Reduction
Flood Volume Reduction
Investment Cost Function
3.4.4. Maximum GI Investment Cost
4. Results and Discussion
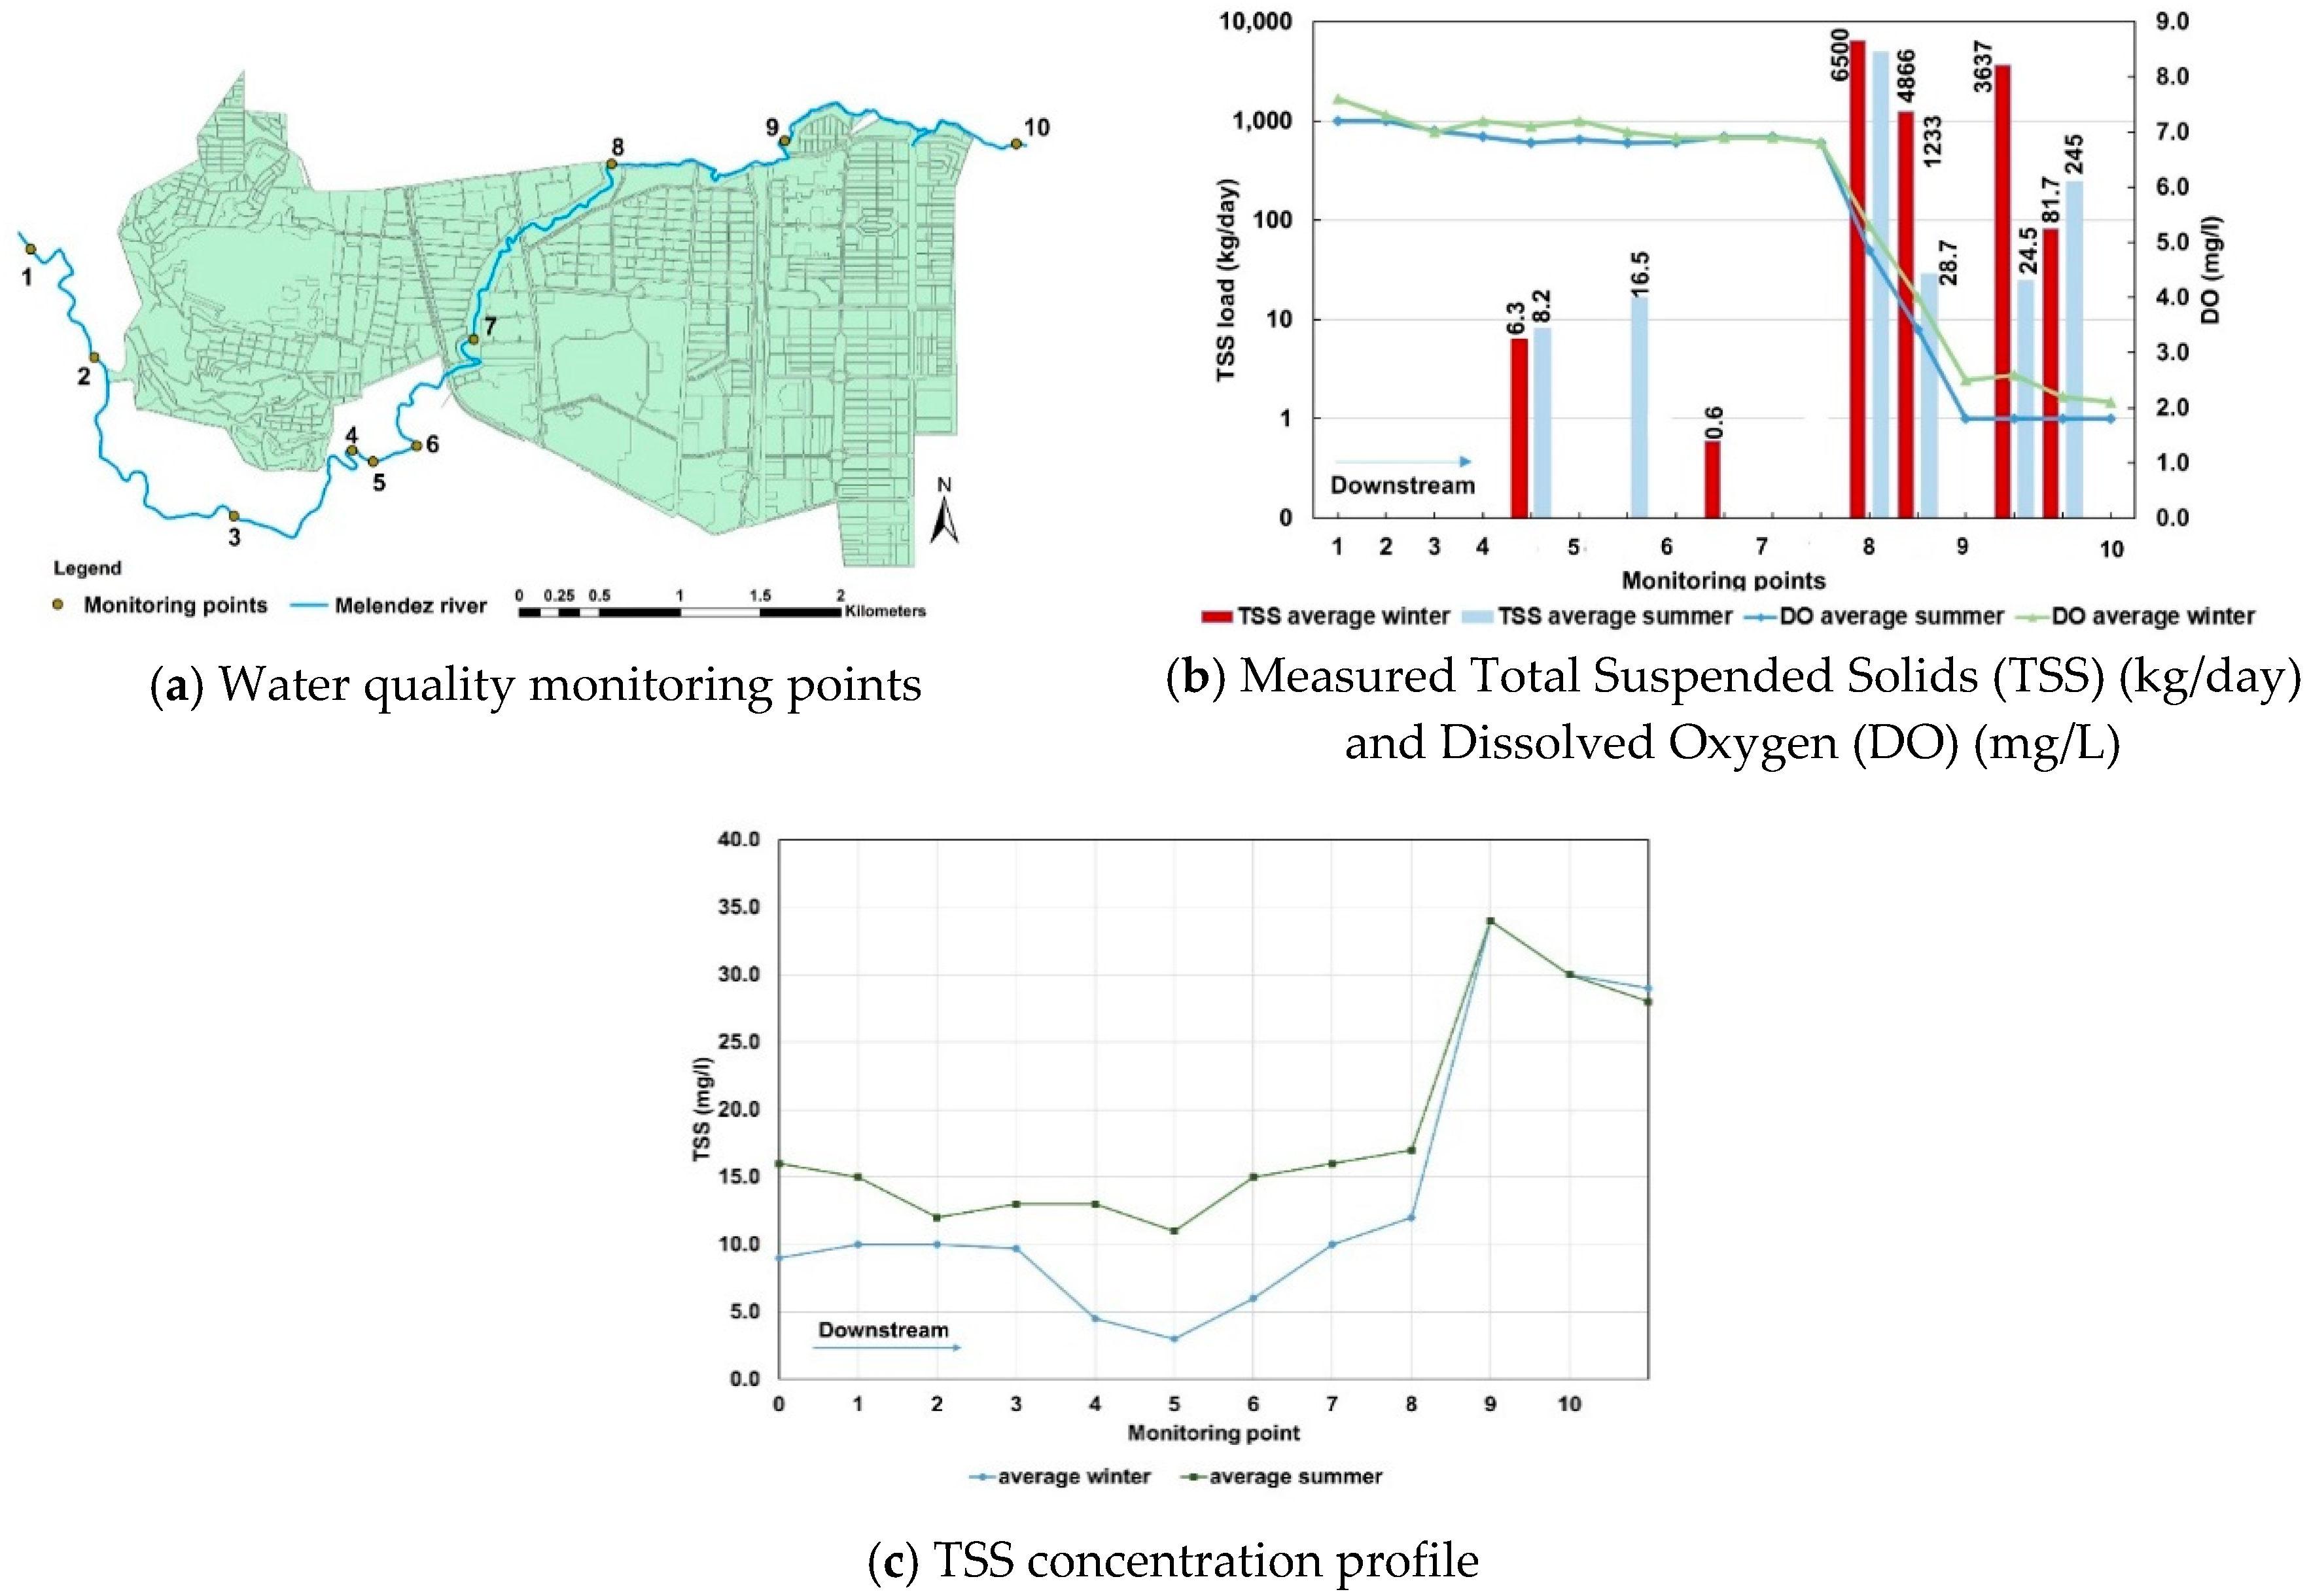
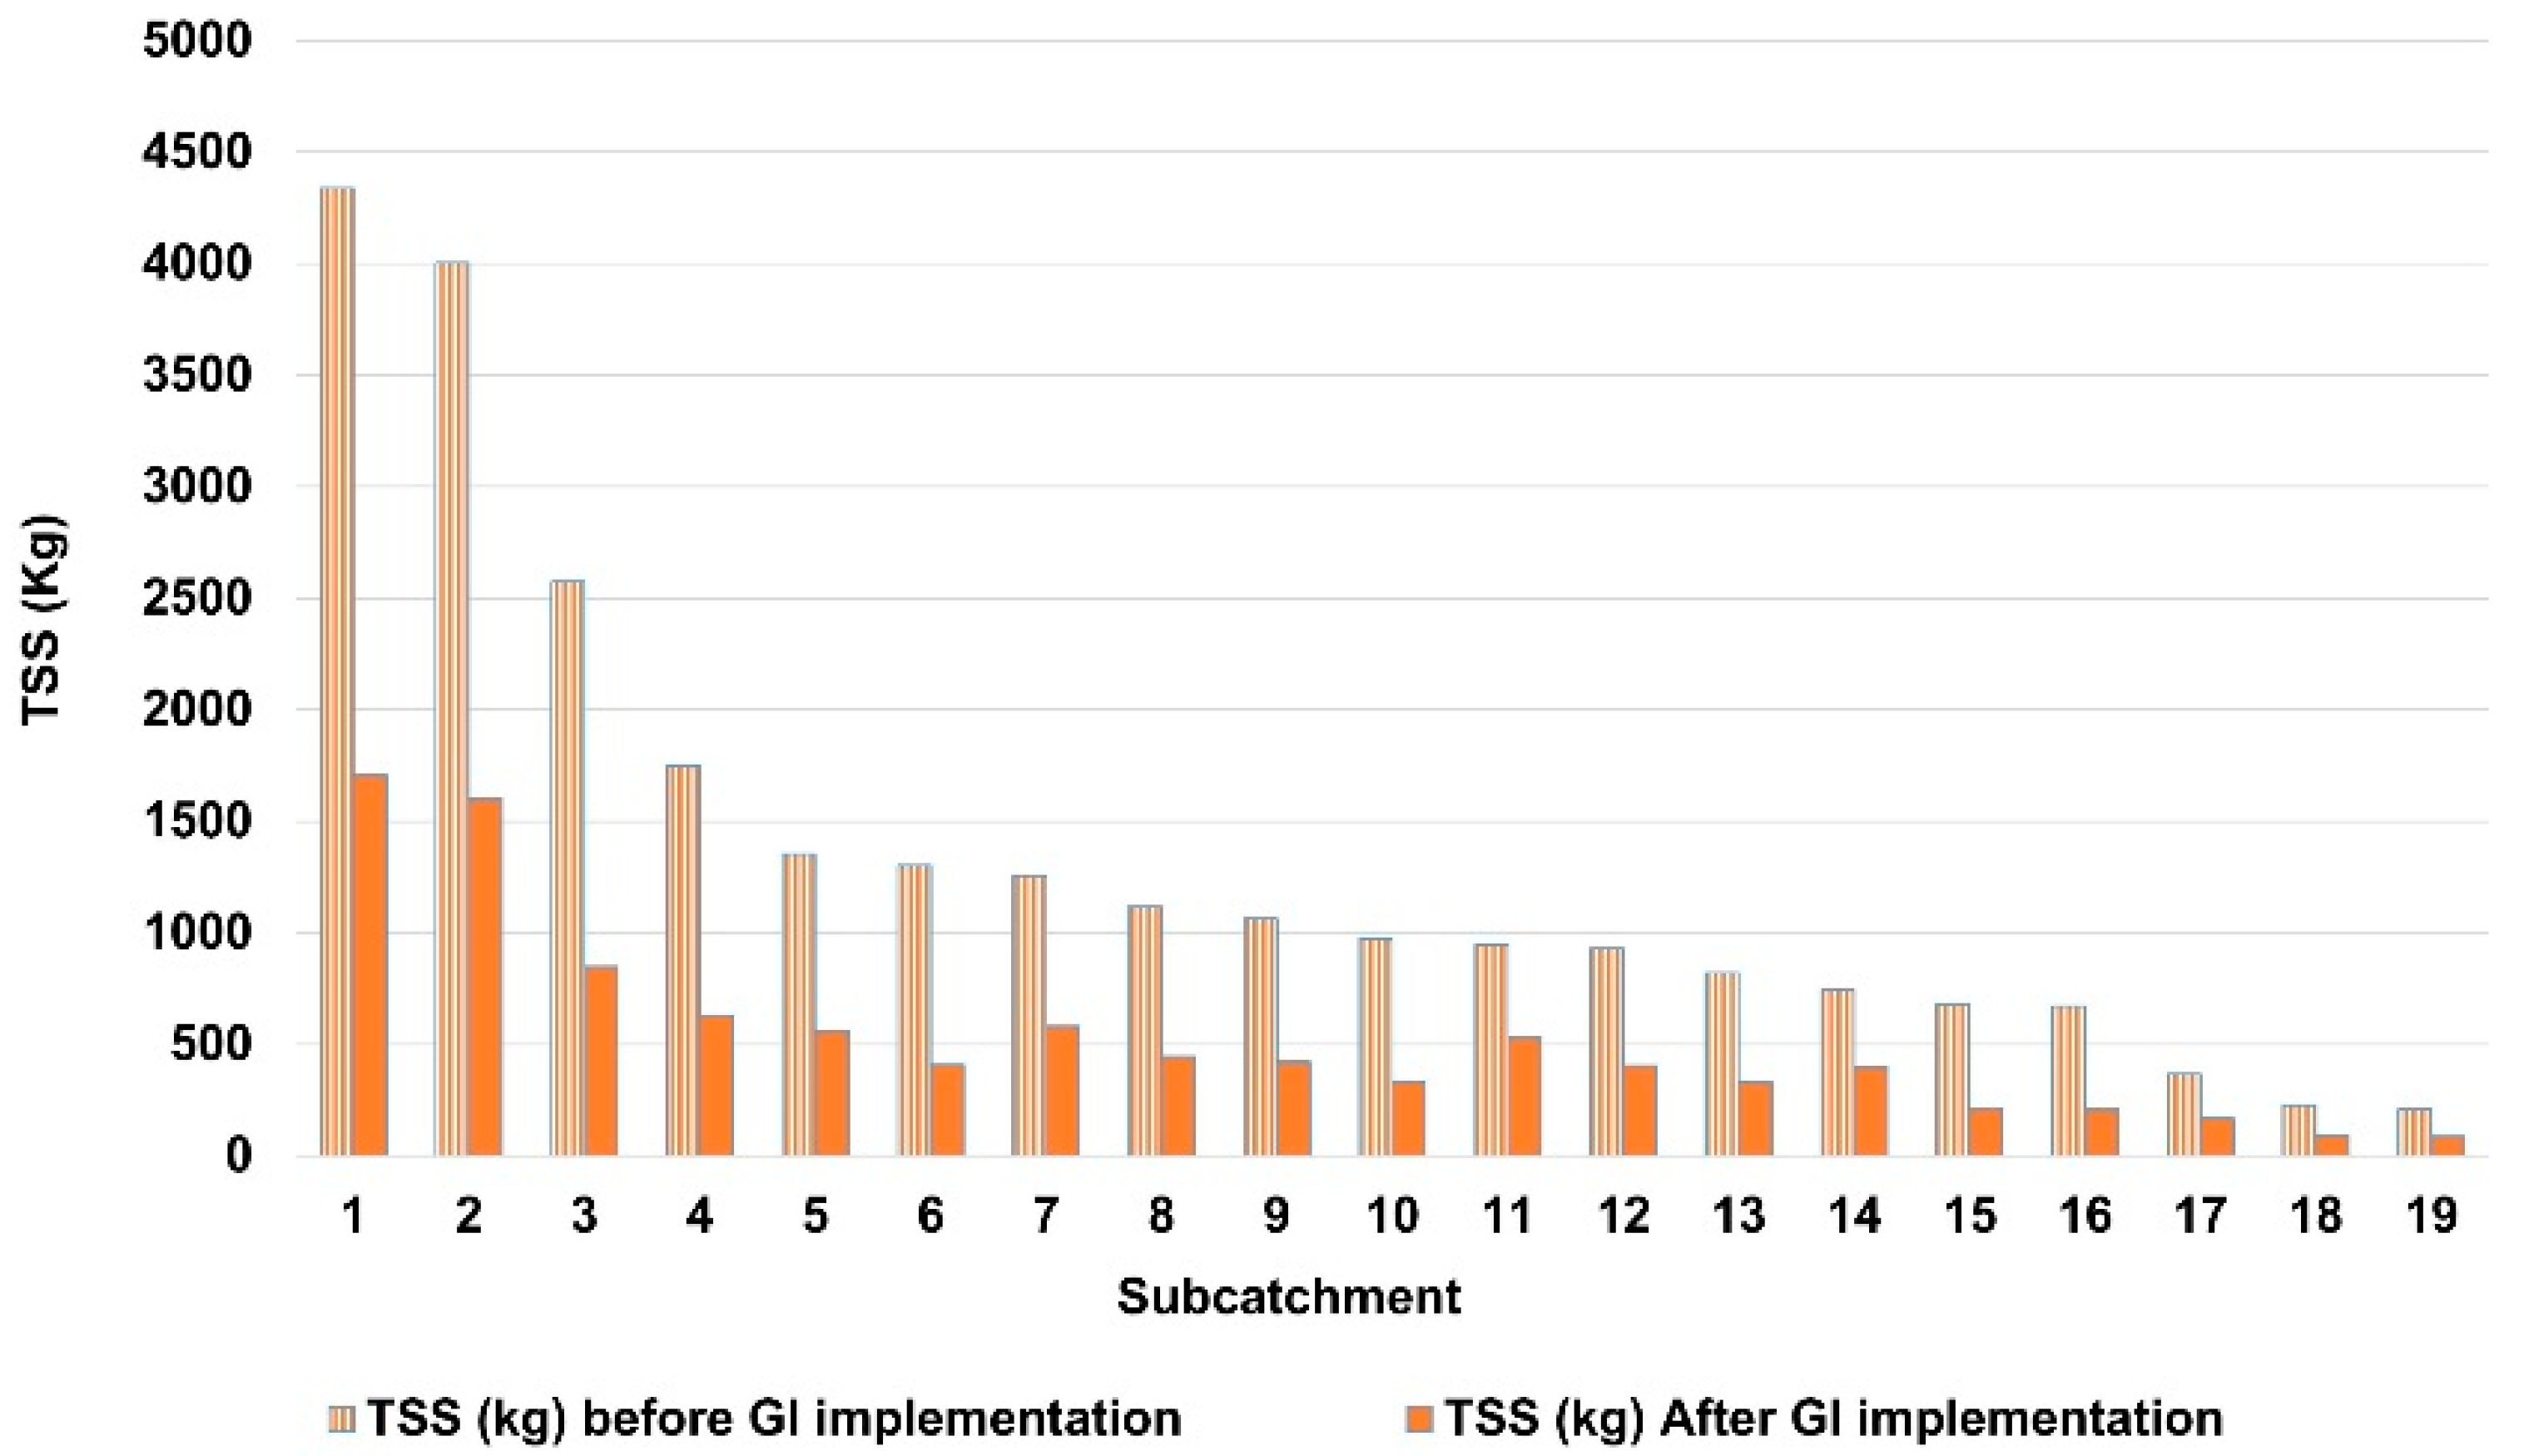
4.1. Initial Performance of the Drainage System
4.2. GI Placement
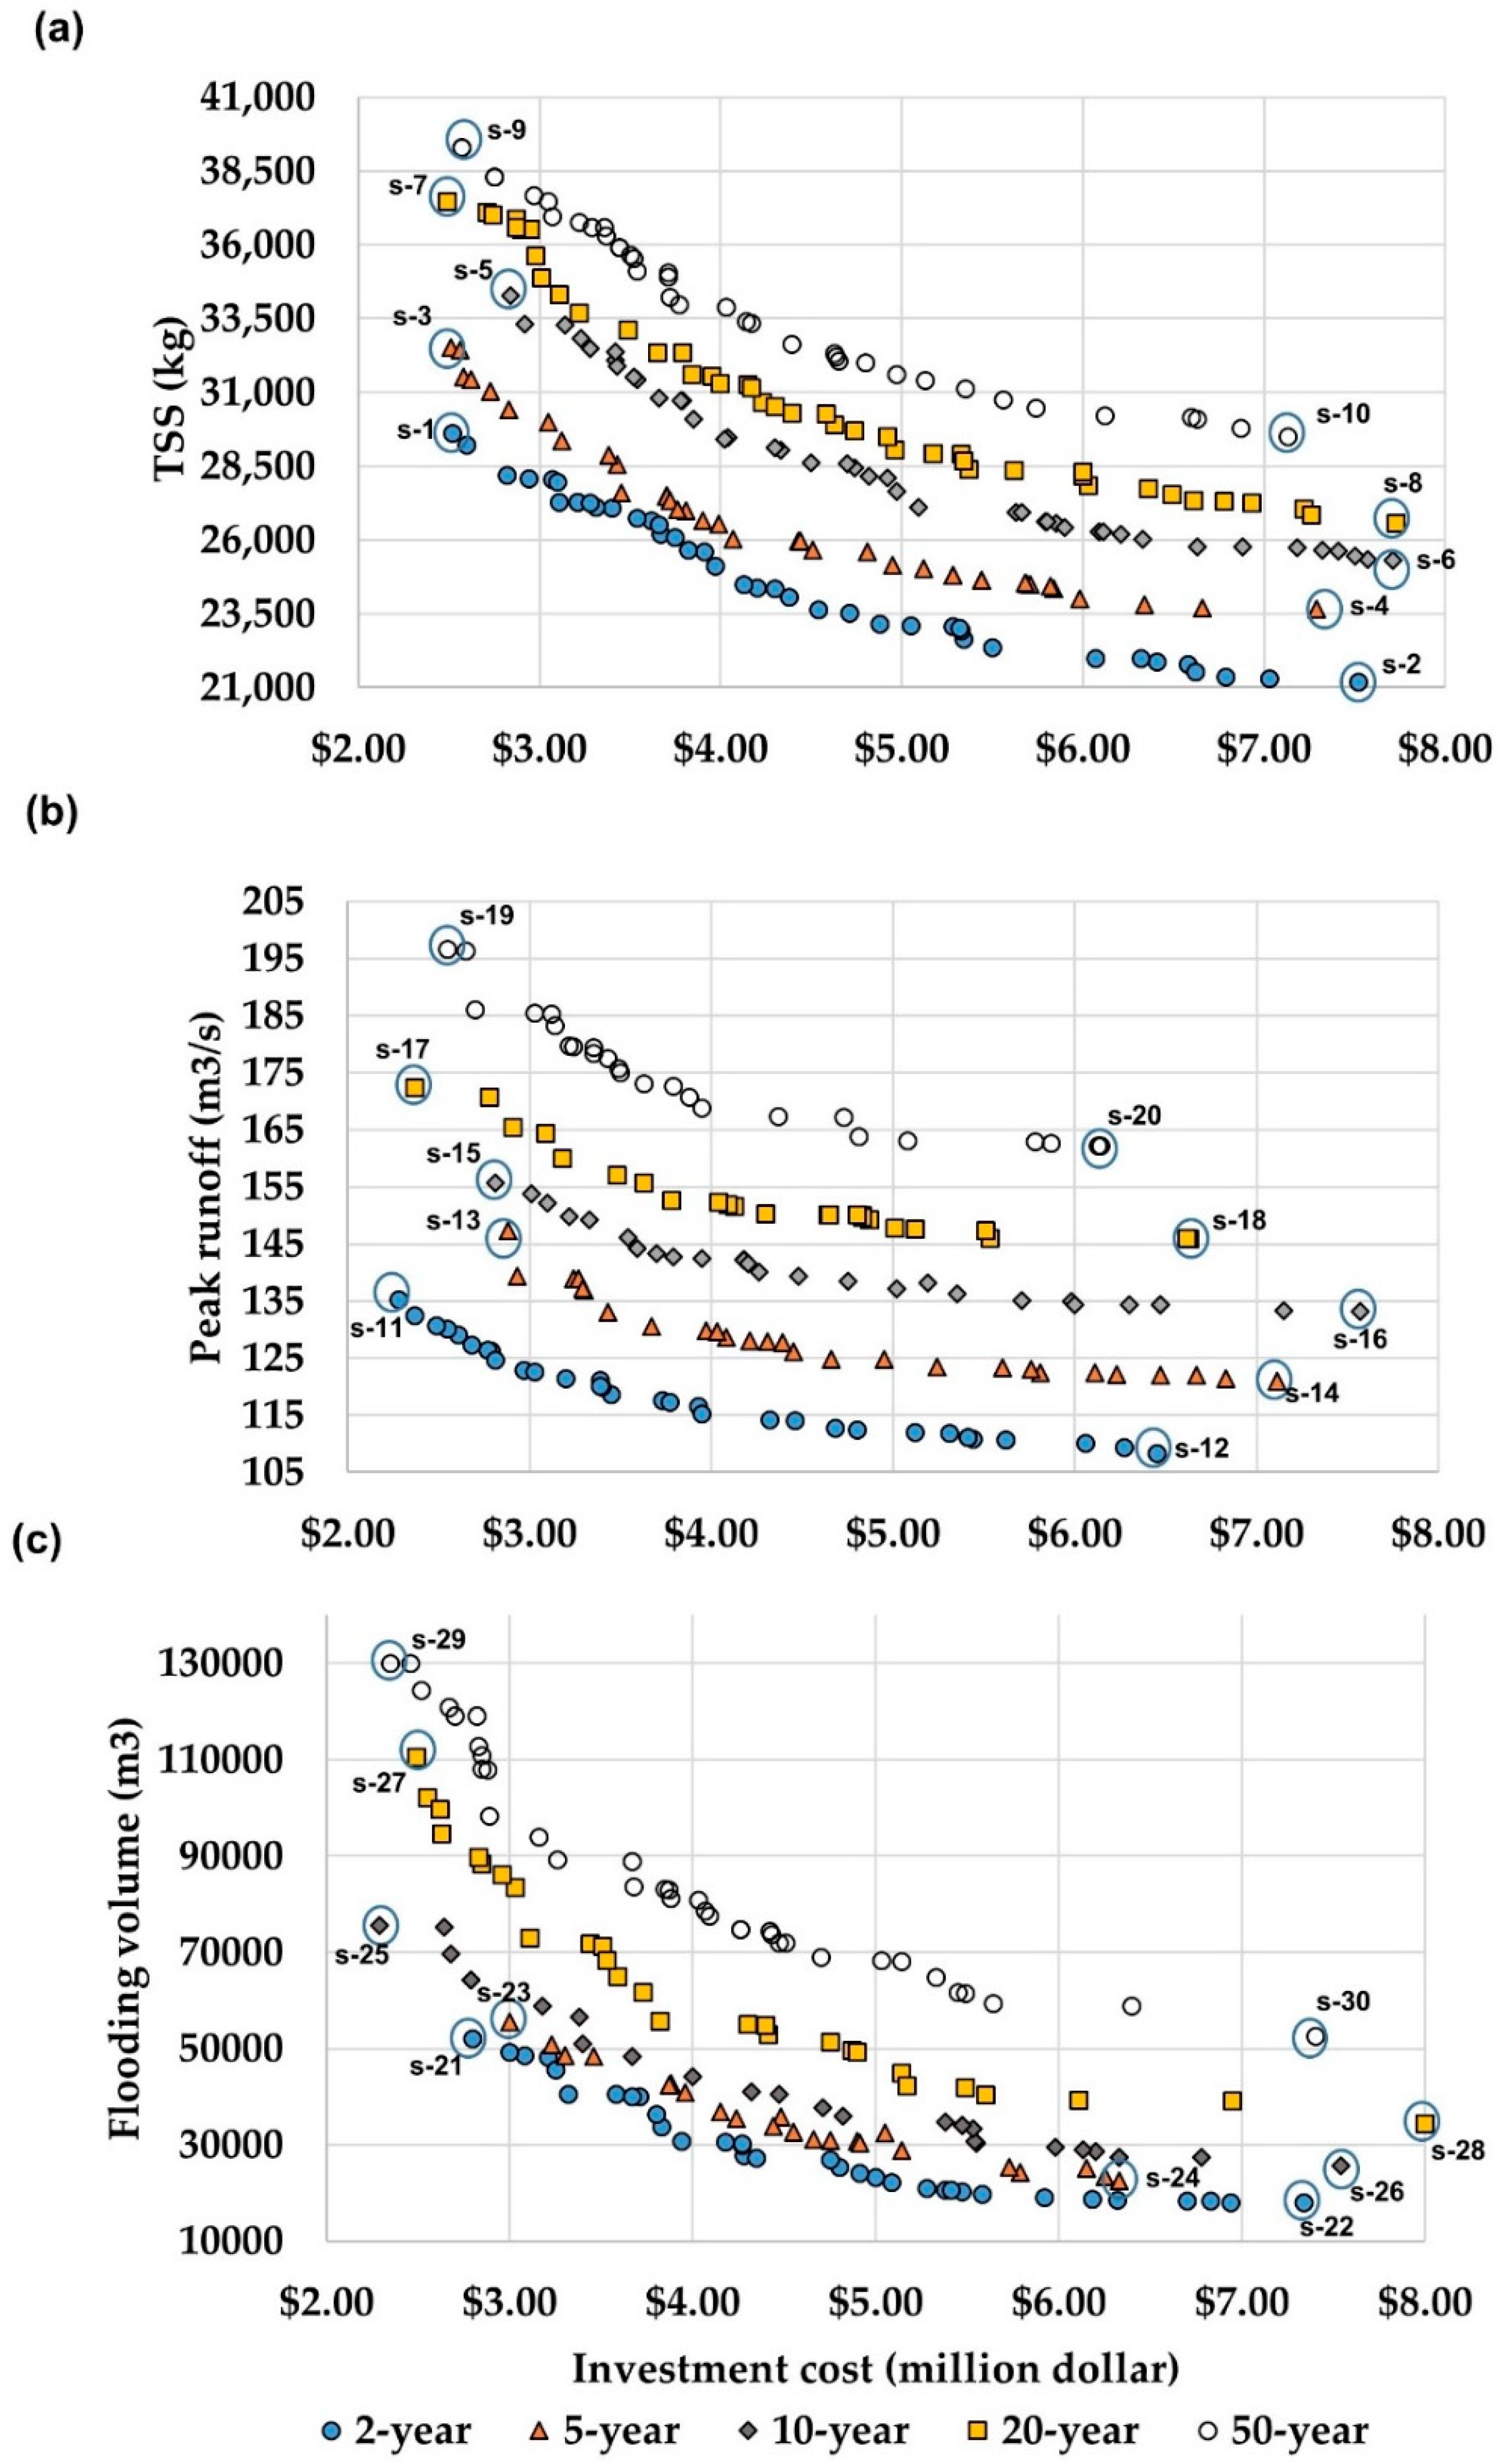
4.3. Assessing Optimal GI Measures
5. Conclusions
Author Contributions
Funding
Conflicts of Interest
Appendix A

| Sub Catchment | GI Type | Area (Ha) | % Imper | Drainage Area (Ha) | Flow (m3/s) | Volume (m3) | Size Depth (m) | Width (m) | Unit Area (m2) | GI # Units | % Imper Area Treated | GI Unit Cost | GI Total Cost |
|---|---|---|---|---|---|---|---|---|---|---|---|---|---|
| 1 | 126.58 | 0.72 | |||||||||||
| BR03 | 2 | 202 | 4858 | 1.6 | 3036 | 25 | 54.76 | $27,439 | $685,726 | ||||
| IT02 | 2 | 202 | 4858 | 1.4 | 7.5 | 3470 | 16 | 35.05 | $30,812 | $308,119 | |||
| VS01 | 51 | 1214 | 1.6 | 10 | 759 | 16 | 8.76 | $23,966 | $383,448 | ||||
| 2 | 65.08 | 0.76 | |||||||||||
| BR02 | 2 | 212 | 5099 | 1.6 | 3187 | 10 | 40.59 | $32,122 | $321,224 | ||||
| IT02 | 2 | 212 | 5099 | 1.4 | 7.5 | 3642 | 10 | 40.59 | $30,812 | $308,119 | |||
| VS01 | 0.5 | 53 | 1275 | 1.6 | 10 | 797 | 13 | 13.19 | $23,966 | $311,552 | |||
| PP01 | 0.054 | 6 | 540 | 16 | 1.75 | $122,812 | $1,964,990 | ||||||
| 3 | 39.58 | 0.72 | |||||||||||
| BR02 | 2 | 202 | 4849 | 1.6 | 3030 | 5 | 35.09 | $32,122 | $160,612 | ||||
| IT02 | 2 | 202 | 4849 | 1.4 | 7.5 | 3463 | 5 | 35.09 | $30,812 | $154,059 | |||
| VS01 | 0.5 | 51 | 1212 | 1.6 | 10 | 758 | 15 | 26.32 | $23,966 | $359,483 | |||
| 4 | 29.03 | 0.76 | |||||||||||
| BR02 | 2 | 212 | 5095 | 1.6 | 3185 | 5 | 45.53 | $32,122 | $160,612 | ||||
| IT01 | 2 | 212 | 5095 | 1.4 | 7.5 | 3639 | 4 | 36.42 | $30,182 | $123,248 | |||
| VS01 | 0.5 | 53 | 1274 | 1.6 | 10 | 796 | 7 | 15.94 | $23,966 | $167,759 | |||
| PP01 | 0.054 | 6 | 540 | 8 | 1.97 | $122,182 | $982,495 | ||||||
| 5 | 97.57 | 0.11 | |||||||||||
| BR03 | 2 | 31 | 736 | 1.6 | 460 | 2 | 37.51 | $27,429 | $54,858 | ||||
| IT01 | 2 | 31 | 736 | 1.4 | 7.5 | 526 | 2 | 37.51 | $30,812 | $61,624 | |||
| VS01 | 0.5 | 8 | 184 | 1.6 | 10 | 115 | 5 | 23.44 | $23,966 | $119,828 | |||
| 6 | 41.5 | 0.67 | |||||||||||
| BR02 | 2 | 188 | 4508 | 1.6 | 2818 | 4 | 28.80 | $32,122 | $128,490 | ||||
| IT02 | 2 | 188 | 4508 | 1.4 | 7.5 | 3220 | 6 | 43.20 | $30,812 | $184,871 | |||
| VS01 | 0.5 | 47 | 1127 | 1.6 | 10 | 704 | 13 | 23.40 | $23,966 | $311,552 | |||
| PP01 | 0.054 | 6 | 540 | 16 | 3.11 | $122,812 | $1,964,990 | ||||||
| 7 | 58.65 | 0.76 | |||||||||||
| BR02 | 2 | 214 | 5125 | 1.6 | 3203 | 12 | 53.77 | $32,122 | $385,469 | ||||
| IT02 | 2 | 214 | 5125 | 1.4 | 7.5 | 3661 | 8 | 35.85 | $29,508 | $246,495 | |||
| VS01 | 0.5 | 53 | 1281 | 1.6 | 10 | 801 | 8 | 8.96 | $23,965 | $191,724 | |||
| 8 | 31.57 | 0.76 | |||||||||||
| BR02 | 2 | 212 | 5090 | 1.6 | 3181 | 5 | 41.91 | $32,122 | $160,612 | ||||
| IT02 | 2 | 212 | 5090 | 1.4 | 7.5 | 3636 | 4 | 33.53 | $30,812 | $118,033 | |||
| VS01 | 0.5 | 53 | 1272 | 1.6 | 10 | 795 | 11 | 23.05 | $23,966 | $263,615 | |||
| 9 | 61.32 | 0.81 | |||||||||||
| BR01 | 2 | 228 | 5474 | 1.6 | 3421 | 11 | 44.14 | $32,122 | $353,347 | ||||
| IT01 | 2 | 228 | 5474 | 1.4 | 7.5 | 3910 | 8 | 32.10 | $30,812 | $246,495 | |||
| VS01 | 0.5 | 57 | 1369 | 1.6 | 10 | 855 | 23 | 23.07 | $23,966 | $551,207 | |||
| 10 | 87.57 | 0.80 | |||||||||||
| BR01 | 2 | 224 | 5388 | 1.6 | 3367 | 8 | 22.84 | $31,122 | $256,979 | ||||
| IT01 | 2 | 224 | 5388 | 1.4 | 7.5 | 3848 | 18 | 51.39 | $30,811 | $554,602 | |||
| VS01 | 0.5 | 56 | 1347 | 1.6 | 10 | 842 | 13 | 9.28 | $23,966 | $311,552 | |||
| PP01 | 0.054 | 6 | 540 | 14 | 1.08 | $122,812 | $1,719,366 | ||||||
| 11 | 68.76 | 0.10 | |||||||||||
| BR01 | 2 | 29 | 694 | 1.6 | 434 | 1 | 28.21 | $32,122 | $32,122 | ||||
| IT01 | 2 | 29 | 694 | 1.4 | 7.5 | 496 | 2 | 56.42 | $30,812 | $61,624 | |||
| VS01 | 0.5 | 7 | 174 | 1.6 | 10 | 108 | 2 | 14.11 | $23,966 | $47,931 | |||
| 12 | 34.91 | 0.30 | |||||||||||
| BR02 | 2 | 84 | 2020 | 1.6 | 1263 | 2 | 38.19 | $32,122 | $64,245 | ||||
| IT02 | 2 | 84 | 2020 | 1.4 | 7.5 | 1443 | 2 | 38.19 | $30,812 | $61,624 | |||
| VS01 | 0.5 | 21 | 505 | 1.6 | 10 | 316 | 4 | 19.10 | $23,966 | $95,862 | |||
| PP01 | 0.054 | 6 | 540 | 6 | 3.09 | $122,812 | $736,871 | ||||||
| 13 | 32.45 | 0.77 | |||||||||||
| BR02 | 2 | 215 | 5159 | 1.6 | 3225 | 5 | 40.23 | $32,122 | $160,612 | ||||
| IT02 | 2 | 215 | 5159 | 1.4 | 7.5 | 3685 | 6 | 48.27 | $30,812 | $184,871 | |||
| VS01 | 0.5 | 54 | 1290 | 1.6 | 10 | 806 | 5 | 10.06 | $23,966 | $119,828 | |||
| 14 | 37.56 | 0.67 | |||||||||||
| BR02 | 2 | 189 | 4526 | 1.6 | 2828 | 5 | 39.62 | $32,122 | $160,612 | ||||
| IT02 | 2 | 189 | 4526 | 1.4 | 7.5 | 3233 | 5 | 39.62 | $30,812 | $154,059 | |||
| VS01 | 0.5 | 47 | 1131 | 1.6 | 10 | 707 | 10 | 19.81 | $23,966 | $239,655 | |||
| PP01 | 0.054 | 6 | 540 | 4 | 0.86 | $122,812 | $491,248 | ||||||
| 15 | 8.5 | 0.82 | |||||||||||
| BR01 | 2 | 231 | 5546 | 1.6 | 3466 | 2 | 57.14 | $32,122 | $64,245 | ||||
| IT01 | 2 | 231 | 5546 | 1.4 | 7.5 | 3961 | 1 | 28.57 | $30,812 | $30,812 | |||
| VS01 | 0.5 | 58 | 1386 | 1.6 | 10 | 867 | 2 | 14.29 | $23,966 | $47,931 | |||
| 16 | 27.2 | 0.75 | |||||||||||
| BR02 | 2 | 210 | 5039 | 1.6 | 3150 | 4 | 39.30 | $32,122 | $128,490 | ||||
| IT02 | 2 | 210 | 5039 | 1.4 | 7.5 | 3600 | 5 | 49.13 | $30,812 | $30,812 | |||
| VS01 | 0.5 | 52 | 1260 | 1.6 | 10 | 787 | 4 | 9.83 | $23,966 | $47,931 | |||
| 17 | 9.32 | 0.48 | |||||||||||
| BR02 | 2 | 135 | 3237 | 1.6 | 2023 | 1 | 44.64 | $32,122 | $32,122 | ||||
| IT02 | 2 | 135 | 3237 | 1.4 | 7.5 | 2312 | 1 | 44.64 | $30,812 | $30,812 | |||
| 18 | 25.7 | 0.77 | |||||||||||
| BR02 | 2 | 217 | 5217 | 1.6 | 3261 | 4 | 40.18 | $32,122 | $128,490 | ||||
| IT02 | 2 | 217 | 5217 | 1.4 | 7.5 | 3727 | 5 | 50.23 | $30,812 | $154,059 | |||
| VS01 | 0.5 | 54 | 1304 | 1.6 | 10 | 815 | 3 | 7.53 | $23,966 | $71,897 | |||
| 19 | 40.72 | 0.78 | |||||||||||
| BR02 | 2 | 218 | 5225 | 1.6 | 3265 | 5 | 31.66 | $32,122 | $160,612 | ||||
| IT02 | 2 | 218 | 5225 | 1.4 | 7.5 | 3732 | 8 | 50.65 | $30,812 | $246,495 | |||
| VS01 | 0.5 | 54 | 1306 | 1.6 | 10 | 816 | 10 | 15.83 | $23,966 | $239,655 | |||
| PP01 | 0.054 | 6 | 540 | 8 | 1.37 | $122,812 | $982,495 |
References
- Hilly, G.; Vojinovic, Z.; Weesakul, S.; Sanchez, A.; Hoang, D.; Djordjevic, S.; Chen, A.; Evans, B. Methodological Framework for Analysing Cascading Effects from Flood Events: The Case of Sukhumvit Area, Bangkok, Thailand. Water 2018, 10, 81. [Google Scholar] [CrossRef]
- Ashley, R.; Balmforth, D.; Saul, A.; Blanskby, J. Flooding in the future—Predicting climate change, risks and responses in urban areas. Water Sci. Technol. 2005, 52, 265–273. [Google Scholar] [CrossRef] [PubMed]
- Mailhot, A.; Duchesne, S. Design criteria of urban drainage infrastructures under climate change. Water Resour. Plan. Manag. 2010, 136, 201–208. [Google Scholar] [CrossRef]
- Department of Environmental Conservation, New York State, Urban Stormwater Runoff. Available online: http://www.dec.ny.gov/chemical/69422.html#Problem (accessed on 14 March 2018).
- Novotny, B. Water Quality: Diffuse Pollution and Watershed Management, 2nd ed.; John Wiley and Sons: Hoboken, NJ, USA, 2003; ISBN 0-471-39633-8. [Google Scholar]
- U.S. Environmental Protection Agency. National Nonpoint Source Program a Catalyst for Water Quality Improvements; EPA Publishing: Washington, DC, USA, 2016.
- Yang, B.; Li, S. Green infrastructure design for stormwater runoff and water quality: Empirical evidence from large watershed-scale community developments. Water 2013, 5, 4. [Google Scholar] [CrossRef]
- Ozgun, K.; Moulis, A.; Leardini, P. Water-potential-mapping for urban flood/drought resilience: A holistic approach to sustainable spatial planning and design by augmenting use, reuse and storage capacity of storm water in south east Queensland. In Proceedings of the International Conference on Changing Cities III: Spatial, Design, Landscape & Socio-Economic dimensions, Syros-Delos-Mykonos Islands, Greece, 26–30 June 2017; University of Thessaly Volos: Volos, Greece. [Google Scholar]
- Stovin, V.R.; Dunnett, N.; Hallam, A. Green Roofs—Getting Sustainable Drainage off the Ground. In Proceedings of the 6th International Conference of Sustainable Techniques and Strategies in Urban Water Management, Lyon, France, 25–28 June 2007; pp. 11–18. [Google Scholar]
- Jayasooriya, V.; Ng, A. Tools for modelling of stormwater management and economics of green infrastructure practices: A review. Water Air Soil Pollut. 2014, 225, 1–20. [Google Scholar] [CrossRef]
- Shackleton, C.; Blair, A.; De Lacy, P.; Kaoma, H.; Mugwagwa, N.; Dalu, M.; Walton, W. How important is green infrastructure in small and medium-sized towns? Lessons from South Africa. Landsc. Urban Plan. 2016. [Google Scholar] [CrossRef]
- Leroy, M.; Portet-Koltalo, F.; Legras, M.; Lederf, F.; Moncond’huy, V.; Polaert, I.; Marcotte, S. Performance of vegetated swales for improving road runoff quality in a moderate traffic urban area. Sci. Total Environ. 2016, 566–567, 113–121. [Google Scholar] [CrossRef] [PubMed]
- Massoudieh, A.; Maghrebi, M.; Kamrani, B.; Nietch, C.; Treey, M.; Aflaki, S.; Panguluri, S. A flexible modelling framework for hydraulic and water quality performance assessment of stormwater green infrastructure. Environ. Model. Softw. 2017, 92, 57–73. [Google Scholar] [CrossRef]
- Vojinovic, Z.; Keerakamolchai, W.; Weesakul, S.; Pudar, R.; Medina, N.; Alves, A. Combining ecosystem services with cost-benefit analysis for selection of green and grey infrastructure for flood protection in a cultural setting. Environments 2017, 4, 3. [Google Scholar] [CrossRef]
- Alves, A.; Patiño, J.; Vojinovic, Z.; Sanchez, A.; Weesakul, S. Combining co-benefits and stakeholders perceptions into green infrastructure selection for flood risk reduction. Environments 2018, 5, 29. [Google Scholar] [CrossRef]
- Vojinovic, Z.; Seyoum, S.; Salum, M.; Price, R.; Fikri, A.; Abebe, Y. Modelling floods in urban areas and representation of buildings with a method based on adjusted conveyance and storage characteristics. J. Hydroinform. 2012, 15, 1150–1168. [Google Scholar] [CrossRef]
- Vojinovic, Z.; Bonillo, B.; Chitranjan, K.; Price, R. Modelling flow transitions at street junctions with 1D and 2D models. In Proceedings of the 7th International Conference on Hydroinformatics, Nice, France, 4–8 September 2006. [Google Scholar]
- Barreto, W.; Vojinovic, Z.; Price, R.; Solomatine, D. A Multi-objective Evolutionary Approach for Rehabilitation of Urban Drainage Systems. Water Resour. Plan. Manag. 2010, 136, 547–554. [Google Scholar] [CrossRef]
- Vojinovic, Z.; Sahlu, S.; Seyoum, S.; Sanchez, A.; Matungulu, H.; Kapelan, Z.; Savic, D. Multi-objective rehabilitation of urban drainage systems under uncertainties. J. Hydroinform. 2014, 16, 5. [Google Scholar] [CrossRef]
- Martínez, C.; Sanchez, A.; Toloh, B.; Vojinovic, Z. Multi-objective evaluation of urban drainage networks using a 1D/2D flood inundation model. Water Resour. Manag. 2018, 32, 4329–4343. [Google Scholar] [CrossRef]
- Deb, K.; Pratap, A.; Agarwall, A.; Meyarivan, T. A Fast and Elitist Multi-objective Genetic Algorithm. IEEE Trans. Evol. Comput. 2002, 6, 182–197. [Google Scholar] [CrossRef]
- Oraei, S.; Saghafian, B.; Shamsai, A. Multi-objective optimisation for combined quality—Quantity urban runoff control. Hydrol. Earth Syst. Sci. 2012, 16, 4531–4542. [Google Scholar] [CrossRef]
- Galindo, R.; Martínez, C.; Sanchez, A.; Vojinovic, Z.; Brdjanovic, D. Selecting optimal sustainable drainage design for urban runoff reduction. In Proceedings of the 36th IAHR World Congress Deltas of the Future and What Happens Upstream, The Hague, The Netherlands, 28 June–3 July 2015. [Google Scholar]
- Alves, A.; Sanchez, A.; Vojinovic, Z.; Seyoum, S.; Badel, M.; Brdjanovic, D. Evolutionary and holistic assessment of Green-Grey infrastructure for CSO Reduction. Water 2016, 8, 402. [Google Scholar] [CrossRef]
- Chichakly, K.; Bowden, W.; Eppstein, M. Minimization of cost, sediment load, and sensitivity to climate change in a watershed management application. Environ. Model. Softw. 2013, 50, 158–168. [Google Scholar] [CrossRef]
- Liu, Y.; Theller, L.; Pijanowski, B.; Engel, B. Optimal selection and placement of green infrastructure to reduce impacts of land use change and climate change on hydrology and water quality: An application to the trail creek watershed, Indiana. Sci. Total Environ. 2016, 553, 149–163. [Google Scholar] [CrossRef] [PubMed]
- Jayasooriya, V.; Ng, A.; Muthukumaran, S.; Perera, B. Optimal sizing of green infrastructure treatment trains for stormwater management. Water Resour. Manag. 2016, 30, 5407–5420. [Google Scholar] [CrossRef]
- Wang, M.; Sweetapple, C.; Fu, G.; Farmani, R.; Butler, D. A framework to support decision making in the selection of sustainable drainage system design alternatives. J. Environ. Manag. 2017, 201, 145–152. [Google Scholar] [CrossRef] [PubMed]
- CVC. Corporación Autónoma Regional del Valle del Cauca. Geographic Information System of the Cali-Meléndez-Pance–Aguacatal Catchments; Technical Report (in Spanish). CVC Publishing: Cali, Colombia, 2000. [Google Scholar]
- EMCALI. Water Utility of Cali. Sanitation and Management Plan for Discharges; EMCALI Publishing: Cali, Colombia, 2003. [Google Scholar]
- DAGMA and Univalle. Identification of Point Sources for the Meléndez and Cañaveralejo Rivers in the City of Cali; Project Report; DAGMA and Univalle Publishing: Cali, Colombia, 2004. [Google Scholar]
- Galvis, A.; Bernal, D.P.; Mosquera, P.; Cardona, D.A.; Pinzón, A.L.; Raffey, G. Sustainable Water Improves Tomorrow’s Cities ‘Health SWITCH Project Study Case: Cali, Colombia. In Proceedings of the 3rd SWITCH Scientific Meeting, Belo Horizonte, Brazil, 30 November–4 December 2008. [Google Scholar]
- Galvis, A.; Van der Steen, P.; Gijzen, H. Validation of the three-step strategic approach for improving urban water management and water resource quality improvement. Water 2018, 10, 188. [Google Scholar] [CrossRef]
- Shoemaker, L.; Riverson, J.; Alvi, K.; Zhen, J.; Paul, S.; Rafi, T. SUSTAIN—A Framework for Placement of Best Management Practices in Urban Watersheds to Protect Water Quality; EPA Publishing: Washington, DC, USA, 2013. [Google Scholar]
- Rossman, L.A.; Huber, W.C. Storm Water Management Model, Reference Manual–Water Quality; USEPA: Cincinnati, OH, USA, 2016. [Google Scholar]
- Rossman, L. Storm Water Management Model Reference Manual—Hydraulics; USEPA: Cincinnati, OH, USA, 2017. [Google Scholar]
- Martínez, C.; Galvis, A.; Alvis, F.; Werner, M. Model integration to improve an early warning system for pollution control of the Cauca river, Colombia. In Proceedings of the International Conference on Hydroinformatics, New York, NY, USA, 17–21 August 2014. [Google Scholar]
- Alvis, F.; Martínez, C.; Galvis, A. A simple regionalisation approach as an alternative to obtain rainfall data in a tropical and ungauged catchment. Ing. Compet. 2016, 18, 34–45. [Google Scholar]
- BCC. Bank of the Republic Colombia. 2014. Available online: http://www.banrep.gov.co/ (accessed on 14 March 2018).
- GVC. Governance of Valle del Cauca 2014. Available online: http://www.valledelcauca.gov.co (accessed on 11 September 2017).
- Mugume, S.; Butler, D. Evaluation of functional resilience in urban drainage and flood management systems using a global analysis approach. Urban Water J. 2017, 14, 727–736. [Google Scholar] [CrossRef]


| Layer | Property | Units | BR01 | BR02 | BR03 | IT01 | IT02 | VS01 | PP01 |
|---|---|---|---|---|---|---|---|---|---|
| Surface | Berm height | mm | 120 | 120 | 120 | 200 | 200 | 900 | 5 |
| Vegetation volume | fraction | 0.05 | 0.05 | 0.05 | 0 | 0 | 0.15 | 0 | |
| Surface roughness | Manning n | 0 | 0.001 | 0.001 | 0.25 | 0.25 | 0.40 | 0.012 | |
| Surface slope | 0 | 0.5 | 0.5 | 0.5 | 0.5 | 2 | 1 | ||
| Swale side slope | (run/rise) | 5 | |||||||
| Soil | Thickness | mm | 800 | 900 | 600 | - | - | - | 0 |
| Porosity | Volume fraction | 0.453 | 0.453 | 0.43 | - | - | - | 0.5 | |
| Field capacity | Volume fraction | 0.212 | 0.144 | 0.1 | - | - | - | 0.2 | |
| Wilting point | Volume fraction | 0.109 | 0.058 | 0.047 | - | - | - | 0.1 | |
| Conductivity | mm/h | 14.54 | 3.42 | 2.7 | - | - | - | 0.5 | |
| Conductivity slope | 7 | 7 | 5 | - | - | - | 10 | ||
| Suction head | mm | 4.33 | 4 | 2 | - | - | - | 3.5 | |
| Storage | Thickness | mm | 800 | 300 | 300 | 1400 | 1400 | - | 150 |
| Void ratio | Voids/solids | 0.47 | 0.75 | 0.75 | 0.47 | 0.47 | - | 0.47 | |
| Seepage rate | mm/h | 7.27 | 18.79 | 0 | 7.27 | 18.79 | - | 18.79 | |
| Clogging factor | 0 | 0 | 0 | 0 | 0 | - | 0 | ||
| Drain | Flow coefficient | mm/h | 0 | 0 | 2.66 | 0 | 0 | - | 1.02 |
| Flow exponent | fraction | 0.5 | 0 | 0.5 | 0 | 0 | - | 0.5 | |
| Offset height | mm | 6 | 0 | 50 | 0 | 0 | - | 10 | |
| Pavement | Thickness | mm | - | - | - | - | - | - | 150 |
| Void ratio | Voids/solids | - | - | - | - | - | - | 0.15 | |
| Impervious Surf. | Fraction | - | - | - | - | - | - | 0 | |
| Permeability | mm/h | - | - | - | - | - | - | 3400 | |
| Clogging factor | - | - | - | - | - | - | 0 |
| Catchment Point | Return Period | TSS (kg) | Peak Runoff (m3/s) | Flooding Volume (m3) | ||||||
|---|---|---|---|---|---|---|---|---|---|---|
| Present State (no GI) | Optimal Solution s-2 | Optimal Solution s-10 | Present State (no GI) | Optimal Solution s-12 | Optimal Solution s-20 | Present State (no GI) | Optimal Solution s-22 | Optimal Solution s-30 | ||
| G | 2 | 2433 | 924 | - | 3.72 | 1.88 | - | 5654 | 933 | - |
| 50 | 2976 | - | 1,286 | 4.59 | - | 1.71 | 8111 | - | 2470 | |
| H | 2 | 659 | 276 | - | 5.02 | 2.96 | - | 6279 | 1364 | - |
| 50 | 799 | - | 281 | 6.28 | - | 3.71 | 37,802 | - | 9914 | |
| I | 2 | 195 | 83 | - | 0.94 | 0.55 | - | 27,964 | 12,455 | |
| 50 | 244 | - | 114 | 1.18 | - | 0.75 | 34,177 | - | 21,656 | |
| J | 2 | 215 | 89 | - | 1.47 | 0.79 | - | - | - | - |
| 50 | 262 | - | 110 | 1.83 | - | 1.34 | - | - | - | |
© 2018 by the authors. Licensee MDPI, Basel, Switzerland. This article is an open access article distributed under the terms and conditions of the Creative Commons Attribution (CC BY) license (http://creativecommons.org/licenses/by/4.0/).
Share and Cite
Martínez, C.; Sanchez, A.; Galindo, R.; Mulugeta, A.; Vojinovic, Z.; Galvis, A. Configuring Green Infrastructure for Urban Runoff and Pollutant Reduction Using an Optimal Number of Units. Water 2018, 10, 1528. https://doi.org/10.3390/w10111528
Martínez C, Sanchez A, Galindo R, Mulugeta A, Vojinovic Z, Galvis A. Configuring Green Infrastructure for Urban Runoff and Pollutant Reduction Using an Optimal Number of Units. Water. 2018; 10(11):1528. https://doi.org/10.3390/w10111528
Chicago/Turabian StyleMartínez, Carlos, Arlex Sanchez, Roberto Galindo, Aelaf Mulugeta, Zoran Vojinovic, and Alberto Galvis. 2018. "Configuring Green Infrastructure for Urban Runoff and Pollutant Reduction Using an Optimal Number of Units" Water 10, no. 11: 1528. https://doi.org/10.3390/w10111528