Article

An Integrated Methodology to Analyze the Total Nitrogen Accumulation in a Drinking Water Reservoir Based on the SWAT Model Driven by CMADS: A Case Study of the Biliuhe Reservoir in Northeast China

1
The Institution of Water and Environment Research, Dalian University of Technology, Dalian 116024, China
2
China Water Resources Pearl River Planning Surveying & Designing Co, Ltd., Guangzhou 510610, China
*
Author to whom correspondence should be addressed.
Water 2018, 10(11), 1535; https://doi.org/10.3390/w10111535
Submission received: 26 September 2018 / Revised: 25 October 2018 / Accepted: 26 October 2018 / Published: 27 October 2018

Abstract

:
Human activities, especially dam construction, have changed the nutrient cycle process at the basin scale. Reservoirs often act as a sink in the basin and more nutrients are retained due to sedimentation, which induces the eutrophication of the surface water system. This paper proposes an integrated methodology to analyze the total nitrogen (TN) accumulation in a drinking water reservoir, based on the soil and water assessment tool (SWAT) model driven by the China Meteorological Assimilation Driving Datasets for the SWAT model (CMADS). The results show that the CMADS could be applied to drive the SWAT model in Northeast China. The dynamic process of TN accumulation indicates that the distribution of TN inputted into the reservoir fluctuated with the dry and wet seasons from 2009–2016, which was mainly governed by the amount of runoff. The annual average TN input and output fluxes of the Biliuhe reservoir were 274.41 × 10⁴ kg and 217.14 × 10⁴ kg, which meant that 19.76% of the TN input accumulated in the reservoir. Higher TN accumulation in the reservoir did not correspond to a higher TN load, due to the influence of flood discharge and the water supply. Interestingly, a higher TN accumulation efficiency was observed in normal hydrological years, because the water source reservoir always stores most of the water input for future multiple uses but rarely discharges surplus water. The non-point sources from fertilizer and atmospheric deposition and soils constituted the highest proportion of the TN input, accounting for 35.15%, 30.15%, and 27.72% of the average input. The DBWD (Dahuofang reservoir to Biliuhe reservoir water diversion) project diverted 32.03 × 10⁴ kg year−1 TN to the Biliuhe reservoir in 2015–2016, accounting for 14.05% of the total annual input. The discharge output and the BDWD (Biliuhe reservoir to Dalian city water diversion) project output accounted for 48.75% and 47.74%, respectively. The effects of inter-basin water diversion projects should be of great concern in drinking water source water system management. There was a rising trend of TN level in the Biliuhe reservoir, which increases the eutrophication risk of the aquatic ecosystem. The TN accumulated in the sediment contributed to a large proportion of the TN accumulated in the reservoir. In addition to decreasing the non-point source nitrogen input from the upper basin, discharging anoxic waters and sediment with a high nitrogen concentration through the bottom hole of the dam could alleviate the nitrogen pollution in the Biliuhe reservoir.

1. Introduction

On a global scale, human activities—such as agricultural fertilization, domestic and industrial sewage discharge, and fossil fuel combustion—have dramatically increased the nutrient loads transported by rivers, which has resulted in severe eutrophication problems in aquatic ecosystems [1,2]. Reservoirs, acting as the important engineering controls in rivers, have greatly changed the nutrient cycles in the basin. The building of dams impedes the transport of pollutants and nutrients from basins to oceans by rivers [3]. Due to the long water residence time (compared with rivers) and the enhanced particle settling velocity, pollutants will deposit in the reservoir along with other sediment [4]. Additionally, water source reservoirs always store most of the water input for future multiple uses, but rarely discharge surplus water, which leads to the accumulation of pollutants. After decades of operation, the contamination in the reservoir water and sediment become increasingly noticeable, until finally this limits the function of the water supply [5]. China is the country with the largest number of reservoirs, which has built 98,002 reservoirs with a total storage capacity of 932 billion m3 to fulfill the growing demands for flood control, water resources, and power generation [6]. Due to rapid social and economic development in recent decades, the eutrophication problem of reservoirs is aggravated in China. The eutrophication status assessment of 943 reservoirs across the country demonstrates that 28.8% of the reservoirs are in a eutrophic state [7]. In addition, reservoirs in many other countries are also suffering the eutrophication and water quality deterioration problems [8,9,10].
Nutrient accumulation in reservoirs occurs when nutrients are retained due to the construction of a dam, which could be calculated by the nutrient input flux and output flux. A wide range of nitrogen retention rates have been reported in existing studies, which implies that the process of nutrient transportation varies in different basins [11,12]. Nutrient transportation in the basin is complicated, and sometimes the inter-basin water diversion project makes quantitative analysis more difficult. Physical-based models, such as the soil and water assessment tool (SWAT), agricultural non-point source pollution model (AGNPS), and Hydrological Simulation Program—Fortran (HSPF) have been developed to evaluate the nutrient loads since the 1970s [13,14,15]. The SWAT model has been widely used to estimate the non-point pollution yields, and the model performance has been confirmed in many typical basins [16]. However, the model requires high-resolution input data, especially meteorological data, which is the important drive factor of the nutrient cycle [17]. Sparse spatial data, measurement errors, and the sensitivity of the hydrologic parameters would limit the model accuracy [18]. In recent years, various atmospheric reanalysis datasets such as the JRA-55, the ERA-Interim, the CFSR, and the MERRA have been developed and used globally [19,20,21,22]. The China Meteorological Assimilation Driving Datasets for the SWAT model (CMADS) are the latest East Asia atmospheric reanalysis datasets developed by Dr. Xianyong Meng from the China Agricultural University (CAU), which have attracted widespread attention [23,24,25]. The CMADS series of datasets have been verified in different basins of China and Korea and have performed well in the Heihe basin, Manas River Basin, Qinghai–Tibet Plateau, Han River Basin and so on, however the application of CMADS mainly focuses on hydrological simulation and there are few studies about non-point source pollution simulation driven by the datasets, especially in the cold regions of Northeast China [26,27,28,29,30,31,32,33].
Excessive nitrogen is one of the main problems facing surface freshwater systems today [34]. There is widespread research on the monitoring, simulation and assessment of nitrogen in reservoirs [35,36]. However, the quantitative analysis of the dynamic accumulation process of nitrogen in the reservoirs is difficult because of the various nitrogen sources and complicated transportations. Dalian city is one of the most important cities in Northeast China, which is also a water-deficient city. Biliuhe reservoir, the drinking water reservoir of Dalian city, is facing severe nitrogen pollution and the concentration of TN has exceeded Grade V in China’s water quality standard in recent years [37]. A systematic water transfer network has been built to ease the shortage of water resources in the Dalian area, which brings about new issues in environmental management between the different basins. In the Biliuhe reservoir basin, there are some studies about the runoff but few about nutrient transport process [38,39]. The existing research on nitrogen accumulation of the Biliuhe reservoir is based on an empirical model and the results are static and simple, so further analysis is necessary [40]. The effects of the inter-basin water diversion project on the reservoir total nitrogen (TN) accumulation are also rarely studied. The aims of this paper are (1) to propose an integrated methodology for analysis of the reservoir TN accumulation based on the SWAT model driven by CMADS, and (2) to analyze the dynamic process of the TN accumulation in the Biliuhe reservoir.

2. Materials and Methods
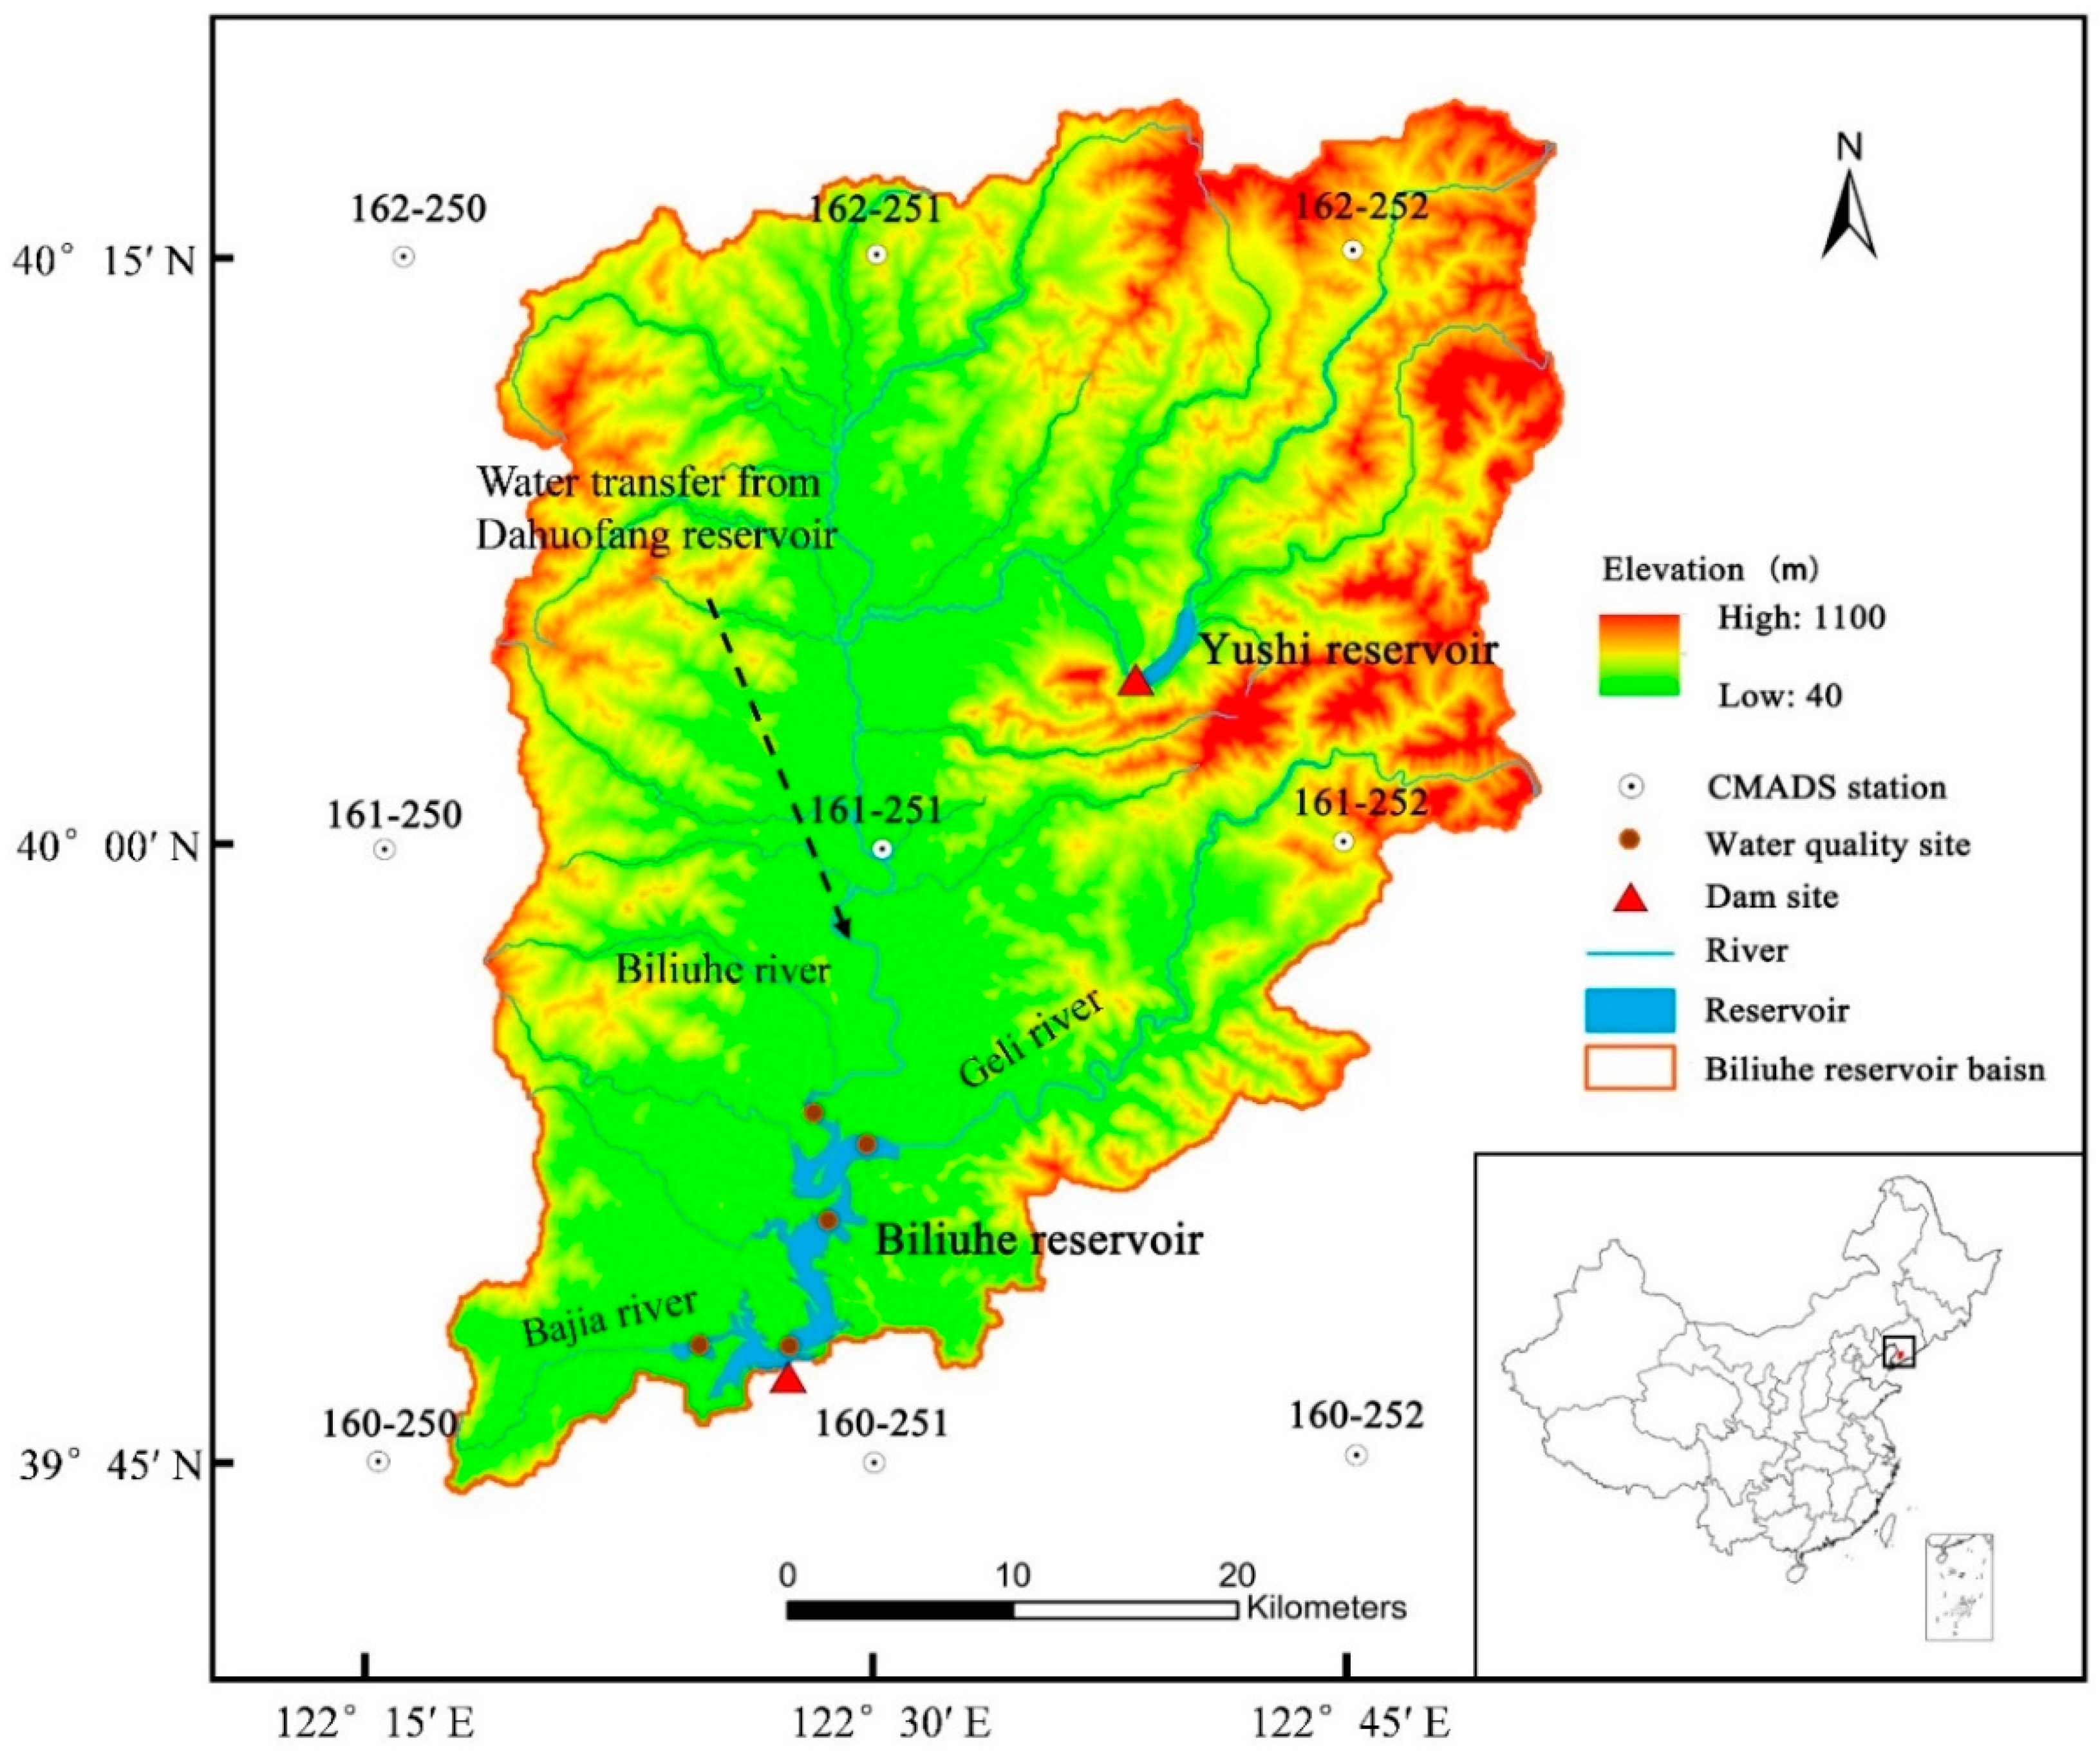
2.1. Study Area

The Biliuhe reservoir (122°29′24.11″ N; 39°49′12.52″ E), located 175 km northeast of Dalian city, is a large canyon-shaped reservoir with multiple uses: water supply, flood control, power generation, and agricultural irrigation. The maximum storage capacity and the effective storage capacity of the reservoir are 9.34 × 10⁸ m3 and 6.44 × 10⁸ m3, respectively. The mean surface water area of the reservoir is 55.60 km2 and the mean water depth is 12.84 m. With a designed annual water supply of 4.38 × 10⁸ m3, the Biliuhe reservoir accounts for 80% of the domestic and industrial water supply for Dalian city. The Yushi reservoir, located in the upper stream of the Biliuhe River, has a storage capacity of 0.88 × 10⁸ m3. There are two main inter-basin water diversion projects in the basin: the Biliuhe reservoir to Dalian city water diversion project (BDWD), and the Dahuofang reservoir to Biliuhe reservoir water diversion project (DBWD). The Biliuhe reservoir to Dalian city water diversion project began to divert water in 1984, and the designed water diversion of the project is 4.38 × 10⁸ m3 year−1. The Dahuofang reservoir to Biliuhe reservoir inter-basin water diversion project was completed in October of 2014. The designed water diversion of the project is 3.29 × 10⁸ m3 year−1. By the end of 2016, 3.2 × 10⁸ m3 water had been transferred into Biliuhe reservoir to alleviate the severe drought in the Dalian area.
The reservoir basin reaches an area of about 2085 km2, with the three main tributary rivers being Biliuhe River, Geli River, and Bajia River (Figure 1). The reservoir catchment has a temperate monsoon climate characteristic, with an annual average temperature of 10.6 °C, hot summers and cold winters. The annual average precipitation is 743 mm and 75% of the precipitation is centralized in the flood period (June–September). The icebound season of the Biliuhe reservoir is long and lasts from November–March. The upper catchment of the reservoir is mainly covered by forest (72%) and agricultural land (19%), which can be seen from the Figure 2. There are about 256,000 residents in the basin and they mostly live along the bank of the river. Agriculture dominates the economic development in the basin.

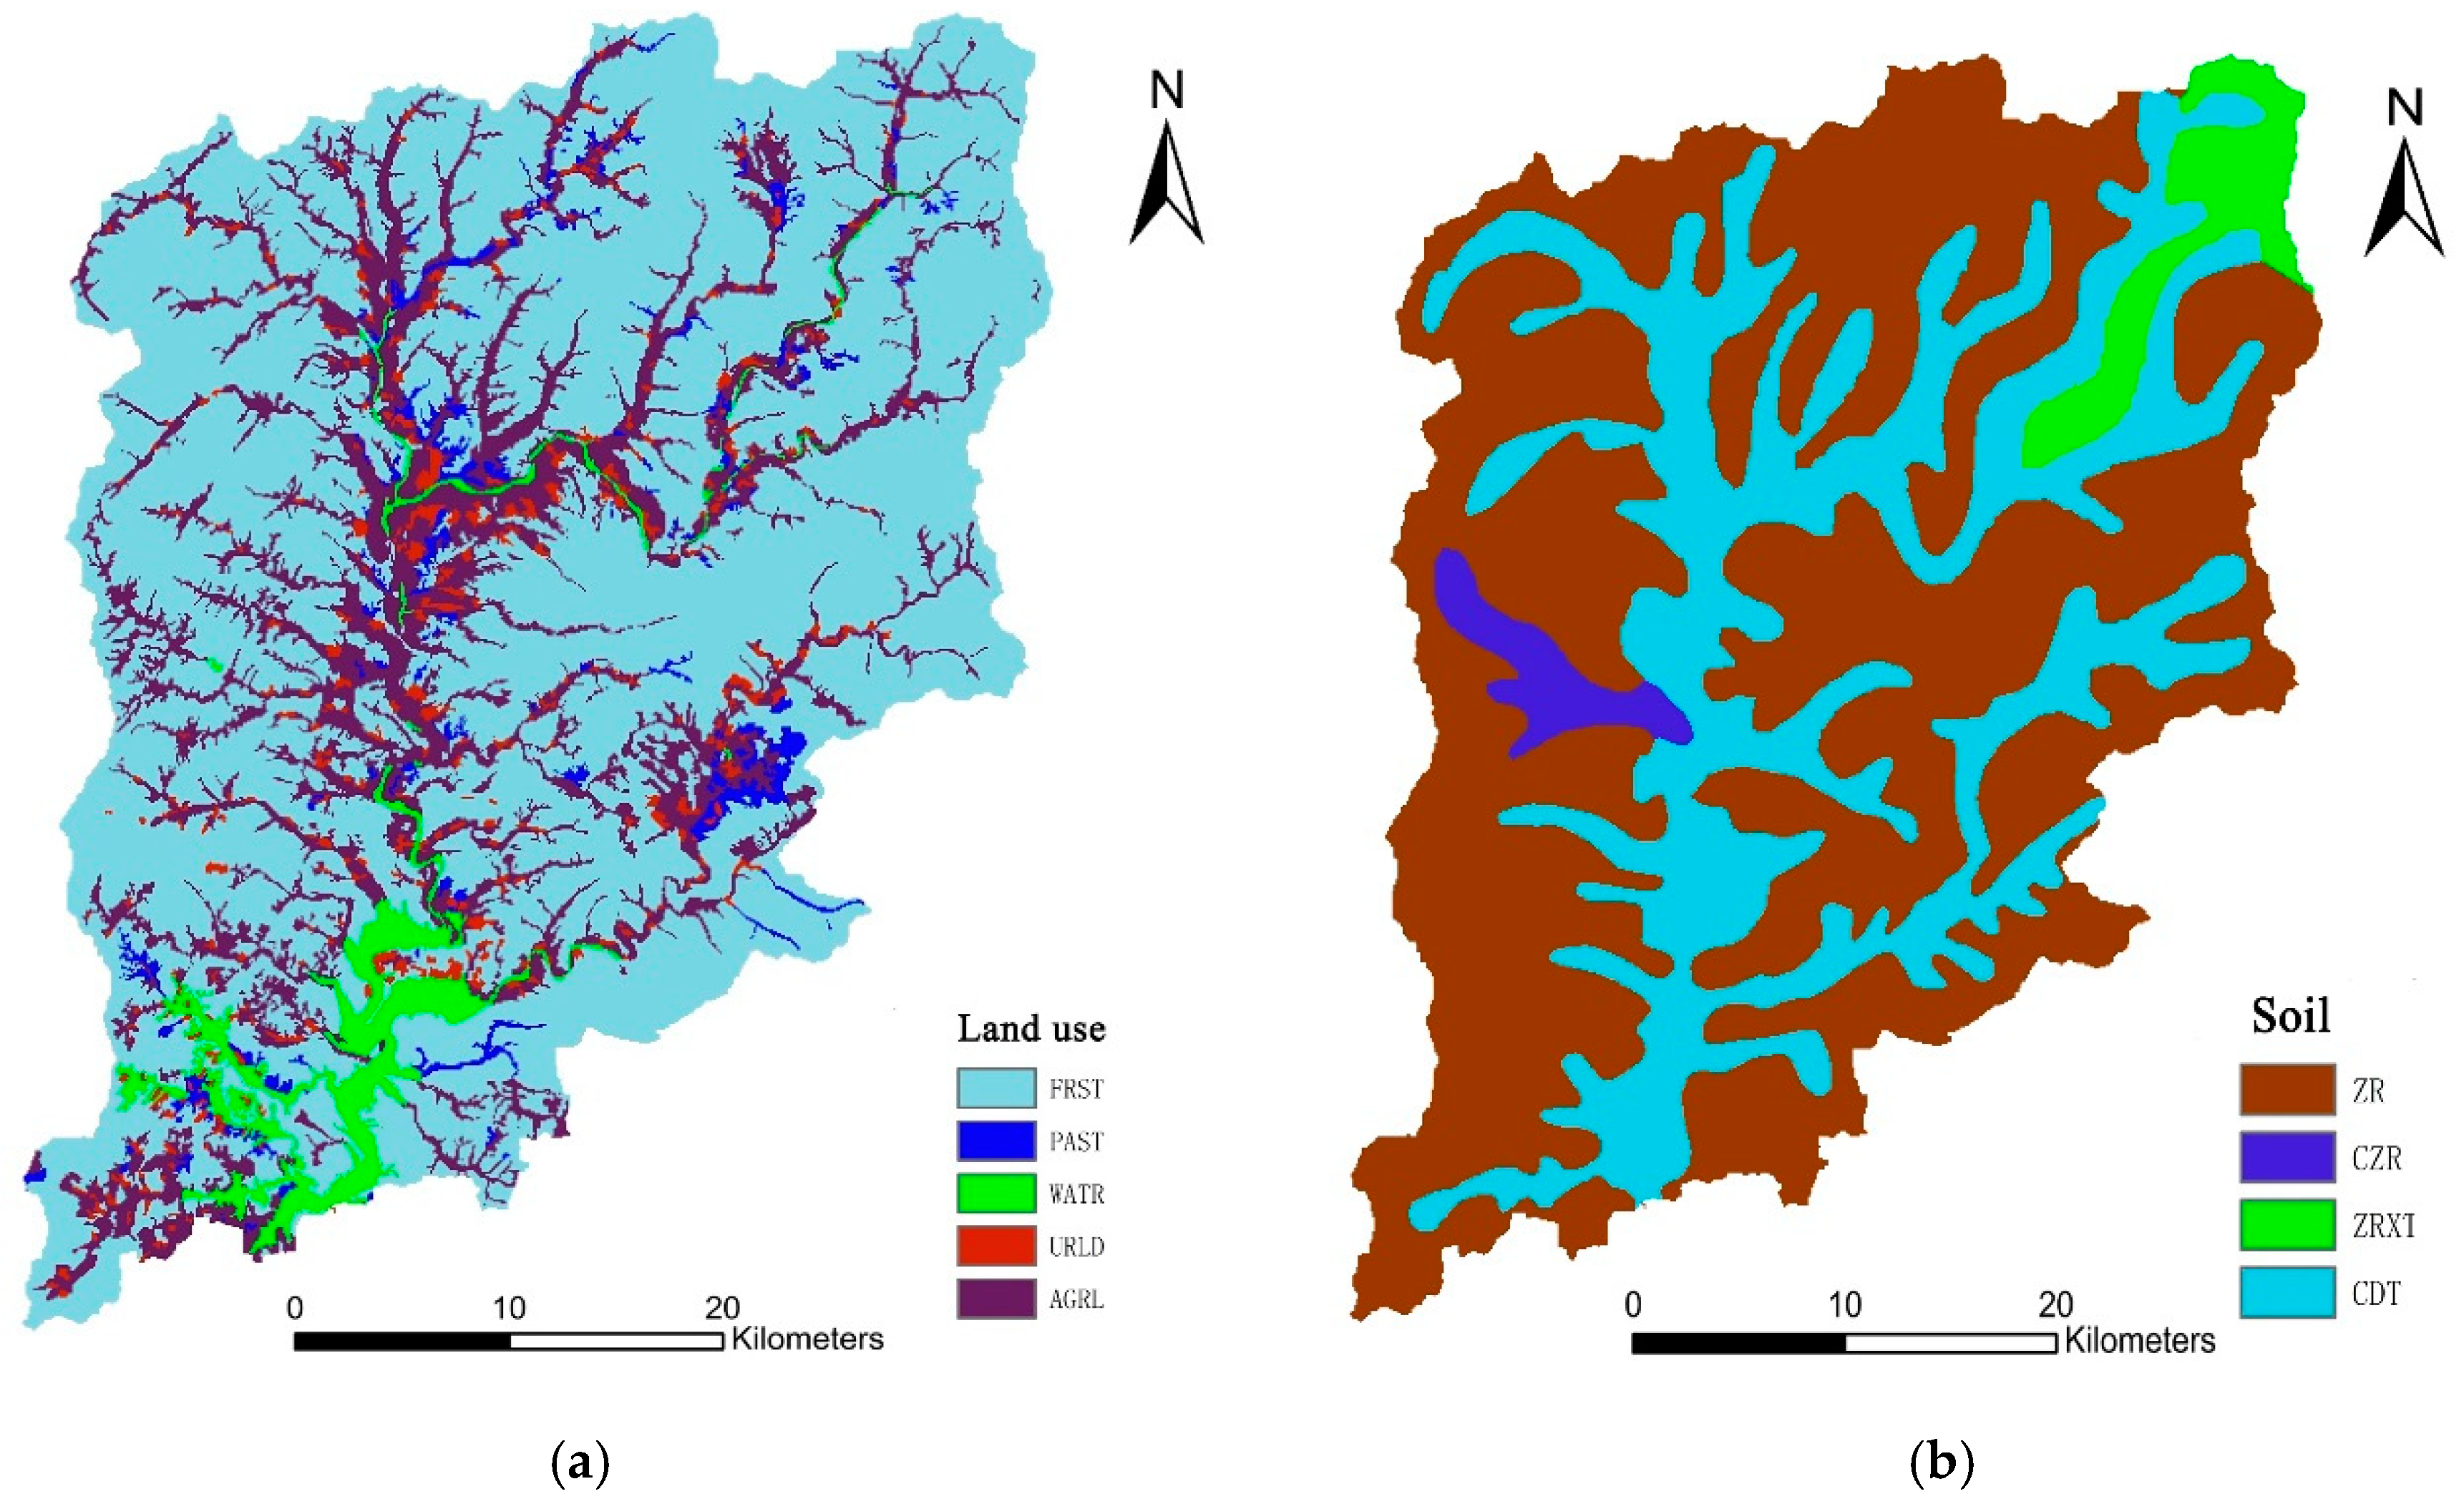
2.2. SWAT Model and Data Source

The SWAT (soil and water assessment tool) model is a basin-scale, semi-distributed, and physically based model developed by the United States Department of Agriculture Research Service in the early 1990s [41]. It has been widely applied to predict the impacts of land management practices on water, sediment, and nutrient loss in large, complex basins. The model partitions the basin into multiple sub-basins, which are further divided into hydrological response units (HRUs) consisting of homogeneous land use, soil characteristic, and slope. The hydrological sub-model is based on the water-balance equation to simulate the processes of precipitation, infiltration, surface runoff, evapotranspiration, lateral flow, and percolation [42]. In this study, the Biliuhe reservoir upper basin was divided into 99 sub-basins and 805 HRUs. The simulation of nutrients in the catchment was fully considered in the nutrients module, including migration and transformation in soil, the transportation process from the upper catchment to downstream through the main river channel, and the surface runoff or interflow [19]. The SWAT model can also simulate the water and nutrient transfer between reservoirs, the reach, and sub-basins, or the water transfer between different basins.
The version of SWAT used in this study is the ArcSWAT 2012 (Texas A&M University, College Station, TX, USA), which is an ArcGIS-ArcView extension and graphical user input interface for the SWAT model. The spatial data used in the SWAT model includes digital elevation data (DEM), land cover data, and soil type data. The 90 × 90 m DEM data was obtained from the International Scientific & Technical Data Mirror Site, Computer Network Information Center, Chinese Academy of Sciences (http://www.gscloud.cn). The land cover data of the 2000s (1:100,000) and soil information map (1:1,000,000) were provided by the Data Center for Resources and Environmental Sciences, Chinese Academy of Sciences (RESDC) (http://www.resdc.cn). The land cover in the study area could be classified into five types: forest (72.30%), farmland (18.94%), grassland (2.40%), low-density residential (2.76%), and water body (3.60%). There are four soil types distributed within the basin: brown earth, young brown earth, meadow brown earth, and meadow soil (Figure 2). The main soil attributes were obtained from the China Soil Database or calculated by the soil–plant–atmosphere–water (SPAW) model. Some attributes that could not be obtained were taken from the soil database of the SWAT model. The soil particle size transformation from an international system to the US system was completed by the cubic spline interpolation method. The basic data of fertilization per hectare, manure of livestock and poultry breeding, and rural domestic sewage came from the report of the investigation of pollution sources and water quality in the Biliuhe reservoir (2012). After an investigation, there was found to be nine point-source pollution outlets within the catchment: Dalian Buyunshan hot spring bath center, Dalian Guanba Silk Food Co., Ltd., Dalian Jiantang hot spring bath center, Dalian Jiantang hot spring bath center east sewage, Dalian Xingzhi Canned Food Co., Ltd., Yingkou Epps Sewing Products Co., Ltd., Shizijie Town comprehensive sewage outlet, Wanfu Town east comprehensive sewage outlet, and Wanfu Town south comprehensive sewage outlet [40]. The regulation of the Yushi reservoir could be simulated directly by the reservoir module of the SWAT model. The model calibration, sensitivity analysis, and uncertainty analysis were achieved by the Sufi-2 (Sequential Uncertainty Fitting, version 2) algorithm, which was coupled with the SWAT-CUP. The model performance was evaluated by the coefficient of determination (R2), Nash–Sutcliffe simulation efficiency (NSE), and percent bias (PBIAS), which are defined as [43]
R 2 = i = 1 n ( O i O avg ) ( S i S avg ) / { [ i = 1 n ( O i O avg ) 2 ] [ i = 1 n ( S i S avg ) 2 ] } 1 2
NSE = 1 i = 1 n ( O i S i ) 2 / i = 1 n ( O i O avg ) 2  
PBIAS = i = 1 n ( O i S i ) / i = 1 n ( O i ) × 100 %  
where Oi and Si are the observed and simulated data, respectively. Oavg and Savg are the average values of the observed and simulated data, while n is the total number of data records. The discharge and TN data required for calibration and validation were derived from the Biliuhe reservoir management bureau, and the TN concentration was monitored by the national standard method.
The meteorological data used in the SWAT model was obtained from the China Meteorological Assimilation Driving Datasets for the SWAT model (CMADS V1.1), which can be downloaded from the website of Cold and Arid Regions Sciences Data Center (www.cmads.org). The CMADS integrated the air temperature, air pressure, humidity, and wind velocity data through the LAPS/STMAS system and other multiple techniques, such as data loop nesting, resampling, pattern estimation, and bilinear interpolation. Precipitation data were assimilated using the CMORPH’s global precipitation product and the National Meteorological Information Center’s data of China [23]. The CMADS V1.1 serials of datasets cover the entire East Asian region (0°–65° N, 60°–160° E) and can provide high-resolution and high-quality meteorological data for the study area with sparse weather station coverage. In this study, the SWAT model made use of the meteorological data of nine CMADS stations in the study area, which included precipitation, relative humidity, solar radiation, temperature, and wind speed. The spatial resolution is 0.25 degrees, the time resolution is daily, and the time scale is 2008–2016. Detailed location information of the stations is shown in Figure 1.

2.3. Integrated Methodology of TN Accumulation

The TN load simulated by the SWAT model is the TN flux transported from the upper basin into the Biliuhe reservoir through the surface and underground runoff, which includes the point source input, non-point source input, and inter-basin water diversion input. Because the SWAT cannot properly conduct reservoir nitrogen simulations in general, it was mainly used to simulate the TN load of the Biliuhe reservoir upper watershed in this study, and the study reservoir was only taken as an outlet of the basin. To better study the nitrogen pollution of the Biliuhe reservoir, an integrated methodology based on the mass balance theory is proposed to calculate the TN accumulation in the Biliuhe reservoir. The TN accumulation of the Biliuhe reservoir is defined as the TN flux difference between input and output, which can be evaluated by accumulation quantity and accumulation efficiency. The reservoir nitrogen input includes the point source input, non-point source input, inter-basin water diversion project (DBWD) input, and aquaculture input due to the fish feed and manure, while the non-point source input includes soil source input, fertilizer application input, livestock and poultry breeding input, rural domestic sewage input, and atmospheric deposition input. The reservoir nitrogen output includes the water discharge output, water diversion project output, aquaculture output, and denitrification output. The TN accumulation model is described by Equations (4) to (6)
∆N = Nin − Nout
Nin = Np + Nnp + Ndiv1 + Naqua1
Nout = Ndis + Ndiv2 + N aqua2 + Nden
where ΔN is the accumulation of TN, kg; Nin is the TN fluxes input the reservoir, kg; and Nout is the TN measured export from the reservoir, kg. In the composition of the TN input, Np is the point source input, kg. The sewage discharge and nitrogen concentration of the nine outlets were measured in 2011, and used for the point source load simulation in this study. Nnp is the non-point source input, which can be divided into soil source input (Nsoil), fertilizer application input (Nfer), livestock and poultry breeding input (Nliv), rural domestic sewage input (Nrur), and atmospheric deposition input (Natm). Ndiv1 is the TN input of the inter-basin water diversion projects, kg. The mean discharge and nitrogen concentration in 2014–2016 were used to calculate the water diversion project load. Naqua1 is the aquaculture input. Because cage culture is prohibited in the Biliuhe reservoir and the fishery statistics data is unavailable, the aquaculture input and output are ignored in this study. All of the TN inputs except the direct rainfall N input were simulated by the SWAT model. The direct rainfall input was calculated by the precipitation, average TN concentration in the precipitation, and the surface water area. The precipitation data was derived from the CMADS. The TN concentration in the precipitation refers to the research of Yan and Shi [44]. The surface water area was obtained from the Biliuhe reservoir management bureau.
In the composition of the TN output, Ndis is the output of the water discharge to the downstream channel, kg. Naqua2 is the output of the aquaculture harvest, kg. Ndiv2 is the output of the water diversion project, kg. Nden is the output of denitrification, kg. N aqua2 is the aquaculture output which was not considered in this study. The water discharge output and the inter-basin water diversion project output were calculated by the output water volume and the TN concentration in front of the dam, which were also obtained from the Biliuhe reservoir management bureau. The denitrification process mainly occurs in the sediment and varies greatly among different aquatic systems [45]. The denitrification output in this study can be calculated by the denitrification rate and reservoir surface area, described by Equation (7)
Nden = 0.014 × V × A
where V is the denitrification rate, referring to a lake in Canada with similar meteorological and hydrological characteristics, 15 μmol N m−2 h−1 [46], and A is the surface water area, km2. The TN accumulation efficiency (RN) can be defined by Equation (8)
RN = (Nin − Nout)/Nin × 100%

3. Results

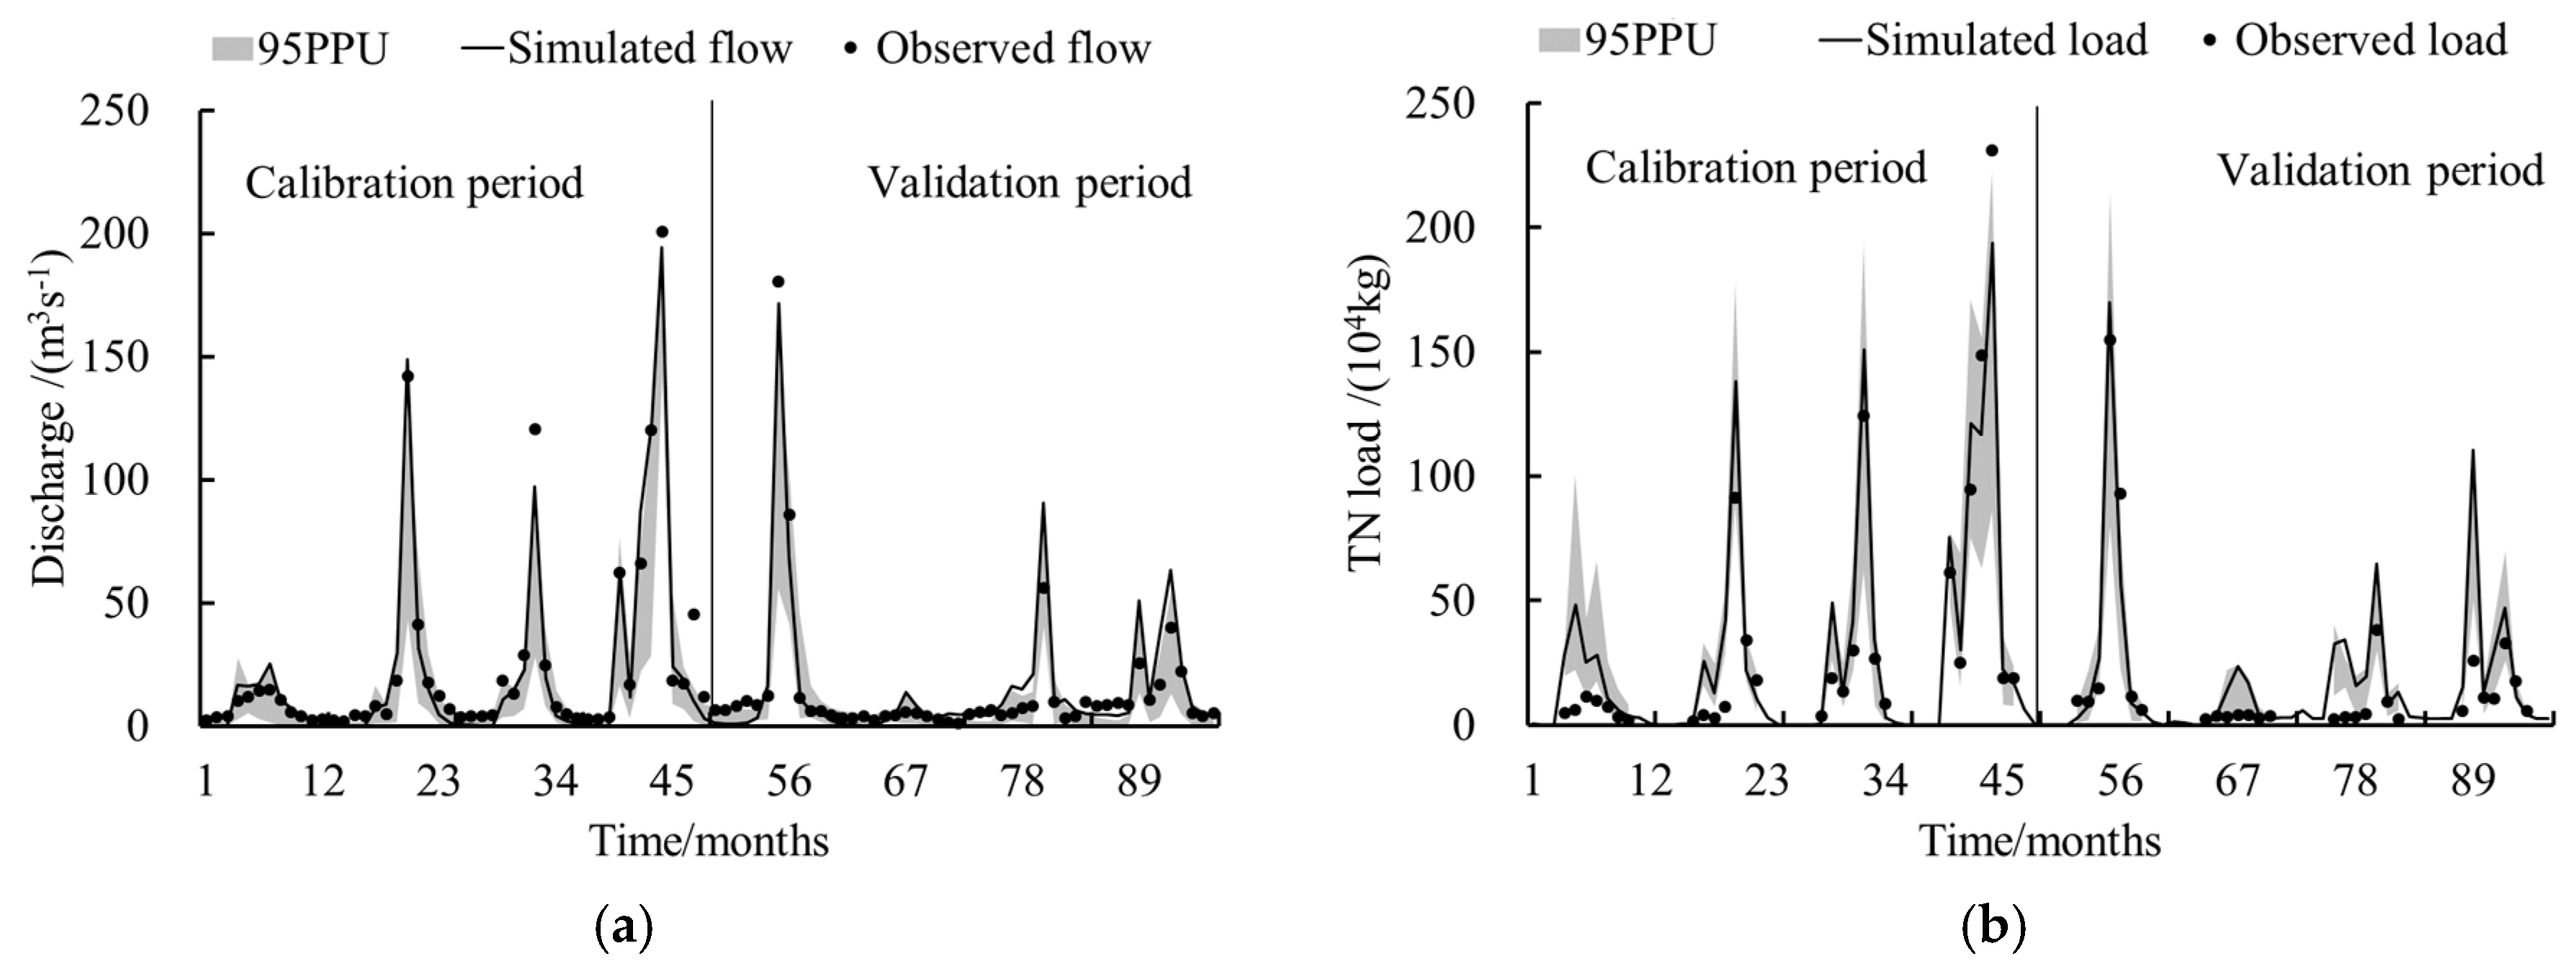
3.1. SWAT Model Performance

The monthly observed data of discharge at the dam monitoring station and TN concentration at the entrance of reservoir were used for warm-up (2008), calibration (2009–2012), and validation (2013–2016). The hydrology and nitrogen parameters used for model calibration were shown in the Table S1 of the Supplementary Materials. For assessment of the SWAT model results, Wang and Melesse proposed that NSE >0.75 can be considered as “good”, while values between 0.36 to 0.75 can be considered as “satisfactory” [47]. On the other hand, Moriasi et al. suggested a monthly model simulation can be judged as satisfactory if NSE values > 0.5 for runoff and 0.35 for nutrients, and if PBIAS was ±15% for discharge, and ±30% for N [43]. The evaluation results of the simulation discharge and TN are shown in Table 1. For the discharge, the monthly R2 values were 0.96 and 0.90, the NSE values were 0.96 and 0.89, and PBIAS values were 8.68% and −11.53% in the calibration and validation periods, indicating a good performance of the SWAT model.
For the simulation of TN, the R2 values were 0.87 and 0.71, the NSE values were 0.85 and 0.53, and the PBIAS values were –13.49% and –21.71% in the calibration and validation periods, respectively. The accuracy of the TN simulation was lower than that of the stream flow, but can still be considered as satisfactory according to the standard suggested by Moriasi. The observed and simulated monthly stream flow and TN are shown in Figure 3. The accuracy of the stream simulation results in the validation periods was worse than those in the calibration periods, which can be attributed to the drought that occurred in 2014–2015. Increased irrigation and domestic water consumption during droughts lead to a severe water intake from the river, and the observed discharge at the dam monitoring sites will be lower than the simulation value. The simulation of TN had similar characteristics. In general, the meteorological data of CMADS has a good applicability in the study area, and the CMADS-driven SWAT model can be used for runoff and TN simulation in the Biliuhe reservoir basin.
The sensitivity analysis result showed that the maximum canopy storage (CANMX), baseflow alpha factor for bank storage (ALPHA_BNK), Manning’s n value for the main channel (CH_N2), SCS runoff curve number (CN2), and effective hydraulic conductivity in the main channel alluvium (CH_K2) were the most sensitive parameters for stream flow, while the nitrogen percolation coefficient (NPERCO), saturated hydraulic conductivity (SOL_K), moist bulk density (SOL_BD), Manning’s n value for the main channel (CH_N2), and organic nitrogen enrichment ratio (ERORGN) were the most sensitive parameters for the TN load. The uncertainty analysis results showed that 88% (P-factor) of the discharge observations and 75% (P-factor) of the TN observations fell within the 95% confidence level uncertainty range (95PPU) in the calibration period, and the R-factors were 0.59 and 0.96, respectively. During the validation period, 79% of the discharge observations, and 71% of the TN observations fell within the 95% confidence interval (95PPU), and the R-factors were 0.58 and 0.90. The uncertainty of the SWAT model in the validation period was higher than that in the calibration period.

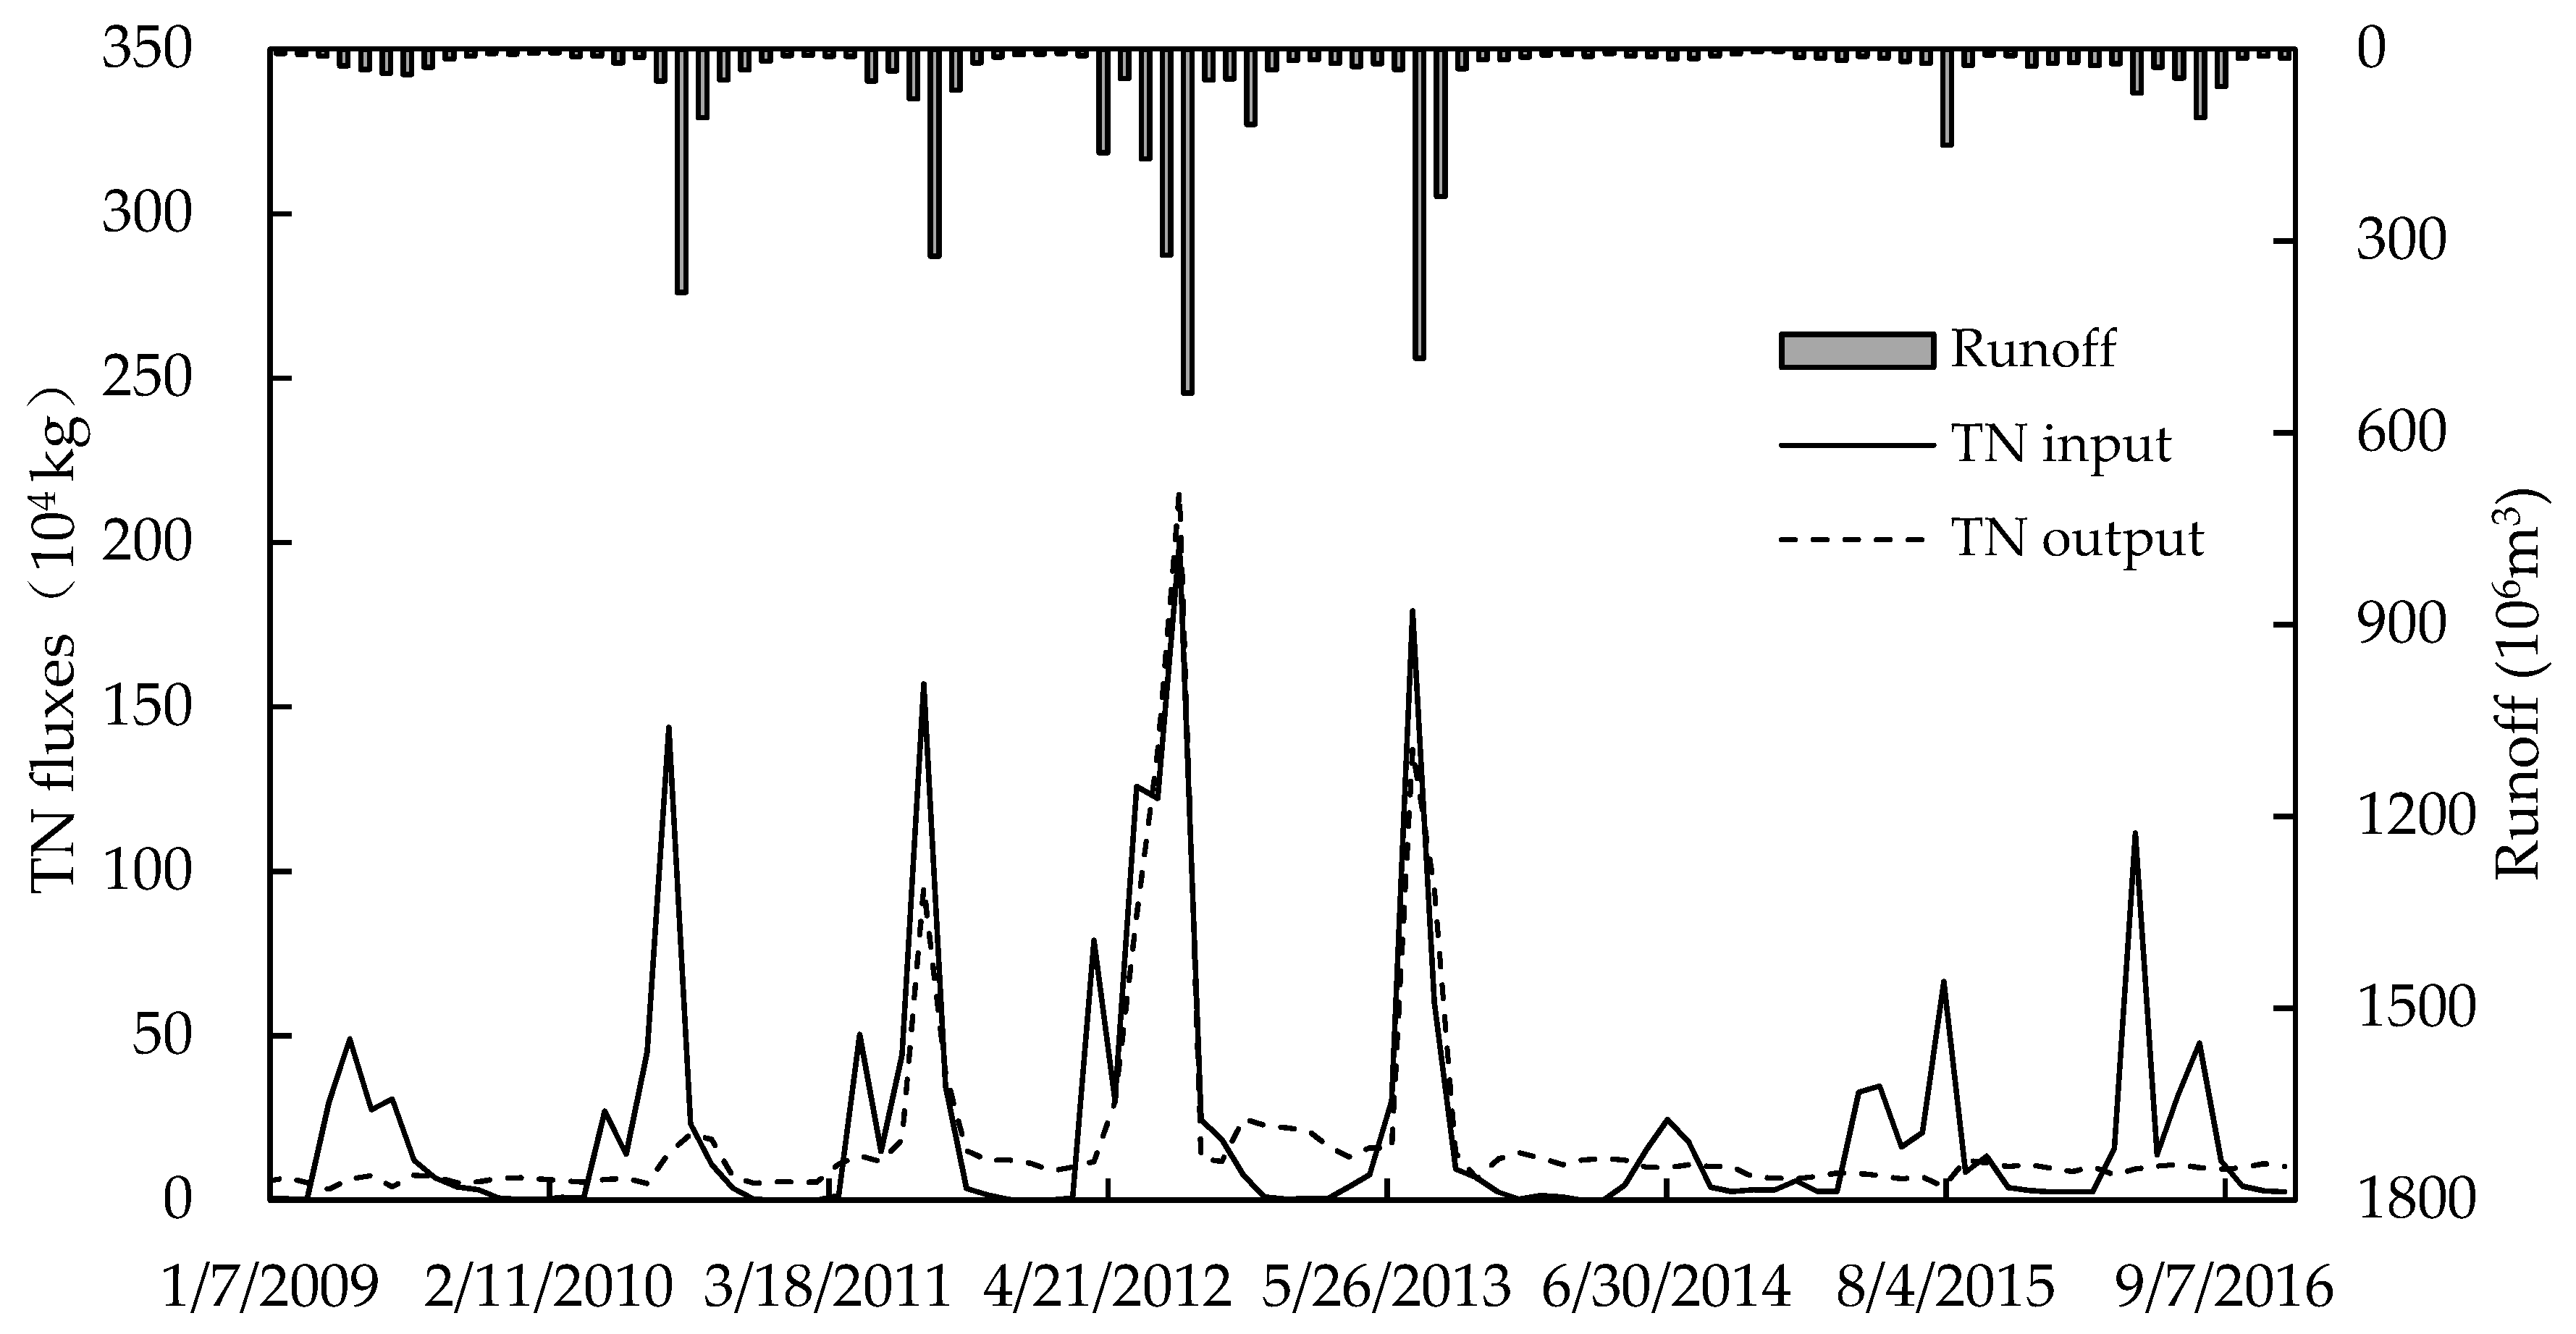
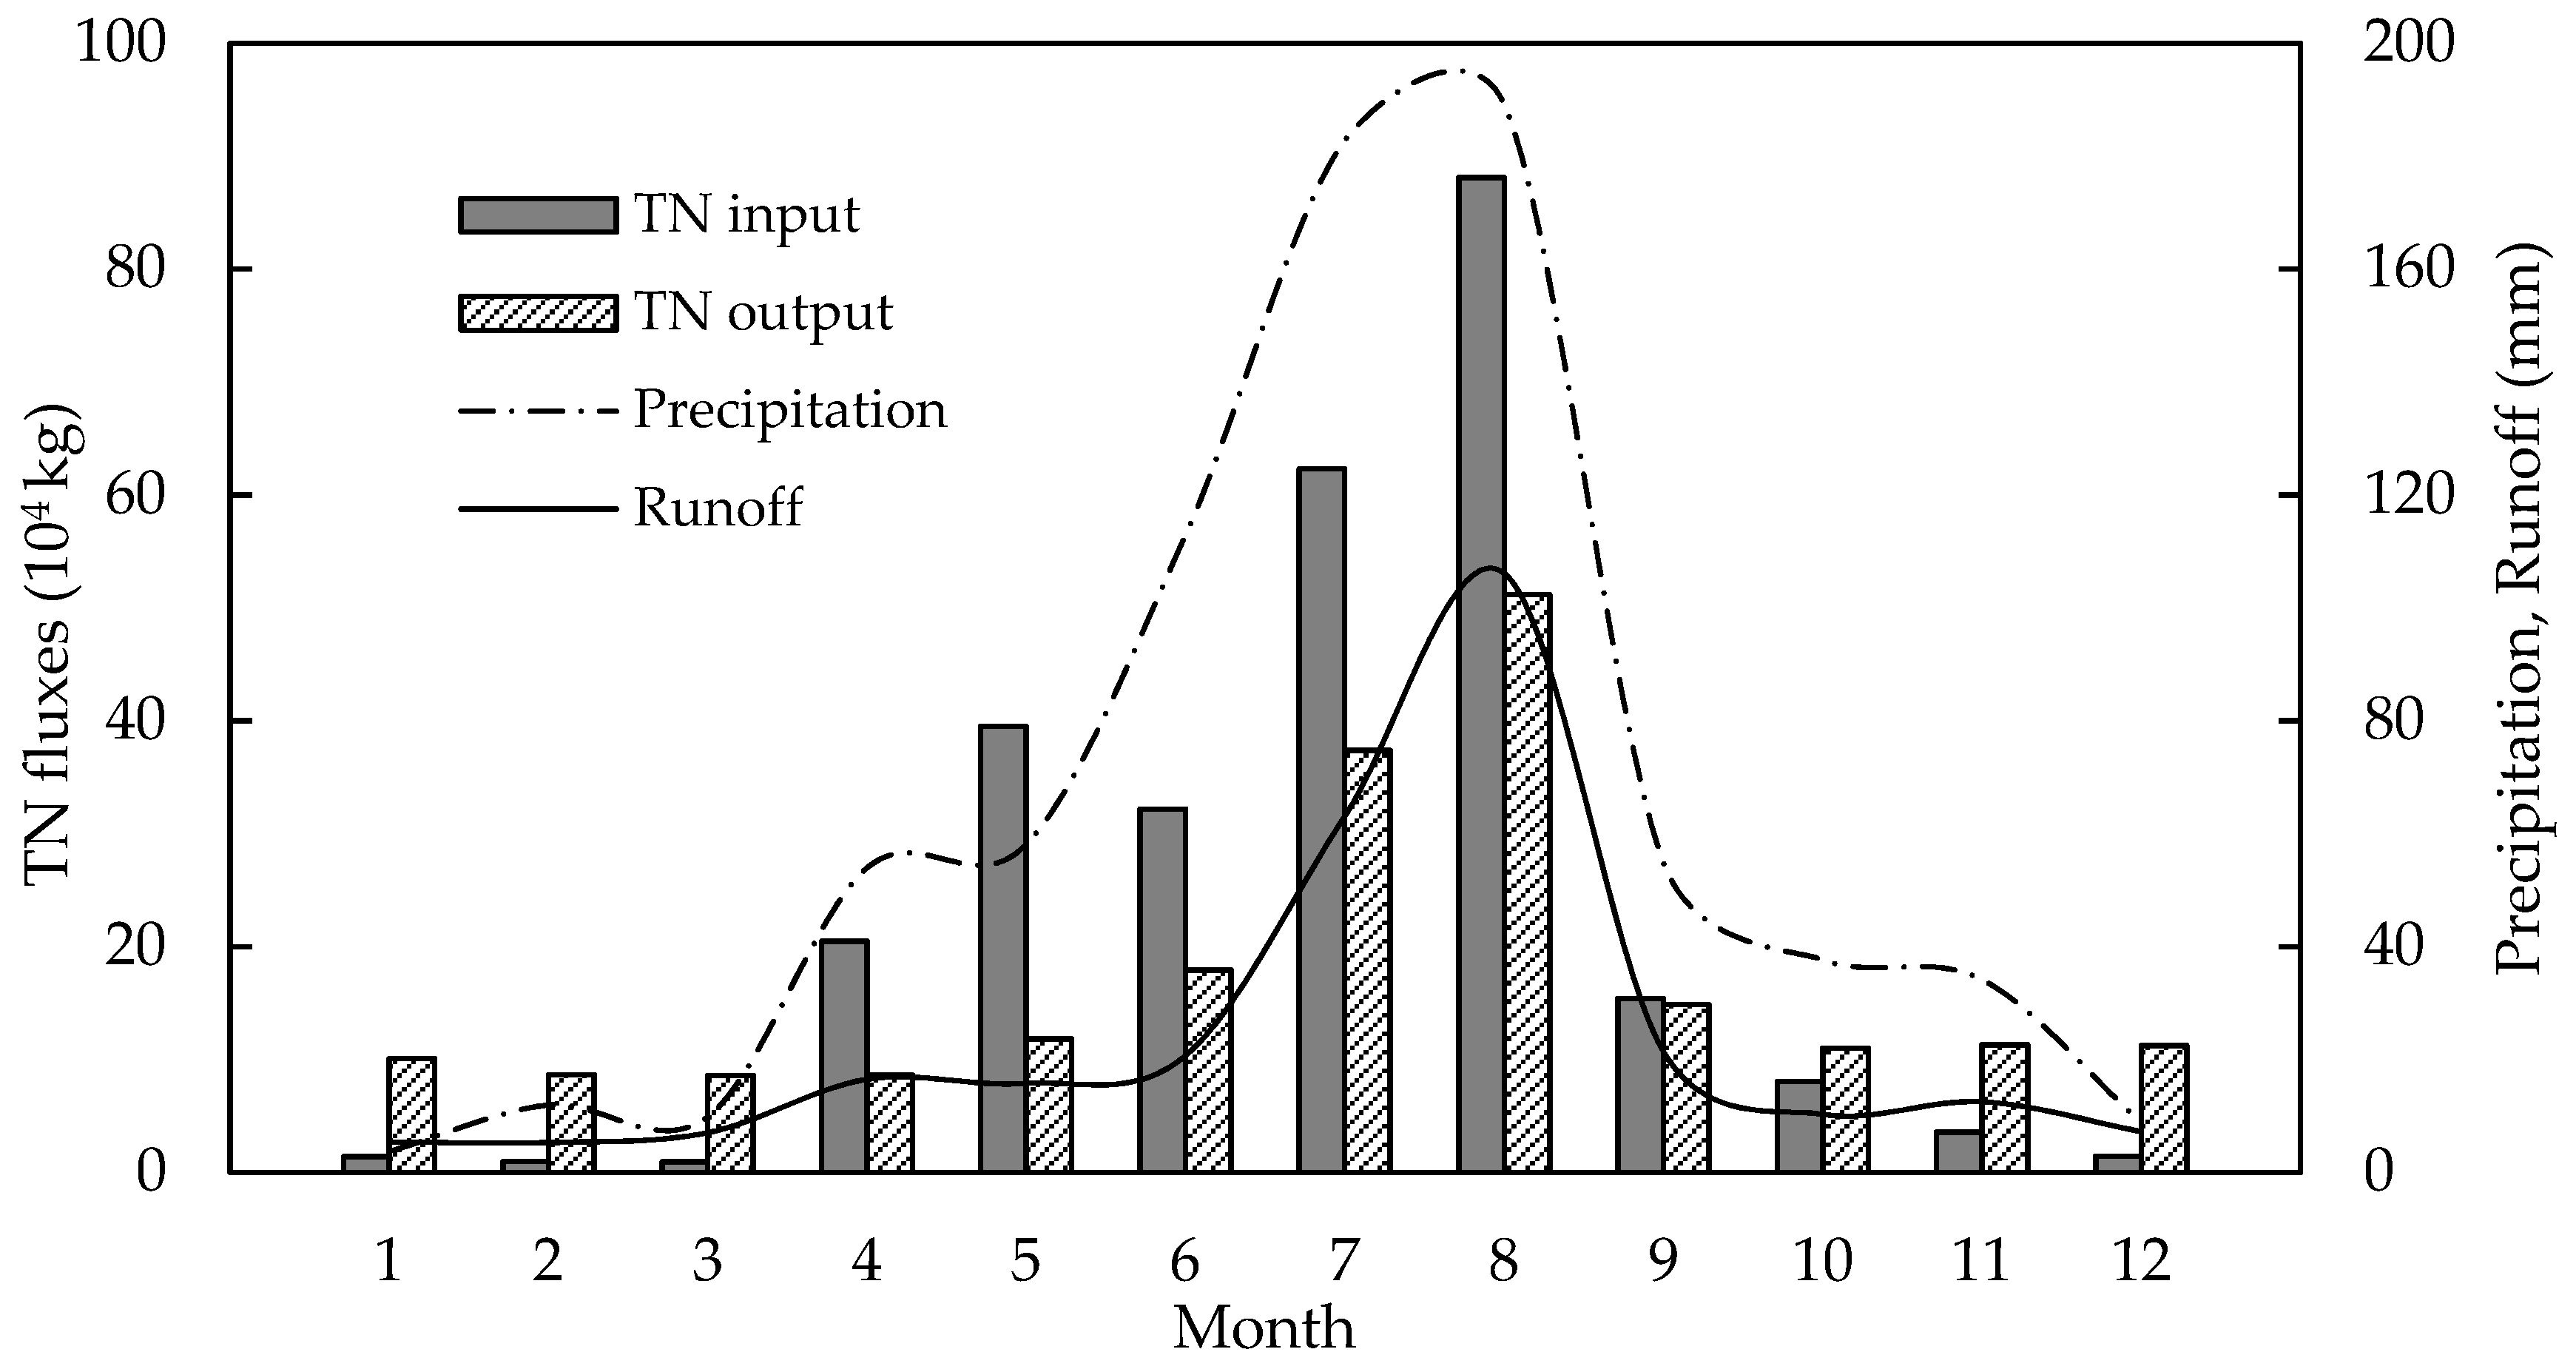
3.2. Temporal Characteristic of TN Fluxes of the Biliuhe Reservoir

The stream flow and TN fluxes of the Biliuhe reservoir are shown in Figure 4. The distribution of the TN input was very uneven between different years, and the TN input during the flood period was significantly higher than in the non-flood period. The TN input was consistent with the runoff. A simple Pearson’s correlation analysis was performed to assess possible relationships between the TN input and the runoff, and the precipitation and the runoff. The results showed a strong and significant positive correlation between the TN input and the discharge (r = 0.918, p < 0.01), which meant that the nitrogen input was mainly governed by the runoff (Figure 5). This result was in a good agreement with other studies [48,49,50]. The correlation between the precipitation and the runoff was also high (r = 0.872, p < 0.01), but lower than that between the TN input and the runoff. This can be attributed to the severe drought and the inter-basin water diversion project. Due to the flushing of surface runoff, a large amount of nitrogen—along with the flood—enters the reservoir, resulting in the higher input during flood periods (August 2010, August 2011, August 2012, and July 2013). In contrast, the TN input in dry periods (July 2014–November 2015) was relatively lower due to the decrease in precipitation and runoff. For the Biliuhe reservoir, the TN output is greatly influenced by artificial regulation. Therefore, the TN output does not follow the variation of runoff. During wet years, surplus water quantity increases due to the flood input, leading to an increasing TN output. Additionally, affected by the disturbance of the density flow, the nitrogen stored in sediments will release into the water, then be exported from the reservoir with surplus water. In addition to the three years of 2011–2013, the TN output was very stable most of the time. Because in dry years there is no chance for the reservoir to discharge surplus water, water withdrawal becomes the main pathway for TN output, the TN output in dry years is stable and relatively lower than in wet years.
The seasonal TN input and output in the Biliuhe reservoir were assessed to analyze the temporal characteristics of TN fluxes during the year. As can be seen from Figure 6, the TN input changed from month to month and was high in wet seasons and fall and low in dry seasons, consistent with the precipitation and runoff, as well as with the intensive agriculture activities in the wet seasons. The wet seasons (April–October) accounted for 95% of the annual TN input, indicating an extremely uneven distribution of TN input during the year. There was an abrupt increase of TN input at the beginning of the wet season (April), meaning that TN stored in dry seasons had a considerable release during the dry-wet alternation process. The TN output in dry seasons was mainly due to the water supply output and changed slightly, while it increased a lot in wet seasons due to the flood discharge. In general, the TN input was higher than the output during the wet seasons except for October, which meant that the Biliuhe reservoir acted as a sink during most of the wet season. The monthly input of TN was always lower than the output from September to the next March, suggesting that the Biliuhe reservoir acted as a source during dry seasons. The TN accumulation and the composition of TN input and output were analyzed in the discussion.

4. Discussion

4.1. TN Accumulation in the Biliuhe Reservoir

The dynamic TN accumulation process of the Biliuhe reservoir were analyzed based on the TN input and output fluxes. The annual TN accumulation of the Biliuhe reservoir are presented in Table 2. In the study period, the mean annual TN input flux was 274.41 × 10⁴ kg, which was higher than the output flux of 217.14 × 10⁴ kg. The average annual accumulation of TN was 57.27 × 10⁴ kg, indicating that 19.76% of the TN input was retained by the Biliuhe reservoir, which was higher than the TN retained by the Three Gorges reservoir (China) and Wivenhoe reservoir (Australia) [51,52], but lower than the TN retained by Lake Shelbyville (USA) [53]. The maximum and minimum TN input fluxes were 60.98 × 10⁴ kg in 2012 and 78.02 × 10⁴ kg in 2014, while the maximum and minimum output fluxes were 582.88 × 10⁴ kg in 2012 and 71.75 × 10⁴ kg in 2009, indicating that TN accumulation in the study reservoir varied in different hydrological years. It can also be seen from Table 2 that the Biliuhe reservoir was not always a sink of TN—sometimes it could transform into a source. The accumulation of TN in reservoirs is influenced by the balance of input and output. The input TN is mainly driven by runoff, while the TN export from the reservoir is driven by the domestic water supply and flood discharge. Therefore, higher nitrogen input did not correspond to higher nitrogen accumulation in the study period. Especially in 2013, the accumulation of TN was negative due to the higher flood discharge output. Interestingly, higher TN accumulation efficiency was observed in normal hydrological years, because the Biliuhe reservoir always stores most of the water input for future multiple uses but rarely discharges surplus water. During extreme drought years, the reservoir may also act as a source, with the TN input flux decreasing and the water consumption increasing, as shown in 2014. Reservoirs act as a sink or source of nutrients due to the basin characteristics and reservoir regulation.
For the Biliuhe river basin, the dam decreases the ecological water volume of the downstream area and obstructs the dispersal and migration of nutrients, which has resulted in the degradation of the downstream ecosystem and extinction of species. In the study reservoir, there was a rising trend of TN accumulation. The TN retained by the reservoir partly stores in the water and partly deposits with sediment due to adsorption. The water TN concentration of the Biliuhe reservoir was 2.16 mg/L in 2009, rising to 2.92 mg/L in 2016, which meant an increase of the eutrophication risk of the water body. Despite the increase of the TN concentration in the water, the TN stored in the water decreased during the study period due to the decrease in water volume (from 562 million m3 in 2009 to 183 million m3 in 2016), which demonstrated that the TN that accumulated in the sediment contributed to a large proportion of the TN accumulation in the reservoir. Recent research has also shown that TN in the sediment of the Biliuhe reservoir is at a relatively high level, and endogenous nitrogen released from the sediment could contribute to the water nitrogen pollution [54]. Water supply and flood discharge are two major ways to export the TN from the reservoir. Water withdrawal for urban use is mainly from the upper water column in front of the dam, which has good water quality. Therefore, the nitrogen in the bottom water and sediment could not be discharged from the reservoir. For the above problems, in addition to decreasing the non-point source nitrogen input from upper basin, discharging anoxic waters and sediment with a high nitrogen concentration through the bottom hole of the dam could alleviate the nitrogen pollution in the Biliuhe reservoir.

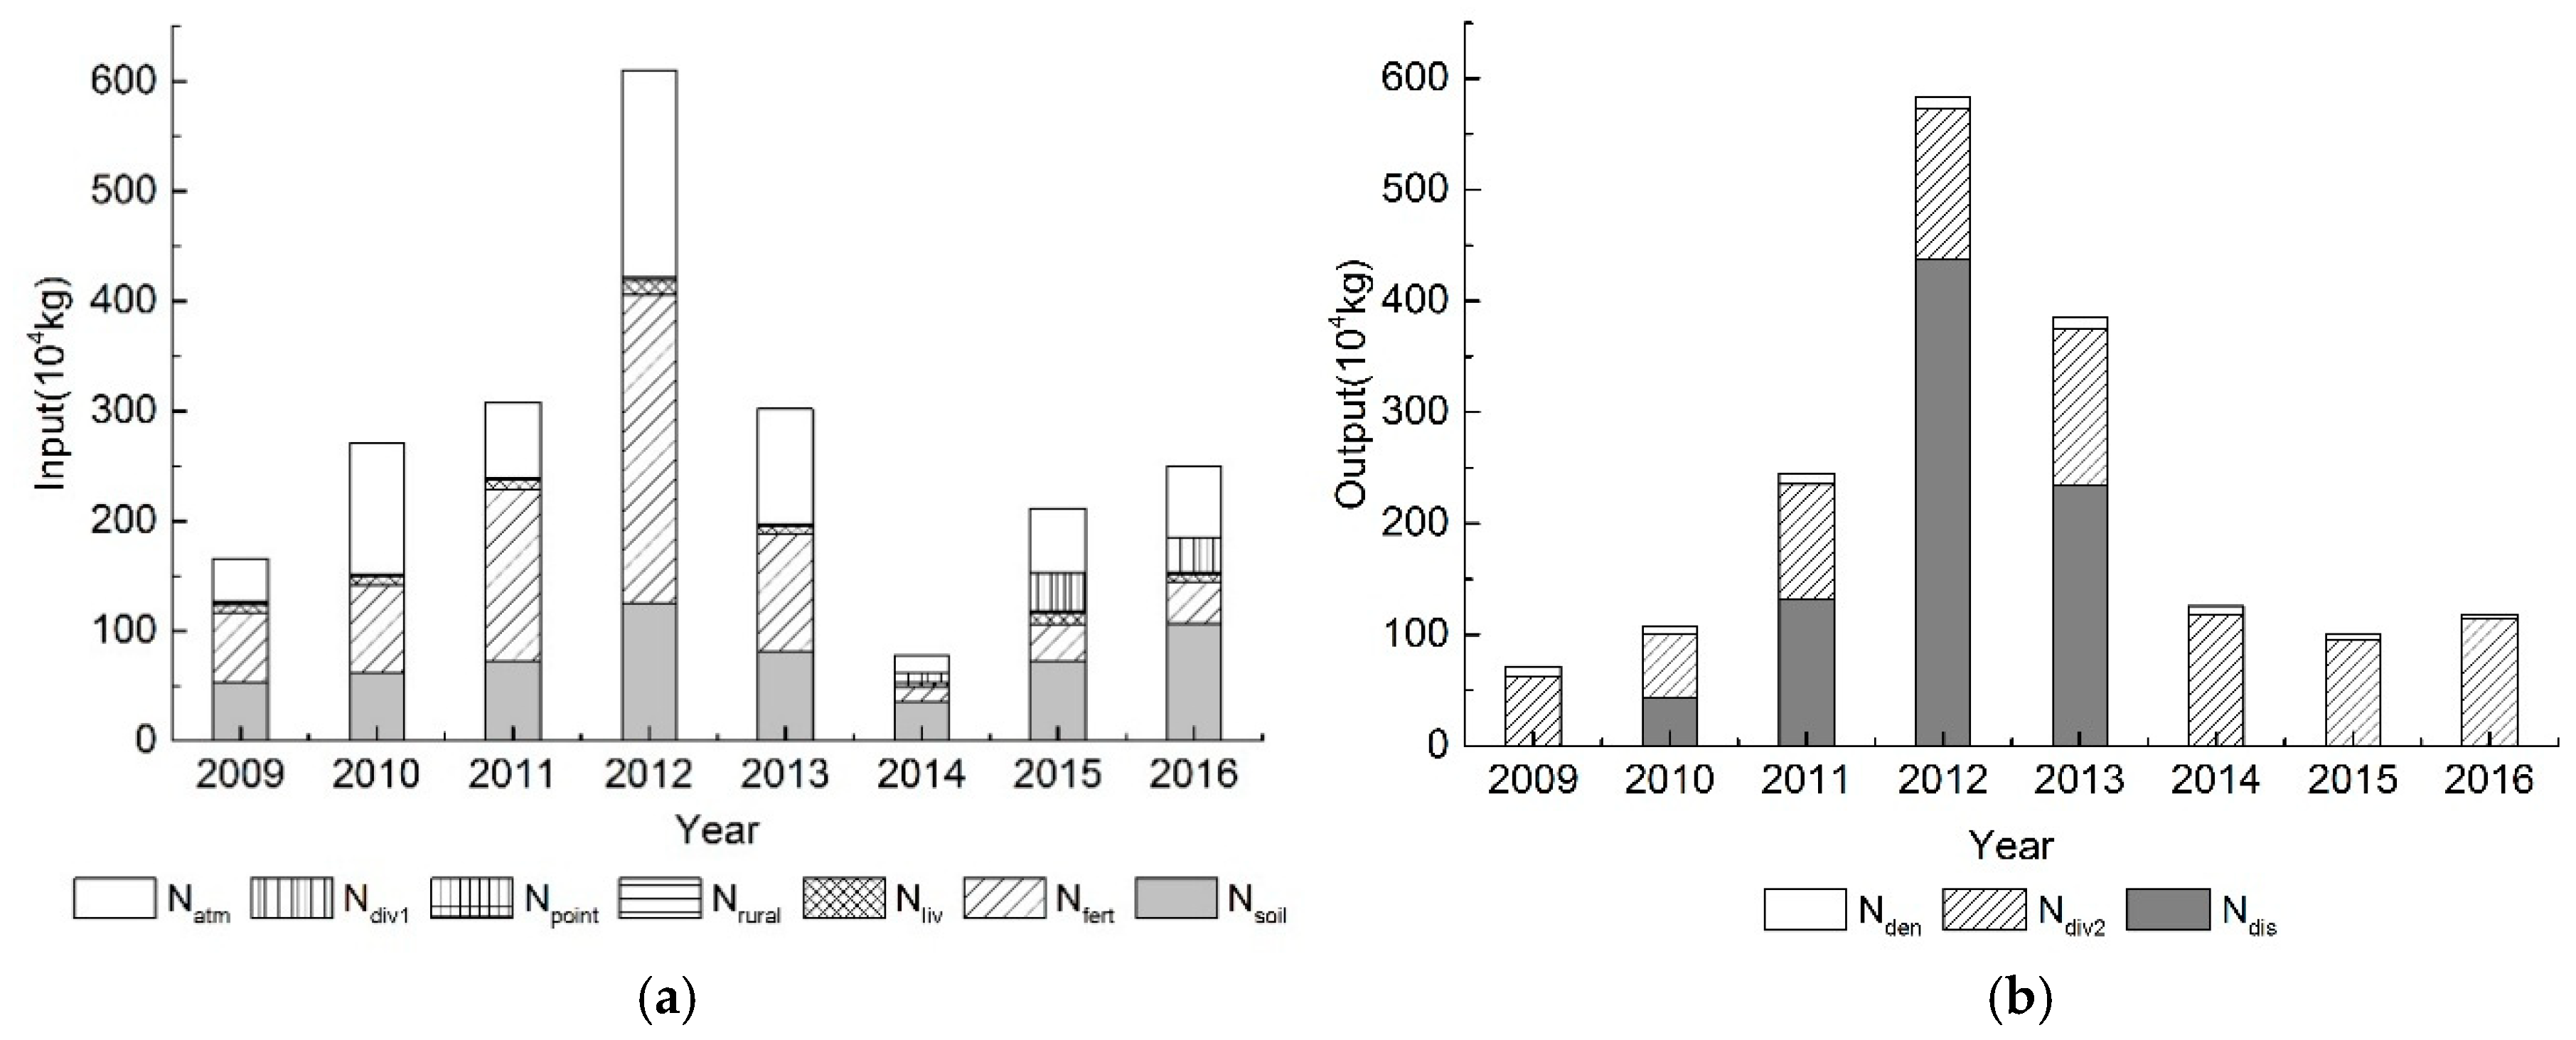
4.2. Composition of TN Input and Output

The composition of TN input during 2009–2016 is shown in Figure 7a and Figure 8a. It can be seen from these figures that the point source input accounted for a small proportion of TN input, which is only 0.16% of the average input. This means that the point-source nitrogen input is not serious and the non-point source input dominates the TN input of the Biliuhe reservoir. This result is consistent with the actual conditions wherein most of the untreated sewage outlets in the basin have been closed in recent years, but non-point sources like agricultural fertilization and livestock and poultry breeding are difficult to treat. The non-point sources from fertilizer and atmospheric deposition and soils constituted the highest proportion of the TN input, accounting for 35.15, 30.15, and 27.72% of the average input. According to the study result, reduction of the non-point source TN input during the flood period should be an effective measure to control the TN pollution of the study reservoir. In addition to the TN load from the reservoir control basin, the TN input of the inter-basin water diversion project was 32.03 × 10⁴ kg year−1 during 2015–2016, accounting for 14.05% of the annual total input. According to the design water diversion capacity of 3.00 × 10⁸ m3 year−1 in the future, 63.90 × 10⁴ kg year−1 TN will input into the reservoir via the DBWD project, which was approximately equal to the TN input in extreme drought years. The impact of the inter-basin water diversion project on TN accumulation should be of great concern in the future.
The composition of the TN output during 2009–2016 is shown in Figure 7b and Figure 8b. It can be seen from these figures that the average discharge output accounted for 48.75% of the average TN output, and mainly occurred in wet years with the flood discharge. The reservoir rarely discharges surplus water in normal or dry years due to the high water demand of Dalian city. The average TN output of the BDWD project was 103.66 × 10⁴ kg year−1, which contributed to 47.74% of the annual TN output. In the dry or normal years like 2014–2016, the TN output by the BDWD project accounted for more than 90% of the total TN output, indicating that a large proportion of the nitrogen was transported to other basins through the inter-basin water diversion project. The inter-basin water diversion project links different basins together and changes the original nutrient transportation within or between river basins, which creates new challenges for comprehensive environmental management across multiple basins [55]. The denitrification output accounted for 3.51% of the total nitrogen output, which was much lower than the inter-basin water diversion project and downstream water discharge output.

4.3. Analysis of the Proposed Methodology

This study explores an integrated methodology that is based on the SWAT model to quantify the nitrogen accumulation in the reservoir. It is convenient for the proposed methodology to analyze the TN accumulation process in the study reservoir. The CMADS has also been proven to be capable of driving the SWAT model in the study area. The methodology combines the mechanism model and the statistical model to obtain more reasonable results, which show that the Biliuhe reservoir serves as a sink of TN most of the time, and the TN accumulation process is significantly influenced by the reservoir operation mode. In this study, the uncertainty of the methodology may come from the meteorological data of CMADS, parameters of SWAT, and sparse distribution of water quality monitoring sites due to the complex mechanism of TN transformation and transportation. More work will be done to reduce the uncertainty and improve methodology accuracy. In this study, the reservoir was taken as a small point and the internal N transportation process of the reservoir was not taken into consideration. In the next step, we will improve the simulation by coupling the SWAT with the 2-D or 3-D hydrological and water quality model for further research.

5. Conclusions

The integrated methodology based on the SWAT model driven by CMADS was established in the Biliuhe river basin to analyze the TN accumulation of the Biliuhe reservoir. The calibrated model generally achieved a satisfactory performance, indicating that the CMADS can be successfully applied to drive the SWAT model in Northeast China. The model performance in the validation periods was worse than in calibration periods, which can be attributed to the drought in 2014–2015. The maximum canopy storage (CANMX) was the most sensitive parameter for runoff, and the nitrogen percolation coefficient (NPERCO) was the most sensitive parameter for TN. The uncertainty analysis results showed that 88% (P-factor) of discharge observations and 75% (P-factor) of TN observations fell within the 95% confidence level uncertainty range (95PPU) in the calibration period, and within 79% of the stream flow and 71% of the TN in the validation period. The uncertainty of the SWAT model in the validation period was higher than that in the calibration period.
The distributions of annual and seasonal TN input were very uneven and consistent with the runoff, indicating that TN input was mainly governed by the runoff. The TN output was greatly influenced by artificial regulation and did not follow the variation of runoff. The TN input was higher than the output during the wet seasons, and was always lower than the output during the dry seasons, meaning that the reservoir acted as a sink of nitrogen most of time in the wet seasons and as a source in the dry seasons. The mean annual TN accumulation of the Biliuhe reservoir was 57.27 × 10⁴ kg during the study period, which meant that 19.76% of the TN input was retained in the Biliuhe reservoir. The TN accumulation varied in different hydrological years and higher TN accumulation in the reservoir did not correspond to a higher TN load due to the influence of artificial regulation. Higher TN accumulation efficiency is often observed in normal hydrological years because the water source reservoir stores most of the water input for future multiple uses, but rarely discharges surplus water. In addition, the non-point sources from fertilizer, atmospheric deposition, and soils constituted the highest proportion of the TN input, accounting for 35.15%, 30.15%, and 27.72% of the average input, respectively. The inter-basin water diversion project of DBWD diverted 32.03 × 10⁴ kg year−1 TN to the Biliuhe reservoir in 2015–2016, accounting for 14.5% of the total annual input. According to the design water diversion capacity of 3.00 × 10⁸ m3 year−1 in the future, 63.90 × 10⁴ kg year−1 TN will input into the reservoir via the DBWD project in the future. The discharge output and the inter-basin water diversion project output of the BDWD accounted for 48.75% and 47.74%, respectively. The inter-basin water diversion projects have noticeably influenced the TN accumulation in drought years, which should be of great concern in drinking water source water system management.
There was a rising trend of TN level in the Biliuhe reservoir, which increased the eutrophication risk of the aquatic ecosystem. However, the TN accumulated in the sediment contributed to a large proportion of the total TN accumulated in the reservoir. Decreasing the non-point source nitrogen input and discharging of anoxic waters and sediment with a high concentration of TN through the bottom of the dam should be effective measures to reduce the TN concentration in the Biliuhe reservoir. The integrated methodology proposed in this work provided a convenient way to quantify the TN accumulation in reservoirs, and the results could contribute to reservoir water quality improvement under the influence of inter-basin water diversion projects.

Supplementary Materials

The following are available online at https://www.mdpi.com/2073-4441/10/11/1535/s1, Figure S1: SWAT parameters calibrated for the monthly streamflow and the TN load in the Biliuhe reservoir basin.

Author Contributions

Conceptualization, G.Q. and T.W.; Data curation, T.W.; Formal analysis, G.Q.; Funding acquisition, J.L., S.X. and T.W.; Investigation, S.X. and G.S.; Methodology, G.Q. and T.W.; Project administration, T.W.; Resources, S.X.; Software, G.Q.; Supervision, J.L. and T.W.; Validation, J.L. and T.W.; Visualization, G.Q.; Writing—original draft, G.Q.; Writing—review & editing, G.S.

Funding

This research was supported by the National Key Research and Development Program of China (2016YFC0400903), the Natural Sciences Foundation of China (51679026;51809032;51879031), and the Fundamental Research Funds for the Central Universities (DUT17JC17).

Acknowledgments

The authors would like to thank the anonymous reviewers for their review and constructive comments related to this manuscript.

Conflicts of Interest

The authors declare no conflict of interest.

References

  1. Saunders, D.L.; Kalff, J. Nitrogen retention in wetlands, lakes and rivers. Hydrobiologia 2001, 443, 205–212. [Google Scholar] [CrossRef]
  2. Thieu, V.; Billen, G.; Garnier, J. Nutrient transfer in three contrasting NW European watersheds: The Seine, Somme, and Scheldt Rivers. A comparative application of the Seneque/River strahler model. Water Res. 2009, 43, 1740–1754. [Google Scholar] [CrossRef] [PubMed]
  3. Zhang, Q.; Hirsch, R.M.; Ball, P.W. Long-term changes in sediment and nutrient delivery from Conowingo Dam to Chesapeake Bay: Effects of reservoir sedimentation. Environ. Sci. Technol. 2016, 50, 1877–1886. [Google Scholar] [CrossRef] [PubMed]
  4. Chen, D.; Hu, M.; Dahlgren, R.A. A dynamic watershed model for determining the effects of transient storage on nitrogen export to rivers. Water Resour. Res. 2014, 50, 7714–7730. [Google Scholar] [CrossRef] [Green Version]
  5. Ma, W.; Huang, T.; Li, X.; Zhou, Z.; Li, Y.; Zeng, K. The Effects of storm runoff on water quality and the coping strategy of a deep canyon-shaped source water reservoir in China. Int. J. Environ. Res. Public Health 2015, 12, 7839–7855. [Google Scholar] [CrossRef] [PubMed]
  6. Ministry of Water Resources, China; National Bureau of Statistics, China. Bulletin of First National Census for Water, 2013. Available online: http://www.mwr.gov.cn/sj/tjgb/dycqgslpcgb/201701/t20170122_790650.html (accessed on 21 March 2013).
  7. Ministry of Water Resources, China. Bulletin of National Water Resources, 2016. Available online: http://www.mwr.gov.cn/sj/tjgb/szygb/201707/t20170711_955305.html (accessed on 31 December 2016).
  8. Zaragüeta, M.; Acebes, P. Controlling eutrophication in a Mediterranean Shallow Reservoir by phosphorus loading reduction: The need for an integrated management approach. Environ. Manag. 2017, 59, 635–651. [Google Scholar] [CrossRef] [PubMed]
  9. Clark, V.E.; Odhiambo, K.B.; Ricker, C.M. Comparative analysis of metal concentrations and sediment accumulation rates in two Virginian reservoirs, USA: Lakes Moomaw and Pelham. Water Air Soil Pollut. 2014, 225, 1860. [Google Scholar] [CrossRef]
  10. Lopez-Doval, J.C.; Montagner, C.C.; de Alburquerque, A.F.; Moschini-Carlos, V.; Umbuzeiro, G.; Pompeo, M. Nutrients, emerging pollutants and pesticides in a tropical urban reservoir: Spatial distributions and risk assessment. Sci. Total Environ. 2017, 575, 1307–1324. [Google Scholar] [CrossRef] [PubMed]
  11. Zhang, E.R.; Zhang, J. Analysis of the Three-Gorge Reservoir impacts on the retention of N and P in the Yangtze River. J. Lake Sci. 2003, 15, 41–48. (In Chinese) [Google Scholar]
  12. Cunha, D.F.; Calijuri, M.D.; Dodds, W.K. Trends in nutrient and sediment retention in Great Plains reservoirs (USA). Environ. Monit. Assess. 2014, 186, 1143–1155. [Google Scholar] [CrossRef] [PubMed]
  13. Ullrich, A.; Volk, M. Application of the Soil and Water Assessment Tool (SWAT) to predict the impact of alternative management practices on water quality and quantity. Agric. Water Manag. 2009, 96, 1207–1217. [Google Scholar] [CrossRef]
  14. Cho, J.; Park, S.; Im, S. Evaluation of Agricultural Nonpoint Source (AGNPS) model for small watersheds in Korea applying irregular cell delineation. Agric. Water Manag. 2008, 95, 400–408. [Google Scholar] [CrossRef]
  15. Kourgialas, N.N.; Karatzas, G.P.; Nikolaidis, N.P. An integrated framework for the hydrologic simulation of a complex geomorphological river basin. J. Hydrol. 2010, 381, 308–321. [Google Scholar] [CrossRef]
  16. Bosch, N.S. The influence of impoundments on riverine nutrient transport: An evaluation using the Soil and Water Assessment Tool. J. Hydrol. 2008, 355, 131–147. [Google Scholar] [CrossRef]
  17. Xu, F.; Dong, G.; Wang, Q.; Liu, L.; Yu, W.; Men, C.; Liu, R. Impacts of DEM uncertainties on critical source areas identification for non-point source pollution control based on SWAT model. J. Hydrol. 2016, 540, 355–367. [Google Scholar] [CrossRef]
  18. Abbaspour, K.C.; Rouholahnejad, E.; Vaghefi, S.; Srinivasan, R.; Yang, H.; Klove, B. A continental-scale hydrology and water quality model for Europe: Calibration and uncertainty of a high-resolution large-scale SWAT model. J. Hydrol. 2015, 524, 733–752. [Google Scholar] [CrossRef]
  19. Ebita, A.; Kobayashi, S.; Ota, Y.; Moriya, M.; Kumabe, R.; Onogi, K.; Harada, Y.; Yasui, S.; Miyaoka, K.; Takahashi, K.; et al. The Japanese 55-Year Reanalysis ‘‘JRA-55’’: An interim report. SOLA 2011, 7, 149–152. [Google Scholar] [CrossRef]
  20. Dee, D.P.; Uppala, S.M.; Simmons, A.J.; Berrisford, P.; Poli, P.; Kobayashi, S.; Andrae, U.; Balmaseda, M.A.; Balsamo, G.; Bauer, P.; et al. The ERA—Interim reanalysis: Configuration and performance of the data assimilation system. Q. J. R. Meteor. Soc. 2011, 137, 553–597. [Google Scholar] [CrossRef]
  21. Saha, S.; Moorthi, S.; Pan, H.L.; Wu, X.; Wang, J.; Nadiga, S.; Tripp, P.; Kistler, R.; Woollen, J.; Behringer, D.; et al. The NCEP climate forecast system reanalysis. Bull. Am. Meteorol. Soc. 2010, 91, 1015–1057. [Google Scholar] [CrossRef]
  22. Rienecker, M.M.; Suarez, M.J.; Gelaro, R.; Todling, R.; Bacmeister, J.; Liu, E.; Bosilovich, M.G.; Schubert, S.D.; Takacs, L.; Kim, G.; et al. MERRA: NASA’s Modern-Era retrospective analysis for research and applications. J. Clim. 2011, 24, 3624–3648. [Google Scholar] [CrossRef]
  23. Meng, X.; Wang, H. Significance of the China meteorological assimilation driving datasets for the SWAT Model (CMADS) of East Asia. Water 2017, 9, 765. [Google Scholar] [CrossRef]
  24. Zhou, S.; Wang, Y.; Chang, J.; Guo, A.; Li, Z. Investigating the dynamic influence of hydrological model parameters on runoff simulation using Sequential Uncertainty Fitting 2-Based Multilevel-Factorial-Analysis Method. Water 2018, 10, 1177. [Google Scholar] [CrossRef]
  25. Tian, Y.; Zhang, K.; Xu, Y.-P.; Gao, X.; Wang, J. Evaluation of Potential Evapo-transpiration Based on CMADS Reanalysis Dataset over China. Water 2018, 10, 1126. [Google Scholar] [CrossRef]
  26. Meng, X.; Wang, H.; Cai, S.; Zhang, X.; Leng, G.; Lei, X.; Shi, C.; Liu, S.; Shang, Y. The China meteorological assimilation driving datasets for the SWAT Model (CMADS) application in China: A case study in Heihe River Basin. Preprints 2016. [Google Scholar] [CrossRef]
  27. Meng, X.; Wang, H.; Lei, X.; Cai, S.; Wu, H. Hydrological modeling in the Manas River Basin using soil and water assessment tool driven by CMADS. Teh. Vjesn. 2017, 24, 525–534. [Google Scholar] [CrossRef]
  28. Liu, J.; Shanguan, D.; Liu, S.; Ding, Y. Evaluation and hydrological simulation of CMADS and CFSR reanalysis datasets in the Qinghai-Tibet Plateau. Water 2018, 10, 513. [Google Scholar] [CrossRef]
  29. Zhao, F.; Wu, Y.; Qiu, L.; Sun, Y.; Sun, L.; Li, Q.; Niu, J.; Wang, G. Parameter uncertainty analysis of the SWAT model in a mountain-loess transitional watershed on the Chinese Loess Plateau. Water 2018, 10, 690. [Google Scholar] [CrossRef]
  30. Vu, T.T.; Li, L.; Jun, K.S. Evaluation of multi-satellite precipitation products for streamflow simulations: A case study for the Han River Basin in the Korean Peninsula, East Asia. Water 2018, 10, 642. [Google Scholar] [CrossRef]
  31. Cao, Y.; Zhang, J.; Yang, M.; Lei, X.; Guo, B.; Yang, L.; Zeng, Z.; Qu, J. Application of SWAT model with CMADS data to estimate hydrological elements and parameter uncertainty based on SUFI-2 algorithm in the Lijiang River Basin, China. Water 2018, 10, 742. [Google Scholar] [CrossRef]
  32. Shao, G.; Guan, Y.; Zhang, D.; Yu, B.; Zhu, J. The impacts of climate variability and land use change on streamflow in the Hailiutu River Basin. Water 2018, 10, 814. [Google Scholar] [CrossRef]
  33. Gao, X.; Zhu, Q.; Yang, Z.; Wang, H. Evaluation and hydrological application of CMADS against TRMM 3B42V7, PERSIANN-CDR, NCEP-CFSR, and Gauge-Based Datasets in Xiang River Basin of China. Water 2018, 10, 1225. [Google Scholar] [CrossRef]
  34. Harrison, J.A.; Maranger, R.J.; Alexander, R.B.; Giblin, A.E.; Jacinthe, P.A.; Mayorga, E.; Seitzinger, S.P.; Sobota, D.J.; Wollheim, W.M. The regional and global significance of nitrogen removal in lakes and reservoirs. Biogeochemistry 2009, 93, 143–157. [Google Scholar] [CrossRef]
  35. Komai, Y.; Umemoto, S.; Takeda, Y.; Inoue, T.; Imai, A. Budgets of major ionic species and nutrients on a dam reservoir in forested watershed. Water Sci. Technol. 2007, 56, 287–293. [Google Scholar] [CrossRef] [PubMed]
  36. Han, H.; Lu, X.; Burger, D.F.; Joshi, U.M.; Zhang, L. Nitrogen dynamics at the sediment-water interface in a tropical reservoir. Ecol. Eng. 2014, 73, 146–153. [Google Scholar] [CrossRef]
  37. Xu, S.; Wang, T.; Hu, S. Dynamic assessment of water quality based on a variable fuzzy pattern recognition model. Int. J. Environ. Res. Public Health 2015, 12, 2230–2248. [Google Scholar] [CrossRef] [PubMed]
  38. Zhang, C.; Shoemaker, C.A.; Woodbury, J.D.; Cao, M.; Zhu, X. Impact of human activities on stream flow in the Biliu River Basin, China. Hydrol. Process. 2013, 27, 2509–2523. [Google Scholar] [CrossRef]
  39. Zhu, X.; Zhang, C.; Qi, W.; Cai, W.; Zhao, X.; Wang, X. Multiple climate change scenarios and runoff response in Biliu River. Water 2018, 10, 126. [Google Scholar] [CrossRef]
  40. Wang, T.; Xu, S.; Liu, J. Analysis of accumulation formation of sediment contamination in reservoirs after decades of running: A case study of nitrogen accumulation in Biliuhe Reservoir. Environ. Sci. Pollut. R. 2018, 25, 9165–9175. [Google Scholar] [CrossRef] [PubMed]
  41. Arnold, J.G.; Fohrer, N. SWAT2000: Current capabilities and research opportunities in applied basin modelling. Hydrol. Process. 2005, 19, 563–572. [Google Scholar] [CrossRef]
  42. Fan, M.; Shibata, H. Spatial and temporal analysis of hydrological provision ecosystem services for watershed conservation planning of water resources. Water Resour. Manag. 2014, 28, 3619–3636. [Google Scholar] [CrossRef]
  43. Moriasi, D.N.; Gitau, M.W.; Pai, N.; Daggupati, P. Hydrologic and water quality models: Performance measures and evaluation criteria. Trans. ASABE 2015, 58, 1763–1785. [Google Scholar] [CrossRef]
  44. Seitzinger, S.; Harrison, J.A.; Böhlke, J.K.; Bouwman, A.F.; Lowrance, R.; Peterson, B.; Tobias, C.; Van Drecht, G. Denitrification across landscapes and waterscapes: A synthesis. Ecol. Appl. 2006, 16, 2064–2090. [Google Scholar] [CrossRef]
  45. Yan, W.J.; Shi, K. Program on the nitrogen concentrations in rain water in Dalian city. Ecol. Environ. 2013, 22, 517–522. (In Chinese) [Google Scholar]
  46. Saunders, D.L.; Kalff, J. Denitrification rates in the sediments of Lake Memphremagog, Canada-USA. Water Res. 2001, 35, 1897–1904. [Google Scholar] [CrossRef]
  47. Wang, X.; Melesse, A.M. Effects of STATSGO and SSURGO as inputs on SWAT model’s snowmelt simulation. J. Am. Water Resour. Assoc. 2006, 42, 1217–1236. [Google Scholar] [CrossRef]
  48. Helmreich, B.; Hilliges, R.; Schriewer, A.; Horn, H. Runoff pollutants of a highly trafficked urban road—Correlation analysis and seasonal influences. Chemosphere 2010, 80, 991–997. [Google Scholar] [CrossRef] [PubMed]
  49. Liu, M.; Chen, X.; Yao, H.; Chen, Y. A coupled modeling approach to evaluate nitrogen retention within the Shanmei Reservoir basin, China. Estuar. Coast. Shelf Sci. 2015, 166, 189–198. [Google Scholar] [CrossRef]
  50. Molina-Navarro, E.; Trolle, D.; Martinez-Perez, S.; Sastre-Merlin, A.; Jeppesen, E. Hydrological and water quality impact assessment of a Mediterranean limno-reservoir under climate change and land use management scenarios. J. Hydrol. 2014, 509, 354–366. [Google Scholar] [CrossRef]
  51. Ran, X.; Bouwman, L.; Yu, Z.; Beusen, A.; Chen, H.; Yao, Q. Nitrogen transport, transformation, and retention in the Three Gorges Reservoir: A mass balance approach. Limnol. Oceanogr. 2017, 62, 2323–2337. [Google Scholar] [CrossRef]
  52. Burford, M.A.; Green, S.A.; Cook, A.J.; Johnson, S.A.; Kerr, J.G.; O’Brien, K.R. Sources and fate of nutrients in a subtropical reservoir. Aquat. Sci. 2012, 74, 179–190. [Google Scholar] [CrossRef]
  53. David, M.B.; Wall, L.G.; Royer, T.V.; Tank, J.L. Denitrification and the nitrogen budget of a reservoir in an agricultural landscape. Ecol. Appl. 2006, 16, 2177–2190. [Google Scholar] [CrossRef]
  54. Wang, T.; Xu, S.; Liu, J. Dynamic assessment of comprehensive water quality considering the sediment release. Water 2017, 9, 275. [Google Scholar] [CrossRef]
  55. Wang, Y.; Zhang, W.; Zhao, Y.; Peng, H.; Shi, Y. Modelling water quality and quantity with the influence of inter-basin water diversion projects and cascade reservoirs in the Middle-lower Hanjiang River. J. Hydrol. 2016, 541, 1348–1362. [Google Scholar] [CrossRef]
Figure 1. Geography of the Biliuhe reservoir basin.
Water 10 01535 g001
Figure 2. Land use types (a) and soil types (b) of the Biliuhe reservoir basin. Land use classes correspond to FRST (frost), PAST (pasture), WATR (water), URLD (low-density residential), and AGRL (agricultural land). Soil classes correspond to ZR (brown earth), CZR (young brown earth), ZRXT (meadow brown earth), and CDT (meadow soil).
Water 10 01535 g002
Figure 3. Observed and simulated (a) flow and (b) TN loads.
Water 10 01535 g003
Figure 4. The runoff and TN fluxes of the Biliuhe reservoir.
Water 10 01535 g004
Figure 5. Relationships between runoff and TN input (a) and precipitation and runoff (b) from 2009–2016.
Water 10 01535 g005
Figure 6. Seasonal variations of precipitation, runoff, and TN fluxes.
Water 10 01535 g006
Figure 7. The composition of annual TN input (a) and output (b) fluxes of the Biliuhe reservoir from 2009–2016.
Water 10 01535 g007
Figure 8. The average composition ratio of the TN input (a) and output (b) fluxes of the Biliuhe reservoir from 2009–2016.
Water 10 01535 g008
Table 1. Evaluation results of the discharge and TN simulation.
Parameter IndexCalibrationValidation
DischargeR20.960.90
NSE0.960.89
PBIAS8.68%–11.53%
TNR20.870.71
NSE0.850.53
PBIAS–13.49%–21.71%
Table 2. Annual TN accumulation of the Biliuhe reservoir (2009–2016).
YearNi/(104 kg)No/(104 kg)ΔN/(104 kg)RN/(%)
2009165.5971.7593.8456.67
2010270.25108.16162.0959.98
2011308.44245.1263.3220.53
2012609.98582.8827.104.44
2013301.95384.96–83.01–27.49
201478.02125.84–47.82–61.29
2015211.07100.20110.8752.53
2016249.99118.19131.8052.72
Mean value 274.41217.1457.2719.76

