Article

Microbial Community Composition and Antibiotic Resistance Genes within a North Carolina Urban Water System

1
Department of Bioinformatics and Genomics, The University of North Carolina at Charlotte, 9201 University City Blvd, Charlotte, NC 28223, USA
2
Bioinformatics Services Division, The University of North Carolina at Charlotte, 150 N Research Campus Dr, Kannapolis, NC 28081, USA
3
Department of Nutrition, The University of North Carolina at Chapel Hill, 135 Dauer Drive, Chapel Hill, NC 27599, USA
4
Charlotte Water, Charlotte-Mecklenburg Utility Department, 5100 Brookshire Blvd, Charlotte, NC 28216, USA
5
Department of Geography and Earth Sciences, The University of North Carolina at Charlotte, 9201 University City Blvd, Charlotte, NC 28223, USA
6
Department of Civil and Environmental Engineering, The University of North Carolina at Charlotte, 9201 University City Blvd, Charlotte, NC 28223, USA
7
Department of Biological Sciences, The University of North Carolina at Charlotte, 9201 University City Blvd, Charlotte, NC 28223, USA
*
Author to whom correspondence should be addressed.
Water 2018, 10(11), 1539; https://doi.org/10.3390/w10111539
Submission received: 13 September 2018 / Revised: 7 October 2018 / Accepted: 24 October 2018 / Published: 29 October 2018
(This article belongs to the Special Issue Antimicrobial Resistance in Environmental Waters)

Abstract

:
Wastewater treatment plants (WWTPs) are thought to be potential incubators of antibiotic resistance. Persistence of commonly used antibiotics in wastewater may increase the potential for selection of resistance genes transferred between bacterial populations, some of which might pose a threat to human health. In this study, we measured the concentrations of ten antibiotics in wastewater plant influents and effluents, and in surface waters up- and downstream from two Charlotte area treatment facilities. We performed Illumina shotgun sequencing to assay the microbial community and resistome compositions at each site across four time points from late winter to mid-summer of 2016. Antibiotics are present throughout wastewater treatment, and elevated concentrations of multiple antibiotics are maintained in moving stream water downstream of effluent release. While some human gut and activated sludge associated taxa are detectable downstream, these seem to attenuate with distance while the core microbial community of the stream remains fairly consistent. We observe the slight suppression of functional pathways in the downstream microbial communities, including amino acid, carbohydrate, and nucleic acid metabolism, as well as nucleotide and amino acid scavenging. Nearly all antibiotic resistance genes (ARGs) and potentially pathogenic taxa are removed in the treatment process, though a few ARG markers are elevated downstream of effluent release. Taken together, these results represent baseline measurements that future studies can utilize to help to determine which factors control the movement of antibiotics and resistance genes through aquatic urban ecosystems before, during, and after wastewater treatment.

1. Introduction

Urbanization has the potential to affect surface water quality and alter microbial community composition [1,2,3,4]. One mechanism by which human activity directly affects surface waters is through the wastewater treatment process, in which human waste is collected, treated, and the residual water eventually released back into surface waterways [3,5,6]. Pharmaceuticals and antimicrobial compounds that are not fully metabolized or that are disposed of improperly make treated wastewater a significant source of pharmaceuticals in surface waters [7]. Significant effects of pharmaceuticals, including metformin, estrogens, and illegal drugs on native flora and fauna have recently been reported as well [8,9,10,11].
With the growth of antibiotic resistance as a public health threat, there has been increased interest in the prevalence of antibiotics and associated resistance elements released to the environment, as well as their removal from wastewater systems [12]. Both antivirals [13] and antibiotics [14] have been found in treated effluent waters in recent studies, exposing the native microbial flora to sub-lethal levels of antibiotics, and contributing to selective pressures potentially resulting in the emergence of resistant strains [15,16]. Agricultural runoff from antibiotic-administered livestock is also of concern [17,18], as is the use of reclaimed water in public locations, such as water, amusement, and grassy parks [19]. It is hypothesized that any antibiotic resistance genes (ARGs) persisting in reclaimed water may become long-term environmental contaminants, potentially creating hot spots for breeding resistant microbe populations [20]. Further exploration of reclaimed water systems and efforts to reduce the presence of antibiotics and the associated resistance factors are described in a recent review [21].
Results from prior studies of treated effluent impacts on surface waters are highly varied. In areas where water treatment infrastructure is sparse, human microbial resistomes have been shown to pass into the environment through mobile genetic elements [22]. Even in nations with state-of-the-art water treatment systems, the outcome of water treatment is highly dependent on the specific technology used and on operating parameters. For example, a 2011 study showed that treated wastewater was a significant source of antibiotic resistance markers in Minnesota’s Duluth Harbor [23]. In contrast, a recent study from Denmark suggests that the dissemination of the resistome is fairly limited [24]. A concurrent study demonstrated that aerobic treatment procedures may significantly reduce antibiotic resistance elements that are present in wastewater processing locations [25].
The potential for human impact on surface water composition and microbiomes in Charlotte, NC is significant as a city of approximately 800,000 people within a larger metropolitan area of 2.3 million. Charlotte has no large body of water within the city itself, but the surrounding Mecklenburg County does have a network of over 3000 miles of small creeks and streams, many of which are integral features of popular public greenway and park facilities. The regional water utility, Charlotte Water, operates five major wastewater treatment and two minor package plant facilities that release treated wastewater into local creeks. The purpose of this study is to establish a baseline understanding of the impact of treated wastewater release on the urban stream microbiome, and to quantify the impact of released effluent on antibiotic concentrations and resistance elements that were observed in the streams.

2. Materials and Methods

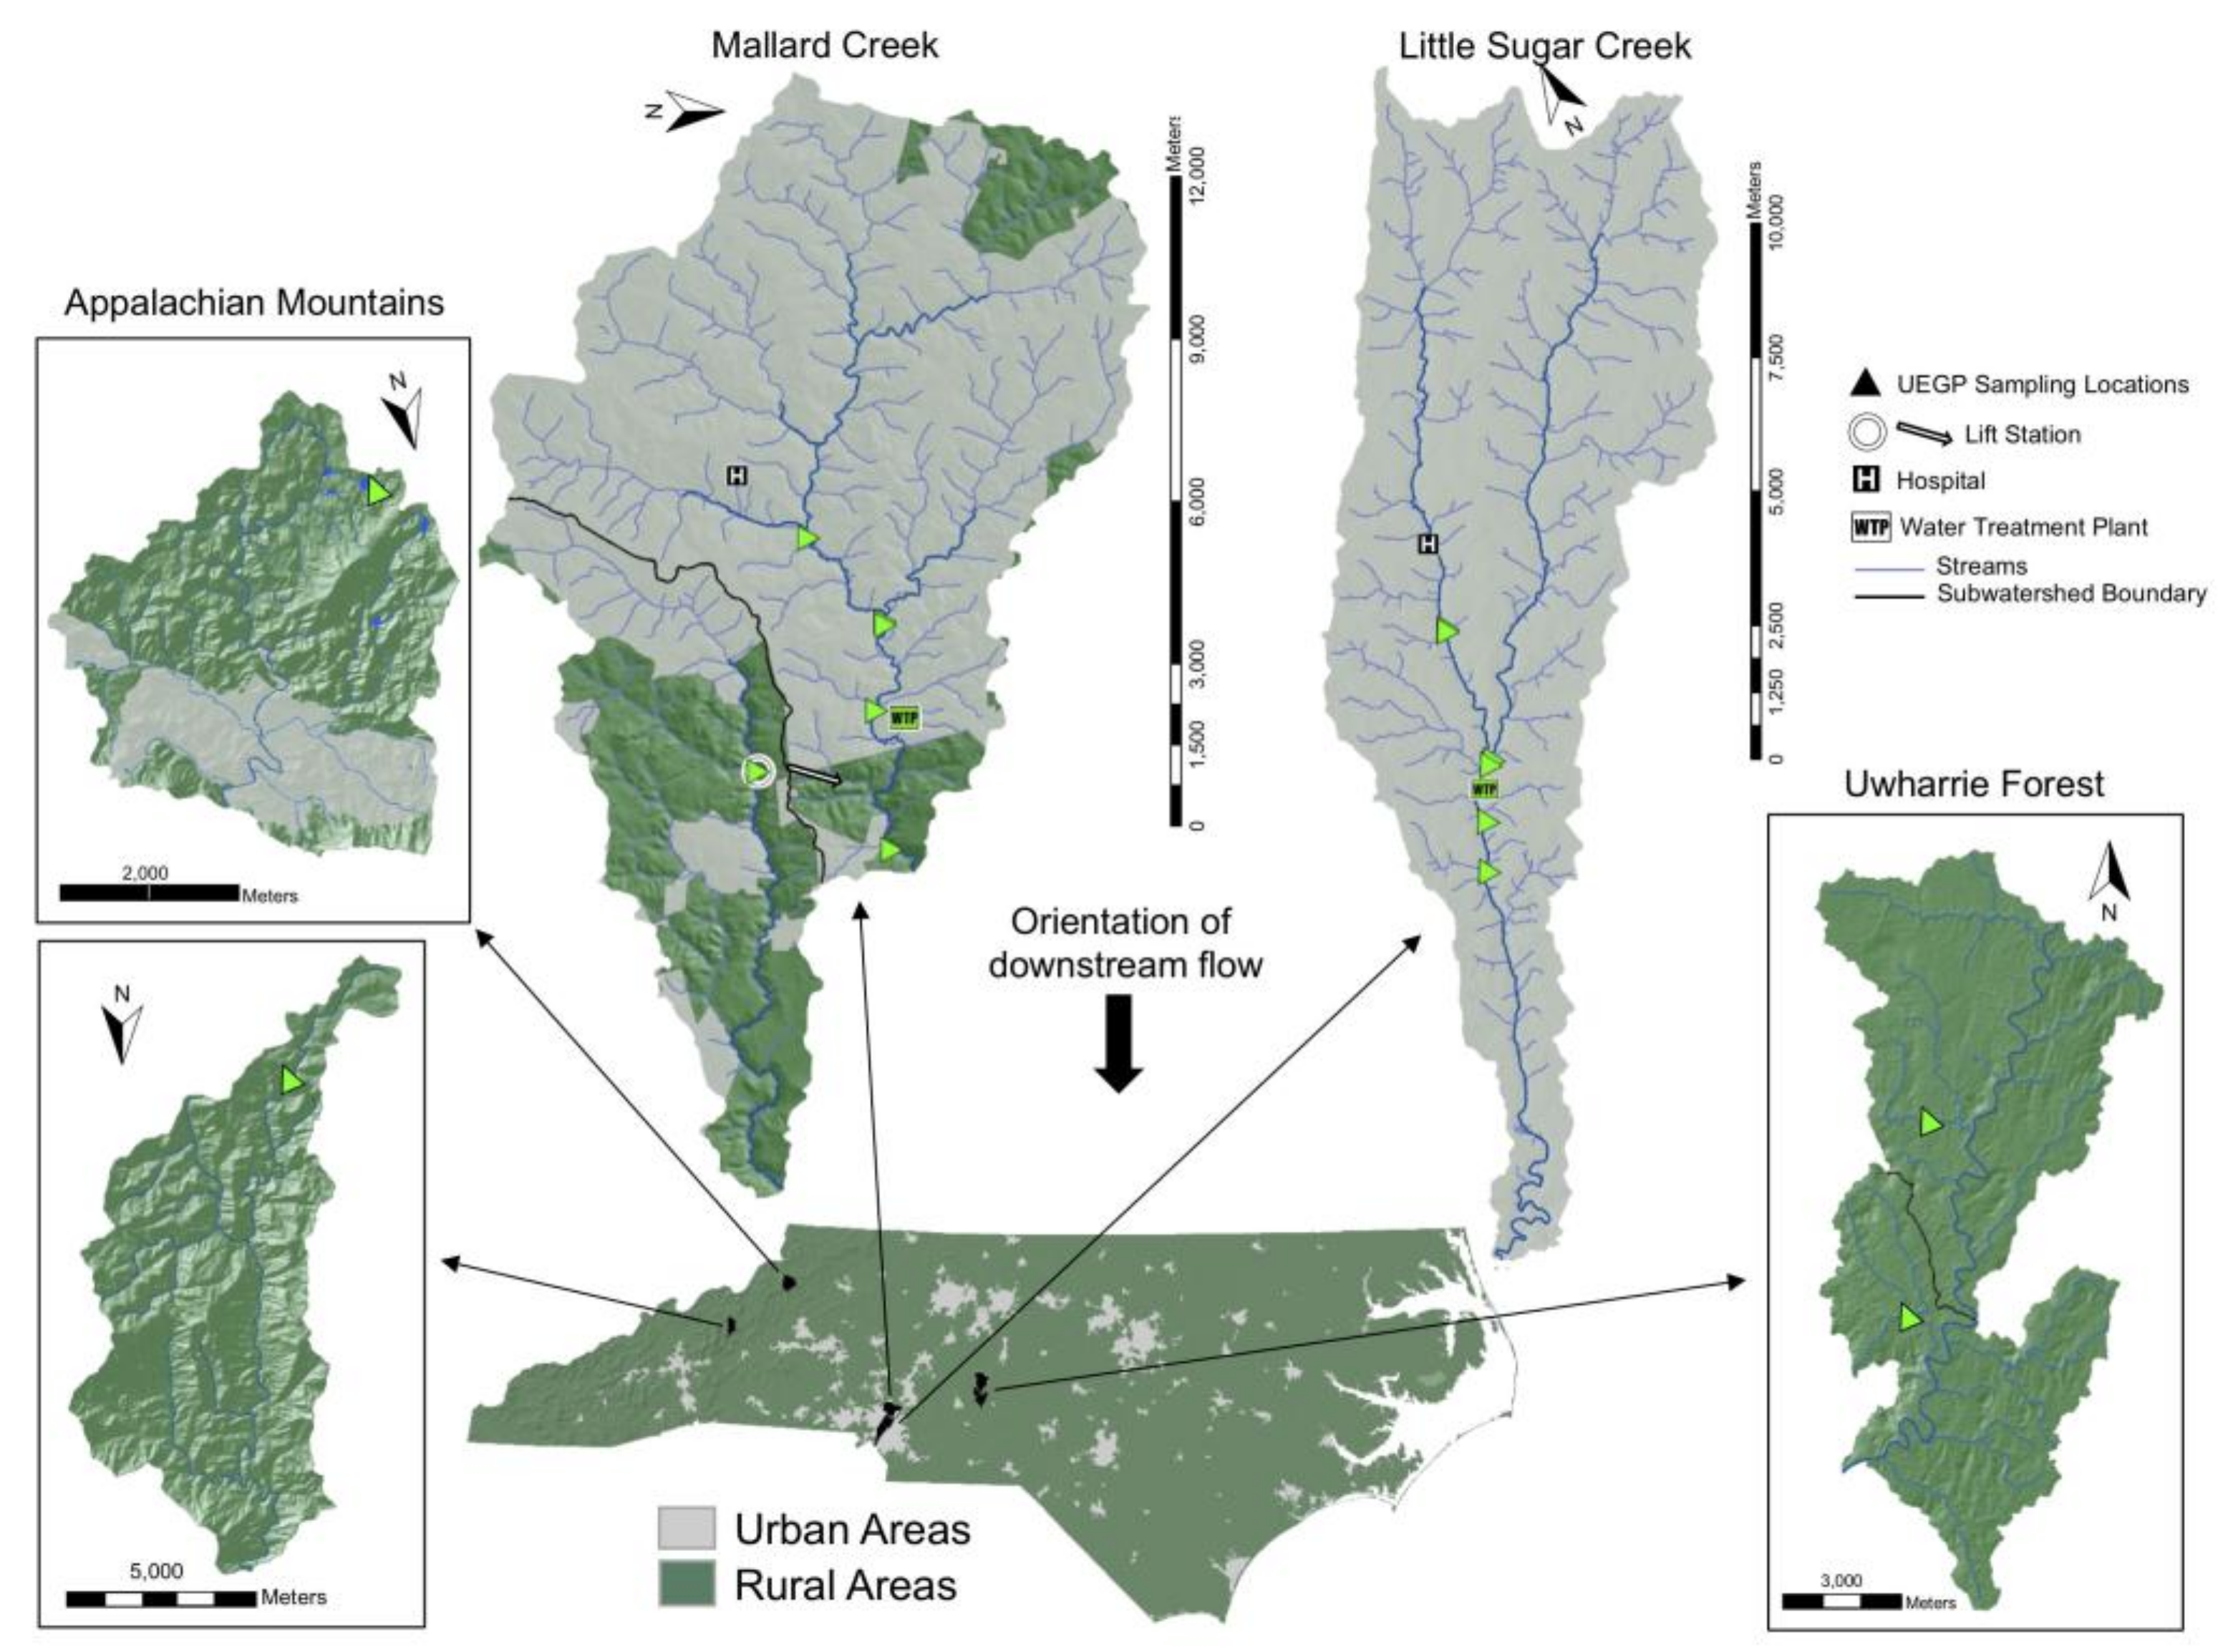
2.1. Selection of Sampling Sites

The design of this study encompasses two systems: the urban stream upstream and downstream of treated wastewater release points, and the wastewater treatment plant and its various processing stages. Our primary interest was in the impact of treated wastewater release on the stream environment, which has the most obvious consequences for the population of Charlotte that interacts with these streams in public areas, but we also sought insight into the impact of sewage input sources and various stages in the water treatment process on the final released product.
The sites selected for this study, Mallard Creek (MC) and Sugar Creek (SC) reclamation facilities, are activated sludge plants that release treated wastewater into Mallard Creek and Little Sugar Creek. These streams are in two different watersheds; Mallard Creek feeds into the Yadkin Pee-Dee watershed, while Little Sugar Creek feeds into Sugar Creek, and ultimately into the Catawba River basin. Sampling sites chosen in the urban streams include two points upstream of treated wastewater release and two points downstream, at distances of approximately 3300 and 2700 m from effluent release for Little Sugar and Mallard Creek, respectively. Two remote locations were also selected in the Appalachian Mountains (MNTA/MNTB) and Uwharrie forest preserve (UWHA/UWHB) to give insight into the microbial community and antibiotic load at sites more removed from urban activities. While these sites differ in their elevation and therefore in their underlying geology, they were the best option for a remote background due to the lack of Piedmont stream sites that are relatively untouched by human activity.
Several sites were sampled inside each WWTP, representing processing stages. Five sites were selected inside the Mallard Creek plant, including the raw influent (INF), the primary clarifier influent (PCI), the primary clarifier effluent (PCE), the aeration tank effluent (ATE), and the final clarifier effluent (FCE). Samples from both hospital-adjacent (HOSP) and residential (RES) sewage trunklines “upstream” of the plant were collected in each case, to allow the investigation of potential microbial community differences between residential and hospital waste. Corresponding locations were used at the Sugar Creek plant, with sites, including INF, PCE, ATE, and FCE. Location of sampling points at the Sugar Creek plant did not allow for collection of a PCI sample, but it was possible to directly sample ultraviolet disinfected effluent (UV), which had not been accessible at the Mallard Creek plant.
The locations of the plants and sampling sites are illustrated in Figure 1 with full details of sample collection and handling provided in Supplementary Materials.

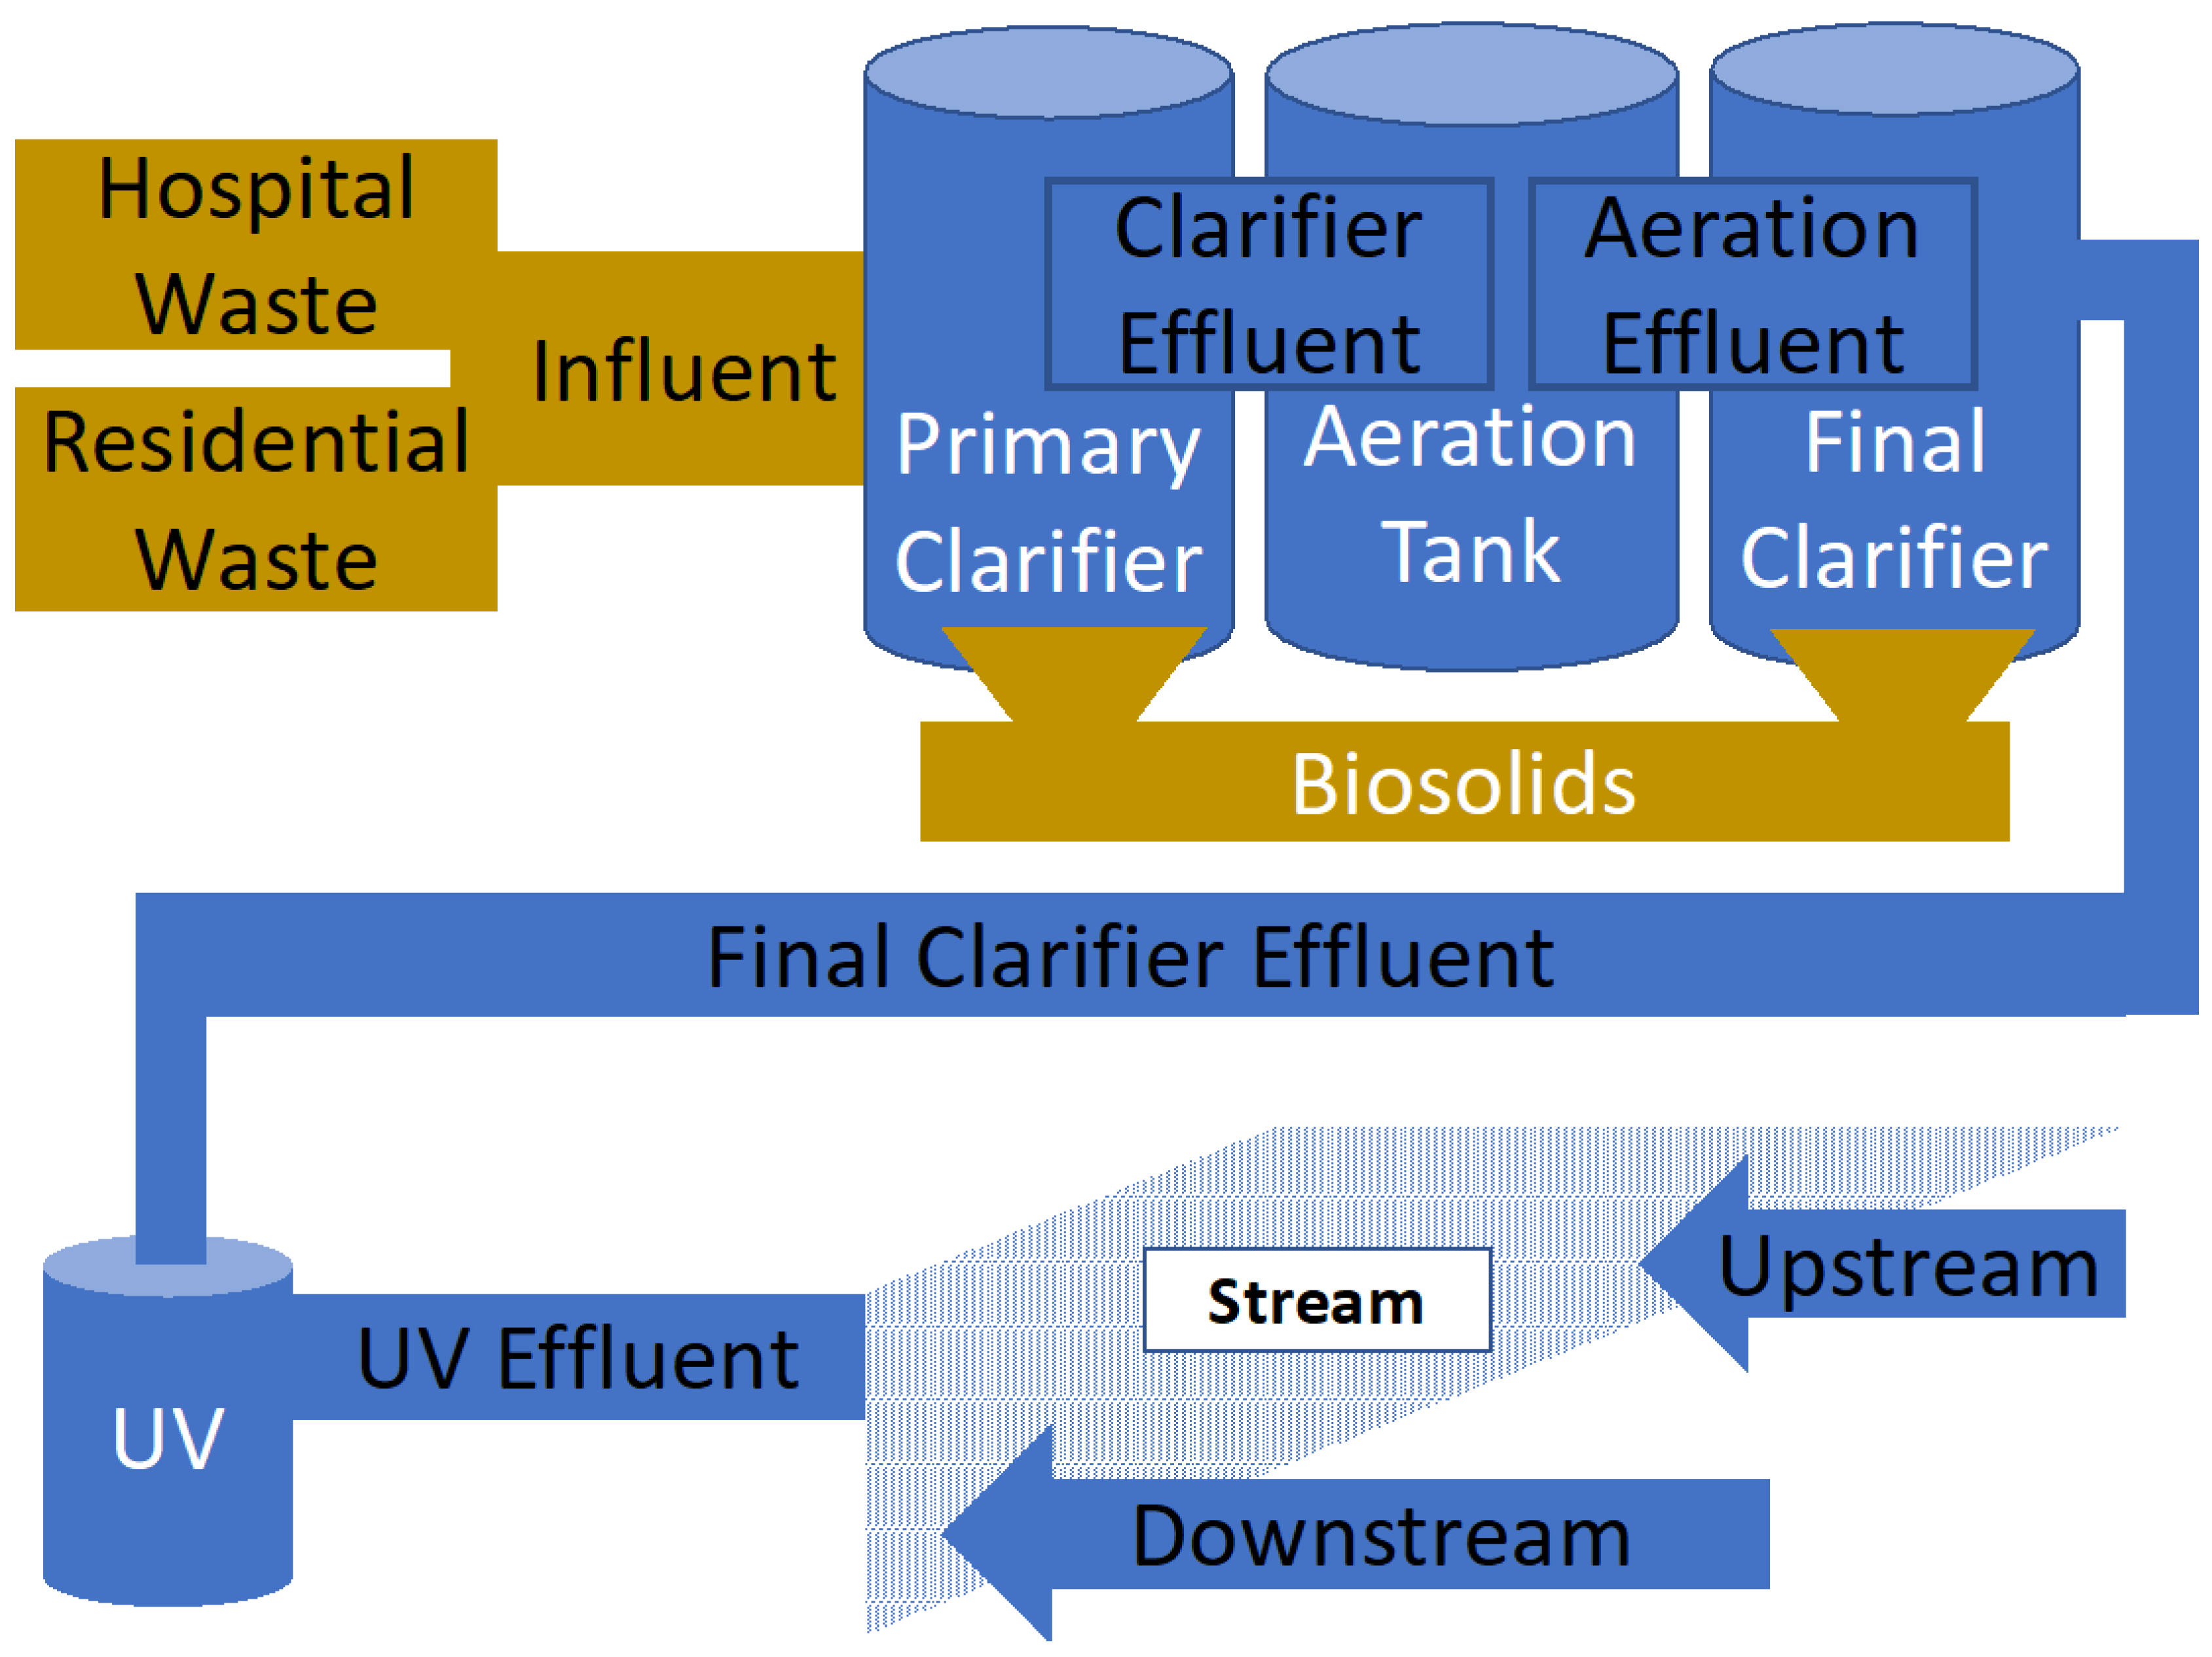
2.2. Treatment Methods and Conditions in Charlotte Water Facilities

Both plants studied use similar activated sludge treatment processes, beginning with physical bar screens, grit removal stations, and primary clarifiers, followed by activated sludge processing consisting of anoxic and aerobic zones and secondary clarifier tanks, and ending with ultraviolet disinfection at an intensity of 16,000 μW-s/cm2. The Sugar Creek facility employs an additional filtration step with anthracite bed filters, followed by wet and dry odor scrubber units, prior to creek release. Anaerobic digestion is used for solids treatment with digestate that was returned to the activated sludge tank, and biosolids reclamation is conducted at both facilities. An overview of this process is shown in Figure 2. Final effluent is monitored for carbonaceous biochemical oxygen demand (CBOD), total suspended solids (TSS), ammonia, chronic toxicity (Ceriodaphnia dubia), fecal coliform, flow rates, dissolved oxygen, pH, and phosphorus. Sugar Creek also monitors nickel and copper concentrations. The Mallard Creek facility is rated for 12 million gallons daily (MGD) being released directly into Mallard Creek, while the Sugar Creek facility is rated for 20 MGD and discharges into Little Sugar Creek.

2.3. Sample Collection and Handling

Stream samples were collected by submerging sterile 1 L Nalgene screw cap bottles approximately six inches beneath the water surface until full. The bottle mouth was oriented against the direction of flow to prevent any disturbed upstream sediment from being received and was capped while submerged. A total of 6 L of creek water was collected from each creek sampling site and stored in an insulated cooler for transport. Sewage samples were collected using an ISCO 6712 auto-sampler (Teledyne, Lincoln, NE, USA), pulling 150 mL of sewage every 30 min peristaltically to generate a 24-h composite volume in sterile 2.5 gallon carboys. The carboys were kept in an ice water bath within the sampler during the collection time. Composite collections at the reclamation facilities also used the same sampling strategy with refrigerated ISCO 6712FR autosamplers (Teledyne, Lincoln, NE, USA) and carboy storage at 4 degrees Celsius for 24 h. Following collection, 1 L of volume was transferred via a peristaltic pump from the collection carboys after thorough mixing into 1 L sterile Nalgene bottles in a sterile hood for further processing. An additional 500 mL was pumped into sterile amber glass bottles containing 200 mg of EDTA to inhibit bacterial growth for mass spectrometry analysis of antibiotic residues. In total, four time points were collected beginning with late Winter (time point 1), early and late Spring (time points 2 and 3, respectively), and mid-Summer (time point 4). The pump tubing was replaced between each sample collection and the bottles were stored at 4 degrees Celsius until DNA extraction. At the time of sample retrieval, environmental metadata measurements were collected along with the sample material. These data were integrated in downstream correlation analyses and models. Metadata gathered at the time of collection included dates and times, latitude and longitude, ambient, sample, and storage temperatures, conductivity (pHmv), pH, humidity, and autosampler composite collection start and end times (if applicable).

2.4. Detection of Antibiotic Compounds by Mass Spectrometry

Ten antibiotic compounds representing a broad range of commonly prescribed classes were chosen for the study. These included sulfamethoxazole, trimethoprim, ciprofloxacin, cephalexin, levofloxacin, amoxicillin, clindamycin, doxycycline, ertapenem (used exclusively for multi-drug resistant infections in hospitals), and azithromycin. Standardized compounds were used to generate calibration curves for the detection of each antibiotic in the wastewater composites, treated wastewater, and stream collections.
Antibiotic standards for each were spiked into various solvents, according to their preparation instructions. Ciprofloxacin, doxycycline, ertapenem, and amoxicillin were spiked into sterile water in varying concentrations from 1.95 ng/mL to 1000 ng/mL. Azithromycin, clindamycin, and sulfamethoxazole were spiked into ethanol, and levofloxacin, trimethoprim, and cephalexin were spiked into methanol at the same concentrations. An additional curve was generated for amoxicillin at diluted concentrations from 0.12 ng/mL to 0.98 ng/mL. Ciprofloxacin required an additional standard curve, as the initial data points were not linear and could not be used for concentration detection. Five-hundred mL composites of previously described wastewater and creek samples were passed over Whatman microfiber and 0.47 micron membrane filters (GE Healthcare, Pittsburgh, PA, USA) prior to cartridge loading. Growth-inhibiting EDTA was added before and after filtering to inhibit bacterial growth and to chelate any metal ions. Each sample was adjusted to a pH of 3.5 with 10% formic acid, and 200 mL of each sample were loaded onto preconditioned Oasis HLB cartridges. Each cartridge was washed with 12 mL of sterile water and 12 mL of methanol and formic acid (99%/1% v/v) to elute the bound material, which was subsequently dried overnight in nitrogen. Following desiccation, 190 uL of 99%/1% methanol/formic acid with 10 uL of 200 ng/mL Cl-phenylalanine was added to the dried material. Samples were vortexed for 10 min and centrifuged at 10,000× g for 5 min before the supernatant was transferred to vials for ultra performance liquid chromatography tandem mass spectrometer (UPLC-MS) analysis. In total, 26 samples were loaded into an Acquity UPLC-Quattro Premier XE MS system (Waters Corp, Milford, MA, USA) and ran in positive electrospray ionization mode. Raw files were processed using the TargetLynx Application Manager (Waters Corp, Milford, MA, USA), obtaining values of peak area and retention time. Concentrations of antibiotic compounds from each sample were calculated from the spray spectra based on the standard antibiotic curves. A total of 92 samples were processed in four batches, so that the preparation of the samples and the UPLC-MS analysis could be conducted on the same day. Antibiotic standard dilutions were also run in series with each batch, along with an internal phenylalanine standard to ensure consistency in instrument performance.

2.5. DNA Extraction

All samples were passed in triplicate over 0.45 micron vacuum water filters (MOBIO, Carlsbad, CA, USA) in 100 mL volumes until the flow had stopped. Flow-through volumes varied from ~150 mL to ~1 L depending on the turbidity and origin of the sample. Filters were removed from the filtration unit with sterilized forceps and were halved with sterile scissors, where one half was sliced into ~5 mm wide strips and the other was stored at −80 Celsius for future redundancy. The filter material strips were then placed in a bead homogenizer tube of the FastDNA SPIN kit for soil (MP Biomedicals, Santa Ana, CA, USA) and homogenized for 60 s using a benchtop FastPrep-24 homogenizer (MP Biomedicals, Santa Ana, CA, USA), as recommended in the manufacturer's manual. DNA extraction and elution were conducted according to the manufacturer’s protocol for increased yield and quantified using a Qubit fluorometer (Thermo-Fisher, Waltham, MA, USA) and Nanodrop spectrophotometer (Thermo-Fisher). Following DNA quality control, samples were frozen at −20 Celsius before delivery to the David H. Murdock Research Institute (DHMRI, Kannapolis, NC, USA) Genomics laboratory for sequencing library preparation. Primer, adapter, and barcode sequences are listed in the Supplementary Materials.

2.6. Shotgun Metagenomic Library Preparation and Sequencing

All sequencing was performed by the core laboratory at the David H. Murdock Research Institute (DHMRI, Kannapolis, NC, USA). Amplicon libraries were generated from collected DNA templates and validated using qPCR. Each was uniquely indexed and all the samples were pooled together in equimolar proportions and sequenced with 125 bp paired-end reads on an Illumina HiSeq 2500 flow cell (Illumina, San Diego, CA, USA). Time points 1–3 each comprised 66 total samples, while time point 4 consisted of 78 total samples, including the Uwharrie and Appalachian locations. Sequences were demultiplexed and debarcoded by the DHMRI team prior to delivery. Libraries were pooled nine per HiSeq 2500 lane, resulting in a sequencing depth of ~5 Gb per sample with 125 bp paired-end reads.

2.7. DNA Sequence Trimming and Quality Control

Raw DNA sequences were filtered and demultiplexed by the DHMRI using the Illumina HiSeq HCS software (Illumina, San Diego, CA, USA). Greater than 80% of the bases must have a quality score greater than 30, or an accuracy rate of 99.9%. Barcode, primer, and adapter sequences were also removed and verified in-house before proceeding with further analysis. Trimmomatic parameters for read clipping were ILLUMINACLIP:TruSeq3-PE:2:30:10 to ensure the complete removal of any remaining Illumina adapters. Leading and trailing base calls below a PHRED score of 3 were removed, and a sliding window approach was implemented with a required average PHRED score of 20 across a three-base section. Lastly, a minimum read length of 50 bases was specified, retaining ~80% of the total input reads, which were merged using PEAR with a minimum specified overlap of 10 bases, minimum assembled length of 50 bases, and a minimum alignment p-value of 0.01, resulting in an average assembly efficiency of 99%. In total, 1,344,546,211 paired reads for each deep-sequenced sample were obtained and used to ensure the multiplexing strategy did not affect or dilute the results returned for pooled samples. For the pooled metagenome shotgun sequences, approximately 88% of the total reads per sample contained surviving paired mates following quality control, yielding an average of 147,163,056 reads for each multiplexed sample.

2.8. Metagenomic Classification Analysis Using MetaPhlAn2

To determine species-level relative abundance, we analyzed the merged shotgun sequence datasets with the Metagenomic Phylogenetic Analysis for Metagenomic Taxonomic Profiling (MetaPhlAn) package, version 2.5.0 [26]. Sequences were aligned to the default MetaPhlAn2 marker database (v.20) for relative abundance measurements. Heat maps of the top 100 species-level taxa were generated in R [27] with ggplot2 [28], using hclust and Bray-Curtis distance calculations, along with alpha and beta diversity metrics (links provided in Supplementary Materials). Bar plots were generated using ggplot2.

2.9. Identification and Quantitation of Resistance Elements Using ShortBRED

Antibiotic resistant markers were identified and quantified using Short, Better Representative Extract Data (ShortBRED) [29]. To ensure the broadest available reference database for alignments, we created a custom database with ShortBRED-identify, consisting of the Comprehensive Antibiotic Resistance Database (CARD) [30] version 1.1.0 (August 2016) that was merged with the Lahey Clinic beta-lactamase database. ShortBRED-quantify was applied to the merged forward and reverse paired shotgun sequencing reads. The highest depth replicate was used to calculate the representative normalized reads per kilobase per million mapped reads (RPKM) counts of hits to each marker in the database for each sample. All the markers with zero RPKM hits were then removed. Heat maps were generated from the top 40 markers with the highest number of normalized counts and barplots were created to show overall ARG load at each sampling location.

2.10. Functional Classification Analysis Using HUMAnN2

To determine pathway-level relative abundance, we analyzed the merged shotgun sequencing datasets with the HMP Unified Metabolic Analysis Network (HuMAnN2) package, version V0.11.1. Sequences were aligned to the ChocoPhlAn nucleotide database and a translated search was performed using the Uniprot UniRef90 [31] database. Pathway abundance files that were generated by HuMAnN2 were used for downstream statistical analysis.

2.11. Statistical Methods

The significance of differences in microbial relative abundances, pathway relative abundances, and ShortBRED-derived resistance elements between sites were each assessed using linear regression models, via the lm function in R [27]. The relative abundance or RPKM of ShortBRED genes served as the response variable and the final explanatory variables consisted of the stream source (MC or SC), the sampling site (upstream, treatment plant influent, downstream, etc.), and a representation of the time at which the sample was taken (late winter, early spring, late spring, mid-summer). As the triplicates were clustered closely together, the most deeply sequenced sample from each set of replicates was taken as the representative for that measurement. A threshold frequency of a non-zero presence in at least 25% of all samples in the comparison was used to avoid wasting hypotheses on stochastic differences in rare taxa or genes. The Benjamini-Hochberg false discovery rate was used to perform multiple hypothesis correction [32]. All the p-values are Benjamini-Hochberg corrected, and complete statistical comparison results are available at the links provided in Supplementary Materials.

3. Results

Our study of antibiotics, taxa and resistance genes throughout the Charlotte, NC urban watershed surveyed several processing stages inside two wastewater treatment plants, as well as upstream and downstream sites across four time points in the 2016 calendar year. We found that the release of treated water maintains elevated concentrations of multiple antibiotics in downstream waters, and that some pathogens of interest are present in small quantities in the streams, both upstream and downstream of treatment sites. However, unlike antibiotic compounds, pathogenic taxa and antibiotic resistance gene markers are generally not significantly increased in concentration in moving waters downstream of treated water release.

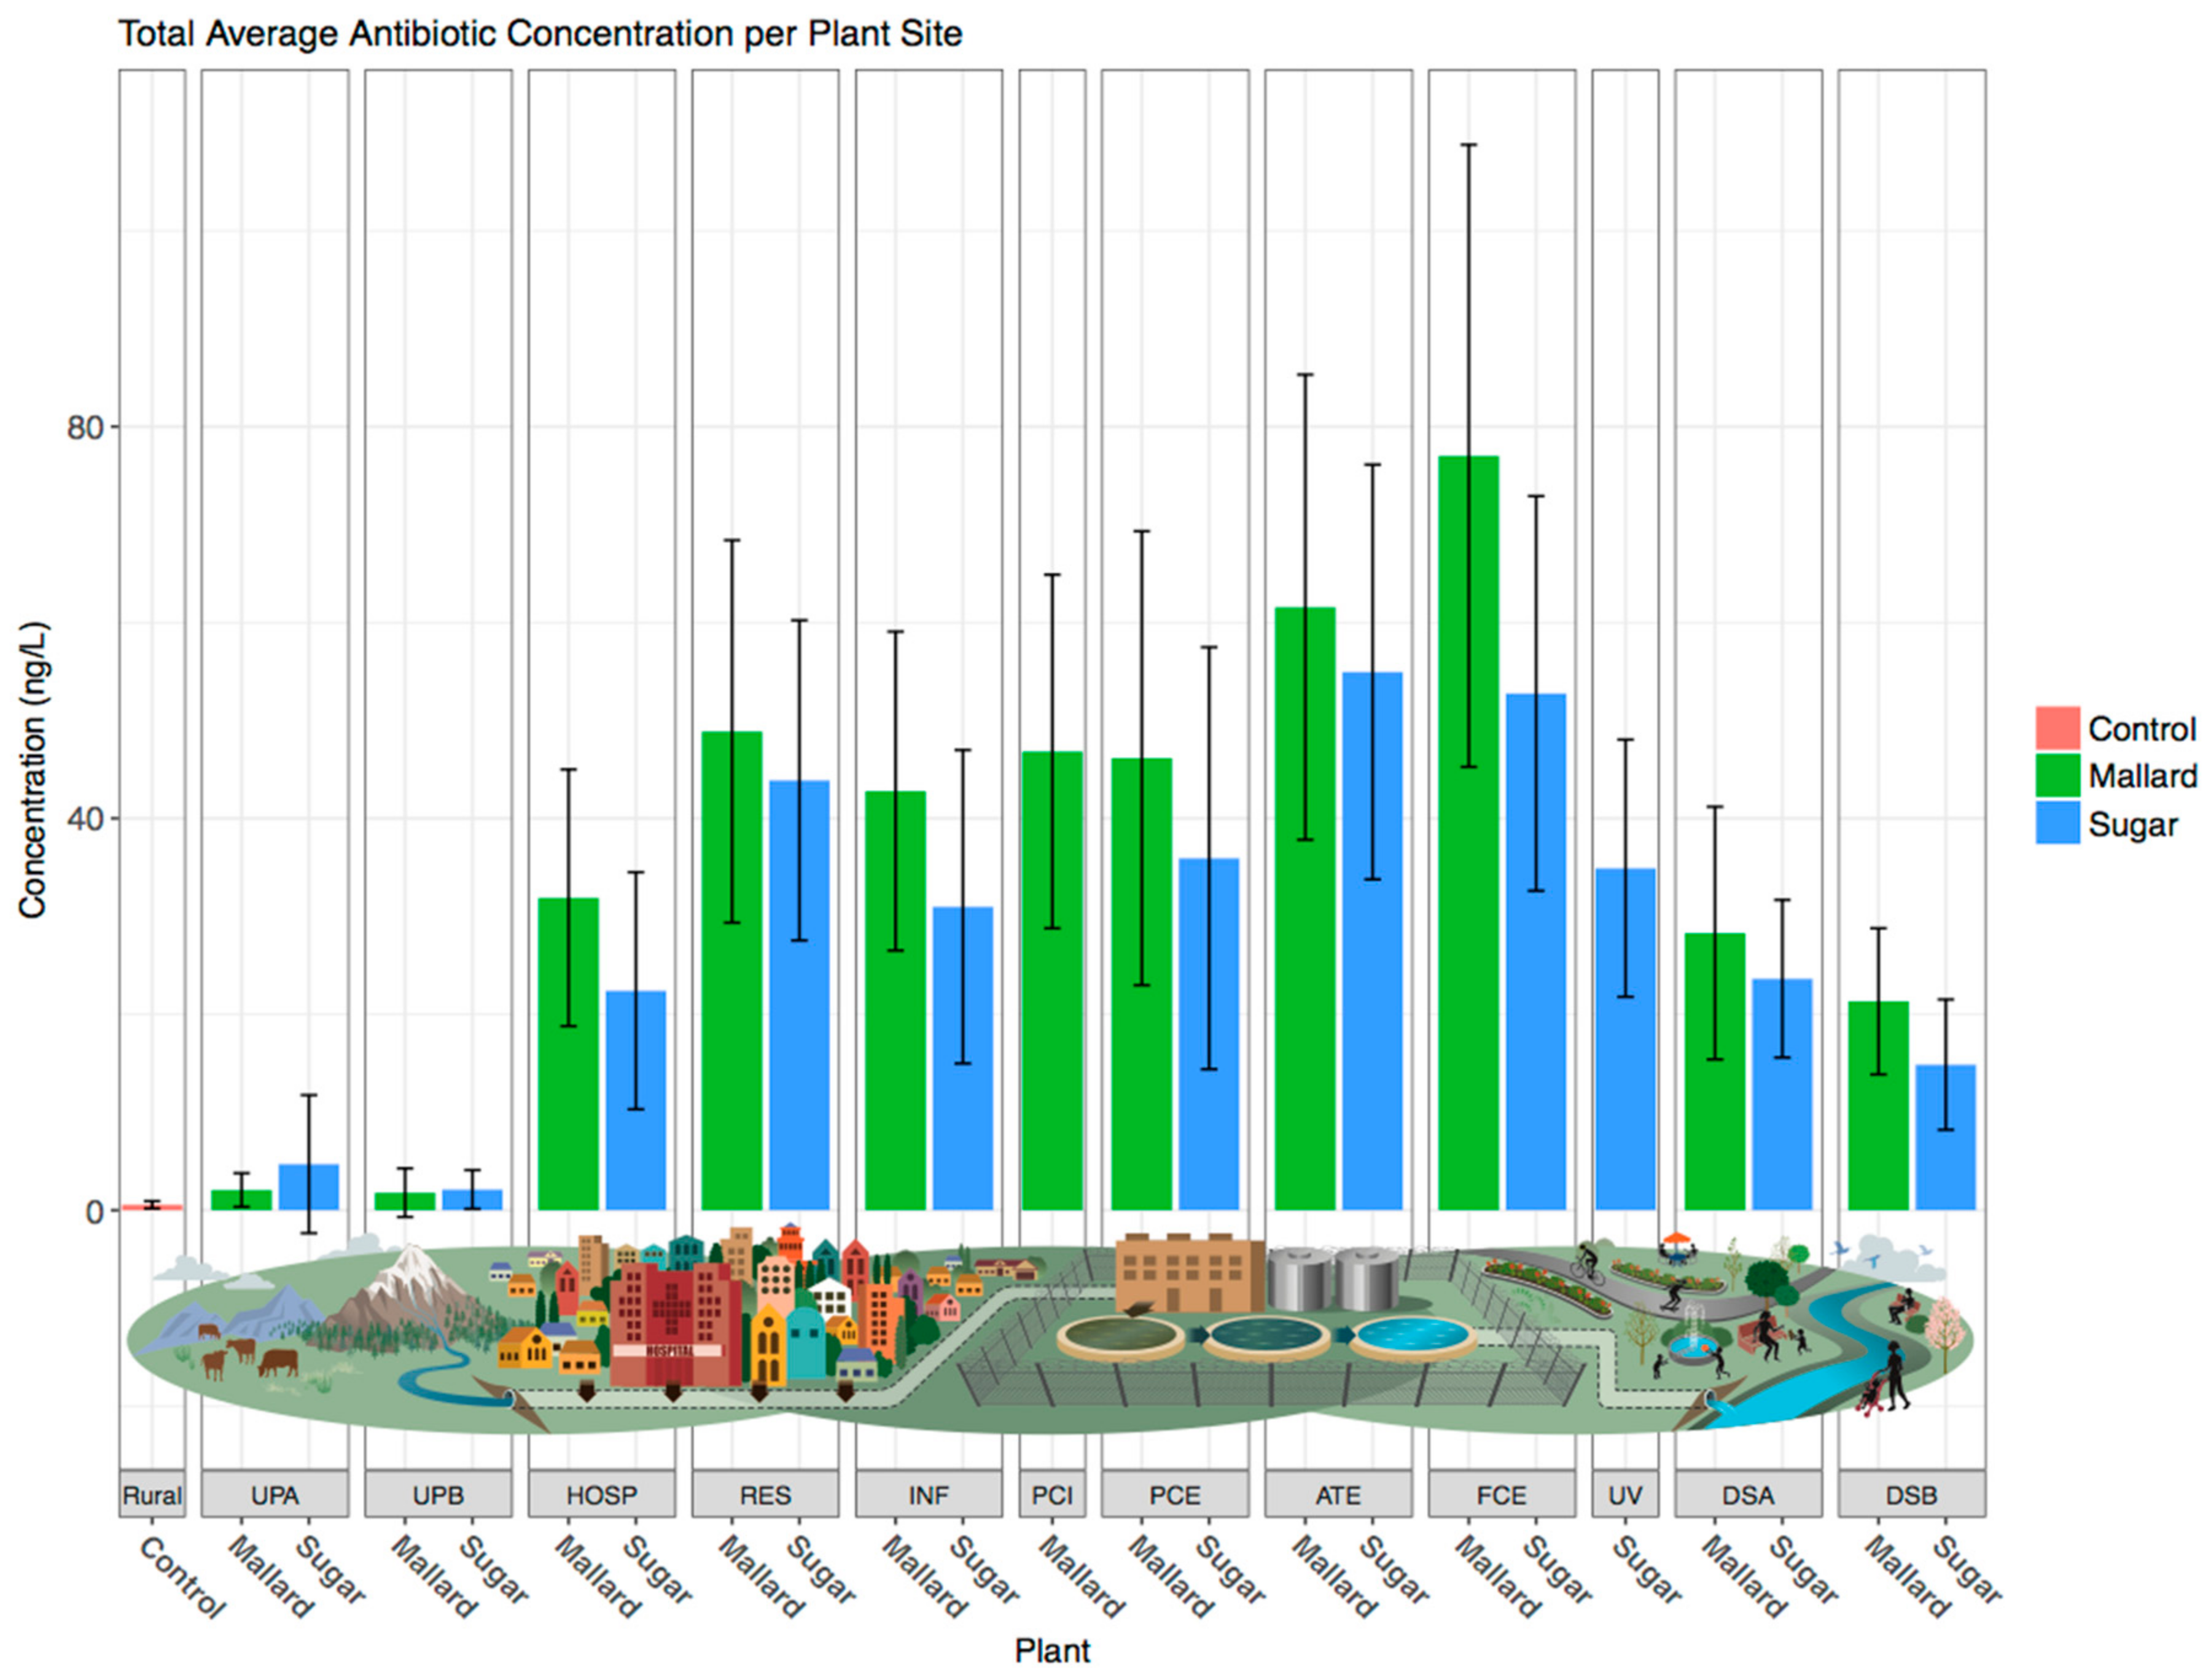
3.1. Antibiotic Concentrations Are Elevated Downstream of Wastewater Treatment Plants

Ten compounds were chosen to represent a diversity of frequently used classes of antibiotics with different chemical properties and mechanisms of action. Eight of these (ciprofloxacin, doxycycline, azithromycin, clindamycin, sulfamethoxazole, cephalexin, trimethoprim, and levofloxacin) were detected in most of the samples that were collected (Supplementary Materials Figure S1). By contrast, ertapenem and amoxicillin were only seen in a limited number of samples at concentrations below the limit of quantification (1.95 and 0.24 ng/L, respectively).
Our survey included two urban upstream sites (Mallard and Little Sugar Creek) as well as two rural sites that were chosen for low human impact, which we anticipated would have low background antibiotic concentrations. Remote rural sites and upstream sites were substantially equivalent, with antibiotic concentrations changing by an average of less than 5 ng/L when compared to each other, with no significant differences with regards to the presence of specific antibiotics, and no significant seasonal changes (p < 0.05, Supplementary Materials File S2). Consistent with previous literature [14,33,34], concentrations of the eight consistently detected antibiotics were present in measurable concentrations throughout the treatment process (Figure 3). For both Little Sugar and Mallard Creek locations, downstream concentrations of all antibiotic compounds were significantly increased relative to their upstream concentrations, by an average factor of eight-fold, except for clindamycin (Figure S3). This demonstrates whole-compound persistence throughout the treatment plants and into the discharged treated wastewater. We also compared two downstream sites at distances of 3300 and 2700 m for both Little Sugar and Mallard Creek, respectively, and found that overall antibiotic concentrations decreased significantly by an average of 6 ng/L from the more proximal downstream site A to the more distal downstream B site (Figure 3), with the largest concentration reduction seen in ciprofloxacin. Overall, these data demonstrate that wastewater treatment plant effluents can act a source of antibiotics, sufficient to maintain elevated concentrations of antibiotics in moving water for a considerable distance downstream of the plant.

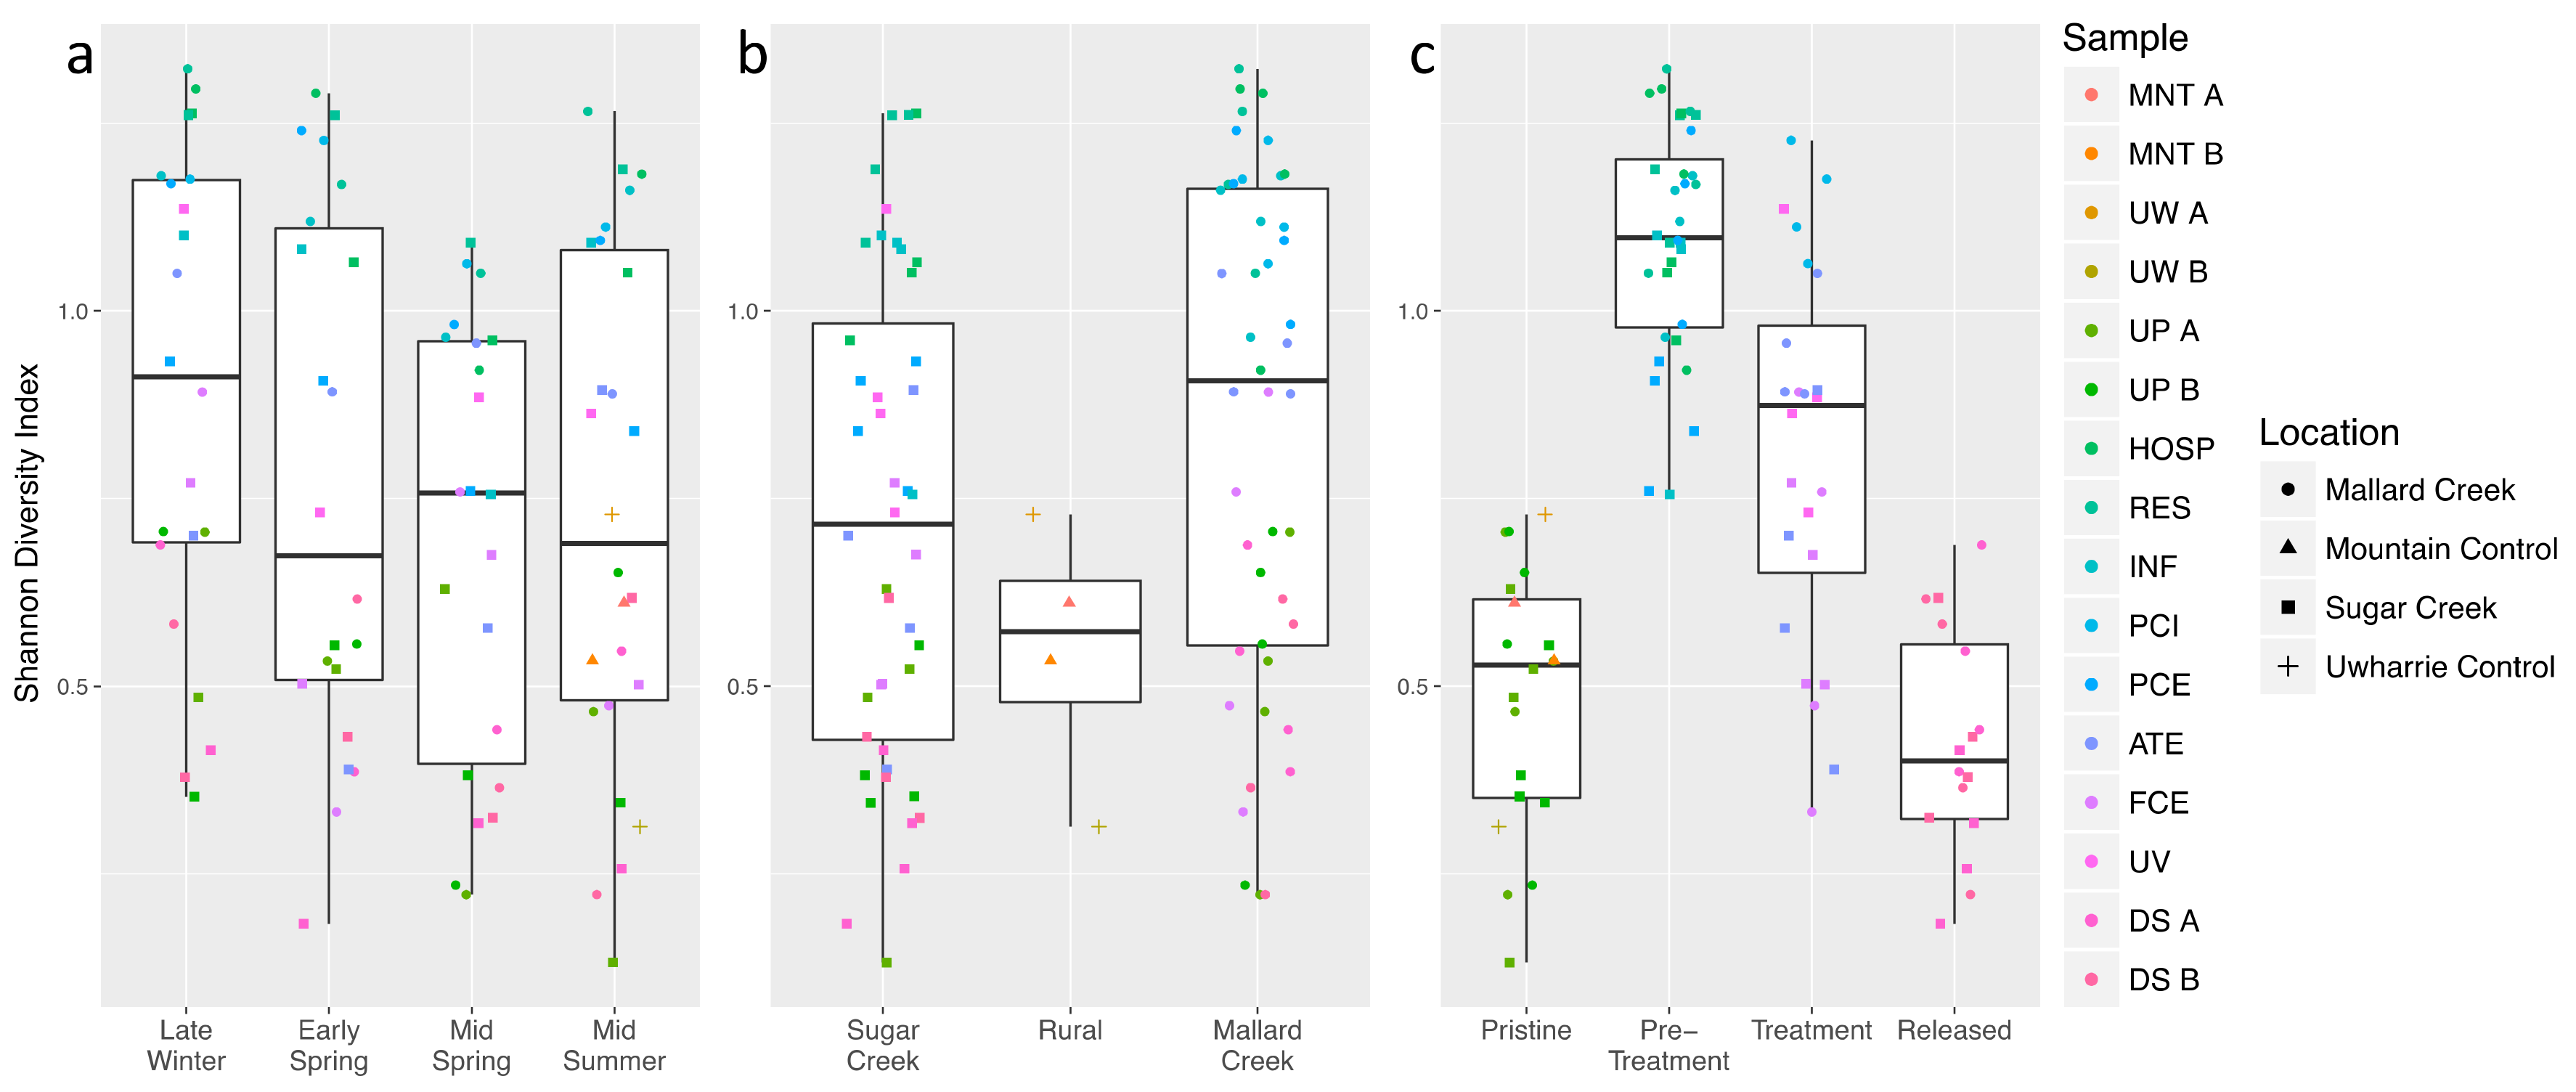
3.2. Treated Wastewater Microbial Communities Become More like Fresh Water Communities as Waste Progresses through the Treatment Process

Relative abundances of microbial species were computed from shotgun sequencing data using MetaPhlan2 [26] (Figure 4). Influent samples and sewage prior to the ATE stage were the richest in species diversity, while stream samples and treated wastewater were the least diverse (Figure 5). Beta-diversity measures showed that treated water samples clustered together, separately from stream and rural sites (Figure 6). Technical replicates conducted in triplicate with independent sample DNA extraction and sequencing displaying little variance (Figure S4).
When we examine upstream and downstream stream samples at the phylum level Actinobacteria and Proteobacteria predominate (Figure 4), as is typical for freshwater communities [35]. At the genus level, 366 total taxa were detected, 16 of which were significantly different between upstream and downstream locations. Of these, 15 were higher in relative abundance downstream, and they are also present in at least two wastewater treatment plant locations at a relative abundance of greater than 0.1% (Table S1). These results are consistent with these taxa being introduced into the downstream ecosystem from the wastewater treatment plant. However, when we compared the closest (DSA) and most distant (DSB) downstream locations from the plant effluent discharge sites to see whether any of these species decrease in relative abundance with increased distance from the effluent sources we found no significant differences in enriched taxa with respect to distance from the discharge site (data not shown).
Within the influents and the treatment plant environment, Bacteroides and Firmicutes predominate (Figure 4), as we would expect from previous literature [36,37] for material mainly originating in the human gut. Collectively, raw sewage influents between the Mallard and Sugar Creek treatment facilities were comparable, with no significant population deviations between the two basins at the phylum level (p < 0.05). Minimal differences in microbial relative abundance were detected between mixed hospital waste and waste that was exclusively residential, with the soil dwelling bacterium Kocuria rhizophila (p = 0.0318) as the only significantly different taxon (Table 1). When influents pass through the aeration tank following the point at which activated sludge is introduced, there is a noticeable shift in dominant phyla with 23 taxa being significantly different (Table 1). Actinobacteria species are reintroduced, and the trending relative abundances of Bacteroides and Firmicutes drop, although those phyla are still more abundant than they are in the stream. When upstream locations and rural sites were compared, the soil-associated genus Sphingobium was the only significant differing taxon (p = 0.01) that was detected at elevated levels in the rural sites when compared to Charlotte upstream locations (Table 1).

3.3. Microbial Community Shifts during Wastewater Processing

Comparisons between wastewater collection and treatment stages were constrained to processing stages that were identical between the two plants. No significant differences in taxa were observed between the PCI and PCE stages where there is no active processing. However, between the PCE and the aeration tank effluent (ATE), 221 unique taxa were significantly altered in relative abundance, with 192 of these being reduced overall. Of the taxa that increased in relative abundance in the aeration tank effluent, all have been previously characterized as digestors and denitrifiers within wastewater and/or activated sludge [36,38,39,40,41,42,43,44,45,46,47,48,49,50,51,52,53,54,55].
In the subsequent treatment stage from the ATE to the final clarifier effluent (FCE), we also observed very minor changes in relative abundance, although several differences were marginally significant (Supplementary Materials File S3). The composition of the FCE prior to ultraviolet disinfection in both plants differed significantly from downstream samples across 66 different taxa. Most of the differential taxa appeared to be reduced from FCE levels during the subsequent UV disinfection step (Table 1)
The internal population profiles of both Mallard and Sugar Creek, plants were generally quite similar. At both the late winter (Figure 4) and the other collection timepoints (Figure S4), the FCE of Sugar Creek had significantly lower relative abundances of the soil- and freshwater- associated genus Thauera, when compared to Mallard Creek FCE. All comparisons between plant stages can be accessed in their entirety from the Figshare links provided in the Supplementary Materials.

3.4. Shifts in Stream Microbial Community Function Are Observed Downstream of Treated Wastewater Release Points

In order to understand the potential functional significance of observed changes in the microbial communities among the locations sampled, we analyzed the data using HUMAnN [56] to determine the relative abundance of orthologous gene families making up known MetaCyc microbial pathways [57]. Between upstream and downstream sites, there are 24 significant pathway relative abundance changes (p < 0.05) (Table 2). Twenty-two of the twenty-four affected pathways are present in higher relative abundance upstream of treated water release. Pathways involved include nucleotide, amino acid, and carbohydrate biosynthesis, as well as nucleotide and peptide degradation and salvage pathways.

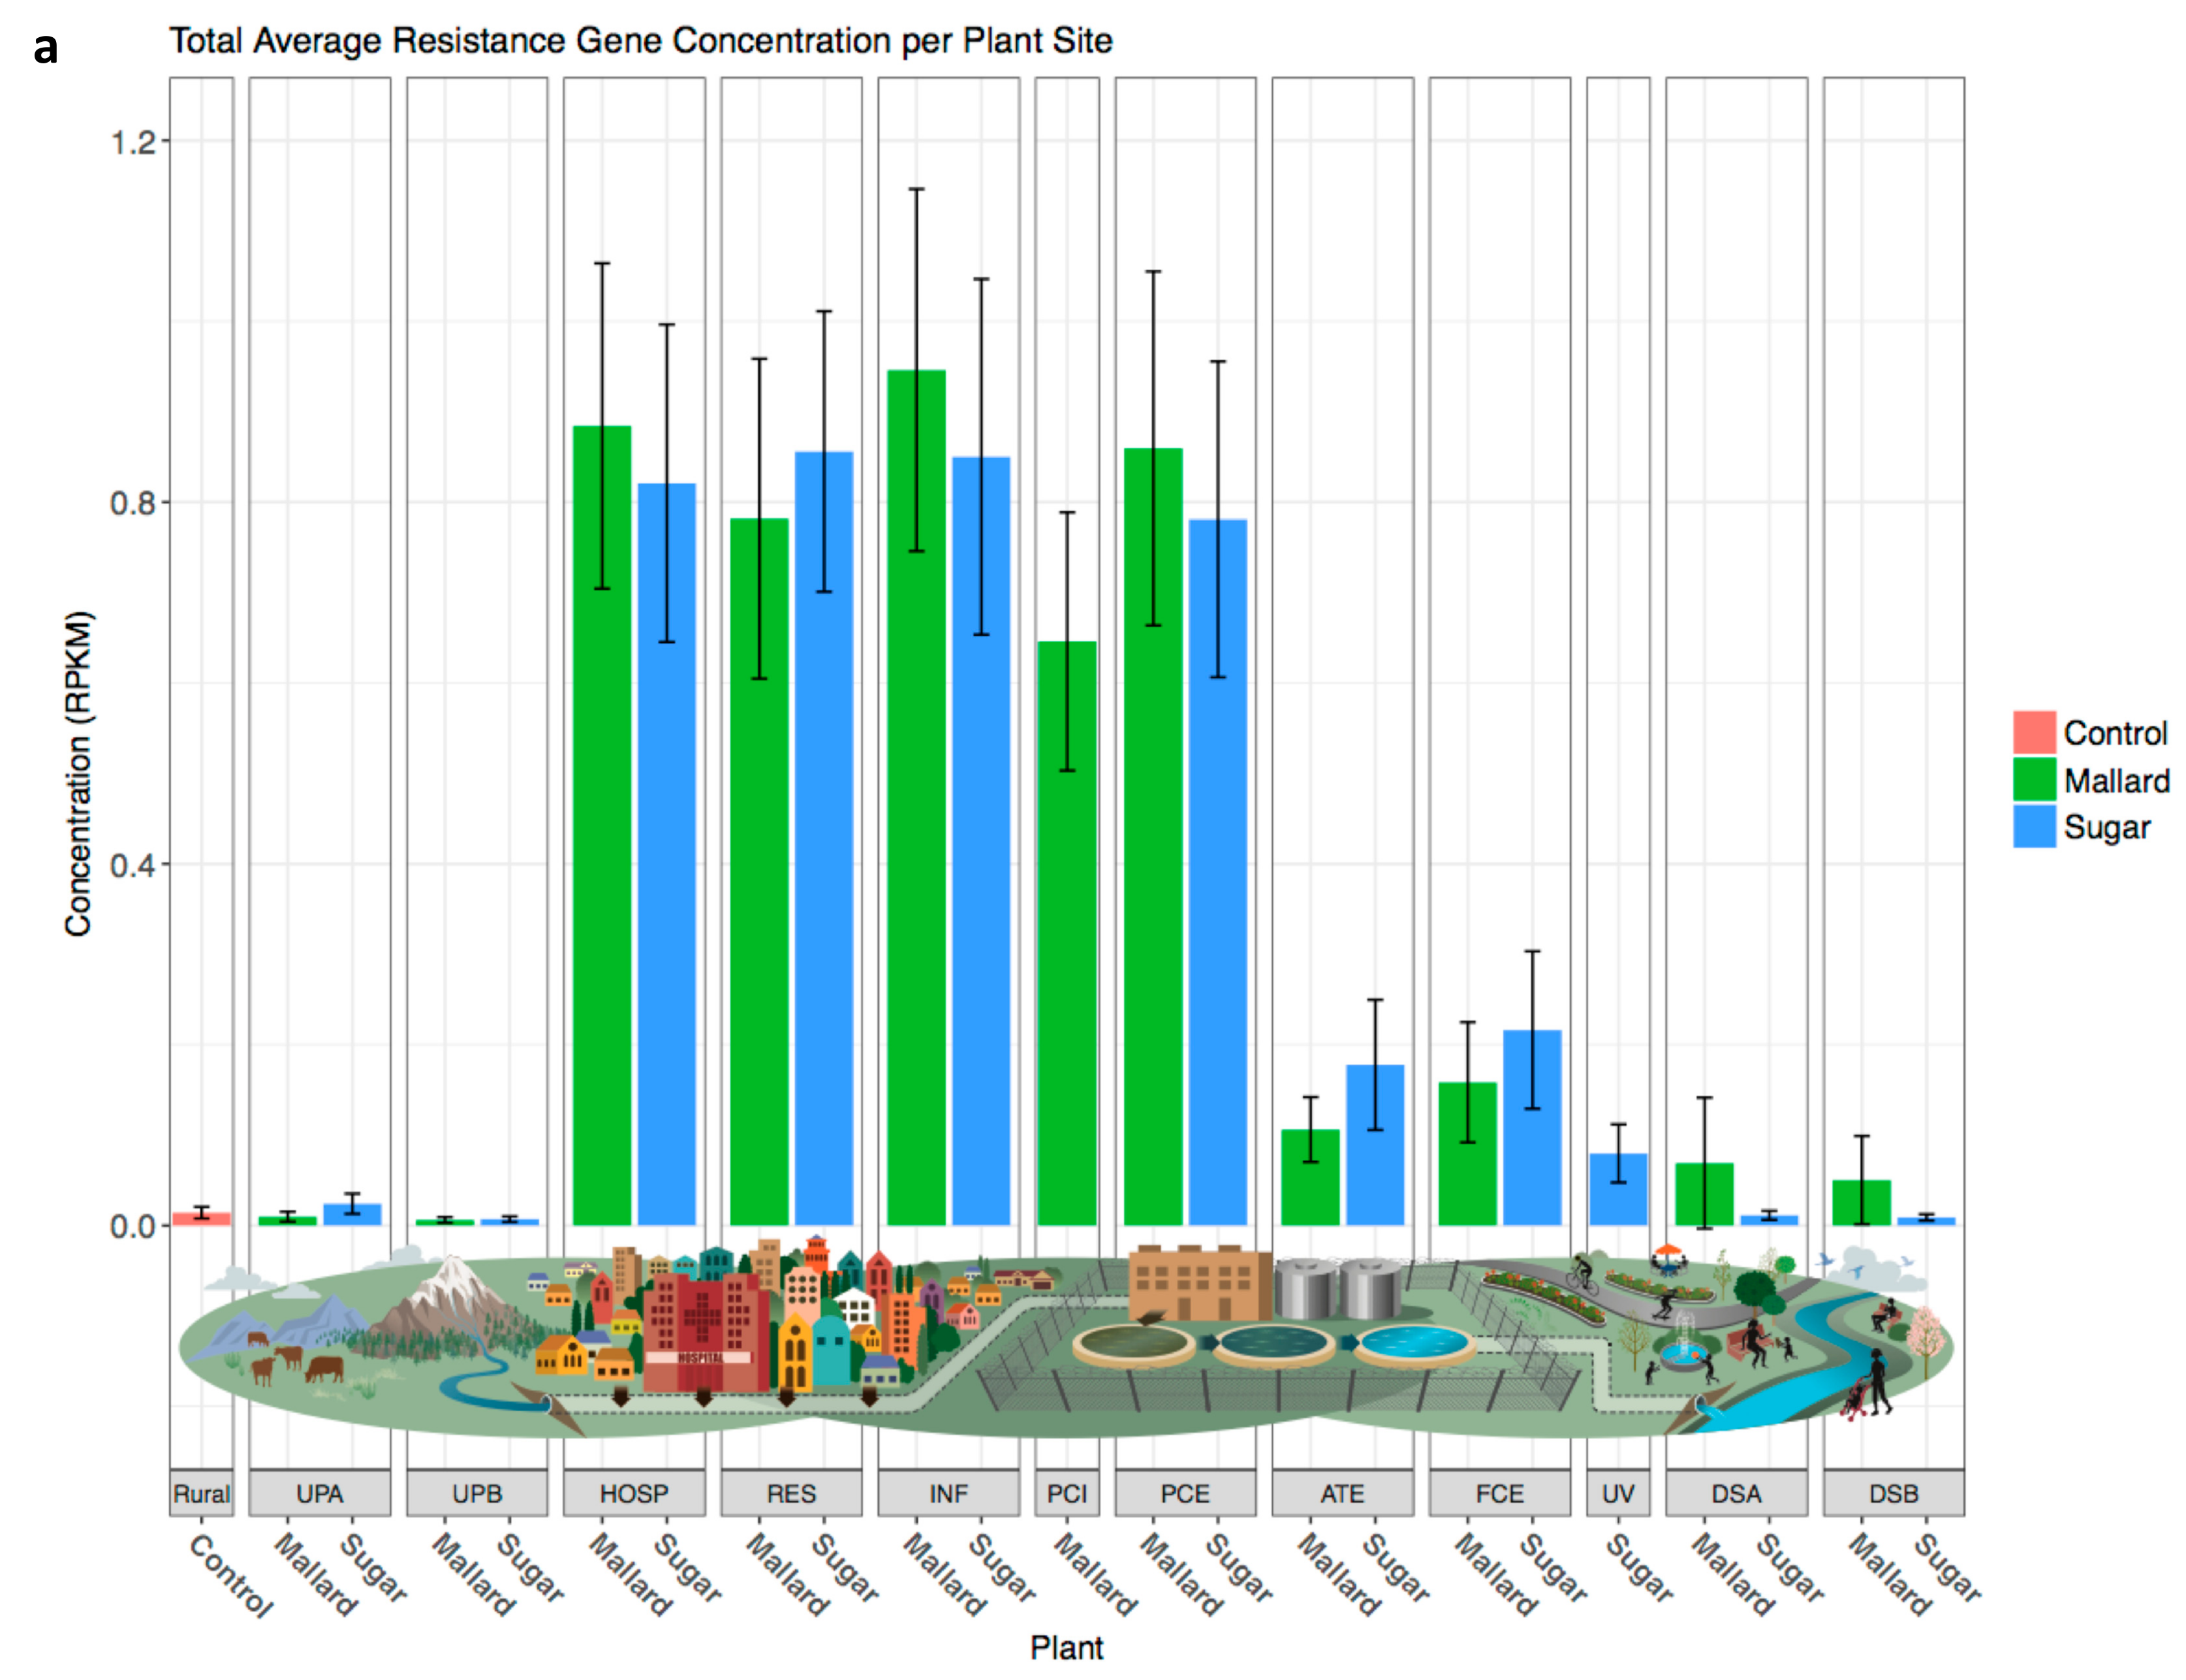
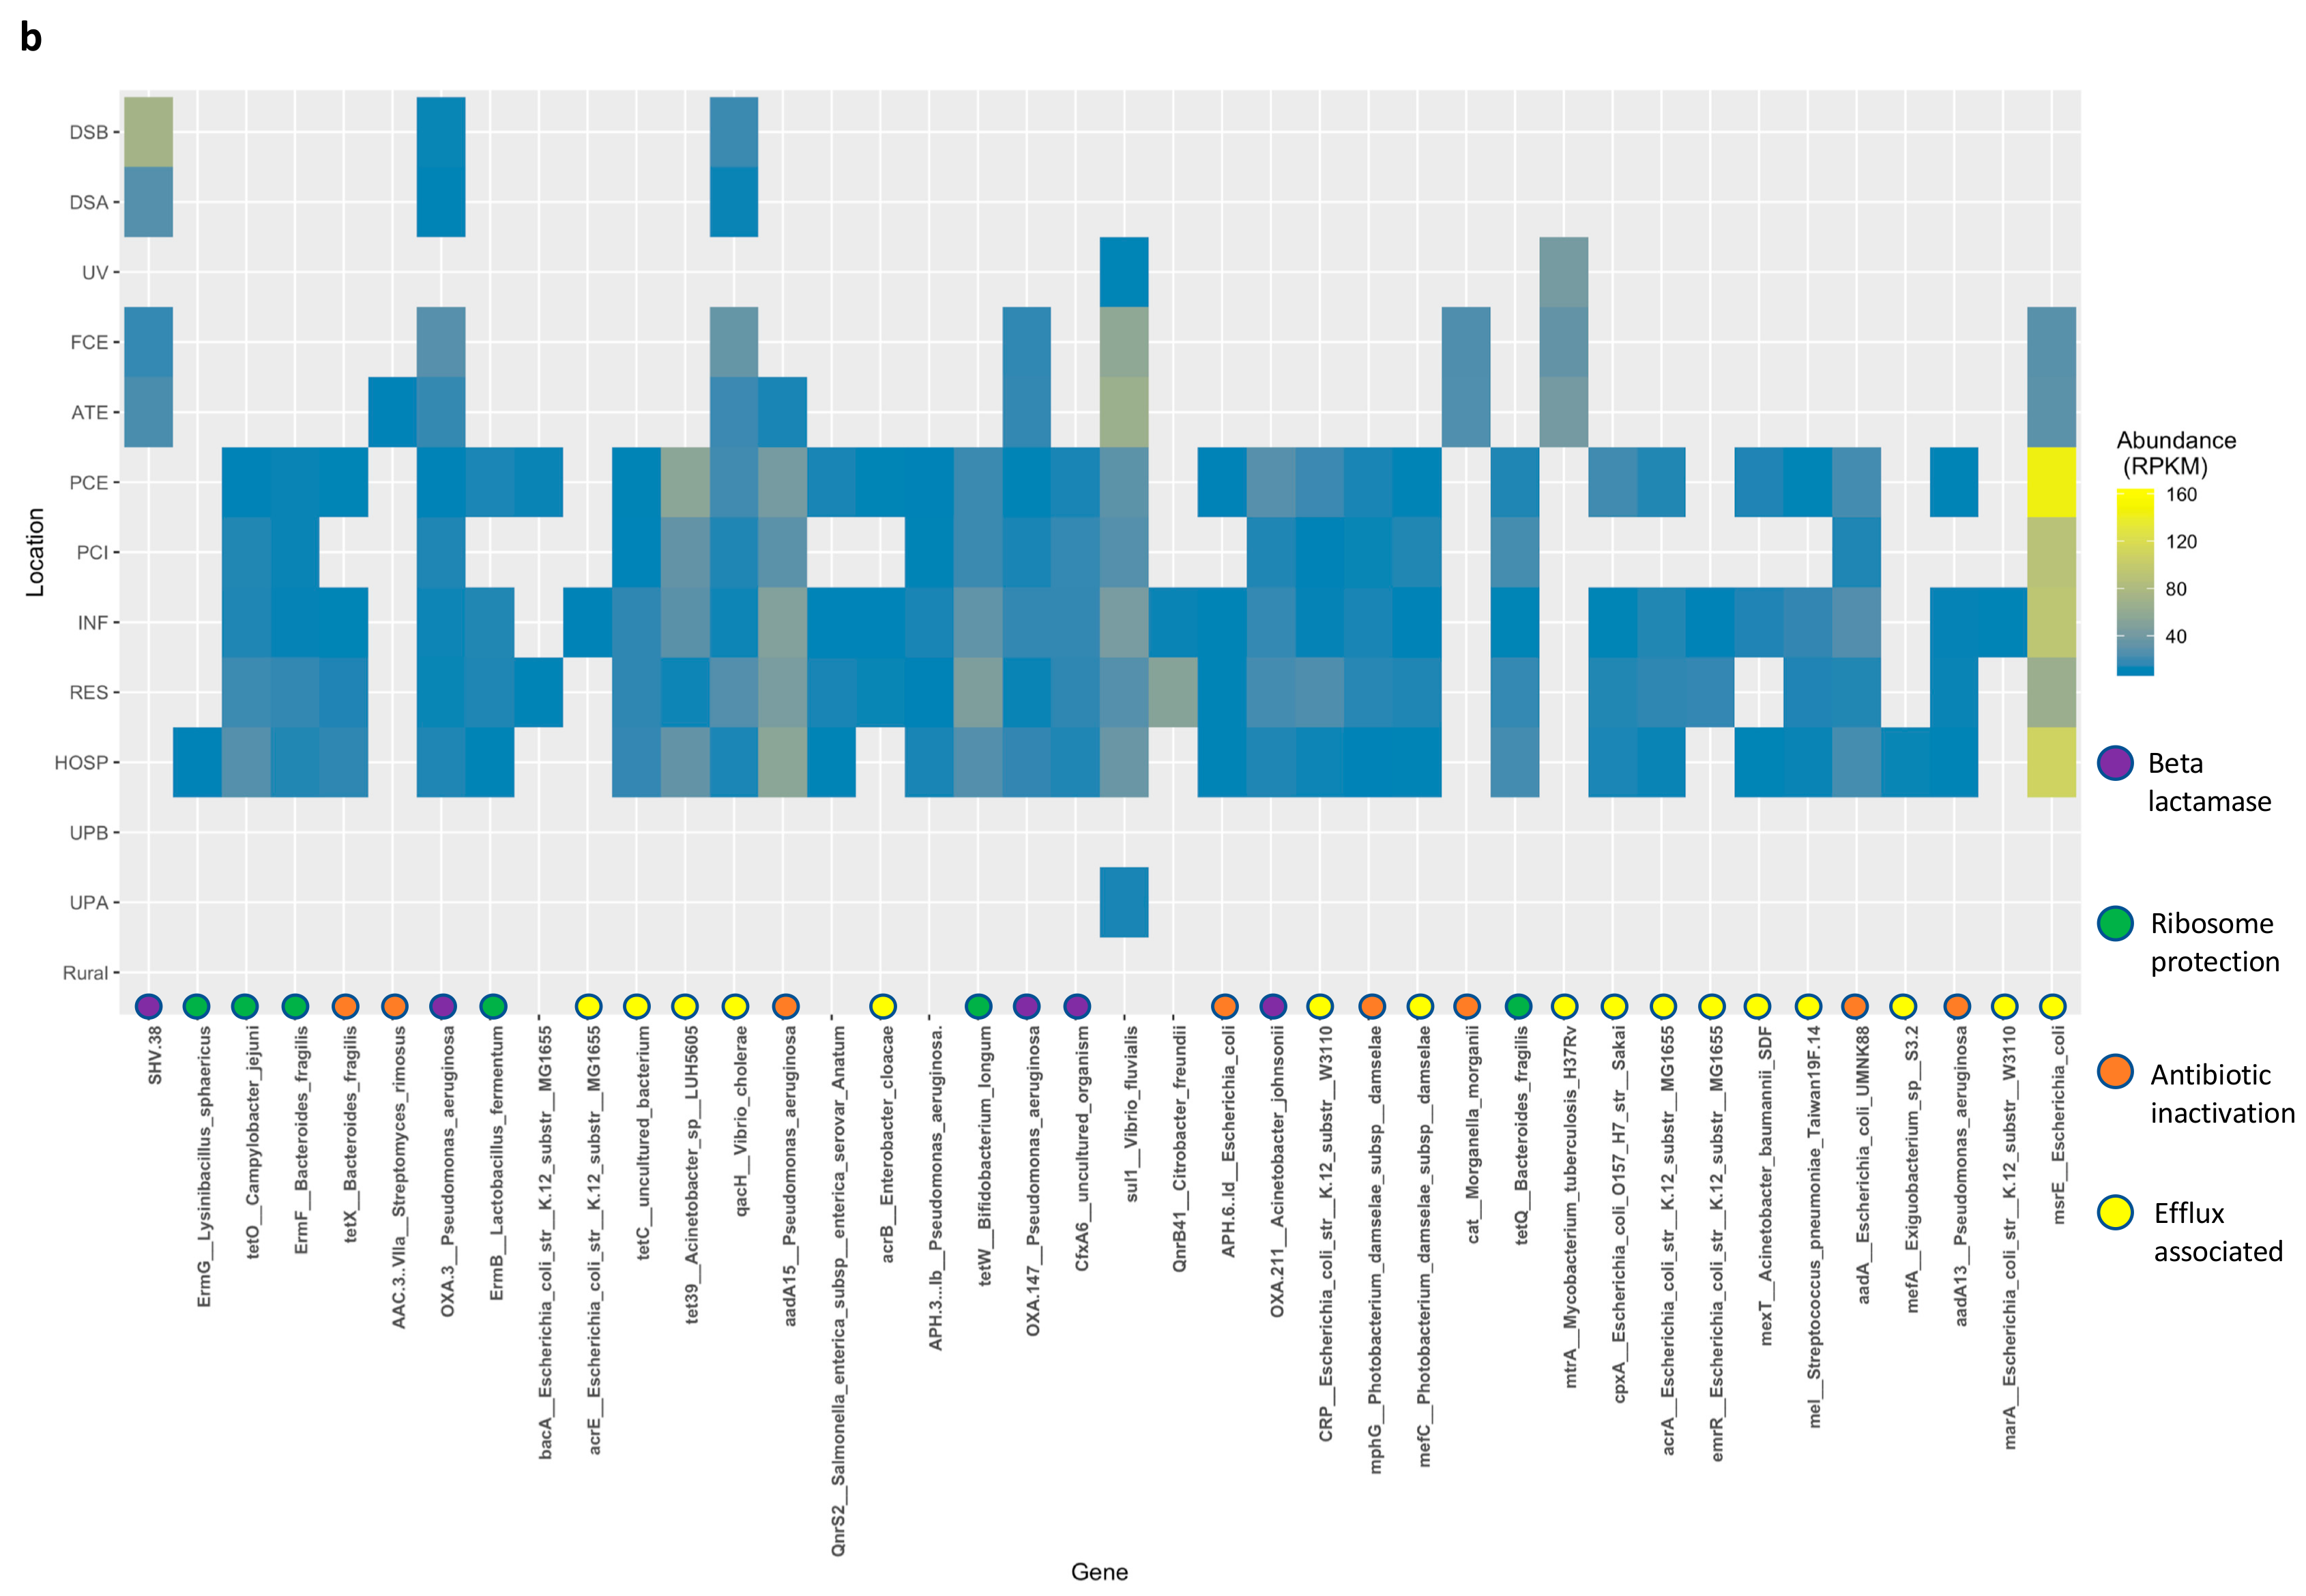
3.5. Resistance Genes Are Slightly More Abundant Downstream of Wastewater Treatment Plants

In order to measure changes in resistance gene content, we used ShortBRED to identify specific antibiotic resistance associated genes and elements. Alignment of shotgun sequencing data to the hybrid CARD and Lahey databases for antibiotic resistance associated genes and mobile plasmid elements revealed hits to a total of 600 unique terms from all of the samples across all time points. Of the 600 total detected antibiotic resistance associated sequences, nine were more abundant in downstream waters when compared to upstream (statistical tables available from FigShare links in Supplementary Materials). These included carbenicillin and oxacillin beta-lactamases CARB-3 and OXA-1 from the WHO priority pathogen Pseudomonas aeruginosa, including two extended spectrum beta-lactamases (Figure 7B and Figure S6). Plasmid-derived sulfonamide resistance for Vibrio cholerae species, encoding a dyhydropteroate synthase, was also more abundant in downstream waters. Multiple genes conferring multi-drug resistance (MDR) within the E. coli K-12 strain were detected as well, all encoding multiple efflux pump subunits or modulating efflux control. Overall, only two antibiotic resistance elements were significantly different in relative abundance between upstream and downstream sites. A Streptomyces lividans methyltransferase was found in significantly higher abundance upstream (p = 0.044), while a beta-lactamase from Pseudomonas aeruginosa was higher downstream (p = 0.044).
When compared to the relative abundances of ARG sequences within the FCE stage of treatment, 15 of the 600 terms were significantly lower downstream (statistical tables provided in FigShare of Supplementary Materials). An Exiguobacterium macrolide efflux pump (p = 0.043) was detected in higher relative abundance within partial hospital sewage, while the residential sewage contained significantly more Escherichia coli macrolide efflux pump and associated MDR efflux pump membrane proteins (p = 0.043). Following treatment in the primary clarifier, no ARGs were altered significantly in abundance from the raw influent. Subsequent digestion in the aeration tank reduced the relative abundance of 84 antibiotic resistance elements, with many falling to undetectable levels. The transition from ATE to FCE did not result in further significant changes to relative abundance of any ARG markers, although a methyltransferase from Streptomyces lividans and an aminoglycoside acetyltransferase in Streptomyces rimosus were marginally reduced (p = 0.052 and 0.051, respectively). The final UV step (implicit in the comparison of FCE to downstream sites DSA and DSB) resulted in the reduction or removal of twelve additional markers, including a Vibrio cholerae and Vibrio fluvialis sulfonamide dihydropteroate synthase (p = 0.0004), an aminoglycoside acetyltransferase in Serratia marcescens (p = 0.014), a Pseudomonas aeruginosa beta-lactamase (p = 0.054), a tetracycline efflux pump in Acinetobacter (p = 0.054), Photobacterium damselae macrolide efflux pump (p = 0.054), Escherichia coli plasmid-encoded efflux pumps for streptogramin, streptomycin, and erythromycin (p = 0.054), and suggest elevated levels of a chloramphenicol acetyltransferase in Morganella morganii, and an MDR efflux pump for Mycobacterium tuberculosis (p = 0.1). No significant differences in ARG markers were detected between the two downstream locations. Remote mountain and Uwharrie stream sites and the upstream urban sites were essentially equivalent, with no significant difference in antibiotic resistance markers. Corresponding illustrations for individual antibiotic concentrations and shotgun analysis, ARGs, and all taxa, as well as between site comparisons, are provided in Supplementary Materials (Figures S7–S9).

4. Discussion

In this survey of two Charlotte NC urban waterways and their associated treatment plants, we made four key observations. Each of these suggests targets for future research or innovation in water treatment methodology.
First, we assayed the concentration of 10 antibiotic compounds representing families of commonly used antibiotics, and found that multiple antibiotic concentrations are elevated downstream of wastewater treatment plants. Antibiotic compounds tend to be concentrated inside the plants relative to upstream and influent concentrations, whole compounds persist throughout the treatment cycle, and elevated concentrations of antibiotics are observed in moving waters downstream of the treatment plants. Both the interior sites in the plant and the downstream sites are environments that facilitate the simultaneous exposure of bacteria to multiple antibiotics. Trunk lines handling hospital waste did not have significantly higher antibiotic levels than purely residential trunk lines.
Second, we assayed microbial communities at the same sites within treatment plants and stream watersheds, and found that treated water microbial communities become more like fresh water communities as waste progresses through the treatment process. Some antibiotic resistance terms originating from priority pathogens were observed in low relative abundance in environmental sites and at much higher relative abundance within the influent and in the treatment plants. Surprisingly, influent from hospital-associated and all-residential neighborhoods was not significantly different from the microbial community perspective. We observed an increased relative abundance of expected microbial signatures, such as human gut associated Bacteroidetes and Firmicutes and activated sludge associated taxa, in downstream waters. Levels of these attenuated between the proximal and distal downstream sites and did not significantly change the core microbial community of the streamwater. More downstream sampling locations would be required to accurately model this trend, and it will be of interest to assay antibiotic levels at the endpoint of the Catawba and Yadkin Pee-Dee rivers in southeast coastal waters as well.
Third, we analyzed relative abundance of functional pathways in the stream and treatment plant microbial communities, and found that shifts in stream microbial community function are observed downstream of treated water release points. Here, we focused primarily on the impact of water release on the function of the stream community. When comparing upstream and downstream sites, we observed that some core functions of stream microbes, including many pathway terms for DNA and peptide recycling and biosynthesis, were suppressed relative to upstream sites. This is an interesting finding that we cannot yet explain mechanistically, but it suggests that further investigation of sediments in urban streams under long-term antibiotic stress is necessary to understand the mechanism of impact of this stressor on community function.
Finally, we analyzed presence of antibiotic resistance gene (ARG) signatures in the plant and stream microbial communities, and found that resistance genes are slightly more abundant downstream of wastewater treatment plants. This was not a foregone conclusion of this study, because in other contexts ARG signatures have been observed to increase downstream of treated water release. However, Charlotte Water’s treatment process, which includes UV treatment of waters prior to final release, appears to be very effective in reducing ARG relative abundance. While certain ARG signatures, including concerning carbapenem resistance and broad spectrum beta lactamases, originating from organisms, such as Pseudomonas aeruginosa, Vibrio cholerae, and Escherichia coli were detectable in low relative abundance downstream of the plants, the reduction in relative abundance of these signatures relative to influent and internal WWTP locations was dramatic, especially when considering that the testing that Charlotte Water conducts for pathogens in treated water is limited to the standard fecal coliform test. To our knowledge, this is the first study of this scope and resolution to investigate all of these key factors together in one integrated analysis.
Testing for antibiotics and associated resistance genes is not conducted as part of the wastewater treatment and monitoring process at Charlotte Water, nor is this implemented as standard practice in any known treatment facilities in the United States. However, the spread of resistance to common antibiotics is a well-known public health threat, and the presence of antibiotics in sub-lethal concentrations is known to drive microbial evolution [15,16,58]. Based on available knowledge about the dissemination of pharmaceutical compounds in surface waters in North America [59], we hypothesized that either the processing or the release of treated water could create a condition where mixtures of bacteria are simultaneously exposed to multiple antibiotics, and facilitate the spread of antibiotic resistance [60]. We observed that conditions for multiple antibiotic exposure exist inside the water treatment plants as well as at downstream urban locations.
Wastewater treatment plant influent is known to contain significant populations of human gut associated pathogens, and regional sewage microbial profiles are tightly correlated with the microbial profiles of human residents in the region [61]. Although we observe in this study that gut-associated taxa are somewhat elevated in downstream waters, the microbial profile of moving waters in upstream sites in the city is not far removed from the profiles of more remote rural sites, largely devoid of most resistance elements. The addition of treated water to the stream appears as a temporary perturbation in the microbial community that begins to attenuate further away from the release point. This likely allows the stream microbial profile to return to its pre-effluent baseline within a relatively short distance, particularly with the limited downstream population effects that are reported here. Recent works describe similar changes in stream biofilms [34], although the extent of observable species changes was less significant in our samples.
Charlotte’s WWTPs accumulate significant quantities and varieties of genetic elements associated with antibiotic resistance, but unlike some other treatment facilities [62], are quite effective in removing them prior to release. Simultaneous exposures of microbes to multiple antibiotics within the plants themselves, where antibiotic concentrations are highest, are relatively short, although a typical residence time of approximately 20 days still encompasses many microbial generations. However, residence times for microbes are much longer in downstream sites, especially in stream sediments and biofilms. We showed that the release of treated water maintains significantly elevated concentrations of multiple antibiotics in the stream for a significant distance downstream of release. The very effective removal of ARG gene signatures by Charlotte Water’s treatment process suggests that even though the influent, and the interior of the plant itself, is a diverse hothouse of pathogens and antibiotic resistance, those elements escaping the plant is not likely to be the main mechanism of treated water impact on downstream microbial ecology [63]. Only a small number of recognizable ARGs pass through the water treatment process to end up at detectable levels in the streams. This is not uniformly true in modern water treatment systems, as demonstrated in another recent study [33], and concentrations of specific resistance elements can vary between global processes, as shown from a 2011 study [64]. Rather, we now hypothesize that the persistently elevated concentration of antibiotics downstream of treated water release may be creating its own microenvironment, and that this will impact the function of stream sediment communities and their capacity to provide ecosystem services. Chlorination has been previously shown to be ineffective at ARG removal [65]; however, it is possible that increasing UV treatment intensity and/or exposure time could further reduce dissemination of many ARGs with minimal changes to existing infrastructure [66]. Antibiotic dissemination can potentially be reduced by microfiltration, but these methods are not yet widely implemented and can be potentially costly to use [67]. Surface waters in areas devoid of anthropogenic involvement are known to lack most antibiotic resistance markers, including many mobile elements [68,69]; however, some resistance factors do emerge naturally through the process of recombination and mutation [68], and the conditions with the potential to exacerbate this process do exist in Charlotte’s urban streams [70]. Given the tendency of environmental resistance factors to be passed to clinical pathogens [71,72], further study of the impact of maintaining permanent low concentrations of antibiotics in the stream, in the presence of resistance elements from wastewater or environmental sources, is critical for understanding how we can improve water treatment to safeguard both the ecosystem and human health.

Supplementary Materials

The following are available at: https://www.mdpi.com/2073-4441/10/11/1539/s1. NGS datasets created in this study are deposited in the SRA, accession number SRP121672, and scripts are available from GitHub at https://github.com/NCUrbanMicrobiomeProject/InitialStudy. Additional statistical comparisons between sampling sites are available from FigShare as noted in Supplementary Materials. (Table S1) Genera higher in relative abundance in downstream locations also present in at least two wastewater treatment plant locations at a relative abundance of greater than 0.1%. (Figure S1) Concentrations of each antibiotic compound for each sampling location, showing the mean and standard deviation across all four timepoints. (Figure S2) Shared taxa between both plants. (Figure S3) Shared taxa between sample types. (Figure S4) Shannon diversity and Bray-Curtis Beta diversity of all shotgun sample replicates. (Figure S5) Species-level taxonomic classification of differentially abundant clades between sampling locations. (Figure S6) Relative abundance values for antibiotic resistance genes. (Figure S7) Significant differences in antibiotic concentrations between sample site, waterway, and timepoint. (Figure S8) Significant differences in taxa from shotgun sequence analysis between sample site, waterway, and timepoint. (Figure S9) Significant differences between ARGs in collection sites with regards to timepoint, waterway, sample site, and combinations of sample site/timepoint and waterways are shown. Each colored box indicates a significant relative abundance difference between the corresponding sites shown on the x-axis, and the significant resistance term on the y-axis. (File S1) Adjustment values for antibiotic detection and quantification limits. (File S2) Complete linear model statistical results from mass spectrometry data. (File S3) Complete linear model statistical results from shotgun taxonomic classification. (File S4) Complete statistical results from mass spectrometry linear models. (File S5) Standard curve calculations for commercial antibiotic standards. (File S6) Relative abundance values for shotgun taxonomic classification at the genus level.

Author Contributions

K.L., S.S., O.K., S.C., M.R., and C.G. designed the experiment. A.F. and M.T. designed the statistical models, and A.F., M.T., J.J., K.L., and A.L. performed statistical analyses. O.W., A.A.-S., and A.L. conducted antibiotic resistance gene analyses. K.L., A.L., and M.T. performed taxonomic classification. K.L. and C.G. wrote the manuscript with input from all authors.

Funding

This research received no external funding.

Acknowledgments

The authors would like to thank Steven Blanchard (University of North Carolina at Charlotte, UNCC) for assistance troubleshooting scripts and cluster jobs, Douglas A. Shoemaker (UNCC Center for Applied GIS) for assistance in producing geographical maps, Raad Gharaibeh (University of Florida College of Medicine) for advice in establishing our metagenomic pipeline, Jennifer Gibas for the graph axis illustration, Michael Sioda for initializing the metagenomics analysis, and Alicia Sorgen, Taylor Jones, and Kristen Smith for assistance with sample preparation and collection (UNCC). We are grateful to Meredith Bostrom and Randy Crowell of the David H. Murdock Research Institute for sequencing services, Kevin Knagge and Huiyuan Chen for mass spectrometry services (David H. Murdock Research Institute), as well as the technical support and access from Charlotte Water that made this work possible. Research was supported by the UNCC Department of Bioinformatics and Genomics.

Conflicts of Interest

The authors declare no conflict of interest.

References

  1. Walsh, C.J.; Roy, A.H.; Feminella, J.W.; Cottingham, P.D.; Groffman, P.M.; Morgan, R.P., II. The urban stream syndrome: Current knowledge and the search for a cure. J. N. Am. Benthol. Soc. 2005, 24, 706–723. [Google Scholar] [CrossRef]
  2. Yu, S.; Wu, Q.; Li, Q.; Gao, J.; Lin, Q.; Ma, J.; Xu, Q.; Wu, S. Anthropogenic land uses elevate metal levels in stream water in an urbanizing watershed. Sci. Total Environ. 2014, 488–489, 61–69. [Google Scholar] [CrossRef] [PubMed]
  3. Fisher, J.C.; Newton, R.J.; Dila, D.K.; McLellan, S.L. Urban microbial ecology of a freshwater estuary of Lake Michigan. Elementa 2015, 3, 000064. [Google Scholar] [CrossRef] [PubMed]
  4. Qu, X.; Ren, Z.; Zhang, H.; Zhang, M.; Zhang, Y.; Liu, X.; Peng, W. Influences of anthropogenic land use on microbial community structure and functional potentials of stream benthic biofilms. Sci. Rep. 2017, 7, 15117. [Google Scholar] [CrossRef] [PubMed] [Green Version]
  5. Newton, R.J.; McLellan, S.L. A unique assemblage of cosmopolitan freshwater bacteria and higher community diversity differentiate an urbanized estuary from oligotrophic Lake Michigan. Front. Microbiol. 2015, 6, 1028. [Google Scholar] [CrossRef] [PubMed]
  6. McLellan, S.L.; Fisher, J.C.; Newton, R.J. The microbiome of urban waters. Int. Microbiol. 2015, 18, 141–149. [Google Scholar] [PubMed]
  7. Kasprzyk-Hordern, B.; Dinsdale, R.M.; Guwy, A.J. The removal of pharmaceuticals, personal care products, endocrine disruptors and illicit drugs during wastewater treatment and its impact on the quality of receiving waters. Water Res. 2009, 43, 363–380. [Google Scholar] [CrossRef] [PubMed]
  8. Niemuth, N.J.; Jordan, R.; Crago, J.; Blanksma, C.; Johnson, R.; Klaper, R.D. Metformin exposure at environmentally relevant concentrations causes potential endocrine disruption in adult male fish. Environ. Toxicol. Chem. 2015, 34, 291–296. [Google Scholar] [CrossRef] [PubMed]
  9. Conley, J.M.; Evans, N.; Mash, H.; Rosenblum, L.; Schenck, K.; Glassmeyer, S.; Furlong, E.T.; Kolpin, D.W.; Wilson, V.S. Comparison of in vitro estrogenic activity and estrogen concentrations in source and treated waters from 25 U.S. Drinking water treatment plants. Sci. Total Environ. 2017, 579, 1610–1617. [Google Scholar] [CrossRef] [PubMed]
  10. Beresford, N.; Baynes, A.; Kanda, R.; Mills, M.R.; Arias-Salazar, K.; Collins, T.J.; Jobling, S. Use of a battery of chemical and ecotoxicological methods for the assessment of the efficacy of wastewater treatment processes to remove estrogenic potency. J. Vis. Exp. 2016, 54243. [Google Scholar] [CrossRef] [PubMed]
  11. Zhang, Y.; Zhang, T.; Guo, C.; Lv, J.; Hua, Z.; Hou, S.; Zhang, Y.; Meng, W.; Xu, J. Drugs of abuse and their metabolites in the urban rivers of Beijing, China: Occurrence, distribution, and potential environmental risk. Sci. Total Environ. 2017, 579, 305–313. [Google Scholar] [CrossRef] [PubMed]
  12. Li, N.; Sheng, G.P.; Lu, Y.Z.; Zeng, R.J.; Yu, H.Q. Removal of antibiotic resistance genes from wastewater treatment plant effluent by coagulation. Water Res. 2017, 111, 204–212. [Google Scholar] [CrossRef] [PubMed]
  13. Prasse, C.; Schlüsener, M.P.; Schulz, R.; Ternes, T.A. Antiviral drugs in wastewater and surface waters: A new pharmaceutical class of environmental relevance? Environ. Sci. Technol. 2010, 44, 1728–1735. [Google Scholar] [CrossRef] [PubMed]
  14. He, K.; Soares, A.D.; Adejumo, H.; McDiarmid, M.; Squibb, K.; Blaney, L. Detection of a wide variety of human and veterinary fluoroquinolone antibiotics in municipal wastewater and wastewater-impacted surface water. J. Pharm. Biomed. Anal. 2015, 106, 136–143. [Google Scholar] [CrossRef] [PubMed]
  15. Andersson, D.I.; Hughes, D. Evolution of antibiotic resistance at non-lethal drug concentrations. Drug Resist. Updates 2012, 15, 162–172. [Google Scholar] [CrossRef] [PubMed]
  16. Hughes, D.; Andersson, D.I. Selection of resistance at lethal and non-lethal antibiotic concentrations. Curr. Opin. Microbiol. 2012, 15, 555–560. [Google Scholar] [CrossRef] [PubMed]
  17. Ma, L.; Xia, Y.; Li, B.; Yang, Y.; Li, L.-G.; Tiedje, J.M.; Zhang, T. Metagenomic assembly reveals hosts of antibiotic resistance genes and the shared resistome in pig, chicken, and human feces. Environ. Sci. Technol. 2016, 50, 420–427. [Google Scholar] [CrossRef] [PubMed]
  18. Call, D.R.; Matthews, L.; Subbiah, M.; Liu, J. Do antibiotic residues in soils play a role in amplification and transmission of antibiotic resistant bacteria in cattle populations? Front. Microbiol. 2013, 4, 193. [Google Scholar] [CrossRef] [PubMed]
  19. Wang, F.-H.; Qiao, M.; Su, J.-Q.; Chen, Z.; Zhou, X.; Zhu, Y.-G. High throughput profiling of antibiotic resistance genes in urban park soils with reclaimed water irrigation. Environ. Sci. Technol. 2014, 48, 9079–9085. [Google Scholar] [CrossRef] [PubMed]
  20. Fahrenfeld, N.; Ma, Y.; O’Brien, M.; Pruden, A. Reclaimed water as a reservoir of antibiotic resistance genes: Distribution system and irrigation implications. Front. Microbiol. 2013, 4, 130. [Google Scholar] [CrossRef] [PubMed]
  21. Pruden, A. Balancing water sustainability and public health goals in the face of growing concerns about antibiotic resistance. Environ. Sci. Technol. 2014, 48, 5–14. [Google Scholar] [CrossRef] [PubMed]
  22. Pehrsson, E.C.; Tsukayama, P.; Patel, S.; Mejia-Bautista, M.; Sosa-Soto, G.; Navarrete, K.M.; Calderon, M.; Cabrera, L.; Hoyos-Arango, W.; Bertoli, M.T.; et al. Interconnected microbiomes and resistomes in low-income human habitats. Nature 2016, 533, 212–216. [Google Scholar] [CrossRef] [PubMed] [Green Version]
  23. LaPara, T.M.; Burch, T.R.; McNamara, P.J.; Tan, D.T.; Yan, M.; Eichmiller, J.J. Tertiary-treated municipal wastewater is a significant point source of antibiotic resistance genes into duluth-superior harbor. Environ. Sci. Technol. 2011, 45, 9543–9549. [Google Scholar] [CrossRef] [PubMed]
  24. Munck, C.; Albertsen, M.; Telke, A.; Ellabaan, M.; Nielsen, P.H.; Sommer, M.O. Limited dissemination of the wastewater treatment plant core resistome. Nat. Commun. 2015, 6, 8452. [Google Scholar] [CrossRef] [PubMed] [Green Version]
  25. Christgen, B.; Yang, Y.; Ahammad, S.Z.; Li, B.; Rodriquez, D.C.; Zhang, T.; Graham, D.W. Metagenomics shows that low-energy anaerobic–aerobic treatment reactors reduce antibiotic resistance gene levels from domestic wastewater. Environ. Sci. Technol. 2015, 49, 2577–2584. [Google Scholar] [CrossRef] [PubMed]
  26. Segata, N.; Waldron, L.; Ballarini, A.; Narasimhan, V.; Jousson, O.; Huttenhower, C. Metagenomic microbial community profiling using unique clade-specific marker genes. Nat. Methods 2012, 9, 811–814. [Google Scholar] [CrossRef] [PubMed] [Green Version]
  27. R Department Core Team. R: A Language and Environment for Statistical Computing; The R Foundation for Statistical Computing: Vienna, Austria, 2017. [Google Scholar]
  28. Wickham, H. Ggplot2: Elegant Graphics for Data Analysis; Springer: New York, NY, USA, 2009. [Google Scholar]
  29. Kaminski, J.; Gibson, M.K.; Franzosa, E.A.; Segata, N.; Dantas, G.; Huttenhower, C. High-specificity targeted functional profiling in microbial communities with shortbred. PLoS Comput. Biol. 2015, 11, e1004557. [Google Scholar] [CrossRef] [PubMed]
  30. McArthur, A.G.; Waglechner, N.; Nizam, F.; Yan, A.; Azad, M.A.; Baylay, A.J.; Bhullar, K.; Canova, M.J.; De Pascale, G.; Ejim, L.; et al. The comprehensive antibiotic resistance database. Antimicrob. Agents Chemother. 2013, 57, 3348–3357. [Google Scholar] [CrossRef] [PubMed]
  31. Suzek, B.E.; Wang, Y.; Huang, H.; McGarvey, P.B.; Wu, C.H.; the UniProt, C. Uniref clusters: A comprehensive and scalable alternative for improving sequence similarity searches. Bioinformatics 2015, 31, 926–932. [Google Scholar] [CrossRef] [PubMed]
  32. Benjamini, Y.; Hochberg, Y. Controlling the false discovery rate—A practical and powerful approach to multiple testing. J. R. Stat. Soc. Ser. B Methodol. 1995, 57, 289–300. [Google Scholar]
  33. Wang, M.; Shen, W.; Yan, L.; Wang, X.H.; Xu, H. Stepwise impact of urban wastewater treatment on the bacterial community structure, antibiotic contents, and prevalence of antimicrobial resistance. Environ. Pollut. 2017, 231, 1578–7585. [Google Scholar] [CrossRef] [PubMed]
  34. Aubertheau, E.; Stalder, T.; Mondamert, L.; Ploy, M.C.; Dagot, C.; Labanowski, J. Impact of wastewater treatment plant discharge on the contamination of river biofilms by pharmaceuticals and antibiotic resistance. Sci. Total Environ. 2017, 579, 1387–1398. [Google Scholar] [CrossRef] [PubMed]
  35. Zhang, J.; Yang, Y.; Zhao, L.; Li, Y.; Xie, S.; Liu, Y. Distribution of sediment bacterial and archaeal communities in plateau freshwater lakes. Appl. Microbiol. Biotechnol. 2015, 99, 3291–3302. [Google Scholar] [CrossRef] [PubMed]
  36. Yang, C.; Zhang, W.; Liu, R.; Li, Q.; Li, B.; Wang, S.; Song, C.; Qiao, C.; Mulchandani, A. Phylogenetic diversity and metabolic potential of activated sludge microbial communities in full-scale wastewater treatment plants. Environ. Sci. Technol. 2011, 45, 7408–7415. [Google Scholar] [CrossRef] [PubMed]
  37. McLellan, S.L.; Huse, S.M.; Mueller-Spitz, S.R.; Andreishcheva, E.N.; Sogin, M.L. Diversity and population structure of sewage-derived microorganisms in wastewater treatment plant influent. Environ. Microbiol. 2010, 12, 378–392. [Google Scholar] [CrossRef] [PubMed] [Green Version]
  38. MacRae, J.D.; Smit, J. Characterization of caulobacters isolated from wastewater treatment systems. Appl. Environ. Microbiol. 1991, 57, 751–758. [Google Scholar] [PubMed]
  39. Lücker, S.; Wagner, M.; Maixner, F.; Pelletier, E.; Koch, H.; Vacherie, B.; Rattei, T.; Damsté, J.S.S.; Spieck, E.; Le Paslier, D.; et al. A metagenome illuminates the physiology and evolution of globally important nitrite-oxidizing bacteria. Proc. Nat. Acad. Sci. USA 2010, 107, 13479. [Google Scholar] [CrossRef] [PubMed]
  40. Kim, M.K.; Choi, K.M.; Yin, C.R.; Lee, K.Y.; Im, W.T.; Lim, J.H.; Lee, S.T. Odorous swine wastewater treatment by purple non-sulfur bacteria, Rhodopseudomonas palustris, isolated from eutrophicated ponds. Biotechnol. Lett. 2004, 26, 819–822. [Google Scholar] [CrossRef] [PubMed]
  41. Gonzalez-Martinez, A.; Sihvonen, M.; Muñoz-Palazon, B.; Rodriguez-Sanchez, A.; Mikola, A.; Vahala, R. Microbial ecology of full-scale wastewater treatment systems in the polar arctic circle: Archaea, bacteria and fungi. Sci. Rep. 2018, 8, 2208. [Google Scholar] [CrossRef] [PubMed]
  42. Saunders, A.M.; Albertsen, M.; Vollertsen, J.; Nielsen, P.H. The activated sludge ecosystem contains a core community of abundant organisms. ISME J 2016, 10, 11–20. [Google Scholar] [CrossRef] [PubMed]
  43. Balcom, I.N.; Driscoll, H.; Vincent, J.; Leduc, M. Metagenomic analysis of an ecological wastewater treatment plant’s microbial communities and their potential to metabolize pharmaceuticals. F1000Research 2016, 5, 1881. [Google Scholar] [CrossRef] [PubMed] [Green Version]
  44. Medhi, K.; Thakur, I.S. Bioremoval of nutrients from wastewater by a denitrifier paracoccus denitrificans istod1. Bioresour. Technol. Rep. 2018, 1, 56–60. [Google Scholar] [CrossRef]
  45. Pagnier, I.; Croce, O.; Robert, C.; Raoult, D.; La Scola, B. Genome sequence of Reyranella massiliensis, a bacterium associated with amoebae. J. Bacteriol. 2012, 194, 5698. [Google Scholar] [CrossRef] [PubMed]
  46. Pehl, M.J.; Jamieson, W.D.; Kong, K.; Forbester, J.L.; Fredendall, R.J.; Gregory, G.A.; McFarland, J.E.; Healy, J.M.; Orwin, P.M. Genes that influence swarming motility and biofilm formation in Variovorax paradoxus eps. PLoS ONE 2012, 7, e31832. [Google Scholar] [CrossRef] [PubMed]
  47. Kampfer, P.; Witzenberger, R.; Denner, E.B.; Busse, H.J.; Neef, A. Sphingopyxis witflariensis sp. Nov., isolated from activated sludge. Int. J. Syst. Evol. Microbiol. 2002, 52, 2029–2034. [Google Scholar] [PubMed]
  48. Zielinska, M.; Rusanowska, P.; Jarzabek, J.; Nielsen, J.L. Community dynamics of denitrifying bacteria in full-scale wastewater treatment plants. Environ. Technol. 2016, 37, 2358–2367. [Google Scholar] [CrossRef] [PubMed]
  49. Cai, L.; Ju, F.; Zhang, T. Tracking human sewage microbiome in a municipal wastewater treatment plant. Appl. Microbiol. Biotechnol. 2014, 98, 3317–3326. [Google Scholar] [CrossRef] [PubMed]
  50. Jiang, K.; Sanseverino, J.; Chauhan, A.; Lucas, S.; Copeland, A.; Lapidus, A.; Del Rio, T.G.; Dalin, E.; Tice, H.; Bruce, D.; et al. Complete genome sequence of Thauera aminoaromatica strain mz1t. Stand. Genom. Sci. 2012, 6, 325–335. [Google Scholar] [CrossRef] [PubMed]
  51. Al Atrouni, A.; Joly-Guillou, M.L.; Hamze, M.; Kempf, M. Reservoirs of non-baumannii acinetobacter species. Front. Microbiol. 2016, 7, 49. [Google Scholar] [CrossRef] [PubMed]
  52. Chagas, T.P.; Seki, L.M.; Cury, J.C.; Oliveira, J.A.; Davila, A.M.; Silva, D.M.; Asensi, M.D. Multiresistance, beta-lactamase-encoding genes and bacterial diversity in hospital wastewater in rio de janeiro, brazil. J. Appl. Microbiol. 2011, 111, 572–581. [Google Scholar] [CrossRef] [PubMed]
  53. Carr, E.L.; Eales, K.L.; Seviour, R.J. Substrate uptake by Gordonia amarae in activated sludge foams by fish-mar. Water Sci. Technol. 2006, 54, 39–45. [Google Scholar] [CrossRef] [PubMed]
  54. Hanada, S.; Liu, W.T.; Shintani, T.; Kamagata, Y.; Nakamura, K. Tetrasphaera elongata sp. Nov., a polyphosphate-accumulating bacterium isolated from activated sludge. Int. J. Syst. Evol. Microbiol. 2002, 52, 883–887. [Google Scholar] [PubMed]
  55. Zhang, B.; Xu, X.; Zhu, L. Structure and function of the microbial consortia of activated sludge in typical municipal wastewater treatment plants in winter. Sci. Rep. 2017, 7, 17930. [Google Scholar] [CrossRef] [PubMed] [Green Version]
  56. Abubucker, S.; Segata, N.; Goll, J.; Schubert, A.M.; Izard, J.; Cantarel, B.L.; Rodriguez-Mueller, B.; Zucker, J.; Thiagarajan, M.; Henrissat, B.; et al. Metabolic reconstruction for metagenomic data and its application to the human microbiome. PLoS Comput. Biol. 2012, 8, e1002358. [Google Scholar] [CrossRef] [PubMed] [Green Version]
  57. Caspi, R.; Altman, T.; Billington, R.; Dreher, K.; Foerster, H.; Fulcher, C.A.; Holland, T.A.; Keseler, I.M.; Kothari, A.; Kubo, A.; et al. The metacyc database of metabolic pathways and enzymes and the biocyc collection of pathway/genome databases. Nucleic Acids Res. 2014, 42, D459–D471. [Google Scholar] [CrossRef] [PubMed]
  58. Andersson, D.I.; Hughes, D. Microbiological effects of sublethal levels of antibiotics. Nat. Rev. Microbiol. 2014, 12, 465–478. [Google Scholar] [CrossRef] [PubMed]
  59. Kolpin, D.W.; Furlong, E.T.; Meyer, M.T.; Thurman, E.M.; Zaugg, S.D.; Barber, L.B.; Buxton, H.T. Pharmaceuticals, hormones, and other organic wastewater contaminants in U.S. Streams, 1999–2000: A national reconnaissance. Environ. Sci. Technol. 2002, 36, 1202–1211. [Google Scholar] [CrossRef] [PubMed]
  60. Rodriguez-Rojas, A.; Rodriguez-Beltran, J.; Couce, A.; Blazquez, J. Antibiotics and antibiotic resistance: A bitter fight against evolution. Int. J. Med. Microbiol. 2013, 303, 293–297. [Google Scholar] [CrossRef] [PubMed]
  61. Newton, R.J.; McLellan, S.L.; Dila, D.K.; Vineis, J.H.; Morrison, H.G.; Eren, A.M.; Sogin, M.L. Sewage reflects the microbiomes of human populations. MBio 2015, 6, e02574. [Google Scholar] [CrossRef] [PubMed]
  62. Yoon, Y.; Chung, H.J.; Wen Di, D.Y.; Dodd, M.C.; Hur, H.G.; Lee, Y. Inactivation efficiency of plasmid-encoded antibiotic resistance genes during water treatment with chlorine, uv, and uv/h2o2. Water Res. 2017, 123, 783–793. [Google Scholar] [CrossRef] [PubMed]
  63. Laquaz, M.; Dagot, C.; Bazin, C.; Bastide, T.; Gaschet, M.; Ploy, M.C.; Perrodin, Y. Ecotoxicity and antibiotic resistance of a mixture of hospital and urban sewage in a wastewater treatment plant. Environ. Sci. Pollut. Res. Int. 2017, 25, 9243–9253. [Google Scholar] [CrossRef] [PubMed]
  64. Zhang, X.X.; Zhang, T. Occurrence, abundance, and diversity of tetracycline resistance genes in 15 sewage treatment plants across china and other global locations. Environ. Sci. Technol. 2011, 45, 2598–2604. [Google Scholar] [CrossRef] [PubMed]
  65. Yuan, Q.B.; Guo, M.T.; Yang, J. Fate of antibiotic resistant bacteria and genes during wastewater chlorination: Implication for antibiotic resistance control. PLoS ONE 2015, 10, e0119403. [Google Scholar] [CrossRef] [PubMed]
  66. Calero-Caceres, W.; Muniesa, M. Persistence of naturally occurring antibiotic resistance genes in the bacteria and bacteriophage fractions of wastewater. Water Res. 2016, 95, 11–18. [Google Scholar] [CrossRef] [PubMed]
  67. Watkinson, A.J.; Murby, E.J.; Costanzo, S.D. Removal of antibiotics in conventional and advanced wastewater treatment: Implications for environmental discharge and wastewater recycling. Water Res. 2007, 41, 4164–4176. [Google Scholar] [CrossRef] [PubMed]
  68. Chen, B.; Yuan, K.; Chen, X.; Yang, Y.; Zhang, T.; Wang, Y.; Luan, T.; Zou, S.; Li, X. Metagenomic analysis revealing antibiotic resistance genes (args) and their genetic compartments in the Tibetan environment. Environ. Sci. Technol. 2016, 50, 6670–6679. [Google Scholar] [CrossRef] [PubMed]
  69. Pawlowski, A.C.; Wang, W.; Koteva, K.; Barton, H.A.; McArthur, A.G.; Wright, G.D. A diverse intrinsic antibiotic resistome from a cave bacterium. Nat. Commun. 2016, 7, 13803. [Google Scholar] [CrossRef] [PubMed] [Green Version]
  70. Li, B.; Ju, F.; Cai, L.; Zhang, T. Profile and fate of bacterial pathogens in sewage treatment plants revealed by high-throughput metagenomic approach. Environ. Sci. Technol. 2015, 49, 10492–10502. [Google Scholar] [CrossRef] [PubMed]
  71. Forsberg, K.J.; Reyes, A.; Wang, B.; Selleck, E.M.; Sommer, M.O.A.; Dantas, G. The shared antibiotic resistome of soil bacteria and human pathogens. Science 2012, 337, 1107–1111. [Google Scholar] [CrossRef] [PubMed]
  72. Alam, M.Z.; Aqil, F.; Ahmad, I.; Ahmad, S. Incidence and transferability of antibiotic resistance in the enteric bacteria isolated from hospital wastewater. Braz. J. Microbiol. 2013, 44, 799–806. [Google Scholar] [CrossRef] [PubMed] [Green Version]
Figure 1. Geographical illustration of sampling sites and locations. Mountain samples were collected in Caldwell (Mountain A) and Yancey (Mountain B) counties, while both Uwharrie forest samples were collected in Stanly county. Mallard and Sugar Creek facilities and trunklines were all located in Mecklenburg County. Urban locations are marked in grey, while more rural locations are shaded green. Hospital and wastewater treatment plant locations are indicated in relation to sample collection sites, which are denoted with green triangles.
Water 10 01539 g001
Figure 2. Summary of the wastewater treatment process in Charlotte facilities. Untreated wastewater from trunkline locations, including hospital and residential wastes, collects into the main influent trunkline before entry into the treatment plant. The primary clarification tank is the first stage in treatment, removing physical debris and solids. The aeration tank assists in removing oils and hydrocarbons before a final physical precipitation in the final clarifier. Solids are collected in both the primary and final clarifier tanks for reuse. Effluent from the final clarifier is sterilized in an ultraviolet treatment tank before discharge into environmental streams.
Water 10 01539 g002
Figure 3. Antibiotic concentrations for each sampling site. Concentrations for all ten antibiotic compounds, reported in ng/L, were averaged across all four time points for each sampling location and treatment plant. Standard deviations are reported within each concentration bar. Rural sites are shown in red for comparison to urban wastewater, with Mallard and Little Sugar Creek sites in green and blue colors, respectively. Primary clarifier influent (PCI) is reported for Mallard Creek only, and UV is only reported for the Sugar Creek facility, as described in Methods.
Water 10 01539 g003
Figure 4. Relative abundance of phyla in collection sites for shotgun sequence data. Abundance values calculated from normalized reads per kilobase per million mapped reads (RPKM) counts at the phylum level are shown for all sampling locations in time point 1, including detected viral load. Phyla that are <1% of the total abundance are combined into the “Other” category. These abundances are representative of the remaining three timepoints, as variability was limited with respect to season.
Water 10 01539 g004
Figure 5. Phylum Shannon diversity for all four collection time points, sample types, and sampling locations is shown, with the mean and standard deviation for each (ac). A color gradient denotes different samples, while shapes indicate location.
Water 10 01539 g005
Figure 6. Alpha and beta diversities from shotgun sequencing. PCoA ordination at the genus level for all time points with PC1 and PC2 components. Data are clustered and colored by stream vs. wastewater samples (a), stream samples only (b), and wastewater samples only (c). Raw, unprocessed wastewater samples cluster together, while streams and processed wastewater (ATE+) have similar clustering patterns. Rural locations cluster with background urban streams, and the greatest separation between samples appears to be driven most by treatment type.
Water 10 01539 g006
Figure 7. Abundance and differential abundance of antibiotic resistance genes. (a) The average number of antibiotic resistance-associated genetic elements across all four time points are reported in RPKM for each different site and each treatment plant. Standard deviations are shown within each bar. Rural sites are displayed in red, with Mallard and Little Sugar Creek sites in green and blue respectively. PCI is exclusive to Mallard, while UV is only in the Sugar Creek facility as denoted in Methods. (b) Relative abundance of antibiotic resistance elements. The top 40 average antibiotic resistance genes across all sampling timepoints with an average normalized RPKM of 10 or above are shown for each sampling site. Colored dots indicate common resistance mechanisms conferred by groups of similar resistance genes.
Water 10 01539 g007aWater 10 01539 g007b
Table 1. Taxa of significant differential abundance between wastewater treatment stages and stream sites. The sampling location containing a higher percent abundance of the listed taxa is shown in the “Higher Abundance” column, and the Bonferroni-corrected p value resulting from the mixed linear models is also shown.
Taxap ValueHigher Abundance
Peptostreptococcaceae0.0039Downstream to Upstream
Afipia0.0093Downstream to Upstream
Holospora0.0039Downstream to Upstream
Azoarcus0.0114Downstream to Upstream
Acinetobacter0.013Downstream to Upstream
Bppunalikevirus0.0093Downstream to Upstream
Yualikevirus0.0096Downstream to Upstream
Sphingobium0.01Rural to Upstream
Kocuria rhizophila0.0318Residential to Hospital
Nitrospira defluvii0.0216ATE to PCI
Caulobacter sp.0.0058ATE to PCI
Afipia clevelandensis0.0048ATE to PCI
Rhodopseudomonas paulustris0.012ATE to PCI
Hyphomicrobium denitrificans0.0114ATE to PCI
Mesorhizobium sp.0.0183ATE to PCI
Paracoccus sp.0.0439ATE to PCI
Reyranella massiliensis0.0111ATE to PCI
Sphingobium xenophagum0.0184ATE to PCI
Sphingopyxis sp.0.0003ATE to PCI
Alicycliphilus sp.0.0004ATE to PCI
Limnohabitans sp.0.0005ATE to PCI
Polaromonas sp.0.0003ATE to PCI
Variovorax sp.0.0014ATE to PCI
Azoarcus sp.0.0006ATE to PCI
Dechloromonas sp.0.011ATE to PCI
Methyloversatilis sp.0.0008ATE to PCI
Thauera aminoaromatica0.0212ATE to PCI
Actinobacter parvas0.025ATE to PCI
Turneriella parva0.0058ATE to PCI
Methanobrevibacter sp.0.0357ATE to PCI
Gordonia amarae0.0476ATE to PCI
Tetrasphera elongata0.0218ATE to PCI
Rhodococcus0.0409Downstream to FCE
Actinobacterium sp.0.0116Downstream to FCE
Polynucleobacter necessarius0.00000007Downstream to FCE
Limnohabitans0.00000007Downstream to FCE
Methylotenera0.0404Downstream to FCE
Bppunalikevirus0.0132Downstream to FCE
Yualikevirus0.0266Downstream to FCE
Table 2. Metabolic pathways significantly enriched in up or downstream locations. Significant MetaCyc functional pathways from HUMAnN are shown, along with their corresponding p values and whether they were enriched upstream or downstream of treatment plant effluent release.
MetaCyc Pathwayp-ValueHighest Abundance
PWY-5747 2-methylcitrate cycle II0.009Upstream
PWY-5659 GDP-mannose biosynthesis0.010Upstream
PWY0-42 2-methylcitrate cycle I0.010Upstream
GLYCOGENSYNTH-PWY glycogen biosynthesis I from ADP-d-Glucose0.042Upstream
ILEUSYN-PWY L-isoleucine biosynthesis I from threonine0.042Upstream
PWY-5109 2-methylbutanoate biosynthesis0.042Downstream
PWY-5973 cis-vaccenate biosynthesis0.042Upstream
PWY-6606 guanosine nucleotides degradation II0.042Upstream
PWY-6609 adenine and adenosine salvage III0.042Upstream
PWY-7111 pyruvate fermentation to isobutanol engineered0.042Upstream
PWY-7198 pyrimidine deoxyribonucleotides de novo biosynthesis IV0.042Upstream
PWY-7199 pyrimidine deoxyribonucleosides salvage0.042Upstream
PWY-7208 superpathway of pyrimidine nucleobases salvage0.042Upstream
PWY-7210 pyrimidine deoxyribonucleotides biosynthesis from CTP0.042Upstream
PWY-7211 superpathway of pyrimidine deoxyribonucleotides de novo biosynthesis0.042Upstream
PWY-7663 gondoate biosynthesis anaerobic0.042Upstream
SALVADEHYPOX-PWY adenosine nucleotides degradation II0.042Upstream
UNINTEGRATED0.042Upstream
UNMAPPED0.042Downstream
VALSYN-PWY L-valine biosynthesis0.042Upstream
PWY-3781 aerobic respiration I cytochrome c0.042Upstream
PWY0-1261 anhydromuropeptides recycling0.042Upstream
GLUTORN-PWY L-ornithine biosynthesis0.045Upstream
PWY-6608 guanosine nucleotides degradation III0.045Upstream

