Multi-Criteria Evaluation for China Low-Impact Development Based on Principal Component Analysis

1
State Key Joint Laboratory of Environment Simulation and Pollution Control, School of Environment, Tsinghua University, Beijing 100084, China
2
Department of Planning, Dalian Zhen He Architectural Design Co., Ltd., Dalian 116011, China
3
Department of Environmental Engineering, Beijing WALD Eco-Environment Technology Co. Ltd., Beijing 102200, China
*
Author to whom correspondence should be addressed.
Water 2018, 10(11), 1547; https://doi.org/10.3390/w10111547
Submission received: 1 September 2018
/
Revised: 21 October 2018
/
Accepted: 26 October 2018
/
Published: 30 October 2018
(This article belongs to the Special Issue Stormwater Quality: Modelling, Monitoring, Risk Assessment and Remidiation)
Abstract
:Multiple benefit evaluation may become complicated due to varied and unquantifiable indicators. This study presents a multicriteria approach to evaluate Low Impact Development (LID) performance through an aggregation of principal component analysis and correlation analysis (PCCA). The approach is based on the rule of triple bottom line and complies with the China-specific planning land-use type and site-specific hydrologic and hydrologic condition. The quantitative indicators are coupled with the Stormwater Management Model (SWMM) software and filed investigation; the qualitative indicators are valued by a numerical unit system that converts the level of importance to numbers 5, 4, 3, 2 and 1. The results indicate that the PCCA approach could evaluate the LID performance with fewer dimensions of variables based on environmental, economic and social concerns comprehensively. The principal components concentrated on three streams: (1) runoff quantity and quality control; (2) minimize cost and improve robustness; and (3) improve system management and aesthetic enhancement. Taken together, these streams match the objective of sponge city construction with LID techniques. The PCCA approach is a multicriteria decision-aid tool that helps the decision maker choose the appropriate LID technique.
1. Introduction
Rapid urbanization increasing urban impervious areas has led to a series of significant environmental impacts including floods, stormwater runoff pollution, and a shortage of groundwater resources. Stormwater management is a global issue. Different technologies and strategies for stormwater management have been adopted in various countries, such as best management practices (BMPs) in the USA, sustainable urban drainage systems (SUDS) in the United Kingdom (UK), water sensitive urban design (WSUD) in Australia, and low-impact urban design and development (LIUDD) in New Zealand. The United States Environmental Protection Agency (EPA) defines BMPs as any methods that measure or operate programs that reduce or prevent water pollution, including structured and unstructured measures [1]. Since 2013, China proposed to build the sponge city (SPC), which mimic natural processes for stormwater storage, retention, infiltration, purification, utilization, and drainage. In 2014, China issued The Guide of Sponge City Construction Technology—LID Technique [2]. Obviously, LID is a key technique used in China SPC construction. In the guideline, the annual comprehensive runoff coefficient (ACRC) for different districts is a most important index for SPC construction. Although it requires pollution abatement and an increase in stormwater reuse, the requirements are qualitative. Here, LID was defined as a wide range of terms that combine traditional LID, green infrastructure (GI), and BMP concepts [3], rather than a relatively small-scale conventional technique. Meanwhile, the Chinese authority requires the establishment of a relevant index system to control the negative impacts of runoff based on different land-use types of overall planning and control-specific planning [4]. Obviously, the evaluation of LID performance plays a very important role in evaluating SPC efficiency because SPC construction comprising various LID techniques.
According to EPA, the LID emphasizes keeping the hydrology system in its natural state after land development [5]. LID could be also defined as a land development and retrofit strategy because it reduces runoff volume, flow rate, and pollution [6]. According to a 2010 report from the Center for Neighborhood Technology, LID practices offer more than just environmental benefits [7]. LIDs, such as grassed swales and bio-retention areas, are more economic options when compared to enclosed storm drain systems, and they also provide better environmental and economic results. Field et al. [8] thought safety and aesthetics are two community accepted benefits, especially when considering their financial implications. LID provides a wide range of economic and social benefits in addition to environmental benefit. Many case studies in the U.S. recognize the importance of the multiple benefits associated with LID [9].
The selected criteria may vary for different evaluation objectives, according to a review of the extensive literature, expert survey, and database. Several categories have been found to evaluate LID performance based on indicators selection:
- The indicators related to runoff quantity or water quality: such as flood control, peak flow reduction, groundwater reuse, and water reuse; or selected load reduction, pollutant removal, and event mean concentration (EMC) to evaluate BMPs efficiency [10]. The indicators are related to both runoff quantity and water quality related, such as the proposal by Hsieh et al. [11] for infiltration and pollutant removal to evaluate bio-retention. Line et al. [12] selected runoff volume and pollutant to evaluate the effectiveness of LID commercial development.
- The indicators related to environmental, technical and others: for instance, Baptista et al. [6] defined the performance index based on technical, environmental, sanitary and social aspects. Trinkaus [13] emphasized pollutant, impermeable rate, and sub-watershed areas to assess pollutant reduction. Lim et al. [14] argued pollution reduction and costs; The USA International Stormwater BMP Database is mainly concerned with solids suspension, bacteria, nutrients, and metals in the distribution of influent and effluent [15,16,17].
- The indicators related to environmental, economic and social indicators: for instance, Barraud et al. [18] used 27 criteria to evaluate LID/BMPs. The Center for Neighbor Technology (CNT) elaborated the aggregation criterion. It took account of both environmental criteria such as water quality improvement, runoff, gray infrastructure, and flooding reduction, heat island, habitat improvement, as well as some economic indicators such as benefits relating to water, energy, and air. Moreover, social indicators such as community livability, aesthetics, recreation, noise reduction, and public education were also selected. The U.S. Environment Protection Agency (EPA) took water quality, air quality, groundwater recharge, greenhouse emissions reduction, infrastructure reduction, aesthetics, public education, flooding reduction, potential economic growth, and associated costs as criteria to analyze the benefits of LID. Jia et al. [19] selected runoff quantity, water quality control, ecological benefits, cost and maintenance, water reuse, system reliability, site suitability, and aesthetics to set up a multicriteria index system to evaluate and rank LID/BMPs. Qi [20] selected runoff reduction, pollutant control, construction capital, maintenance cost, operation cost, water reuse, landscape function, liability, and stability to evaluate LID efficiency.
This extensive literature review revealed that a multicriteria approach is a good strategy to evaluate the LID performance. The index system related to environmental, economic and social aspects is relatively practical and easy to implement. However, it should be matched to China land-use type, site hydrology and soil specific when used in China because LID applications have a strong relationship with land-use type. Stormwater runoff volume, pollution, and pollution concentrations are highly related to land use and impervious surfaces [21].
The indicators include quantitative and qualitative variables. Quantitative variables can be valued by simulation calculation or site monitoring. For example, runoff flow reduction, pollutant removal could get by the Stormwater Management Model (SWMM), the System for Urban Stormwater Treatment and Analysis Integration Model (SUSTAIN). Guan et al. stimulated runoff by SWMM and compared to observed flow rates to assess LID performance [22]. Qualitative variables can be evaluated by a numerical method converting the relative importance to value.
A comprehensive evaluation will involve five concerns: evaluation objectives, evaluation criterion, the weighting for each criterion, the integrated model, and evaluators. Castro et al. [23] argued that the quality of the evaluation method, the quality of each indicator and the quality of the criteria are set to play a very important role in the critical analysis. The selected criteria should be in accordance with six attributes: accessibility, objectivity, relevance, robustness, sensitivity, and fidelity.
Currently, with SPC practice in China, once the design meets the annual comprehensive runoff coefficient listed in the guideline, it could be looked at as a qualified LID application design. However, how does the LID really work for SPC? What is the most cost-effective option? What are the comprehensive benefits in addition to the environmental aspect? A multi-criteria evaluation for LID performance will help the decision maker choose the best alternative for LID to build SPC.
This study developed an index system based on environmental, economic and social issues, coupling with China-specific land-use type and site-specific hydrologic and hydraulic condition. It is a wide range index system that matches Chinese planning, LID design, and stormwater management.
To comprehensively evaluate the performance of LID based on environmental, economic and social aspects, a variety of methods can be selected, such as The Rank Sum Ration Method (RSR), Technique for Order of Preference by Similarity to Ideal Solution (TOPSIS), Entropy Method, Efficacy Coefficient Method, Principal Component Analysis (PCA), factor analysis, statistics depth function analysis, and cluster analysis [24]. Because LID performance evaluation involves large amount data and PCA has good performance on it, in this paper, the PCA, eigenvector-based multivariate analyses were used to analyze the set of data. In addition, the correlation analysis (CA) was used as a critical analysis tool. The methodology aggregated PCA and CA, named PCCA method, including the following steps.
All potential indicators related to the environment, economy, and society are collected. This involves both quantitative and qualitative indicators. The quantitative indicators could be calculated by SWMM software and field investigation, and the qualitative indicators will convert into 5, 4, 3, 2, or 1 based on the relative importance of LID.
- (a)
- The weight of each criterion should be determined by the relative importance
- (b)
- All data need to be normalized
- (c)
- PCCA analysis
- (d)
- The explanations of the analysis result
Two scenarios are used in this study. The first is a real LID applied project. Each LID performance in this project was evaluated by the multi-criteria approach based on China-specific conditions. The result indicates that PCCA in this case mainly concentrates on three streams: runoff volume control and pollutant abatement; minimize cost and improve system robustness; and improve system management and landscape enhancement. This is a good match for the objectives of LID/SPC construction in China. Another scenario came from the peer article regarding LID performance evaluations. Comparing the results conducted by PCCA approach presented in this paper to the original results by other researcher, a similar level of LID effectiveness can be achieved despite the fewer variables are applied in presented approach. The approach may facilitate the calculation of an evaluation process.
2. Methodology
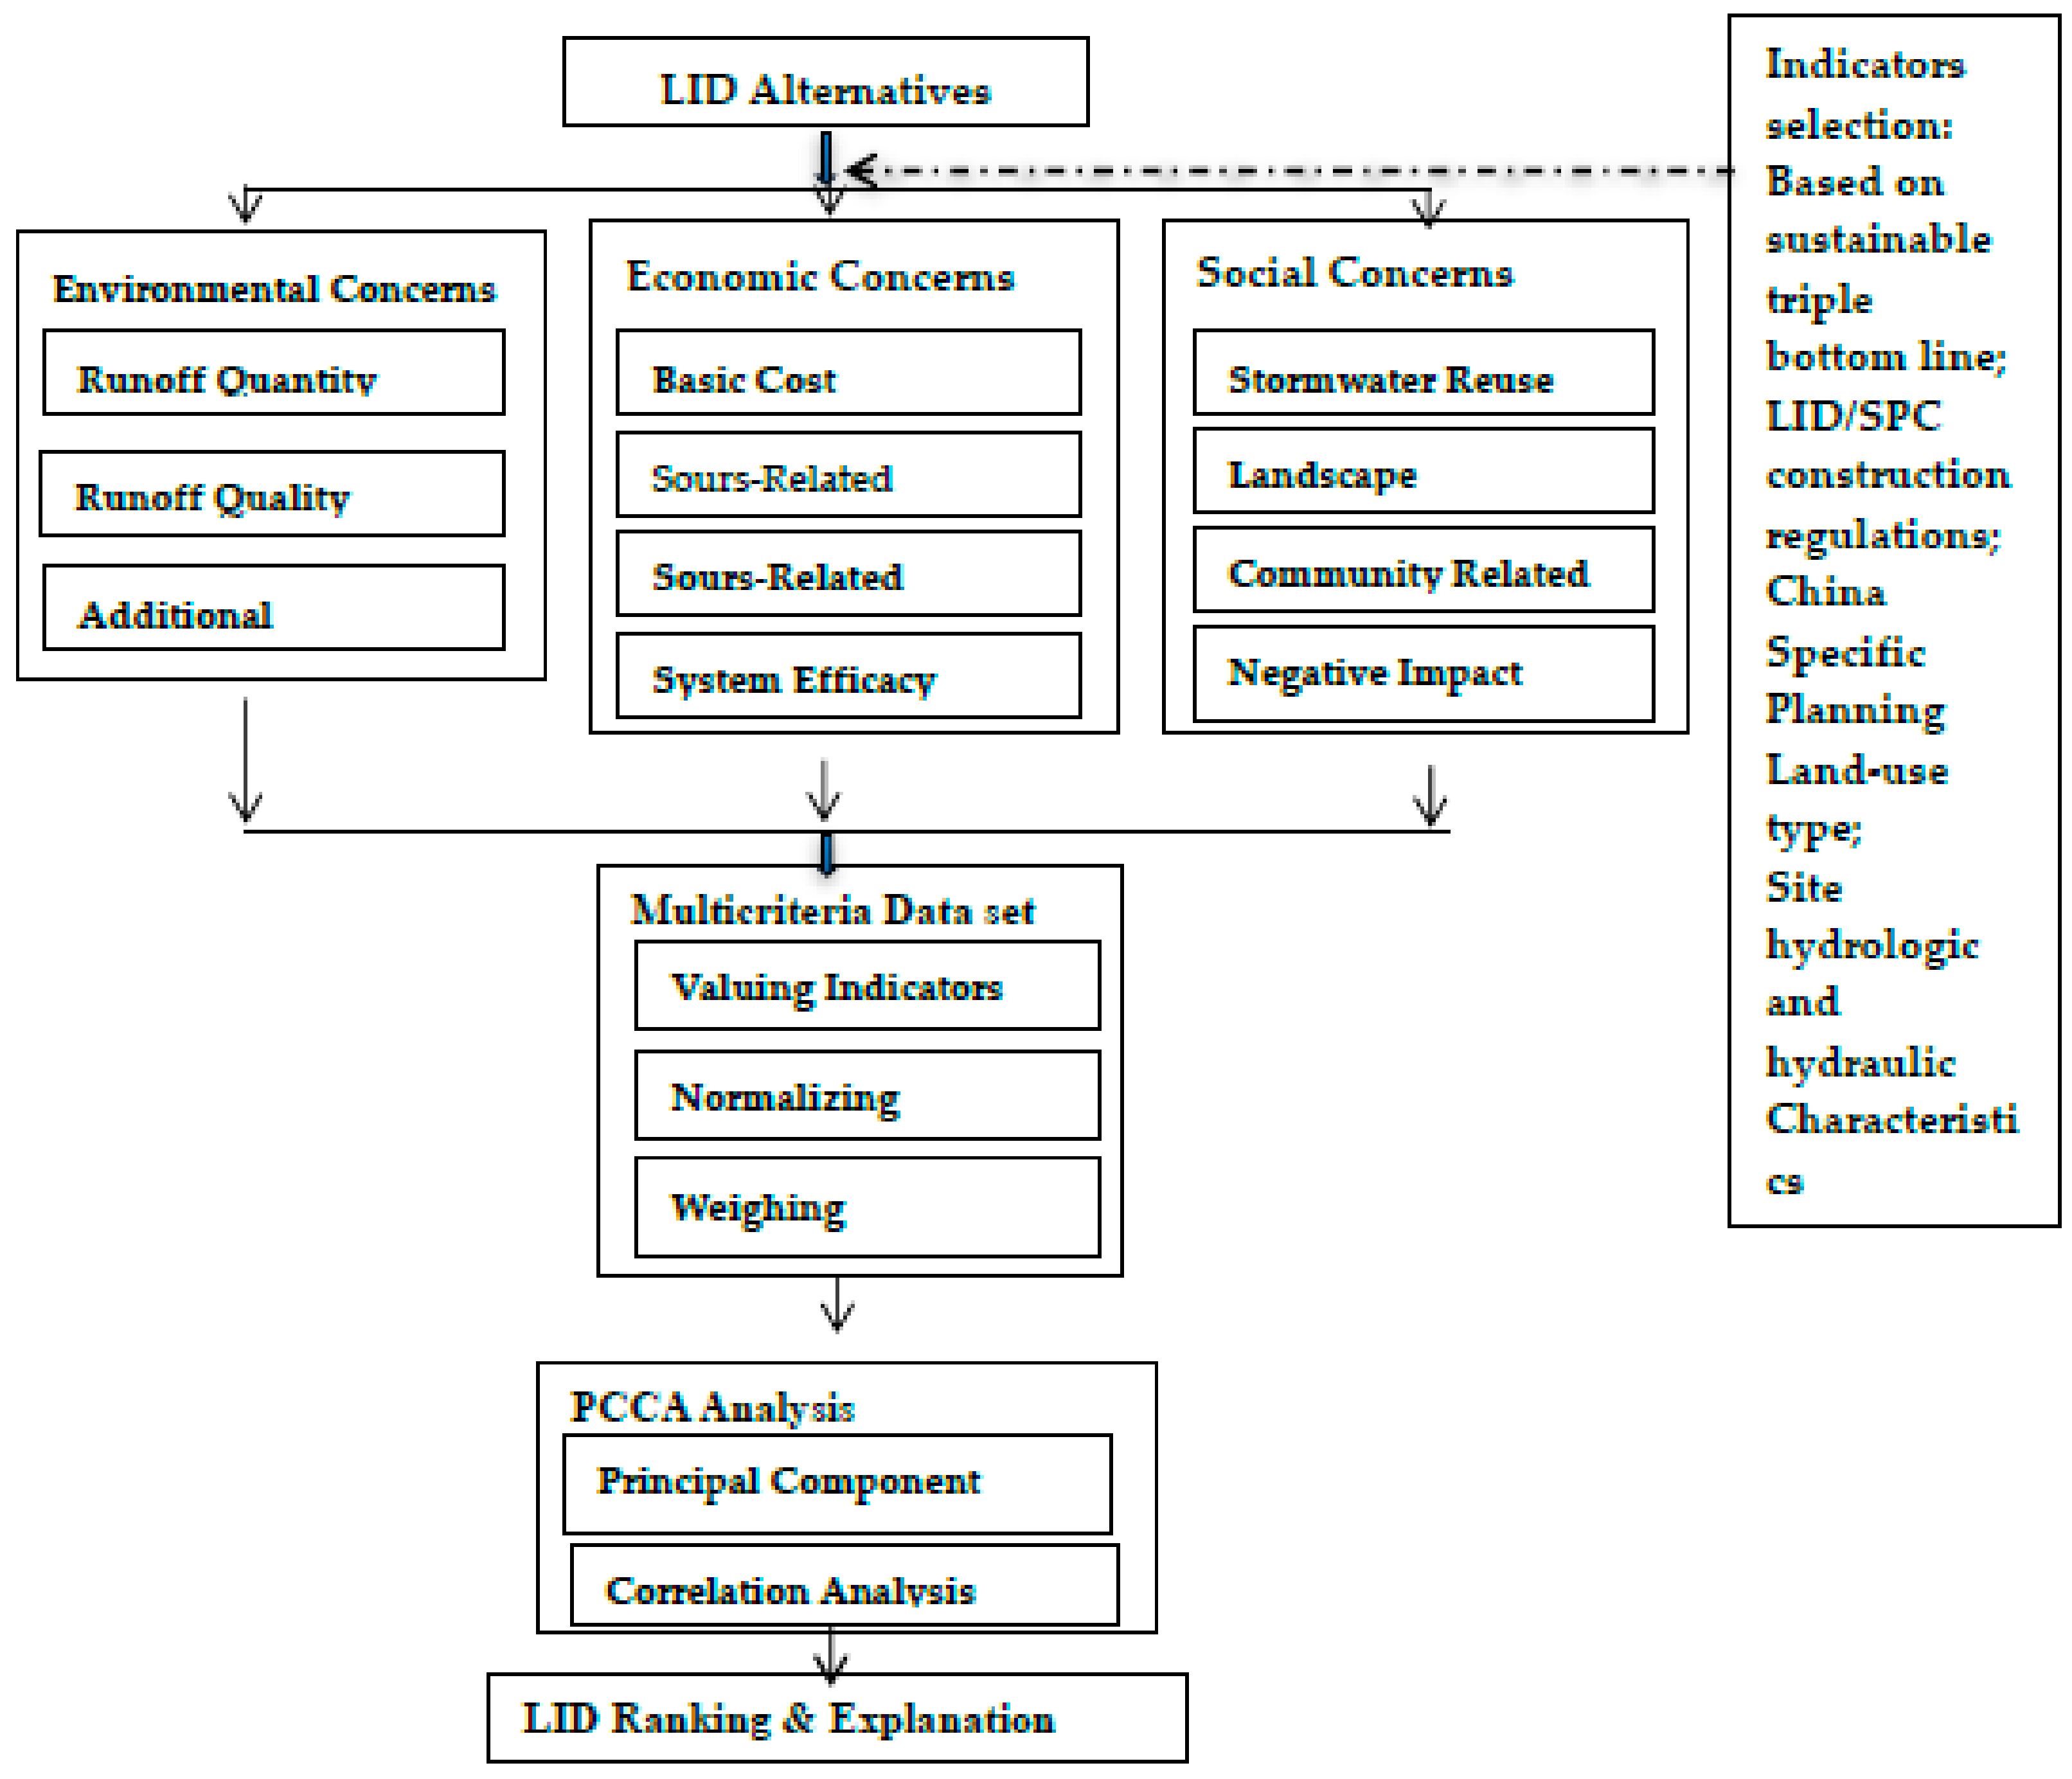
Evaluating a process involves criteria, objectives, targets, weighting, and methods [25]. According to sustainable development theory, environmental, economic, and social factors are established as the rule of triple bottom line and should be weighed equally [26]. The selected criteria were divided into first-level and second-level indices. Figure 1 indicates the LID evaluation framework. Finally, the different principal component groups are explained.
2.1. Criteria Categories and Index Level
To acquire reasonable and effective indicators, many methods can be used. For example, correlation methods, the analytic hierarchy process (AHP), distinction degree methods, regression methods, principal component methods, and expert approaches all apply. Prioritizing is a screening process. The basic principle of selection is to ensure that the selected index factors are comprehensive, typical, operational, sensitive, and concise [27]. First, the indicators associated with the environment, economy, and society are collected. The indicators should be in accordance with China-specific planning land-use type, and site hydrologic and hydraulic condition. Then, the independent discriminated indicators are determined using the PCCA approach.
2.1.1. Environmental Category
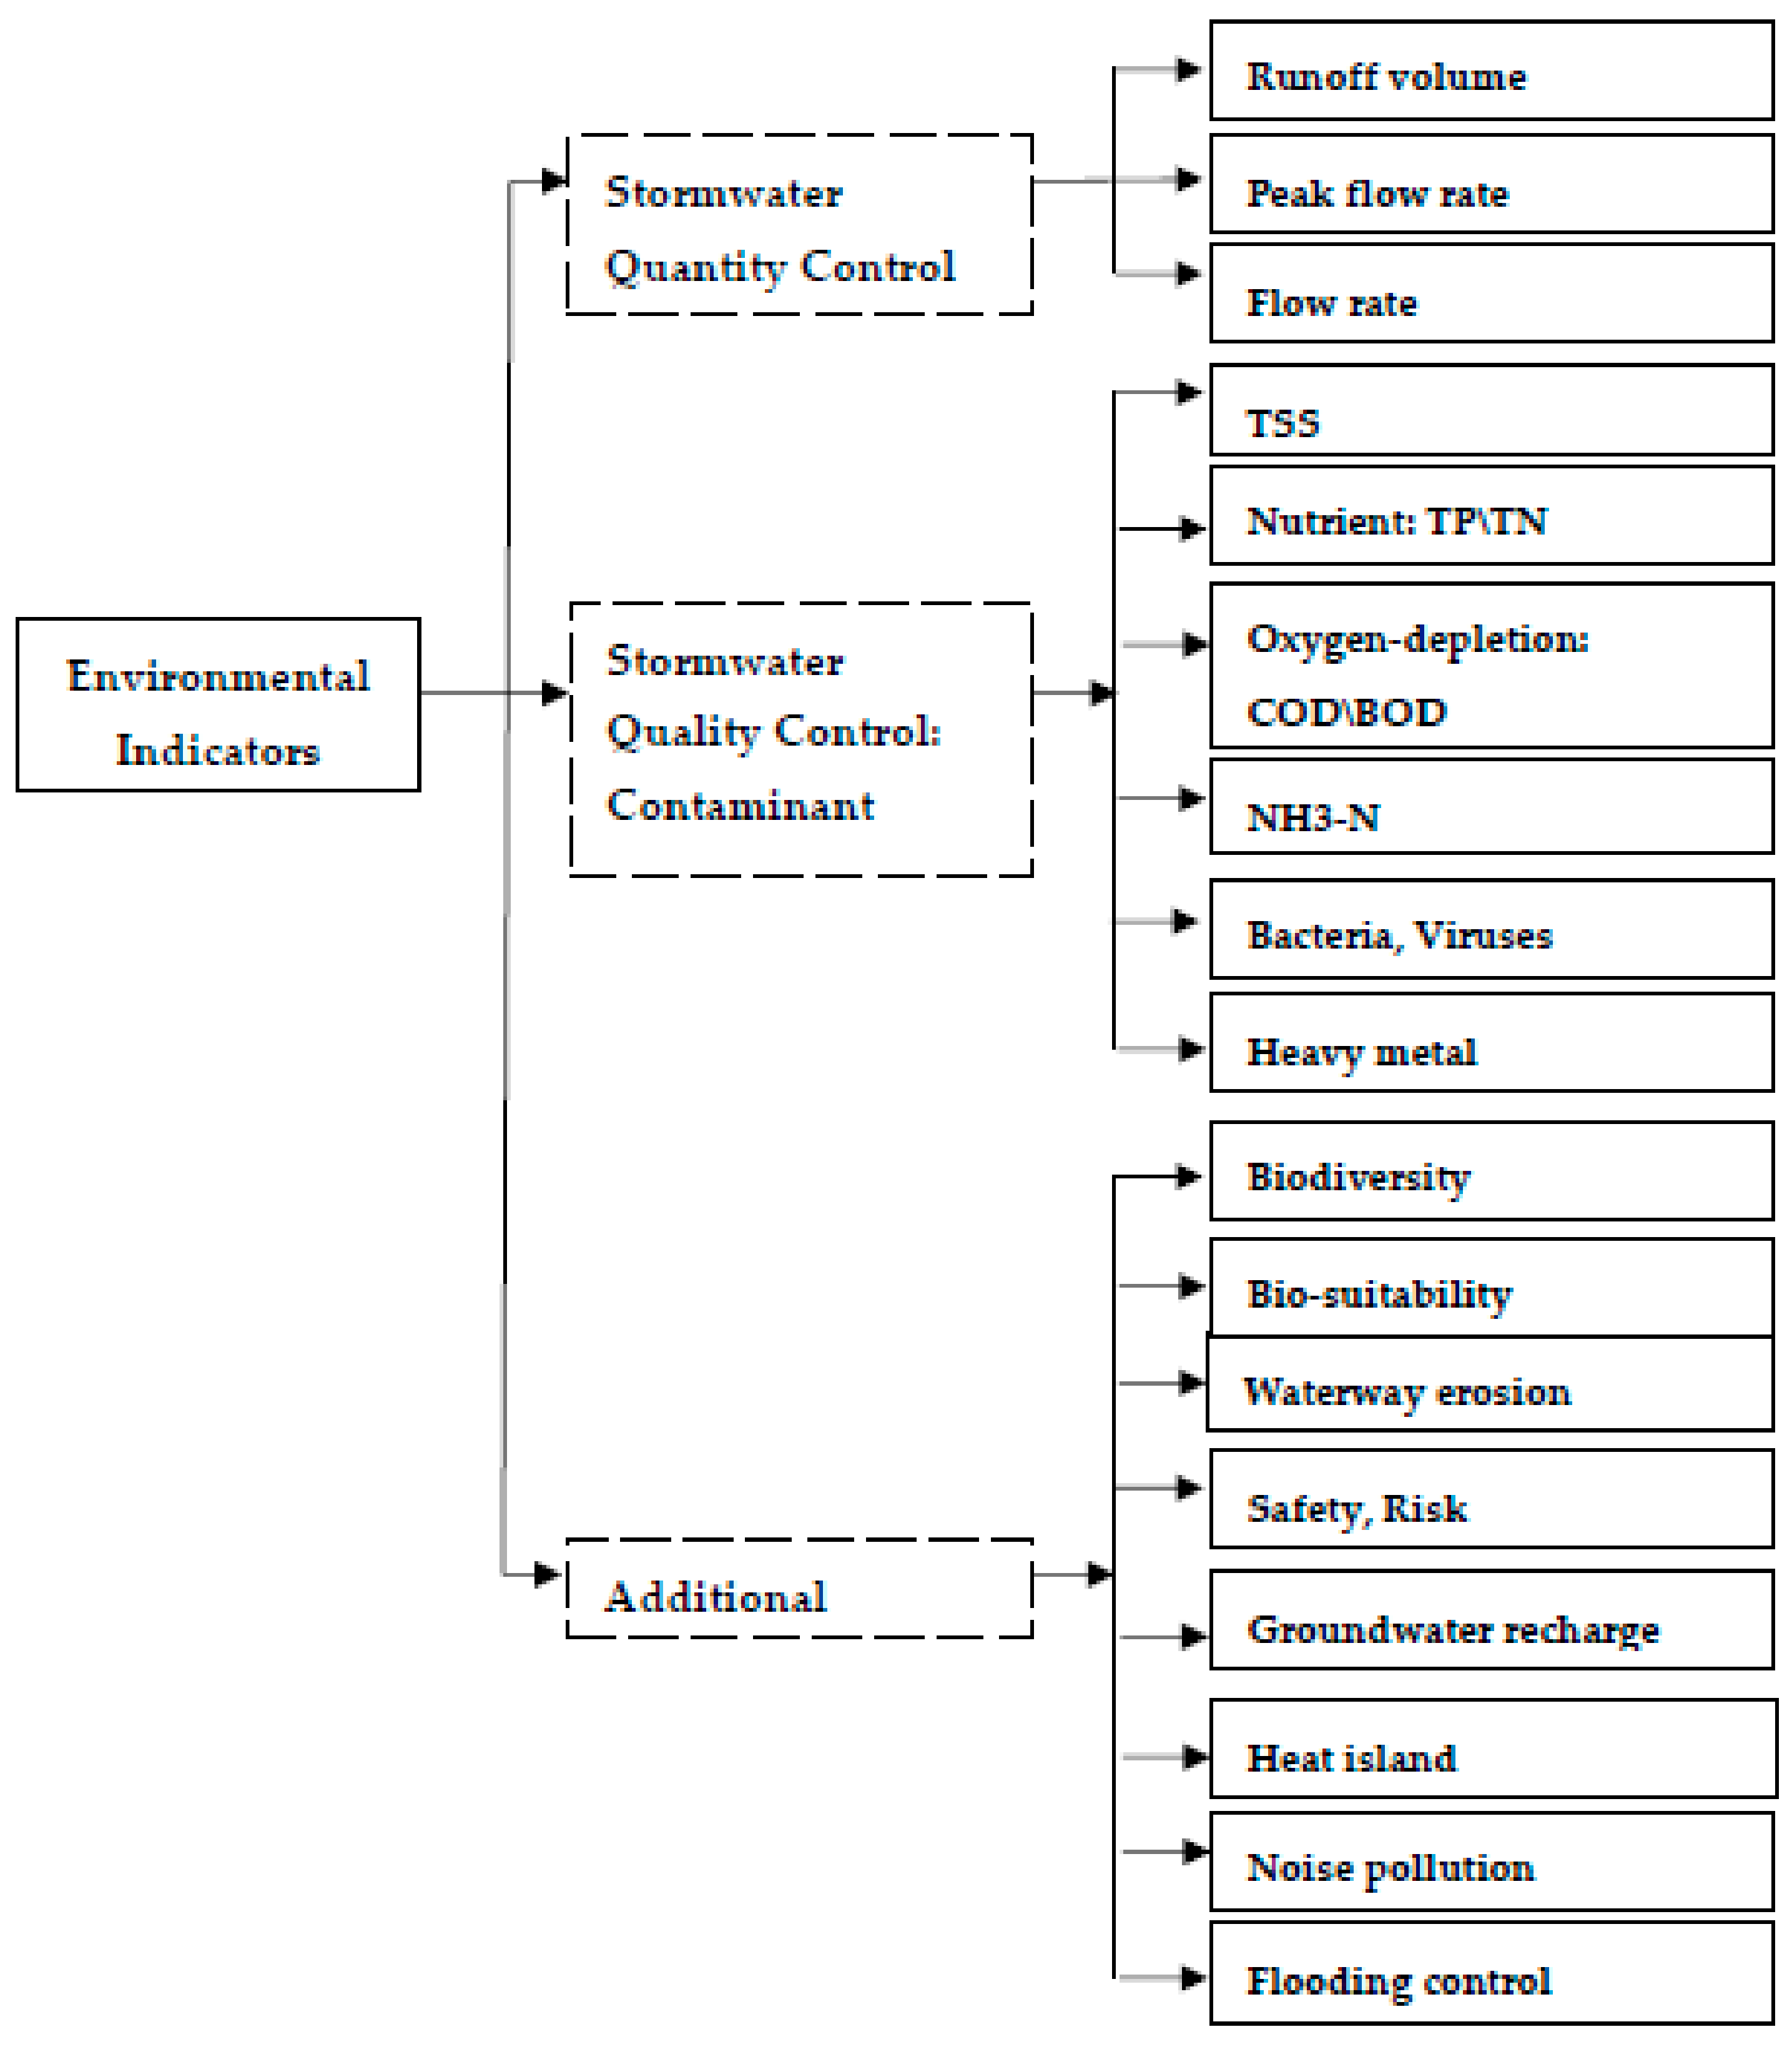
The environmental category is comprised of three first-level and 19 second-level indices related to environmental benefits. Three first-level indices are stormwater quantity control, stormwater quality control, and additional environmental aspects. The quantity criteria are volume reduction, peak flow delay, and flow rate reduction. The quality criteria are the removal of total suspended solids (TSS), total phosphorus (TP), total nitrogen (TN), chemical oxygen demand (COD), biochemical oxygen demand (BOD), ammonia nitrogen (NH3-N), bacteria and viruses, heavy metals, and toxic organic compounds. Additional criteria include the protection of biodiversity and bio-suitability and the improvement of water body safety. The hierarchical index structure is illustrated in Figure 2.
Based on the EPA 2013 report, reducing peak flows and increasing water discharge time could reduce flooding downstream. Flooding and erosion control should also be integrated with pollution control and stormwater reclamation designs [9].
2.1.2. Economic Category
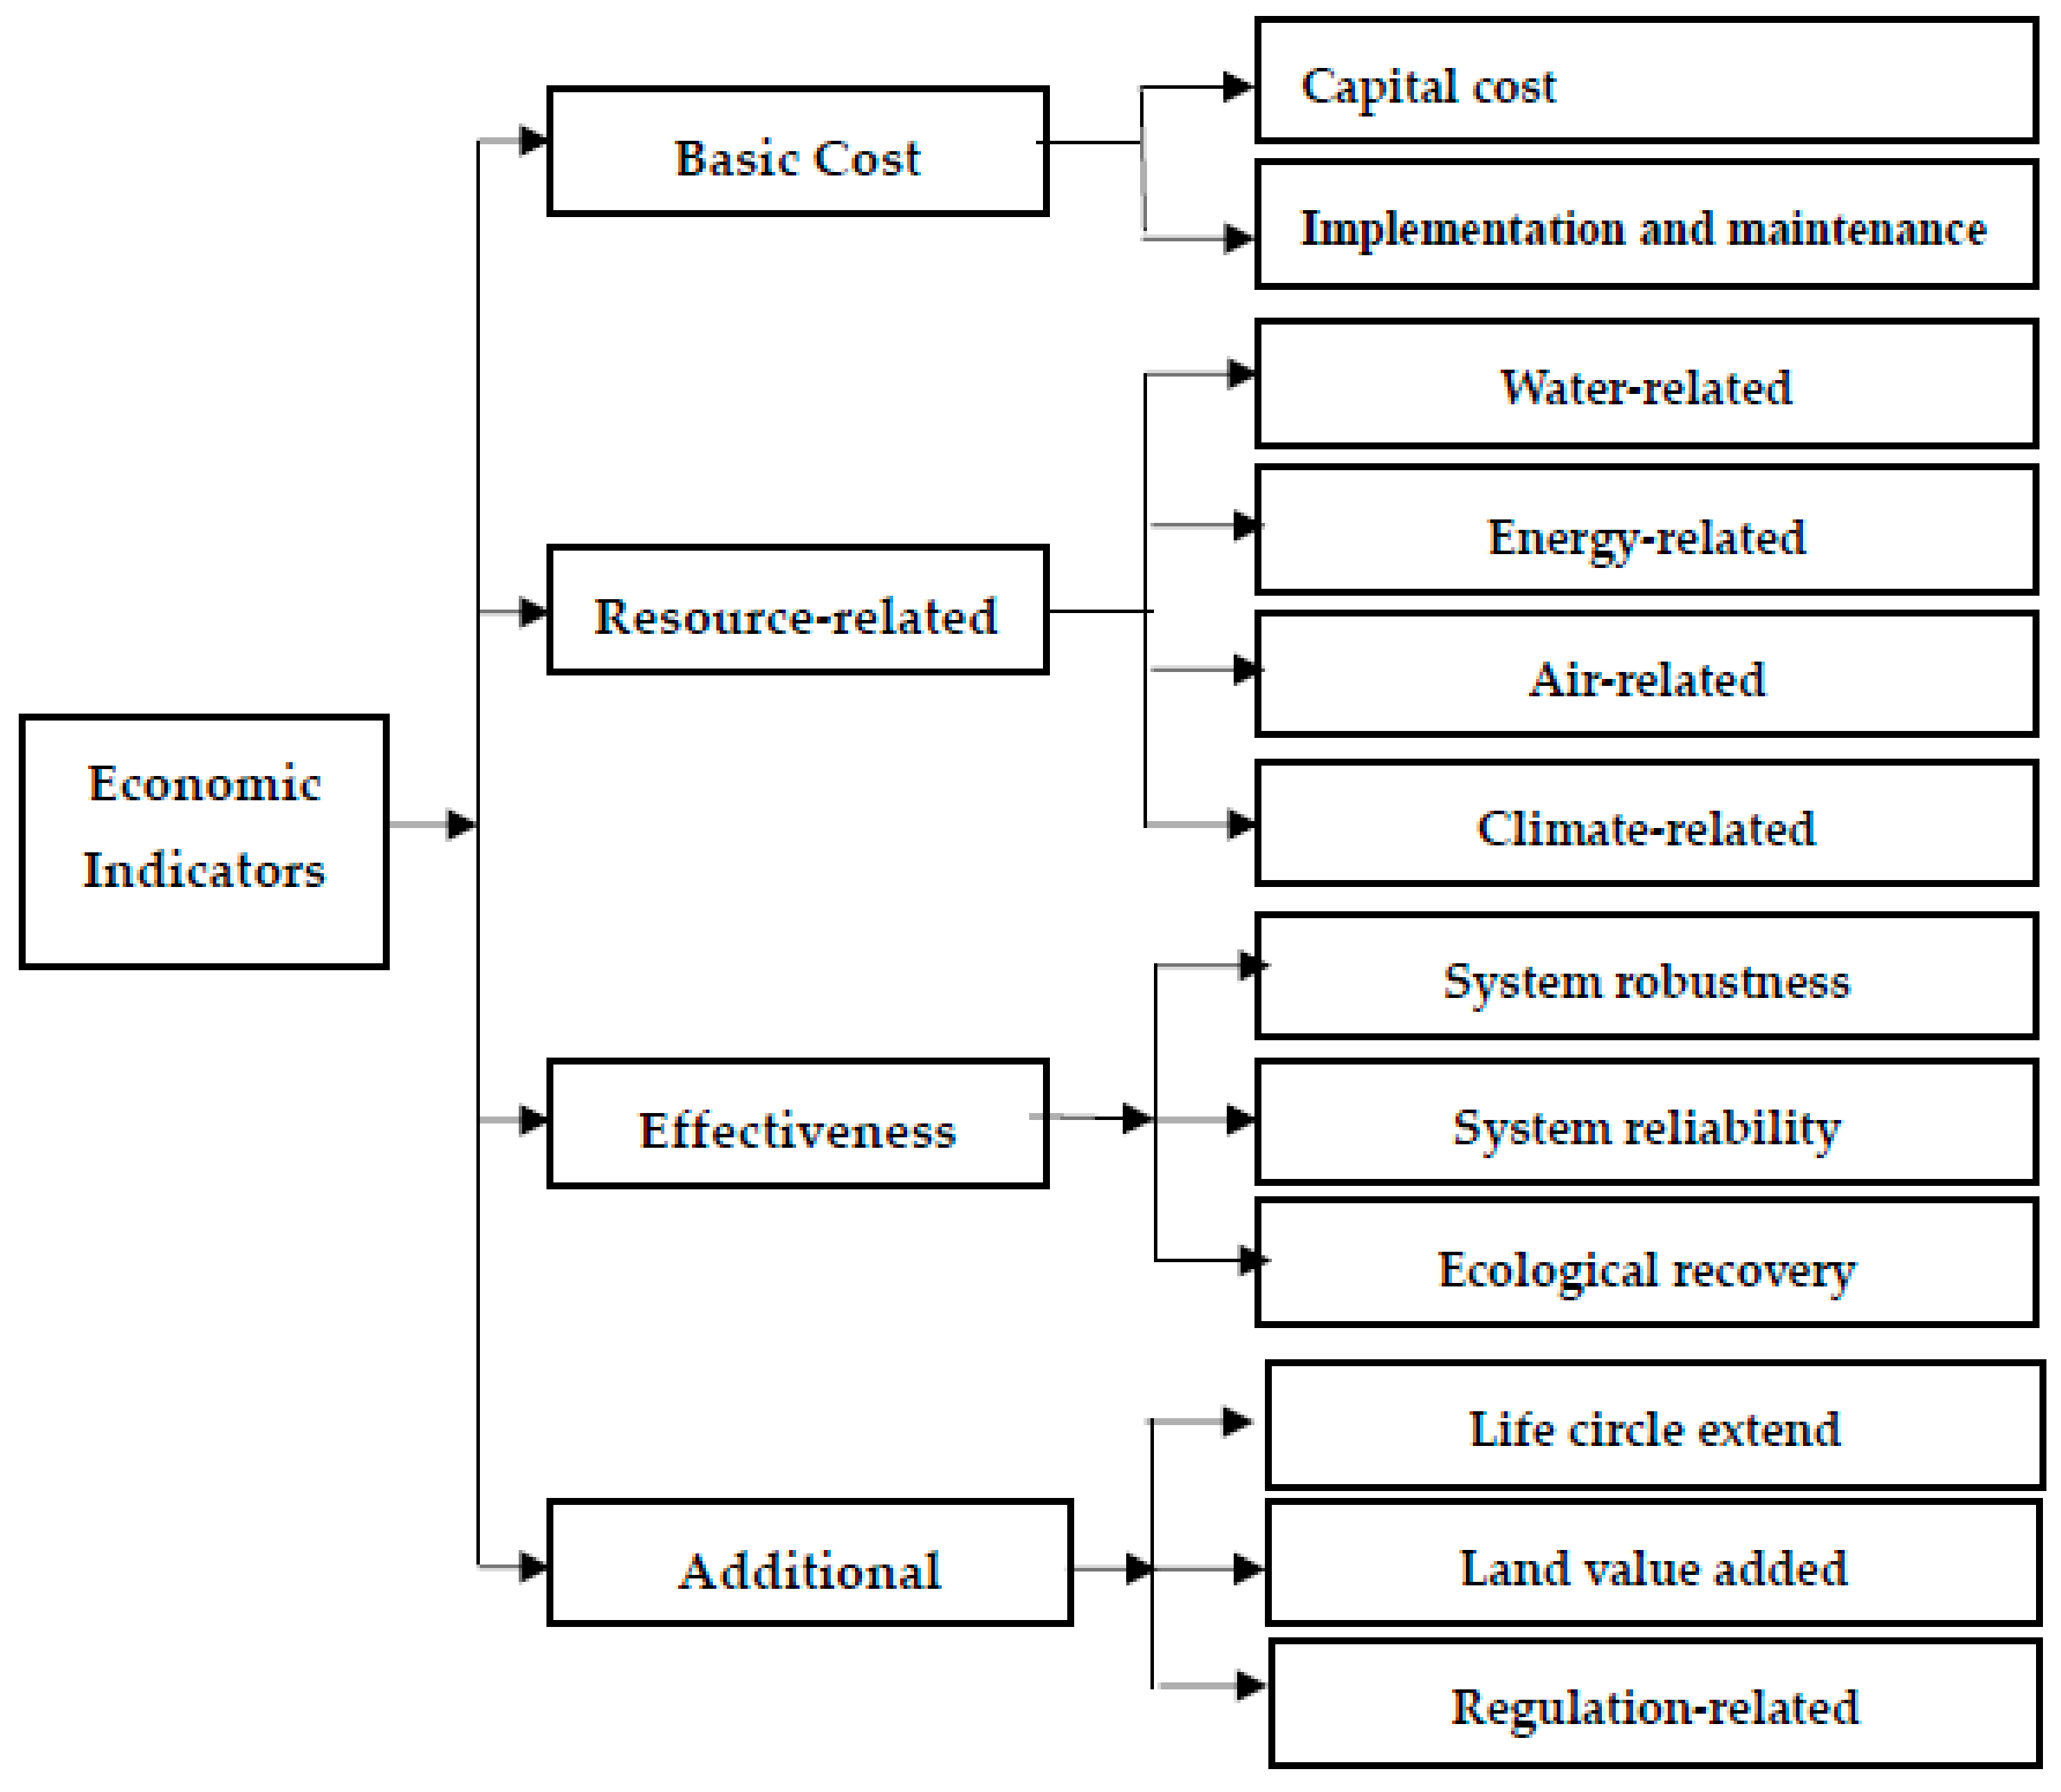
Generally, economic benefits associated with LID mainly consist of capital saving, implementation, and maintenance cost. However, the resources-related benefit and system reliability and robustness are often very significant [20]. Four first-level and 12 second-level indices are structured in Figure 3. The four first-level indicators are the basic cost, benefit resource-related, effectiveness, and additional benefits. The basic cost includes two second-level indices: construction capital, implementation, and maintenance cost. Resource-related indices are divided into four second-level indices: water-related, energy-related, air-related, and climate-related. Effectiveness indicator includes three second-level indices: system robustness, system reliability, and ecological recovery. System robustness emphasizes whether the design goals have been reached; system reliability is concerned mainly with the designed ecological line control, groundwater level control, and final water quality preservation according to relevant regulations; ecological recovery aims to ascertain if the ecological condition of post-development recovers to the level of pre-development. Additional benefits include three second-level indices: life cycle extent, land value added, regulations related to planning, and implementation in accordance with the SPC assessment regulation.
Land value added is a significant factor in the land development. According to the EPA (1995) report, LID practices are beneficial to developers as they create a water feature effect. People have a strong emotional attachment to water arising from its aesthetic qualities, which can lead to increased property values. The EPA indicated “developers could charge per lot a premium of up to $10,000 for homes situated next to well-designed stormwater ponds and wetlands”. The value of a house next to well-designed stormwater ponds and wetlands rose to 28% according to an investigation by the National Association of Home Builders [7].
Resources-related benefits are very important aspects when evaluating LID performance. The water-related benefits are aimed at avoiding cost associated with reduced stormwater runoff and flooding, which can be estimated by the values of potential future increase in gray infrastructure to deal with the reduced volume; energy-related benefits measured are reduced electricity and natural gas usage by LID, which can be calculated by per-unit energy rate to apply to the reduced heating or cooling volume; air-related benefits are indicated through a decrease in energy demand to removing the emission of harmful pollutions potentially and already in the air, which can be measured by tree-related filtration that applies pollutant-specific values to the volume removed from the atmosphere (additionally, the regional summaries for many tree varieties have been provided by U.S. Forest Services); climate-related benefits are aimed at decreasing the emission of greenhouse gases (GHGs), and the avoided costs are similar to the flooding issue [28]. A case study of Lancaster in the USA showed that the benefits related to water, energy, air, and climate could reach a value of over $2.8 M [29].
2.1.3. Social Category
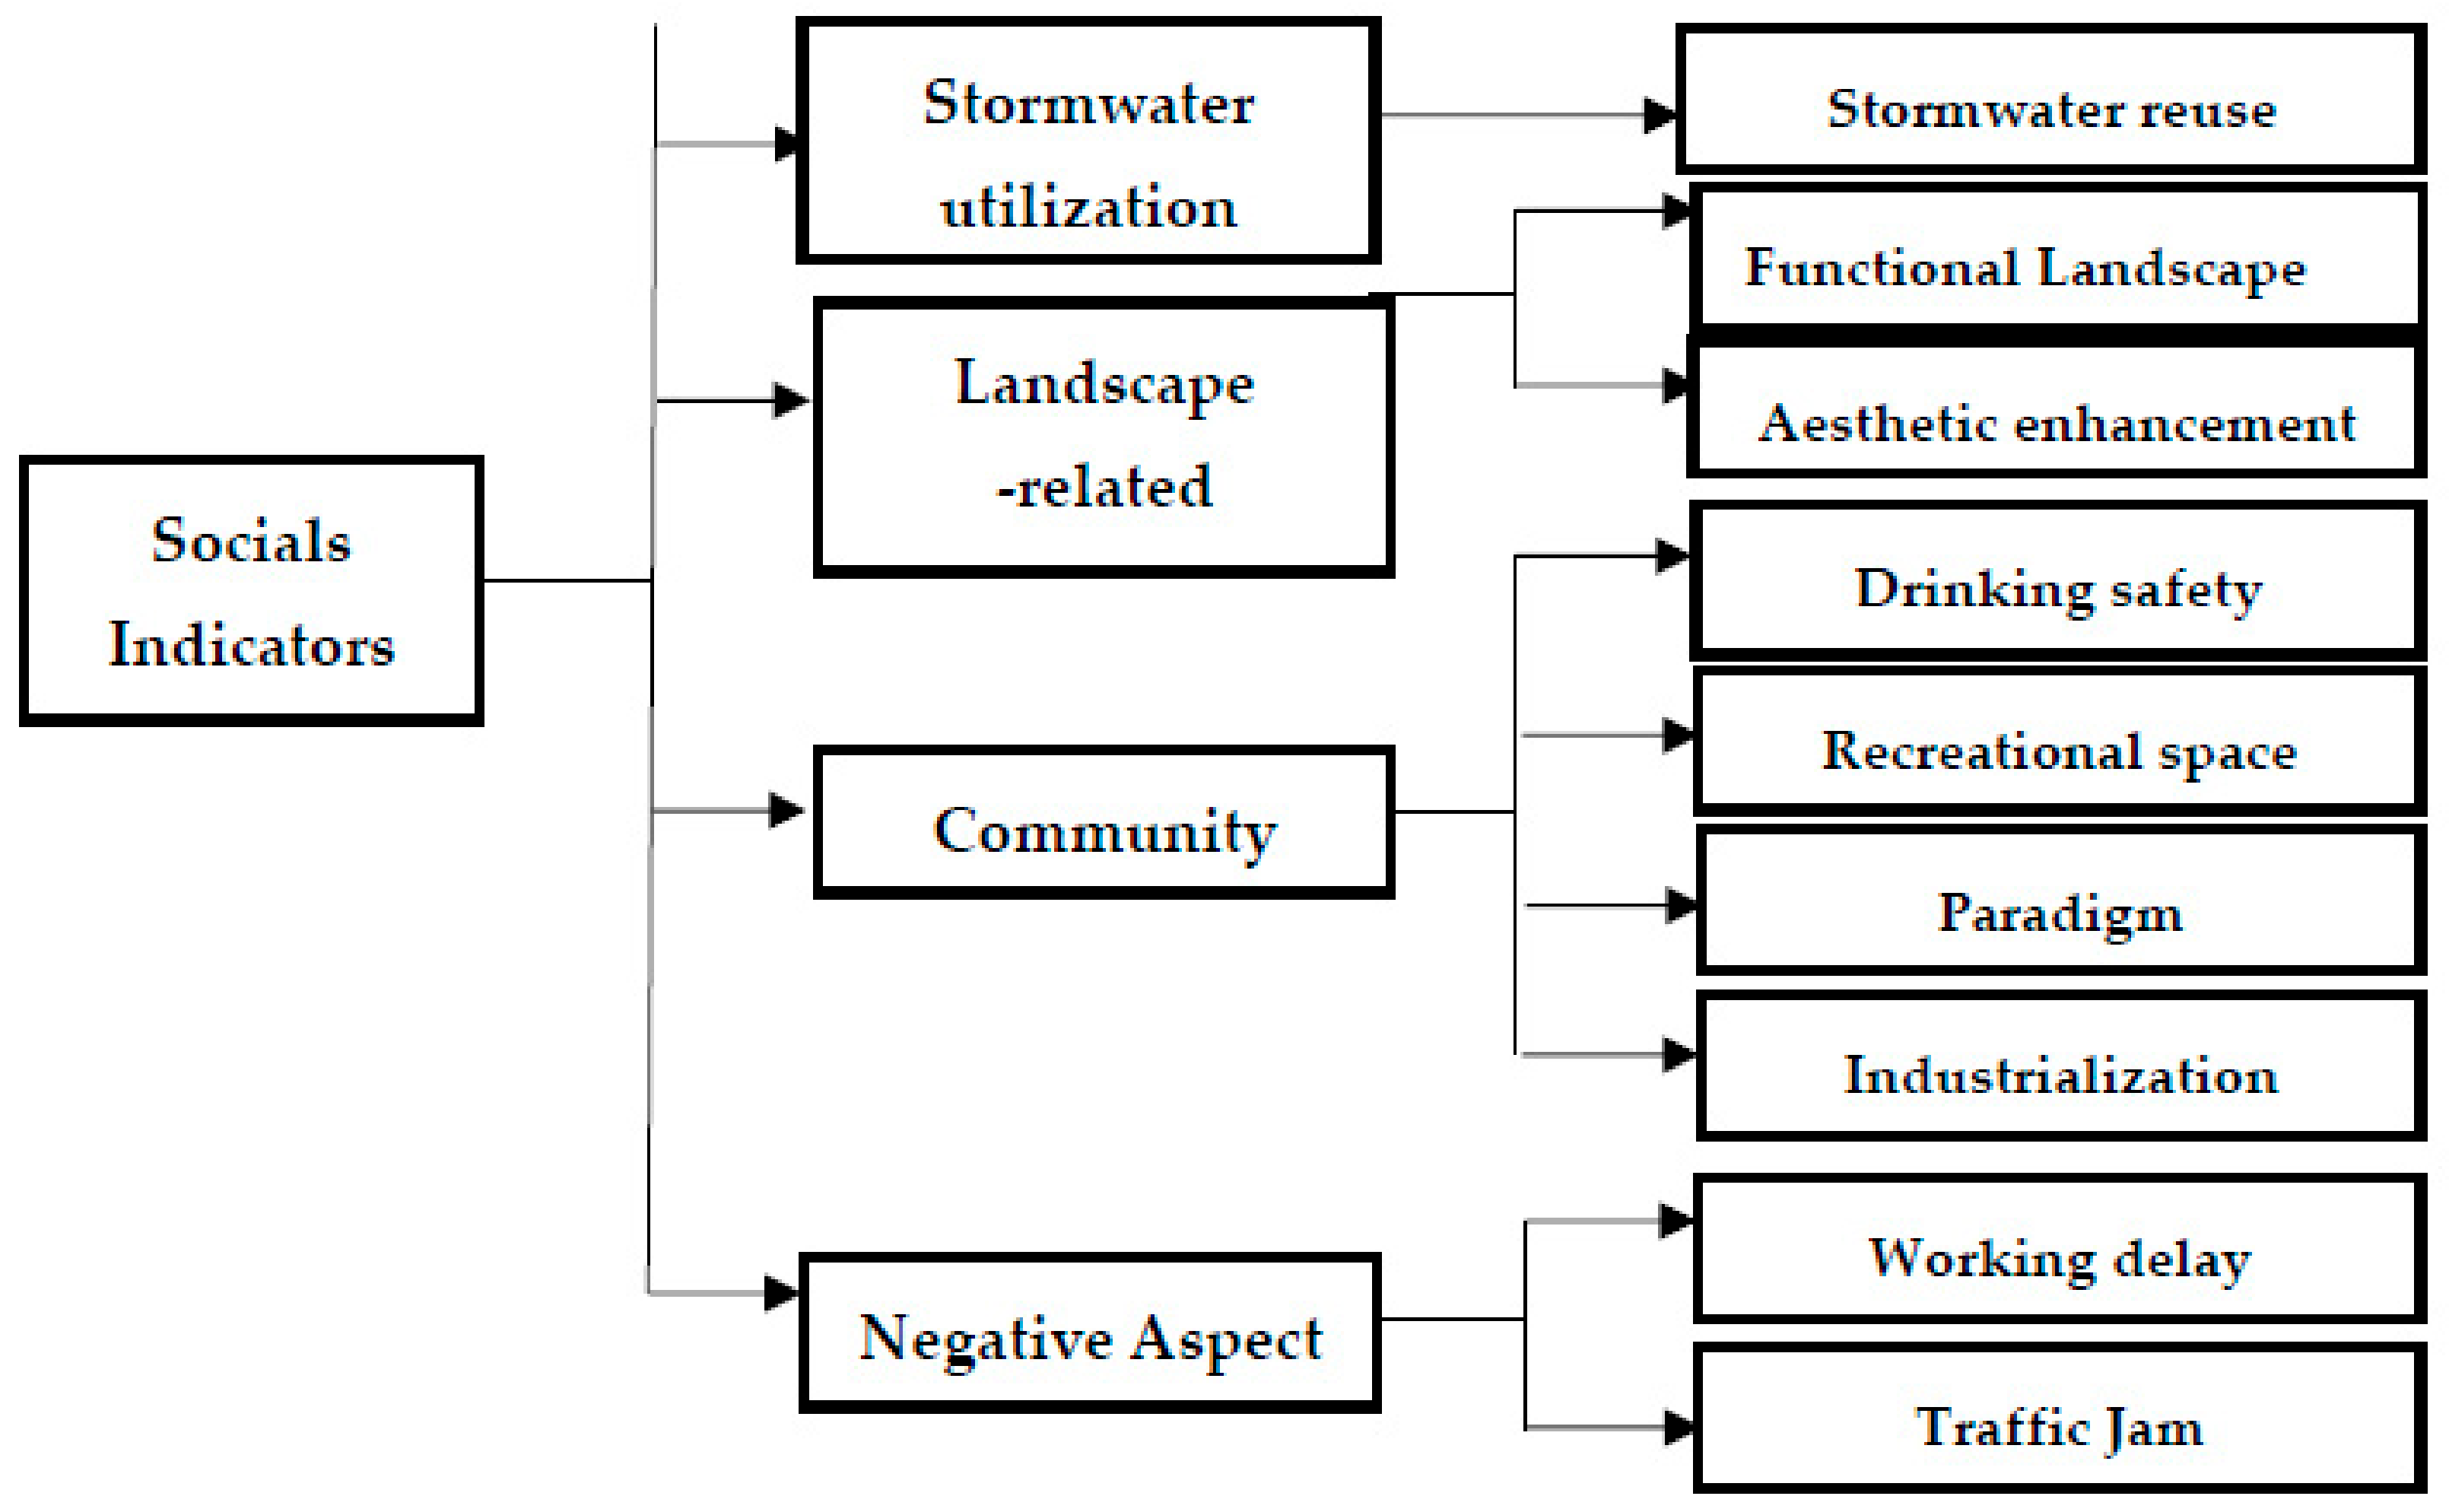
Social benefits are comprised of four first-level indices. They are further divided into nine second-level indices as shown in Figure 4. The four first-level indices are stormwater utilization, landscape-related, community benefit, and negative aspects. Rainwater utilization’s second-level indices are rainwater reuse; landscape’s second-level indices are functional landscape and aesthetic enhancement. The functional landscape is aimed at embodying some function such as filtering, detention, and retention in a landscape. The aesthetic enhancement is aimed to improve aesthetic amenities for landscape.
Community benefits’ second-level indices are drinking water safety, aimed at lessening impact on drinking water by runoff, increasing recreational space, and industrialization. LID construction promotes communities with good, interactive open spaces. Recreational activities help improve human health and save medical costs. In addition, LID construction provides more job opportunities, increasing the awareness of LID and SPC. The paradigm indicates need to control over 60% of the construction area with LID techniques; the industrialization is aimed at making relevant initiatives and policies to promote development which complies with SPC assessment regulation.
The negative aspect second-level indices are working delays and traffic jam during construction. Some LID practices, such as street curb extensions and tree boxes, will occasionally cause traffic problems, especially if they are in high-traffic areas. The negative effect will be considered in the indicators system.
2.2. China Planning, Land-Use Type and Site Characteristics
This article aims to evaluate LID performance in China. As we mentioned previously, LID techniques are related to the land-use type. Land use is often used as a selection factor under the assumption that a successful BMP/LID in one drainage area will be successful in a second area with similar land use [30]. Seo et al. [31] argued that the LID performance will vary depending on different urban patterns. Additionally, the subsurface runoff coefficient is a crucial factor to assess LID performance [32]. To localize the evaluation, the specific planning and land use category need to be introduced.
2.2.1. Overall Planning
Overall planning is legal planning approved by the authority in China, which represents development strategies, requirements, and overall benefits for a certain area over time, which regulates the development nature, goals, scale, land-use type, space arrangement, and implementation measures of a city. The succeeding planning should be subjected to the overall planning. It normally covers five aspects: water ecology and sensitive area protection, mixed-use land development, impermeable land rate control, runoff volume control, and LID techniques application [33]. Therefore, indicator selection should comply with overall planning.
2.2.2. Control-Specific Planning (CP)
CP is the legal planning legislation in China, which is a key component in implementing planning objectives, principles, and strategies in China. It is the most direct legal foundation for instructing and controlling urban development [34], and it provides a set of legal planning control indicators, such as land-use type, land development intensity, urban infrastructure arrangement, and spatial urban form (indicated in Table 1). The most popular criteria are building density and floor area ratio (FAR) due to it will determine the development scale on the site. The developer will strictly follow these indicators in China [35].
Table 1 indicates that there is no indicator related to LID or SPC in the Chinese CP. Therefore, it creates a dilemma for LID application in China, although the Chinese government asked to apply LID techniques to structure SPC. Moreover, in March 2016, Chinese authorities asked local authorities to develop an SPC/LID Specific Planning based on SPC construction guideline. However, the CP that meets the indicators list in Table 1 could be implemented.
Urban land-use classification is divided into eight categories in China. These are residential land (R), public management and public service land (A), commercial facilities (B), industrial land (M), logistics and warehouse land (W), transportation facilities (S), public facilities (U), and green space and square land (G). Each category has three first-level categories matched to various land uses. The land-use type has been divided into 35 second-level categories and 44 third-level categories legally [36]. The first-level category and their descriptions are shown in Table 2. With the definition of each land-use type, it is helpful to determine what indicators may be involved in a data set. Additionally, the categories are different from the USA. It is very important to take account of the localization when we reference or use some analysis from the USA.
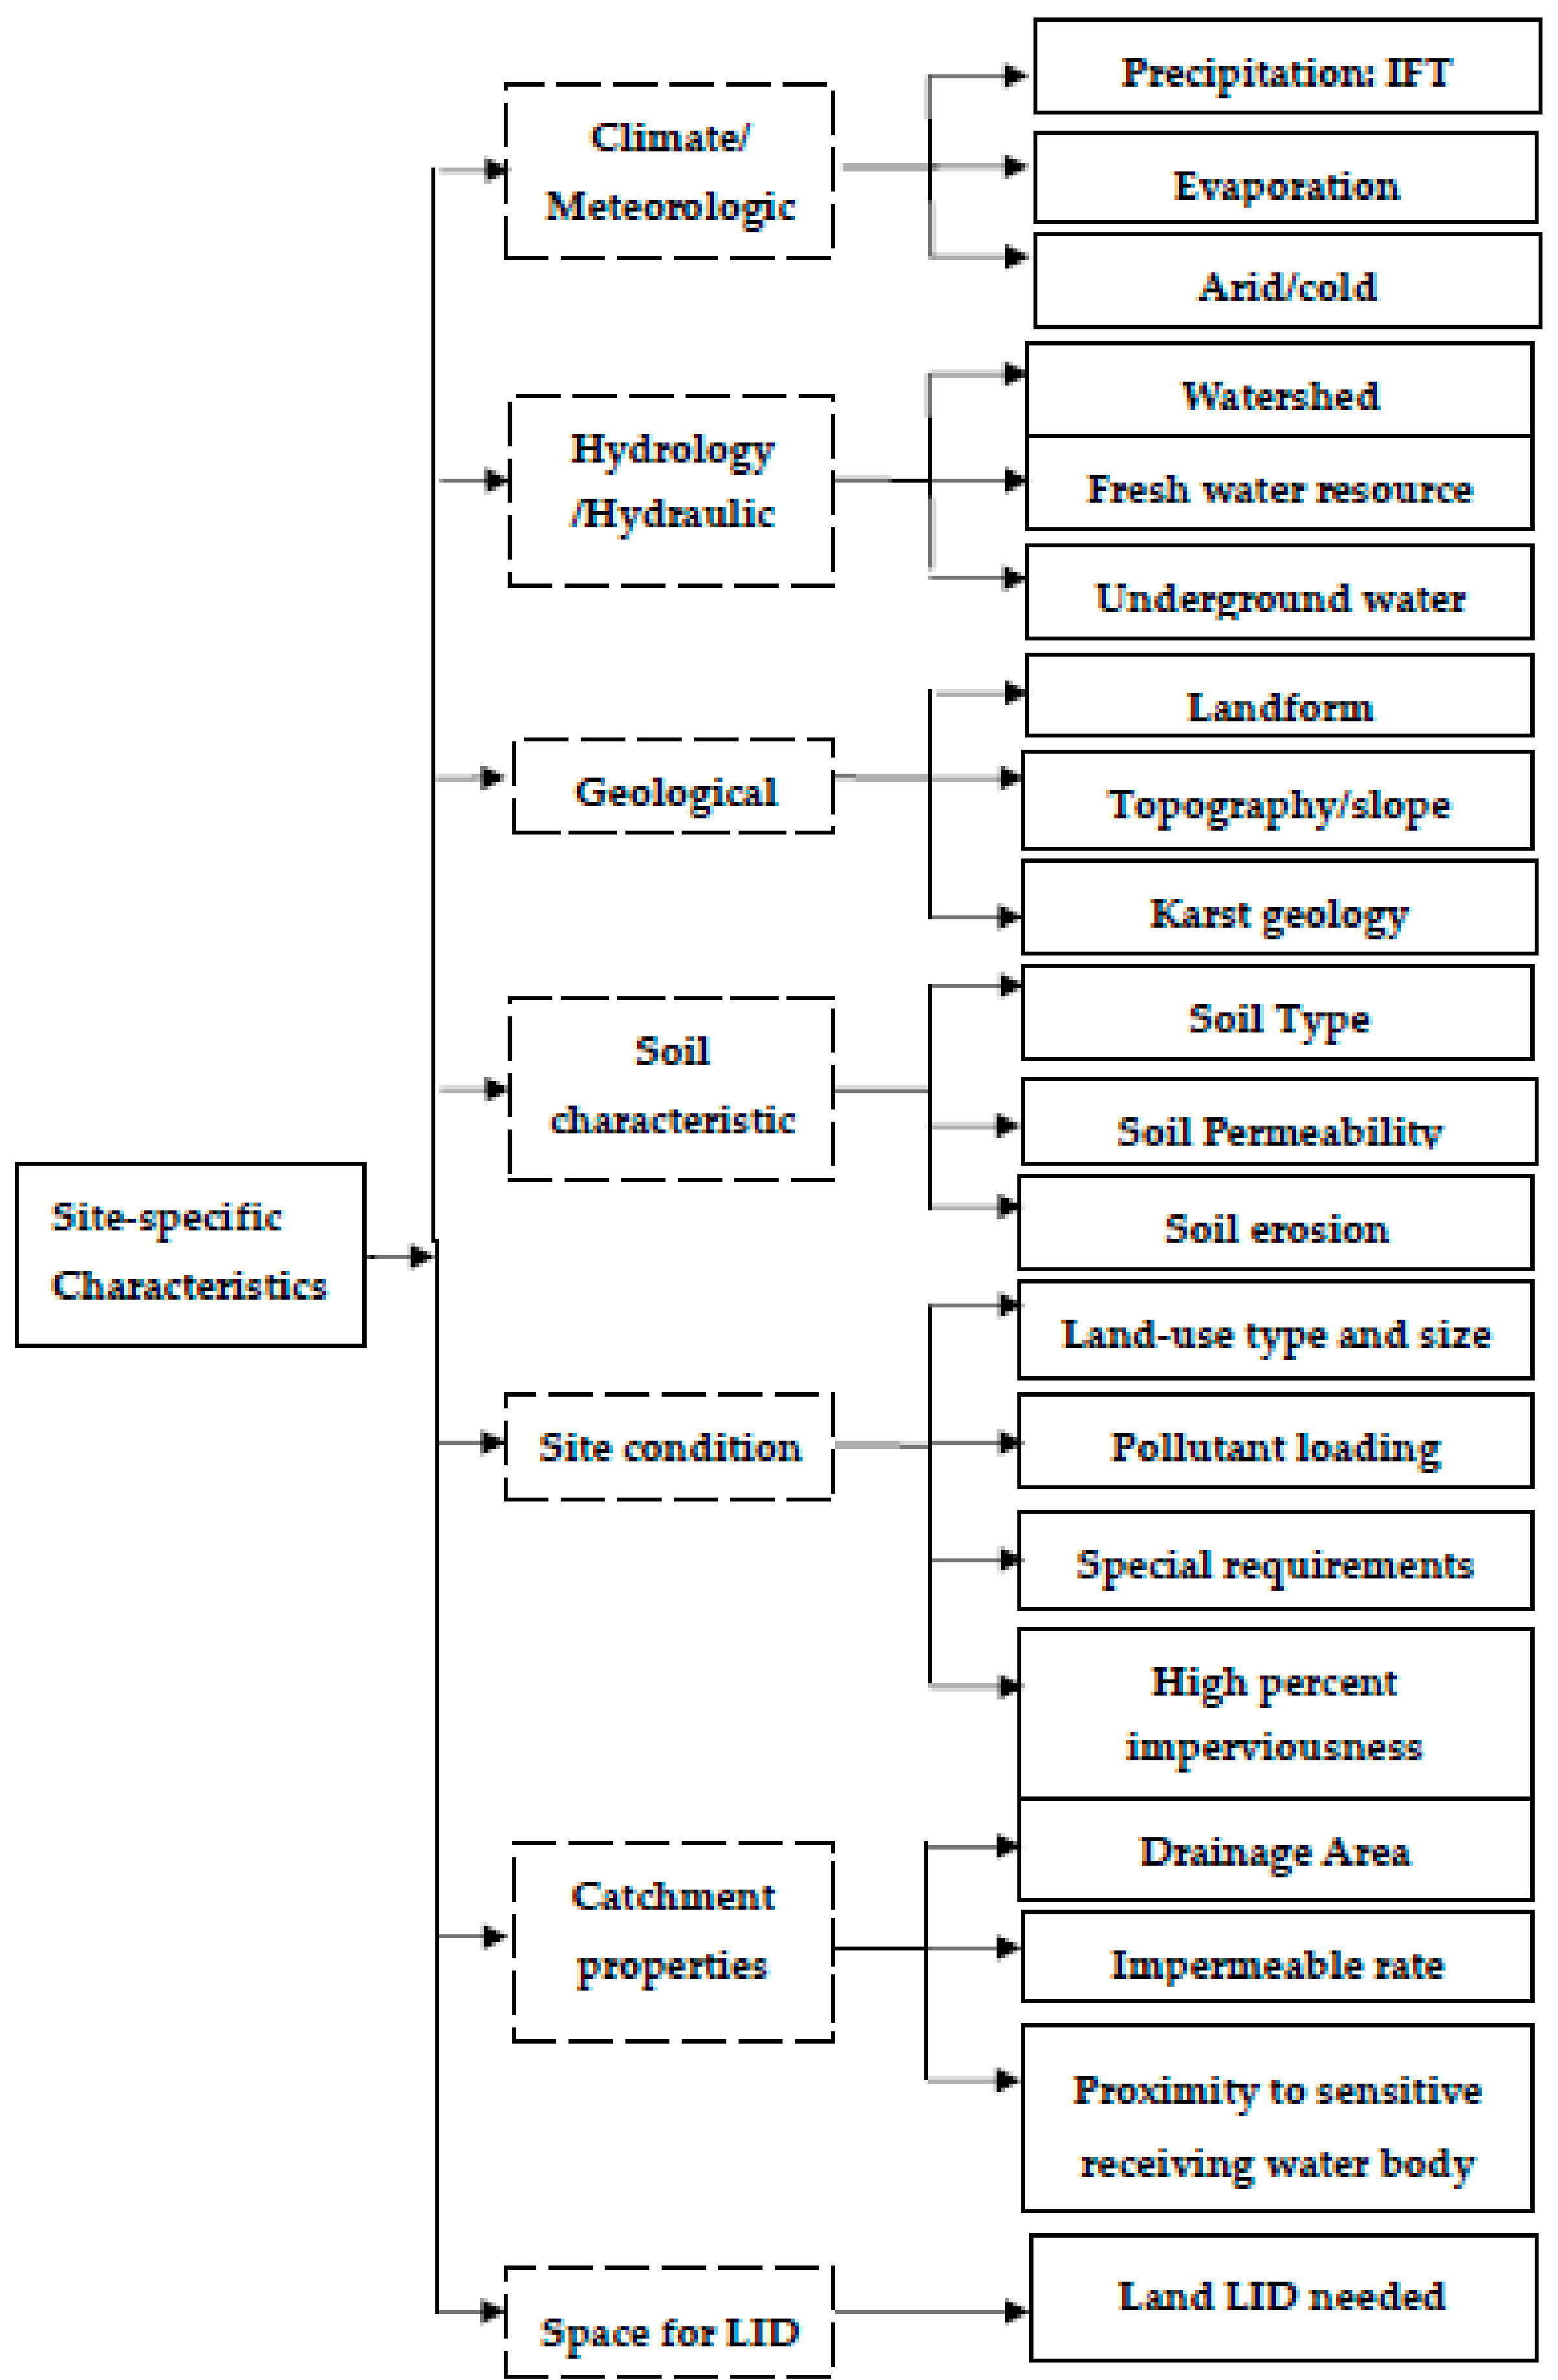
2.3. Site-Specific Characteristics
Site suitability is one of the key factors in successful BMP/LID performance, especially for structural BMPs/LID. To apply appropriate LID techniques to construct SPC, the selected indicators should work in accordance with the site-specific situation. Normally, site factors such as drainage area characteristics, climate, and meteorological characteristics, and physical factors at the location need to be considered during BMP selection.
A list of the full considerations regarding specific site characteristic is given in Figure 5.
- (a)
- Climate and meteorological condition: rainfall frequency, duration, intensity, climate (e.g., arid or cold), and evapotranspiration potential
- (b)
- Hydrology and hydraulic condition: watershed, freshwater resource, and groundwater
- (c)
- Geological condition: landform, topography (ground slope), and Karst geology (soil erosion and landslide are the most important factors)
- (d)
- Soil characteristics: type, permeability, and erosion
- (e)
- Site condition: size, land-use type, retrofit, high percent impervious area, land area requirement, pollutant loading, and special requirements
- (f)
- Catchment properties: drainage area, proximity to sensitive receiving waters, and impermeable rate
- (g)
- LID technique required space: to install appropriate LID measure
For example, if a project is in a heavily polluted area, the priority should emphasize pollution abatement and control. If the project is located upstream of a waterway, the water body safety of the downstream area is very significant, especially if there are existing sensitive water bodies downstream. For Karst sites, soil erosion and landslides are the most important factors.
2.4. Valuing and Normalizing
Obviously, when taking account of a wide range of variables, two issues should be considered. One issue is that too many variables will increase the difficulties for calculation; this will be dealt with in the next section. Another issue is that it is not easy to quantify the indicators or monetize the relative benefits for the qualitative indicators.
Souhals et al. [37] elaborated six methodologies for quantifying indicators as follows:
- (a)
- Avoided cost analysis: to estimate the cost of the future project by using existing services, i.e., the avoided cost associated with reduced runoff and flooding could be water-related benefits
- (b)
- Benefit transfer: By estimating the value of a similar service in another place, i.e., reduced flooding risk could be estimated at 2–5% of the property value
- (c)
- Hedonic analysis: By comparing the value of properties of multiple households, controlling several factors, determining the influence of changes of the service on property value, i.e., what insurance premiums are paid for flood damage insurance as a proxy for the value of reducing the risk of flood damage
- (d)
- Replacement cost analysis: By estimating the cost of the project required to replace the service
- (e)
- Stated preference analysis: By asking people how much they would be willing to pay to protect the service, or to accept to forgo the services, i.e., ask individuals how much they are willing to pay for a given good or service
- (f)
- Travel cost analysis: By calculating the time and money spent individually traveling to experience the service
In addition to resources-related benefits discussed previously, the Center for Neighborhood Technology (CNT) uses the Northeast Community Tree Guide and The Forest Service Tree Guides to calculate the resources-related benefits.
In this paper, quantitative indicators such as flow rate reduction, volume reduction, pollutants (TSS, COD, BOD, TP, TN, and NH3-N) abatement may be analyzed using the SWMM software, and economic indicators such as construction and maintenance cost could be acquired from field or design estimation. However, the other quantitative indicators are more complex to monetize.
SWMM is widely used to model the effects of LID. In a case study the Lincang Technology Innovation Park (LCTIP) was simulated by SWMM for various LID applications. The inputs for SWMM such as a local 10-year precipitation and evaporation record and LID set, and calibration was discussed in detail in that paper [38]. Therefore, the present study directly used the simulation results by SWMM for individual LIDs.
In preparing this paper we set up a model to evaluate the individual LID by ranking LID performance based on the PCCA approach. This could be a decision-aid tool helping a decision maker to select an appropriate LID. This process is concerned with the relative importance of each alternative. Therefore, a numerical system could be used to represent effectiveness, i.e., the ratings ‘most important’, ‘more important’, ‘important’, ‘less important’, ‘not important’ are converted to the numbers 5, 4, 3, 2, and 1 respectively. This rating was used to quantify the quantitative indicators [39]. The numbers only present the relative scores of various LID alternatives. However, it is a subjective method only used for the qualitative indicators that are hard to qualify.
To compare the various LID alternatives on a unified scale, the quantitative indicators that have different units need to be normalized. Several methods could be normalized such as standard, extreme value method, liner scale method, normal method, vector normalization method, efficiency coefficient method. In this paper, we used extreme value method as in the following equation:
—normalized assessment index.
—the evaluation indicator.
, Variance of .
As previously mentioned, environmental, economic and social factors should be equally important. We select the equal weighting in this paper. However, the relative importance of indicators may help with the assessment of technical municipal services, urban stormwater systems designers, environmental regulatory bodies, and researchers.
2.5. Aggregation of Principal Component Analysis and Correlation Analysis (PCCA)
The principal component analysis (PCA) is a statistical analysis method. It can deal with the problem of data overlap and optimize the data structure. Using an orthogonal transformation in PCA, a set of possibly correlated variables can be converted into a set of values of linearly uncorrelated variables called principal variables. After the data transformation, the first principal component has the maximum value of the variance, followed by the second principal component, and so forth to the end. In addition, the principal component is orthogonal to the preceding components. Normally, the number of original variables is more than the number of principal components, which means that PCA could reduce the dimensionality of data. PCA retains the indicator that makes the largest contribution to the result and deletes the indicators that make the least contribution. Normally, the former principal components that explain over 85% of the variance are the main concerns. However, the variables in each component group could possibly be correlated, which is why correlation analysis is integrated into PCA analysis. Typical indicators will be obtained when repeating the procedure. The PCCA analysis steps as follow:
First, the principal components that may explain over 85% of the variables are determined by the PCA method. Based on the PCA definition, each principal component is uncorrelated.
Second, according to the ratio of each principal component explained variable, the number of variables in each principal component set is determined. The variables with higher contribution are kept. However, the data in the same principal component set may be correlated.
For critical analysis, the correlation analysis is used to delete the redundancy indicators which should have an over 95% correlation coefficient and have similar attributes. This is done to avoid the overlap of indicators in the same system and to ensure that the final results are reliable [40].
Finally, the number of the rest variables is less than the original set, which can use for evaluating the LID performance based on the principal component ratio of variance contribution, and the weighting in each principal component set. To the LID (i) alternative, the comprehensive evaluation index is:
j—the number of principal components, normally, n ≤ 3.
—the ratio of variance contribution of principal component (j).
—the comprehensive evaluation index for the principal component (j) about LID (i) alternative, as follow:
k—the number of selected variables.
—the selected variable (k)
—the extracted value from the principal component for the variable (k) in factor (j)
2.6. Case Description and Criteria
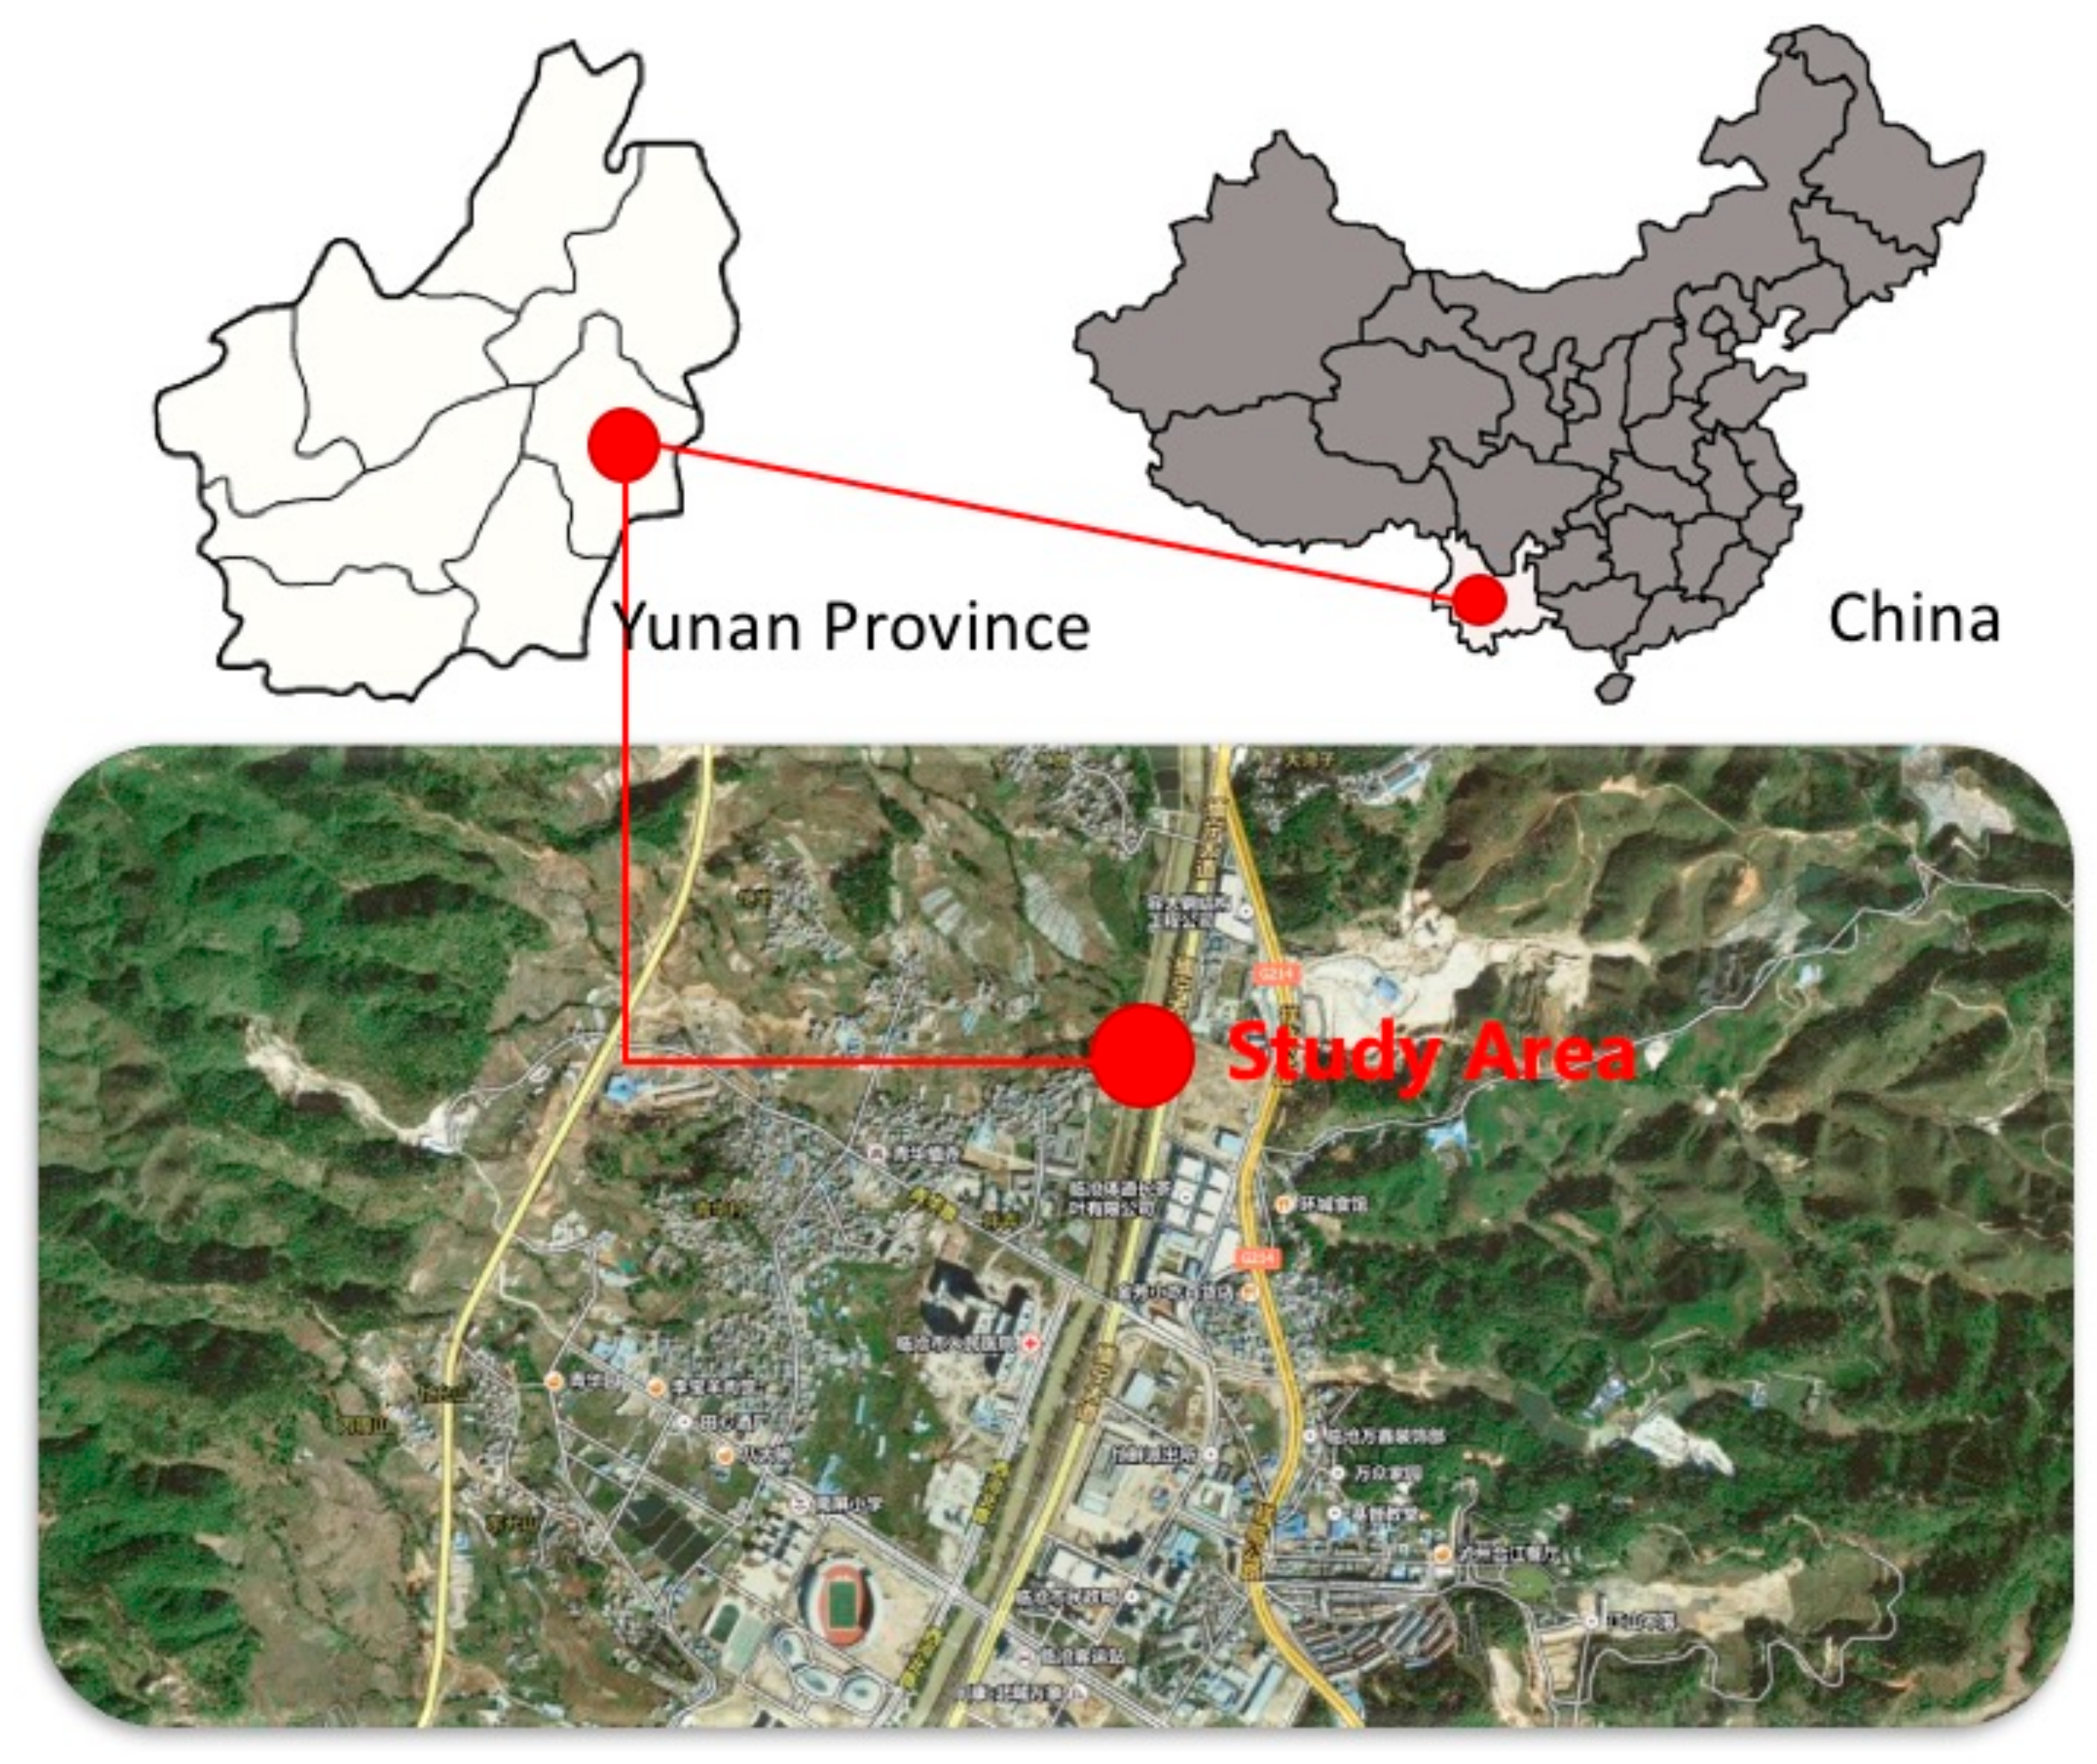
2.6.1. Scenario 01: Lincang Technology Innovation Park (LCTIP)
LCTIP is an industrial park in Lincang City, Yunnan Province, China (Figure 6). It is an innovation park based on overall and specific planning. The climate is subtropical with an annual rainfall of 1158 mm and an average temperature of 17 °C. The land-use type is M1, the first industrial land, based on land classification [33]. The soil is type B and C (clay) based on soil classification. The groundwater level is about 1–6.8 m. The slope is 4.5% higher on the east side than that of the west side. The area of 3.8 ha is covered by buildings, roads, and green space. The total construction area is 78,500 m2 that consists of mixed-use of commercial, residential, and public facilities. Figure 6, Figure 7 and Figure 8 sourced by the reference article [38].
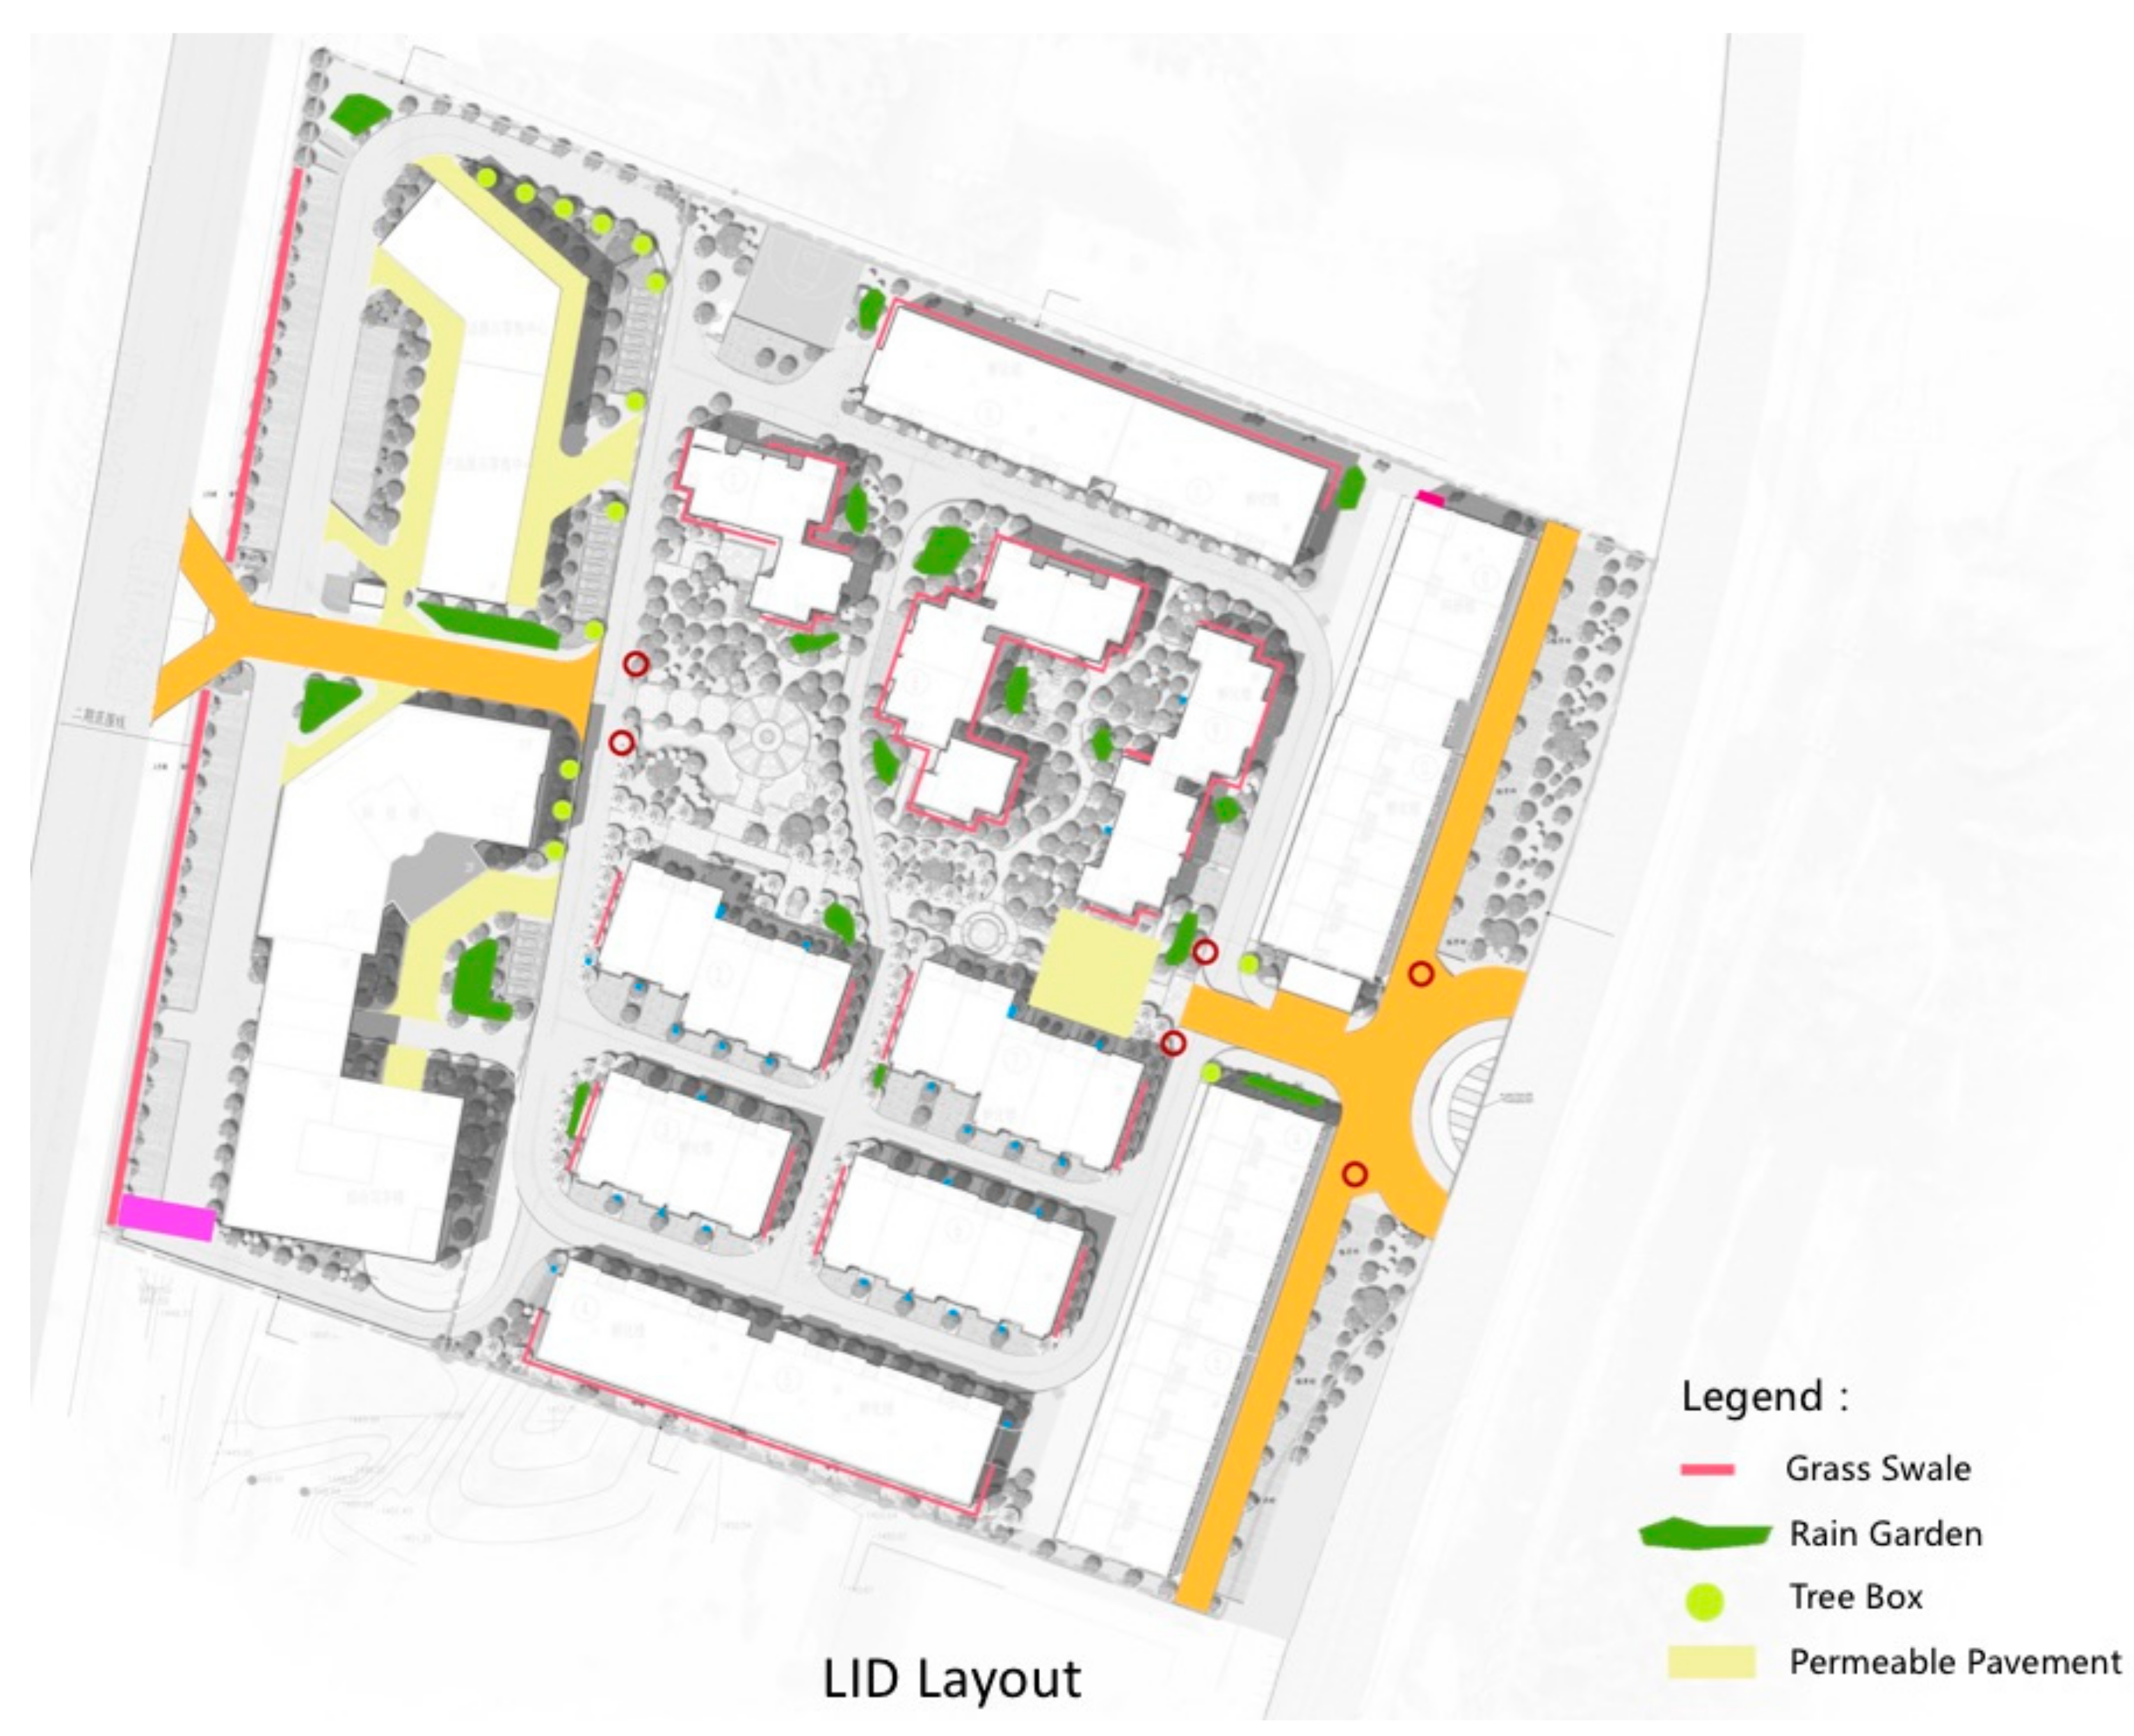
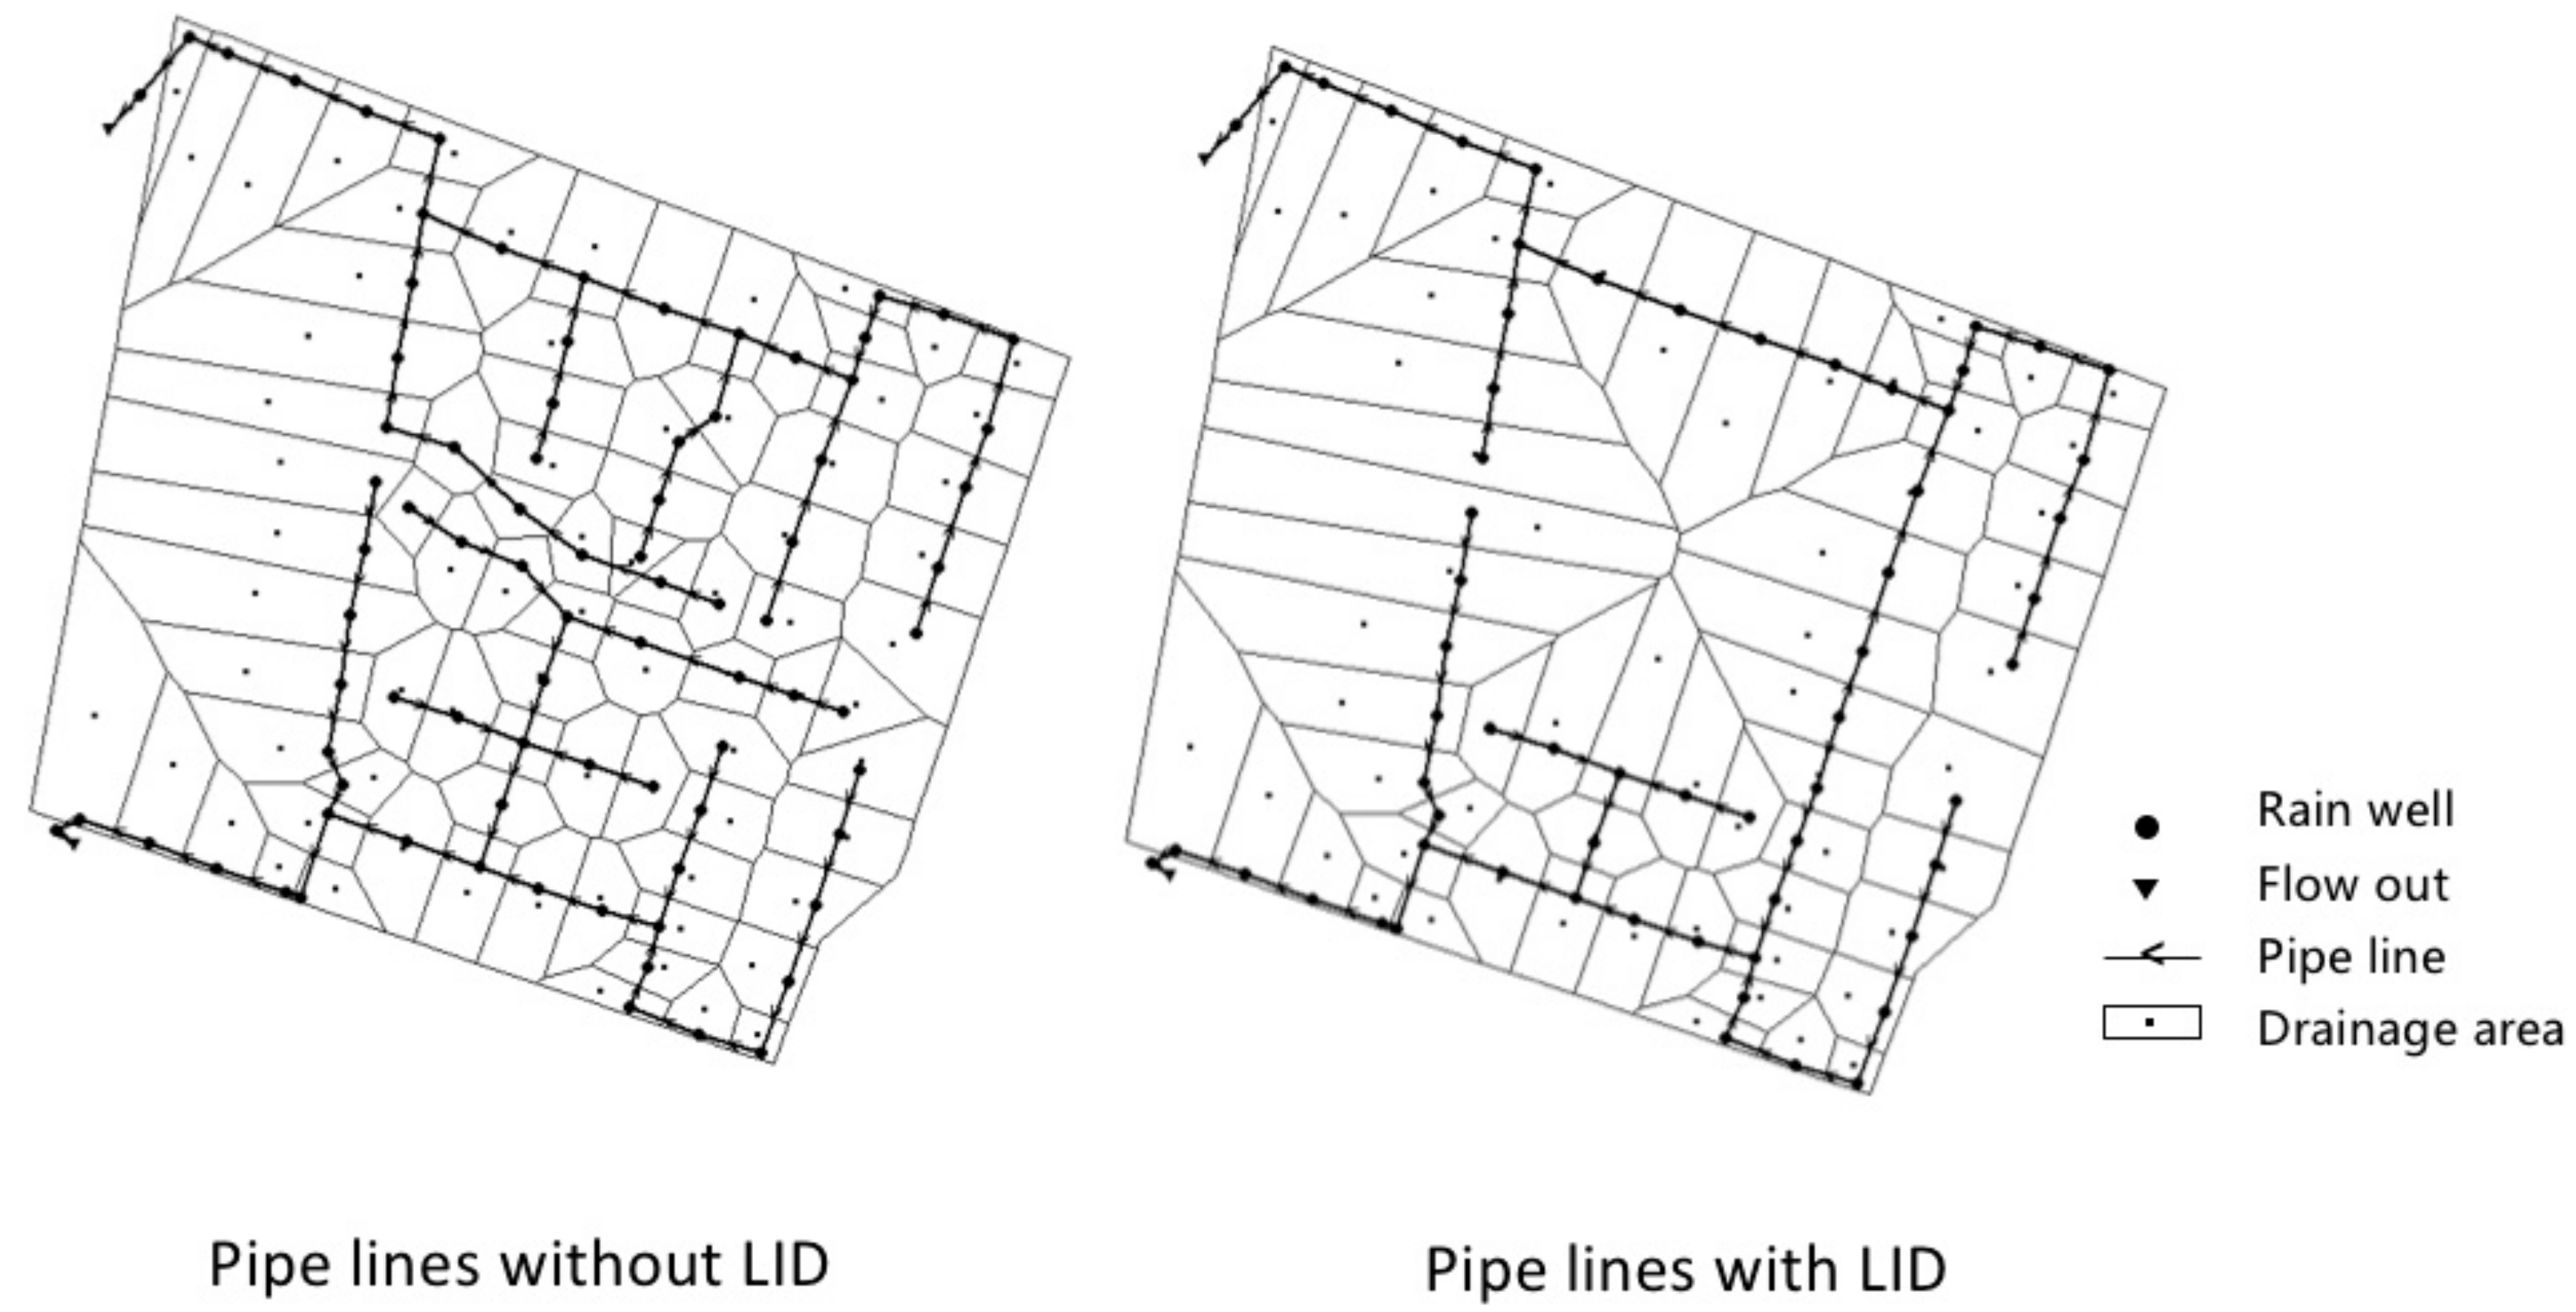
This project construction finished at the end of July 2016 with four LID techniques to reach the design goals of 80% annual runoff volume reduction and 60% TSS removal, which is in accordance with the requirements of China’s Sponge City Guideline. Four LID techniques are arranged in Figure 7, including a rain garden covering 1.31% of the land area, permeable concrete covering 9.32%, grass swale covering 1.283%, and tree boxes covering 0.085%. The drainage system for the stormwater is shown in Figure 8.
2.6.2. Scenario 02: Beijing Architecture University Case (BAU)
Table 3 shows the variables for the case BAU derived from a peer article [20]. Based on the same variables, Qi mainly used an AHP to analyze several LID efficiencies and ranked them. The presented method was applied to this case to rank LIDs with fewer indicators. The comparative result was provided in the next section.
3. Results
3.1. Results for Case LCTIP
3.1.1. Analysis Result by SWMM
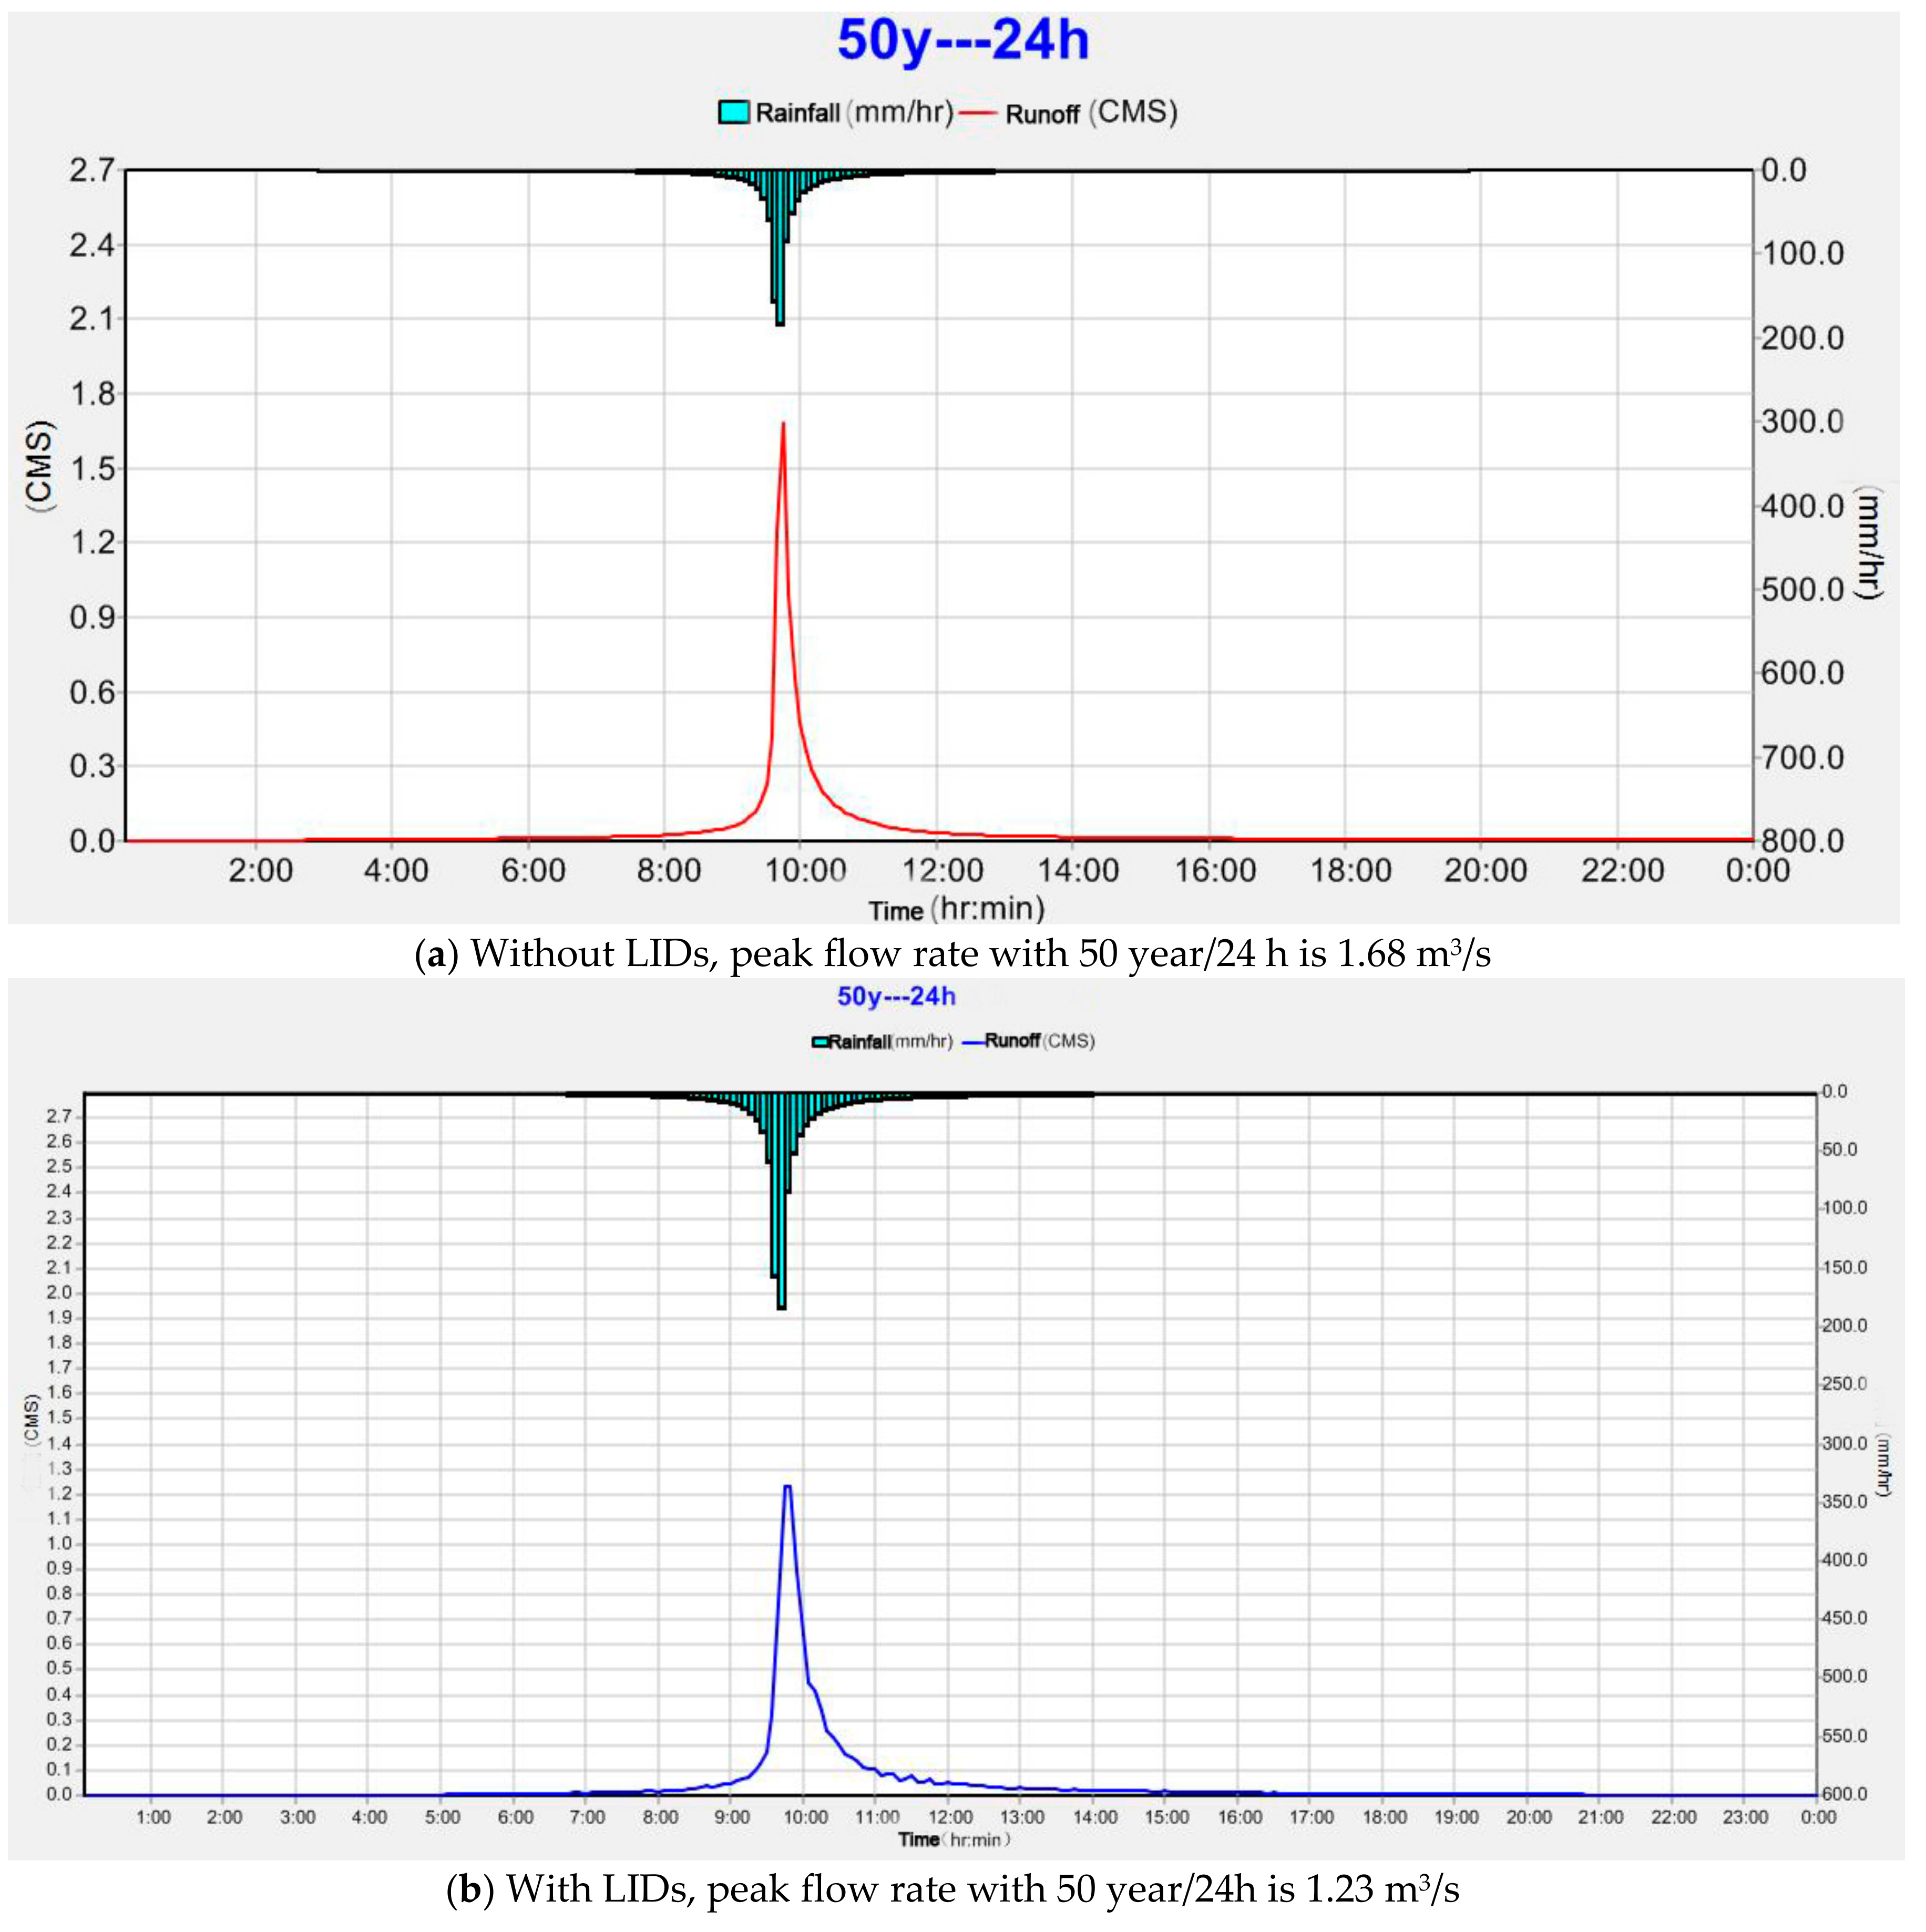
Based on 30-year precipitation data (1985–2015) and site specifics, the analysis was conducted using SWMM 5.0 for 5-, 10-, 20-, 50-, and 100-year return period. The result for individual LID and multi-LID performance for the 50-year return period is presented in Table 4. In addition, the runoff reduction with the 50-year/24-h frequency is shown in Figure 9. The runoff peak flow rate from 1.68 m3/s without LID down to 1.3 m3/s with LID, the reduction is 28.89%.
3.1.2. Valuing the Indicator
Based on the discussion above, we should consider overall planning, specific planning, project requirements, and site characteristics. According to the land classification, the land use M1 is required to have less impact on the environment, having less pollution and being less risky. Therefore, the environmental benefit is significant. The project is a joint project by local government and a developer, Zhongjin Company (ZJ). Based on the interview, ZJ cares more about groundwater recharge and water quality. ZJ hopes to use the rainwater for watering plants and washing cars. In addition, they care about value-added land values because several the housing units will be sold. They hope the LID/SPC construction will both retain and filter the water and enhance aesthetic amenities; these should be very helpful for them in promoting the projects. Therefore, the variables related to these concerns have been considered. The indicator values for the present approach are given in Table 5. The value of variables x1–x7 are derived from Table 3. Values for x8 and x9 were provided by the developer ZJ. Values for x10–x15 were obtained at by the numerical method presented previously in the interview with ZJ.
Statistical Package for the Social Sciences (SPSS) by IBM is a popular statistical package that can perform complex data manipulation and analysis with simple instructions (SPSS, IBM analytical product, USA, https://www.ibm.com/analytics/products). Using SPSS 22.0 (IBM, Armonk, NY, USA), normalization, PCA and correlation analysis (CA) were conducted by using the data in Table 5, and the results illustrated in Table 6, Table 7 and Table 8. From Table 6, the first and second principal components account for 60.68% of the variance and 29.09% of the variance, respectively. The cumulative variance is 89.76% explained by the two components. Based on the ratio of each component, the eight variables selected from the first principal components are x1, x2, x3, x4, x5, x6, x8, x11, and the four variables from the second principal components are x7, x9, x10, and x14.
Table 7 shows the correlation analysis for the first principal component. The x1 has a high correlation with x3, x4, x5, and x6, but is a different category. Therefore, x1 is kept, x3 has a high correlation with x4, x5, and x6 and they belong in the same category; therefore, x4, x5, and x6 were deleted. Table 8 shows the second principal component. The x14 has a high correlation with x15 and they belong in the same category; therefore, x15 was deleted. In the end, the discriminated variables are x1, x2, x3, x8, and x11 and x7, x10, and x14. The number of variables is down from 15 to 8.
Obviously, the first component emphasizes runoff quantity and quality control (x1, x2, x3), system cost, and stability (x8, x11). The second component emphasizes system management and aesthetics enhancement (x10 and x14).
3.1.3. Evaluation of Each LID
Based on the eight selected variables, the fewer indicators, PCA is conducted again by SPSS 22.0. The results are illustrated in Table 9. The 1st and the 2nd principal components explained 95% of the variance.
Using Equations (2) and (3), based on data in Table 5 and Table 9, the factor evaluation index Fi and the individual LID evaluation index Wi are calculated in Table 10. Clearly the rain garden has the best performance, and the order of each LID performance is: rain garden > permeable pavement > grass swale > barrel.
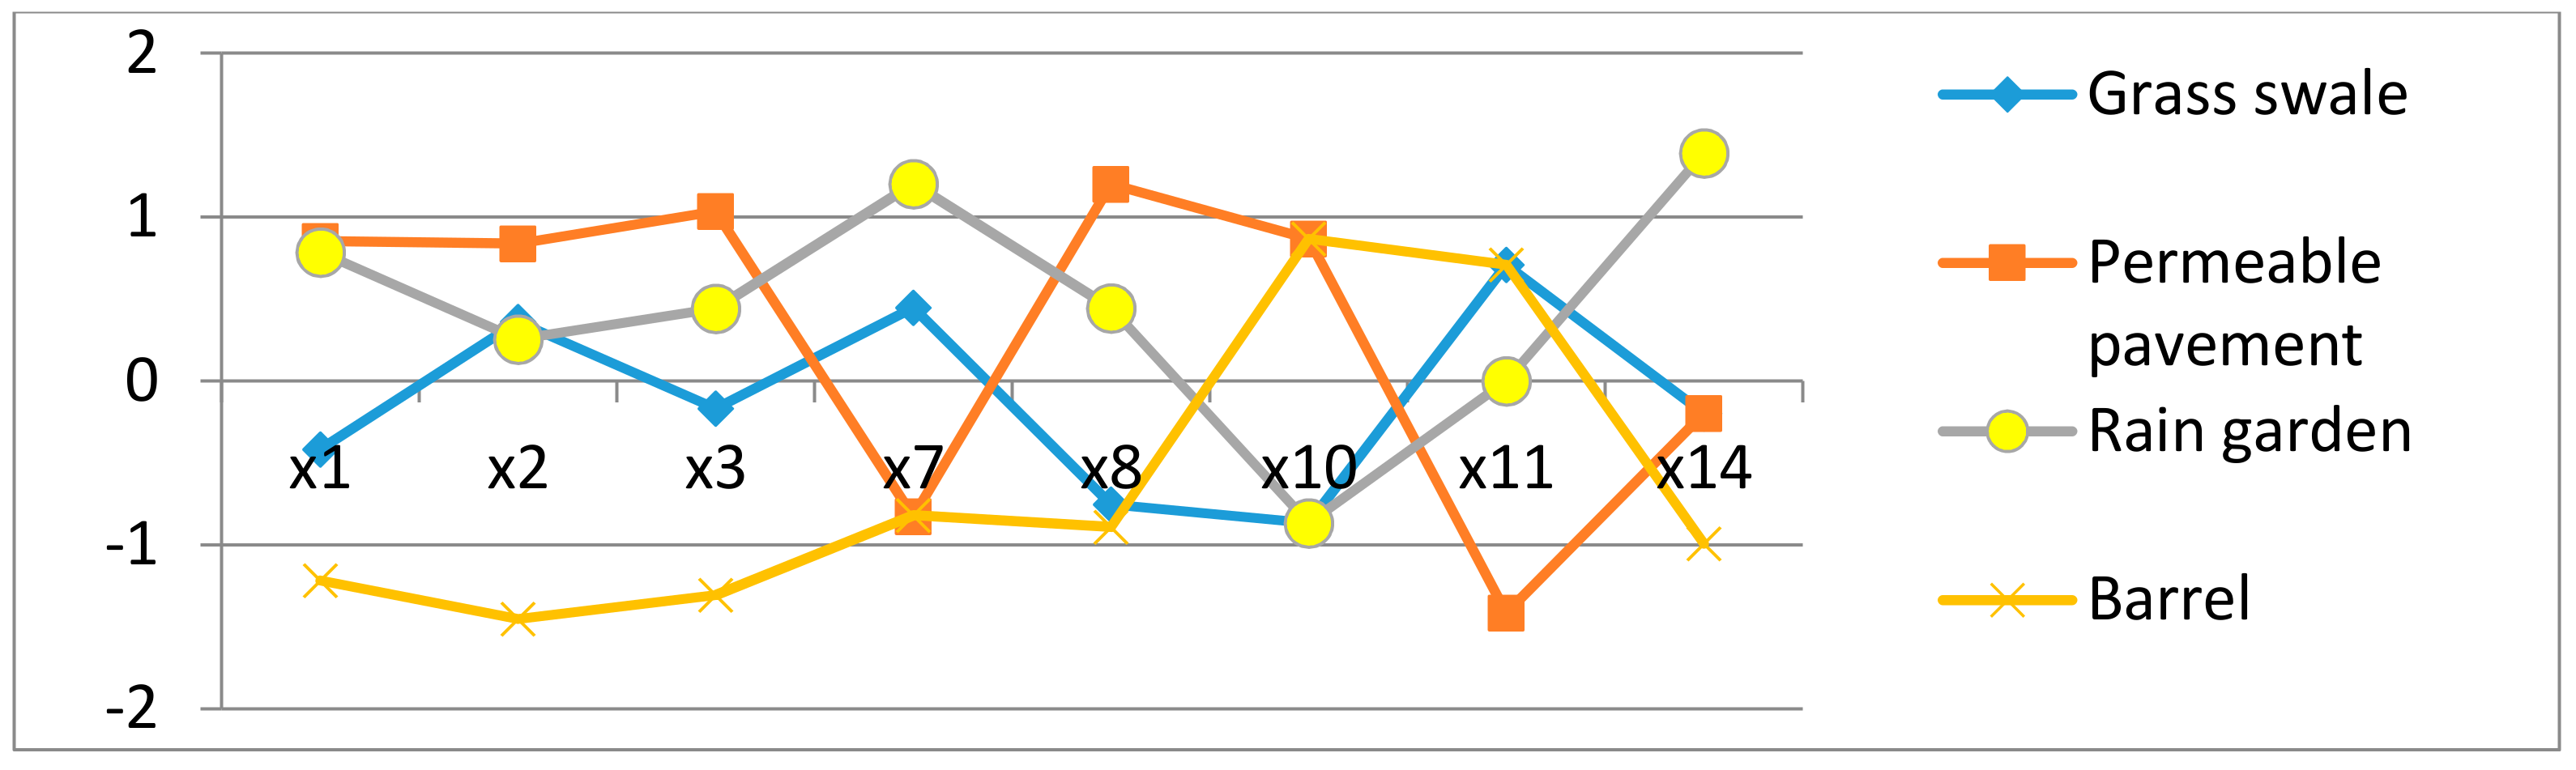
To see the influence of each indicator on each LID performance, Table 11 indicates the result of normalization for the selected variables by Equation (1), and Figure 10 shows the corresponding line graph. From Figure 10, the rain garden, in this case, is not the best performer for runoff quantity and quality control (x1, x2, x3), but it has a relatively lower cost and less management (x8, x10), and relative better system stability (x11), and the best landscape enhancement (x14). The grass swale and barrel have good performance with cost and management (x8, x11) compared to the permeable pavement, but the performance of runoff volume control, flow peak control, and pollutant abatement are the worst (x1, x2, x3). Therefore, the LID performance order is acceptable.
3.2. Results for Case BAU
3.2.1. PCCA Analysis
Based on the data in Table 3, the PCCA method was conducted by SPSS 22.0. The relevant results are shown in Table 12, Table 13, Table 14 and Table 15.
In Table 12, the first three principal components explain 36.8%, 30%, and 23% of the variance, for a cumulative value of 89.9%. Based on the ratio of each component taken, a total of nine variables from the first three components have been selected. The variables are x3, x6, x13, and x14, and x1, x7, x10, and x11, x12.
The correlation analysis for each component group is shown in Table 13, Table 14 and Table 15. According to Table 13, Table 14 and Table 15, x10 is highly correlated (more than 0.95) with x7 and in the same category; therefore, x10 was deleted, and x1, x3, x6, x7, x13, x14, x11, and x12 were kept as key variables.
3.2.2. Evaluation of Each LID
Based on the eight selected variables, PCCA was conducted by SPSS 22.0. The results are shown in Table 16. Similarly, each LID performance was evaluated by Equations (2) and (3), and the results indicated in Table 16 under the “PCCA” column.
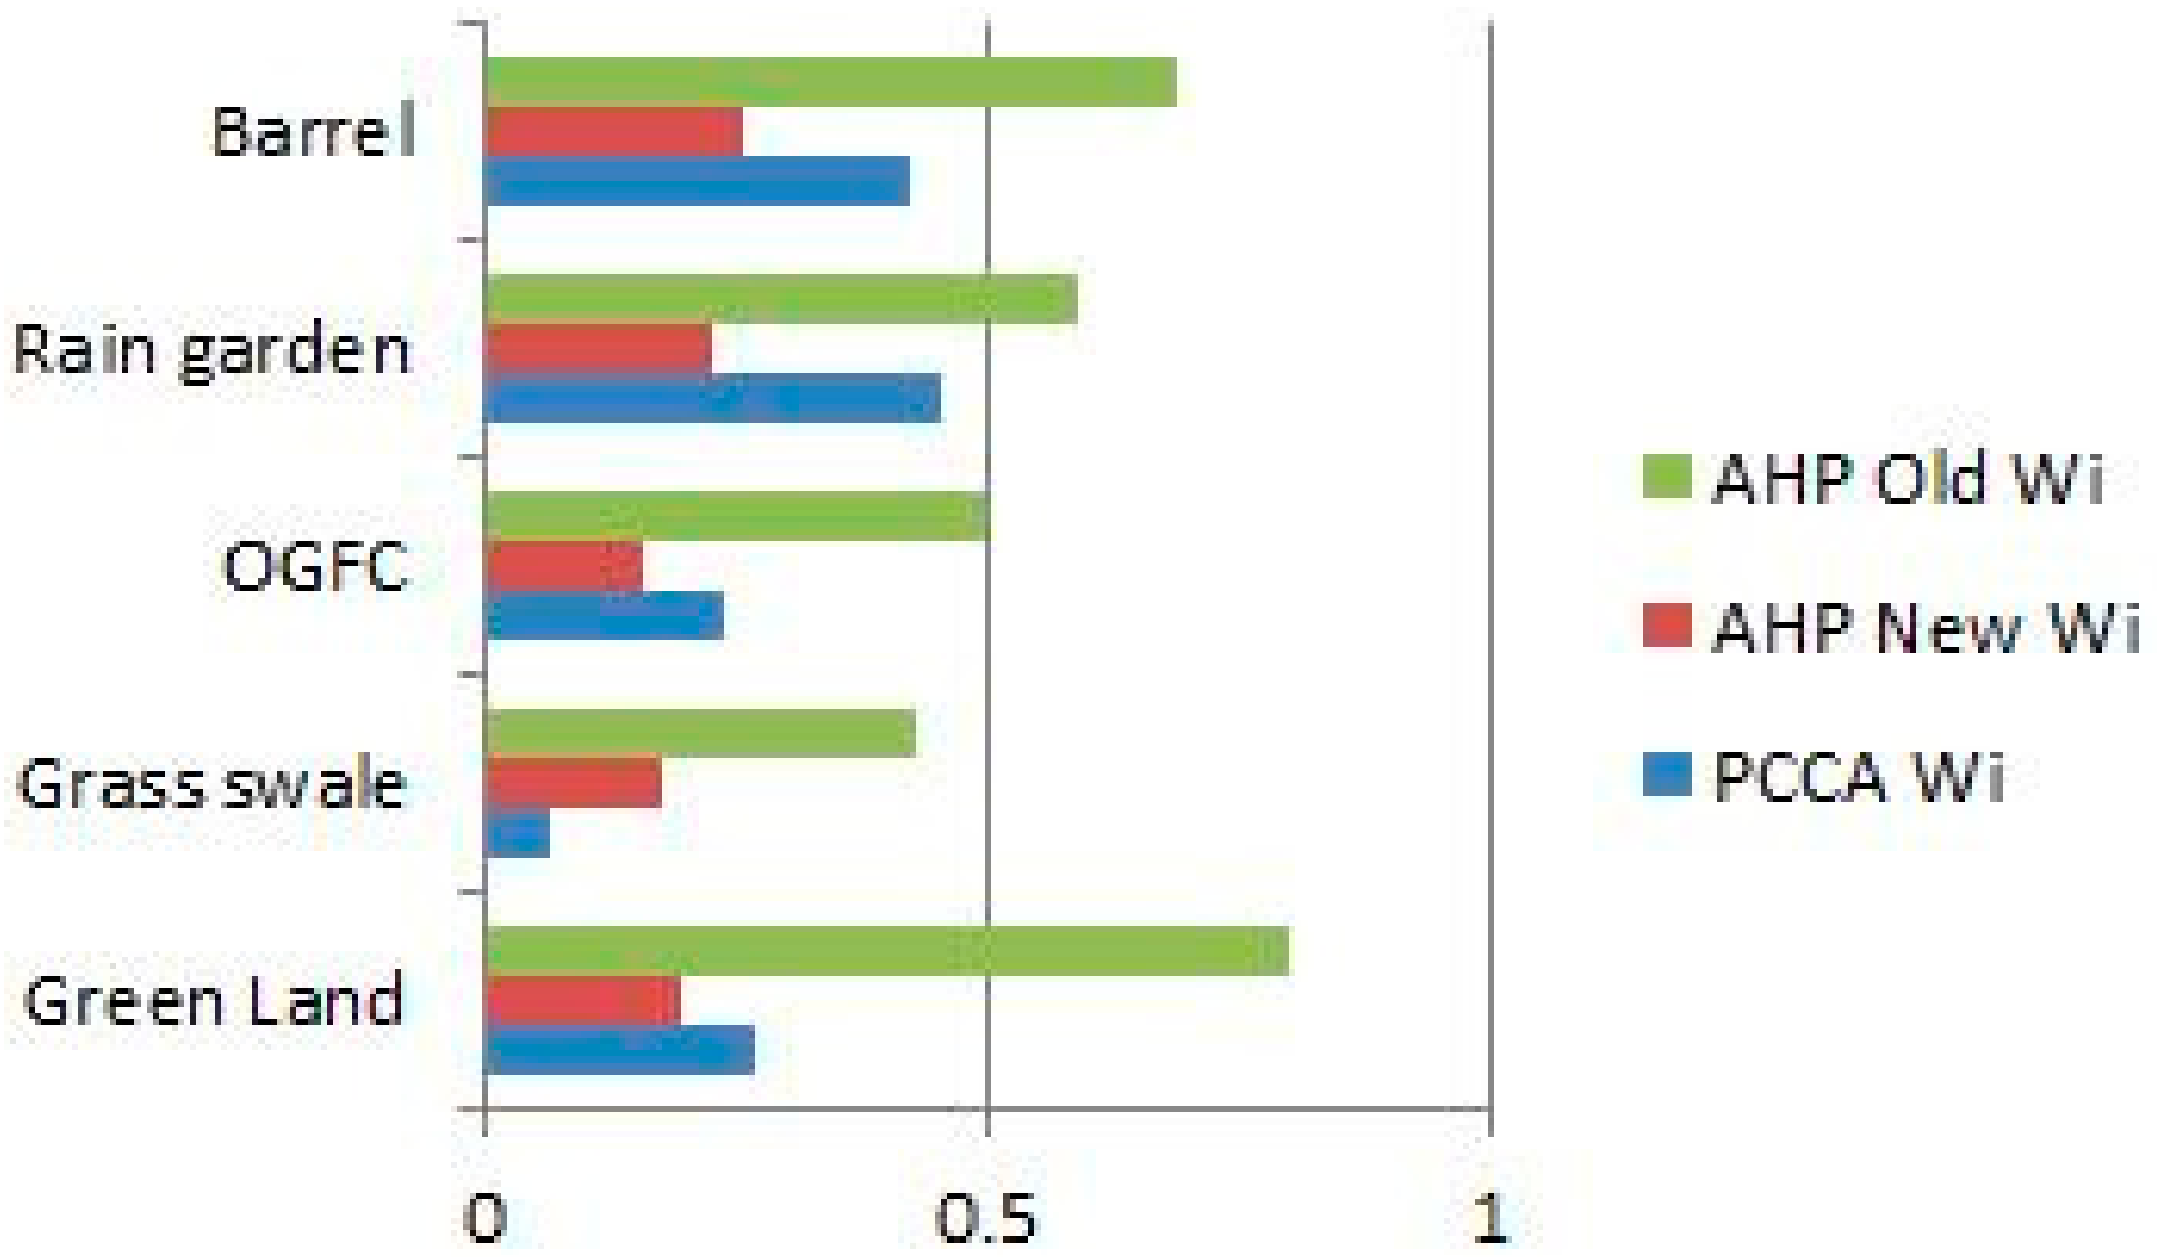
To compare the LID ranking change, in addition to PCCA method, analytic hierarchy process (AHP) was used to evaluate based on the eight selected variables by using software Yaahp 6.0 (AHP software, Kunming, China, http://www.yaahp.com/). The results are shown in Table 16 under “AHP New”. The original order from the peer article marked are under “AHP Old”, conducted by AHP and depending on 14 variables. All the results by the various methods are shown in Table 16. Figure 11 shows the corresponding graph.
4. Discussion
A multicriteria evaluation as a comprehensive evaluation can provide the decision maker with the ranking of various LID alternatives. The method integrating a principal component analysis and correlation analysis (PCCA) is a simple approach to reduce indicators/variables dimension, to identify presented variables, and to evaluate LID relative performance based on the triple bottom line of sustainability. The approach starts with a wide selection of indicators and then narrows down to fewer typical indicators. The process is subject to China’s overall planning and control-specific planning and complies with the project requirements and site specifics, hydrologic and hydraulic condition. The presented study is a China-specific approach; however, it can be used with international sites.
In addition to LIDs performance, the PCCA approach could be used to evaluate sponge city (SPC) performance because SPC is an application comprising various LIDs. The procedure of SPC evaluation is similar to the LCTIP case in this paper. However, SPC evaluation should consider several LIDs working together simultaneously in environmental, economic and social aspects.
The LCTIP case demonstrated that the rank of LID efficiency has changed while taking account of economic and social concerns when compared to the evaluation based on individual environmental criteria. As the scenarios shown in Figure 10 demonstrate, the permeable pavement has the best performance based on environmental indicators (x1~x3), but it attains lower performance than the rain garden with comprehensive evaluation (Table 10). Obviously, the environmental oriented evaluation based on environmental indicators individually, such as annual comprehensive runoff volume control, is insufficient to assess LID performance.
Based on these results, the typical indicators by PCCA analysis could be divided into three streams: (1) runoff volume control and pollutant removal; (2) cost savings and system stability; and (3) good system management and aesthetic enhancement of landscape. These are in accordance with the project circumstances.
The BAU case indicted that different analysis methods may result in different results, but the trend is the same. Additionally, the results show that the PCCA approach maintains a similar level and trend of LID performance, although PCCA applied fewer variables input (8 compared to 14). This will increase the effectiveness of evaluation. In Figure 11, the rank of green land performance is changed from number 1 to number 3. In addition, barrel and rain garden kept better performance than OGFC and grass swale. In future research, the difference can be identified by more sensitive analysis.
Although PCCA can be a viable approach to evaluate individual LID performance, several issues need to be addressed. First, each project may comprise several different LID techniques; therefore, optimizing the different LID is significant based on-site hydrologic and hydraulic condition. Second, it is very important to understand China’s overall planning, control specific planning, and site objectives, and when the presented approach is to be applied on another site, the planning landuse and site-specificities should be taken taken into account. Finally, the variables may involve quantitative and qualitative indicators; it is important to avoid subjectively and when possible use objective values. Some data could be acquired and calibrated by field monitoring. However, although the data set may be varied, the concept and procedures of PCCA analysis are the same.
5. Conclusions
In conclusion, multicriteria analysis based on environmental, economic, and social benefits is fundamental to the application of LID techniques. The present approach is based on planning land-use type and site-specific characteristics. It is an efficient method to evaluate LID performance by identifying typical variables. Additionally, the approach could be used to evaluate LID mixed-use cases such as SPC. The cases used in this paper are based on China-specific conditions; however, the approach could be used in international projects. The presented methodology developed the LID assessment method by using quantifiable indicators, and the statistical PCCA method.
The variables selected from a wide range of considerations such as overall planning, control-specific planning, project requirements, and site-specific characteristics could be optimized through the PCCA method. The typical variables address over 85% of cumulative variance contribution and variable independence. The typical variables will represent all the variables. The LCTIP case indicated that the typical principal components will concentrate on three streams: runoff quantity and quality issues such as runoff volume and flow peak mitigation, various pollutants abatement; minimized cost and system robustness; system best management and aesthetic enhancement for landscape. The study can guide China’s SPC design and help authorities select the appropriate LID design options.
Author Contributions
Conceptualization, N.L.; Methodology, N.L., P.D.; Software, N.L., X.H.; Validation, N.L.; P.D.; Formal Analysis, N.L., X.H.; Investigation, N.L., L.X.; Resources, N.L.; Data Curation, N.L., X.H.; Writing-Original Draft Preparation, N.L.; Writing-Review & Editing, N.L; Visualization; Supervision, P.D.; Project Administration N.L.; Funding Acquisition, P.D.
Funding
This study was funded by the Major Science and Technology Program for Water Pollution Control and Treatment (Grant number is 2014ZX07323001).
Acknowledgments
The authors thank Lincang Technology Innovation Park and Shenzhen WALD Urban Design Company for providing original designs and data for this study. This research was supported by the Major Science and Technology Program for Water Pollution Control and Treatment No. 2012ZX07302002. The optimization results by SUSTAIN, The Field Monitoring Analysis Report for LCTIP, and The Simulation Results by SWMM for 3 Schemes of LCTIP upon your request.
Conflicts of Interest
The authors declare no conflicts of interest.
References
- Lee, J.H.; Bang, K.W.; Ketchum, L.H.; Choe, J.S.; Yu, M.J. First flush analysis of urban storm runoff. Sci. Total Environ. 2002, 293, 163–175. [Google Scholar] [CrossRef]
- Ministry of Housing and Urban-Rural Department. The Guide of Sponge City Construction Technology—LID Technique; Ministry of Housing and Urban-Rural Department: Beijing, China, 2014.
- Ministry of Housing and Urban-Rural Department. Evaluation and Assessment Index of Sponge City Construction Performance (Experiment); Ministry of Housing and Urban-Rural Department: Beijing, China, 2015.
- Ministry of Housing and Urban-Rural Department. Sponge City Specific Plan Design Regulations; Ministry of Housing and Urban-Rural Department: Beijing, China, 2016.
- Environmental Protection Agency (EPA). Low Impact Development (LID): A Literature Review; EPA: Washington, DC, USA, 2000. [Google Scholar]
- Baptista, M.; Nascimento, N.; Castro, L.M.A.; Fernandes, W. Multi-Criteria Evaluation for Urban Storm Drainage. In Proceedings of the First SWITCH Scientific Meeting, Birmingham, UK, 9–10 January 2007. [Google Scholar]
- Center for Neighborhood Technology (CNT). The Value of Green Infrastructure: A Guide to Recognizing It’s Economic, Environmental and Social Benefits; Proceedings of the Water Environment Federation; Center for Neighborhood Technology (CNT): Chicago, IL, USA, 2010; pp. 1–76. [Google Scholar]
- Field, R.; Taruri, A.N. The Use of Best Management Practices (BMPs) in Urban Watersheds; U.S. Environmental Protection Agency: Washington, DC, USA, 2005; Volume 9, p. 268.
- EPA. Case Studies Analyzing the Economic Benefits of Low Impact Development and Green Infrastructure Programs; EPA: Washington, DC, USA, 2013.
- Ackerman, D.; Stein, E. Evaluating the effectiveness of best management practices using dynamic modeling. J. Environ. Eng. 2008, 134, 628–639. [Google Scholar] [CrossRef]
- Hsieh, C.; Davis, A.P. Evaluation and Optimization of Bioretention Media for Treatment of Urban Storm Water Runoff. J. Environ. Eng. 2005, 131, 1521–1531. [Google Scholar] [CrossRef] [Green Version]
- Line, D.E.; Brown, R.A.; Hunt, W.F.; Lord, W.G. Effectiveness of LID for Commercial Development in North Carolina. J. Environ. Eng. 2012, 138, 680–688. [Google Scholar] [CrossRef]
- Trinkaus, S.D. Assessing Pollutant Loads and Evaluation of Treatment Systems to Achieve Water Quality Goals for Land Development Projects. In Proceedings of the World Environmental and Water Resources Congress 2009: Great Rivers, Kansas, MO, USA, 17–21 May 2009; Volume 59, pp. 1–10. [Google Scholar]
- Lim, Y.H.; Asce, M.; Beaudry, A.M. Efficiency Assessments of a City’s BMP in a Cold Region. In Proceedings of the 2016 World Environmental and Water Resources Congress, West Palm Beach, FL, USA, 22–26 May 2016; pp. 319–328. [Google Scholar]
- Clary, J.; Urbonas, B.; Jones, J.; Strecker, E.; Quigley, M.; O’Brien, J. Developing, evaluating and maintaining a standardized stormwater BMP effectiveness database. Water Sci. Technol. 2002, 45, 65–73. [Google Scholar] [CrossRef] [PubMed]
- Urban Stormwater BMP Performance Monitoring. US EPA, Water Environment Research Foundation, Federal Highway Administration, and the Environmental and Water Resources Institute of the American Society of Civil Engineers. 2009. Available online: http://www.bmpdatabase.org/Docs/2009%20Stormwater%20BMP%20Monitoring%20Manual.pdf (accessed on 26 October 2018).
- Geosyntec Consultants Inc.; Wright Water Engineers Inc. Iternational Stormwater Best Management Practices (BMP) Database Pollutant Category Statistical Summary Report: Solids, Bacteria, Nutrients, and Metals; Geosyntec Consultants Inc.: Boca Raton, FL, USA; Wright Water Engineers Inc.: Denver, CO, USA, 2014. [Google Scholar]
- Barraud, S.; Miramond, M.; Gauffre, P.L. A-posteriori analysis of the relevance of a multi-criteria decision-aid method for best management practice choice in urban storm drainage. Urban Water J. 2004, 1, 209–216. [Google Scholar] [CrossRef]
- Jia, H.; Yao, H.; Tang, Y.; Yu, S.L.; Zhen, J.X.; Lu, Y. Development of multi-criteria index ranking system for urban runoff best management practices (BMPs) selection. Environ. Monit. Assess. 2013, 185, 7915–7933. [Google Scholar] [CrossRef] [PubMed]
- Qi, H. Design and Performance Simulation Study of Low Impact Development Rainwater Management Measures. Ph.D. Thesis, Beijing Jianzhu University, Beijing, China, 2013. [Google Scholar]
- Park, D.; Loftis, J.C.; Roesner, L.A. Performance Modeling of Storm Water Best Management Practices with Uncertainty Analysis. J. Hydrol. Eng. 2011, 16, 332–344. [Google Scholar] [CrossRef]
- Guan, M.; Sillanpaa, N.; Koivusalo, H. Assessment of LID practices for restoring predevelopment runoff regime in an urbanized catchment in southern Finland. Water Sci. Technol. 2015, 71, 1485–1491. [Google Scholar] [CrossRef] [PubMed]
- Castro, L.M.A.; Moura, P.; Barraud, S.; Baptista, M.B. Critical Analysis of a Multi-Criteria Decision-Aid Method for the Choice of the Urban Drainage System. NOVATECH. 2007. Available online: http://documents.irevues.inist.fr/bitstream/handle/2042/25447/0431_195castro.pdf (accessed on 26 October 2018).
- Mao, W. The Comparison of Several Typical Comprehensive Assessment Methods and SAS Software. Ph.D. Thesis, China Military Medical Science Institute, Beijing, China, 2011. [Google Scholar]
- Beinat, E.; Nijkamp, P. Land-use management and the path towards sustainability. In Multicriteria Analysis for Land-Use Management; Beinart, E., Nijkamp, P., Eds.; Springer: Dordrecht, The Netherlands, 1998; Volume 9, ISBN 0-7923-5198-3. [Google Scholar]
- Rogers, P.; Jalal, K.F.; Boyd, J.A. An Introduction to Sustainable Development; Harvard University: Cambridge, MA, USA, 2006. [Google Scholar]
- He, S. Shanghai Human Resource Comprehensive Evaluation Index Build and Research; Fudan University: Shanghai, China, 2007. [Google Scholar]
- Water Environment Federation. Green Infrasture Implementation; WEF Special Publication; Water Environment Federation: Alexandria, VA, USA, 2014. [Google Scholar]
- EPA. The Economic Benefits of Green Infrastructure: A Case Study of Lancaster; EPA: Washington, DC, USA, 2014. [Google Scholar]
- Stratus Consulting. A Triple Bottom Line Assessment of Traditional and Green Infrastructure Options for Controlling CSO Events in Philadelphia’s Watersheds; Final Report; Stratus Consulting: Philadelphia, PA, USA, 2009. [Google Scholar]
- Seo, M.; Jaber, F.; Srinivasan, R.; Jeong, J. Evaluating the Impact of Low Impact Development (LID) Practices on Water Quantity and Quality under Different Development Designs Using Swat. Water 2017, 9, 193. [Google Scholar] [CrossRef]
- Garofalo, G.; Palermo, S.; Principato, F.; Theodosiou, T.; Piro, P. The influence of Hydrologic Parameter on the Hydraulic Efficiency of an Extensive Green Groof in Mediterranean Area. Water 2016, 8, 44. [Google Scholar] [CrossRef]
- Wagner, R.A. Calculation of LID Benefits in Meeting New Development Standards. In Proceedings of the 2010 International Low Impact Development Conference, San Francisco, CA, USA, 11–14 April 2010. [Google Scholar]
- Urban Plan Basic Terms; (GB/T50280-ed.); Housing and Urban Construction Department: Beijing, China, 1998.
- Wu, Z.; Li, D. City Plan Principles; China Building Industrial Publisher: Beijing, China, 2012. [Google Scholar]
- Ministry of Housing and Urban-Rural Department. The Code for Classification of Urban Landuse and Planning Standards of Development Land (GB50137-20); Ministry of Housing and Urban-Rural Department: Beijing, China, 2012.
- Souhals, T.P.; Hollingshead, A. Valuing Green Infrastructure; Water Environment Federation: Alexandria, VA, USA, 2014; ISBN 978-1-57278-305-8. [Google Scholar]
- Li, N.; Qin, C.; Du, P. Optimization of China Sponge City Design: The Case of Lincang Technology Innovation Park. Water 2018, 10, 1189. [Google Scholar] [CrossRef]
- De Araújo, D.C.; da Silva, P.O.; Curi, W.F.; Cabral, J.J. The multi-criteria analysis applied to the management of urban pluvial waters. Braz. J. Water Resour. 2017, 22, e18. [Google Scholar]
- Lv, X. Comprehensive evaluation index method review. Cooper. Econ. Technol. 2009, 365. [Google Scholar] [CrossRef]
Figure 1.
Low Impact Development (LID) Performance Evaluation Framework.

Figure 2.
Environmental Indicators.

Figure 3.
Economic Indicators.

Figure 4.
Social Indicators.

Figure 5.
Site-specific characteristics.

Figure 6.
Lincang Technology Innovation Park (LCTIP) Location.

Figure 7.
LID Layout.

Figure 8.
Drainage System.

Figure 9.
Runoff change during the 50 year/24 h recurrence.

Figure 10.
The line graph for the eight selected variables.

Figure 11.
The weight of LID for the three analysis methods.


Table 1.
Control-Specific Planning (CP) Index System and Drawings.
| CP | Indicator | Drawing |
|---|---|---|
| Legally Required Indicators and Drawing |
|
|
| Environmental Control |
|
*—The indicators related to environmental control.
Table 2.
China Urban Land-Use Classification, First Level Category.
| Land-Use Code | Category | Description |
|---|---|---|
| Residential land | Land for residences and residential facilities | |
| A | Administration and public service land | Land for administration, cultural, education, sports, sanitation institutes, including their facilities, but not including the service facilities in the residential land category |
| B | Commercial and business facilities land | Land for commerce, business, entertainment, recreation, and their facilities, but not including the services facilities in the residential land category |
| M | Industrial land | Land for industrial production, storage, and their facilities, including special rail and wharf facilities and their roads and parking lots, but not including outdoor parking lots |
| W | Logistic and warehouse land | Land for goods storage, transfer, and delivery, including their roads, parking lots, and delivery vehicle stations |
| S | Street and transportation facilities land | Land for urban roads and transportation facilities, but not including the roads and parking lots in the residential and industrial land categories |
| U | Municipal facilities land | Land for a supplement, environment, safety, and their facilities |
| G | Green space land | Land for public open space, such as public green land, protective green land, etc. |
Table 3.
Variables derived from the Case of Beijing Architecture University.
| LID | x1 | x2 | x3 | x4 | x5 | x6 | x7 | x8 | x9 | x10 | x11 | x12 | x13 | x14 |
|---|---|---|---|---|---|---|---|---|---|---|---|---|---|---|
| GL | 0.219 | 0.188 | 0.168 | 0.343 | 0.142 | 0.08 | 393,971 | 4728 | 5 | 5 | 1 | 2 | 4 | 3 |
| GS | 0.131 | 0.088 | 0.005 | 0.054 | 0.162 | 0.023 | 127,842 | 3008 | 2 | 5 | 2 | 2 | 3 | 3 |
| OGFC | 0.409 | 0.404 | 0.031 | 0.041 | 0.12 | 0.048 | 6,146,047 | 65,239 | 4 | 2 | 4 | 3 | 3 | 2 |
| RG | 0.161 | 0.124 | 0.276 | 0.032 | 0.203 | 0.075 | 2,079,328 | 134,545 | 2 | 4 | 5 | 4 | 5 | 5 |
| BR | 0.133 | 0.141 | 0.006 | 0.042 | 0.025 | 0.011 | 6123 | 330 | 4 | 5 | 5 | 5 | 2 | 1 |
Note: x1—runoff reduction; x2—peak flow reduction; x3—COD; x4—SS; x5—TN; x6—TP; x7—cost; x8—maintenance cost; x9—management cost; x10—system stability; x11—system reliability; x12—water reuse; x13—Aesthetic; x14—Functional landscape (LA); OGFC—permeable pavement; GL—grassland; GS—grass swale; RG—rain garden; BR—barrel.
Table 4.
Pollutants removal change during the 50-year recurrence by SWMM 5.0, Scenario 01.
| Performance | Contaminants | No LID | Multi-LID | GS | OGFC | RG | TB |
|---|---|---|---|---|---|---|---|
| Runoff reduction | 32.85% | 3.78% | 9.30% | 9.01% | 1.16% | ||
| coefficient | 0.8249 | 0.554 | 0.7938 | 0.7482 | 0.7506 | 0.8153 | |
| Flow reduction | 12% | 7.50% | 10.00% | 7.50% | 1% | ||
| Peak reduction | 28.78% | 7.97% | 10.06% | 16.16% | 3.55% | ||
| Pollutant removal | TSS | 31.97% | 4.34% | 9.21% | 6.78% | 1.09% | |
| COD | 32.28% | 4.51% | 9.16% | 6.87% | 0.91% | ||
| BOD | 32.71% | 4.87% | 9.28% | 7.14% | 0.91% | ||
| TN | 32.62% | 3.74% | 9.26% | 7.04% | 0.92% | ||
| TP | 32.59% | 4.75% | 9.51% | 7.22% | 0.92% |
Note: GS—grass swale; OGFC—permeable pavement; RG—rain garden; TB—tree box.
Table 5.
Performance indicator of LCTIP.
| LID | x1 | x2 | x3 | x4 | x5 | x6 | x7 | x8 |
| Runoff | Peak Low | COD | BOD | TN | TP | SS | Cost | |
| Grass swale | 3.78 | 7.97 | 4.51 | 4.87 | 3.74 | 4.75 | 4.34 | 26,769 |
| Permeable pavement | 9.30 | 10.06 | 9.16 | 9.28 | 9.26 | 9.51 | 0.21 | 842,160 |
| Rain garden | 9.01 | 7.5 | 6.87 | 7.14 | 7.04 | 7.22 | 6.78 | 222,750 |
| Tree box | 1.16 | 3.55 | 0.91 | 0.91 | 0.92 | 0.92 | 1.09 | 28,000 |
| LID | x9 | x10 | x11 | x12 | x13 | x14 | x15 | |
| Maintenance | Management | Stability | Reliability | Land Value Added | Aesthetic | Functional | ||
| Grass swale | 10,780 | 2 | 5 | 2 | 3 | 3 | 3 | |
| OGFC | 6000 | 4 | 2 | 4 | 4 | 3 | 2 | |
| Rain garden | 10,890 | 2 | 4 | 5 | 5 | 5 | 5 | |
| Tree box | 200 | 4 | 5 | 5 | 1 | 2 | 1 |
OGFC—permeable pavement.
Table 6.
PCA of LCTIP by SPSS 22.0.
| Principal Component | x1 | x2 | x3 | x4 | x5 | x6 | x7 | x8 | x9 |
| 1 | 0.91 | 0.89 | 0.97 | 0.96 | 0.98 | 0.97 | 0.14 | 0.94 | 0.34 |
| 2 | 0.37 | 0.17 | 0.22 | 0.25 | 0.19 | 0.23 | 0.99 | 0.34 | 0.83 |
| Principal Component | x10 | x11 | x12 | x13 | x14 | x15 | Eigenvalues | % of Variance | Cumulative % |
| 1 | 0.12 | 0.95 | 0.01 | 0.75 | 0.4 | 0.25 | 9.102 | 60.68 | 60.68 |
| 2 | 0.93 | 0.26 | 0.06 | 0.66 | 0.89 | 0.97 | 4.363 | 29.09 | 89.76 |
Respectively, in the following tables, * indicates p < 0.05, while ** indicates p < 0.01.
Table 7.
Correlation Analysis (CA) for a first principal component of LCTIP by SPSS 22.0.
| Variables | x1/Runoff Reduction | x2/Peak Flow Reduction | x3/COD | x4/BOD | x5/TN | x6/TP | x8/Cost | x11/System Stability |
|---|---|---|---|---|---|---|---|---|
| x1 | 1 | 0.806 | 0.957 * | 0.955 * | 0.974 * | 0.957 * | 0.747 | −0.804 |
| x2 | 1 | 0.937 | 0.944 | 0.892 | 0.938 | 0.736 | −0.746 | |
| x3 | 1 | 0.999 ** | 0.993 ** | 1.000 ** | 0.83 | −0.863 | ||
| x4 | 1 | 0.989 * | 1.000 ** | 0.807 | −0.841 | |||
| x5 | 1 | 0.993 ** | 0.854 | −0.891 | ||||
| x6 | 1 | 0.823 | −0.857 | |||||
| x8 | 1 | −0.995 ** | ||||||
| x11 | 1 |
Table 8.
CA for a second principal component of LCTIP by SPSS 22.0.
| Variables | x7/TSS | x10/Management | x14/Aesthetic | x15/Functional |
|---|---|---|---|---|
| x7 | 1 | −0.937 | 0.820 | 0.921 |
| x10 | 1 | −0.688 | −0.845 | |
| x14 | 1 | 0.969 * | ||
| x15 | 1 |
Table 9.
PCA of selected variables of LCTIP by SPSS 22.0.
| Principal Component | x1 | x2 | x3 | x7 | x8 | x10 | x11 | x14 | Eigenvalues | % of Variance | Cumulative % |
|---|---|---|---|---|---|---|---|---|---|---|---|
| 1 | 0.932 | 0.889 | 0.98 | −0.099 | 0.922 | 0.091 | 0.44 | −0.946 | 4.595 | 57.434 | 57.434 |
| 2 | 0.315 | 0.171 | 0.183 | 0.992 | −0.384 | −0.958 | 0.845 | 0.307 | 3.003 | 37.532 | 94.966 |
Table 10.
LIDs evaluation index and rank for LCTIP.
| LIDs | F1 | F2 | W | Order |
|---|---|---|---|---|
| Grass swale | 0.153902 | 1.99872 | 0.8385 | 3 |
| OGFC | 3.382476 | −2.76826 | 0.9037 | 2 |
| Rain garden | 0.286701 | 2.648591 | 1.1587 | 1 |
| Barrel | −3.11809 | −1.87904 | −2.496 | 4 |
Table 11.
Normalization of the eight selected variables of LCTIP by SPSS 22.0.
| LIDs | x1 | x2 | x3 | x7 | x8 | x10 | x11 | x14 |
|---|---|---|---|---|---|---|---|---|
| Grass swale | −0.41702 | 0.36095 | −0.16792 | 0.44714 | −0.75353 | −0.86603 | 0.70711 | −0.19868 |
| Permeable pavement | 0.85128 | 0.83616 | 1.03337 | −0.82863 | 1.2001 | 0.86603 | −1.41421 | −0.19868 |
| Rain garden | 0.78465 | 0.25409 | 0.44176 | 1.20086 | 0.44463 | −0.86603 | 0 | 1.39076 |
| Barrel | −1.21891 | −1.4512 | −1.30721 | −0.81937 | −0.89121 | 0.86603 | 0.70711 | −0.9934 |
Table 12.
PCA of scenario 02 by SPSS 22.0.
| Principal Component | x1 | x2 | x3 | x4 | x5 | x6 | x7 | x8 | x9 |
| 1 | 0.02 | 0.13 | 0.97 | 0.24 | 0.81 | 0.89 | 0.1 | 0.75 | 0.26 |
| 2 | 0.97 | 0.96 | 0.12 | 0.19 | 0.05 | 0.2 | 0.98 | 0.37 | 0.24 |
| 3 | 0.12 | 0.01 | 0.15 | 0.55 | 0.42 | 0.2 | 0.11 | 0.43 | 0.07 |
| Principal Component | x10 | x11 | x12 | x13 | x14 | Eigenvalues | % of Variance | Cumulative % | |
| 1 | 0.08 | 0.01 | 0.13 | 0.99 | 0.92 | 5.16 | 36.86 | 36.86 | |
| 2 | 0.97 | 0.18 | 0.11 | 0.01 | 0.14 | 4.21 | 30.09 | 66.95 | |
| 3 | 0.15 | 0.94 | 0.99 | 0.11 | 0.13 | 3.23 | 23.04 | 89.99 |
Table 13.
CA about the 1st component of Scenario 02 by SPSS 22.0.
| Variables | x3/COD | x6/TP | x13/Aesthetic | x14/Functional LA |
|---|---|---|---|---|
| X3 | 1 | 0.865 | 0.945 * | 0.847 |
| x6 | 1 | 0.890 * | 0.702 | |
| x13 | 1 | 0.946 * | ||
| x14 | 1 |
Table 14.
CA about the 2nd component of Scenario 02 by SPSS 22.0.
| Variables | x1/Runoff Reduction | x7/Cost | x10/System Stability |
|---|---|---|---|
| x1 | 1 | 0.917 * | −0.898 * |
| x7 | 1 | −0.998 ** | |
| x10 | ** | 1 |
Table 15.
CA about the 3rd component of Scenario 02 by SPSS 22.0.
| Variables | x11/System Reliability | x12/Water Reuse |
|---|---|---|
| x11 | 1 | 0.908 * |
| x12 | 1 |
Table 16.
The LID efficiency rank for different methods.
| LIDs | PCCA | AHP New | AHP Old | |||
|---|---|---|---|---|---|---|
| Weight | Order | Weight | Order | Weight | Order | |
| Green land | 0.694 | 2 | 0.193 | 3 | 0.8007 | 1 |
| Grass swale | −1.3712 | 4 | 0.177 | 4 | 0.4296 | 5 |
| OGFC | 0.3542 | 3 | 0.154 | 5 | 0.4941 | 4 |
| Rain garden | 2.5229 | 1 | 0.225 | 2 | 0.5889 | 3 |
| Barrel | 2.1999 | 5 | 0.252 | 1 | 0.6868 | 2 |
© 2018 by the authors. Licensee MDPI, Basel, Switzerland. This article is an open access article distributed under the terms and conditions of the Creative Commons Attribution (CC BY) license (http://creativecommons.org/licenses/by/4.0/).
Share and Cite
MDPI and ACS Style
Li, N.; Xie, L.; Du, P.; Huang, X. Multi-Criteria Evaluation for China Low-Impact Development Based on Principal Component Analysis. Water 2018, 10, 1547. https://doi.org/10.3390/w10111547
AMA Style
Li N, Xie L, Du P, Huang X. Multi-Criteria Evaluation for China Low-Impact Development Based on Principal Component Analysis. Water. 2018; 10(11):1547. https://doi.org/10.3390/w10111547
Chicago/Turabian StyleLi, Nan, Lina Xie, Pengfei Du, and Xiaochan Huang. 2018. "Multi-Criteria Evaluation for China Low-Impact Development Based on Principal Component Analysis" Water 10, no. 11: 1547. https://doi.org/10.3390/w10111547
Note that from the first issue of 2016, this journal uses article numbers instead of page numbers. See further details here.