1. Introduction
Water resources development is essential to bring about sustainable development and overall economic growth [
1]. The integrated water resources management in a river basin described in this case study is essential for the economic welfare of the society and healthy environmental function.
Nowadays, the global hydrological cycle has been responding to the observed effects of global warming, which include an increasing atmospheric water vapor content and changing precipitation patterns [
2,
3]. The change in precipitation alters the hydrological systems, affecting water resources in both quantity and quality [
4]. To some extent, global climate change has also changed the availability of water resources in developing countries [
5]. The change in precipitation may greatly affect the hydrological systems of river basins. The discharge of many rivers in the world has been changing due to climate change and intensive human activities [
6].
Analysis of potential changes in runoff regimes shows that, by the year 2050, most regions in the world will experience significant changes in their hydrological regime [
7]. These will be changes brought by climate change, which interacts with existing anthropogenic factors and thus causes additional stress to riverine ecosystems [
8].
The Awash river basin is one of the 12 river basins in Ethiopia. Frequent and persistent droughts and the associated food insecurity of the basin have drastically affected the human and livestock population [
3,
8,
9].
Impacts of climate change are increasingly becoming a challenge for global society in tackling food security and water problems [
8,
10,
11]. Assessing and understanding climatic historical changes is essential for the optimal allocation of water resources.
Changes in annual and seasonal precipitation and hydrological regimes affect water resources for agriculture production and overall economic growth in arid and semi-arid parts of the country. The availability of water resources, as well as their management and use within the basin, is impacted by the spatiotemporal variability of rainfall. Trend analyses of precipitation, temperature, and discharge are essential to study the impacts of climate change for water resources planning and management [
12]. Additionally, these climatic variations will have unexpected consequences with respect to frequency and intensity. Furthermore, analysis of the temporal variability of precipitation and discharge is important in investigating drought and flood risks and the management of water resources [
13]. Analysis of the trends of climatic variables and river discharge, particularly in river basins, has thus become a vital research area for many researchers [
14].
For example, Chen et al. [
2]. investigated river discharge trends from climate variables in the Athabasca river basin and found an apparent decline in long-term discharge variation. Yang et al. [
15], using the Mann–Kendall (MK) test, found that annual and seasonal precipitation levels increased significantly in northwest China from 1960 to 2013. Asfaw et al. [
7] investigated the variability and time series trends of rainfall and temperature in the Woleka sub-basin, northcentral Ethiopia, and found decreased annual rainfall as well as decreased levels of Belg and Kiremt rainfall. Furthermore, the authors of References [
16,
17,
18,
19,
20] studied the trends of the spatial and temporal variability of climatic variables across different stations.
Our study region is heavily dependent on rain-fed agriculture, which is driven by intra-seasonal and inter-annual variability in climate, resulting in the occurrence of frequent droughts and floods that negatively affect agricultural production [
21].
The precipitation and discharge of the Awash river basin has changed to varying degrees in recent years [
22]. Highly variable rainfall, frequent floods and droughts, and limited storage capacity continue to constrain the ability of the basin to produce reliable food supplies in spite of being relatively rich in water and land resources [
22].
No study has yet been conducted on the trends of climatic variables and discharge in the Awash river basin. Therefore, assessing the trends of climate and discharges in the Awash river basin is very essential for the management of water resources for future economic development. The Mann–Kendall (MK) test, innovative trend analysis method (ITAM), and Sen’s slope estimator test methods were used to study the temporal trends of climate variables and river discharge with the aim of investigating the potential evidences of climate change which could affect the availability and sustainability of water resources in the basin.
This paper aims to investigate the trends and changes of climatic and hydrological variables of the Awash river basin from 1980 to 2016. The objectives of the study are (1) to analyze climatic trends, (2) to investigate the temporal variations in precipitation, temperature, and discharge, and (3) to assess the correlation between climatic variables and river discharge.
2. Materials and Methods
2.1. Description of Study Area
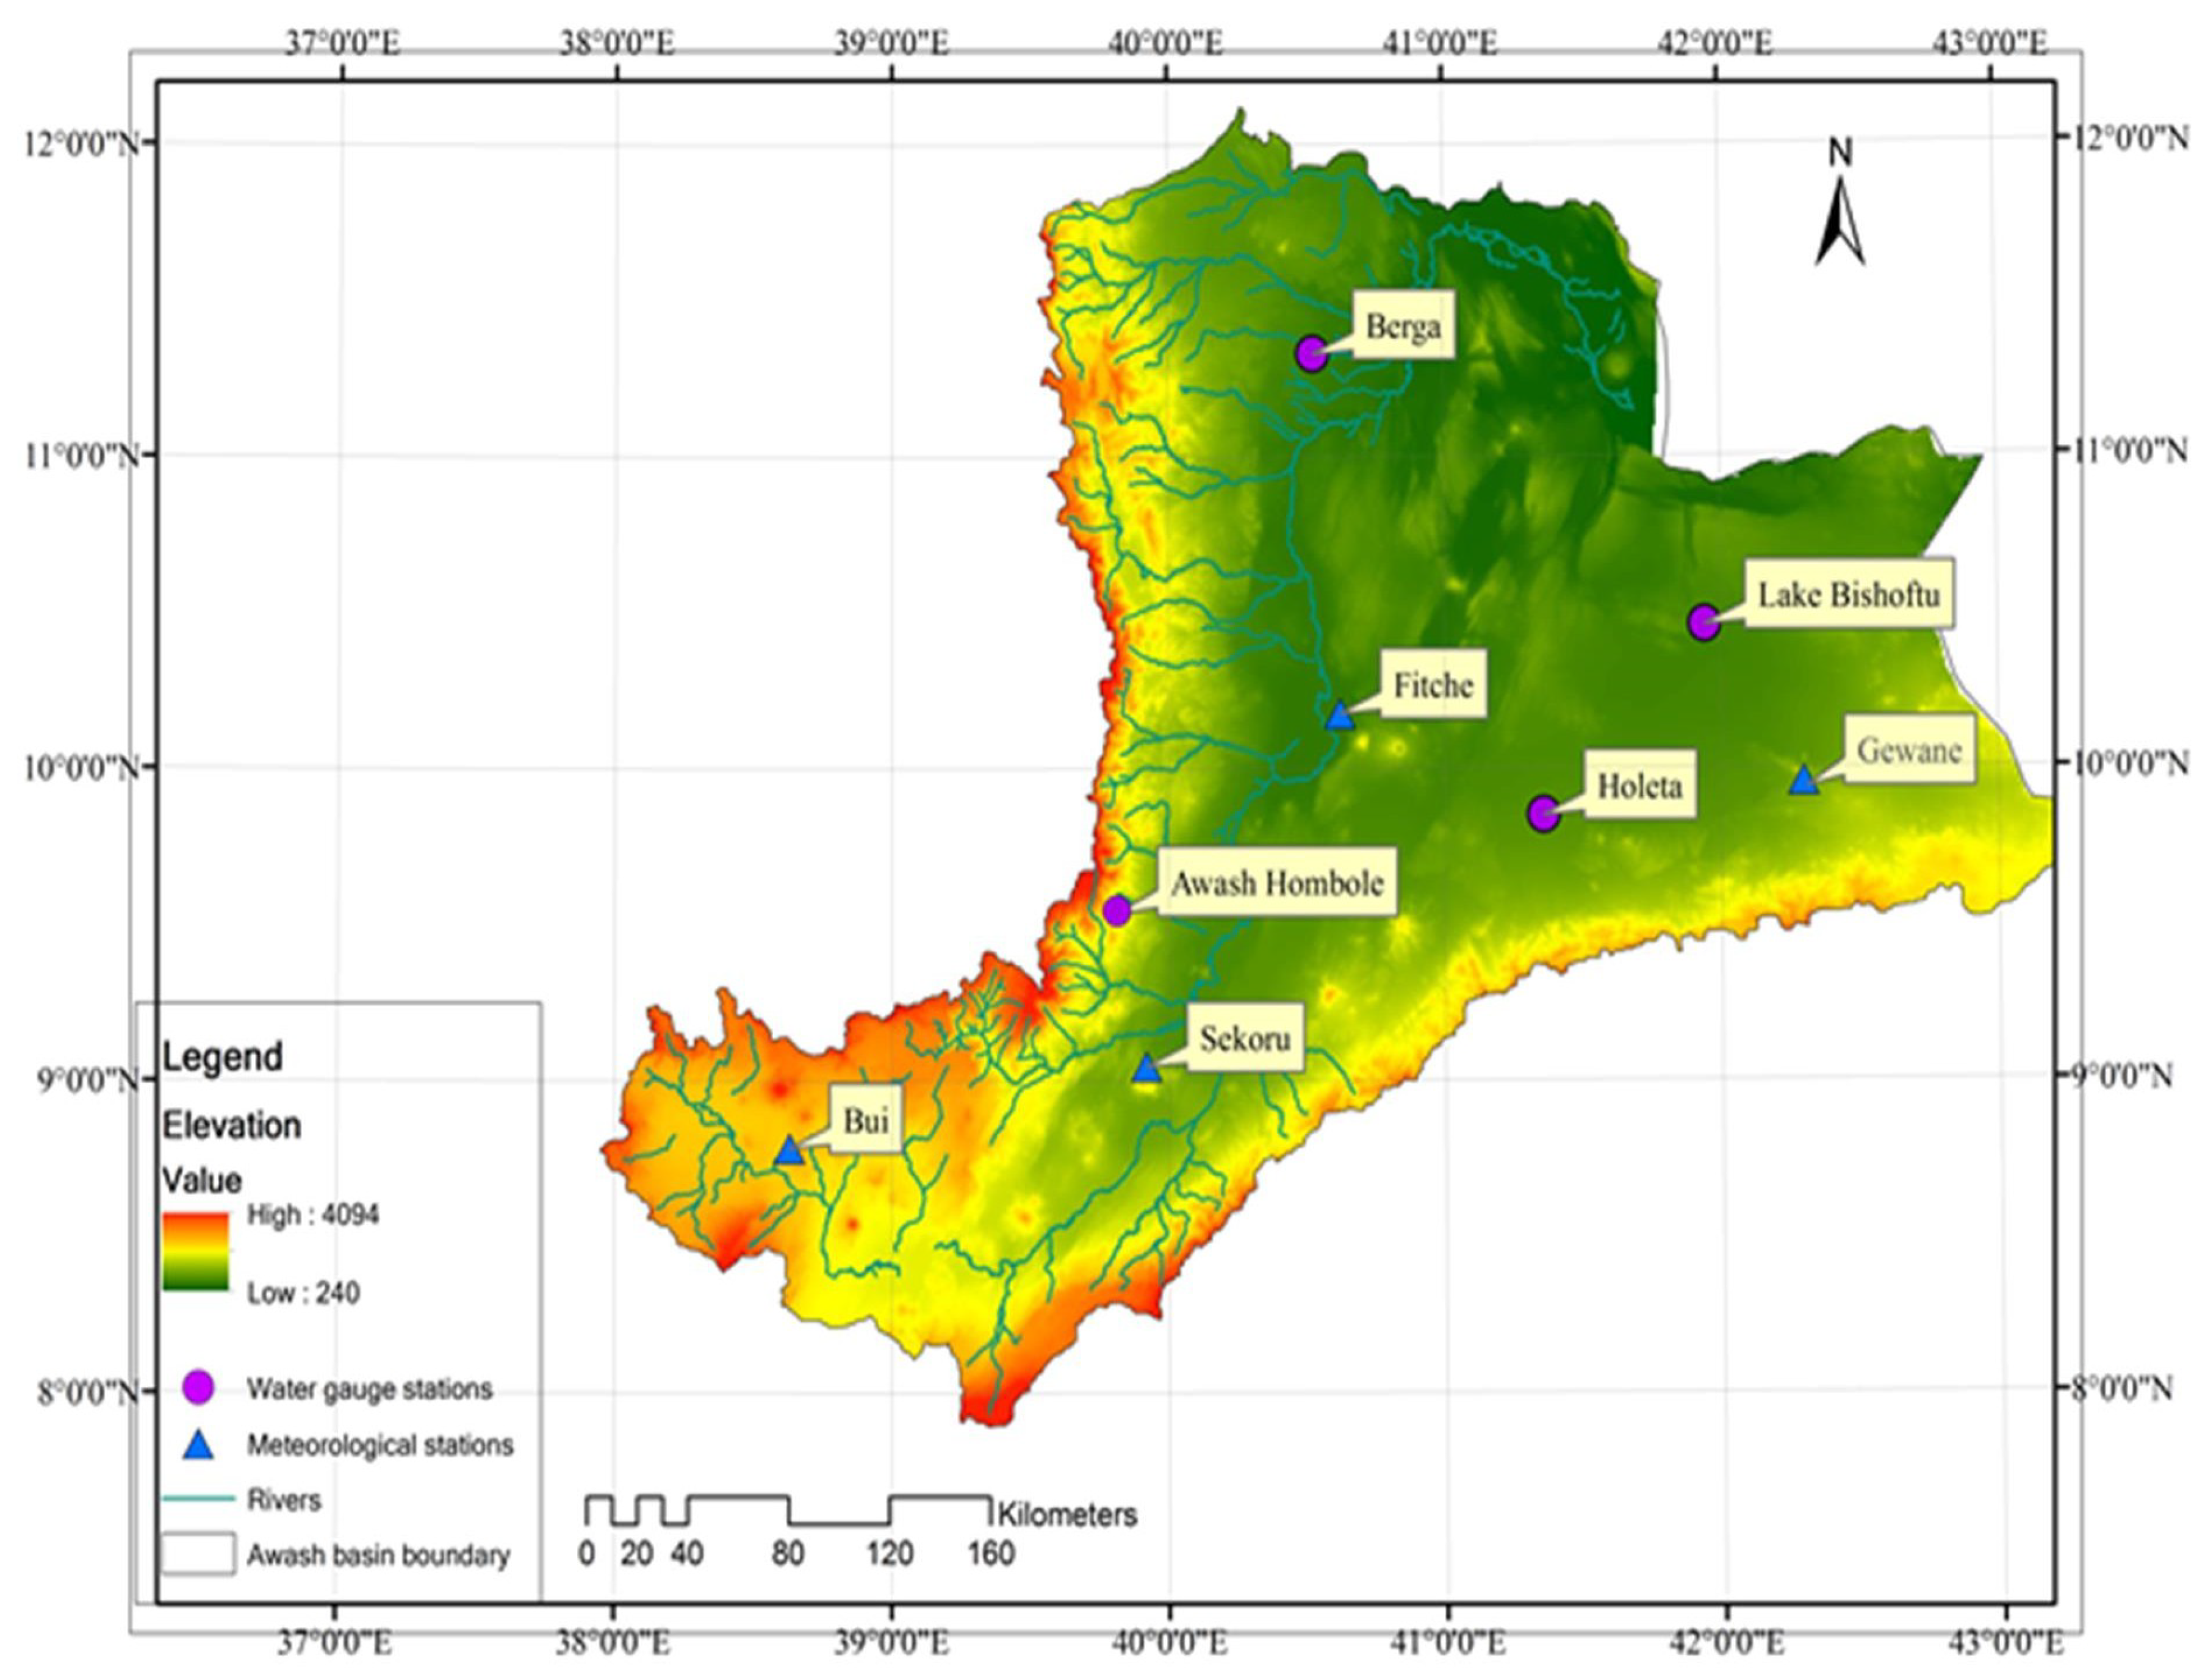
The Awash river basin is one of the 12 river basins of Ethiopia. It is situated between latitudes of 7°53′ N and 12° N and longitudes of 37°57′ E and 43°25′ E [
23]. The basin constitutes the central and northern part of the Rift Valley and is bounded to the west, southeast, and south by the Blue Nile, the Rift Valley lakes, and the Wabeshebele basins, respectively. It covers a total area of 110,000 km
2, with a length of 1200 km [
22]. This basin has been the most highly utilized basin in Ethiopia since modern agriculture was introduced, as early as the 1950s [
3].
The mean annual rainfall of the basin varies from 1600 mm northeast of Addis Ababa to 160 mm in the northern part of the basin (
Figure 1). The distribution of rainfall is bimodal in the middle and lower parts of the basin and unimodal in the upper part [
23].
2.2. Data Sources
Daily precipitation, temperature and discharge data from 1980 to 2016 were collected from the National Meteorological Services Agency of Ethiopia (NMSA). The elevation, latitude, longitude, mean annual maximum temperature, and precipitation of the selected meteorological stations are described in
Table 1. Basic information of the discharge gauging stations are listed in
Table 2.
2.3. Methods
Long-term trends in the observed and adjusted time series data were detected using the MK test, with linear changes in the data represented by Kendall–Theil Robust Lines. This non-parametric MK test is best suited for evaluating changes in hydrologic regimes [
24]. Trend analysis was used to investigate whether the trend was upward, downward, or there was no trend in the data value points. This paper also used ITAM to detect the trends in precipitation, temperature, and discharge time series data. To evaluate the reliability of ITAM, the results were compared with the MK and Sen’s slope estimator tests. The study region has four distinct seasons: Kiremt (June–August), Meher (September–November), Bega (December–February), and Belg (March–May). Significance levels at 10%, 5%, and 1% were taken to assess the precipitation, temperature, and discharge times series data by MK, ITAM, and Sen’s slope estimator methods.
2.3.1. Mann–Kendall Trend Detection
The Mann–Kendall (MK) test is a non-parametric test used to detect the trends of hydrometeorological time series data, which do not require the data points to be normally distributed [
12,
25,
26,
27]. The MK test is easy to use for trend detections in hydrometeorological observations. Thus, it was used to detect trends in the time series data for annual river discharge, annual precipitation, and annual temperature in the present study. The MK
S statistic is given as:
The trend test is applied to
data values (
i = 1, 2, …,
n − 1) and
(
j =
i + 1, 2, …,
n). The data values
are used as a reference points to compare with the data values of
, which are given as:
where
and
are the values in periods
i and
j. When the number of data series is greater than or equal to 10 (
n ≥ 10), the MK test is then characterized by normal distribution with the mean
E(
S) = 0 and the variance
Var(S) is equated as [
28]:
where
m is the number of the tied groups in the time series, and
is the number of data points in the
kth tied group.
The test statistic
Z is as follows:
when
Z is greater than zero, it indicates an increasing trend. When
Z is less than zero, it represents a decreasing trend.
In a time sequence, the statistics are defined independently:
Firstly, given the confidence level
α, if
> UF
α/2, it indicates that the sequence has a significant trend. Then, the time sequence is arranged in reverse order. According to the equation calculation, while making:
Finally,
and
are drawn as U
B and U
F curves. If there is an intersection between the two curves, the intersection is the beginning of the mutation [
29].
2.3.2. Sen’s Slope Estimator Test
The magnitude of the trend is predicted by the slope estimator methods reported in References [
12,
30,
31,
32]. The slope (
) between two data points is given by the equation:
where
and
are data points at times
j and
k (
j >
k), respectively. When there is only a single datum in each time, then
However, if there are many data points, then
, where
n is the total number of observations. The
N values of the slope estimator are arranged from smallest to biggest. Then, the median of slope (
β) is computed as:
The sign of shows whether the trend is increasing or decreasing. A positive value of β indicates an upward trend, while a negative value of β indicates a downward trend.
2.3.3. Innovative Trend Analysis Method (ITAM)
The innovative trend analysis method (ITAM) has been used in many studies to detect hydrometeorological observations and its accuracy was compared with the results of the MK method [
12,
19,
33,
34,
35,
36]. In ITAM, the hydrometeorological observations were classified into two classes and then the data points were arranged independently in increasing order. Then, the two classified classes were placed on a coordinate system, with (
:
i = 1, 2, 3, …,
n/2) on the X-axis and (
:
j =
n/2 + 1,
n/2 + 2, …,
n) on the Y-axis. If the time series data on a scattered plot are collected on the 1:1 (45°) straight line, it indicates no trend. However, the trend is increasing when the data points accumulate above the 1:1 straight line and the trend is decreasing when data points accumulate below the 1:1 straight line.
The difference of the mean value between
and
could give the trend magnitude of the data series. The first observed data point was not considered in this study when classifying the time series data into
and
data plots since the total number of observed data points was 37 from 1980 to 2016. The direction of the trend is also affected by the
data series. The trend indicator of ITAM is multiplied by 10 to make the scale similar to those of the other two tests. The trend indicator is given as:
where
= trend indicator,
n = number of observations in the subseries,
= data series in the first half subseries class,
= data series in the second half subseries class, and
= mean of data series in the first half subseries class.
A positive value of indicates an increasing trend, while a negative value of indicates a decreasing trend. However, when the scatter points cluster around the 1:1 straight line, it implies the non-existence of a significant trend.
3. Results
3.1. Analysis of Precipitation
The annual average precipitation of the study basin during the study period was 921.69 mm, with a coefficient of variation (CV) of 18% and a standard deviation of 165.96 mm. The minimum and maximum recorded rainfalls were 509.93 and 1229.75 mm per year, respectively. A dramatic increase in precipitation was observed in 1982 with a coefficient of determination for the trend line (R
2) of 0.21, and a sharp decrease was seen in 2004 (
Figure 2).
Seasonally, the precipitation was found to be in Kiremt (
Z = 1.18), Meher (
Z = −0.31), Bega (
Z = −1.28), and Belg (
Z = −0.03) as shown in
Table 3. The Kiremt season show an increasing trend whereas the Bega, Meher, and Belg seasons show decreasing trends in the Awash Basin.
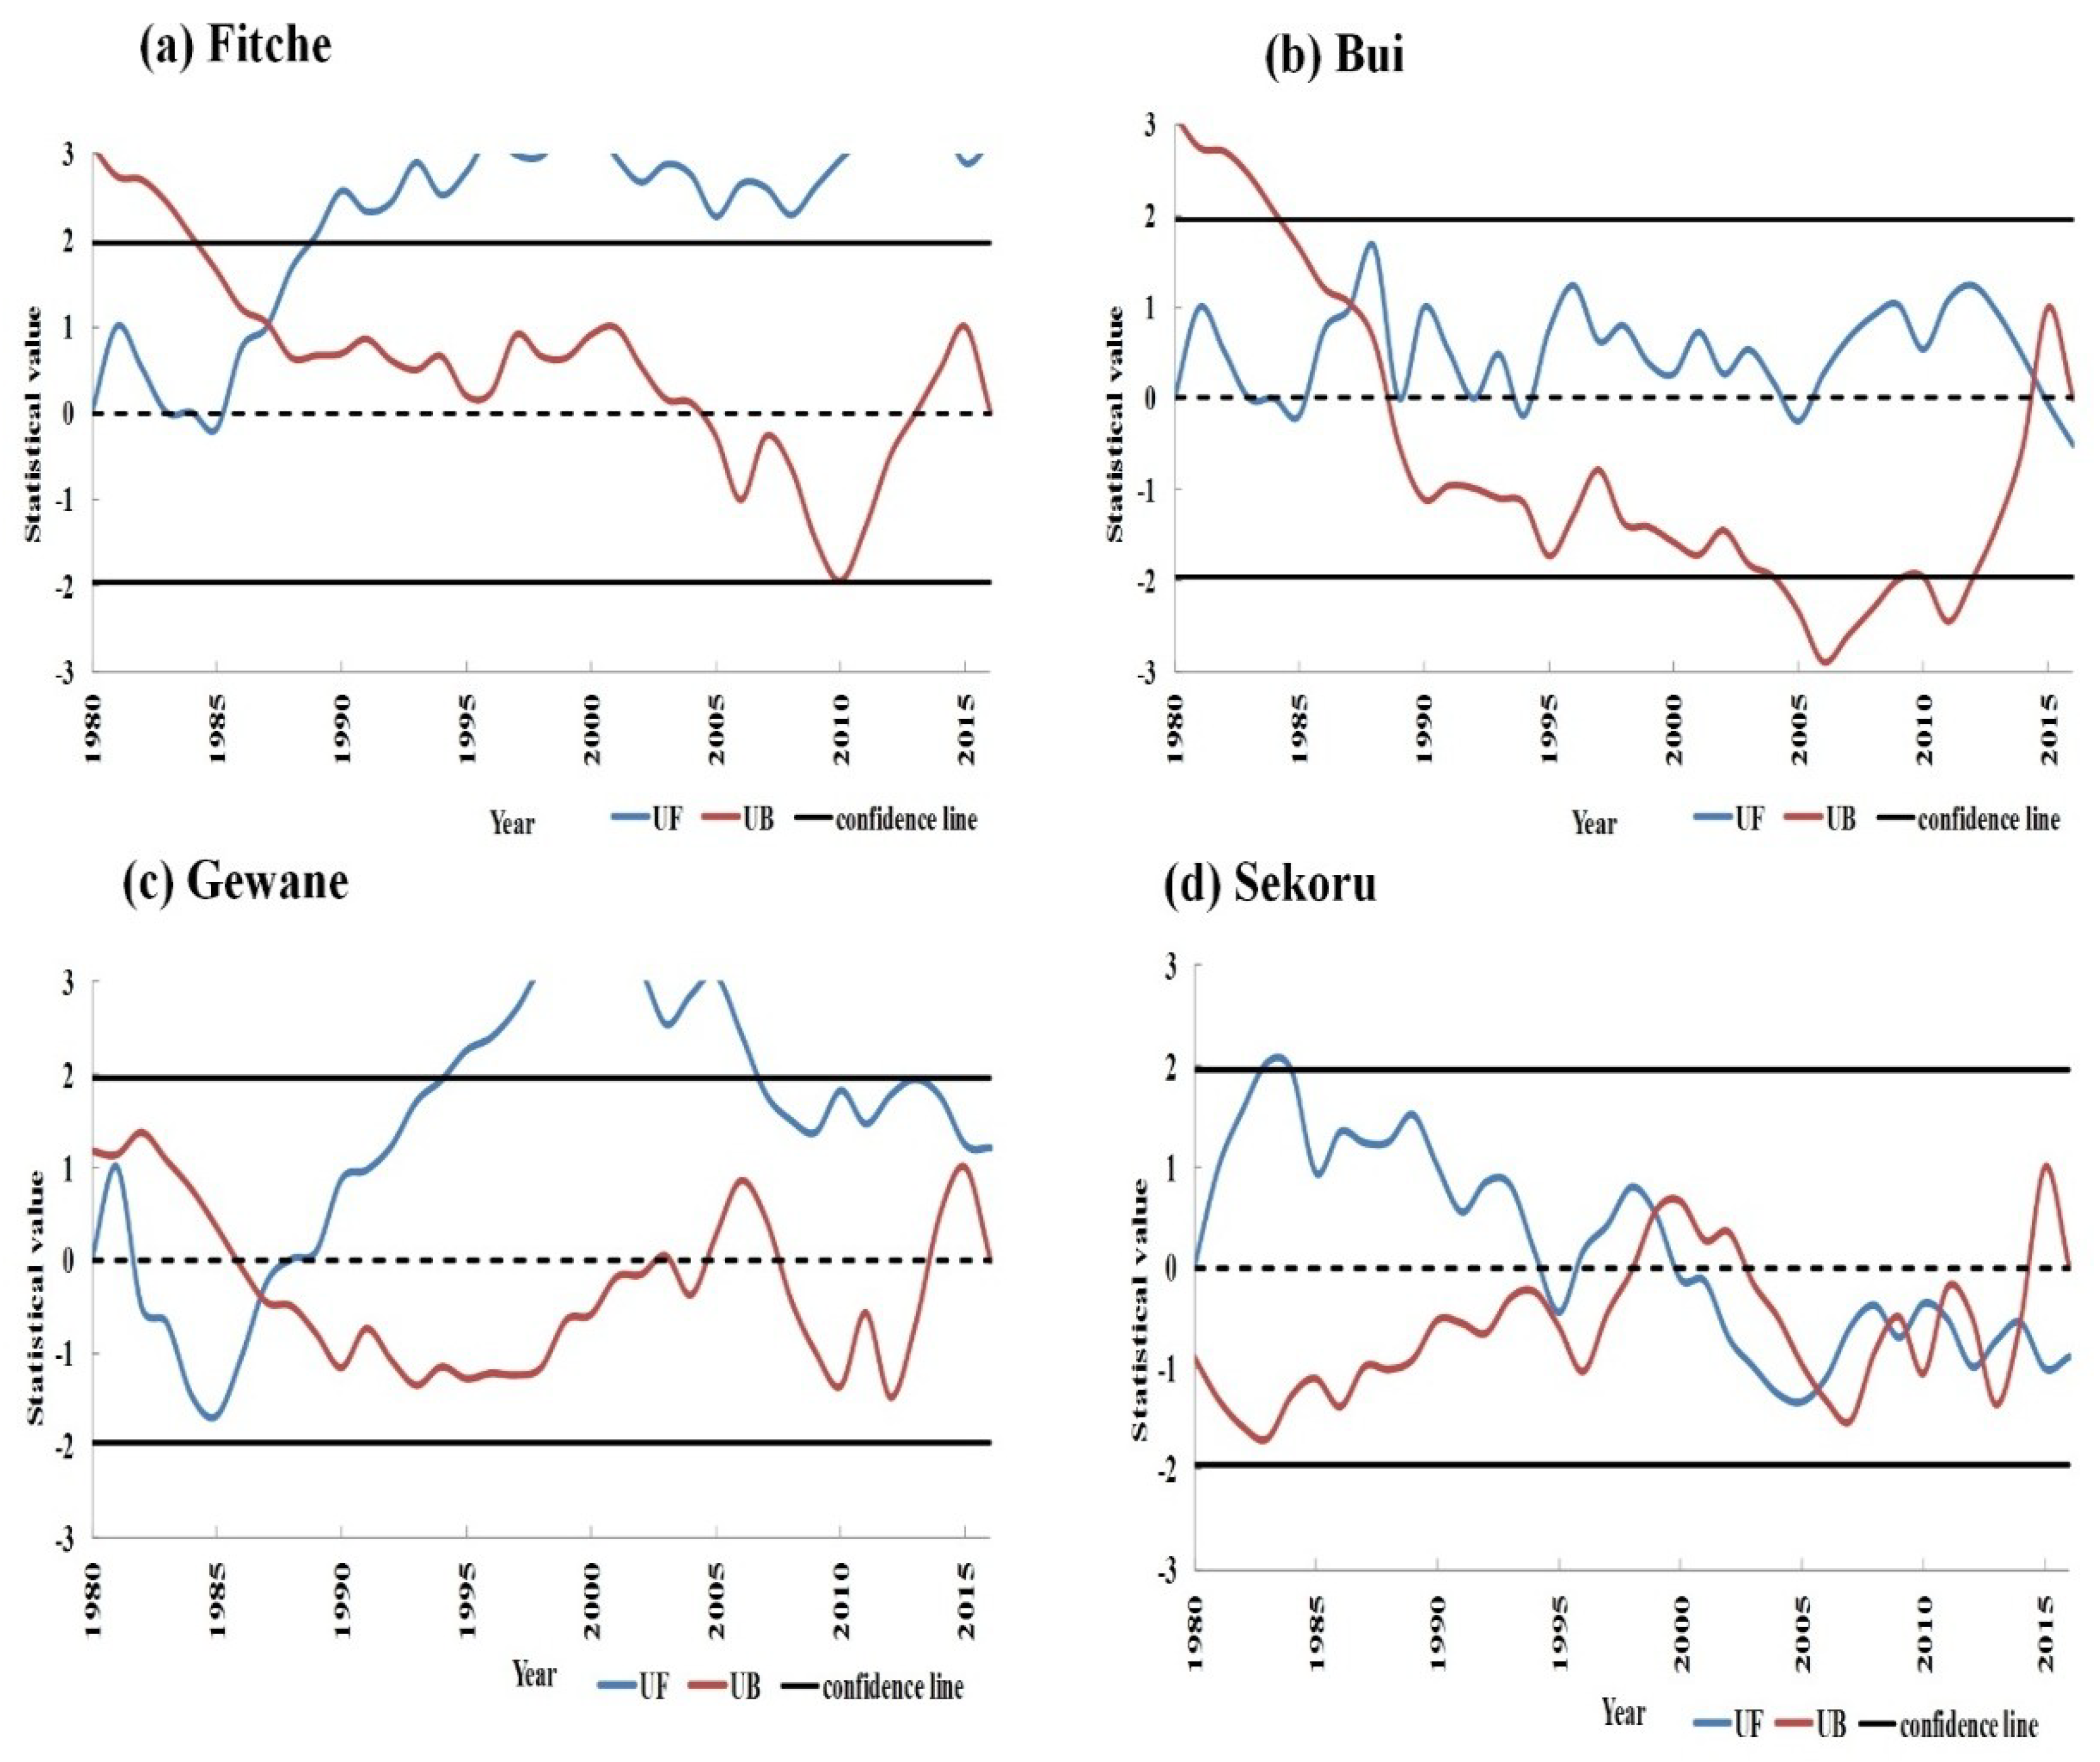
The MK U
B and U
F curves of annual precipitation (changing parameters) showed a statistically significant increasing trend in Fitche (
Z = 0.82) and Gewane (
Z = 0.80) stations from 1989 to 2016 and from 1993 to 2006, respectively; a slightly decreasing trend in Bui (
Z = 0.69); and finally a sharp decreasing trend in Sekoru (
Z = 0.45) (
Figure 2). The trend analysis of precipitation in all stations using the Mann–Kendall (MK) test, ITAM, and Sen’s slope estimator test results is presented in
Table 4.
The trends of precipitation at each point are consistent with the precipitation trends of the entire study basin on different seasons though the MK (Z) values are not the same.
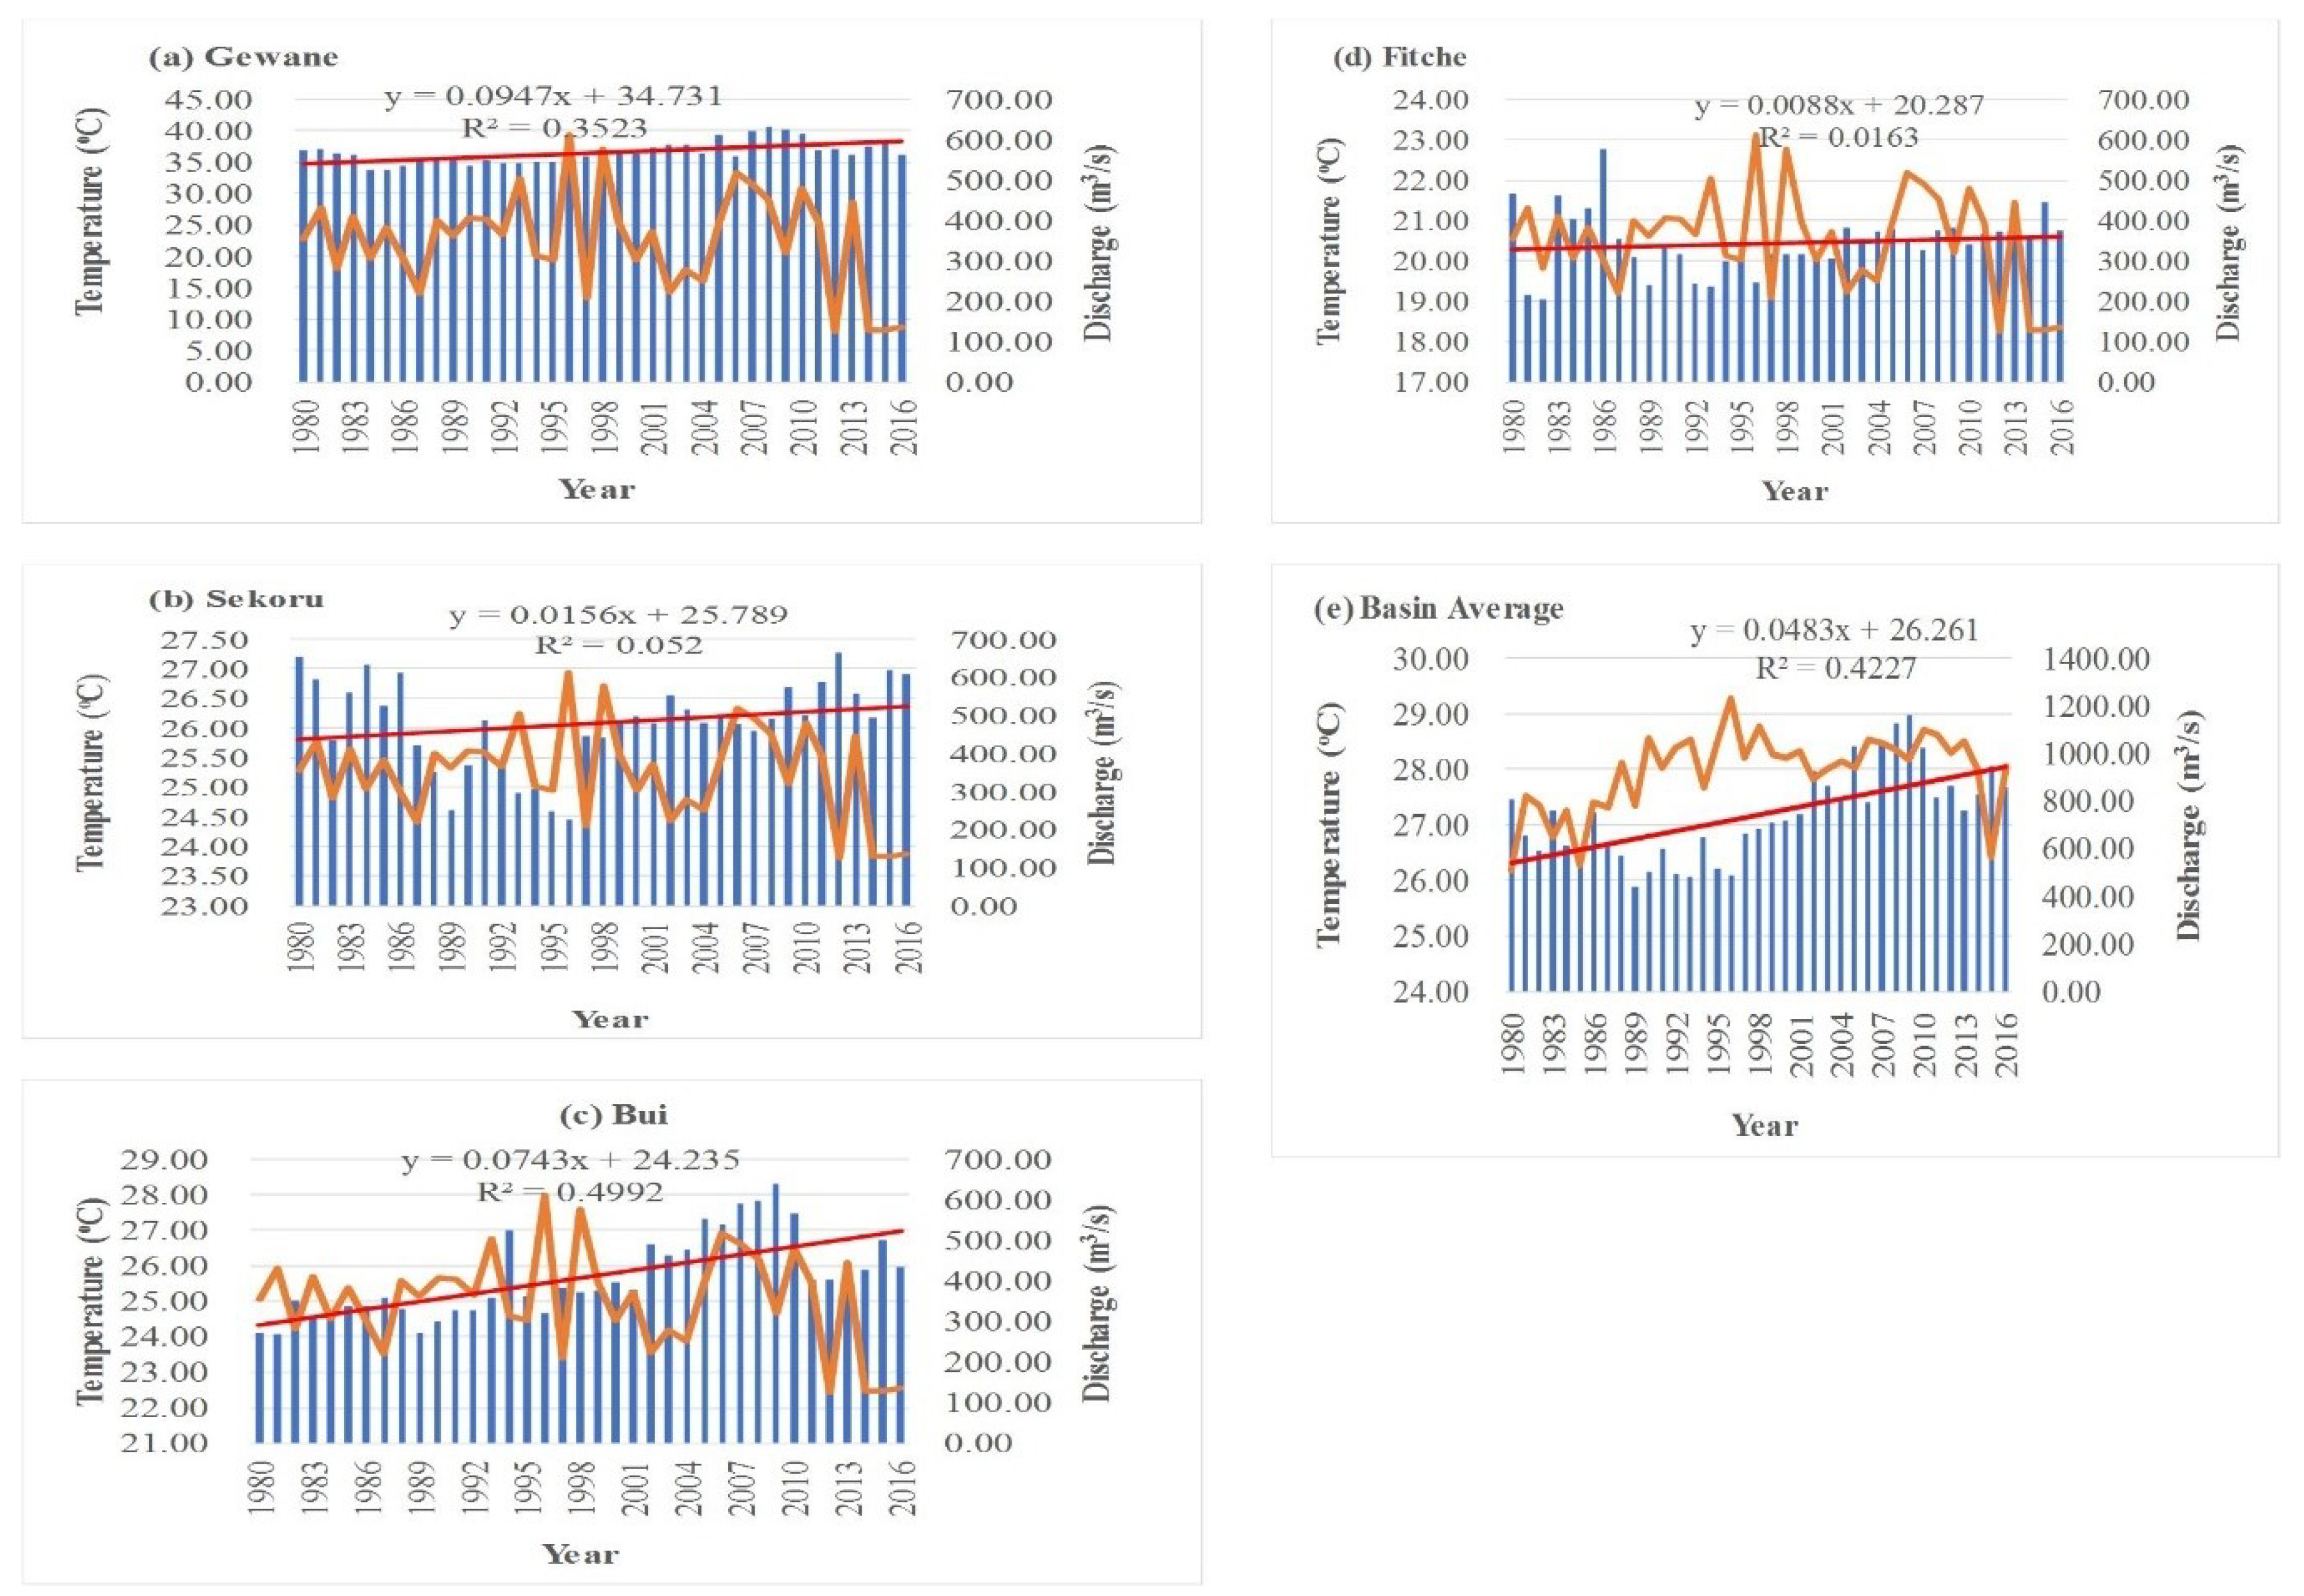
3.2. Analysis of Temperature
The mean annual temperature of the basin was found to be 27.18 °C with minimum and maximum values of 25.87 and 28.98 °C, respectively.
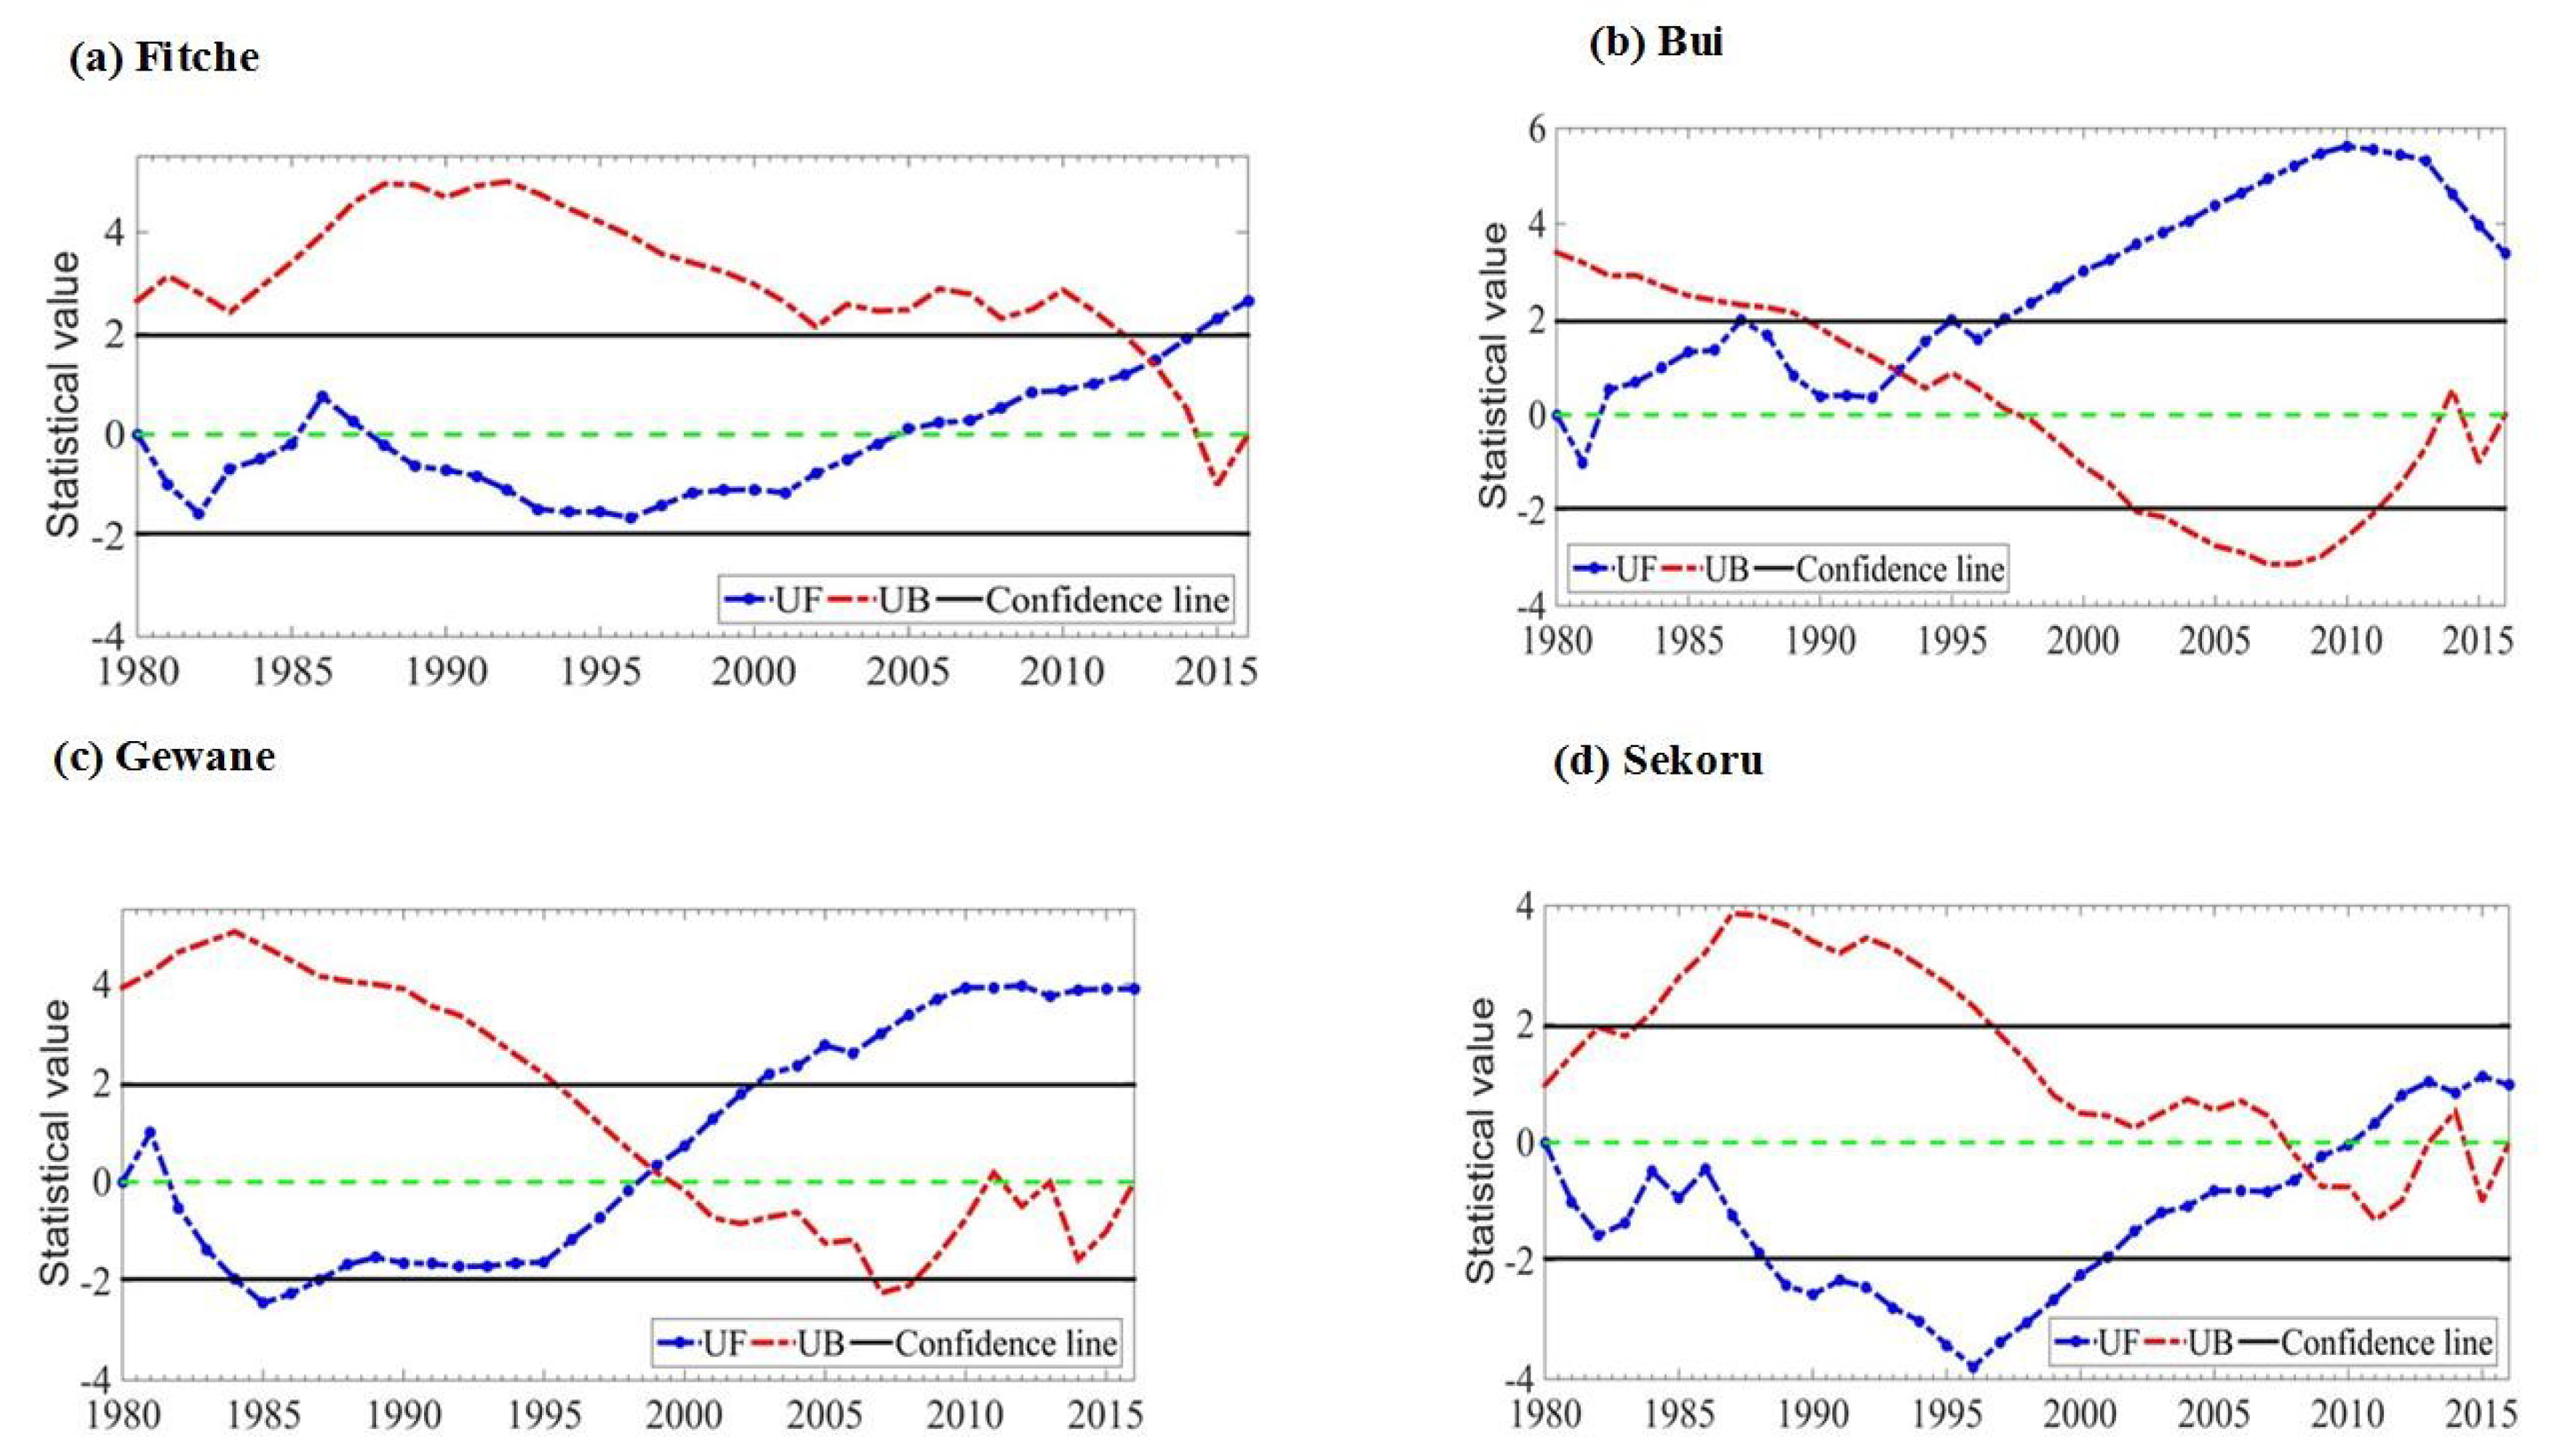
The Mann–Kendall (MK) changing parameters (U
B and U
F) curve line shows a statistically significant increasing trend in Fitche from 2015 to 2016 (
Z = 3.77), a statistically significant, sharp increasing trend from 1996 to 2010 in Bui (
Z = 4.84), a significant increasing trend from 2004 to 2016 in Gewane (
Z = 5.59), and a statistically sharp significant decreasing trend from 1986 to 1995 in Sekoru (
Z = 1.37) (
Figure 3).
The trend analysis of temperature in all stations using the MK test, ITAM, and Sen’s slope estimator test result is presented in
Table 5. The result of ITAM shows an increasing trend in all stations. Hence, the increase and decrease of the test statistic
predict that the magnitude will be strong.
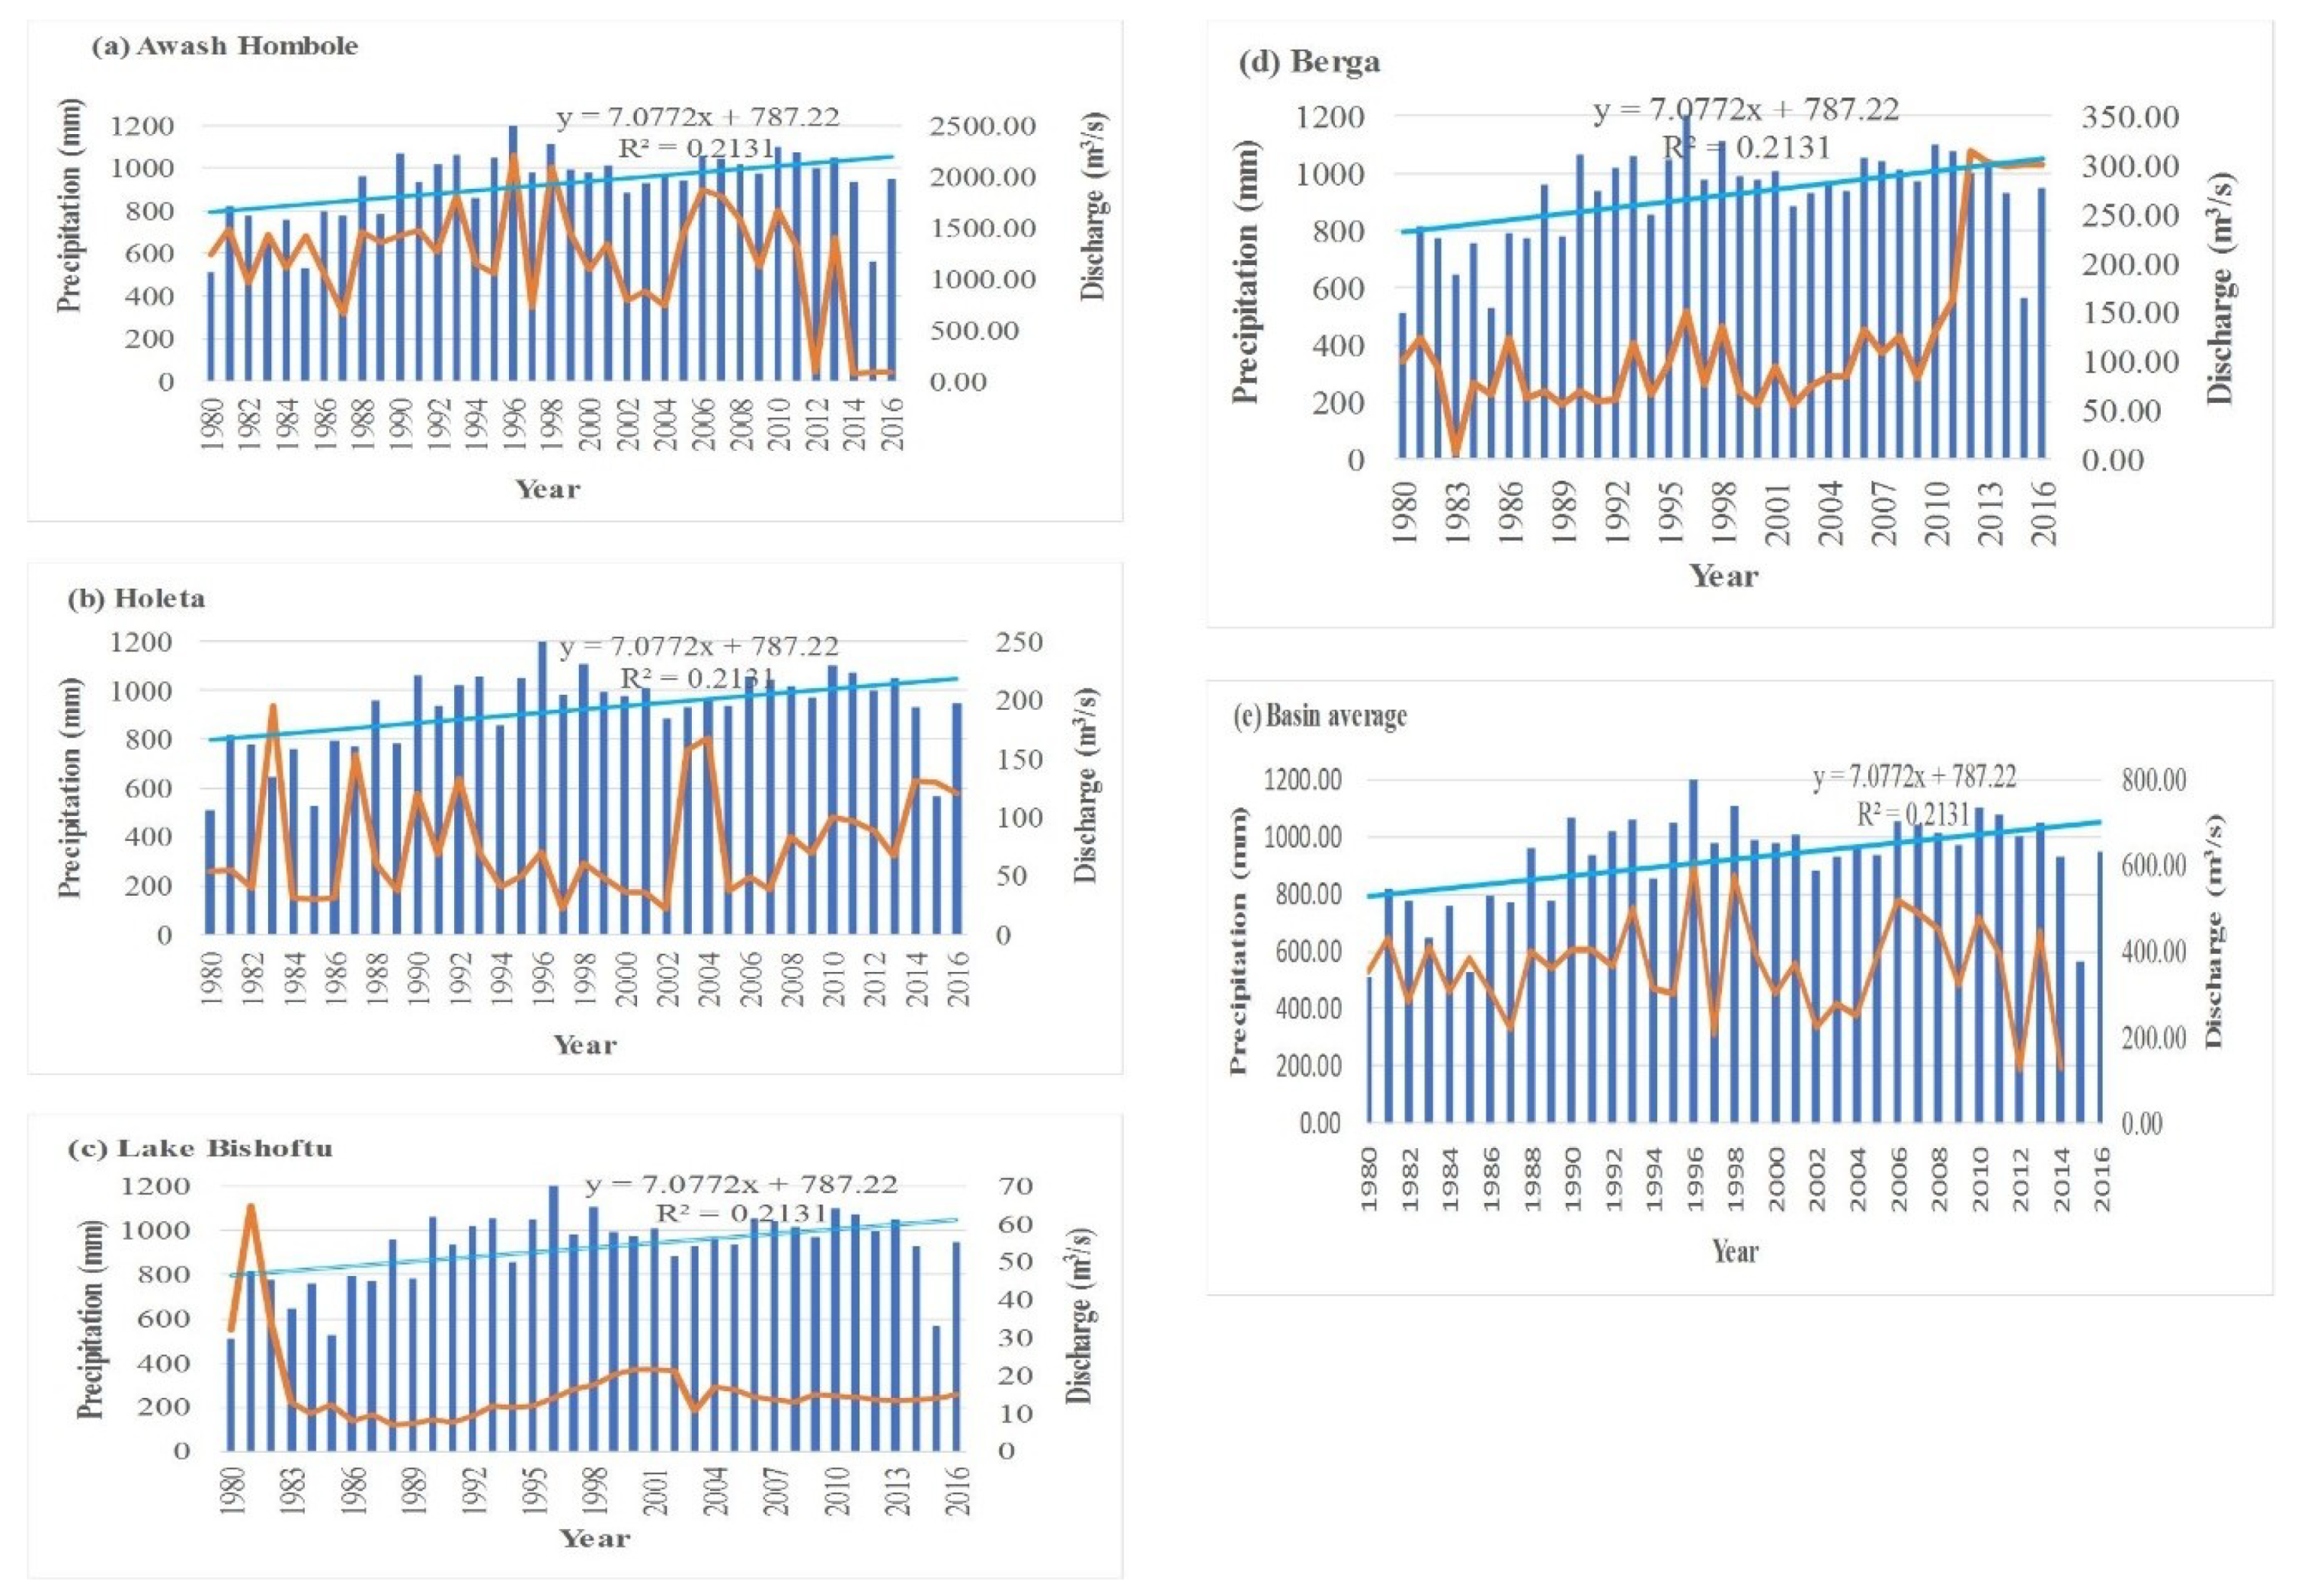
3.3. Analysis of Observed River Discharge
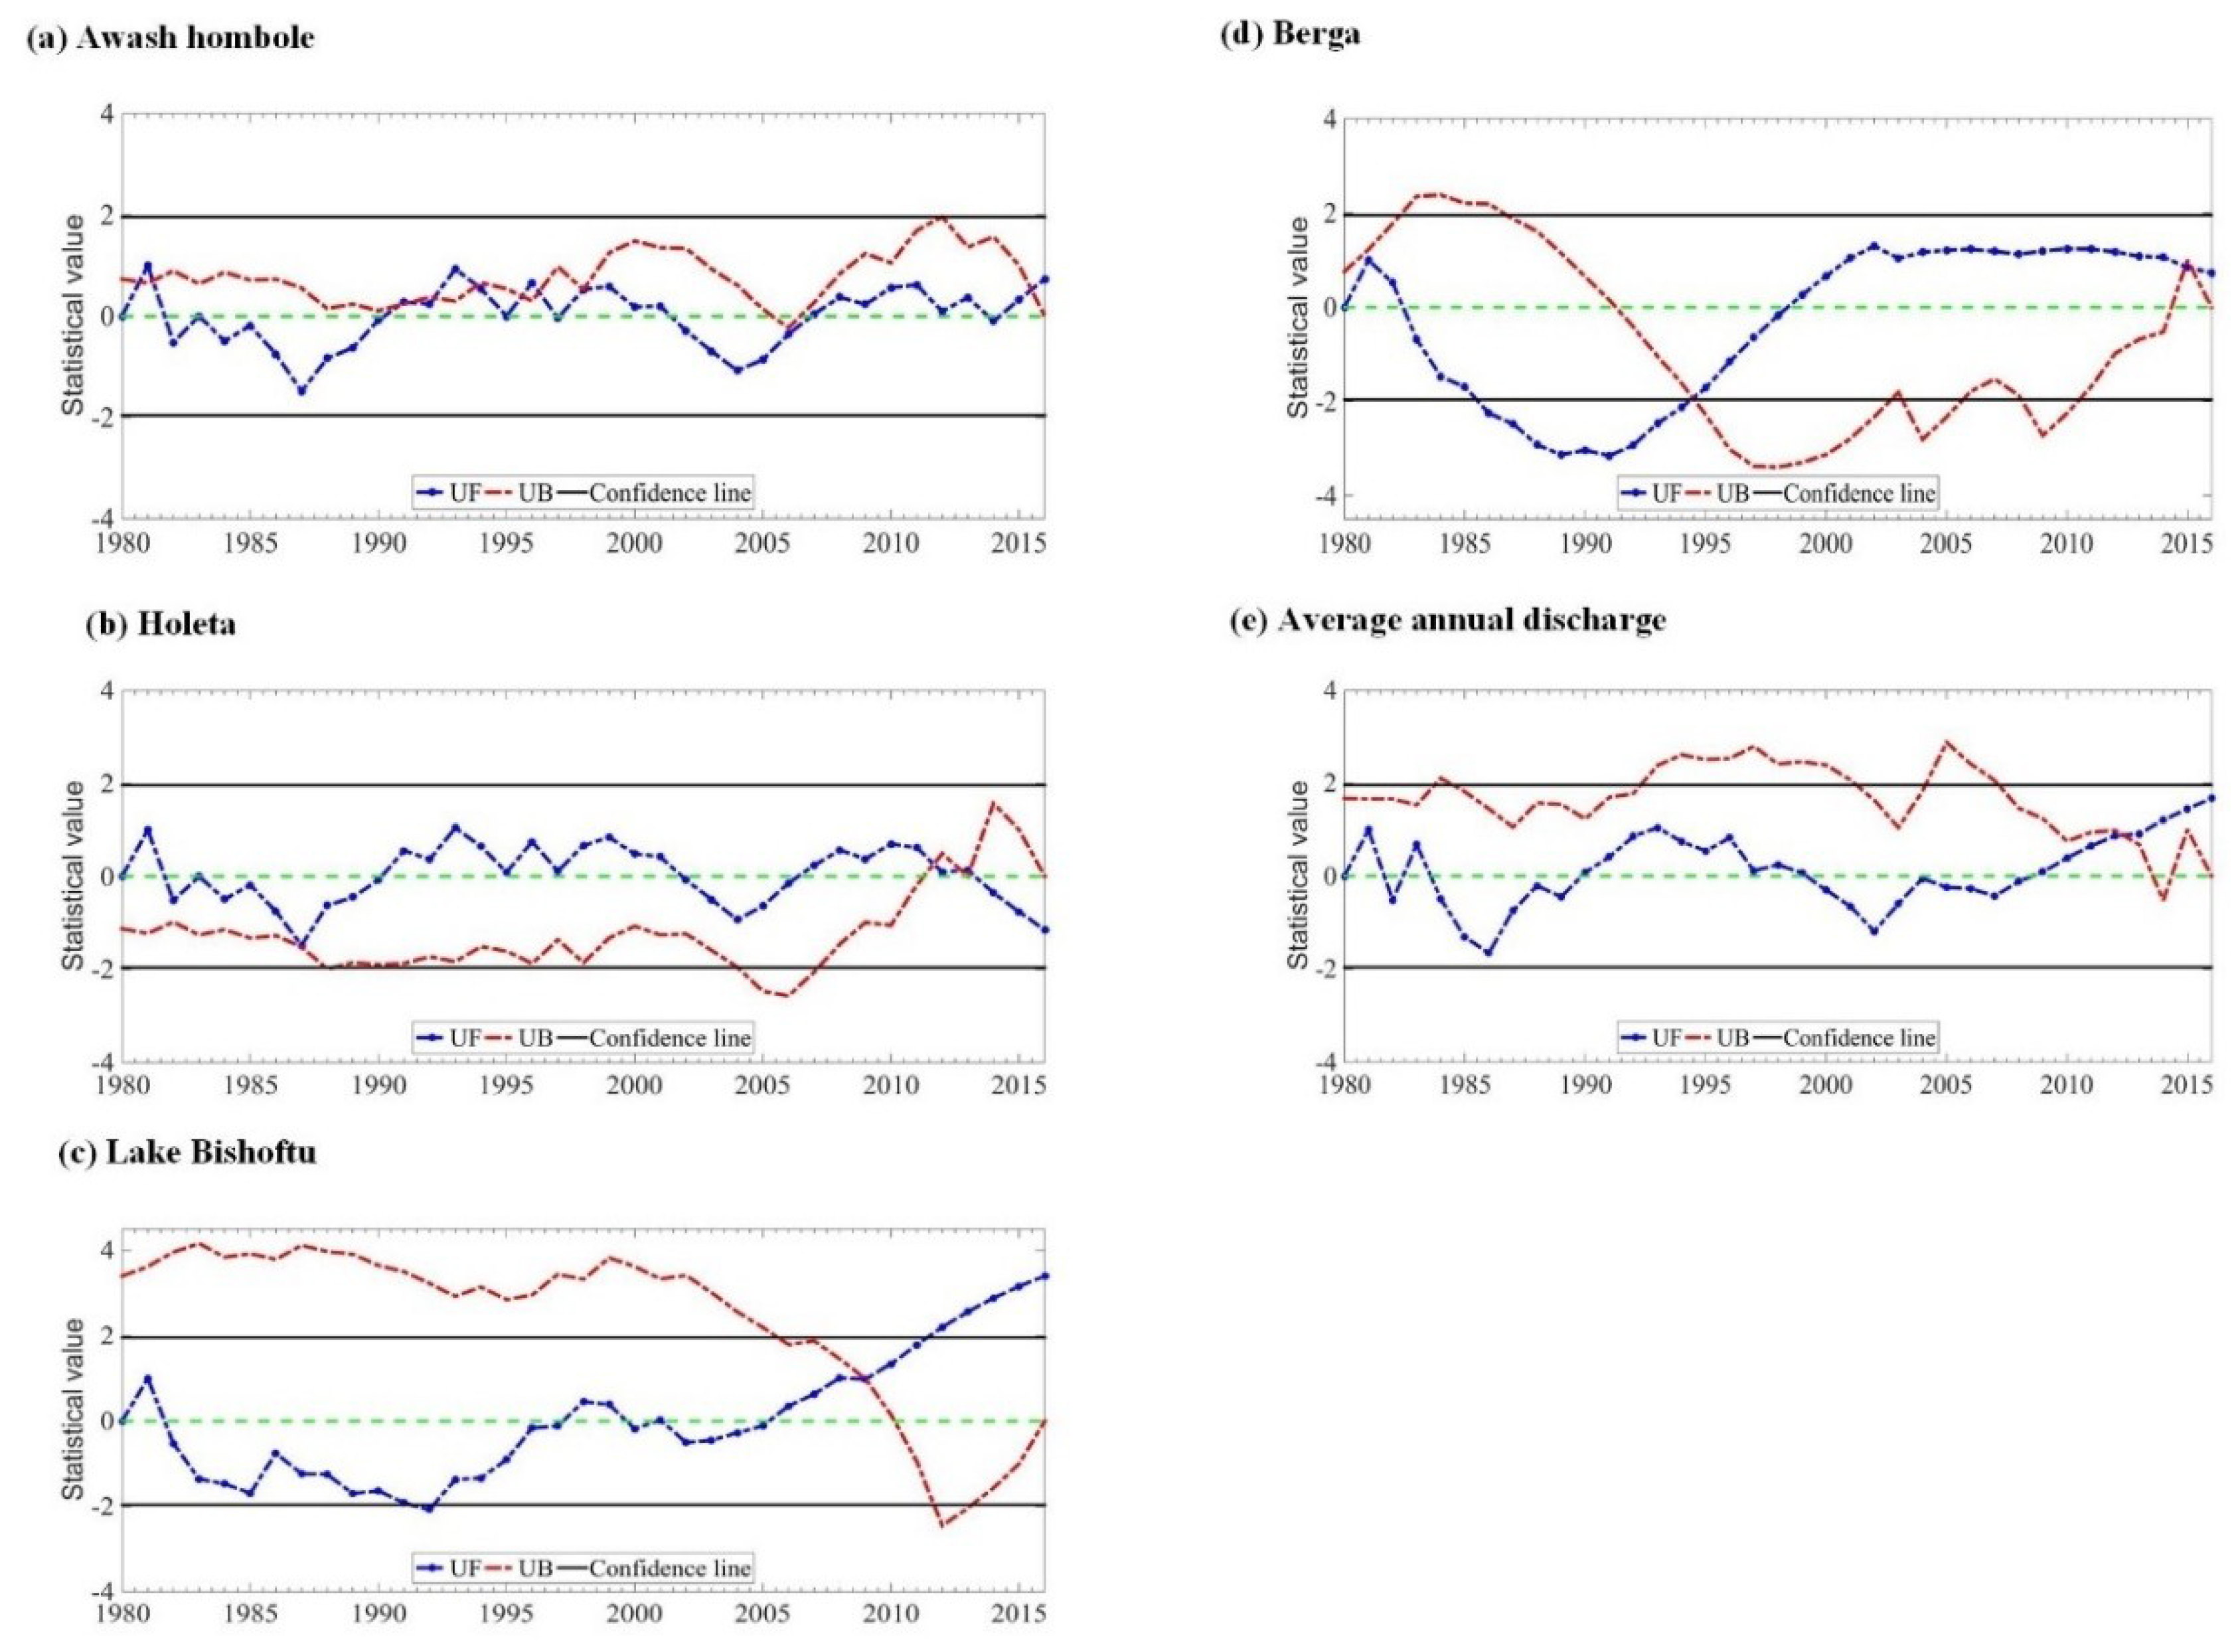
The annual discharge of the Awash river basin shows a sharp decreasing trend from 1981 to 1986 and from 2000 to 2005 with a
Z-value of −0.12, indicating a decreasing trend during the period of 1980 to 2016 (
Figure 4e). The MK changing parameters (U
B and U
F) curve line shows a statistically significant increasing trend in Berga gauging stations from 2010 to 2012 (
Z = 4.00) and a statistically significant decreasing trend in Lake Bishoftu from 1985 to 1995 (
Z = 1.47). However, the trends in Awash Hombole and Holeta gauging stations show decreasing and increasing trends, albeit not statistically significant, with
Z-values of −0.18 and 1.66, respectively. The trends of the Awash river discharge generally exhibited a downward trend from 1980 to 2016. The trend results of all three methods are presented in
Table 6.
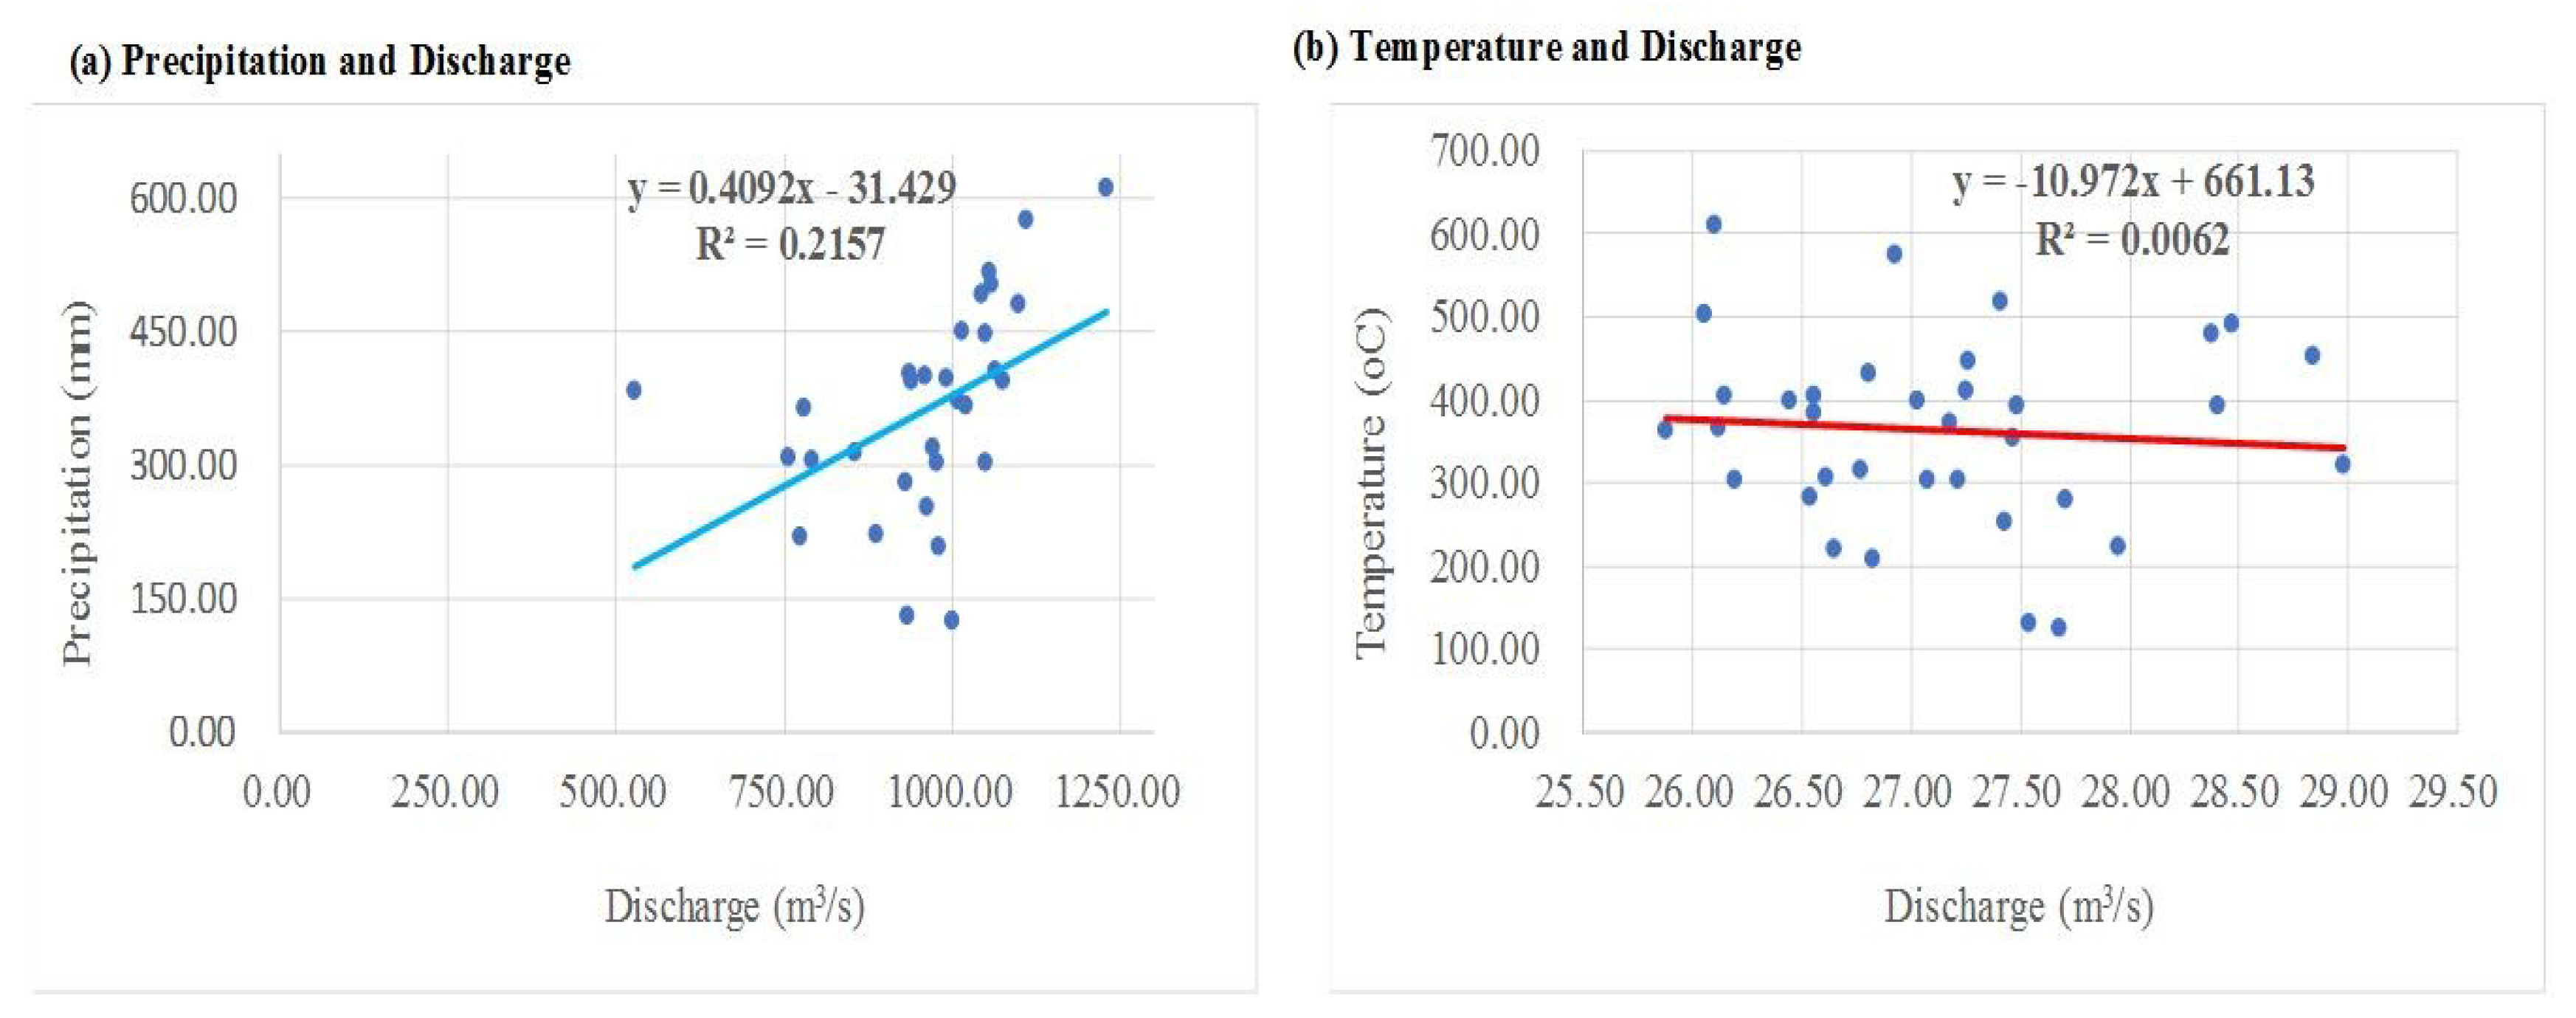
3.4. Correlation Analysis between Climatic and River Discharge
The linkage between climate variables and the changes in river discharge is a subject of ongoing debate. However, the correlation between the climate variables and discharge help us to estimate their relations. High correlations were expected, as one can reasonably assume a cause and effect relationship between precipitation and discharges when considering the average annual values. The correlation between precipitation and discharge (R
2 = 0.22) was found to be very weak in this study. In addition, the correlation between temperature and discharge was also very weak (R
2 = 0.01). Temperature plays a minor role in the increase and decrease of discharge. The annual discharge of the Awash river basin sharply decreased in 1987, 1997, and 2012. The decline in river discharge is likely related to the reduction of a long-term precipitation cycle [
2,
37,
38,
39]. The cause for this change needs further investigation. The correlation between climate variables and discharges is shown in
Figure 5.
4. Discussion
The mean annual precipitation and temperature of the Awash river basin showed a consistent increasing trend. Warmer and wetter scenarios of the Awash river basin are expected to increase the river discharge substantially and could serve to alleviate current local water shortages. By analyzing the Awash river discharge and climate variables, we noticed that between precipitation and temperature, precipitation had a more robust correlation with flow rates, consistent with our observations.
The Awash river basin is characterized by maximum precipitation in Kiremt (June to August) season. There was inter-annual variability of precipitation, temperature, and discharge observed over the stations. The Mann–Kendall test, ITAM, and Sen’s slope estimator test analyses showed that decreasing and increasing trends of precipitation, temperature, and discharge were observed across the stations. As far as spatial distributions of annual precipitation were concerned, a decreasing trend was observed in the northern part of the basin.
This study found that there were fluctuations of precipitation and river discharge during the study period with coefficients of variation of 8.49% and 34%, respectively. The highest discharge was in line with the trends of precipitation, indicating that precipitation plays a great role in the change in direction of the discharge in the study basin. The reduction in precipitation also impacted the volume of the river discharge of the river basin. The analysis of the correlations between precipitation and discharge show a coherent pattern of relationship.
The results of this study are also supported by the findings of References [
2,
6,
12,
40,
41,
42]. The relation between precipitation and discharge is shown in
Figure 6.
On the other hand, the mean annual temperature of the basin was found to be 27.18 °C, with minimum and maximum values 25.87 and 28.98 °C, respectively. As far as the linkage between temperature and discharge was concerned, this study indicates that temperature only plays a minor role in affecting river discharge (
Figure 7).
5. Conclusions
This study investigated the trends of precipitation, temperature, and discharge in the Awash river basin during the period of 1980 to 2016. The temporal and seasonal variability of precipitation was also investigated in all stations. Sharply increasing, significant trends were observed in Fitche and Gewane stations, whereas slightly decreasing trends were detected in Bui and Sekoru stations. The trends of precipitation at each point are consistent with the precipitation trends of the entire study basin according to different seasons. The Kiremt season showed an increasing trend whereas the Bega, Belg, and Meher seasons showed a decreasing trend in the study basin.
As far as temperature trends were concerned, statistically significant increasing trends were detected in Fitche (Z = 3.77), Bui (Z = 4.84), and Gewane (Z = 5.59).
The results of the study indicate that the annual discharge of the Awash River Basin shows a sharp decreasing trend from 1981 to 1986 and from 2000 to 2005 with a Z-value of −0.12. Kiremt rainfall is the main source of water that increases the volume of the Awash river basin.
The decrease in river discharge of the Awash river basin is probably due to over-exploitation of the study basin and periodic drought. Such changes are associated with human activity and climate change in the basin. The results obtained in this study by statistical tests (MK, ITAM, and Sen’s slope estimator tests) were confirmed.
It should be noted that the findings of this paper are not enough to confirm the effects of change of climate in Ethiopia. Further studies are needed to address the causes of the decrease of river discharge and its relations to precipitation and climate change. This paper contributed to provide a scientific basis for the variation of precipitation, temperature, and discharge in the study basin. This would be very essential for managers, helping them to make better decisions concerning integrated water resources management in the future. Furthermore, the findings could have important implications for the basin-scale management of water resources.
Author Contributions
M.G. made substantial contributions to the design, idea generation, analysis, interpretation, and drafting of the original manuscript. D.Y. assisted with and commented on the draft manuscript and supervised the whole work. H.W. is a resource person of the project. X.S. also coordinated the whole work. D.Y., G.D., J.W., Q.L., A.G., B.A.A., D.B. and A.A. participated in the design of the study. The final manuscript was checked and approved by all the authors before submission.
Funding
This research was funded by the National Key Research and Development Project (Grant No. 2016YFA0601503).
Acknowledgments
The authors would like to thank the National Meteorological Service Agency of Ethiopia for providing the raw meteorological and hydrological data. We also thank the China Institute of Water Resources and Hydropower Research for financing this research.
Conflicts of Interest
The authors declare no conflict of interest.
References
- Adeba, D. Assessment of water scarcity and its impacts on sustainable development in Awash basin, Ethiopia. Sustain. Water Resour. Manag. 2015, 1, 71–87. [Google Scholar] [CrossRef] [Green Version]
- Chen, Z.; Grasby, S.E. Reconstructing river discharge trends from climate variables and prediction of future trends. J. Hydrol. 2014, 511, 267–278. [Google Scholar] [CrossRef]
- Edossa, D.C.; Babel, M.S.; Gupta, A. Das. Drought analysis in the Awash River Basin, Ethiopia. Water Resour. Manag. 2010, 24, 1441–1460. [Google Scholar] [CrossRef]
- Seleshi, Y.; Zanke, U. Recent changes in rainfall and rainy days in Ethiopia. Int. J. Climatol. 2004, 24, 973–983. [Google Scholar] [CrossRef] [Green Version]
- Girma, E.; Tino, J.; Wayessa, G. Rainfall trend and variability analysis in Setema-Gatira area of Jimma, Southwestern Ethiopia. Afr. J. Agric. Res. 2016, 11, 3037–3045. [Google Scholar] [CrossRef]
- Wang, Y.J.; Qin, D.H. Influence of climate change and human activity on water resources in arid region of Northwest China: An overview. Adv. Clim. Chang. Res. 2017, 8, 268–278. [Google Scholar] [CrossRef]
- Asfaw, A.; Simane, B.; Hassen, A.; Bantider, A. Variability and time series trend analysis of rainfall and temperature in northcentral Ethiopia: A case study in Woleka sub-basin. Weather Clim. Extrem. 2018, 19, 29–41. [Google Scholar] [CrossRef]
- Yang, F.; Lu, C. Catena Spatiotemporal variation and trends in rainfall erosivity in China’s dryland region during 1961–2012. Catena 2015, 133, 362–372. [Google Scholar] [CrossRef]
- Onyutha, C.; Tabari, H.; Taye, M.T.; Nyandwaro, G.N.; Willems, P. Analyses of rainfall trends in the Nile River Basin. J. Hydro-Environ. Res. 2015. [Google Scholar] [CrossRef]
- Carter, S.; Gulati, M. Climate Change, the Food Energy Water Nexus and Food Security in South Africa; World Wide Fund for Nature: Gland, Switzerland, 2014. [Google Scholar]
- Holmatov, B.; Lautze, J.; Manthrithilake, H.; Makin, I. Water security for productive economies: Applying an assessment framework in southern Africa. Phys. Chem. Earth 2017, 100, 258–269. [Google Scholar] [CrossRef]
- Gedefaw, M.; Yan, D.; Wang, H.; Qin, T.; Girma, A.; Abiyu, A.; Batsuren, D. Innovative Trend Analysis of Annual and Seasonal Rainfall Variability in Amhara Regional State, Ethiopia. Atmosphere 2018, 9, 326. [Google Scholar] [CrossRef]
- Theobald, A.; Mcgowan, H.; Speirs, J. Trends in synoptic circulation and precipitation in the Snowy Mountains region, Australia, in the period 1958–2012. Atmos. Res. 2016, 169, 434–448. [Google Scholar] [CrossRef] [Green Version]
- Lyon, S.W.; King, K.; Polpanich, O.; Lacombe, G. Journal of Hydrology: Regional Studies Assessing hydrologic changes across the Lower Mekong Basin. J. Hydrol. Reg. Stud. 2017, 12, 303–314. [Google Scholar] [CrossRef]
- Yang, P.; Xia, J.; Zhang, Y.; Hong, S. Temporal and spatial variations of precipitation in Northwest China during 1960–2013. Atmos. Res. 2017, 183, 283–295. [Google Scholar] [CrossRef]
- Gocic, M.; Trajkovic, S. Analysis of changes in meteorological variables using Mann-Kendall and Sen’s slope estimator statistical tests in Serbia. Glob. Planet. Chang. 2013, 100, 172–182. [Google Scholar] [CrossRef]
- Wen, X.; Wu, X.; Gao, M. Spatiotemporal variability of temperature and precipitation in Gansu Province (Northwest China) during 1951–2015. Atmos. Res. 2017, 197, 132–149. [Google Scholar] [CrossRef]
- Pingale, S.M.; Khare, D.; Jat, M.K.; Adamowski, J. Spatial and temporal trends of mean and extreme rainfall and temperature for the 33 urban centers of the arid and semi-arid state of Rajasthan, India. Atmos. Res. 2014, 138, 73–90. [Google Scholar] [CrossRef]
- Mbungu, W.; Ntegeka, V.; Kahimba, F.C.; Taye, M.; Willems, P. Temporal and spatial variations in hydro-climatic extremes in the Lake Victoria basin. Phys. Chem. Earth 2012, 50–52, 24–33. [Google Scholar] [CrossRef]
- Nilsson, E.; Hochrainer-Stigler, S.; Mochizuki, J.; Uvo, C.B. Hydro-climatic variability and agricultural production on the shores of Lake Chad. Environ. Dev. 2016, 20, 15–30. [Google Scholar] [CrossRef]
- Tibebe, M.; Zemadim, B. Water Demand Analysis and Irrigation Requirement for Major Crops at Holetta Catchment, Awash Subbasin, Ethiopia. J. Nat. Sci. Res. 2015, 5, 117–128. [Google Scholar]
- Berhe, F.T.; Melesse, A.M.; Hailu, D.; Sileshi, Y. Catena MODSIM-based water allocation modeling of Awash River Basin, Ethiopia. Catena 2013, 109, 118–128. [Google Scholar] [CrossRef]
- Hailu, R.; Tolossa, D.; Alemu, G. Water institutions in the Awash basin of Ethiopia: The discrepancies between rhetoric and realities. Int. J. River Basin Manag. 2018, 16, 107–121. [Google Scholar] [CrossRef]
- Fersi, W.; Lézine, A.M.; Bassinot, F. Hydro-climate changes over southwestern Arabia and the Horn of Africa during the last glacial–interglacial transition: A pollen record from the Gulf of Aden. Rev. Palaeobot. Palynol. 2016, 233, 176–185. [Google Scholar] [CrossRef] [Green Version]
- Wang, H.; Zhang, M.; Zhua, H.; Dang, X.; Yang, Z.; Yin, L. Hydro-climatic trends in the last 50 years in the lower reach of the Shiyang River Basin, NW China. Catena 2012, 95, 33–41. [Google Scholar] [CrossRef]
- Shrestha, N.K.; Du, X.; Wang, J. Science of the Total Environment Assessing climate change impacts on fresh water resources of the Athabasca River Basin, Canada. Sci. Total Environ. 2017, 601–602, 425–440. [Google Scholar] [CrossRef] [PubMed]
- Gu, X.; Zhang, Q.; Singh, V.P.; Shi, P. Changes in magnitude and frequency of heavy precipitation across China and its potential links to summer temperature. J. Hydrol. 2017, 547, 718–731. [Google Scholar] [CrossRef]
- Ma, X.; He, Y.; Xu, J.; van Noordwijk, M.; Lu, X. Catena Spatial and temporal variation in rainfall erosivity in a Himalayan watershed. Catena 2014, 121, 248–259. [Google Scholar] [CrossRef]
- Zhang, Q.; Sun, P.; Singh, V.P.; Chen, X. Spatial-temporal precipitation changes (1956–2000) and their implications for agriculture in China. Glob. Planet. Chang. 2012, 82–83, 86–95. [Google Scholar] [CrossRef]
- Mekasha, A.; Tesfaye, K.; Duncan, A.J. Trends in daily observed temperature and precipitation extremes over three Ethiopian eco-environments. Int. J. Climatol. 2014, 34, 1990–1999. [Google Scholar] [CrossRef]
- Toride, K.; Cawthorne, D.L.; Ishida, K.; Kavvas, M.L.; Anderson, M.L. Science of the Total Environment Long-term trend analysis on total and extreme precipitation over Shasta Dam watershed. Sci. Total Environ. 2018, 626, 244–254. [Google Scholar] [CrossRef] [PubMed]
- Rukundo, E.; Liu, S.; Dong, Y.; Rutebuka, E.; Asamoah, E.F.; Xu, J.; Wu, X. Spatio-temporal dynamics of critical ecosystem services in response to agricultural expansion in Rwanda, East Africa. Ecol. Indic. 2018, 89, 696–705. [Google Scholar] [CrossRef]
- Bard, A.; Renard, B.; Lang, M.; Giuntoli, I.; Korck, J.; Koboltschnig, G.; Janža, M.; d’Amico, M.; Volken, D. Trends in the hydrologic regime of Alpine rivers. J. Hydrol. 2015, 529, 1823–1837. [Google Scholar] [CrossRef]
- Zhou, Z.; Wang, L.; Lin, A.; Zhang, M.; Niu, Z. Innovative trend analysis of solar radiation in China during 1962–2015. Renew. Energy 2018, 119, 675–689. [Google Scholar] [CrossRef]
- Li, J.; Zhu, Z.; Dong, W. A new mean-extreme vector for the trends of temperature and precipitation over China during 1960–2013. Meteorol. Atmos. Phys. 2016. [CrossRef]
- Sawan, Z.M. Climatic variables: Evaporation, sunshine, relative humidity, soil and air temperature and its adverse effects on cotton production. Inf. Process. Agric. 2017. [CrossRef]
- Kopytkovskiy, M.; Geza, M.; McCray, J.E. Climate-change impacts on water resources and hydropower potential in the Upper Colorado River Basin. J. Hydrol. Reg. Stud. 2015, 3, 473–493. [Google Scholar] [CrossRef]
- Stramska, M.; Białogrodzka, J. Spatial and temporal variability of sea surface temperature in the Baltic Sea based on 32-years (1982–2013) of satellite data. Oceanologia 2015, 57, 223–235. [Google Scholar] [CrossRef]
- Chidean, M.I.; Muñoz-Bulnes, J.; Ramiro-Bargueño, J.; Caamaño, A.J.; Salcedo-Sanz, S. Spatio-temporal trend analysis of air temperature in Europe and Western Asia using data-coupled clustering. Glob. Planet. Chang. 2015, 129, 45–55. [Google Scholar] [CrossRef]
- Omondi, P.; Awange, J.L.; Ogallo, L.A.; Okoola, R.A.; Forootan, E. Decadal rainfall variability modes in observed rainfall records over East Africa and their relations to historical sea surface temperature changes. J. Hydrol. 2012, 464–465, 140–156. [Google Scholar] [CrossRef]
- Suryabhagavan, K.V. GIS-based climate variability and drought characterization in Ethiopia over three decades. Weather Clim. Extrem. 2017, 15, 11–23. [Google Scholar] [CrossRef]
- Martinez, C.J.; Maleski, J.J.; Miller, M.F. Trends in precipitation and temperature in Florida, USA. J. Hydrol. 2012, 452–453, 259–281. [Google Scholar] [CrossRef]
© 2018 by the authors. Licensee MDPI, Basel, Switzerland. This article is an open access article distributed under the terms and conditions of the Creative Commons Attribution (CC BY) license (http://creativecommons.org/licenses/by/4.0/).

 ,
, 


