Establishment and Evaluation of the China Meteorological Assimilation Driving Datasets for the SWAT Model (CMADS)


1
College of Resources and Environmental Science, China Agricultural University (CAU), Beijing 100094, China
2
Department of Civil Engineering, The University of Hong Kong (HKU), Pokfulam 999077, Hong Kong, China
3
State Key Laboratory of Simulation and Regulation of Water Cycle in River Basin & China Institute of Water Resources and Hydropower Research (IWHR), Beijing 100083, China
4
National Meteorological Information Center, China Meteorological Administration (CMA), Beijing 100081, China
5
Department of Earth & Environmental Science, Xi’an Jiaotong University, Xi’an 710049, China
6
Xinjiang Institute of Ecology and Geography, Chinese Academy of Sciences (CAS), Urumqi 830046, China
*
Authors to whom correspondence should be addressed.
Water 2018, 10(11), 1555; https://doi.org/10.3390/w10111555
Submission received: 17 September 2018
/
Revised: 27 October 2018
/
Accepted: 30 October 2018
/
Published: 1 November 2018
(This article belongs to the Special Issue Application of the China Meteorological Assimilation Driving Datasets for the SWAT Model (CMADS) in East Asia)
Abstract
:We describe the construction of a very important forcing dataset of average daily surface climate over East Asia—the China Meteorological Assimilation Driving Datasets for the Soil and Water Assessment Tool model (CMADS). This dataset can either drive the SWAT model or other hydrologic models, such as the Variable Infiltration Capacity model (VIC), the Soil and Water Integrated Model (SWIM), etc. It contains several climatological elements—daily maximum temperature (°C), daily average temperature (°C), daily minimum temperature (°C), daily average relative humidity (%), daily average specific humidity (g/kg), daily average wind speed (m/s), daily 24 h cumulative precipitation (mm), daily mean surface pressure (HPa), daily average solar radiation (MJ/m2), soil temperature (K), and soil moisture (mm3/mm3). In order to suit the various resolutions required for research, four versions of the CMADS datasets were created—from CMADS V1.0 to CMADS V1.3. We have validated the source data of the CMADS datasets using 2421 automatic meteorological stations in China to confirm the accuracy of this dataset. We have also formatted the dataset so as to drive the SWAT model conveniently. This dataset may have applications in hydrological modelling, agriculture, coupled hydrological and meteorological modelling, and meteorological analysis.
1. Introduction
Many studies have demonstrated the need for a more realistic distribution of surface climate in meteorological analyses, biogeochemical modelling, and hydrological modelling. Examples of such research include flood and large-scale meteorological studies [1], water balance simulations [2,3], agricultural research [4,5], climate research [6,7,8], and hydrological modelling [9,10]. It is clear that the resolution and accuracy of the meteorological data may influence the analysis results; indeed, significant amounts of uncertainty exist in coarse-resolution meteorological data. The existing data have been used all over the world, such as in Climate Forecast System Reanalysis (CFSR) [11]; the National Center for Atmospheric Research (NCAR-R1\R2) [12,13]; the ERA-Interim [14], ERA-15 [15], and EAR-40 [16] products from the European Centre for Medium-Range Weather Forecasts (ECMWF); and the Modern Era Retrospective-Analysis for Research and Applications (MERRA) from the National Aeronautics and Space Administration (NASA). These data are very useful for the water balance analyses and climate change research at the global scale. However, the re-analysis data are too coarse for national or regional scale research. Further, as part of the resolution, it may not be possible to correct deviations in this re-analysis data using local meteorological observation data.
Although China occupies a vast area with complex topographies, meteorological stations are relatively scarce within the country. The existing network of observation stations no longer meets the requirements for large-scale research on hydrological processes, floods, and hydrologic balance. In addition, traditional meteorological stations can only provide data on individual public stations within the country. The use of data obtained from a limited number of meteorological stations clearly does not accurately represent the actual situation on the ground surface at a larger scale. As such, there is an urgent need for a higher resolution dataset that can be used to drive regional hydrological models (such as the SWAT model) to identify the true process occurring in the watershed [17,18]. The Soil and Water Assessment Tool (SWAT) was developed by the United States Department of Agriculture (USDA) Agricultural Research Service (ARS), and designed to predict the impacts of management practices on the quality and quantity of water, sediment, and climate change in large complex watersheds with various soils, land use, and management conditions. SWAT is a physically-based continuous distributed model that operates on a daily time step, and it requires data such as weather, soil properties, topography, vegetation, and land management practices. The SWAT model has been widely applied in simulating soil and water loss and non-point source pollution [19].
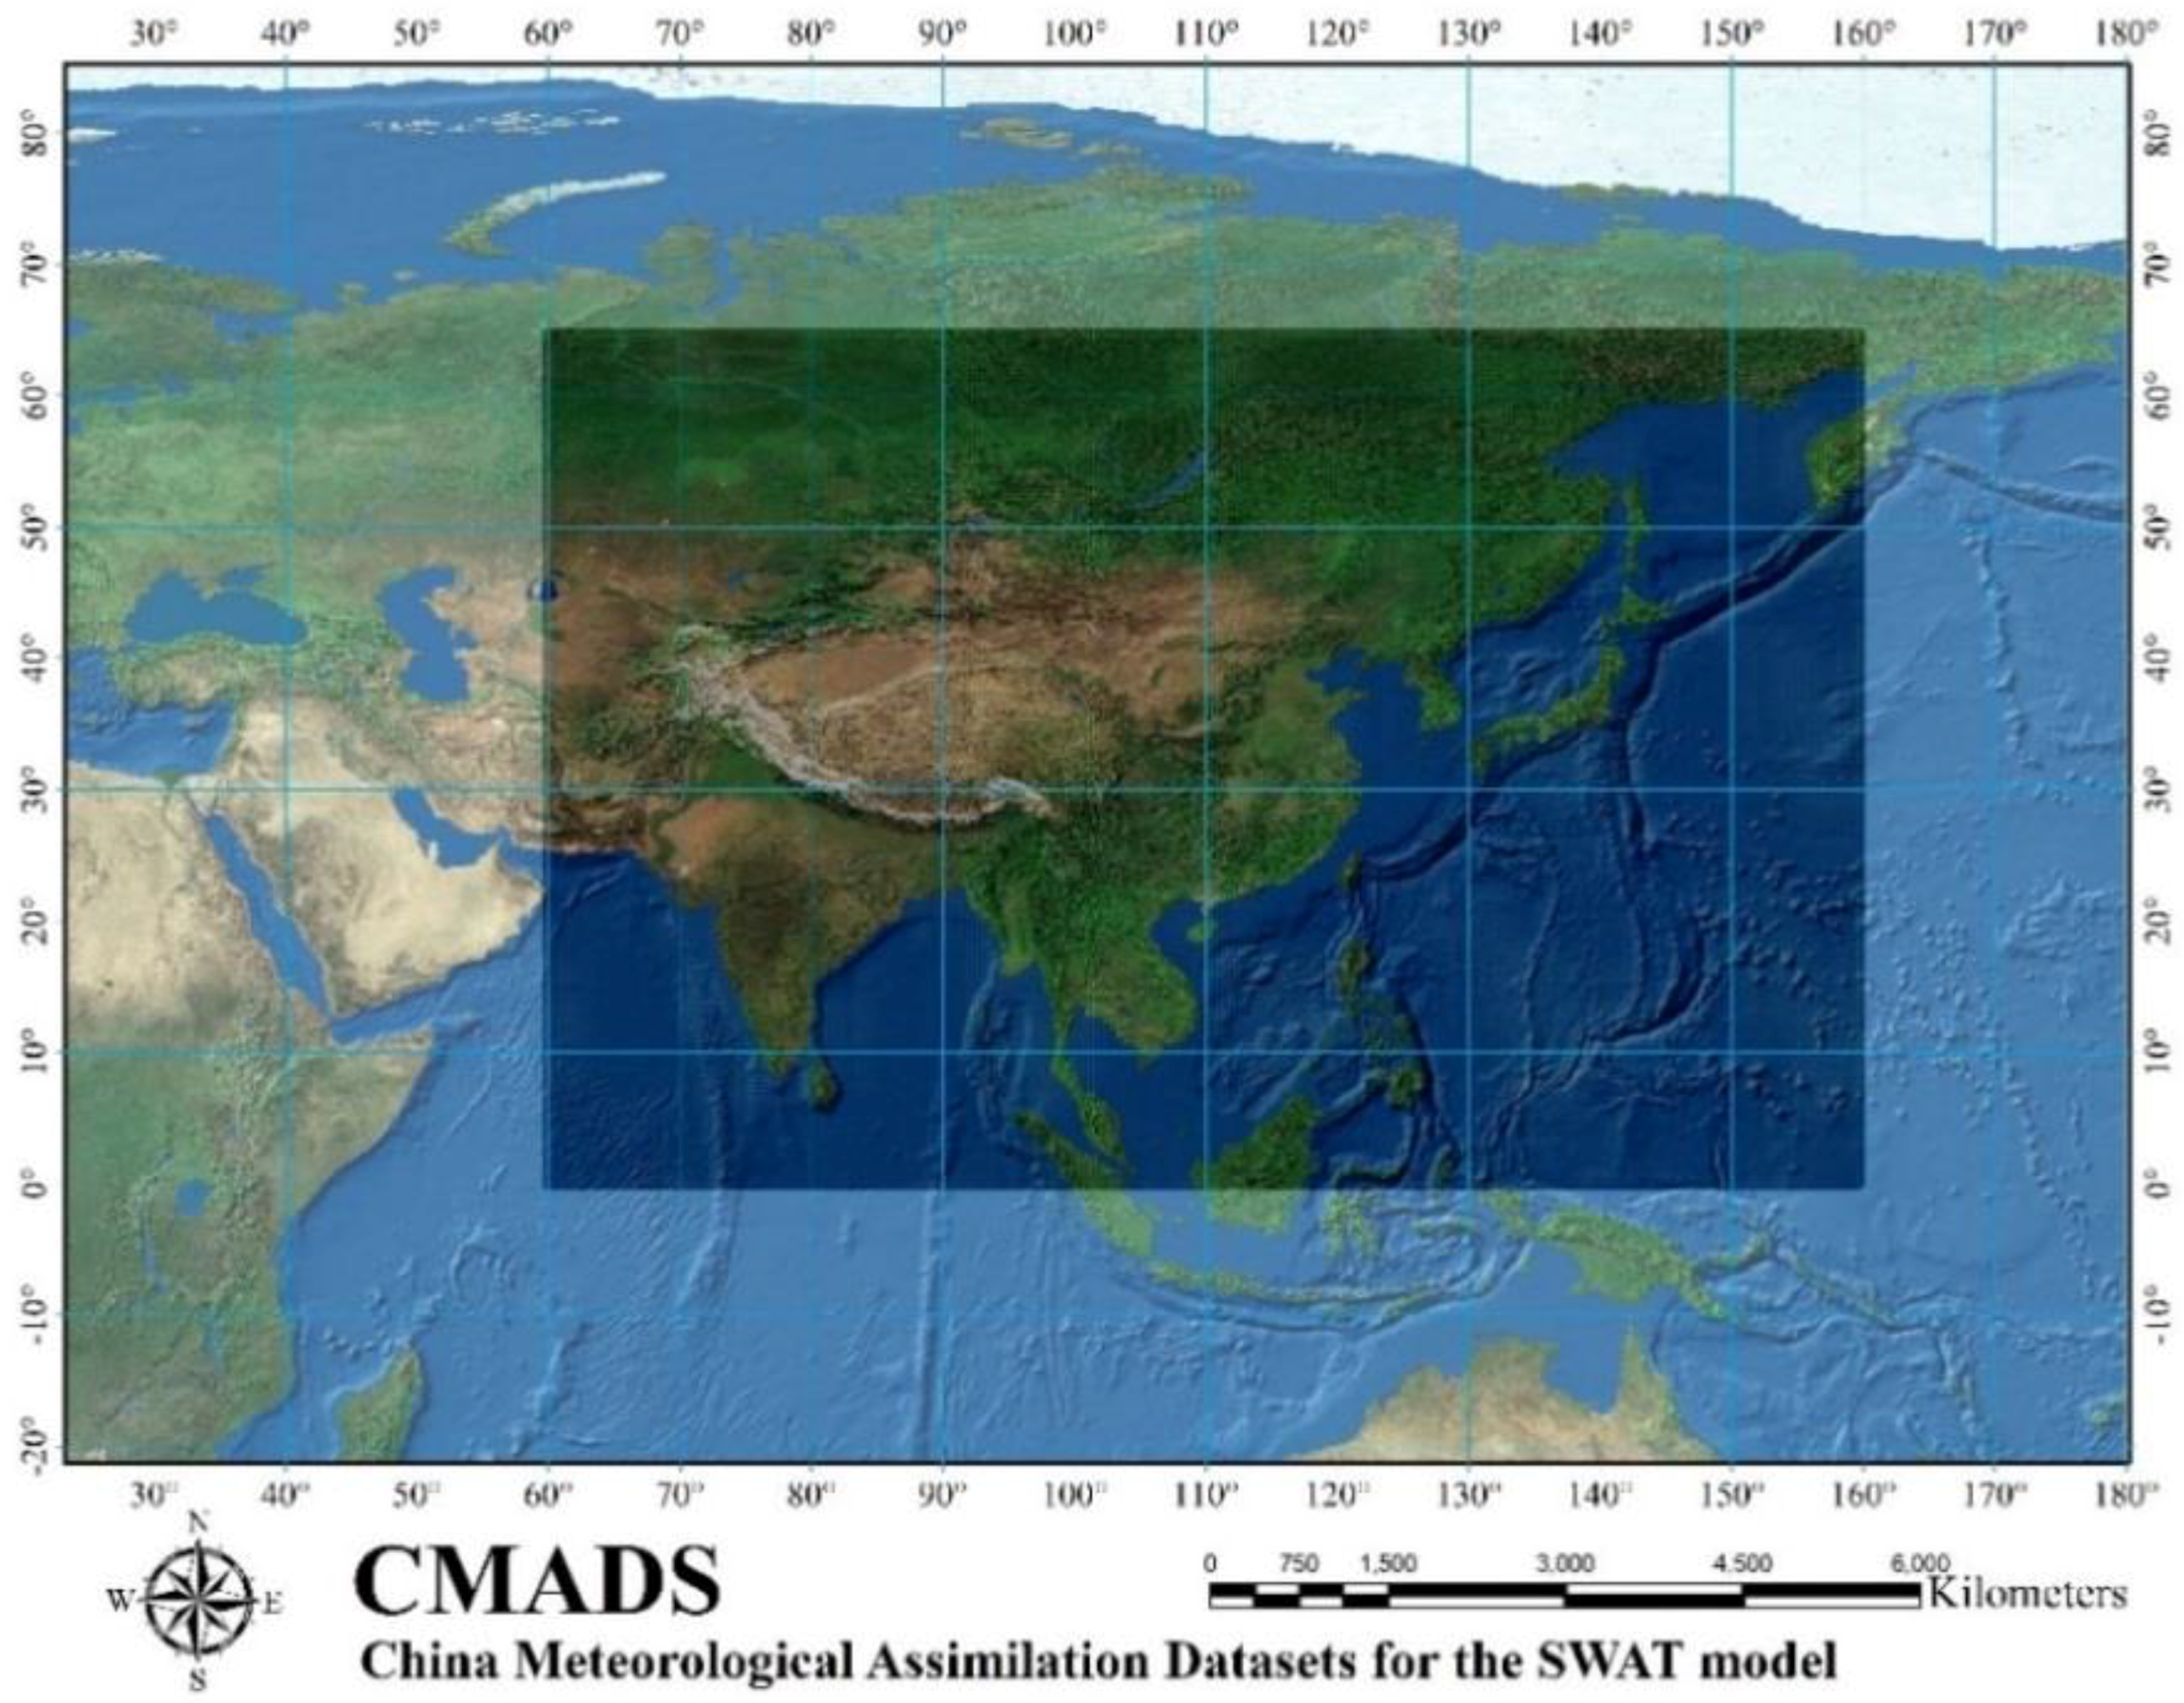
This article describes the construction of CMADS over East Asia (0° N–65° N, 60° E–160° E) (Figure 1). The China Meteorological Assimilation Driving Datasets for the SWAT model (CMADS) is a public dataset developed by Dr. Xianyong Meng from China Agricultural University (CAU). CMADS incorporated technologies of Local Analysis and Prediction System/Space-Time Multiscale Analysis System (LAPS/STMAS) [8] and was constructed using multiple technologies and scientific methods, including the loop nesting of data, resampling, and bilinear interpolation.
The CMADS series of datasets can be used to drive various hydrological models, such as SWAT, the Variable Infiltration Capacity (VIC) model, and the Soil and Water Integrated Model (SWIM). It also allows users to conveniently extract a wide range of meteorological elements for detailed climatic analyses. Data sources for the CMADS series include nearly 40,000 regional encrypted stations under China’s 2421 national automatic and business assessment centres. This ensures that the CMADS datasets have a wide applicability within the country and that the data accuracy was vastly improved. The CMADS series of datasets has undergone finishing and correction to match the specific format of input and driving data of SWAT models. This reduces the volume of complex work that model builders have to deal with. An index table of the various elements encompassing all of East Asia was also established for SWAT models. This allows the models to utilize the datasets directly, thus eliminating the need for any format conversion or calculations using weather generators. Consequently, significant improvements to the modelling speed and output accuracy of SWAT models were achieved. We used the LAPS/STMAS assimilation method [8] and collected all the relevant meteorological data (e.g., auto observation stations, ECMWF, RADAR, etc.) to construct several versions of datasets for the SWAT model. The CMADS comprises the following variables (Table 1): daily maximum temperature (°C), daily average temperature (°C), daily minimum temperature (°C), daily average relative humidity (%), daily average specific humidity (g/kg), daily average wind speed (m/s), daily 24 h cumulative precipitation (mm), daily mean surface pressure (HPa), daily average solar radiation (MJ/m2), soil temperature (K), and soil moisture (mm3/mm3). Further details on the CMADS datasets will be provided in the following sections: Materials and Methods, Results, Usage Notes, and Conclusion.
2. Materials and Methods
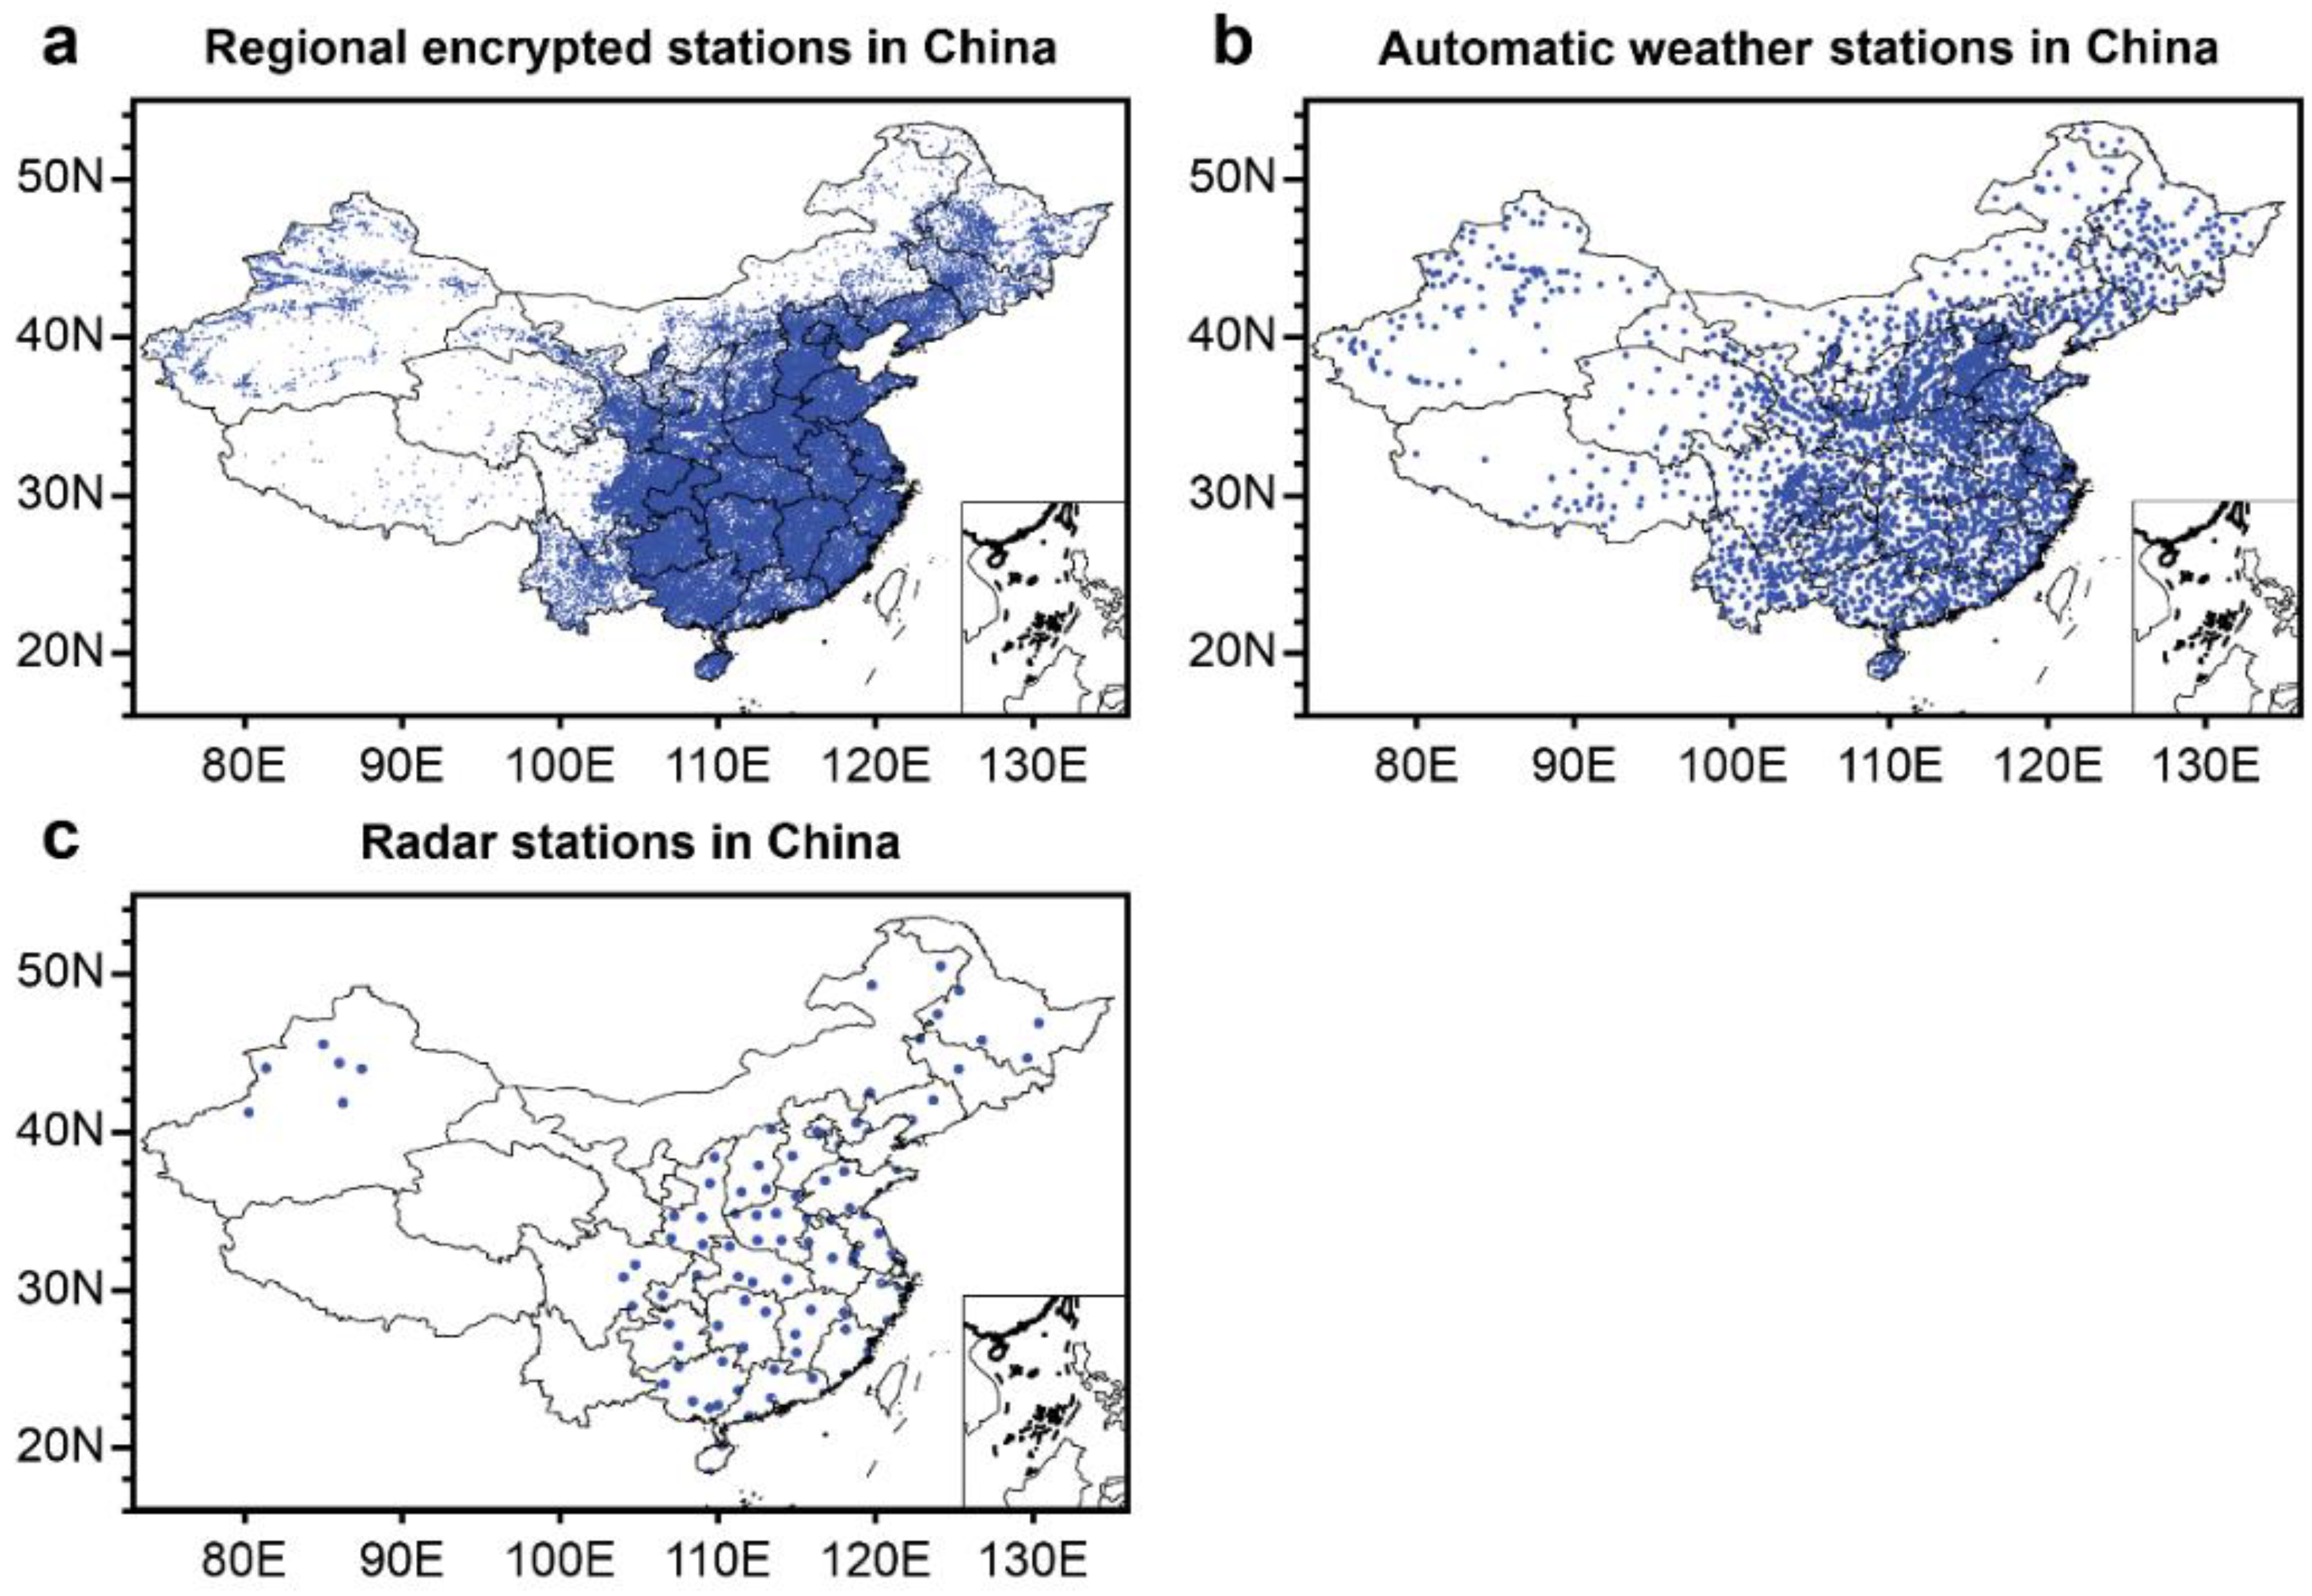
The CMADS have a very strict data assimilation process and have been comprehensively described by Meng et al. [8,20]. First, let us describe the various raw data from the meteorological stations that were incorporated during the process of establishing the CMADS datasets, the assimilation process for the CMADS assimilation field data, and the post-processing of the CMADS data. The raw meteorological data used in this study mainly included the regular raw input data (e.g., regional encrypted stations, national automatic stations, and radar stations), and data from satellites, radars, automatic stations, and background fields of the ECMWF. Several important raw input data for the study are shown in Figure 2, namely data from regional encrypted stations, national automatic stations, and radar stations. The details of the various raw data used to construct the datasets are described below.
2.1. Raw Data for the CMADS Datasets
i. Data from regional encrypted stations:
China has nearly 40,000 regional encrypted stations which provide information on various surface meteorological elements. The main information includes the station numbers, coordinates (latitude and longitude) for the location of each station, altitude of each observation field, altitude based on the barometric pressure sensor, and observation data of each station. The last category includes hourly data of 49 atmospheric elements, including wind direction and speed, temperature, relative humidity, dew point, air pressure, hourly precipitation, and ground temperature. All of the aforementioned data have been subjected to dynamic quality controls, ensuring the accuracy and reliability of the meteorological information.
ii. Data from national automatic stations:
There are 2421 automatic stations nationwide. These provide real-time information on multiple elements, including the daily average pressure; maximum and minimum pressure; average, maximum, and minimum temperature; average and minimum relative humidity; average wind speed; maximum and extreme wind speed and direction; sunshine duration; and precipitation. All the data are subjected to stringent quality control checks. In this study, these were used as the initial assimilation data source for the correction of the various elements [8].
iii. Data from radar stations:
Radar data have become an important component of the weather monitoring network in China. There are 131 radar detection stations in China, and these provide photographs, charts, and data of radar return signals for meteorological phenomena (such as regions with sporadic precipitation). These serve as important bases for Chinese meteorological departments to make weather forecasts for the short- and very short-term (0–72 and 0–12 h, respectively), and especially for the forecasting of precipitation. These are also the main tools used by the China Meteorological Administration (CMA), which provides forecasting services for approaching weather (0–2 h). Given the important role of radar data in China’s weather detection, these were included as one of the raw input data sources for this study.
All three aforementioned categories of data had been subjected to strict quality control (Include formatting, theoretical limit check, climatic extremum check, factor correlation check, Time consistency check, and horizontal homogeneity check), and only those data marked under quality control as being of Grade 1 accuracy were used. Prior to the assimilation and integration of the observation data and background fields, the numerous uncertainties existing in the metadata were highlighted. Some of the observation stations that did not participate in the assessment were also noted. Other than the various types of traditional observation data, the CMADS also uses the six-hourly reanalysis components of the ERA-Interim datasets released by the European Centre for Medium-range Weather Forecasts (ECMWF) as its basic background fields. These include six-hourly data on the pressure, potential temperature, and vorticity under the regional mode. This data product was jointly released by the ECMWF and the Integrated Forecasting System (IFS) system (established in 2006). The IFS system contains four-dimensional variational (4D-VAR) modules spanning 12-hourly windows for analysis.
2.2. The Assimilation Process for Source Data
The integration of air temperature, air pressure, humidity, and wind speed data was mainly achieved through the LAPS/STMAS system [21]. The LAPS system is a comprehensive analytical system containing data from multiple sources. It has five major functional modules [22] that analyse wind, ground surface, temperature, clouds, and water vapour. The analysis must be carried out in a specific sequence [22] because analytical results from earlier stages are required for subsequent analyses. The analytical results of the five modules can be used for diagnostic analysis to arrive at certain values to support the weather diagnosis. The results can also be entered into numerical models after undergoing balance analysis, thereby realizing the warm boot of the modules.
STMAS is a new-generation integration system that was developed under the LAPS framework. Its algorithm uses a multi-grid sequential variational method, which is different from the traditional LAPS system. Functionally, STMAS’ ground surface analytical module replaces the LAPS’ ground surface analysis, and its STMAS3D module replaces LAPS’ wind and temperature analyses. Input–output analyses and analysis of clouds, water vapour, and energy balance and hydrological balance are still dependent on LAPS. There are plans for the gradual integration of LAPS’ non-adiabatic initialization technology with STMAS to form a separate system [21].
2.3. The Integration Process for the Precipitation Data
Precipitation data of CMADS were stitched using CMORPH’s global precipitation products [23], the National Meteorological Information Center’s data of China (which is based on CMORPH’s integrated precipitation products) [24]. The latter contains daily precipitation records observed at 2400 national meteorological stations and the CMORPH satellite’s inversion precipitation products. It was developed with a two-step data integration method that combined the probability density function (PDF) matching and optimal interpolation (OI) [25].
After comparison with heavy precipitation events monitored in China, this dataset was found to describe changes in precipitation intensity more accurately, as well as provide greater details on the spatial distribution of precipitation. It has obvious advantages in capturing the small-scale features of precipitation and has the characteristics of a precipitation product with both high resolution and high precision.
2.4. The Assimilation Process for the Radiation Data
The inversion algorithm used for creating CMADS solar radiation at the ground surface makes use of the discrete longitudinal method by Stamnes et al. [26], the same method as used for CLDAS. This algorithm can be used to calculate the radiance in any direction as it takes into account the anisotropy when the top of the atmosphere reflects solar radiation. First, the radiance of reflected solar radiation at the top of the atmosphere in the direction of the observation of the satellite is calculated. Next, the results are converted to bidirectional visible albedo as observed by the satellite’s visible light channel.
The transmission process by which incoming solar radiation at the top of the atmosphere travels through the atmosphere and reaches the ground surface involves a series of physical processes that interact with both the atmosphere and ground surface. The following are considered by the inversion model: (i) ozone absorption, (ii) multiple molecular Rayleigh scattering, (iii) multiple scattering and absorption of cloud droplets, (iv) absorption of water vapour, (v) multiple scattering and absorption of aerosol, and (vi) multiple reflections of the ground surface and atmosphere [27].
The CMADS in grid format (hereafter referred to as CMADS-GRID) was eventually constructed after assimilation of the various types of observation and background data. It serves as the source data for CMADS, but it does not provide the relative humidity component as its output. In addition, the source data for CMADS were processed using LAPS and other means before their format was standardized as NetCDF.
2.5. The Construction Process for the CMADS Datasets
Preparation of the CMADS datasets was completed through the processes of data interpolation and resampling, calculating relative humidity elements (See Section 2.5.2) and format conversion, and elevation extraction. This ensures that the various hydrological models are able to read and access the data.
2.5.1. The Configuration of Spatiotemporal Resolutions
The maximum spatiotemporal resolution of the CMADS-GRID is 1/16°, 1 h. If the weather stations loaded into the ArcSWAT over a certain number, SWAT will refuse to read it [14]. Study areas at various scales also have different requirements in terms of the number of meteorological stations from which to obtain data. For example, if the scale of the study area is small, an atmospheric drive field with a coarse resolution would not be able to reflect the true state of the atmospheric components at the ground surface effectively. Taking into account these two constraints (limiting the number of meteorological stations and research needs), four versions of the CMADS datasets at various resolutions were considered. Specifically, the resolutions for CMADS V1.0, V1.1, V1.2, and V1.3 were 1/3°, 1/4°, 1/8°, and 1/16°, respectively. Currently, the requisite integral timescale used by most SWAT models to drive data is daily steps. However, the atmospheric driving fields of the CMADS-GRID are based on hourly steps. As such, the CMADS-GRID dataset has to be aggregated to daily time steps.
In this study, the daily output of the CMADS-GRID’ atmospheric assimilation fields was averaged and cumulated on a daily basis, following which it was screened. For the air temperature element, the CMADS screened the maximum and minimum values from the CMADS-GRID’ intra-day data to establish the maximum and minimum daily temperatures. Calculations were also done using the 24-h data from the CMADS datasets to obtain the average daily values for the following elements: temperature (°C), pressure (HPa), specific humidity (g/kg), wind speed (m/s), and solar radiation (MJ/m2). For precipitation, the summation of the 24-h data gave the cumulative daily precipitation (mm).
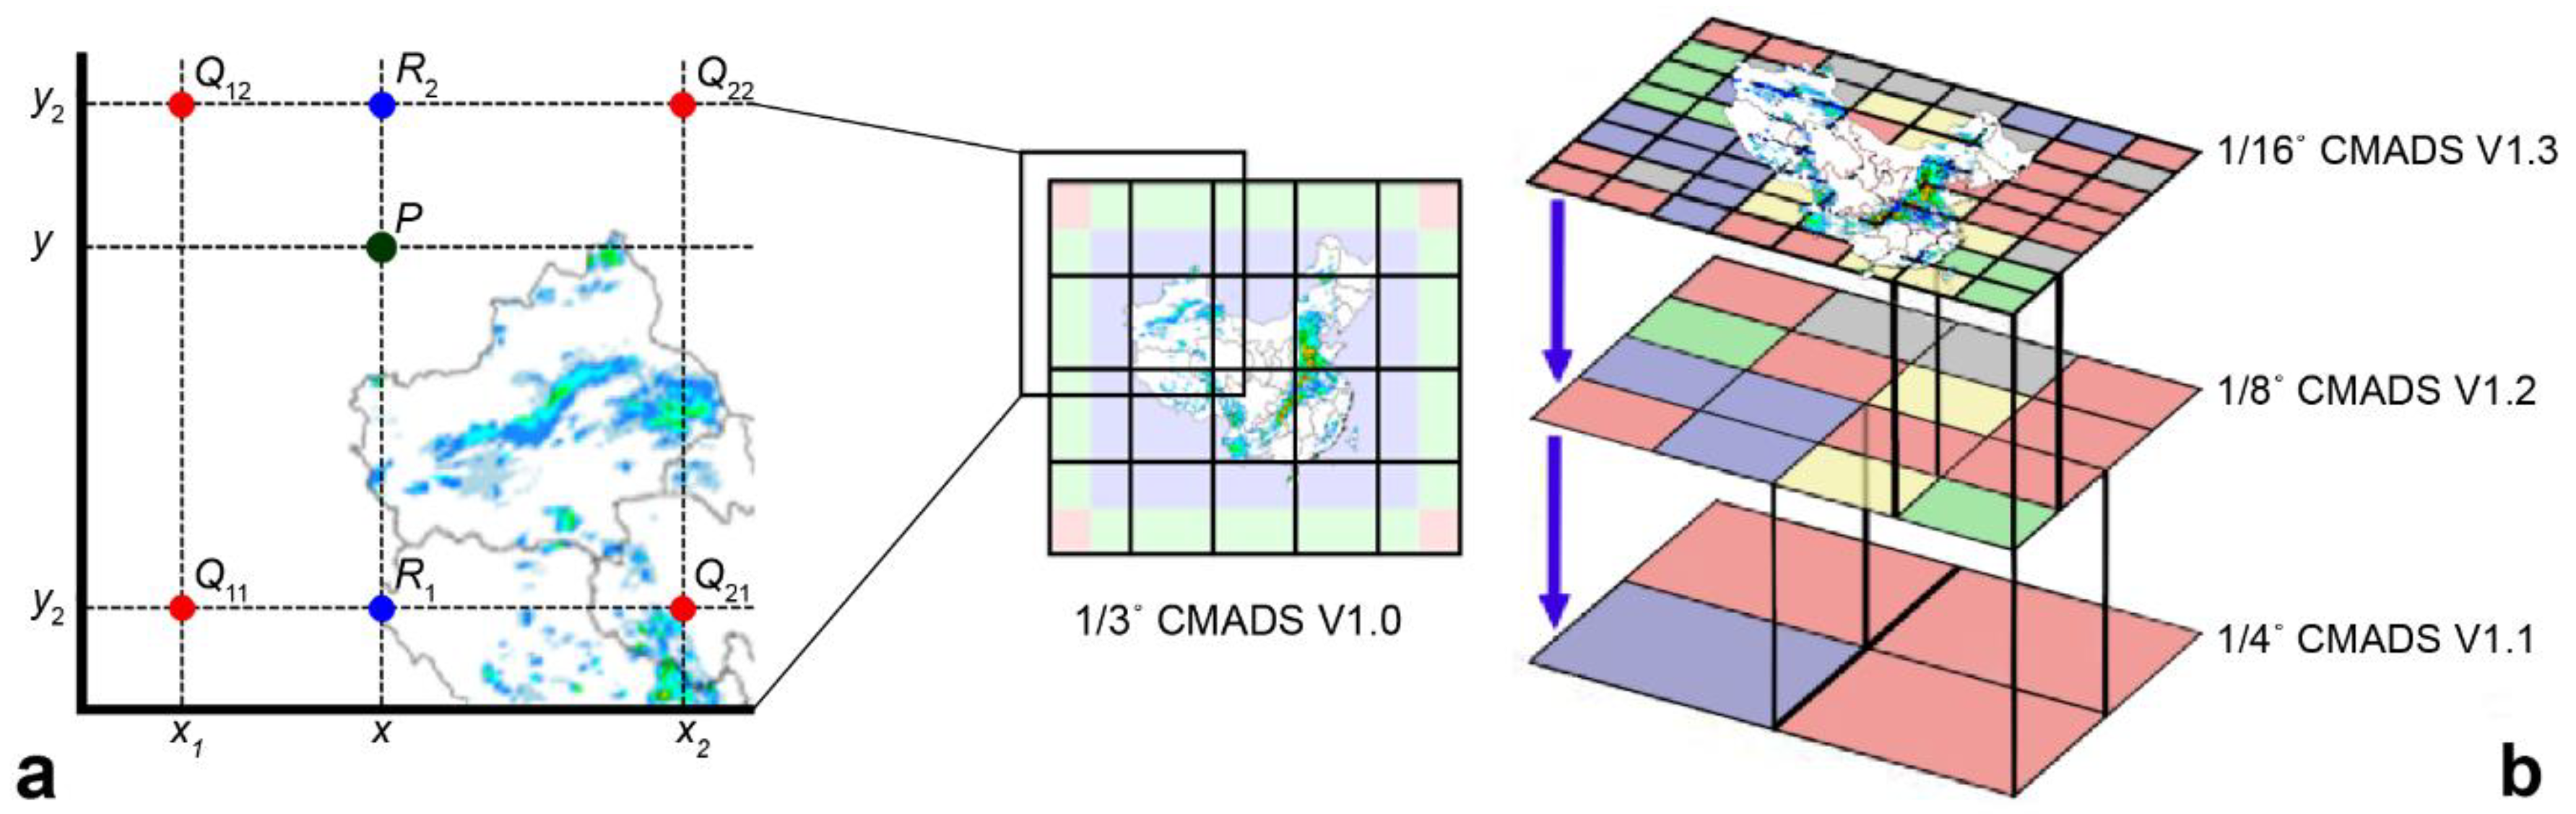
As mentioned earlier, datasets with various spatial resolutions were constructed in this study to overcome the model’s limitations on the number of stations from which the data were accepted, and the requirements imposed by research areas of different scales. Since the resolution of the source data for the CMADS was 1/16°, two sampling methods were considered when the interpolation calculations were done for the four resolutions. Since the resolution 1/3° is an integer multiple of 1/16°, the bilinear interpolation method was applied (Figure 3a). For the other higher resolutions (1/4°, 1/8°, and 1/16°), the nested assignment was used for data reconstruction (Figure 3b).
2.5.2. Calculation of the Relative Humidity Element
An important input element for SWAT models is relative humidity data, but this component was not provided by the CMADS-GRID (CMADS-GRID provides: hourly temperature (°C), hourly Specific Humidity (g/kg), hourly wind speed (m/s), hourly precipitation (mm), hourly surface pressure (HPa), hourly solar radiation (MJ/m2)). Hence, calculation of the relative humidity element was critical. This was achieved using a conversion relationship between the specific and relative humidity.
Equations (1) and (2) were used for calculating the specific humidity (SH) and the corresponding relative humidity (), respectively.
where SH represents the specific humidity, PH2O represents the water vapour pressure and p represents the air pressure.
However, the specific humidity is also defined as the ratio of the mass of water vapour to that of the entire air system (dry air plus water vapour).
2.5.3. Processing of the Data Format
The data in the CMADS datasets were strictly processed to match the format required to be readable and accessible by SWAT models. For SWAT (ArcSWAT and SWAT plus) and other models, the CMADS datasets provide two formats (.dbf and .txt) by which the models could directly access elements of the stations on a daily basis, including maximum and minimum temperature (°C), average wind speed (m/s), average solar radiation (MJ/m2), cumulative precipitation (24 h), and average surface pressure (HPa).
At the same time, CMADS also provides data in the .txt format for use in other hydrological models, such as VIC and SWIM. This format also facilitates data analysis by climate analysts and researchers. The main elements provided in the txt format on a daily basis include maximum, average and minimum air temperature (°C); specific humidity (g/kg), and relative humidity (%); daily wind speed (m/s), daily 24 h cumulative precipitation (mm), surface pressure (HPa), solar radiation (MJ/m2), soil temperature (K) and soil moisture (mm3/mm3).
2.5.4. Other Elements Provided by the CMADS Datasets
In addition to providing users with data on the various surface meteorological elements recorded by the stations, the CMADS datasets also include the specific latitude, longitude, and elevation for the geographical location of each element. The latitudes and longitudes were projected based on the WGS84 spatial and geographical coordinates, while the altitudinal zones were extracted using the Global 30 Arc-Second Elevation (GTOPO30) [28,29]. The GTOPO30 is a global digital elevation model (DEM) with a horizontal grid spacing of 30 arc seconds (approximately 1 km). After altitudinal extraction, the CMADS datasets would create an index table for all grid points within East Asia based on the requisite format of SWAT models. The index table facilitates direct reading and access by SWAT models and concurrently allows other model users to access information on the various meteorological stations.
2.5.5. CMADS Data Records
CMADS datasets are available at the CMADS official website (http://www.cmads.org/) and the SWAT official website (https://swat.tamu.edu/software/). Table 1 contains a brief summary of the CMADS datasets. Currently, CMADS has been updated until Version 1.1. In CMADS V1.0 (at a spatial resolution of 1/3°), East Asia was spatially divided into 195 × 300 grid cells containing 58,500 grid points. Despite being at the same time resolution as CMADS V1.0, CMADS V1.1 contains more data, with 260 × 400 grid cells containing 104,000 grid points. In the near future, CMADS will release versions 1.2 and 1.3, the 1.2 version will divide into 520 × 800 grid cells containing 416,000 grid points and the 1.3 version will divide into 1040 × 1600 grid cells containing 1,664,000 grid points.
The CMADS datasets provide users with data in both the .txt and .dbf formats. The file naming convention of the SWAT subsets in the CMADS datasets is as follows: element code: R, P, S, T, or W (the first letter of the meteorological variables) + latitude grid number − longitude grid number. The CMADS-ST and CMADS-SM provide the daily average soil temperature and soil moisture of 10 layers (First Layer: 0.007 m, Second Layer: 0.028 m, Third Layer: 0.062 m, Fourth Layer: 0.119 m, Fifth Layer: 0.212 m, Sixth Layer: 0.366 m, Seventh Layer: 0.620 m, Eighth Layer: 1.038 m, Ninth Layer: 1.728 m, Tenth Layer: 2.864 m).
3. Results
3.1. CMADS: Distribution of Related Variables and Verification of Applicability on China
Since prior studies on precipitation and solar radiation exist [24,25,27], further verification of these elements was not performed in this study. This section describes the verification that was performed for the remaining four elements (namely, air temperature, surface pressure, relative humidity, and wind speed) to test their applicability to China. The observation data used for verification were obtained from the national automatic stations. Given the space limitations, only the verification results for 2011–2013 are shown.
In order to verify the applicability of the various CMADS meteorological elements, this study selected three years of CMADS datasets (2011–2013) for China, extracted the elements on a daily basis, and then calculated the annual averages. Next, the bilinear interpolation method was used for data verification. This was achieved via sample matching of the elements (temperature, pressure, humidity, wind speed, precipitation, and radiation) between the CMADS datasets and records by China’s national automatic stations (2421 in total). Verification of only the first four elements is demonstrated in this study due to space limitations. The various elements from the observation stations that were selected for the matching process were made to pass strict quality controls (including thresholds for the regional and climatic boundaries, and tests for spatiotemporal consistency), the usability rate of the stations’ verification data reached 98.9%. The spatial distributions of the biases and root mean square errors (RMSEs) for the elements of temperature, pressure, relative humidity, and wind speed between the CMADS datasets and national automatic stations are shown in Figure 4, Figure 5, Figure 6 and Figure 7, respectively. The verifications showed that the CMADS datasets accurately reflected the spatial characteristics and distribution of various types of surface elements in China.
3.2. Distribution and Verification of Indicators for Temperature
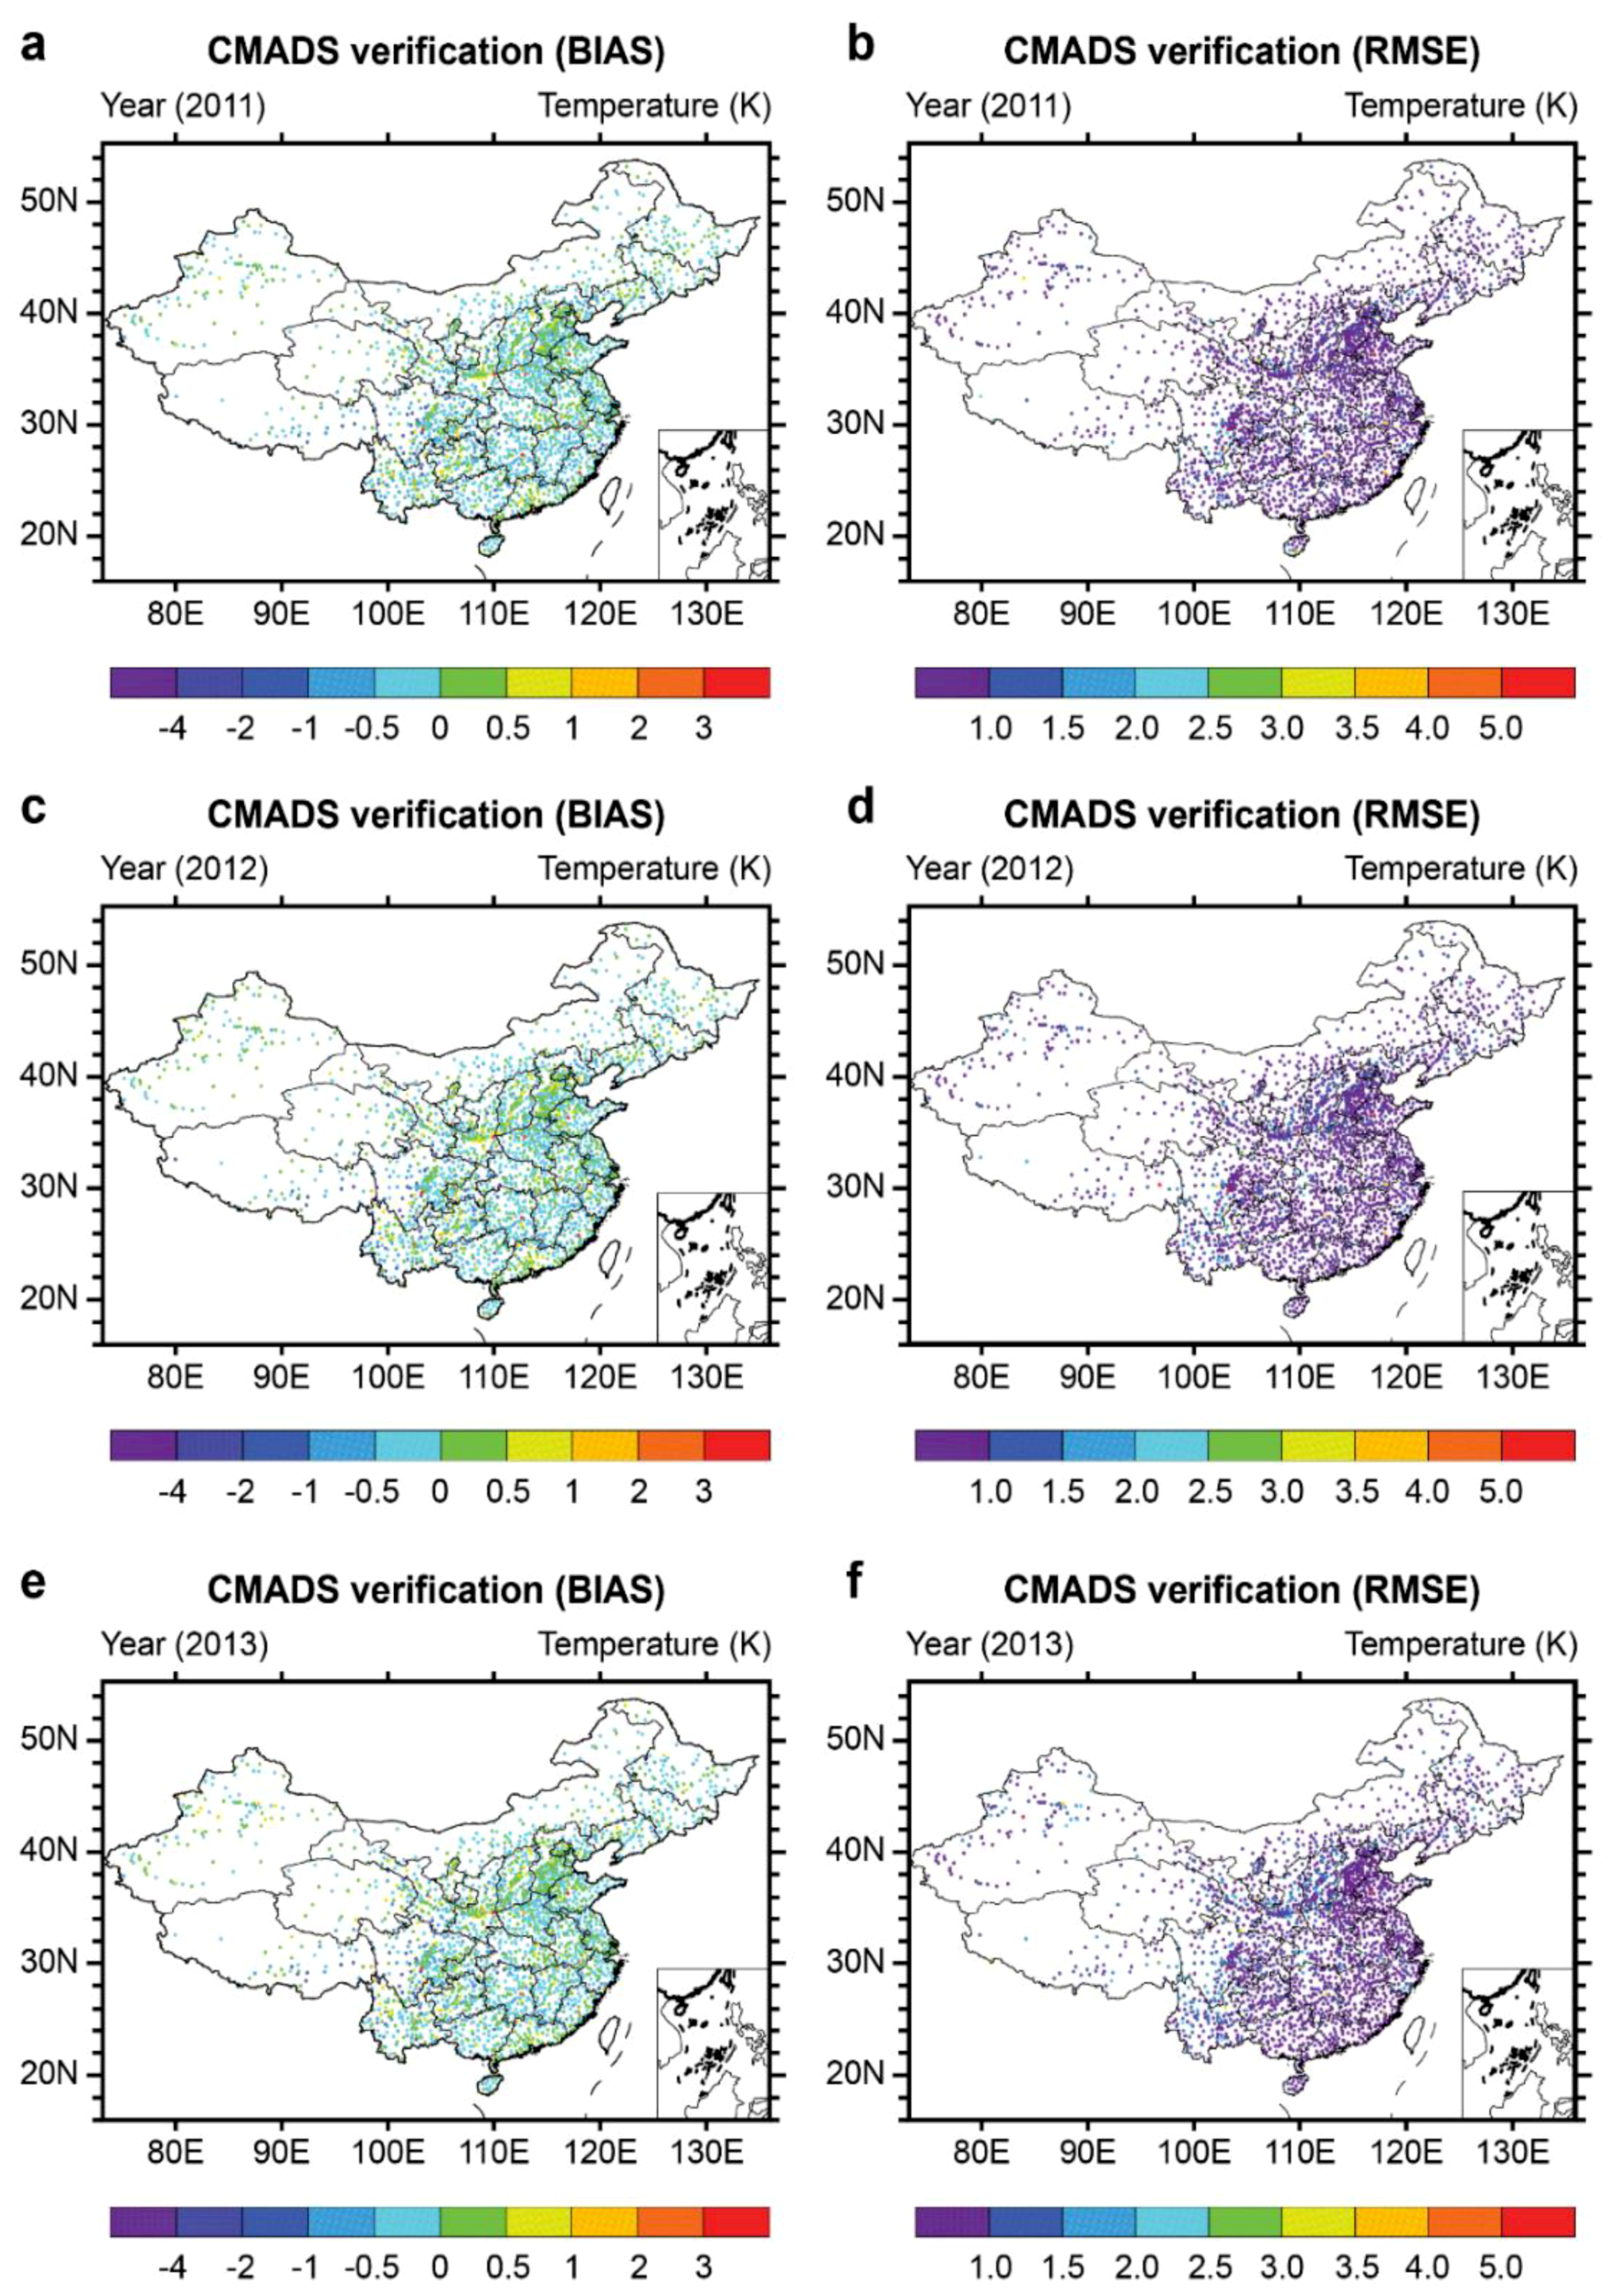
The spatial distribution of indicators for temperatures in 2011–2013 and the related verifications are shown in Figure 4. For the temperature element of the CMADS datasets (2011–2013), the spatiotemporal distributions of the biases and RMSEs are shown in Figure 4a–f, respectively. It was found that over the three-year verification period, the temperature element performed very well for the majority of territories within China in terms of bias. In 2011–2013, the biases between the temperature element of CMADS and those of the observation stations were maintained between −0.5 K and 0.5 K. For North China, the northwest region of Northeast China, the southern region of Southwest China, and the southern region of South China, the biases were concentrated at 0.5–1 K. This phenomenon of weak and positive biases in temperature for these four regions/sub-regions was apparent and occurred consistently over the three years. In contrast, the phenomenon of substantial negative biases in temperature was noted for a minority of stations located in Southwest China (including the eastern portion of the Tibet Autonomous Region, the entire western region of the Sichuan Province, the southern part of Gansu Province, and the western part of Yunnan Province). Most of the negative biases were concentrated between −1 K and −4 K. On the whole, the temperature data in the CMADS datasets were acceptable with regards to the bias indicator for most of the country. Overall, the datasets were verified to be good.
In order to analyze the performance of the temperature element in the CMADS datasets more objectively, we further evaluated its RMSE indicator for China (Figure 4b,d,f). For most of the stations in the country, the RMSEs of the temperature element were controlled within 1 K. In the southeastern part of Northwest China (such as the southern part of Gansu Province, the northern part of the Ningxia Hui Autonomous Region, and the western part of Shaanxi Province) and parts of the southern region of Southwest China (such as the southern part of Sichuan province, and the western and southern parts of Yunnan Province), the RMSEs of most of the temperature elements remained within 2.5 K, with a small number of stations being at 3.5 K. This study also found that the RMSEs of the aforementioned regions gradually increased annually during the three-year period. However, this increase in errors applied to stations located in small areas only (such as the western region of Shaanxi Province). In terms of the RMSE indicator, the verification results for the temperature element of the CMADS dataset were good.
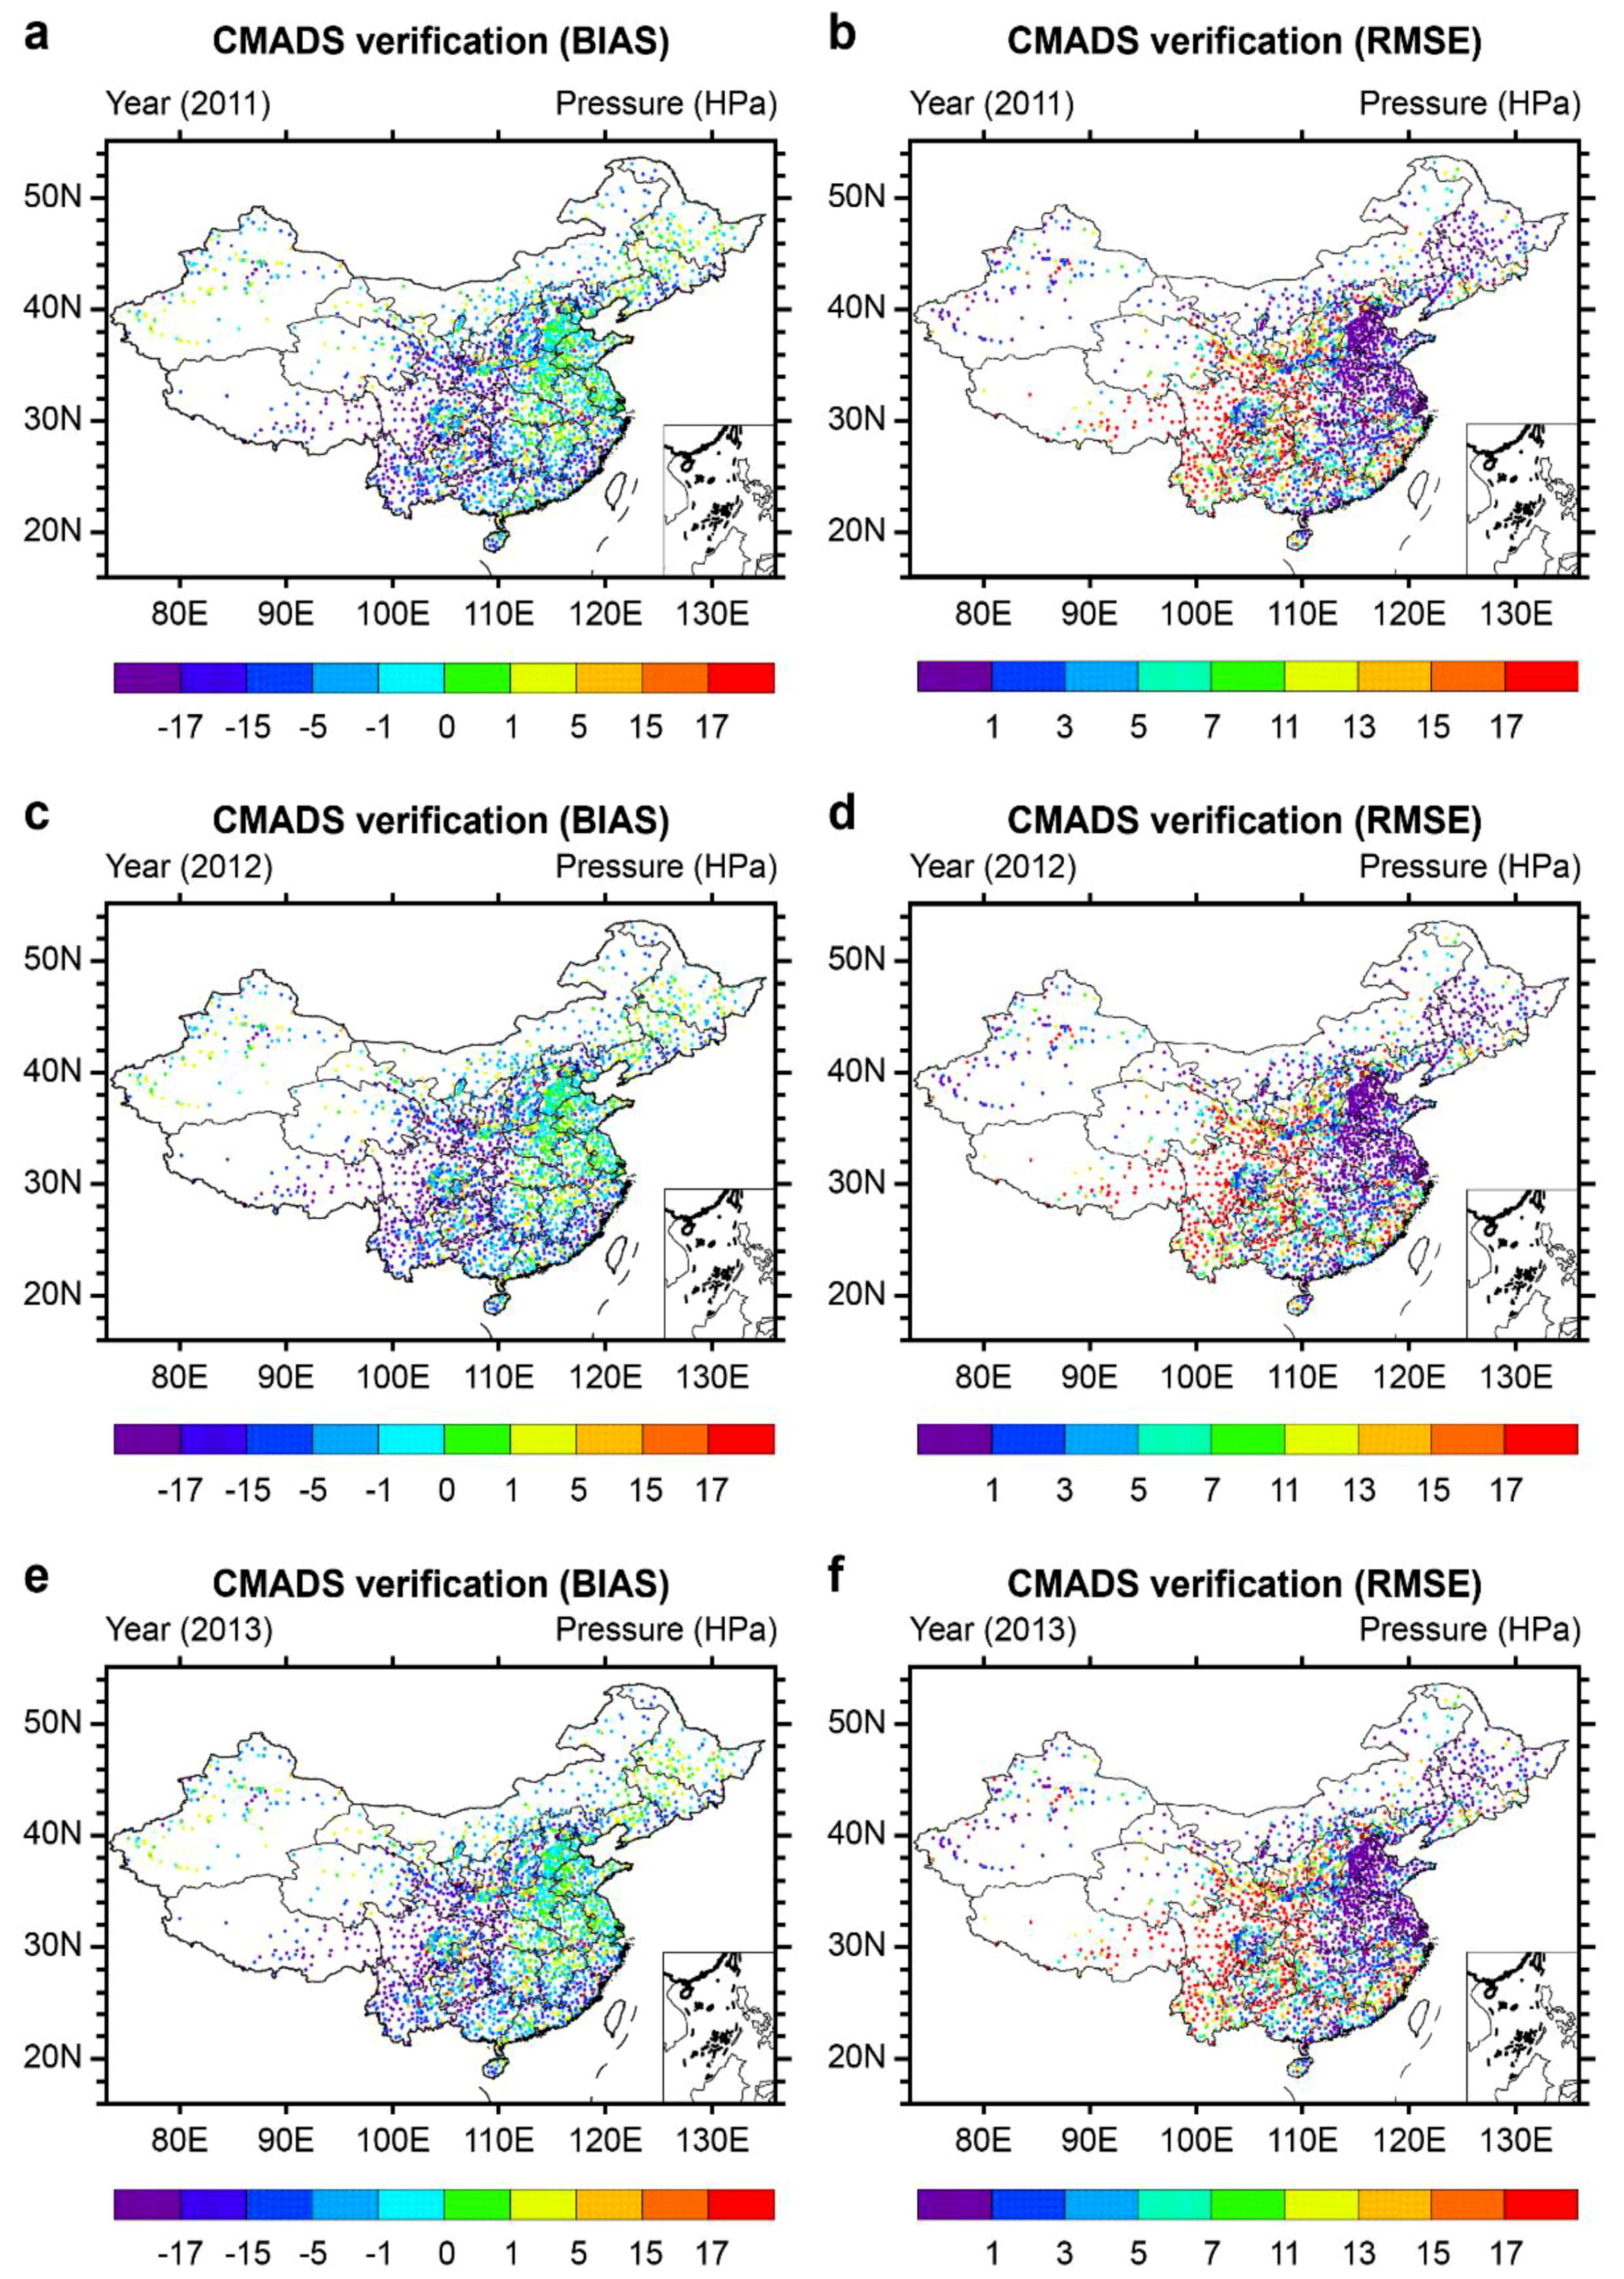
3.3. Distribution and Verification of Indicators for Atmospheric Pressure
The spatial distribution of indicators for pressures during 2011–2013 and the related verifications are shown in Figure 5. For the pressure element of the CMADS datasets (2011–2013), the spatiotemporal distributions of the biases and RMSEs are shown in Figure 5a–f, respectively. It can be seen from Figure 5a,c,e that overall, the CMADS’ biases for atmospheric pressure were mainly found in the eastern region of West China.
Upon detailed analysis, it was found that these biases were controlled within the range of −1 HPa to 5 HPa for the following regions: the central–southern part of Northeast China (the western part of Liaoning Province, all of Jilin Province, and the southern part of Heilongjiang Province); North China; the northern parts of Central and East China (Zhejiang Province, Jiangsu Province, Anhui Province, and Jiangxi Province); the central part of South China (the western part of Guangdong Province); the northern part of Ningxia Hui Autonomous Region; and the intersection between the Chongqing and Sichuan provinces. In contrast, the biases were controlled between −1 HPa and −17 HPa for the southern part of East China (Fujian Province), most of the areas in Southwest China, and Northwest China. Among these regions, the biases were greater (−5 HPa to −17 HPa) for the majority of stations in the southern part of East China (Fujian Province) and most of the areas in Southwest China.
The RMSEs of the atmospheric pressure element in the CMADS datasets (Figure 5b,d,f) presented a similar situation such as that for biases. Specifically, the RMSEs were greater for most of Southwest China, the eastern part of Northwest China, and the southern part of East China (Fujian Province). The errors were mainly positive and contained at 5–17 HPa. For the remaining regions, the performance of the RMSEs was good, with the errors for the majority of stations being controlled within 3 HPa. For both indicators, the performance of the atmospheric pressure data in the CMADS datasets was deemed to be reliable when applied to the entire country.
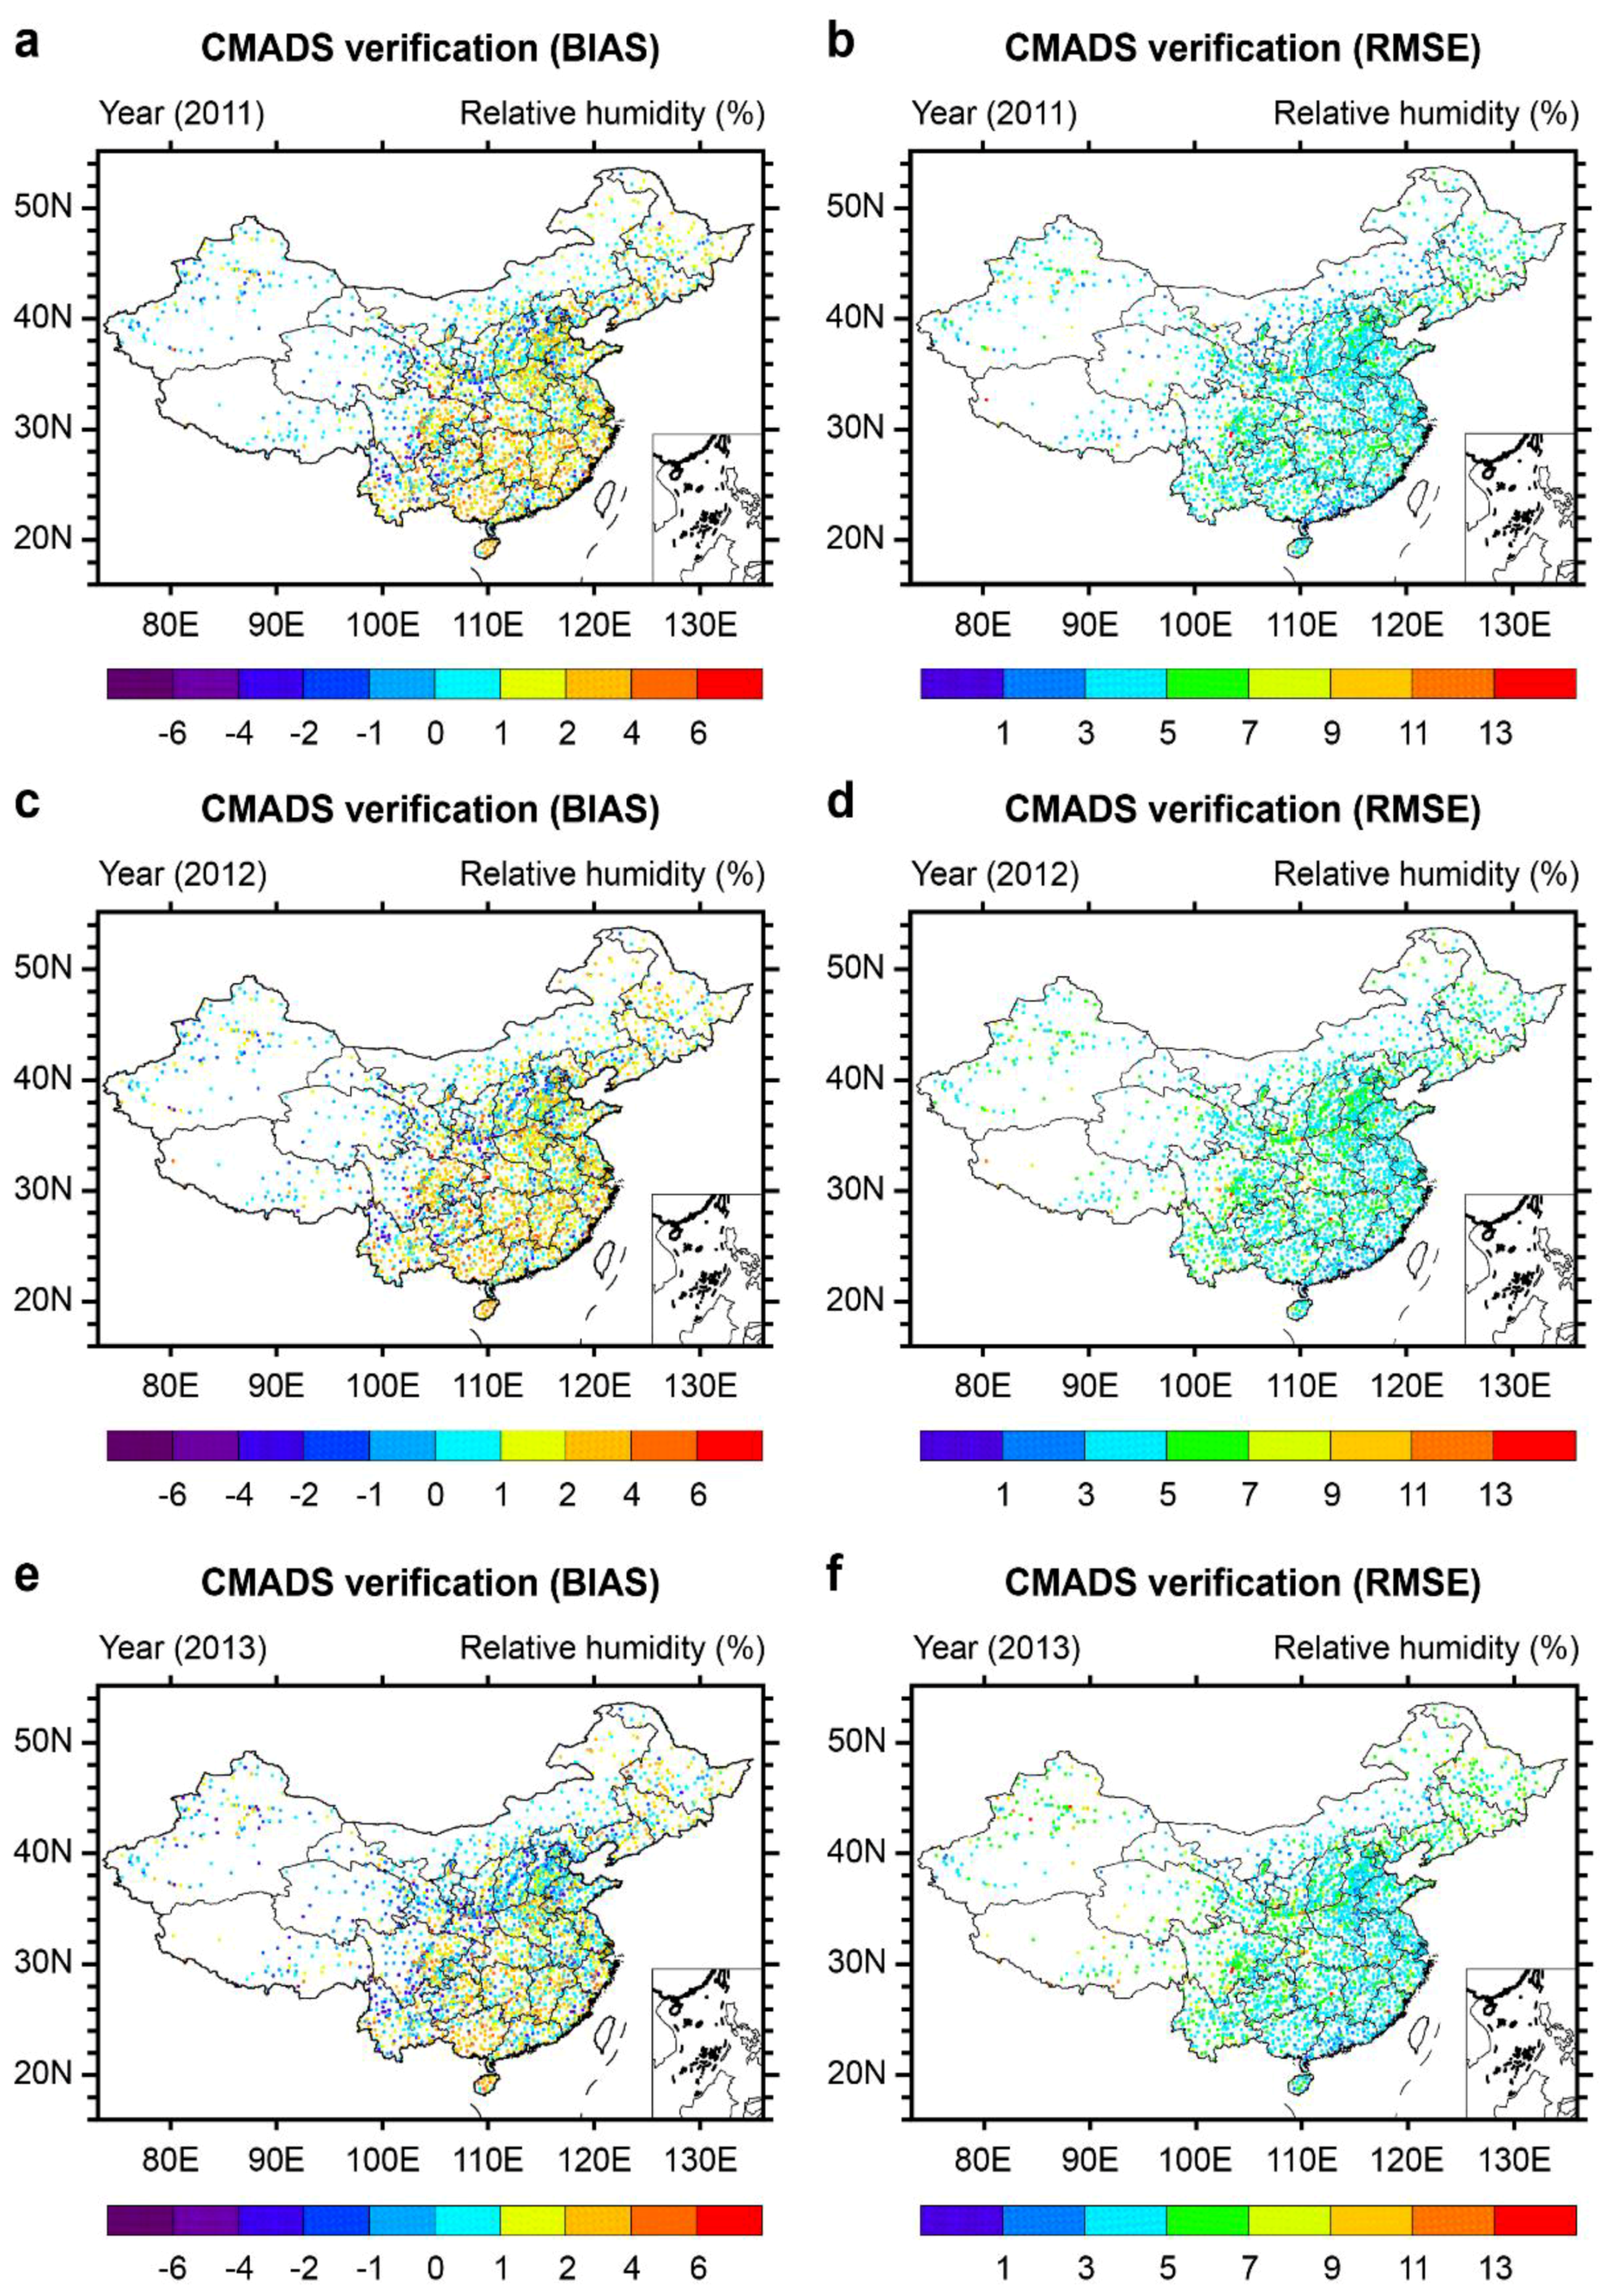
3.4. Distribution and Verification of Indicators for Relative Humidity
The spatial distribution of indicators for relative humidity in 2011–2013 and the related verifications are shown in Figure 6. Figure 6a–f show the spatiotemporal distributions of the biases and RMSEs for the relative humidity element of the CMADS datasets, respectively. Analyses of the biases in relative humidity from an overall perspective revealed that generally, there was a positive bias effect. This effect appeared in Northeast China; North China; East China; Central China; South China; the southeastern parts of South and Southwest China (mainly in the eastern part of the Sichuan Province, Chongqing, Guizhou area, and the southern part of the Yunnan Province); and the southeastern part of Northwest China (mainly in the southern part of the Gansu Province and the central part of the Shaanxi Province). The positive biases for these regions were limited between −1% and 6%.
Slight negative biases (within −1%) were found in Northwest China, the central and northern parts of Southwest China, and Inner Mongolia, and very few stations showed a negative bias between −4 to −1%. Interannual analyses of the relative humidity biases in the CMADS datasets for 2011–2013 indicated a declining trend year-on-year. For some of the stations, positive biases for relative humidity in 2011 became negative biases two years later. The phenomenon of negative biases was the most evident throughout Northwest China, but it also existed generally throughout Southeast China. Analyses of the distribution of RMSEs for relative humidity over China (Figure 6b,d,f) indicated that these were controlled between 3% and 9% for most of the country. As with the biases, the errors were greater (5–9%) in North China; Central China; the eastern part of Northwest China (the southern part of Shaanxi Province); and Southwest China (the southeastern part of Sichuan Province, Yunnan Province, and Guizhou Province). For most of the other regions, the errors were limited to 3–5%. During the period from 2011 to 2013 in this region, a correlation was seen between the trends in the spatial distribution of the RMSE and those of the positive biases in relative humidity. Nevertheless, in terms of overall performance for the entire country, both the biases and RMSEs in the CMADS data on relative humidity were considered to be acceptable.
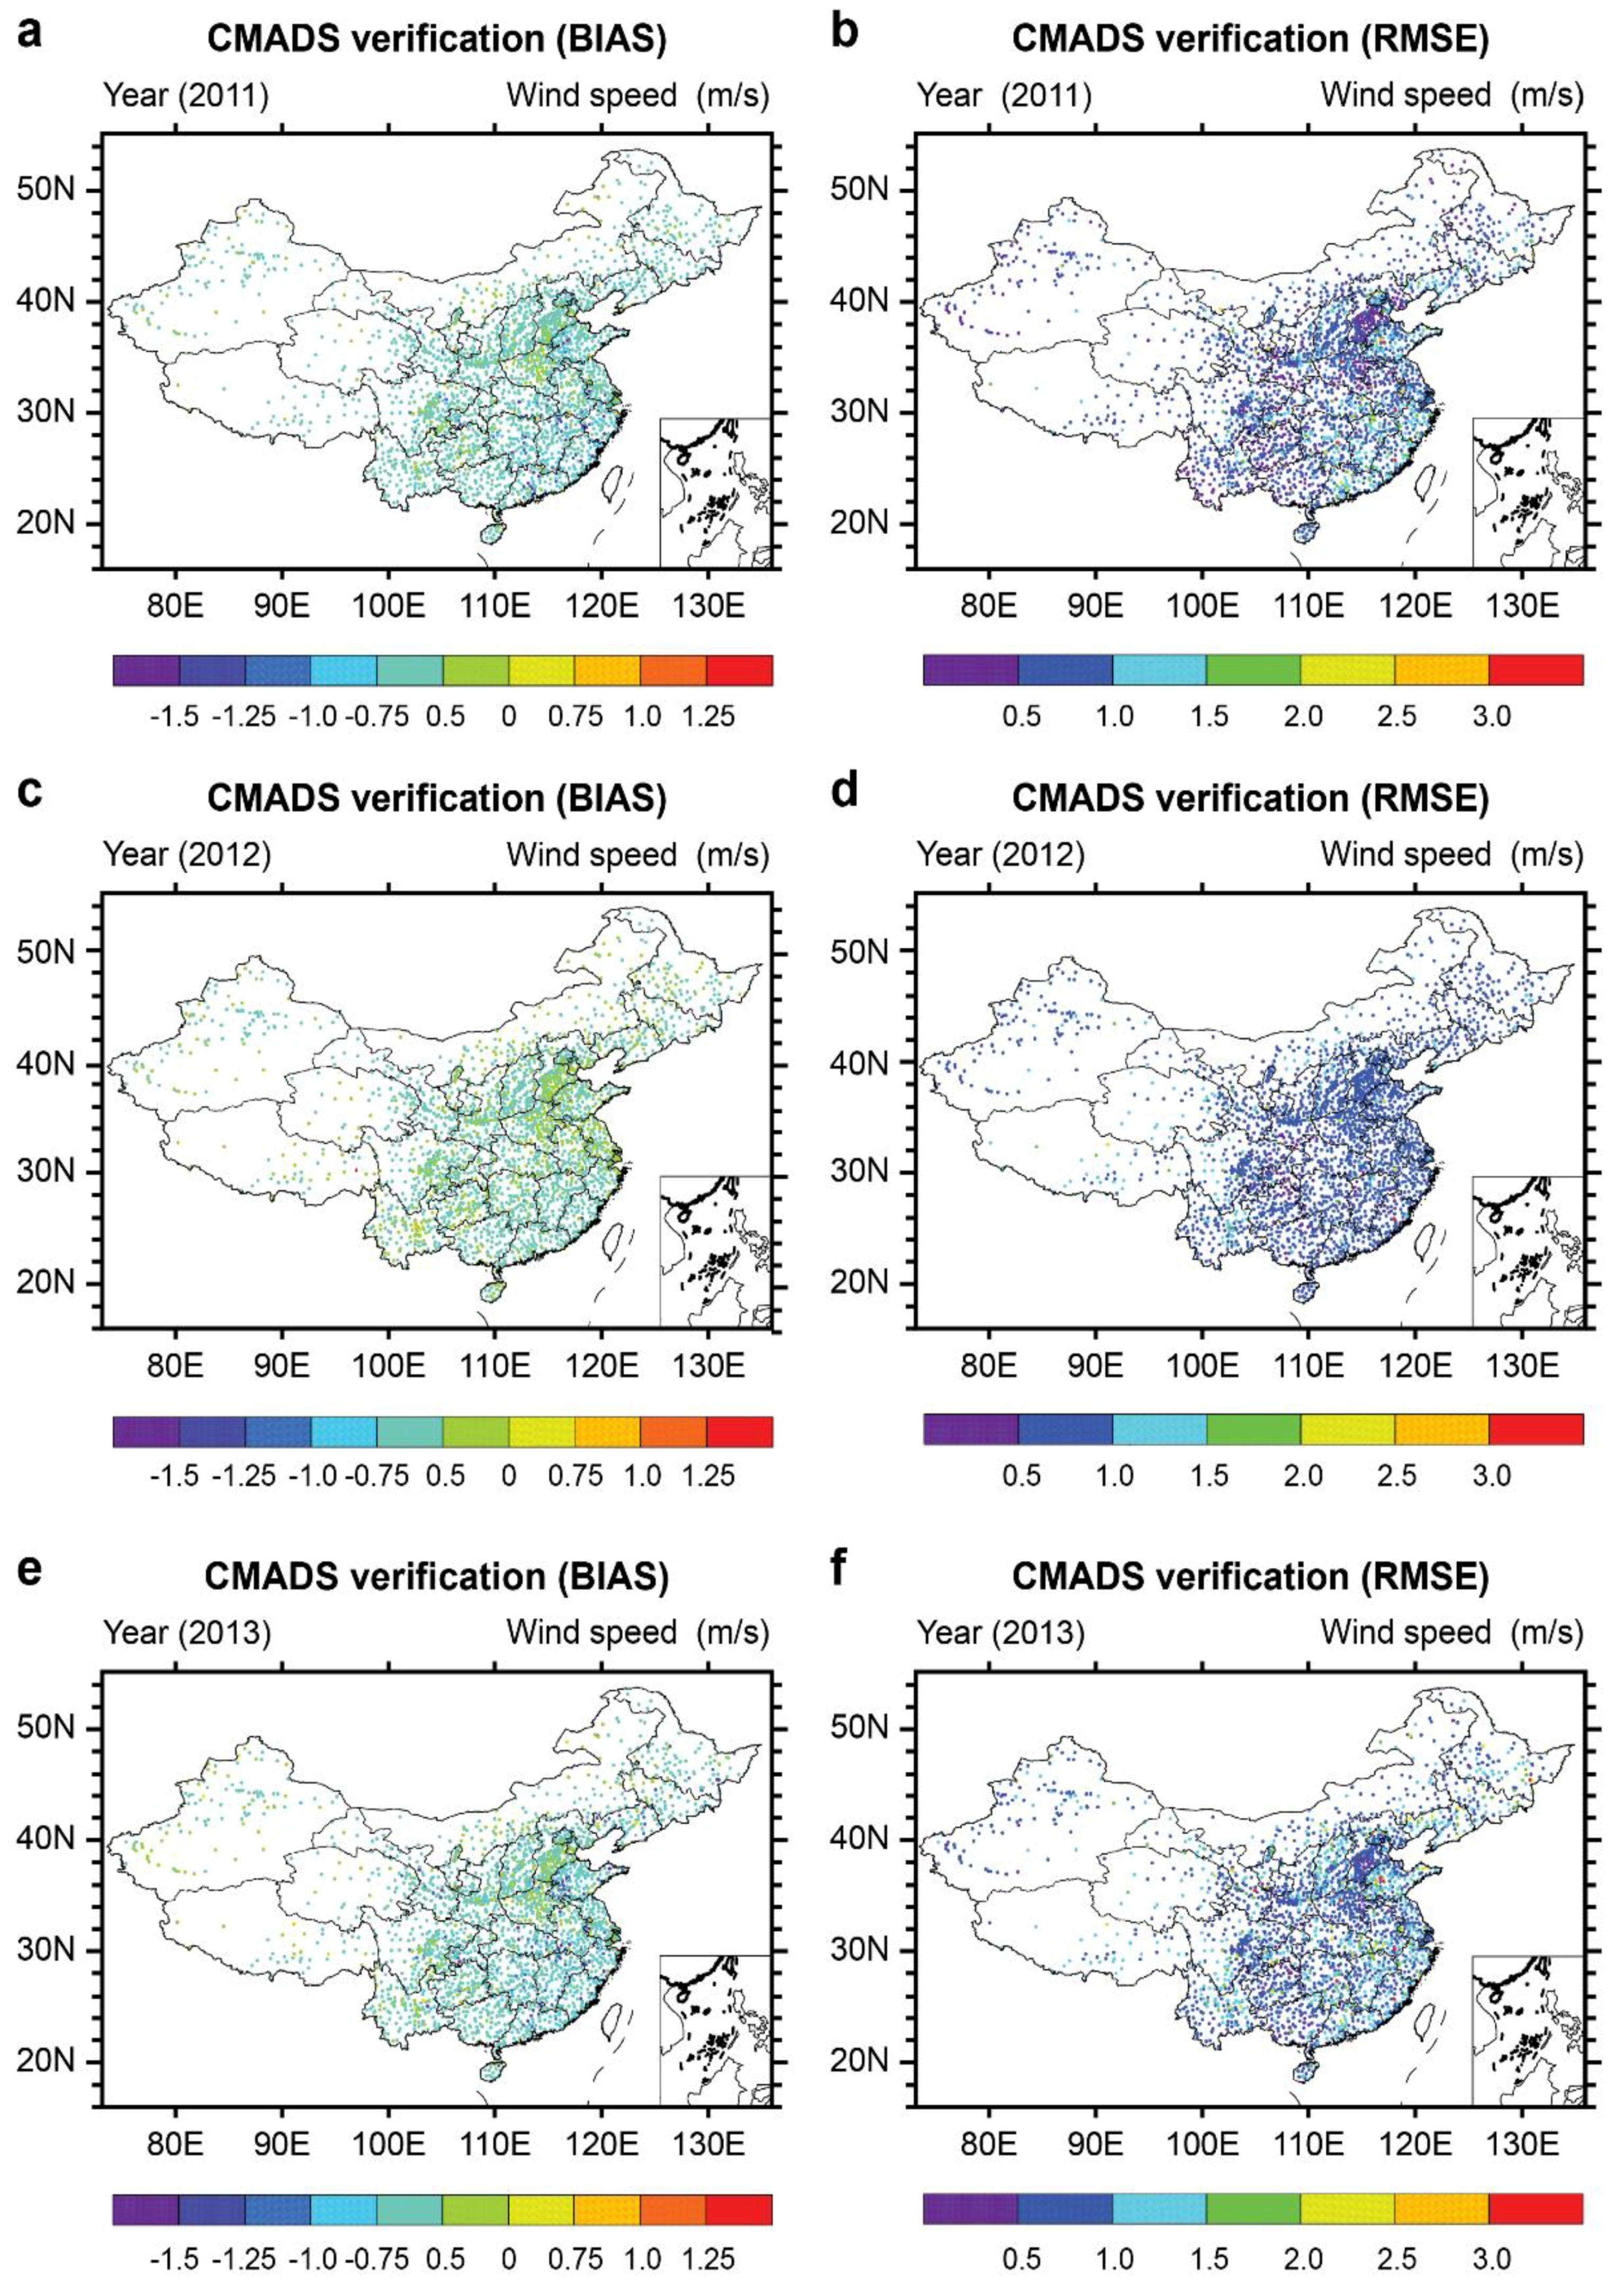
3.5. Distribution and Verification of Indicators for Wind Speed
The spatial distribution of indicators for wind speed in 2011–2013 and the related verifications are shown in Figure 7. The distribution of biases and RMSEs for the wind speed element of the CMADS datasets are shown in Figure 7a–f, respectively.
Analyses of the biases for the entire country led to the conclusion that its performance was good, with the general range being between −1.0 m/s and 0.75 m/s. For some stations, the verification results showed greater negative biases for 2011 and 2013. Examples included parts of North China (Shandong Province); East China (Jiangxi Province, Zhejiang Province, and Fujian Province); parts of South China (such as Guangdong Province); and parts of Central China (Hunan Province and Hubei Province). A small number of stations in these regions had biases ranging between −1.5 m/s and −1.0 m/s. The bias effect was generally better for 2012 when it was controlled between −0.75 m/s and 0.75 m/s for the whole country. Over the three years, positive biases for some stations were maintained at 0–0.75 m/s for parts of North China (such as Hebei Province and Henan Province); parts of East China (Jiangsu Province); and parts of Southwest China (such as the southern parts of Yunnan, Sichuan, and Guizhou Provinces). The wind speed element mostly contained weak positive biases. In contrast, most of the stations in the other provinces presented the general phenomenon of negative biases. These were between −1.5 m/s and −1.0 m/s for some stations.
Upon analysis, the distribution of RMSEs (Figure 7b,d,f) was found to be similar to the situation for biases. In 2012, the error indicators for most stations in China were within 0.5 m/s. For scattered stations in Inner Mongolia; the southeastern part of Qinghai Province; and parts of Southwest China (such as the southeastern part of the Tibet Autonomous Region, Sichuan Province, and the southeastern part of Yunnan Province), the RMSEs were controlled between 1.0 m/s and 1.5 m/s. Verification of the situations in 2011 and 2013 showed that the RMSEs of the wind speed element were similar. With the exception of parts of North China (such as Shandong Province and the northern part of Shanxi Province); parts of East China (such as Zhejiang Province, Fujian Province, and Guangdong Province); and Central China (the southern part of Hunan Province, and Hubei Province), where its performance was poor, the RMSEs for a minority of stations were at 1.0–1.5 m/s.
Besides the aforementioned regions, the RMSEs of the wind speed element for most of the stations were within 1.0 m/s. The overall verification results proved that the CMADS wind speed element was able to accurately reflect the distribution of wind velocities at the national level over multiple years.
4. Discussion
The uncertainty of hydrological models is greatly influenced by meteorological data. Establishing CMADS is quite useful because the CMADS has defines a unified site location (longitude and latitude), assimilated more data sources, and has been corrected by more observation stations. Importantly, the data is freely available to the public. Further, this set of data can serve climate change analysis, water resources, and water pollution assessment. What needs to be emphasized is: the accuracy of the CMADS data set is achieved by the advanced STMAS method and assimilating/correcting the ECMWF background field using a large number of observations. In areas without observatories, CMADS can still be supported by the corrected background fields to ensure data availability and superiority. However, although we have carried out corrective experiments on the entire East Asia region using observed data in China, more assimilation needs to be followed up to ensure that the CMADS background fields in these regions are close to the real world. Besides, we admitted that the factors controlling CMADS accuracy have not yet been systematically analyzed at the present stage, which will be carried out in our future studies.
The assessment of using CMADS for driving SWAT outside China is acceptable. For example, researchers from Korea used CMADS to drive SWAT in the Han River Basin in the Korean Peninsula with a satisfactory performance [30], and the results were acceptable. In China, scientists used CMADS to drive the hydro-meteorological model for the Qinghai-Tibet Plateau [31], the Yangtze River Basin [32], the Yellow River Basin [33,34,35], the Pearl River Basin [36], and the inland arid areas in Northwest China [37,38]. The above studies show that CMADS has been widely verified in many regions of East Asia. Furthermore, Researchers from China also used CMADS data and the Penman–Monteith method to calculate potential evapotranspiration (PET) across China with a good performance [39]. All the above studies show that the application of CMADS dataset in East Asia is satisfactory. Although we have gained many advantages in historical simulations, we believe the period the current CMADS covered is still relatively short. Therefore, we plan to improve the data in duration (backward to 1980s) and the time step (hourly). We also plan to produce CMADS forecast data using WRF (CMADS-WRF), and thus the future CMADS would support flood prediction and analysis.
5. Usage Notes
These datasets are more than mere supporting data for the development of SWAT models. These can also be extracted in text format from the for-other-model directory, and then used to drive other models. We recommend using the Notepad++ software which developed by Dr. Don Ho (download from https://notepad-plus-plus.org) to access the data from this directory. If you are accustomed to using a text reader (on the Windows platform), you only need to use the Unix2Dos (developed by Benjamin Lin, download from http://dos2unix.sourceforge.net/) command for execution in this directory layer.
6. Conclusions
This study evaluated the accuracy of the CMADS data for application in China against data recorded by the national automatic stations. The datasets were found to match the actual observation data recorded by the national observation stations very well. This confirmed the applicability of the datasets for the country. It was noted that the distribution of the observation data was scattered, with extremely uneven distributions between the eastern and western regions of China. Thus, the CMADS datasets can more than adequately make up for the lack of traditional meteorological stations in China, especially in West China.
Author Contributions
X.M. and X.J. organized and wrote the manuscript. X.M. collected and analyzed the data. X.M., Y.W., C.S. and H.W. contributed to discussing the results. All authors reviewed the manuscript.
Funding
This research was funded by the National key Technology R & D Program of China (2017YFC0404305) and the National Science Foundation of China (41701076).
Acknowledgments
The authors would like to appreciate the anonymous reviewers for their helpful comments on an earlier draft of this manuscript.
Conflicts of Interest
The authors declare no conflicts of interest.
References
- Lavers, D.A.; Villarini, G.; Allan, R.P.; Wood, E.F.; Wade, A.J. The detection of atmospheric rivers in atmospheric reanalyses and their links to British winter floods and the large-scale climatic circulation. J. Geophys. Res. 2012, 117, D20106. [Google Scholar] [CrossRef]
- Quadro, M.F.L.; Berbery, E.H.; Dias, M.A.F.S.; Herdies, D.L.; Goncalves, L.G.G. The atmospheric water cycle over South America as seen in the new generation of global reanalyses. AIP Conf. Proc. 2013, 732, 732–735. [Google Scholar]
- Wei, W.; Jilong, C.; Ronghui, H. Water budgets of tropical cyclones: Three case studies. Adv. Atmos. Sci. 2013, 30, 468–484. [Google Scholar]
- Nicholls, N. Increased Australian wheat yield due to recent climate trends. Nature 1997, 387, 484–485. [Google Scholar] [CrossRef]
- Changnon, S.A.; Kunkel, K.E. Rapidly expanding uses of climate data and information in agriculture and water resources: Causes and characteristics of new applications. Bull. Am. Meteorol. Soc. 1999, 80, 821–830. [Google Scholar] [CrossRef]
- Ozturk, T.; Altinsoy, H.; Türkeș, M.; Kurnaz, M. Simulation and spatiotemporal pattern of air temperature and precipitation in Eastern Central Asia using RegCM. Sci. Rep. 2018, 8, 3639. [Google Scholar] [Green Version]
- Hulme, M.; Mitchell, J.; Ingram, W.; Lowe, J.; Johns, T.; New, M.; Viner, D. Climate change scenarios for global impacts studies. Glob. Environ. Chang. 1999, 9, S3–S19. [Google Scholar] [CrossRef]
- Meng, X.; Wang, H.; Wu, Y.; Long, A.; Wang, J.; Shi, C.; Ji, X. Investigating spatiotemporal changes of the land-surface processes in Xinjiang using high-resolution CLM3.5 and CLDAS: Soil temperature. Sci. Rep. 2017, 7, 13286. [Google Scholar] [CrossRef] [PubMed] [Green Version]
- Wang, Y.J.; Meng, X.Y. Snowmelt runoff analysis under generated climate change scenarios for the Juntanghu River basin in Xinjiang, China. Tecnología y Ciencias del Agua 2016, 7, 41–54. [Google Scholar]
- Meng, X.; Sun, Z.; Zhao, H.; Ji, X.; Wang, H.; Xue, L.; Wu, H.; Zhu, Y. Spring Flood Forecasting Based on the WRF-TSRM mode. Tehnički Vjesnik 2018, 25, 27–37. [Google Scholar]
- Saha, S.; Moorthi, S.; Pan, H.-L.; Wu, X.; Wang, J.; Nadiga, S.; Tripp, P.; Kistler, R.; Woollen, J.; Behringer, D.; et al. The NCEP climate forecast system reanalysis. Bull. Am. Meteorol. Soc. 2010, 91, 1015–1057. [Google Scholar] [CrossRef]
- Trenberth, K.E.; Anthes, R.A.; Belward, A.; Brown, O.B.; Habermann, T.; Karl, T.B.; Running, S.; Ryan, B.; Tanner, M.; Wielicki, B. Climate Science for Serving Society: Research, Modeling and Prediction Priorities; Hurrell, J.W., Asrar, G., Eds.; Springer: New York, YN, USA, 2013; Chapter 2. [Google Scholar]
- Kanamitsu, M.; Ebisuzaki, W.; Woollen, J.; Yang, S.K.; Hnilo, J.J.; Fiorino, M.; Potter, G.L. NCEP-DEO AMIP-II reanalysis (R-2). Bull. Am. Meteorol. Soc. 2002, 83, 1631–1643. [Google Scholar] [CrossRef]
- Dee, D.P.; Uppala, S.M.; Simmons, A.J.; Berrisford, P.; Poli, P.; Kobayashi, S.; Andrae, U.; Balmaseda, M.A.; Balsamo, G.; Bauer, P.; et al. The ERA-Interim reanalysis: Configuration and performance of the data assimilation system. Q. J. R. Meteorol. Soc. 2011, 137, 553–597. [Google Scholar] [CrossRef]
- Gibson, J.K.; Kållberg, P.; Uppala, S.; Hernandez, A.; Nomura, A.; Serrano, E. ERA Description; Re-Analysis Project Report Series No. 1; European Centre for Medium-Range Weather Forecasts (ECMWF): Reading, UK, 1997; Available online: www.ecmwf.int/sites/default/files/elibrary/1997/9584-era-description.pdf (accessed on 1 May 1999).
- Uppala, S.M.; KÅllberg, P.W.; Simmons, A.J.; Andrae, U.; Bechtold, V.D.C.; Fiorino, M.; Gibson, J.K.; Haseler, J.; Hernandez, A.; Kelly, G.A.; et al. The ERA-40 re-analysis. Q. J. R. Meteorol. Soc. 2005, 131, 2961–3012. [Google Scholar] [CrossRef] [Green Version]
- Daly, C.; Neilson, R.P.; Phillips, D.L. A statistical-topographic model for mapping climatological precipitation over mountainous terrain. J. Appl. Meteorol. 1994, 33, 140–158. [Google Scholar] [CrossRef]
- Frei, C.; Schar, C. A precipitation climatology of the Alps from high-resolution rain-gauge observations. Int. J. Climatol. 1998, 18, 873–900. [Google Scholar] [CrossRef] [Green Version]
- Neitsch, S.L.; Arnold, J.G.; Kiniry, J.R.; Williams, J.R. Soil and Water Assessment Tool: Theoretical Documentation—Version 2009; Texas Water Resources Institute Technical Report No. 406; Agricultural Research Service (USDA) & Texas Agricultural Experiment Station, Texas A&M University: Temple, TX, USA, 2011. [Google Scholar]
- Meng, X.; Wang, H. Significance of the China Meteorological Assimilation Driving Datasets for the SWAT Model (CMADS) of East Asia. Water 2017, 9, 765. [Google Scholar] [CrossRef]
- Xie, Y.; Koch, S.; McGinley, J.; Albers, S.; Bieringer, P.E.; Wolfson, M.; Chan, M. A Space–Time Multiscale Analysis System: A Sequential Variational Analysis Approach. Mon. Weather Rev. 2011, 139, 1224–1240. [Google Scholar] [CrossRef]
- Albers, S.C.; Xie, Y.; Raben, V.; Toth, Z.; Holub, K. The Local Analysis and Prediction System (LAPS) Cloud Analysis: Validation with All-sky Imagery and Development of a Variational Cloud Assimilation. In AGU Fall Meeting Abstracts; American Geophysical Union: Washington, DC, USA, 2013. [Google Scholar]
- Xie, P.; Joyce, R.; Wu, S.; Yoo, S.H.; Yarosh, Y.; Sun, F.; Lin, R. Reprocessed, Bias-Corrected CMORPH Global High-Resolution Precipitation Estimates from 1998. J. Hydrometeorol. 2017, 18, 1617–1641. [Google Scholar] [CrossRef]
- Yang, F.; Lu, H.; Yang, K.; He, J.; Wang, W.; Wright, J.S.; Li, C.; Han, M.; Li, Y. Evaluation of multiple forcing data sets for precipitation and shortwave radiation over major land areas of china. Hydrol. Earth Syst. Sci. 2017, 21, 1–32. [Google Scholar] [CrossRef]
- Shen, Y.; Pan, Y.; Yu, J.J. Application of Probability Density Function-Optimal Interpolation in Hourly Gauge-Satellite Merged Precipitation Analysis over China. Available online: http://www.isac.cnr.it/~ipwg/meetings/saojose-2012/pres/Shen.pdf (accessed on 16 October 2012).
- Stamnes, K.; Tsay, S.-C.; Wiscombe, W.; Jayaweera, K. Numerically stable algorithm for discrete-ordinate-method radiative transfer in multiple scattering and emitting layered media. Appl. Opt. 1988, 27, 2502–2509. [Google Scholar] [CrossRef] [PubMed]
- Liu, J.J.; Shi, C.X. Retrievals and Evaluation of Downward Surface Solar Radiation Derived from FY-2E. Remote Sens. Inf. 2018, 33, 104–110. [Google Scholar]
- Bliss, N.B.; Olsen, L.M. Development of a 30-arc-second digital elevation model of South America. In Proceedings of the Pecora Thirteen, Human Interactions with the Environment—Perspectives from Space, Sioux Falls, SD, USA, 20–22 August 1996. [Google Scholar]
- Danielson, J.J. Delineation of drainage basins from 1 km African digital elevation data. In Proceedings of the Pecora Thirteen, Human Interactions with the Environment—Perspectives from Space, Sioux Falls, SD, USA, 20–22 August 1996. [Google Scholar]
- Vu, T.T.; Li, L.; Jun, K.S. Evaluation of Multi-Satellite Precipitation Products for Streamflow Simulations: A Case Study for the Han River Basin in the Korean Peninsula, East Asia. Water 2018, 10, 642. [Google Scholar] [CrossRef]
- Liu, J.; Shanguan, D.; Liu, S.; Ding, Y. Evaluation and Hydrological Simulation of CMADS and CFSR Reanalysis Datasets in the Qinghai-Tibet Plateau. Water 2018, 10, 513. [Google Scholar] [CrossRef]
- Gao, X.; Zhu, Q.; Yang, Z.; Wang, H. Evaluation and Hydrological Application of CMADS against TRMM 3B42V7, PERSIANN-CDR, NCEP-CFSR, and Gauge-Based Datasets in Xiang River Basin of China. Water 2018, 10, 1225. [Google Scholar] [CrossRef]
- Zhao, F.; Wu, Y.; Qiu, L.; Sun, Y.; Sun, L.; Li, Q.; Niu, J.; Wang, G. Parameter Uncertainty Analysis of the SWAT Model in a Mountain-Loess Transitional Watershed on the Chinese Loess Plateau. Water 2018, 10, 690. [Google Scholar] [CrossRef]
- Zhou, S.; Wang, Y.; Chang, J.; Guo, A.; Li, Z. Investigating the Dynamic Influence of Hydrological Model Parameters on Runoff Simulation Using Sequential Uncertainty Fitting-2-Based Multilevel-Factorial-Analysis Method. Water 2018, 10, 1177. [Google Scholar] [CrossRef]
- Shao, G.; Guan, Y.; Zhang, D.; Yu, B.; Zhu, J. The Impacts of Climate Variability and Land Use Change on Streamflow in the Hailiutu River Basin. Water 2018, 10, 814. [Google Scholar] [CrossRef]
- Cao, Y.; Zhang, J.; Yang, M.; Lei, X.; Guo, B.; Yang, L.; Zeng, Z.; Qu, J. Application of SWAT Model with CMADS Data to Estimate Hydrological Elements and Parameter Uncertainty Based on SUFI-2 Algorithm in the Lijiang River Basin, China. Water 2018, 10, 742. [Google Scholar] [CrossRef]
- Meng, X.; Wang, H.; Cai, S.; Zhang, X.; Leng, G.; Lei, X.; Shi, C.; Liu, S.; Shang, Y. The China Meteorological Assimilation Driving Datasets for the SWAT Model (CMADS) Application in China: A Case Study in Heihe River Basin. PearlRiver 2016, 37, 1–19. [Google Scholar]
- Meng, X.Y.; Wang, H. Hydrological Modeling in the Manas River Basin Using Soil and Water Assessment Tool Driven by CMADS. Tehnički Vjesnik 2017, 24, 525–534. [Google Scholar]
- Tian, Y.; Zhang, K.; Xu, Y.-P.; Gao, X.; Wang, J. Evaluation of Potential Evapotranspiration Based on CMADS Reanalysis Dataset over China. Water 2018, 10, 1126. [Google Scholar] [CrossRef]
Figure 1.
The spatial range of the CMADS.

Figure 2.
The several important raw input data for the CMADS datasets (a) Regional encrypted stations, (b) National automatic stations, (c) Radar stations.
Figure 2.
The several important raw input data for the CMADS datasets (a) Regional encrypted stations, (b) National automatic stations, (c) Radar stations.

Figure 3.
The interpolation methods used in CMADS. (a) Bilinear interpolation for CMADS V1.0, (b) Nested assignment for CMADSV1.0 to CMADS1.3.
Figure 3.
The interpolation methods used in CMADS. (a) Bilinear interpolation for CMADS V1.0, (b) Nested assignment for CMADSV1.0 to CMADS1.3.

Figure 4.
The evaluation of indicators for temperature in China (2011–2013). (a) The spatial distributions of the biases for the temperature in year 2011, (b) The spatial distributions of the RMSEs for the temperature in year 2011, (c) The spatial distributions of the biases for the temperature in year 2012, (d) The spatial distributions of the RMSEs for the temperature in year 2012, (e) The spatial distributions of the biases for the temperature in year 2013, (f) The spatial distributions of the RMSEs for the temperature in year 2013.

Figure 5.
The evaluation of indicators for atmospheric pressure in China (2011–2013). (a) The spatial distributions of the biases for the atmospheric pressure in year 2011, (b) The spatial distributions of the RMSEs for the atmospheric pressure in year 2011, (c) The spatial distributions of the biases for the atmospheric pressure in year 2012, (d) The spatial distributions of the RMSEs for the atmospheric pressure in year 2012, (e) The spatial distributions of the biases for the atmospheric pressure in year 2013, (f) The spatial distributions of the RMSEs for the atmospheric pressure in year 2013.

Figure 6.
The evaluation of indicators for relative humidity in China (2011–2013). (a) The spatial distributions of the biases for the relative humidity in year 2011, (b) The spatial distributions of the RMSEs for the relative humidity in year 2011, (c) The spatial distributions of the biases for the relative humidity in year 2012, (d) The spatial distributions of the RMSEs for the relative humidity in year 2012, (e) The spatial distributions of the biases for the relative humidity in year 2013, (f) The spatial distributions of the RMSEs for the relative humidity in year 2013.

Figure 7.
The evaluation of indicators for wind speed in China (2011–2013). (a) The spatial distributions of the biases for the wind speed in year 2011, (b) The spatial distributions of the RMSEs for the wind speed in year 2011, (c) The spatial distributions of the biases for the wind speed in year 2012, (d) The spatial distributions of the RMSEs for the wind speed in year 2012, (e) The spatial distributions of the biases for the wind speed in year 2013, (f) The spatial distributions of the RMSEs for the wind speed in year 2013.


Table 1.
The information on CMADS.
| CMADS Attribute | Records |
|---|---|
| Variables Provided | daily maximum temperature (°C), daily average temperature (°C), daily minimum temperature (°C), daily average relative humidity (%), daily average specific humidity (g/kg), daily average wind speed (m/s), daily 24 h cumulative precipitation (mm), daily mean surface pressure (HPa), daily average solar radiation (MJ/m2), soil temperature (K) and soil moisture (mm3/mm3) |
| Spatial range of CMADS | 0° N–65° N, 60° E–160° E |
| Timescale of CMADS | 1 January 1980–31 December 2017 (Periodic update) |
| Spatiotemporal resolution | 1/3°, 1/4°, 1/8°, 1/16° (Daily) |
© 2018 by the authors. Licensee MDPI, Basel, Switzerland. This article is an open access article distributed under the terms and conditions of the Creative Commons Attribution (CC BY) license (http://creativecommons.org/licenses/by/4.0/).
Share and Cite
MDPI and ACS Style
Meng, X.; Wang, H.; Shi, C.; Wu, Y.; Ji, X. Establishment and Evaluation of the China Meteorological Assimilation Driving Datasets for the SWAT Model (CMADS). Water 2018, 10, 1555. https://doi.org/10.3390/w10111555
AMA Style
Meng X, Wang H, Shi C, Wu Y, Ji X. Establishment and Evaluation of the China Meteorological Assimilation Driving Datasets for the SWAT Model (CMADS). Water. 2018; 10(11):1555. https://doi.org/10.3390/w10111555
Chicago/Turabian StyleMeng, Xianyong, Hao Wang, Chunxiang Shi, Yiping Wu, and Xiaonan Ji. 2018. "Establishment and Evaluation of the China Meteorological Assimilation Driving Datasets for the SWAT Model (CMADS)" Water 10, no. 11: 1555. https://doi.org/10.3390/w10111555
Note that from the first issue of 2016, this journal uses article numbers instead of page numbers. See further details here.