Influences on Water Quality and Abundance of Cladophora, a Shore-Fouling Green Algae, over Urban Shoreline in Lake Ontario

Ontario Ministry of the Environment, Conservation and Parks, 125 Resources Road, Toronto, ON M9P 3V6, Canada
Water 2018, 10(11), 1569; https://doi.org/10.3390/w10111569
Submission received: 15 September 2018
/
Revised: 30 October 2018
/
Accepted: 31 October 2018
/
Published: 2 November 2018
(This article belongs to the Special Issue Eutrophication Management: Monitoring and Control)
Abstract
:Urban centers border western Lake Ontario, the terminus of the Laurentian Great Lakes, impacting water quality on the shores of this oligotrophic lake. The green algae Cladophora proliferates on the shallow lakebed and fouls the shoreline, presenting an eutrophication concern. The conditions over a typical urbanized shoreline were studied to assess linkages between Cladophora and area nutrient sources. The most pervasive of the mixing areas of varying extent identified using field sensor measurements was associated with the discharge of treated sewage from a Water Pollution Control Plant (WPCP). Phosphorus and nitrogen were enriched at times near the WPCP diffuser and also in shallow water along the shoreline. Dissolved nutrients were also measured directly above the lakebed in close proximity to Cladophora. Dissolved phosphorus and inorganic nitrogen were higher in proximity to the WPCP diffuser at times, however, spatial patterns were not as clearly aligned with external inputs as the patterns of enrichment in the water column. Biomass distribution of Cladophora was unrelated to nutrient levels in the water column or at the lakebed. Yet, concentrations of phosphorus in Cladophora, an indicator of nutrient sufficiency, were higher near the WPCP diffuser. This disparity, while possibly an artifact of variable loss rates of biomass among locations, may in part stem from variable water clarity among areas. Abundant dreissenid mussels also potentially obscure the effects of nutrient loading on algal biomass if the sequestering of phosphorus from offshore plankton, suggested by periods of onshore circulation, approaches the extent of external loading. Further study of phosphorus flux at the lakebed is required to establish clear linkages between external nutrient loading and algal growth in order to manage the proliferation of Cladophora over urban coastline.
1. Introduction
The coastline of Lake Ontario, the furthest downstream of the Laurentian Great Lakes, is valued for its water resources and ecological services, but has a history of human disturbance. Large populations live in cities on the shores of the lake. They use water within one to two kilometers of the shoreline as a source of drinking water and as a receiver of wastewater. On the Canadian shoreline between the cities of St. Catharines and Oshawa, encompassing 160 kilometers of coastline, there are 12 wastewater plants. The plants service a collective population in excess of 5 million people. The proximity of so many people to a naturally oligotrophic water body [1] poses a threat to water quality along the coastal margin where most land-based runoff and discharges first mix with the lake.
Surface runoff that is discharged from tributaries and storm water create mixing zones at the land–water interface frequently enriched in nutrients, major ions, suspended solids and fecal pollution indicators [2,3,4,5]. A characteristic feature of this coastline is watershed tributary inputs where an appreciable portion of the drainage area is urbanized. Treated wastewater, discharged at depths typically <10 m, create localized plumes with elevated nutrient levels. The phosphorus discharged from water pollution control plant (WPCP) outfalls has a high proportion of the phosphorus in a dissolved form, much of it as soluble reactive phosphorus (SRP), as contrasted with phosphorus attached to particles which typically dominates non-point sources such as tributaries and storm water [6,7]. The implication is that phosphorus loaded from a WPCP outfall has a more immediate and higher unit mass potential to stimulate primary productivity compared with tributary runoff. Considering the two most obvious sources of phosphorus loading at the shore of the lake, WPCPs and tributaries, a Lake Ontario phosphorus loading analysis in 2008 [8] indicated that the 54 tributaries between St. Catharines and Oshawa loaded 494 mt of phosphorus compared with 607 mt from WPCPs over the same shoreline.
Eutrophication problems in western Lake Ontario are centered on the overabundance of the green algae Cladophora which blankets much of the shallow lakebed and periodically fouls shorelines [9,10,11,12]. There is growing concern that regional nutrient loading is causing or contributing to the overabundance of Cladophora [9,10,11,12,13]. Phytoplankton levels in the nearshore are generally low. In recent years there have not been water-column algae blooms in this region of the lake. Lake-wide spring total phosphorus (TP) concentrations when the lake is mixed have declined over the last 35 years subsequent to phosphorus controls in the 1970s, albeit more slowly in the past 20 years. Recent levels range from 5 to 7 μg/L indicative of oligotrophic conditions [14]. Studies of nutrient patterns in the nearshore of Lake Ontario confirm that nutrient enrichment occurs widely, particularly in shallow water, but that the spatial and temporal extents vary among regions [3,5,15].
A key factor in the resurgence in Cladophora, previously a problem in the 1960–1980s when the lake was more nutrient enriched, is the improved light climate of the lake following the invasion of dreissenid mussels [16] in about 1990 [17]. Kuczynski et al. [18] have convincingly demonstrated that there has indeed been a resurgence in Cladophora which can be directly attributed to the changing light climate. These studies have concluded that the growth potential for Cladophora has increased markedly compared with the period prior to the deepening photic zone.
The only tool available for abatement of Cladophora in Lake Ontario is the control of phosphorus inputs [18]. Based on the most recent published estimate, the single largest phosphorus input to the lake is upstream from Lake Erie, accounting for 27% of the annual loading [19]. A hurdle to advancing phosphorus management to abate Cladophora is clarifying the mechanisms and spatial scales of phosphorus loading into Lake Ontario that drive the growth of Cladophora.
The benthification (see [20]) of the nearshore of Lake Ontario and other parts of the Great Lakes following the invasion of dreissenid mussels [21,22] has also raised questions on nutrient transfers at the lakebed [20,23,24,25]. The critical role of external nutrient loading at the lake-wide scale is less obvious at a regional scale. Here, the physical and biological transfers to the inshore from the offshore occur concurrently with local-area loading. A pivotal question in Lake Ontario at this time is the role of the flux of nutrients into the nearshore from the offshore routed through the lakebed by filter-feeding of dreissenid mussels.
This article examines the distribution of Cladophora over urban shoreline in Lake Ontario to identify associations with nutrient sources. This work stems from a 2008 study [9] conducted on a lake-wide scale which found that the nuisance biomass of Cladophora was limited to urban areas, and correlated to area nutrient enrichment. The finding suggested that nutrient management to abate Cladophora may best be focused on area nutrient sources. Further studies in 2012 and 2013 examined the generality of the 2008 findings across a regional nutrient gradient and further examined how nutrient enrichment in an urban setting promotes the proliferation of Cladophora. However, unlike in 2008, the distribution of Cladophora was broadly similar among regions that varied in degree of urban development. The four study areas, three of which were adjacent to urbanized shoreline and a fourth with little development, had similar, high biomass levels [10]. Three possibilities were considered to explain this unexpected finding: (i) that internal nutrient loading linked to refocusing of phosphorus from other parts of the lake by filter feeding of dreissenid mussels accounted for a portion of the nutrient supply for Cladophora; (ii) differences in light regime among areas and, degree of light limitation affected biomass production, and, (iii) the Cladophora sampling methods could not adequately differentiate the abundance of Cladophora among areas [10].
Embedded within this regional study was a more detailed examination of environmental conditions over one of the urban study areas. This examination, reported here, considered how typical local-scale ranges of nutrient and physical conditions may affect the growth of Cladophora, to contrast and compare with the coarse grain analysis at the regional scale. The possible reasons for the unexpected findings at the regional scale noted above are also examined further.
This article examines the nutrient regime, and water quality, over the shoreline which features discharge from a WPCP, runoff from urban tributaries and stormwater outfalls. Measurements of dissolved nutrients directly above the lakebed are used to represent the nutrient regime in proximity of Cladophora. The heavy colonization of the lakebed by dreissenid mussels is considered as a possible correlate with water quality and Cladophora distribution. Finally, the distribution of Cladophora in relation to potential sources of nutrients is examined.
2. Materials and Methods
2.1. Study Area
The study area, located on the north shore of Lake Ontario adjacent to the municipalities of Pickering and Ajax, Ontario, consisted of a 10 km wide polygon extending about 5 km offshore starting at the 3-m depth contour (Figure 1). The lakebed to 20-m depth is primarily erosional with limited depositional sediments near the mouth of Duffins Creek and Frenchman’s Bay. The substrate consists of glacial till made up of a mix of sand, gravel, rocks of varying size from stones to boulders [26]. The drainage area to the study polygon is approximately 353 km2 with an estimated population of 187,000 based on GIS interpolation using 2011 Census Canada data. Land cover varies with proximity to the lake [27]; within 1 km, it is 56% built-up compared with 22% in the overall drainage area [10]. Forest and wetland types make up 40% of the overall cover, falling to 28% within 1 km of the shoreline. Tilled land makes up 7% of the area. Direct drainage to the lake includes tributaries, the largest of which is the Duffins Creek and Carruthers Creek, with watersheds of 283 and 36 km2, respectively, and stormwater outfalls [28].
The Duffin Creek WPCP, servicing a population of approximately 900,000 located in the regions of Durham and York, a portion of which is outside the drainage area of the study polygon, discharges to the study area (Figure 1). In 2012 and 2013, the years of the study, the Duffin Creek WPCP, subsequently referred to as the WPCP, discharged an average of 117 and 120 kg/day of phosphorus [29]. The annual average concentration of phosphorus in effluent was 0.36 and 0.35 mg/L in 2012 and 2013, respectively. Effluent is discharged through a diffuser at a lake depth of 9 to 10 m approximately 1 km from the shore [30]. The Pickering Nuclear Generating plant discharges once-through cooling water to the shoreline at the east and west ends of the plant located on the western shores of the study area.
2.2. Water Quality—Water Column
Water quality was assessed four times between May 2012 and April 2013 using field sensor measurements on board the Ontario Ministry of Environment, Conservation and Parks (MECP) vessel the Great Lakes Guardian and conventional lab-based water chemistry data. Sensors connected to the manifold of a shipboard flow-through system, fed by a 1.5-m depth intake, collected georeferenced measurements, at intervals of approximately 5 m over a predefined survey track, navigated moving in the opposing direction of the alongshore lake current at the start of the day. A RBR XR-620 probe measured temperature and conductivity, a Chelsea Technology Group (CTG) UV Aquatracka probe measured UV-stimulated fluorescence of organic matter (in a range optimized for CDOM). The CDOM probe had peak excitation and emission wavelengths at 239 nm and 430 nm, respectively. CDOM-fluorescence response is relative to the μg/L concentration of perylene used to calibrate the sensor response [31]. Nitrate concentrations were measured with a factory-calibrated Satlantic MBARI-ISUS optical nitrate sensor. The nitrate sensor data were empirically re-calculated to equivalency with lab-based nitrate by linear regression using paired field and lab data (see Supplemental Material Table S1). A Sea Point turbidity sensor attached to a pole mounted on the side of the vessel was used to measure turbidity at 1.5-m depth. Additional sensors mounted on a frame collected water column profiles over the survey track. Conductivity, temperature, pressure, and turbidity were measured using a CTG Aquapac profiler. A CTG Minitracka chlorophyll a fluorescence sensor, a CTG Alphatracka transmissometer (660 nm wavelength), and a CTG UVtracka fluorescence sensor optimized for hydrocarbons were integrated with the profiler. The UVtracka probe had peak and emission wavelengths at 239 nm and 360 nm, respectively. The fluorescence response, referred to as UVFR (see [3]) subsequently, is relative to μg/L of carbazole (which is used to calibrate the sensor response; [31]).
Water samples for lab analysis were taken from a port on the manifold feeding the surface sensors, with the exception of samples for E. coli and fecal Streptococcus (FS) analysis, which were collected from a depth of 1.0–1.5 m by submerging sterile sample containers directly into the lake using a pole. At selected sites, additional water samples were collected 1 to 2 m from the lakebed using a Van Dorn beta sampler. Water samples were kept on ice after collection and transported to the Toronto MECP laboratory within 24 h. Whole water samples were analyzed for suspended solids, turbidity, alkalinity, pH, specific conductivity, chloride, calcium, TP, kjeldahl nitrogen, silicate, dissolved organic carbon (DOC), ammonium + ammonia, nitrite, and nitrate + nitrite, E. coli and FS. Water samples for analysis of dissolved phosphorus (DP) were filtered when collected using a syringe fitted with a 0.45 μm pore Millex durapore membrane filter unit (SLHV033RS). Water samples for chlorophyll analysis were filtered in the field. Approximately 1 to 2 L of water was filtered through 1.2 μm nylon filters with filters stored frozen until analysis. All laboratory-based water analyses were using standard MECP methods for surface waters [32] with the exception of TP and DP which were analyzed at the MECP Dorset laboratory using a low-level method [33].
Total inorganic nitrogen (TIN) was calculated as the sum of ammonium + ammonia and nitrate + nitrite and expressed as mass of N. Reactive silicate is expressed as mass of Si. The minimum reportable value of the suspended solids method of 0.5 mg/L was used in calculations when results were below reportable levels. Plate counts used to determine levels of E. coli and FS had a detection threshold of 2 CFU/100 mL which were used in subsequent calculations. Linear regressions of field-measured specific conductivity with paired lab-measured values were used to assess and, where necessary adjust field conductivity measurements.
2.3. Nearbed Dissolved Nutrients
Water samples for nutrient analysis were collected approximately 10 cm above the lakebed using either a surface-deployed syringe-based sampling device or by divers using a hand-operated suction tube. The remote nearbed sampler consisted of four 50 mL syringes mounted on a metal frame with the nozzles of the syringes located 10 cm from the bottom of the frame and 21 cm from the legs of the frame (See Appendix A). The syringe plungers, deployed in a closed position, were attached to a piston mounted on a bracket holding the syringes. The device was slowly lowered from the lake surface. A metal arm extending from the side of the frame trigged the piston on contact with the lakebed filling the syringes with water. Aspects of the sampler operation were drawn from the syringe-based water sampler of Martin et al. [34], however, the design does not follow that of any previous device. Multiple drops of the surface deployed sampler were sometimes needed to collect sufficient water for analysis. Syringes with visible debris and algae were rejected.
Divers used a suction tube (5.7 cm diameter and 40 cm length) fitted with a 12-mm diameter intake channel to collect nearbed water samples on two of seven sampling events. A 10 cm guide attached to the intake tube was used to position the intake 10 cm from the lakebed before slowly filling the suction device.
Nearbed water samples were analyzed for DP, nitrate + nitrite, nitrite and ammonia + ammonium and were filtered and analyzed as given above. Samples for soluble reactive phosphorus (SRP) were filtered as described above, and analyzed at Environment and Climate Change Canada’s National Laboratory for Environmental Testing (NLET) located in Burlington, Ontario. The minimum reportable value of the SRP method of 0.2 μg/L P was used in calculations, tables and figures when laboratory results were at or below the minimum reportable concentration and reported as 0.2 μg/L. The profiling sensors described above were used to collect water column profiles at all sites during nearbed sampling events with the exception of the diver collected samples.
2.4. Benthic Biological Measurements
Random sampling of Cladophora and dreissenid mussels by divers was conducted on July and August 2012 at sites from 3- to 20-m depth. Sites were selected as locations with hard substrate suitable for Cladophora attachment. Dreissenid mussels and Cladophora were collected from three randomly placed 0.15-m2 quadrats. Material was collected by hand or scraped from surfaces and placed into fine mesh bags for retrieval. Samples were frozen on dry ice after collection and stored frozen until freeze-drying for enumeration of mussel numbers and determination of mussel and Cladophora dry weight or chemical analysis. The diver-based sampling was conducted by Pollutec Limited of Windsor, Ontario under contract to MECP.
Dreissenid mussels were sorted by species and then counted and weighed to estimate abundance and whole mussel dry biomass. The weight of Cladophora was determined after removing non-algal debris from the freeze-dried samples. The Cladophora samples were weighed and sub-samples ground to a powder for determination of phosphorus by colourimetry after the samples were digested in hot sulfuric acid and potassium persulphate [35] at the MECP Toronto laboratories. Phosphorus data are reported as percent of Cladophora dry weight (Qp) which was determined as (g phosphorus)/(g dry weight Cladophora) × 100.
2.5. Lake Circulation and Physical Measurements
Recording instruments were deployed over the study area to measure physical conditions (Figure 1). Acoustic Doppler Current Profilers (ADCP; RDI 600 KHz Workhorse) and an acoustic point current meter (Nortec Aquadopp 2 MHz; at site Buoy1) measured current speed and direction; ADCP data were binned at intervals of 0.5 to 1 m and recorded as pulses at 30-minute intervals. Temperature recorders (Onset Stowaway Tidbits) were also placed at intervals through the water column on the ADCP moorings and at additional sites. Antifouling conductivity sensors (ALEC Electronics Compact-CLW) were deployed at variable depths within the water column at selected sites (Figure 1). Instruments were deployed in May and retrieved in November 2012.
2.6. Data Analysis
The sensor data collected during water column sampling was used to interpolate surface maps by kriging using Environmental Visualization System version 9.2 (EVS). The boundaries of the interpolated raster surfaces were constrained to areas bounded by data points.
Principal components analysis (PCA) using the factor procedure in SAS 9.1 was used to explore covariation among water quality variables. A correlation matrix of log10 transformed data was used in the analysis. Linear regression was conducted using the REG procedure in SAS 9.1.
Patterns in water transparency over the study area were evaluated using beam transmission measurements averaged over the upper 10 m of the water column collected during the four water quality sampling events and two additional sampling events in May and July 2012 (see Supplemental Information Table S2), respectively, when water column profiles were collected to compute a 3D volume model of the study area. The population of average K660 values for profiles over individual sampling events were converted to z-scores to facilitate the detection of spatial patterns using the time variable data.
3. Results
3.1. Water Column Nutrients and Water Quality
Field mapping of nitrate, CDOM fluorescence and conductivity at the lake surface identified recurrent patterns in DP and TP correlated with shoreline features (Figure 2). A mixing area of elevated nitrate coincident with the WPCP diffuser was evident during all sampling events. Both DP and TP tended to be higher in these mixing areas compared with other areas with the exception of TP in April 2013. The mixing areas were oriented roughly shore-parallel and appeared to extend more shoreward during the May and July 2012 sampling events (Figure 2).
Areas of elevated CDOM fluorescence contrasted with nitrates and were more shoreward with the exception of the July 2012 survey, when levels were highest near the WPCP diffuser (Figure 2). Areas of elevated CDOM fluorescence were detected east of the mouth of Duffins Creek during the July 2012 and April 2013 surveys and west of the river mouth during the May 2012 survey. The levels of TP were higher, as was turbidity, in areas of elevated CDOM fluorescence near the river mouth compared with other areas along the shoreline.
Conductivity maps depict similar spatial patterns to nitrate and CDOM fluorescence but with additional features. Macro-scale areas of elevated conductivity were observed at locations along the shore (Figure 2). Conductivity was also elevated more generally over the shoreline compared with locations further from the shore.
Water quality varied with site depth but at times varied more strongly among sites of similar depth (Table 1). Median values of nitrate + nitrate, TP and DP were lower at depths >12 m compared with shallower depth groupings. Dissolved nutrient concentrations were more variable at lake depths <12 m compared with deeper areas, with the exception of silicate; the widest range in concentrations was at sites 8- to 12- m in depth. Despite the elevated upper range in concentrations of DP and TP in depth ranges <12 m, the median values were <9 μg/L. The maximum concentrations of DP and TP in surface samples were 21 and 38 μg/L, respectively (Table 1). At the lake surface, DP made up 57 to 71 percent of TP among depth ranges and was highest in the 5- to 8-m depth range (Table 1). The maximum concentration of TP in samples collected 1 to 2 m above the lakebed was 56 μg/L, however median values among depth strata ranged from only 4 to 7 μg/L. Median concentrations of nitrate+nitrite were highest in the 8 to 12-m depth range with a maximum value of 1270 μg/L. Across depth strata, median values ranged from 409 to 535 μg/L in surface samples and from 378 to 584 μg/L in lower water column samples. Inorganic nitrogen was composed largely of nitrate+nitrate making up 95 to 96 percent of TIN as proportions of median values.
Median chlorophyll a concentrations ranged from 0.4 to 0.6 μg/L among depth groupings, indicating oligotrophic conditions; the maximum concentration in a sample was 2.8 μg/L (Table 1). The median levels of suspended solids and turbidity, ranging from <0.5 to 0.7 mg/L and 0.2 to 0.7 FTU, respectively, suggested generally low levels of particulate material in the water column with the exception of the shallowest depths where the range of values was higher, indicating moderate levels of suspended solids in some samples. Chloride levels, consistent with the field measurements of conductivity, indicated appreciable variability at all depths with the widest ranges at 3 to 5 m and 8 to 12 m depths. There was no indication of fecal pollution at the time of the surveys; maximum count of either E. coli or fecal streptococci in a sample of 58 CFU/100 mL.
Ordination analysis of the lab-analyzed water quality variables in Table 1 suggested spatial patterns in water quality consistent with those evident in the more spatially extensive field data. Three interpretable axes were identified in a principal component analysis (PCA) accounting for 84% of the total variability within the log10 transformed dataset. The first axis was a general water quality gradient capturing overall land-based influences (i.e., the WPCP diffuser, tributaries and storm sewers). The strongest contributors to the axes were conductivity and chloride followed by DOC, DP, TP and calcium (Table 2). The second axis identified temporal differences with axes scores roughly sorted by survey period. Chlorophyll a and turbidity score positively and nitrate and silicates score negatively suggesting that the axis is driven by seasonal dynamics of phytoplankton. The final interpretable axes appear to sort samples based on the influence of the discharge from the WPCP diffuser on water quality as inferred from the proximity of sites to the diffuser (Figure 3). Ammonia+ammonium and TP have the highest positive correlations and calcium the strongest negative correlation with the axis.
Concentrations of TP and DP at the lake surface were strongly correlated with field sensor measurements, however, the degree of correlation with specific sensors varied among the sampling events (Table 3). In May 2012, CDOM fluorescence, conductivity and nitrate were correlated with TP and DP at about the same degree; correlation coefficients ranged from 0.64 to 0.71 and 0.72 to 0.78 for TP and DP, respectively. In contrast, CDOM fluorescence and nitrate were more strongly correlated with TP and DP than other sensors in July. In October 2012, nitrate was the strongest correlate. Correlates in April 2013 were similar to those of May 2012 with the exceptions that turbidity was also strongly related to TP and DP and nitrate and conductivity were more strongly correlated with DP than with CDOM fluorescence.
There was little difference in median concentrations of nutrient variables between the surface and lower water column samples at sites located at the outer perimeter of the study area (site depth >25 m) used to infer the differences between lake epilimnion and hypolimnion (Table 1). Median values of TP and DP in surface samples were 0.4 μg/L higher and 0.5 μg/L lower, respectively, than in deep samples. The median value of nitrate + nitrite was 12 μg/L higher in surface samples. The median values of most parameters were higher 1 to 2 m above the lakebed at 8- to 12-m depth sites than at deeper depths. The higher median and maximum values of DP, TP and nitrate + nitrate at 1 to 2 m above the nearbed in this depth range likely reflect the influence of discharges from the WPCP diffuser.
Water clarity, while generally high as inferred from levels of turbidity, suspended solids, DOC and chlorophyll a (Table 1) was variable over the study area (Figure 2). The overall spatial pattern in water clarity was inferred from depth-integrated estimates of K660 over the upper 10 m of the water column which confirmed the variable nature of water clarity but suggested a recurrent spatial pattern. There was a predominance of higher relative K660 values (higher Z-scores; less light transmission) over an inshore area (approximately <3 km from shore) stretching from the west side of the Pickering Power Station to the mouth of Duffins Creek (Figure 4). This contrasts with a predominance of low values (lower Z-scores and higher light transmission) over the area east of the mouth of Duffins Creek to the east edge of the study area near the shore but slightly offshore from the shoreline edge.
3.2. Nearshore Lake Circulation and Water Column Stratification
Lake circulation over the study area was dominated by periodically reversing alongshore flows with current reversals on the order of days. Four ADCPs deployed at shallow and deeper sites, at roughly 10 and 20 m, respectively, indicated an overall synchrony in the prevailing alongshore circulation (Figure 5). Currents at the deeper ADCPs, 1.8 and 2.8 km offshore, were generally stronger and periodically approached speeds of 50 cm/s (Figure 5). Cross-shore flows were also stronger at the deeper sites and most notably at an ADCP deployed offshore of the linear shoreline in the eastern portion of the study area. Periods of cross-shore flow near the surface of >20 cm/s were common.
Shore parallel flow to WSW and ENE accounted for the highest proportions of near surface measurements at AJ3 directly offshore of the WPCP diffuser, with west oriented flow more frequent than to the east (Table 4). Near-surface currents to the ENE were the strongest, averaging 13.5 cm/s. Near-bottom currents were typically weaker than near-surface currents and less aligned with an alongshore orientation. Flows to the WSW and SW were marginally more frequent than other directions, but unlike near the lake surface, onshore and offshore currents were more frequent and east-oriented currents infrequent.
Water column stratification was erratic over time, ranging from strongly stratified to periods when the water column was fully mixed (Figure 6). The transitions between stratified to more mixed conditions occurred over intervals ranging from hours to days. Temperature profiles and water column density changes measured at AJ3 indicate varying conditions at the depth of the WPCP diffuser with an absence of persistent seasonal stratification. Stratification features at a nearby deeper nearshore site (TE2) were similar to AJ3, supporting the interpretations that water column mixing conditions are highly heterogeneous over the broader study area (Figure 6).
Upwelling and downwelling events strongly influence physical conditions throughout the study area. Temperature traces at AJ3 indicate at least seven occasions in 2012 when surface temperature declined abruptly due to upwelling and as many downwelling events when water temperatures rose as the water column became fully mixed (Figure 6).
Mixing within the water column in the area of the WPCP diffuser was inferred from near-surface and near-lakebed conductivity at sensors ENE and WSW (Figure 1) of the outfall on the assumption that the conductivity of discharge would be higher than in the lake. Surface conductivity was elevated above the lake background more frequently at the westward sensor (Figure 7). Similarly, conductivity near the lakebed was more frequently higher to the west than east, however, the difference between the east and west sensors was smaller than near the surface. Collectively, the conductivity traces suggest that the mixing area orientates to the WSW more frequently than ENE and is often buoyant as inferred from the higher conductivity near the lake surface compared with the nearbed. Nevertheless, elevated conductivity above the lake background seen near the lakebed suggests that the diffuser mixing area frequently persists at the lakebed.
3.3. Nearbed Dissolved Nutrients
Concentrations of DP, SRP and TIN measured at approximately 10 cm from the lakebed confirm that levels above the lakebed in proximity to benthic algae are affected by area loading, however, strong temporal variability and biological uptake confounds the interpretation of the overall level of enrichment. The distribution of SRP values measured seven times between May 2012 and July 2013 contrasted among sampling events. The highest concentrations of SRP were measured in October 2012, ranging from <0.4 to 5.3 μg/L averaging 3.6 μg/L (Figure 8); at other times, concentrations were mostly <2 μg/L. The lowest levels were found in July 2012 when concentrations ranged from <0.2 to 3.3 μg/L averaging 0.7 μg/L. Concentrations of SRP appeared to be higher on average in areas aligned with the most frequent alongshore surface flow away from the WPCP diffuser (i.e., WSW and ENE) during the August and October 2012 sampling events (Figure 8). In August, concentrations along this axis ranged from <0.2 to 2.5 μg/L compared with <0.2 to 0.9 μg/L elsewhere at similar depths. In October, levels in areas of the prevailing surface flow away from the diffuser ranged from 3.0 to 5.0 μg/L and were 0.4 to 3.9 μg/L elsewhere. During some sampling events, concentrations at the deepest sites tended to be higher than the shallowest sites.
Concentrations of DP were higher WSW of the WPCP diffuser in October 2012, however, there was little obvious pattern at other times (Table 5). During the October 2012 sampling event, average DP was 8.5 μg/L WSW of the WPCP diffuser compared with 3.3 to 5.3 μg/L for site groupings east of the mouth of Duffins Creek. Unlike SRP, DP concentrations exhibited little pattern with depth. Average concentrations of DP at the offshore sites ranged from 2.7 to 5 μg/L.
The fraction of DP composed of SRP was variable among sites based on distance from the WPCP diffuser and the mouth of Duffins Creek but with little recurrent spatial pattern over time (Supplemental Information Table S3). The SRP fraction was low at times (e.g., 5 to 12% for five of 11 site grouping in July 2012; see Supplemental Information Table S3) contrasting with periods with a higher SRP fraction (e.g., 70 to 80% in seven of 12 site grouping in October 2012). Overall, the 20 m sites had the highest fraction of SRP ranging from 28 to 73%, with the SRP fraction >50% on five of seven sampling events.
Nearbed TIN concentrations at sites, when compared with levels at the deepest sites, suggest limited enrichment due to area loading with the exception of sites near the WPCP diffuser (Table 6) which did have higher average TIN concentrations than other site groups, with exceptions. The highest TIN concentration was at stations 1 to 2 km east of Duffins Creek in July 2013. However, average concentrations among site groups, while variable, were not substantially different from concentrations at the 19 to 21 m stations with the exception of the October 2012 sampling event when TIN levels WSW of the WPCP diffuser, ranging from 514 to 556 μg/L, were higher than the offshore sites (435 μg/L).
Concentration of DP was a predictor of SRP above the lakebed to varying degrees. Linear regressions between DP and SRP were significant (p < 0.05) for six of seven sampling events with R2 values ranging from 0.27 to 0.57 (Table 7). This was less the case for TIN where regressions were significant for only three sampling events with R2 values ranging from 0.23 to 0.74. The strong correspondence among SRP, DP and TIN seen during the August 2012 sampling event is suggestive of a more direct influence of external loading on the nearbed concentrations.
Correlations between UVFR, chlorophyll a fluorescence, K660 and temperature, used as tracer of external loading of water at the lakebed, with dissolved nutrient concentrations were generally weak. The strongest correspondence was with TIN during the July 2012 sampling event (see Supplemental Information Table S4) when UVFR, chlorophyll a fluorescence and K660 were positively related to TIN and negatively with temperature at the time. Concentrations of SRP and DP exhibited little association with the tracer measurement or site depth.
During the diver-based sampling events, conductivity and water temperature at the lakebed measured by divers were used as tracers. Conductivity in June 2012 ranged from 292 to 313 μS/cm and was not significantly related to SRP, DP or TIN concentration (p > 0.05; linear regression n = 19). Nearbed temperature, ranging from 11.7 to 20.8 °C was a significant predictor of TIN (p = 0.019; R2 = 0.27; negative slope). In August 2012, conductivity at the lakebed, ranging from 298 to 328 μS/cm, was not significantly correlated with SRP, DP and TIN concentration. Similar to June, nearbed water temperature was negatively related to TIN (p = 0.003; R2 = 0.42) as were SRP (p = 0.0021; R2 = 0.44; negative slope) and DP (p = 0.04; R2 = 0.22; negative slope). Temperature ranged from 9.4 to 22.7 °C.
3.4. Distribution of Cladophora and Tissue Phosphorus
Filament lawns of Cladophora and other benthic algae covered much of the lakebed at the time of diver surveys of the benthos in June and August 2012. Diver-estimated cover by Cladophora ranged from 30 to 85% and 30 to 60% in June and August, respectively, among depth strata varying from 3 to 11 m in depth (Table 8). The average height of the Cladophora filament lawn ranged from 3 to 7 cm among depth strata (Table 8). There were no clear differences in percent cover or lawn height among groups of sites based on proximity to the mouth of Duffins Creek (WSW; <2 km ENE; >2 km ENE).
Biomass of Cladophora declined over the 3- to 20-m depth range and was typically highest at the 3- to 6-m sites (Figure 9). The average biomass ranged from 0.2 to 83 g/m2 at sites <6 m in depth and from 1.6 to 14.5 g/m2 at 6 to 10 m in depth in June, 2012. Sites with high relative biomass in June also had high biomass in August, however, biomass declined less abruptly with depth in August. Average biomass ranged from 12.1 to 48 g/m2 at sites <6 m in depth and from 3.4 to 29 g/m2 at 6 to 10 m in depth in August. Biomass exceeded levels considered indicative of nuisance levels at several sites. In June, biomass was >50 g/m2, the higher of two thresholds suggested as problematic, whereas in August biomass did not exceed this level at any site but was >30 g/m2, a more recent threshold, at six sites. Low but measurable biomass was found at the 20-m sites ranging from 0.2 to 0.6 g/m2.
There was little pattern in the distribution of biomass over the study area. In August, the highest biomass was found on the eastern shoreline and to a lesser extent on the western edge of the study area. Biomass at sites along the axes of alongshore currents oriented WSW and ESE from the WPCP diffuser was not higher than other areas at the time of benthic sampling.
In contrast, concentrations of phosphorus in Cladophora (Qp) appeared higher in the area of the WPCP diffuser and at sites alongshore on the WSW and ENE axis away from the outfall (Figure 9). In June 2012, Qp ranged from 0.091 to 0.13% in this area compared to 0.073 to 0.078% at other sites at similar depths. In August, levels ranged from 0.15 to 0.24% in the area of the WPCP diffuser and along the WSW and ENE axis compared with 0.14 to 0.18% at other sites of similar depth. Qp generally increased with depth and was higher in August than June. Levels at the deepest sites ranged from 0.2 to 0.24% in June and from 0.35 to 0.49% in August contrasting with levels at the shallowest (<4 m) ranging from 0.072 to 0.089% in June and 0.074 to 0.23% in August. Qp was inversely related to Cladophora biomass in August but only weakly so during the June survey, when the distribution of Cladophora biomass with depth was more limited (Supplemental Information Figure S1).
3.5. Distribution of Dreissenid Mussels
Dreissenid mussels, almost exclusively Dreissena rostiformis-bugensis, were widely distributed and abundant over the study area. Surface cover by mussels estimated by divers in June and August of 2012 ranged from 10 to 90% and 20 to 80%, respectively, among depth strata (Table 8). The middle section of study area (<2 km ENE of Duffins Creek; Table 8) appeared to have lower mussel cover than sections to the east or west. Coverage ranged from 10 to 35% in this area compared with 25 to 90% further east and 20 to 50% further west.
The highest biomass, ranging from 1668 to 4195 g/m2, was found at the 19 to 21 m sites (Figure 10). Biomass exceeded 1000 g/m2 at 10 of 19 and 11 of 19 sites during the June and August 2012 surveys, respectively. The distribution of biomass suggested two areas of higher mussel biomass, west of the WPCP diffuser and at the eastern margins of the study area, respectively, and a third area of reduced abundance east of the WPCP stretching to east of the mouth of Duffins Creek.
Dreissena and Cladophora biomass in paired samples was weakly correlated at shallow depths. The Pearson correlation between biomass of Cladophora and Dreissena at depths <8 m was marginally significant in June and stronger in August (p < 0.056 and p < 0.001, respectively) (Figure 11). Biomass of Cladophora was often higher in quadrats with high Dreissena biomass at sites <8 m deep. There was no significant correlation between mussels and algae over the full depth range of sites.
4. Discussion
4.1. Urban Influences on Nearshore Water Quality
Macro-scale gradients, on the order of 10s to 100s of meters, in nutrients and other water quality features were evident from the field sensor measurements. Locations near the WPCP diffuser, a tributary mouth and, in close proximity to the shoreline were most influenced by the adjacent shoreline. Nutrients, suspended solids, major ions and chlorophyll a were elevated and co-varied broadly in areas affected by runoff and discharges, similar to other areas of developed Great Lakes shoreline [3,5].
A mixing area near the WPCP diffuser was usually the largest spatial feature evident from the field sensor measurements. The orientation was approximately parallel to the shore, consistent with the pattern in current directions (Table 4). Leon et al. [36], using a combination of field and modeling studies conducted in 2007 and 2008, similarly reported that the mixing zone associated with the WPCP diffuser was the most apparent and prevalent water quality feature of the area. Field nitrate was the strongest overall tracer as inferred from correlations between field measurements and lab-measured TP and DP concentrations (Table 3). Previous studies have used nitrate to infer the mixing areas associated with discharge from the Duffins Creek WPCP [13,37]. However, the dimensions of the mixing areas at the lake surface could not be delineated using the field sensor data because of the interacting influence of other area loading sources. This is evident from the PCA analysis of lab-based water quality data. The third axis separated locations based on the influence of the discharge from the WPCP, yet nitrate + nitrite did not correlate strongly with the axis as contrasted with ammonia + ammonium, TP and DP. This suggests that enrichment of nitrate + nitrite is less specific to loading from the outfall than ammonia + ammonium. The field conductivity and CDOM fluorescence also depict mixing areas in the vicinity of the WPCP diffuser but the spatial patterns are also influenced by other discharges along the shoreline.
The limit of navigation, and data collection, was the 3-m depth contour which constrained the ability to resolve shoreside (<2 m) conditions where tributary and stormwater discharges are most strongly focused and often dispersed directly adjacent to the shoreline by alongshore flow [2,38]. At times, conductivity and CDOM fluorescence were elevated at points along the shoreward edge of the study area. Field sensor data is difficult to interpret when lakeward signals are not well captured. Nevertheless, it is clear that phosphorus concentrations were elevated along the immediate shoreline due to runoff into the lake.
Water column productivity was low, as inferred from chlorophyll a. The low concentrations of chlorophyll a and the absence of visible blooms suggest limited effects on phytoplankton from area discharges and runoff. This does not mean that phytoplankton growth was not affected, only that lake mixing is sufficient to disperse added phytoplankton production to lake background levels. Water column TP concentrations measured near the lake surface also suggest broadly oligotrophic [14] conditions, however, the higher concentrations in the vicinity of the WPCP diffuser and at shallow depths strongly indicate areas of enrichment (Figure 2).
Temporal changes in water quality due to both area and lake-wide influences were evident throughout the study. Site scores on the third PCA axis noted above varied among sampling events, at times suggesting limited influence of the WPCP discharge, as viewed at the lake surface, and at other times, such as in October 2012, suggesting more widely distributed effects on water quality. Lake-wide seasonal changes due to phytoplankton and lake warming were also evident from the PCA analysis. Chlorophyll a is positively associated and nitrate + nitrite and silica are negatively associated with PCA axis 2, consistent with the summer drawdown of these nutrients by phytoplankton [39,40]. The association with turbidity likely stems from seasonal development of whiting in Lake Ontario which results in increased turbidity as calcium carbonate precipitates [41].
Water quality in 2012 and 2013 is broadly similar to that described using a comparable sampling approach in 2008 [2]. Other earlier studies have also described water quality in the area [13,15,36] which lies within the eastern extent of the footprint of the Greater Toronto Area (GTA) on the north shore of the lake. A west to east gradient of decreasing nutrient richness associated with the urban development of western Lake Ontario and the distribution of large rivers has been evident in studies since the mid-1970s. Lake-wide analysis of nutrient distribution in 1981 and 1982 [42] indicates a declining gradient in TP on the north shore away from the GTA. More recently, in 2008, higher TP concentrations were reported in the GTA than further east on the north shore [3], similar to findings in the regional component of the present study which found a decreasing gradient in TP and DP concentrations on the north shore extending from the City of Toronto to less developed shoreline further east [10]. Phosphorus levels averaged over the Pickering-Ajax study area were intermediate to the end points of the gradient [10].
Limited chemistry sampling was conducted through the water column, making it difficult to discern the variability due to depth-variable mixing of discharges. Of concern is that the discharge at the WPCP diffuser results in mixing zones within the water column that are not adequately represented by the near surface or lakebed sampling reported here. Lake-deployed conductivity sensors indicated that conductivity was frequently elevated near the lake surface as compared with near the lakebed in the area of the diffuser. This suggests that the discharge is often buoyant and nutrient enrichment should often be evident at the lake surface, albeit at levels below maximal levels within the water column adjacent.
The Duffins WPCP is a large continuous source of bio-available phosphorus as noted in earlier studies [13,36], however, placing it in context with other sources requires data which is not fully available. Tributary load estimates are not available for 2012 and 2013. Makarewicz et al. [8] reported a loading of 14.8 mT to the study area in 2008 from monitoring of Duffins Creek and Caruthers Creek which suggests that the WPCP load of phosphorus far exceeds the tributary load, even without consideration of the relative bioavailability of phosphorus. However, Booty et al. [43] using different load estimation techniques reported higher and wide-ranging phosphorus loads from Duffins Creek. Estimates ranged from 13 to 17, 57 to 73 and 69 to 92 mT in 2007, 2008 and 2009, respectively. Load estimates from shoreline stormwater are not available but of interest considering the proximity to the shallow water where Cladophora is abundant. Loading of phosphorus to Lake Ontario varies among years due to weather patterns affecting tributary loading (e.g., [43]) as well as varying municipal loading. For example, the discharge of phosphorus from the Duffins Creek WPCP in 2008 was nearly double that of 2012 and 2013; annual phosphorus loading was 90.2 mT in 2008 [8] compared with 42.8 and 43.8 mT in 2012 and 2013, respectively.
A highly uncertain element of the phosphorus budget relates to the transport of nutrients across the offshore boundary into the study area driven by onshore circulation. At first look, the influx of offshore water will lower water column concentrations because of the low TP concentrations in the offshore of the lake, likely diluting the phosphorus supply in the nearshore water column. However, this overlooks the capacity of filter feeding by Dreissena on the nearshore lakebed [22] to extract phytoplankton, and with it phosphorus, from the water column as offshore water circulates inshore. The current and temperature data collected in 2012 demonstrates that the nearshore water column is loaded with offshore water during periods of onshore circulation. Phosphorus extracted from offshore water and sequestered on the nearshore lakebed represents an uncertain phosphorus load that needs to be considered in a phosphorus budget for the study area.
4.2. Nearbed Concentrations of Dissolved Nutrients to Detect Enrichment Affecting Benthic Algae
Concentrations of SRP, DP and TIN measured at the lakebed suggested enrichment from area sources, however, the spatial associations were weak and often uncertain. Concentrations were measured approximately 10 cm above the lakebed, which in principal, reduces the uncertainty due to assimilation and mixing within the water column and yields a more direct measure of nutrient levels in proximity to the growing algae. However, inferences on external sources are constrained by the fact that internal flux of nutrients at the lakebed may obscure spatial associations between external loading and nearbed concentrations.
Taken together, the results from seven sampling events in 2012 and 2013 provide mixed evidence of local-area enrichment of SRP. Higher nearbed concentrations of SRP were detected near the WPCP diffuser and over the alongshore axis away from the outfall during the August and October 2012 sampling events. In contrast, at other times there was no obvious pattern other than high relative values at a site near the diffuser. There was little consistent pattern in SRP levels along the shoreline at the shallowest sites (<5 m depth) where concentrations were generally lower than adjacent locations in deeper water. It is likely that biological drawdown lowers concentrations at times such that enrichment is less evident. In addition, mixing plumes are sometimes buoyant, reducing contact time with the lakebed as suggested in the area of the WPCP diffuser by the conductivity sensor data. Concentrations were often highest at the deepest sites where biological utilization of SRP was likely reduced compared with better illuminated shallower sites where Cladophora was abundant.
Nearbed SRP concentrations were mostly <2 µg/L, with area-wide average values among sampling events ranging from 0.8 to 2.9 µg/L, with the exception of October 2012. There are few comparable lakebed measurements of SRP for nearshore Lake Ontario. Ozersky et al. [44] reported SRP concentrations ranging from 0.9 to 2.8, averaging 1.9 µg/L, in samples collected 20 cm above the lakebed in June and July of 2006. Spring-time water column concentrations in the lake offshore when the lake is mixed provide an indirect reference point. Dove and Chapra [14] report concentrations of 1.4 and 2.0 µg/L for the spring of 2012 and 2013, respectively, with mean spring concentrations since 2010 ranging from 1.4 to 3.1 µg/L.
Concentrations of DP are expected to be proportionally less affected by biological uptake than SRP and may better depict enrichment patterns. The linear regressions predicting SRP from DP (Table 7) also suggest that DP should also be an indicator of bio-available phosphorus. At times, nearbed DP concentrations were higher at sites in proximity to the WPCP diffuser and the mouth of Duffins Creek. In May 2012, concentrations were higher at sites <10-m in depth compared with sites 20 m in depth, indicating enrichment in the shallows. Concentrations were higher on the east compared with the west shoreline (Table 5), suggesting loading along the eastern shoreline or alongshore transport of discharge from Duffins Creek. In August 2012, DP was higher in the area of the diffuser, a pattern also seen in SRP. A stronger influence of the WPCP on DP was seen in October 2012 with higher levels to the west of the diffuser. In contrast, the results for June 2012 and June and July 2013 suggest little spatial pattern other than a possible source of enrichment on the eastern shoreline. Collectively, the results suggest periodic enrichment of the lakebed due to the wastewater discharge and shoreline runoff. The limited increase in DP concentration with depth compared with SRP is consistent with more limited bioavailability and biological draw down of DP compared with SRP.
Nearbed concentrations of inorganic nitrogen also provide evidence of the influence of WPCP discharge on the lakebed nutrient regime. Concentrations were higher near the WPCP diffuser at times, most notably in October 2012. External loading of TIN should be more evident compared to SRP because of the proportionally lower biological utilization of the total supply. Unlike phosphorus, TIN concentrations are thought to remain above growth-limiting levels for phytoplankton (e.g., [45]) and Cladophora [9,18]. Linear regressions predicting SRP and TP from TIN were significant for three and two of seven sampling events, respectively (Table 7), suggesting that lakebed TIN may be a predicator of external loading of phosphorus, such as in August 2012, but that this is not consistently the case. Offshore loading of TIN from the hypolimnion may mimic or mask external loading during mid to late summer when TIN concentration gradients develop through the water column. During the summer, TIN becomes depleted in the epilimnion [2,39,40] and consequently onshore transport of hypolimnetic water results in gradients of TIN in the nearshore both with depth within the water column and with proximity to shore. The upwelling over the study area in 2012 (Figure 6) and reported in other studies [2,46] suggests that variability in nearbed TIN concentrations is to be anticipated irrespective of local-area loading.
4.3. Interpreting the Distribution of Cladophora
Benthic blooms of Cladophora, suggesting strong growth under nutrient enriched conditions, were evident over the study area. The shallow lakebed was widely covered by Cladophora. Biomass of Cladophora exceeded the criteria of 30 and 50 g/m2, used to infer nuisance conditions [47], in some samples. However, there was no clear or consistent difference in the amounts of Cladophora among sub-areas of the shoreline.
Unlike biomass, concentrations of phosphorus in Cladophora, an indicator of phosphorus sufficiency [48], varied over the study area with higher levels near the WPCP diffuser. The higher Qp values indicate enrichment and algal growth under less phosphorus-limited conditions in the absence of confounding effects of other growth-limiting factors. Growth rates are predicted to increase strongly as Qp rises to 0.1%, less rapidly to 0.2%, reaching an asymptote after which the growth rate is unresponsive to increasing cellular phosphorus [49]. In June 2012, Qp at sites east of the mouth of Duffins Creek were <0.082% compared with 0.081 to 0.13% at sites west of Duffins Creek and closer to the WPCP diffuser, with the exception of the 20 m sites (Figure 9). In August, the levels were higher overall and again with the same east to west pattern. Notable are the higher Qp values (mostly >0.1%) oriented to the WSW away from the WPCP diffuser (Figure 9).
The seeming contradiction between the distributions of Cladophora biomass and Qp is potentially explained by the nuances of the ecology of Cladophora that make the interpretation of field studies challenging. Unpredictable loss of attached biomass of Cladophora due to physical disturbance by wave action and physiological deterioration of the alga over the growing season [50] may confound inferences on overall biomass production among areas. The similar lake current regimes among sensors over the study area suggest that physical disturbance should be similar at sites of comparable depth. However, the effects of varying nutrient and temperature regimes on senescence of algae among locations cannot be discounted. The Pickering Nuclear Generating Plant discharges cooling water to the shoreline at the west end of the study area, affecting water temperature which may alter the timing of growth among locations.
The interaction of phosphorus and light limitation on growth can also make the interpretation of Qp as an indicator of phosphorus enrichment challenging. At 20-m sites, Qp ranged from 0.20 to 0.24% and 0.35 to 0.49% in June and August, respectively, indicating phosphorus sufficiency due to light limitation of growth as evident from the low biomass. Discerning the effects of light limitation on Qp is more difficult when PAR flux is suboptimal for growth but not fully limiting [51]. Light transmission at depths of Cladophora growth was variable as inferred from beam attenuation (K660) measurements in the upper water column which suggested that transmission is higher at times over the eastern section of the shoreline than the central-west section. The two largest discharges to the study area, the Duffins Creek WPCP diffuser and the mouth of Duffins Creek, are in the central-west section of the shoreline. Characterization of the PAR regime and Cladophora growth modeling (e.g., [48]) are required to distinguish light effects on Qp levels and would be useful in more fully resolving the reasons for the variability in Qp among areas.
The abundance of Cladophora in 2012 appears lower than in 2008 [9]. Average biomass at 3-m sites in the Ajax area in June and July of 2008 was 130 and 78 g/m2, respectively, falling to 44- and 29- at 6-m sites. This compares with the highest average biomass of 84 and 34 g/m2 at any 3- and 6-m site, respectively, in 2012 (Figure 9). The growth of Cladophora may vary from year to year because of differences in weather, lake conditions and possibly differences in nutrient loading. Biomass levels have varied widely where monitored annually [12].
Earlier studies examining why Cladophora is abundant in Lake Ontario [9,10,11,13,15,16,18], an oligotrophic lake [14], have made appreciable progress yet questions remain that arguably stand in the way of a strategy to abate overabundance of Cladophora. Ecological changes in the lake after the invasion of dreissenid mussels account for a general increase in Cladophora. A key factor has been a lake-wide increase in water clarity, with more light reaching the lakebed, resulting in better growing conditions and more lakebed habitat for Cladophora [16,18].
Less certain is the understanding of the pathways by which phosphorus loaded to the lake fuels the widespread abundance of Cladophora in the lake. Nutrient loading in urban areas has been identified as a contributing factor to differences in Cladophora abundance among areas in Lake Ontario [9]. This reasonably suggests that the lake-wide regional supply of phosphorus when augmented by local-area sources results in the increased growth of Cladophora with the possible exceptions of when either (i) the lake-wide supply exceeds the local-area supply, or, (ii) when physical conditions such as light also limit algae growth. More speculative is the hypothesized beneficial effects of increased nutrient focusing at the lakebed due to the heightened biological activity associated with a high concentration of mussel biomass. There is a growing case that a Dreissena-colonized lakebed leaks dissolved phosphorus into the base of the water column as envisaged by Hecky et al. [20] and observed by Ozersky et al. [44] and Waples et al. [25] using incubation chamber experiments.
4.4. Dreissenid Mussels as Modifiers of the Lakebed Environment
The abundance and wide distribution of Dreissena shapes the physical and biological character of the lakebed of the study area and, Lake Ontario in general [21,22], aspects of which may affect Cladophora. Mussel abundance was variable within sites and sub-areas suggesting that any associations between mussels, lakebed nutrients and Cladophora would likely be difficult to detect and likely be most evident at the scale of patches (i.e., among sampling quadrats). Mussel biomass appeared higher west of the WPCP diffuser and on the eastern margins of the study area contrasting with lower abundance east of the WPCP diffuser and east of the mouth of Duffins Creek, an area more strongly influenced by sedimentation from Duffins Creek [26]. Biomass was consistently high at sites WSW of the WPCP outfall, suggesting a positive effect of the proximity to the outfall. Abundance was unrelated to depth other than that it was consistently high at the two deepest sites, suggesting that physical disturbance from waves had a negative effect on abundance.
The higher biomass of Cladophora seen in some quadrats with high mussel abundance is suggestive of a beneficial association, however, the correlation between Cladophora and Dreissena biomass at sites <8 m, the depth range of strong Cladophora growth, was weak. A stronger positive association between Cladophora and Dreissena was detected in the regional study using a larger dataset, which also including the data here, over a broader geographic area [10].
The possibility that internal phosphorus loading facilitated by Dreissena adds to, and obscures, local-area phosphorus loading, contributing to the growth of Cladophora, is neither supported nor well resolved with the data here. The weak association between Cladophora and Dreissena biomass, the absence of spatial association between Cladophora biomass and areas of nutrient enrichment, and in consideration of the sheer abundance of Dreissena and a growing literature that indicates that Dreissena affects lake nutrient pathways suggests that efforts to manage Cladophora in areas with nutrient pollution be mindful of possible interactions with dreissenid mussels.
4.5. Summary
The lands draining to the shores of the towns of Ajax and Pickering and, also beyond the drainage area, affect water quality in the adjacent coastline of Lake Ontario. Within the water column, the discharge of treated sewage stands out because of the concentration gradients of phosphorus and nitrogen that occur over the mixing area. Dilution rapidly reduced levels to those approaching nearshore background concentrations with subtle gradients extending away from the outfall diffuser that are detectable for some distance at times. The prevailing alongshore flow of the coastal zone frequently distributes affected water parallel to the shoreline. Runoff into the lake also added to the phosphorus enrichment in the area as indicated by the elevated DP and TP in shallow water at the shoreline. In general, water quality along the shoreline was more perturbed than further into the lake, however, it was difficult to distinguish the individual influences of Duffins Creek and other runoff points due to mixing along the shoreline.
The growth of phytoplankton was not a concern, as inferred from chlorophyll a concentrations. With the possible exception of the immediate mixing zone near the WPCP diffuser, oligotrophic conditions, as inferred from chlorophyll a and TP, prevailed over the study area. In stark contrast, the green algae Cladophora, forming lawns growing on the lakebed, was abundant at depths <10 m. Biomass exceeded the criteria indicating nuisance levels in some samples.
The distribution of Cladophora biomass was not related to the locations of nutrient loading, or the patterns of water quality measured in the water column. Measurements of dissolved nutrients at the lakebed were used to detect the influence of loading sources on nutrient levels in proximity to growing Cladophora. At times, there was little spatial pattern in levels of dissolved nutrients, and overall, evidence that levels were affected by biological uptake. However, spatial patterns in concentrations indicated intermittent, and spatially varying, enrichment with SRP, DP and TIN near the WPCP diffuser and with DP along the shoreline.
Unlike Cladophora biomass which was seemingly unrelated to either water column or nearbed nutrient levels, the phosphorus levels in Cladophora (Qp), an indicator of nutrient sufficiency, were higher in the area of the WPCP diffuser. Measurements of light transmission through the water column also suggest that light limitation, presumably affecting the growth of Cladophora, should be considered as a modifying factor. While the possible impact of light limitation merits further investigation, the balance of the Qp data provides evidence of phosphorus enrichment.
The lakebed was widely colonized with Dreissena, suggesting that filter-feeding by mussels might augment the phosphorus supply to the nearshore lakebed and Cladophora during the frequent onshore circulation of offshore water. There was no correspondence between Dreissena biomass and dissolved nutrient levels on the lakebed, however, biomass of Cladophora was weakly correlated with the biomass of Dreissena at shallow depths.
The findings here describing the covariation between Cladophora and water quality over a local-area scale of variability have similarities to those reported over a regional scale. Like the regional scale analysis [10], there was little correspondence between water column nutrient levels and the abundance of Cladophora. Similar to the regional analysis, Qp levels were higher in areas where water quality suggested exposure of algae to higher phosphorus levels, and in both cases there was an element of uncertainty in the interpretation Qp due to possibly co-varying light regimes and phosphorus levels. The Qp data indicated that Cladophora growth was likely phosphorus limited over the regions in the geographically broader study as it was over much of the Pickering-Ajax area. The biomass of Cladophora was weakly correlated with the abundance of Dreissena at both the local and regional scales, suggesting a positive effect of the mussels on algae growth but with the strength of the evidence leaving uncertainty.
The seeming lack of correspondence between the abundance of Cladophora and varying levels of water column phosphorus within the Pickering-Ajax study area is perplexing and points to the need to resolve whether loading of phosphorus from the offshore to the nearshore, dependent on lake-wide loading, plays a role in the wide-spread abundance of Cladophora in Lake Ontario. The attempt here to parse out the local-area effects on Cladophora abundance provides reasons to expect that phosphorus gradients in the study area will affect growth. Field studies of benthic algae are also challenging and fraught with an element of uncertainty due the typically high levels of variability on the lakebed, and the logistical difficulty of accurately sampling on the lakebed.
Phosphorus inputs to Lake Ontario may increase in the coming years due to anticipated continued urban growth [52]. Widespread phosphorus limitation of growth is evident from this and the regional study with the implication that additional phosphorus supply will likely result in more algal growth. Attaining the phosphorus concentration and loading targets required to manage overabundance of Cladophora as envisaged by the US-Canada Great Lakes Water Quality Agreement and the Province of Ontario Great Lakes Strategy will require an “ecosystem approach” in which investigations will need to advance understanding of the balances between (i) area and lake-wide nutrient supply, and, (ii) benthic and water column nutrient flux.
Supplementary Materials
The following are available online at https://www.mdpi.com/2073-4441/10/11/1569/s1. Supplemental Material Table S1: Linear regression to predict lab-equivalent nitrate (as nitrate + nitrite minus nitrite) from field measurements of nitrate using the MABARI ISSUS nitrate probe. Supplemental Information Table S2: Upper water column average K660 among sampling events when water column profiles were collected over the full extent of the study area in 2012 and 2013. Supplemental Information Table S3: Percent SRP of DP immediately above the lakebed at varying distances along the WSW-ESE axis from the Duffin Creek WPCP outfall and the mouth of Duffins Creek. Supplemental Information Table S4: Pearson correlations between nearbed SRP, DP and TIN concentrations and average values of UVFR, chlorophyll a fluorescence, K660, depth and temperature measured from 1 m above lakebed to the lakebed in water column profiles collected during sampling events. Supplemental Information Figure S1: Cladophora tissue phosphorus plotted against mean Cladophora biomass at sites over the study area in 2012. Supplemental Information Figure S2: Cladophora and Dreissena biomass plotted against nearbed SRP, DP and TIN for the July and August 2012 benthic surveys.
Funding
This research received no external funding.
Acknowledgments
The work of the Great Lakes field group in the undertaking of this study is greatly appreciated. The assistance of Alice Dove of Environment and Climate Change Canada in providing SRP analysis at the National Laboratory for Environmental Testing (NLET) Burlington was crucial for this study. Thanks to the staff at Pollutec Environmental Sarnia, Ontario for the careful work conducting the benthic biological surveys.
Conflicts of Interest
The author declares no conflict of interest.
Appendix A
Figure A1.
Remote sampling device used to collect water samples 10 cm from the lakebed. The apparatus is slowly lowered from the surface with plungers of four 50 mL syringes (two are not visible) depressed. A piston is triggered and pulls the plungers up when an arm attached to the side of the apparatus contacts the lakebed.

References
- Beeton, A.M. Eutrophication of the St. Lawrence Great Lakes. Limnol. Oceanogr. 1965, 10, 240–254. [Google Scholar] [CrossRef] [Green Version]
- Howell, E.T.; Chomicki, K.M.; Kaltenecker, G. Tributary discharge, lake circulation, and lake biology as drivers of water quality on the Canadian shores of Lake Ontario. J. Great Lakes Res. 2012, 38, 47–61. [Google Scholar] [CrossRef]
- Howell, E.T.; Chomicki, K.M.; Kaltenecker, G. Patterns in water quality on Canadian shores of Lake Ontario: Correspondence with proximity to land and level of urbanization. J. Great Lake Res. 2012, 38, 32–46. [Google Scholar] [CrossRef]
- Makarewicz, J.C.; Lewis, T.; Boyer, G.; Edwards, W. The influence of streams on nearshore water chemistry, Lake Ontario. J. Great Lakes Res. 2012, 38, 62–71. [Google Scholar] [CrossRef]
- Makarewicz, J.C.; Lewis, T.W.; Pennuto, C.; Atkinson, J.; Edwards, W.J.; Boyer, G.L.; Howell, E.T.; Thomas, G. Physical and chemical characteristics of the nearshore zone of Lake Ontario. J. Great Lakes Res. 2012, 38, 21–31. [Google Scholar] [CrossRef]
- Carey, R.O.; Migliaiccio, K.W. Contribution of wastewater treatment plant effluents to nutrient dynamics in aquatic systems: A review. Environ. Manag. 2009, 44, 205–217. [Google Scholar] [CrossRef] [PubMed]
- Millier, H.; Hooda, P. Phosphorus species and fractionation—Why sewage derived phosphorus is a problem. J. Environ. Manag. 2011, 92, 1210–1214. [Google Scholar] [CrossRef] [PubMed]
- Makarewicz, J.C.; Booty, W.G.; Bowen, G.S. Tributary phosphorus loading to Lake Ontario. J. Great Lakes Res. 2012, 38, 14–20. [Google Scholar] [CrossRef]
- Higgins, S.N.; Pennuto, C.M.; Howell, E.T.; Lewis, T.; Makarewicz, J.C. Urban influences on Cladophora blooms in Lake Ontario. J. Great Lakes Res. 2012, 38, 116–123. [Google Scholar] [CrossRef]
- Howell, E.T. Cladophora (green algae) and dreissenid mussels over a nutrient loading gradient on the north shore of Lake Ontario. J. Great Lakes Res. 2018, 44, 86–104. [Google Scholar] [CrossRef]
- LOSAAC. Final Report to Halton Regional Council, Ontario; Lake Ontario Algae Action Advisory Committee: Oakville, ON, Canada, 2008. [Google Scholar]
- SOLEC (Environment Canada and the U.S. Environmental Protection Agency). State of the Great Lakes 2017. Cat No. En161-3/1E-PDF. EPA 950-R-17-001. Section 5.6 Cladophora Sub-Indicator. 2017, pp. 312–328. Available online: http://binational.net (accessed on 28 October 2018).
- Auer, M.T. Field Studies of Phosphorus and Cladophora in Lake Ontario along the Ajax, Ontario Waterfront; Report; The Town of Ajax: Ajax, ON, Canada, 2014. [Google Scholar]
- Dove, A.; Chapra, S.C. Long-term trends of nutrients and trophic response variables for the Great Lakes. Limnol. Oceangr. 2015, 60, 696–721. [Google Scholar] [CrossRef]
- Malkin, S.Y.; Dove, A.; Smith, R.E.; Guildford, S.; Hecky, R.E. Spatio-temporal patterns of water quality in Lake Ontario and their implications for nuisance growth of Cladophora. J. Great Lakes Res. 2010, 36, 477–489. [Google Scholar] [CrossRef]
- Malkin, S.Y.; Guildford, S.J.; Hecky, R.E. Modeling the growth of Cladophora in a Laurentian Great Lake in response to changes due to the exotic invader Dreissena and to lake warming. Limnol. Oceanogr. 2008, 53, 1111–1124. [Google Scholar] [CrossRef]
- Griffiths, R.W.; Schloesser, D.W.; Leach, H.; Ksvalak, W.P. Distribution and dispersal of the zebra mussel (Driessenia polyrnorpha) in the Great Lakes region. Can. J. Fish. Aquat. Sci. 1991, 48, 1381–1388. [Google Scholar] [CrossRef]
- Kuczynski, A.; Auer, M.T.; Brooks, C.N.; Grimm, A.G. The Cladophora resurgence in Lake Ontario: Characterization and implications for management. Can. J. Fish. Aquat. Sci. 2016, 73, 999–1013. [Google Scholar] [CrossRef]
- Dolan, D.M.; Chapra, S.C. Great Lakes total phosphorus revisited: 1. loading analysis and update (1994–2008). J. Great Lakes Res. 2012, 38, 730–740. [Google Scholar] [CrossRef]
- Hecky, R.E.; Smith, R.E.H.; Barton, D.R.; Guildford, S.J.; Taylor, W.D.; Charlton, M.N.; Howell, T. The nearshore phosphorus shunt: A consequence of ecosystem engineering by dreissenids in the Laurentian Great Lakes. Can J. Fish. Aquat. Sci. 2004, 61, 1285–1293. [Google Scholar] [CrossRef]
- Wilson, K.A.; Howell, E.T.; Jackson, D.A. Replacement of zebra mussels by quagga mussels in the Canadian nearshore of Lake Ontario: The importance of substrate, Round Goby abundance, and upwelling frequency. J. Great Lakes Res. 2006, 32, 11–28. [Google Scholar] [CrossRef]
- Pennuto, C.M.; Howell, E.T.; Lewis, T.W.; Makarewicz, J.C. Dreissena population status in nearshore Lake Ontario. J. Great Lake Res. 2012, 38, 161–170. [Google Scholar] [CrossRef]
- Bootsma, H.; Liao, Q. Nutrient cycling by dreissenid mussels: Controlling factors and ecosystem response. In Quagga and Zebra Mussels: Biology, Impacts and Control, 2nd ed.; Nalepa, T.F., Schloesser, D.W., Eds.; CRC Press: Boca Raton, FL, USA, 2013; pp. 555–574. [Google Scholar]
- Lake Ontario Nutrient Targets Task Team (LONTTT). Recommendations to Develop Binational Lake Ontario Nutrient Targets. Report to Annex 4 Nutrients Subcommittee Great Lakes Water Quality Agreement under the US-Canada Great Lakes Water Quality Agreement. October 2016. Available online: https://binational.net/annexes/a4/ (accessed on 1 November 2018).
- Waples, J.T.; Bootsma, H.A.; Klump, J.V. How are coastal benthos fed? Limnol. Oceanogr. Lett. 2017, 2, 18–28. [Google Scholar] [CrossRef] [Green Version]
- Rukavina, N.A. Nearshore sediment survey of western Lake Ontario, methods and preliminary results. In Proceedings of the 12th Conference of Great Lakes Research, Ann Arbor, MI, USA, 5–7 May 1969; pp. 317–324. [Google Scholar]
- MNRF Ontario Ministry of Natural Resource and Forestry. SOLARIS V2.0 Land Cover Land-Cover Classification; MNRF: Peterborough, ON, Canada, 2015.
- Town of Ajax (South of Hwy 401) Stormwater Management Retrofit Study. Class Environmental Assessment Master Planning Study Prepared for Town of Ajax; Stantec Consulting Ltd.: Markham, ON, Canada, 2011. [Google Scholar]
- Duffin Creek Water Pollution Control Plant Phosphorus Reduction Action Plan Study; Prepared for Regional Municipalities of Durham and York; Ch2mhill Consulting: Toronto, ON, Canada, 2018.
- Class Environmental Assessment to Address Outfall Capacity Limitations at the Duffins Creek Water Pollution Control Plant; Prepared for Regional Municipalities of Durham and York; Ch2mhill Consulting: Toronto, ON, Canada, 2013.
- UVAquatracka Handbook; Chelsea Instruments Ltd.: Surrey, UK, 1994.
- Chow, J.; Abbey, A.I.; Khan, Z.; Dermicheva, S.; Jennings, W.; Wilson, P. Ontario Ministry of the Environment 2009 Performance Report: General Chemistry and Microbiology Analyses Section; Queen’s Printer for Ontario: Toronto, ON, Canada, 2010. [Google Scholar]
- Ontario Ministry of the Environment (OMOE). Method E3036: The Determination of Total Phosphorus in Water by Colourimetry, Version 3.0, April 1, 2011; Environmental Monitoring and Reporting Branch: Dorset, ON, Canada, 2011.
- Martin, J.B.; Thomas, R.G.; Hartl, K.M. An inexpensive, automatic and submersible water sampler. Limnol. Oceanogr. Methods 2004, 2, 398–405. [Google Scholar] [CrossRef]
- Ontario Ministry of the Environment (OMOE). Method NPSED-3116. The Determination of Total Kjeldahl Nitrogen and Total Phosphorus in Soil, Sediment, Sludge, and Vegetation by Colourimetry; OMOE Laboratory Service Branch: Toronto, ON, Canada, 2009.
- Leon, L.F.; Smith, R.; Malkin, S.; Depew, D.; Hipsey, M.R.; Antenucci, J.P.; Higgins, S.N.; Hecky, R.E.; Rao, R.Y. Nested 3D modeling of the spatial dynamics of nutrients and phytoplankton in a Lake Ontario nearshore zone. J. Great Lakes Res. 2012, 38, 171–183. [Google Scholar] [CrossRef]
- Helm, P.A.; Howell, E.T.; Li, H.; Metcalfe, T.L.; Chomicki, K.; Metcalfe, C.D. Influence of nearshore dynamics on the distribution of organic wastewater-associated chemicals in Lake Ontario determined using passive samplers. J. Great Lakes Res. 2012, 38, 105–115. [Google Scholar] [CrossRef]
- Howell, E.T.; Barton, D.R.; Fietsch, C.; Kaltenecker, G. Fine-scale nutrient enrichment and water quality on the rural shores of Southeast Lake Huron. J. Great Lakes Res. 2014, 40, 126–140. [Google Scholar] [CrossRef]
- Lean, D.R.S.; Knowles, R. Nitrogen transformations in Lake Ontario. Can. J. Fish. Aquat. Sci. 1987, 44, 2133–2143. [Google Scholar] [CrossRef]
- Winter, G.W.; Howell, E.T.; Nakamota, L.K. Annual and seasonal trends in nutrients, phytoplankton and chloride in nearshore waters of Lake Ontario: Synchrony and relationships with physical conditions. J. Great Lake Res. 2012, 38, 124–132. [Google Scholar] [CrossRef]
- Barbiero, R.P.; Tuchman, M.L.; Millard, E.S. Post-dreissenid increases in transparency during summer stratification in the offshore waters of Lake Ontario: Is a reduction in whiting events the cause? J. Great Lakes Res. 2006, 32, 131–141. [Google Scholar] [CrossRef]
- Neilson, M.A.; Stevens, R.J. Spatial heterogeneity of nutrients and organic matter in Lake Ontario. Can. J. Fish. Aquat. Sci. 1987, 44, 2192–2203. [Google Scholar] [CrossRef]
- Booty, W.G.; Wong, I.; Bowen, G.S.; Fong, P.; McCrimmon, C.; Leon, L. Loading estimate methods to support integrated watershed-lake modelling: Duffins Creek, Lake Ontario. Water Qual. Res. J. 2014, 49, 171–191. [Google Scholar] [CrossRef]
- Ozersky, T.; Malkin, S.Y.; Barton, D.R.; Hecky, R.E. Dreissenid phosphorus excretion can sustain C. glomerata growth along a portion of Lake Ontario shoreline. J. Great Lakes Res. 2009, 35, 321–328. [Google Scholar] [CrossRef]
- Millard, E.S.; Myles, D.D.; Johannsson, O.E.; Ralph, K.M. Seasonal phosphorus deficiency of Lake Ontario phytoplankton at two index stations: Light versus phosphorus limitation of growth. Can. J. Fish. Aquat. Sci. 1996, 53, 1112–1124. [Google Scholar] [CrossRef]
- Haffner, G.D.; Yallop, M.L.; Herbert, P.D.N.; Griffiths, M. Ecological significance of upwelling events in Lake Ontario. J. Great Lakes Res. 1984, 10, 28–37. [Google Scholar] [CrossRef]
- Recommended Phosphorus Loading Targets for Lake Erie. Annex 4 Objectives and Targets Task Team Final Report; Nutrients Annex Subcommittee under the US-Canada Great Lakes Water Quality Agreement; 11 May 2015. Available online: https://www.epa.gov/sites/production/files/2015-06/documents/report-recommended-phosphorus-loading-targets-lake-erie-201505.pdf (accessed on 1 November 2018).
- Tomlinson, L.M.; Auer, M.T.; Bootsma, H.A.; Owens, E.M. The Great Lakes Cladophora model: Development, testing and application to Lake Michigan. J. Great Lakes Res. 2010, 36, 287–297. [Google Scholar] [CrossRef]
- Auer, M.T.; Canale, R.P. Ecological studies and mathematical modeling of Cladophora in Lake Huron: 3. the dependence of growth rates on internal phosphorus pool size. J. Great Lakes Res. 1982, 8, 93–99. [Google Scholar] [CrossRef]
- Higgins, S.N.; Malkin, S.Y.; Howell, E.T.; Guildford, S.J.; Campbell, L.; Hiriart-Baer, V.; Hecky, R.E. An ecological review of the Cladophora glomerata (Chlorophyta) in the Laurentian Great Lakes. J. Phycol. 2008, 44, 839–854. [Google Scholar] [CrossRef] [PubMed]
- Howell, E.T.; Dove, A. Chronic nutrient loading from Lake Erie affecting water quality and nuisance algae on the St. Catharines of Lake Ontario. J. Great Lakes Res. 2017, 43, 899–915. [Google Scholar] [CrossRef]
- Growth Plan for the Greater Golden Horseshoe (2017); Ontario Ministry of Municipal Affairs and Housing: Toronto, ON, Canada, 2017.
Figure 1.
Map of Pickering—Ajax study area. The gray line indicates the survey track used for collection of field sensor data. The location of the diffuser for the Duffins Creek Wastewater Plant outfall is given by the orange circle. Shoreline stormwater outfalls are given by stars. The locations of conductivity sensors, current meters and temperature strings deployed in 2012 are indicated by the blue triangles, black squares and red diamonds respectively. The inset map shows the location of the study area in Lake Ontario.

Figure 2.
Surface maps of nitrate, CDOM fluorescence and specific conductivity (columns left to right) over the Pickering-Ajax study area in 2012 and 2013. The numeric values indicate DP, TP and turbidity levels at points on the surface maps in columns from left to right, respectively. Rows from top to bottom indicate results for surveys on 23 May, 4 July and 17 October 2012 and 25 April 2013, respectively. Note that not all numeric values are visible due to the size of maps.

Figure 3.
PCA sample scores on axes 1, 2, and 3 of the water quality analysis plotted on a map of the study area. Rows from top to bottom indicate results for surveys in May, July and October 2012 and April 2013, respectively.
Figure 3.
PCA sample scores on axes 1, 2, and 3 of the water quality analysis plotted on a map of the study area. Rows from top to bottom indicate results for surveys in May, July and October 2012 and April 2013, respectively.

Figure 4.
Composite map of estimates of K660 in the upper water column, expressed as Z-scores, determined from profile measurements of beam attenuation during water column sampling events. Measurement of K660 from 1 m below the surface to 10-m depth, or the lakebed at sites where depths <10 m have been averaged. Light transmission is higher at lower K660 and Z-scores. Data for six sampling events were converted to Z-scores by survey.

Figure 5.
Alongshore and cross-shore near-surface currents measured by current meters from April to November 2012. Panel (A) is alongshore currents at shallow sites; AJ3, 13.5 m (red) and AJ10, 9.5 m (blue). Panel (B) is alongshore currents at deeper sites; Buoy1, 18.5 m (red) and TE2, 20.7 m (blue). Panels (C,D) give corresponding cross-shore currents for shallow and deeper sites respectively.

Figure 6.
Temperature traces from April to November 2012 at sensor sites (see Figure 1 for locations). Panel (A) gives temperatures at approximately 3, 9 and 19 m below the surface at TE2 (lake depth is 20.2 m). Panel (C) gives temperatures at approximately 2, 7 and 13 m depths at AJ3 located offshore of the WPCP diffuser (site depth is 13.9 m). Panels (B,D) give hourly, the largest density change between successive sensors at 1 m intervals through the water column at sites TE2 and AJ3, respectively.

Figure 7.
Specific conductivity in 2012 at sensors WSW and ENE of the Duffins Creek WPCP diffuser (see Figure 1). The bottom right panel indicates conductivity near the lakebed ENE of the diffuser (site depth 11.0 m; sensor depth 10.0 m). The top right panel indicates the difference in conductivity between a sensor placed near the lake surface and above the lakebed WSW of the diffuser (site depth 9.1 m; sensor depths 4.1 and 9.1 m). The top left panel indicates the difference between sensors near the lake surface WSW and ENE (site depth 11.0 m; sensor depth 6.0 m) of the diffuser. The bottom left panel indicates the difference between sensors near the lakebed WSW and ENE of the diffuser.

Figure 8.
Nearbed SRP concentrations (μg/L) over the Pickering-Ajax study area between May 2012 and July 2013. Panels (A–E) give results for surveys in May, June, July, August and October 2012, respectively. Panels (F,G) give results for June and July 2013. Panel (H) indicates the distribution of sampling points (black circles) relative to the Duffin Creek WPCP diffuser (red square), storm sewers discharging directly to the lake (green circles) and substrate type characterized as either hard or soft material as extracted and interpreted from a substrate map in [26]. See Table 5 for sampling dates.

Figure 9.
Distribution of Cladophora biomass and phosphorus concentrations (Qp) over the study area in 2012. Panel (A,B) indicate biomass (g/m2 dry weight) during the 14–25 June and 13–16 August benthic surveys, respectively. Panels (C,D) indicate phosphorus concentrations (% dry weight) in samples collected during the June and August benthic surveys, respectively.

Figure 10.
Biomass of Dreissena over the study area in 2012. Panel (A,B) indicate biomass (g/m2 total dry weight) during the June and August benthic surveys, respectively.
Figure 10.
Biomass of Dreissena over the study area in 2012. Panel (A,B) indicate biomass (g/m2 total dry weight) during the June and August benthic surveys, respectively.

Figure 11.
Cladophora biomass plotted against Dreissena biomass in individual quadrats. Panel (A,B) indicate the results for sampling events in June and August 2012, respectively. The symbol colour indicates site depth with green, red, blue and black indicating depth ranges of 3 to 5, 5 to 8, 8 to 11 and 19 to 21 m, respectively.

Table 1.
Median values of water quality variables by depth strata over all samples collected in the Pickering-Ajax study area in 2012 to 2013. Minimum and maximum values in brackets. (A) Surface Samples (1.5 m below the surface). (B) Bottom Samples (1 to 2 m above the lakebed).

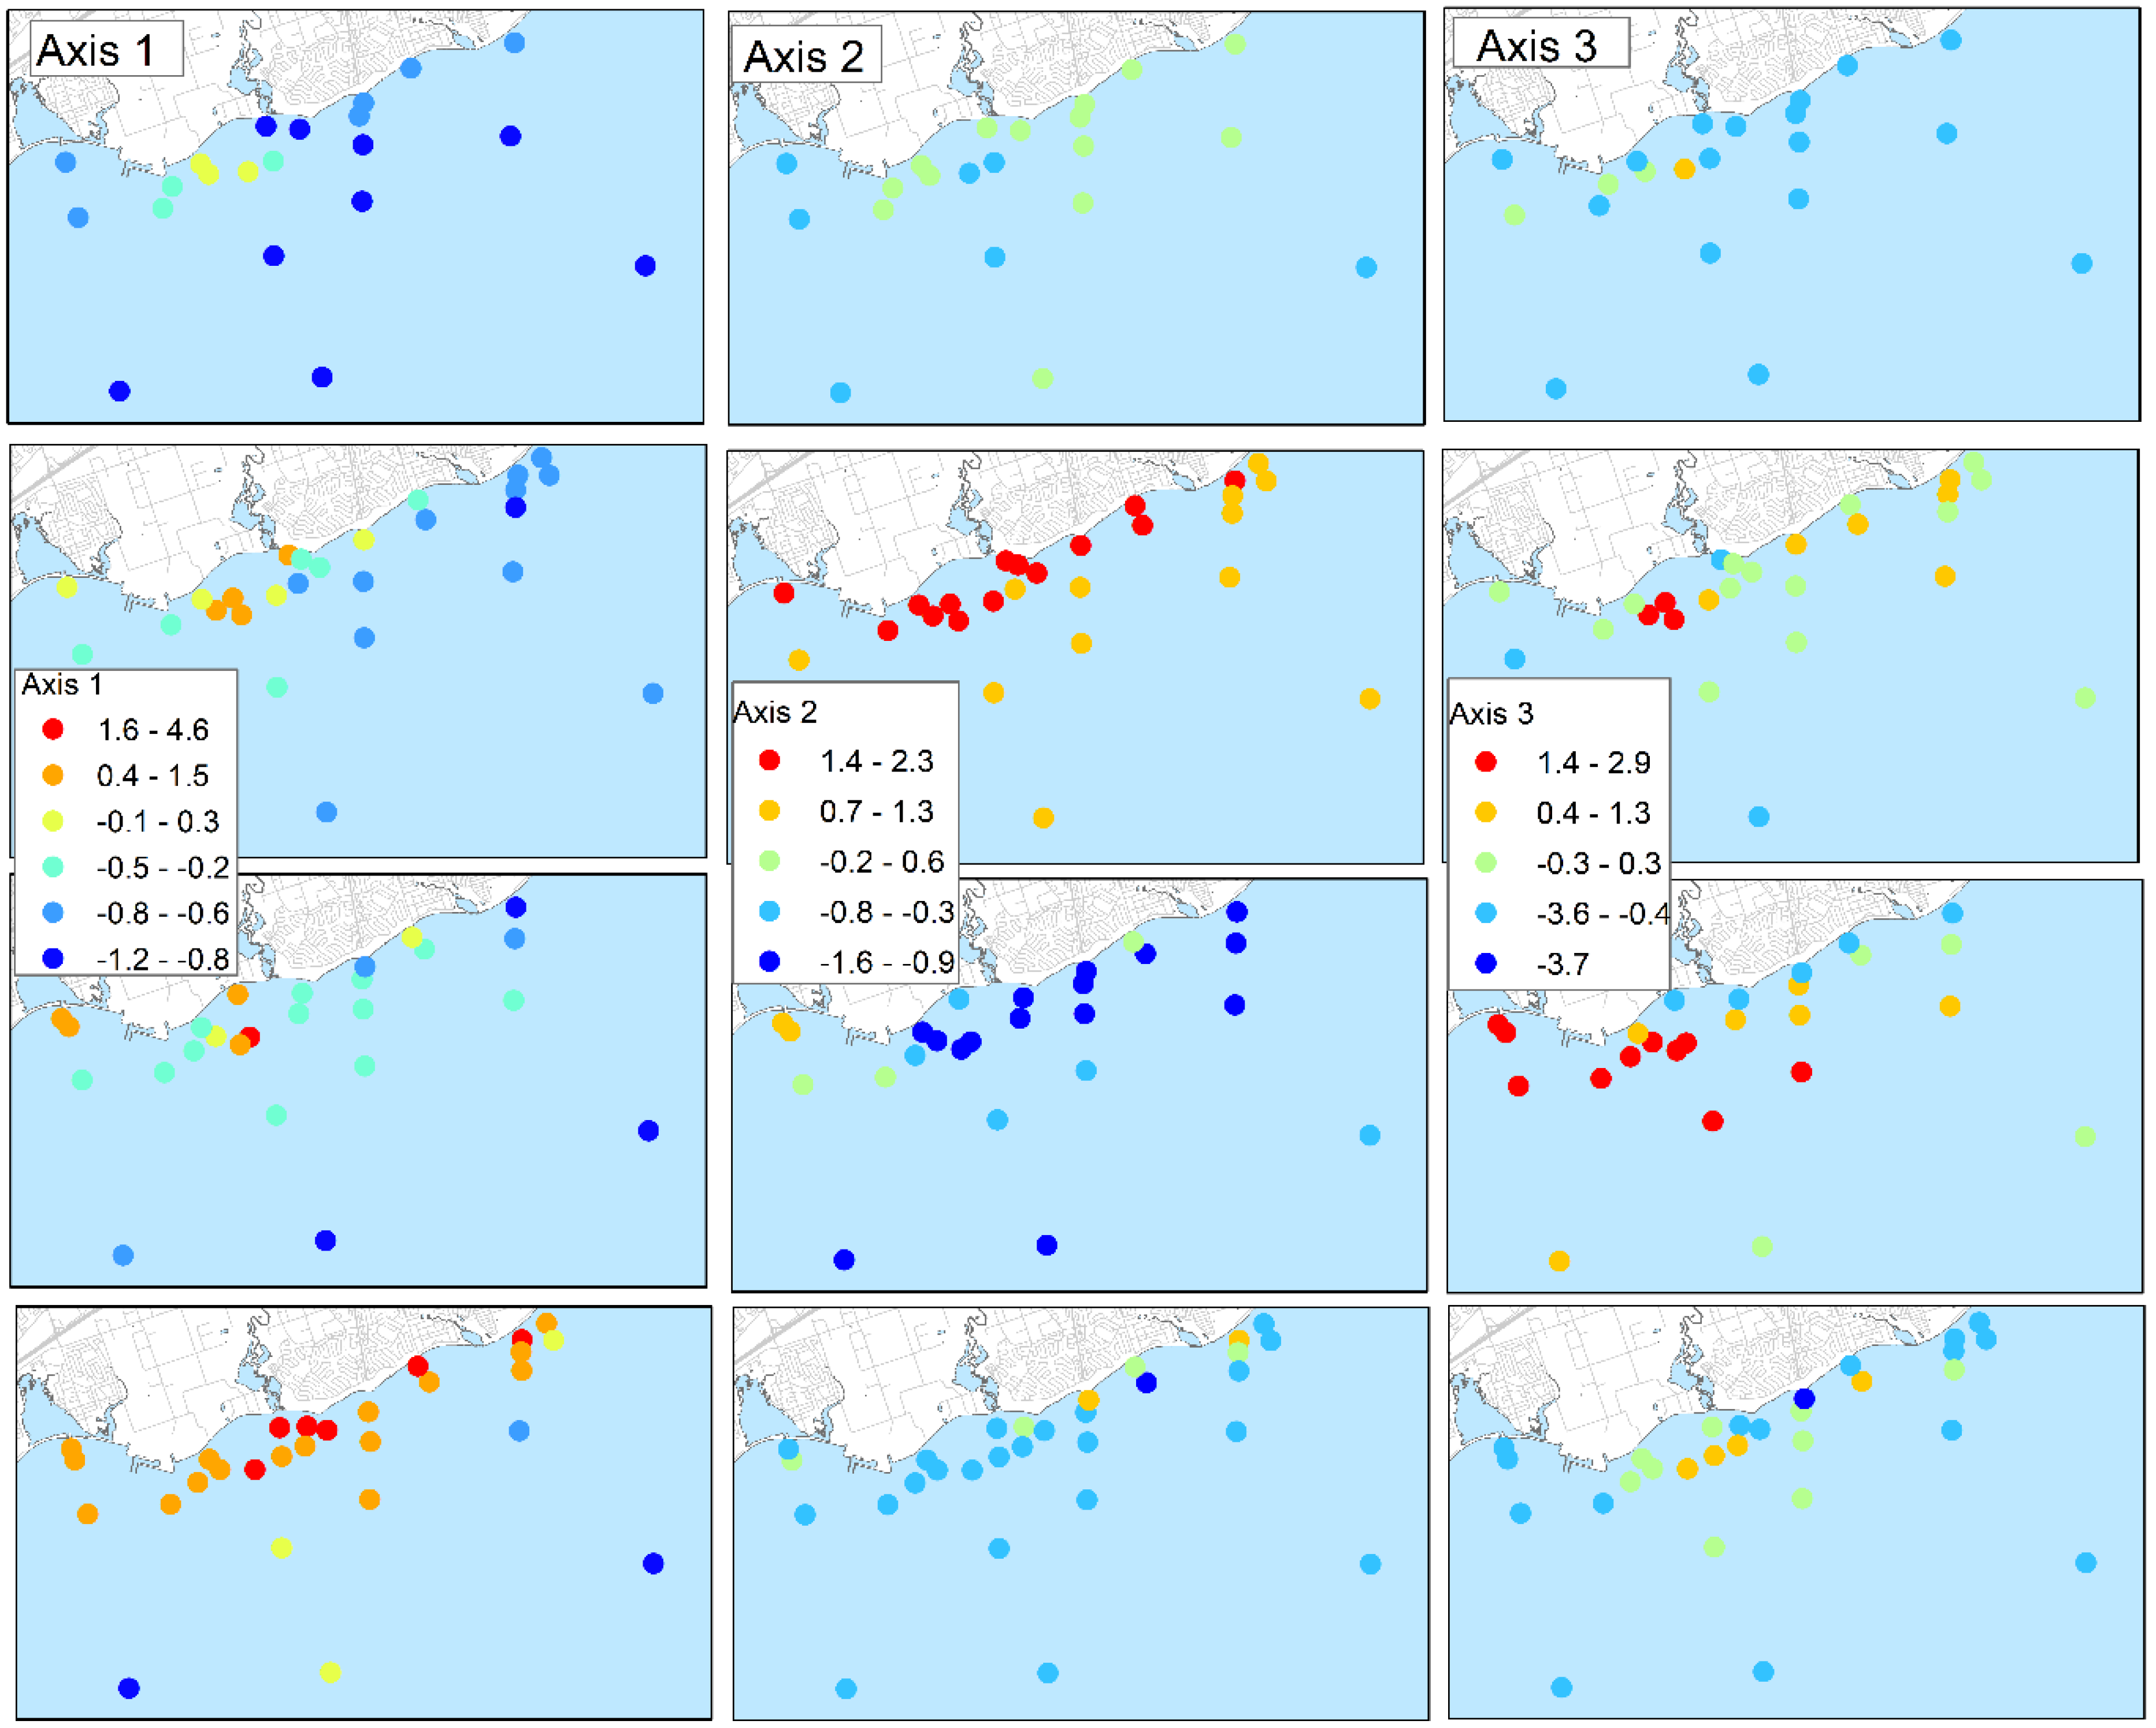
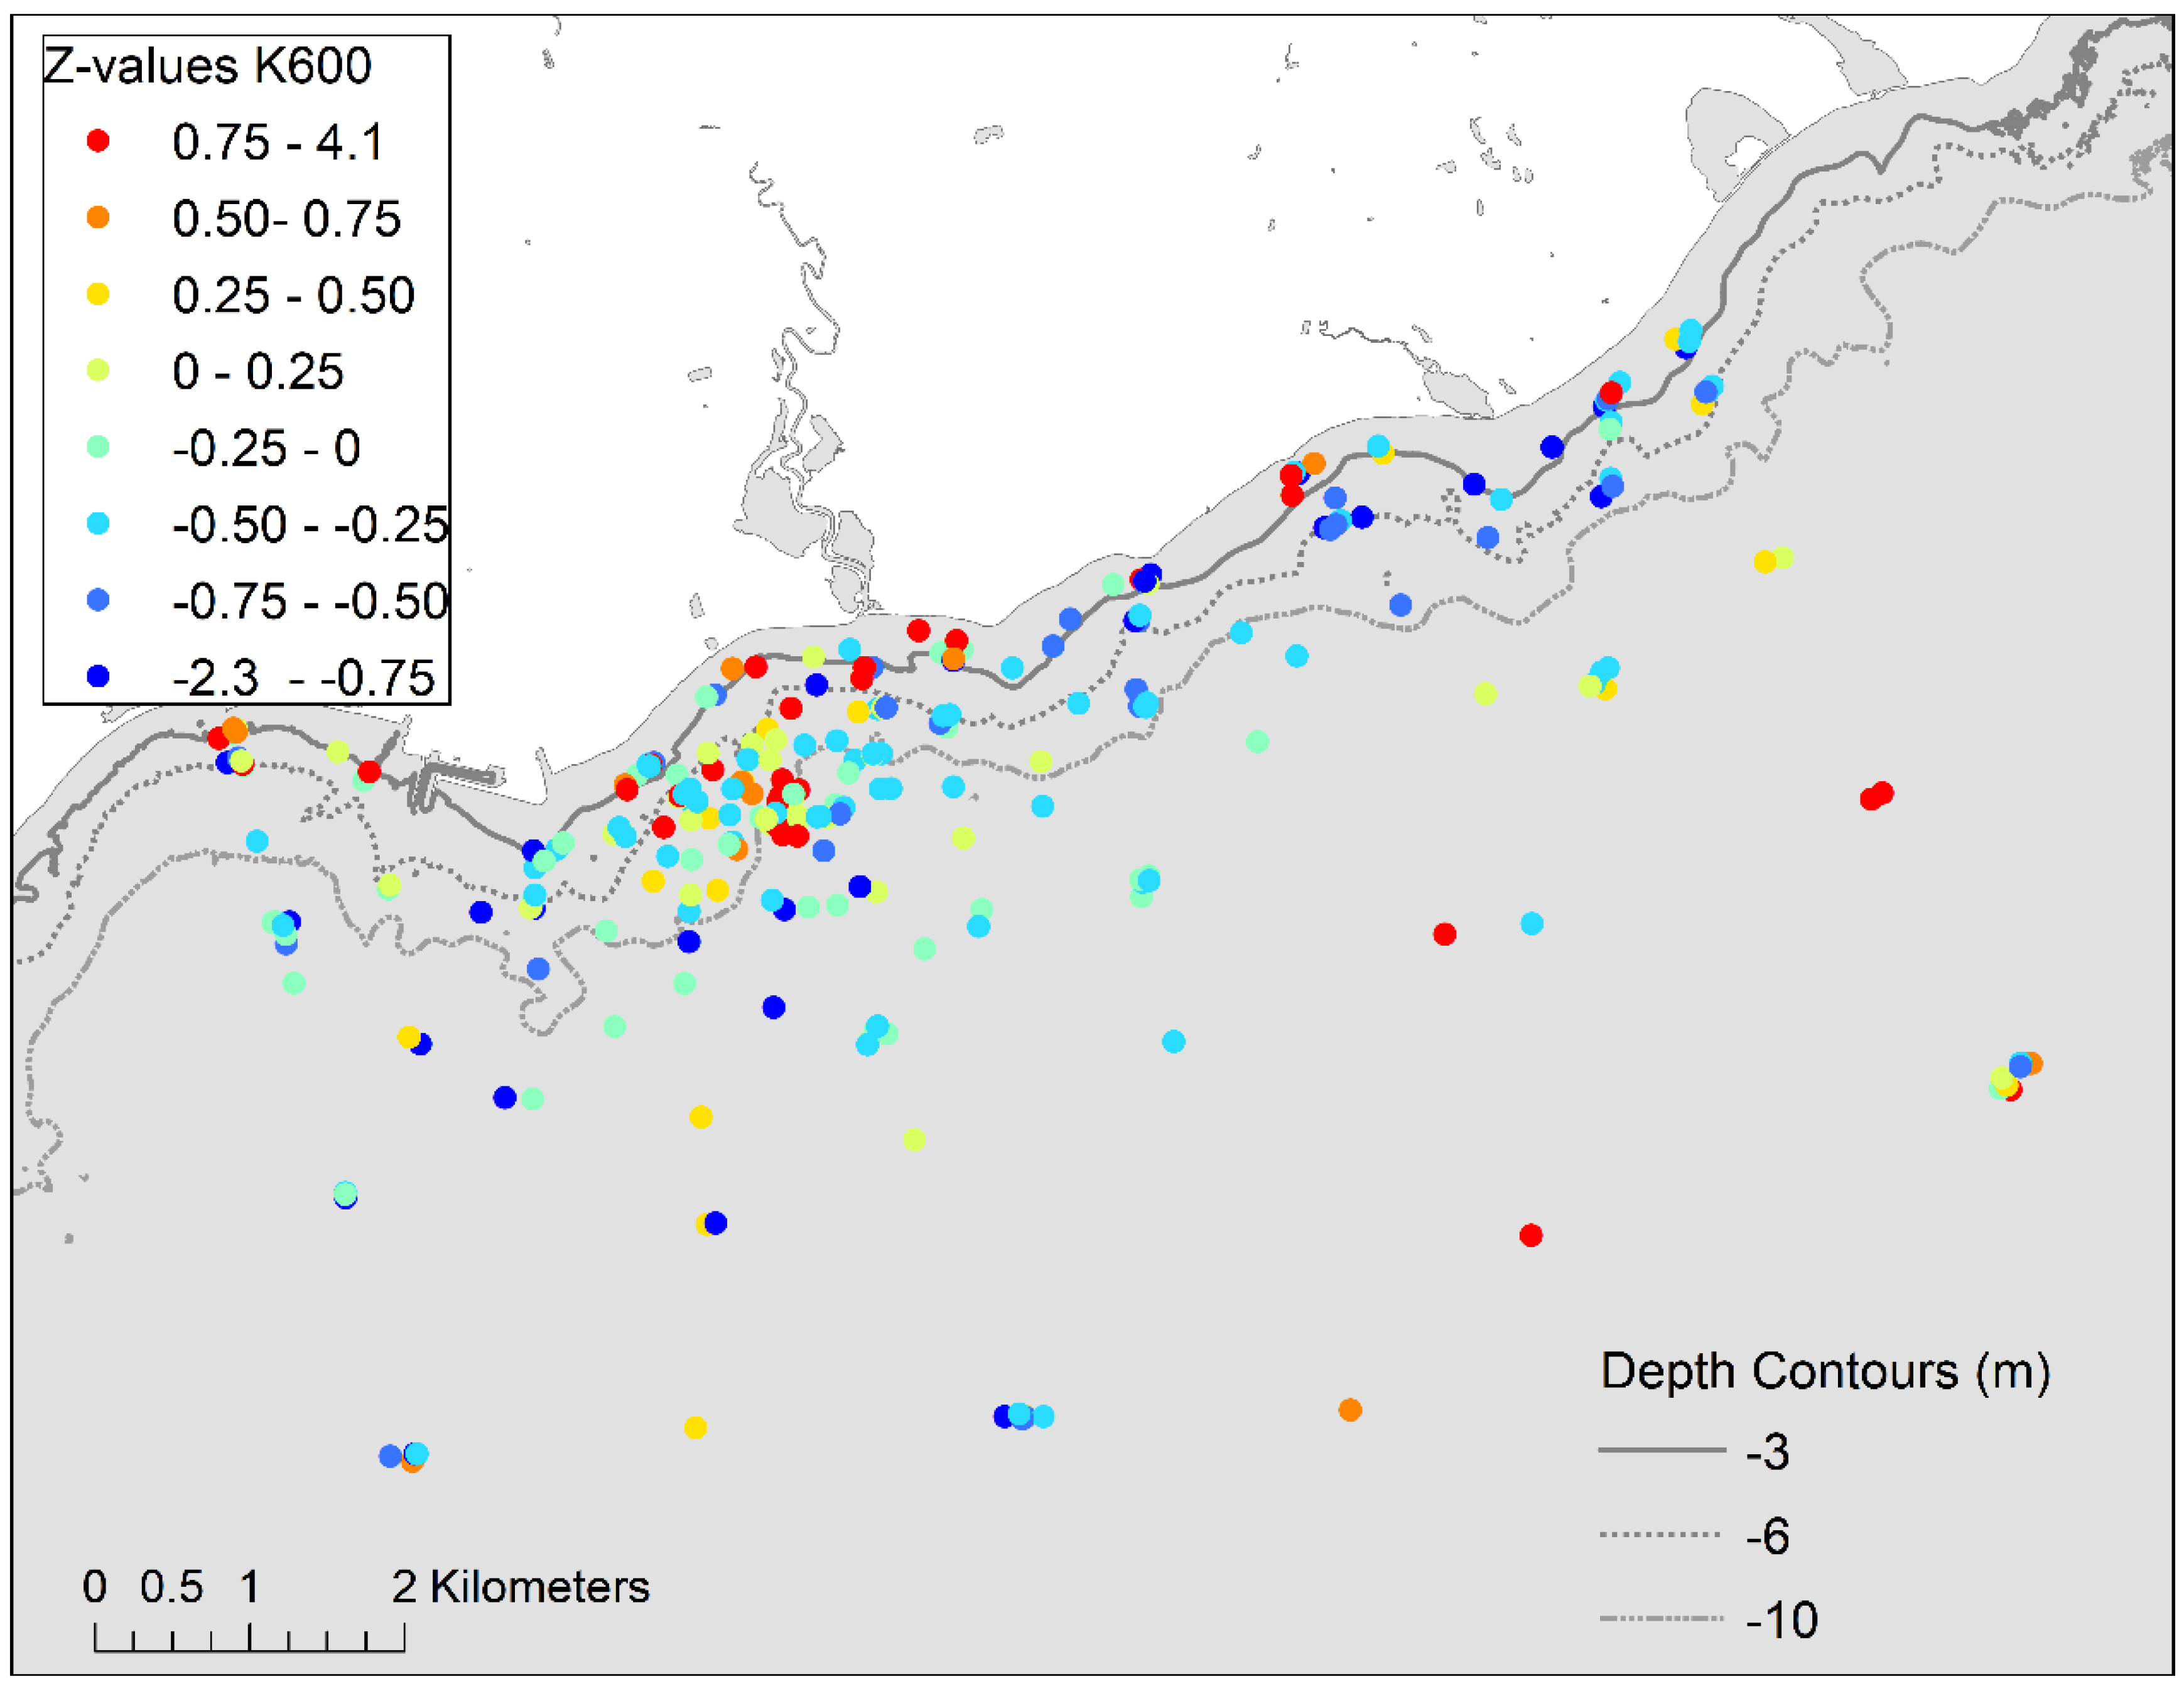
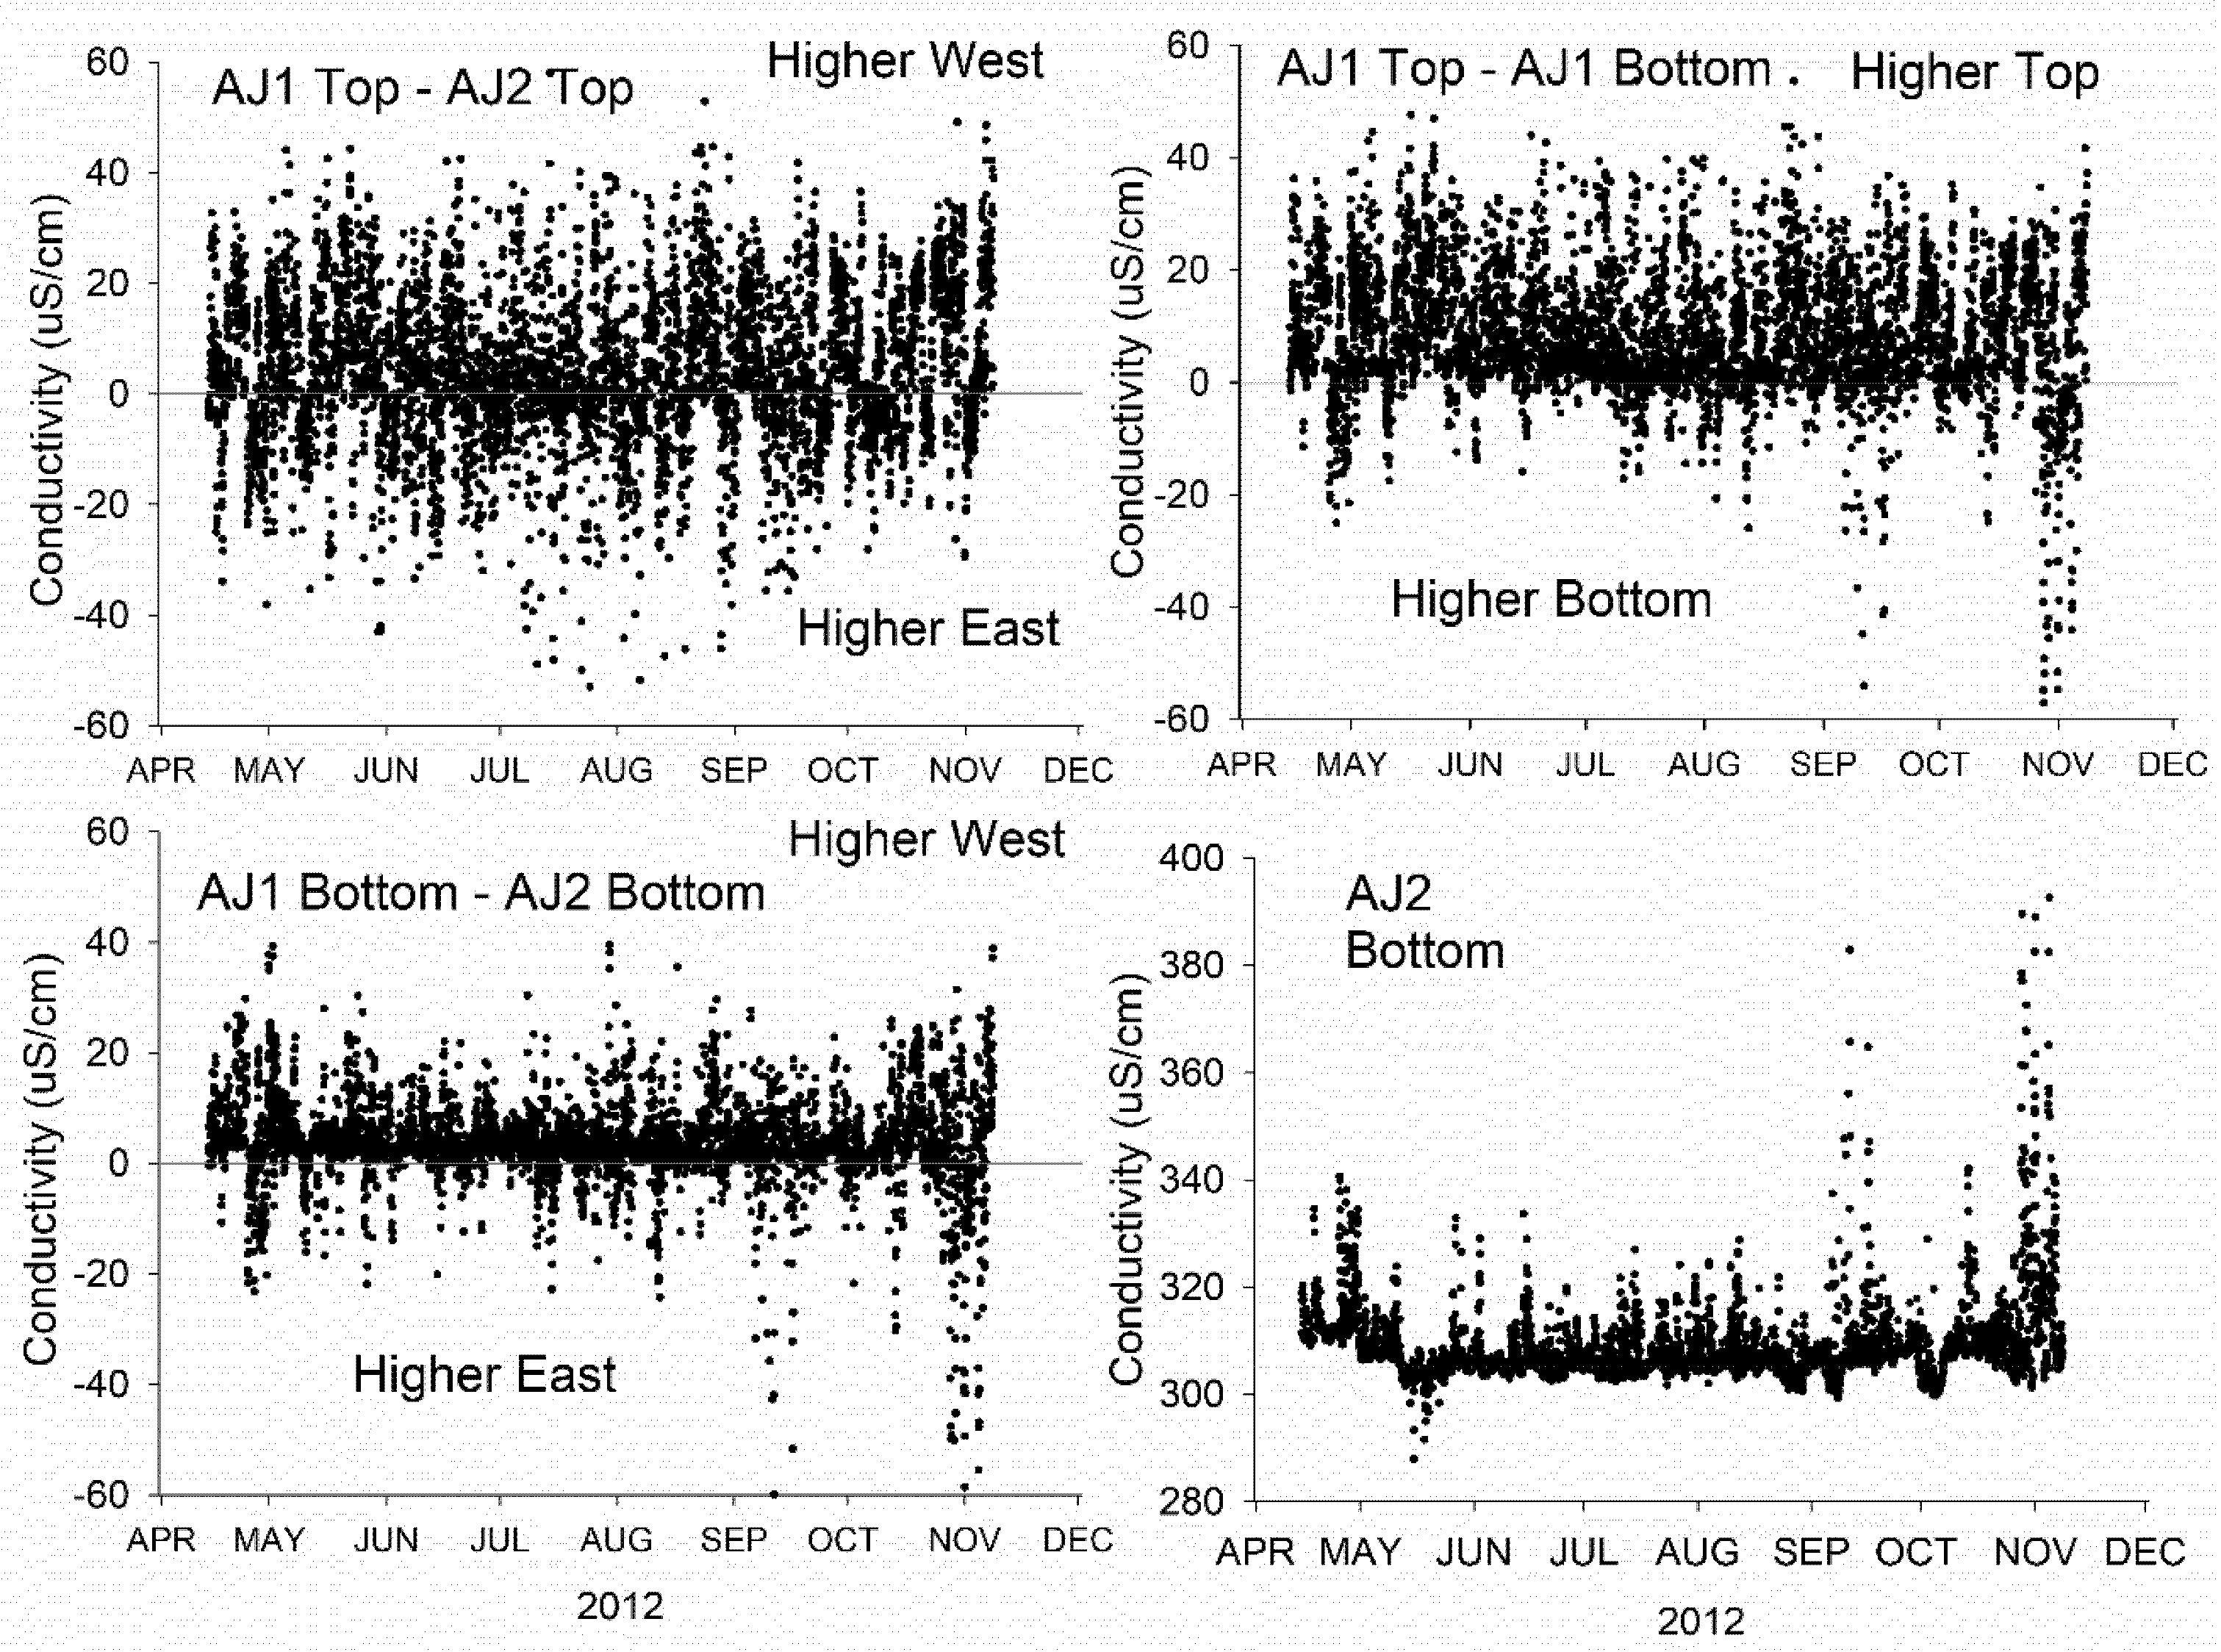
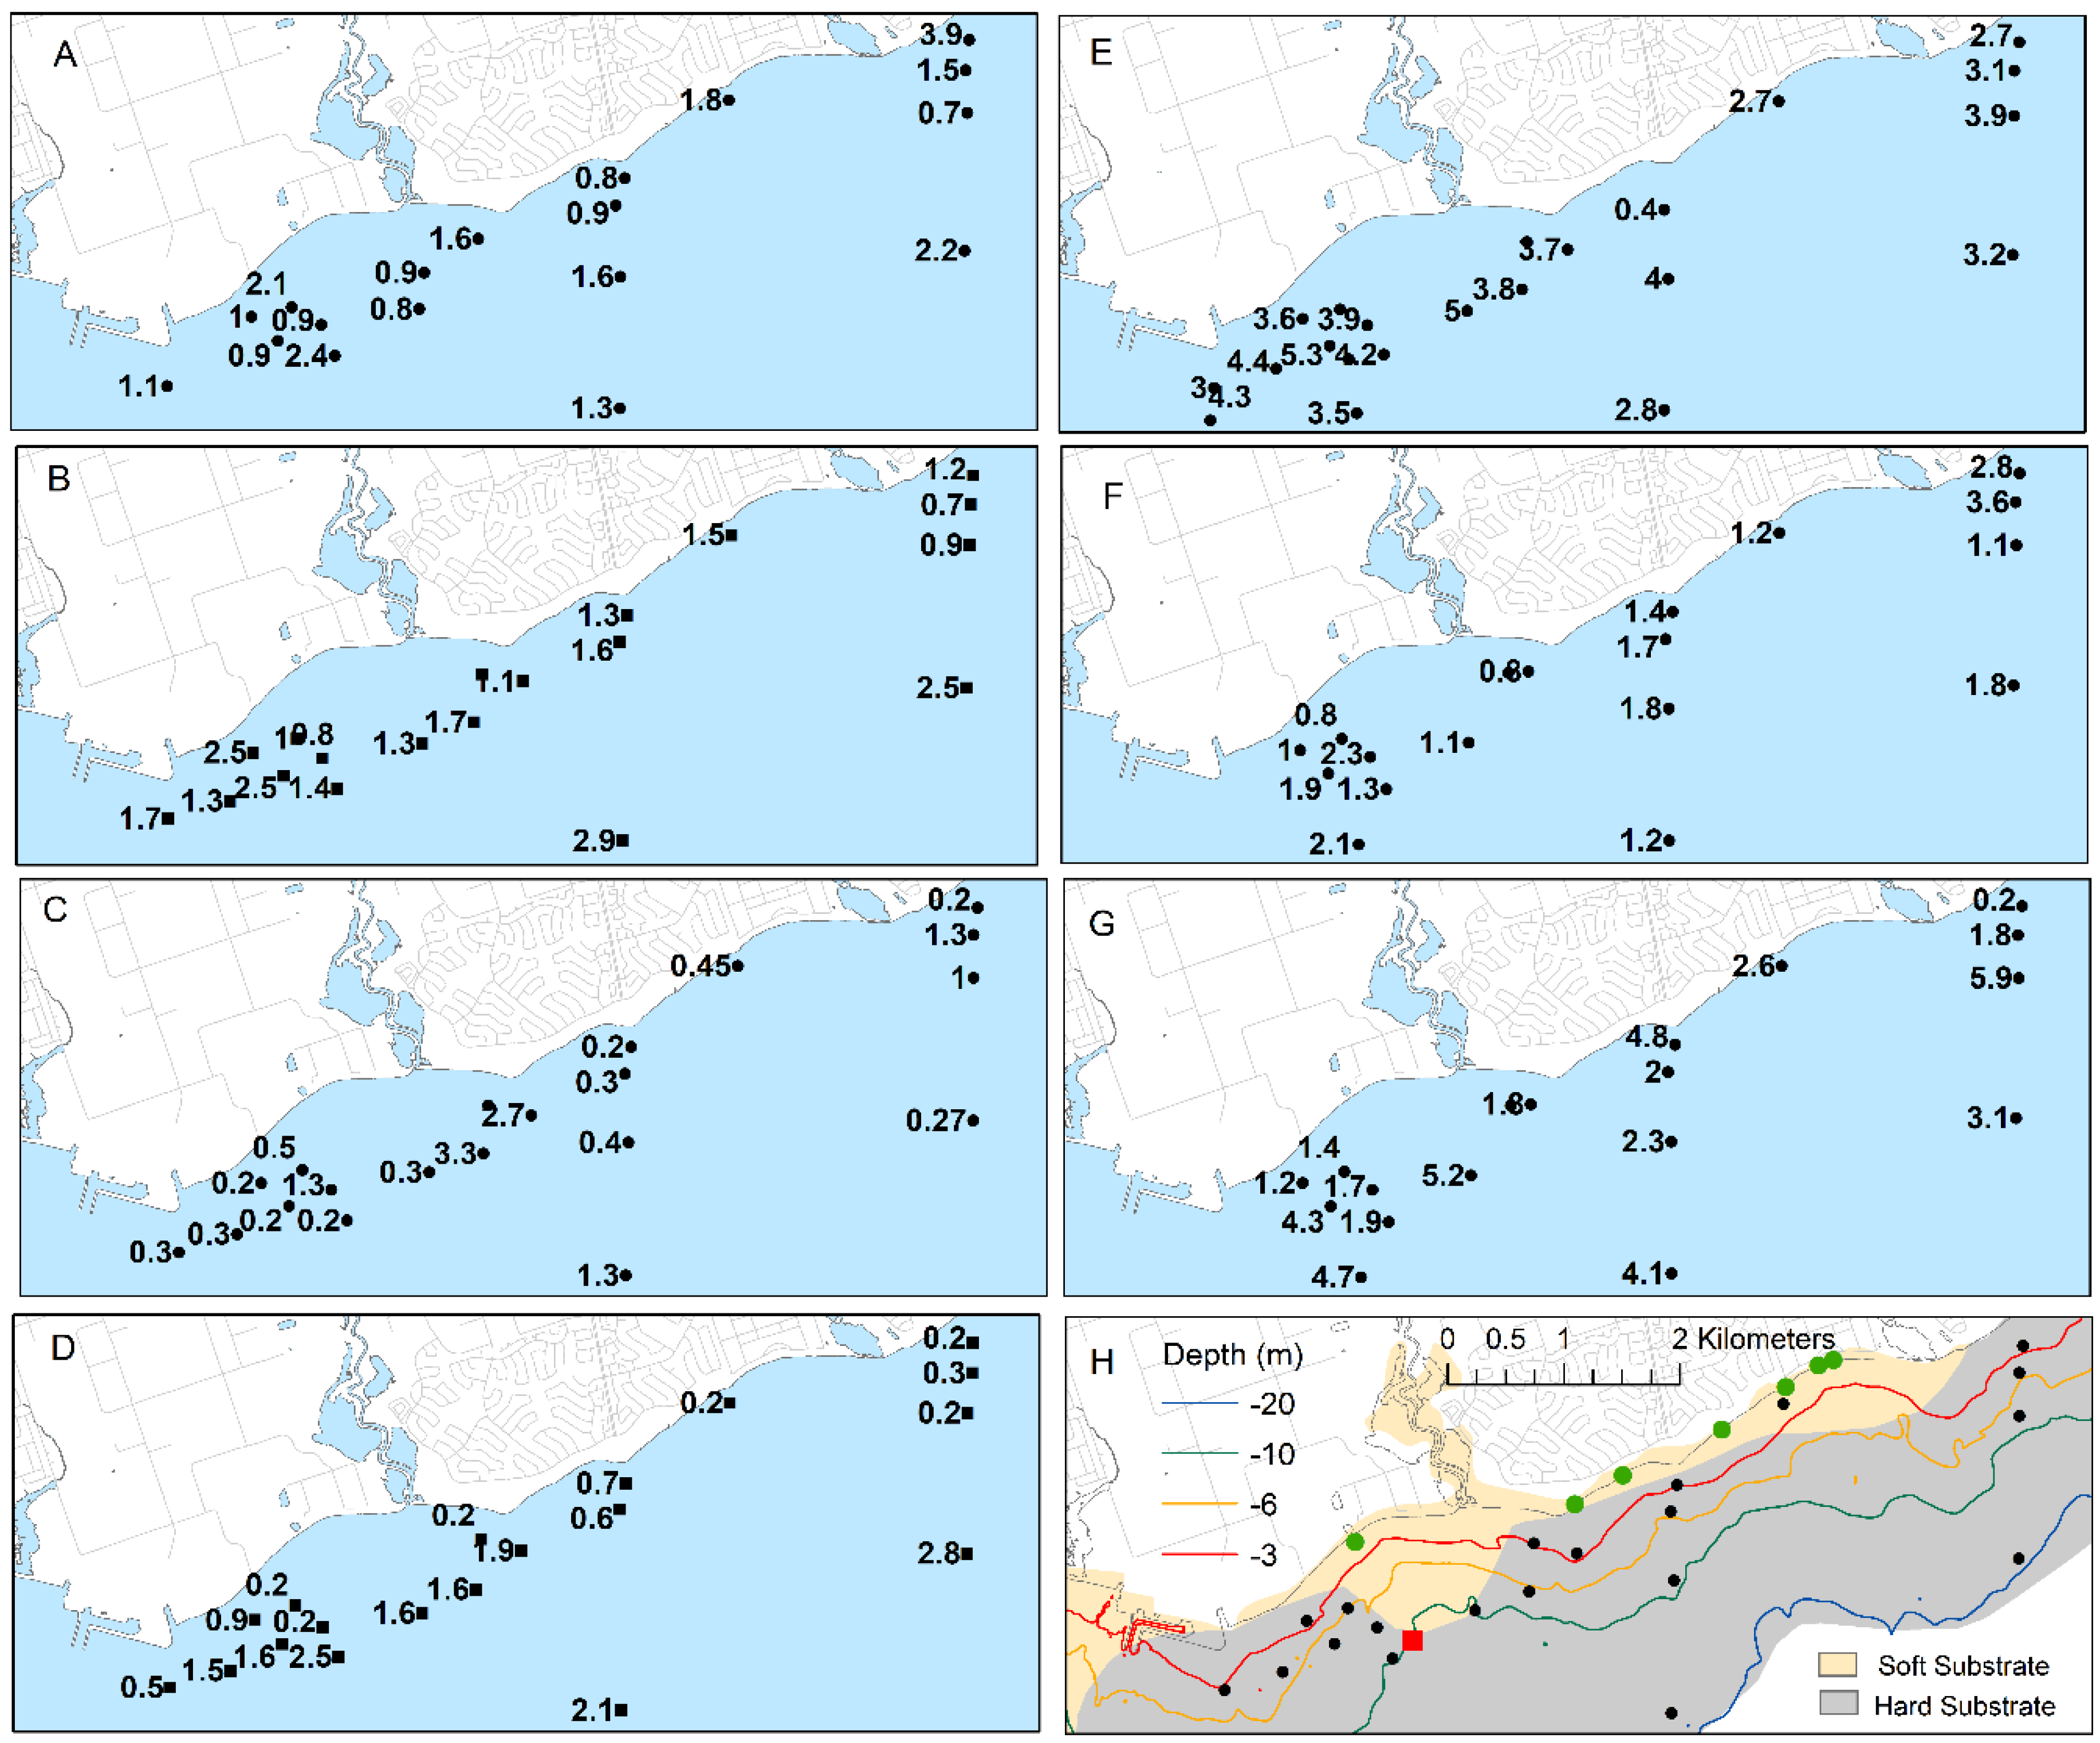
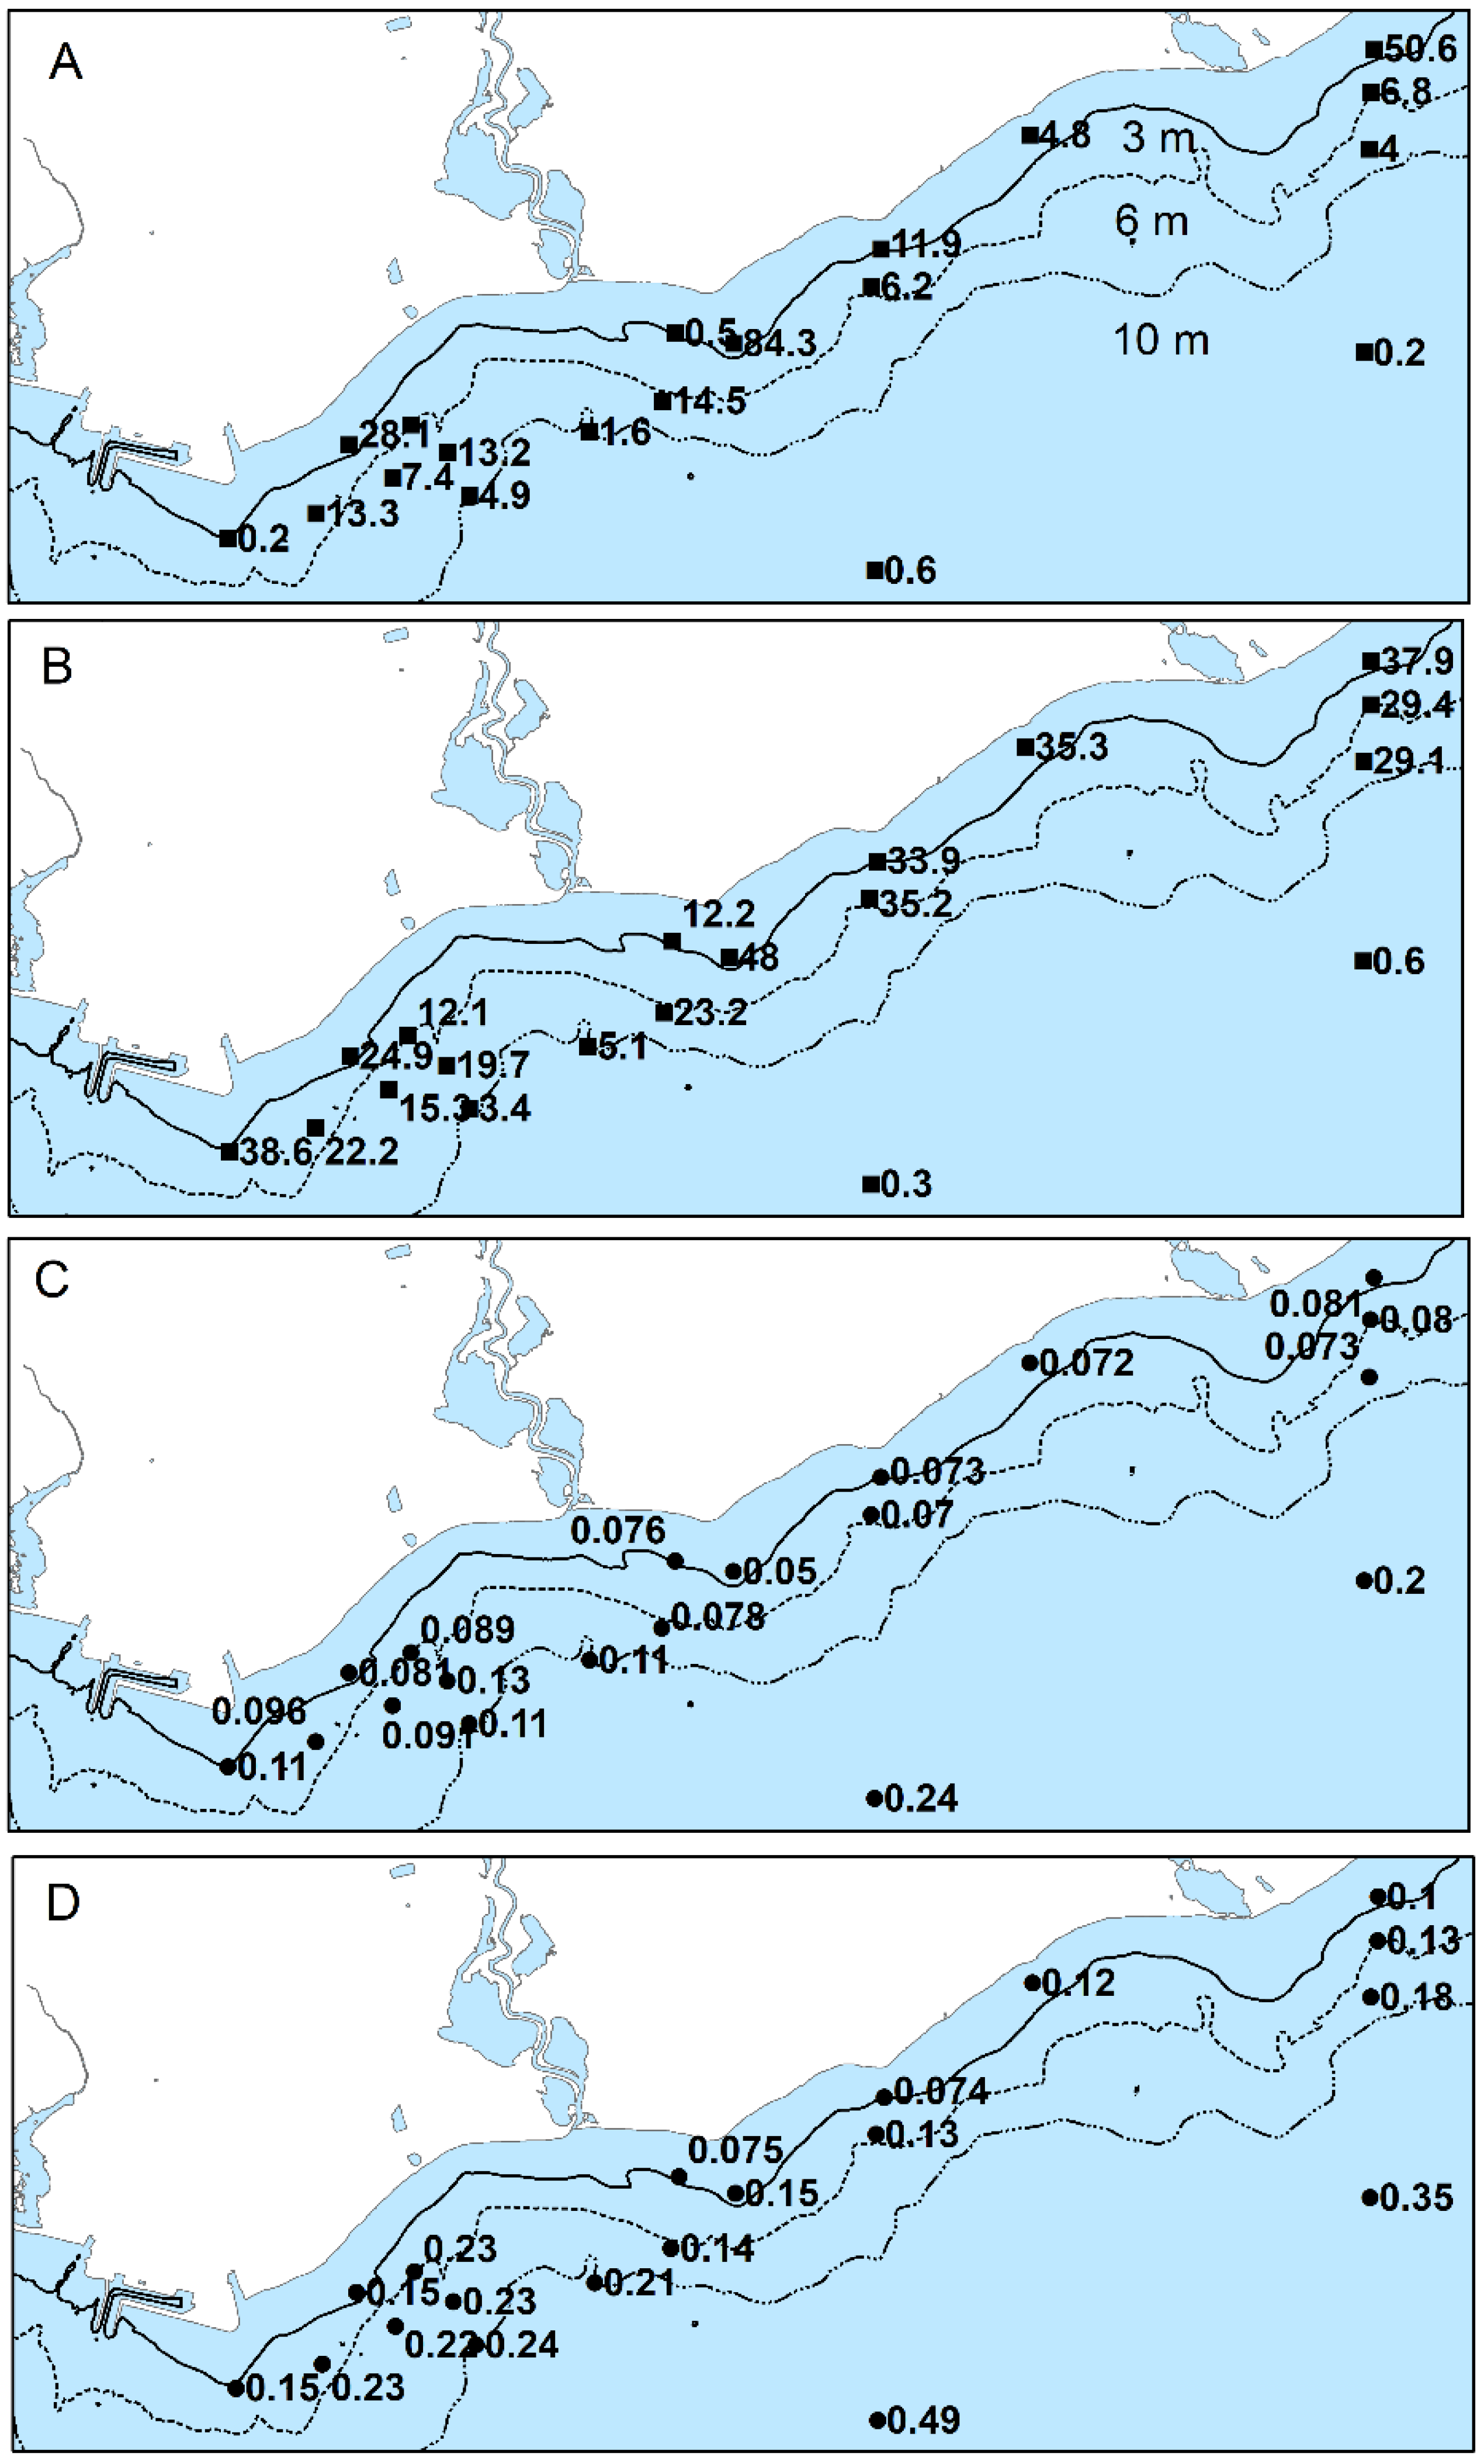
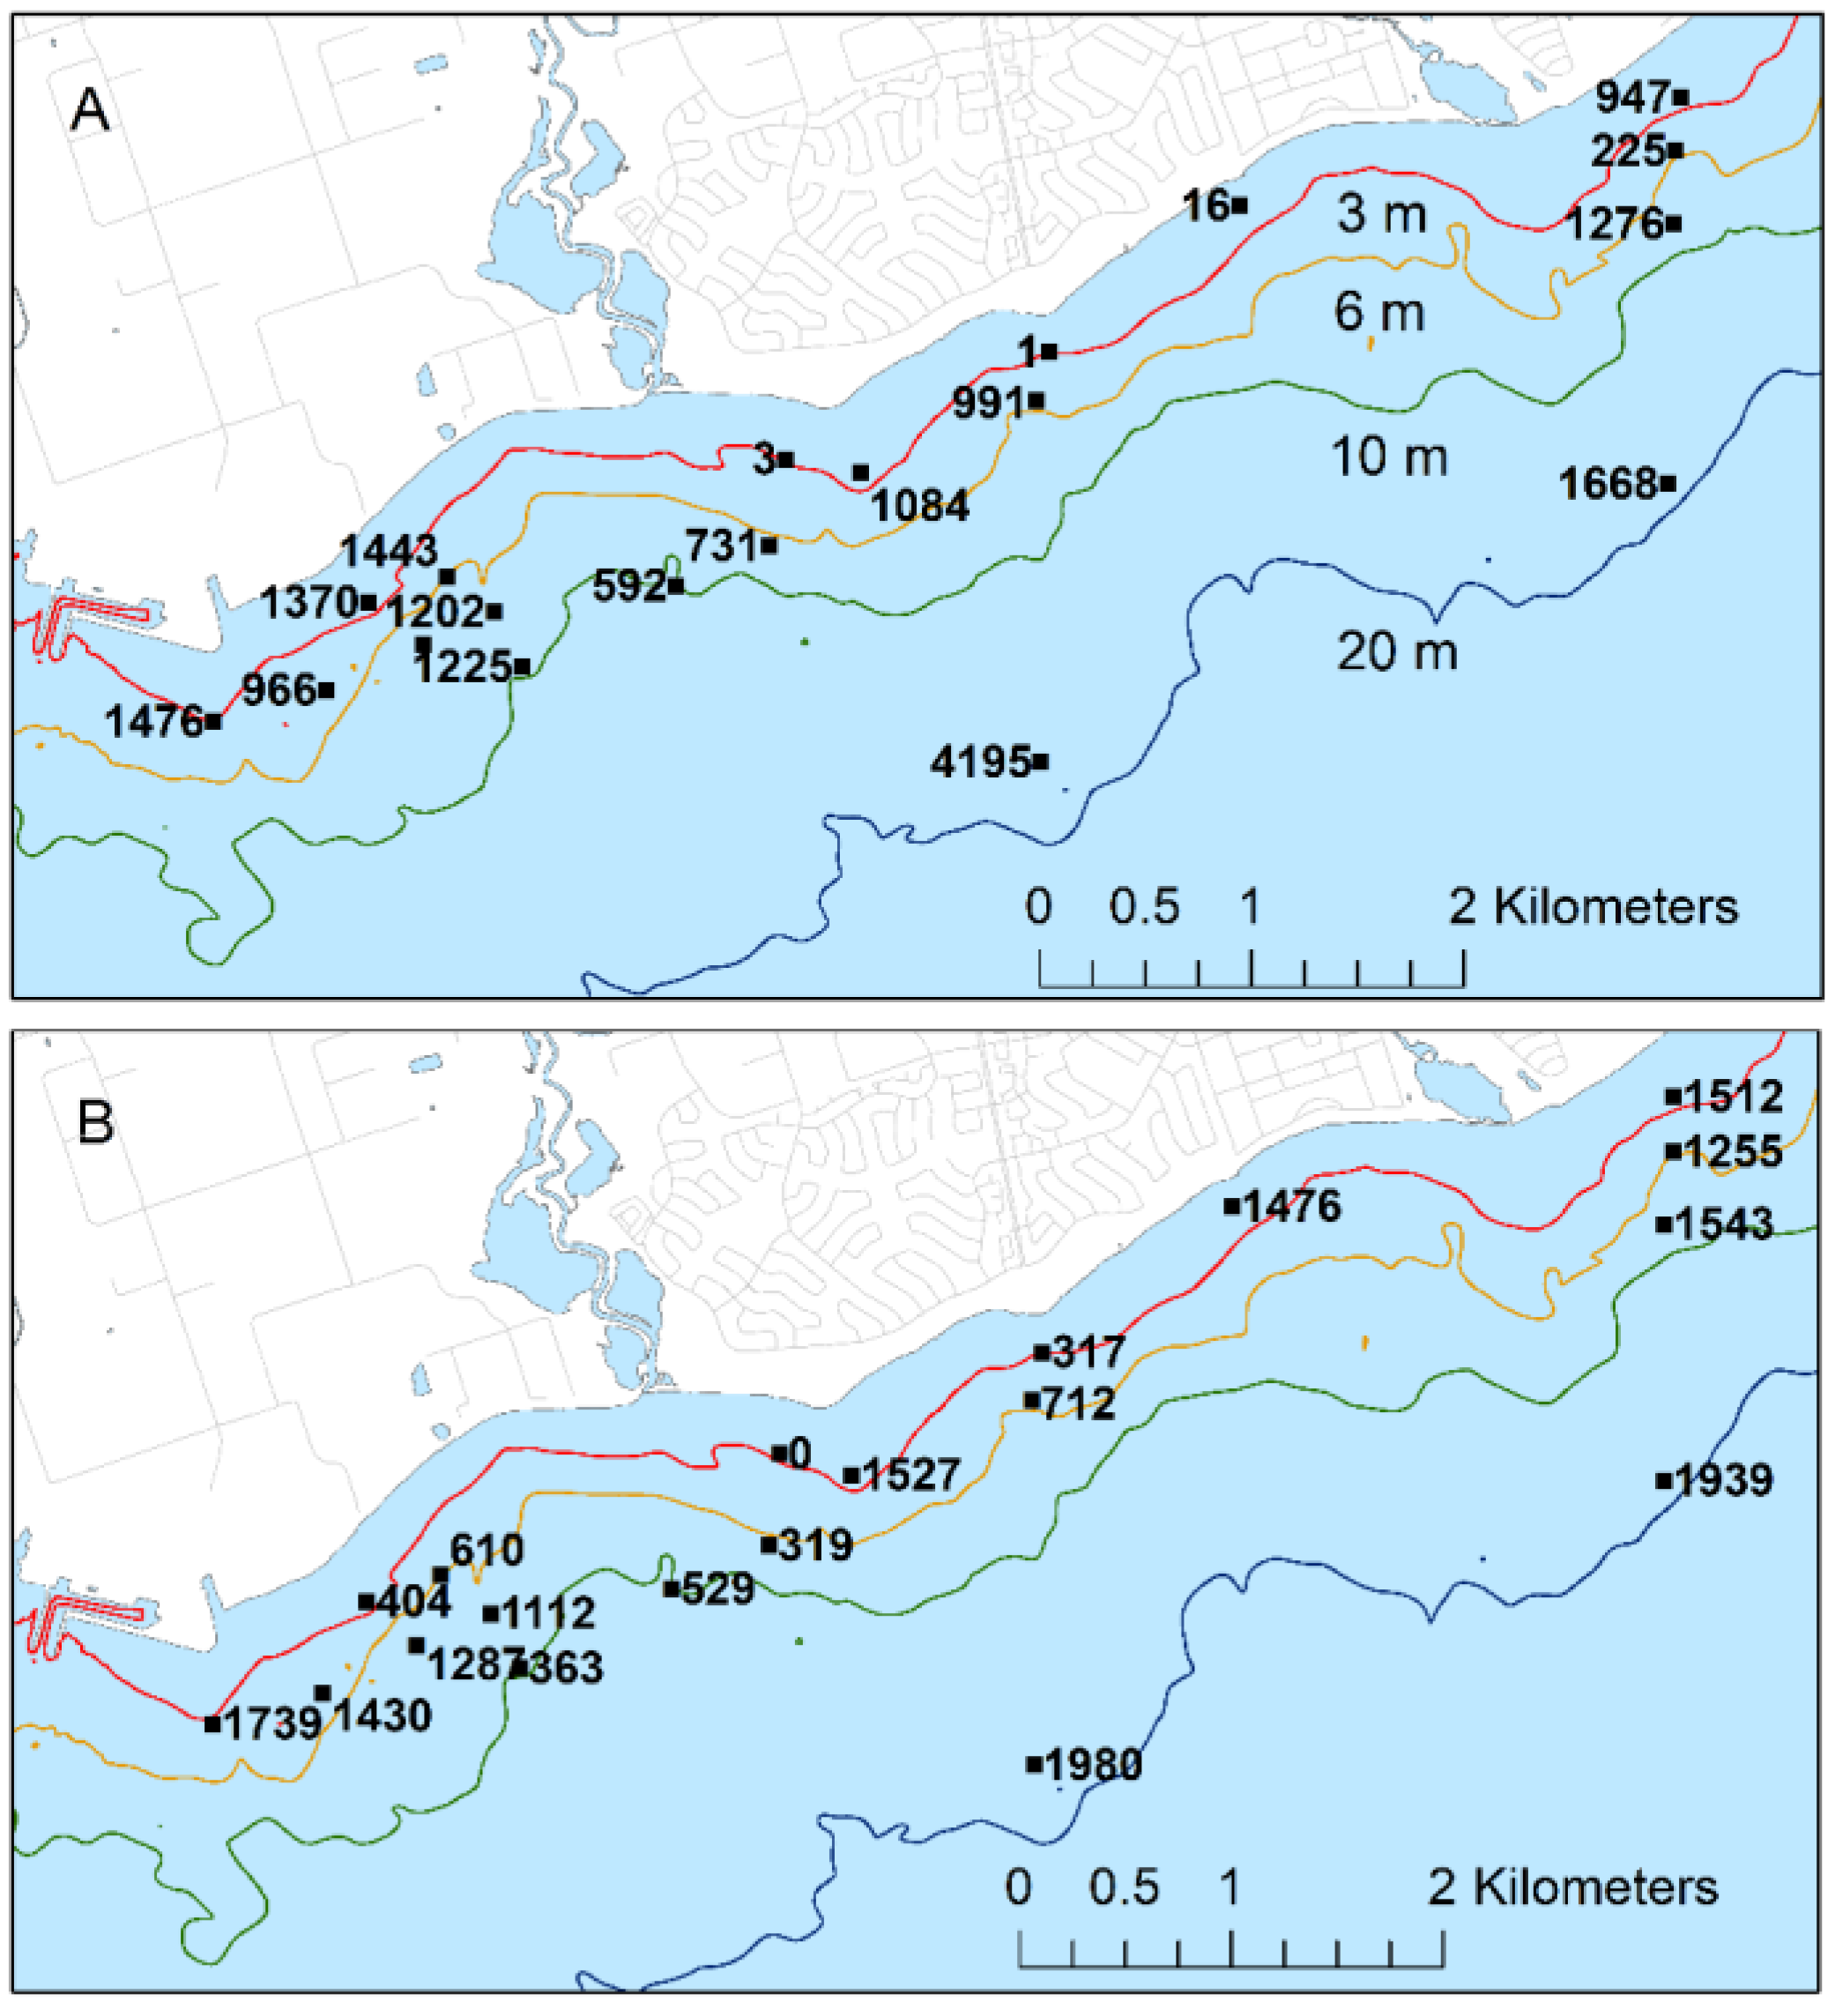
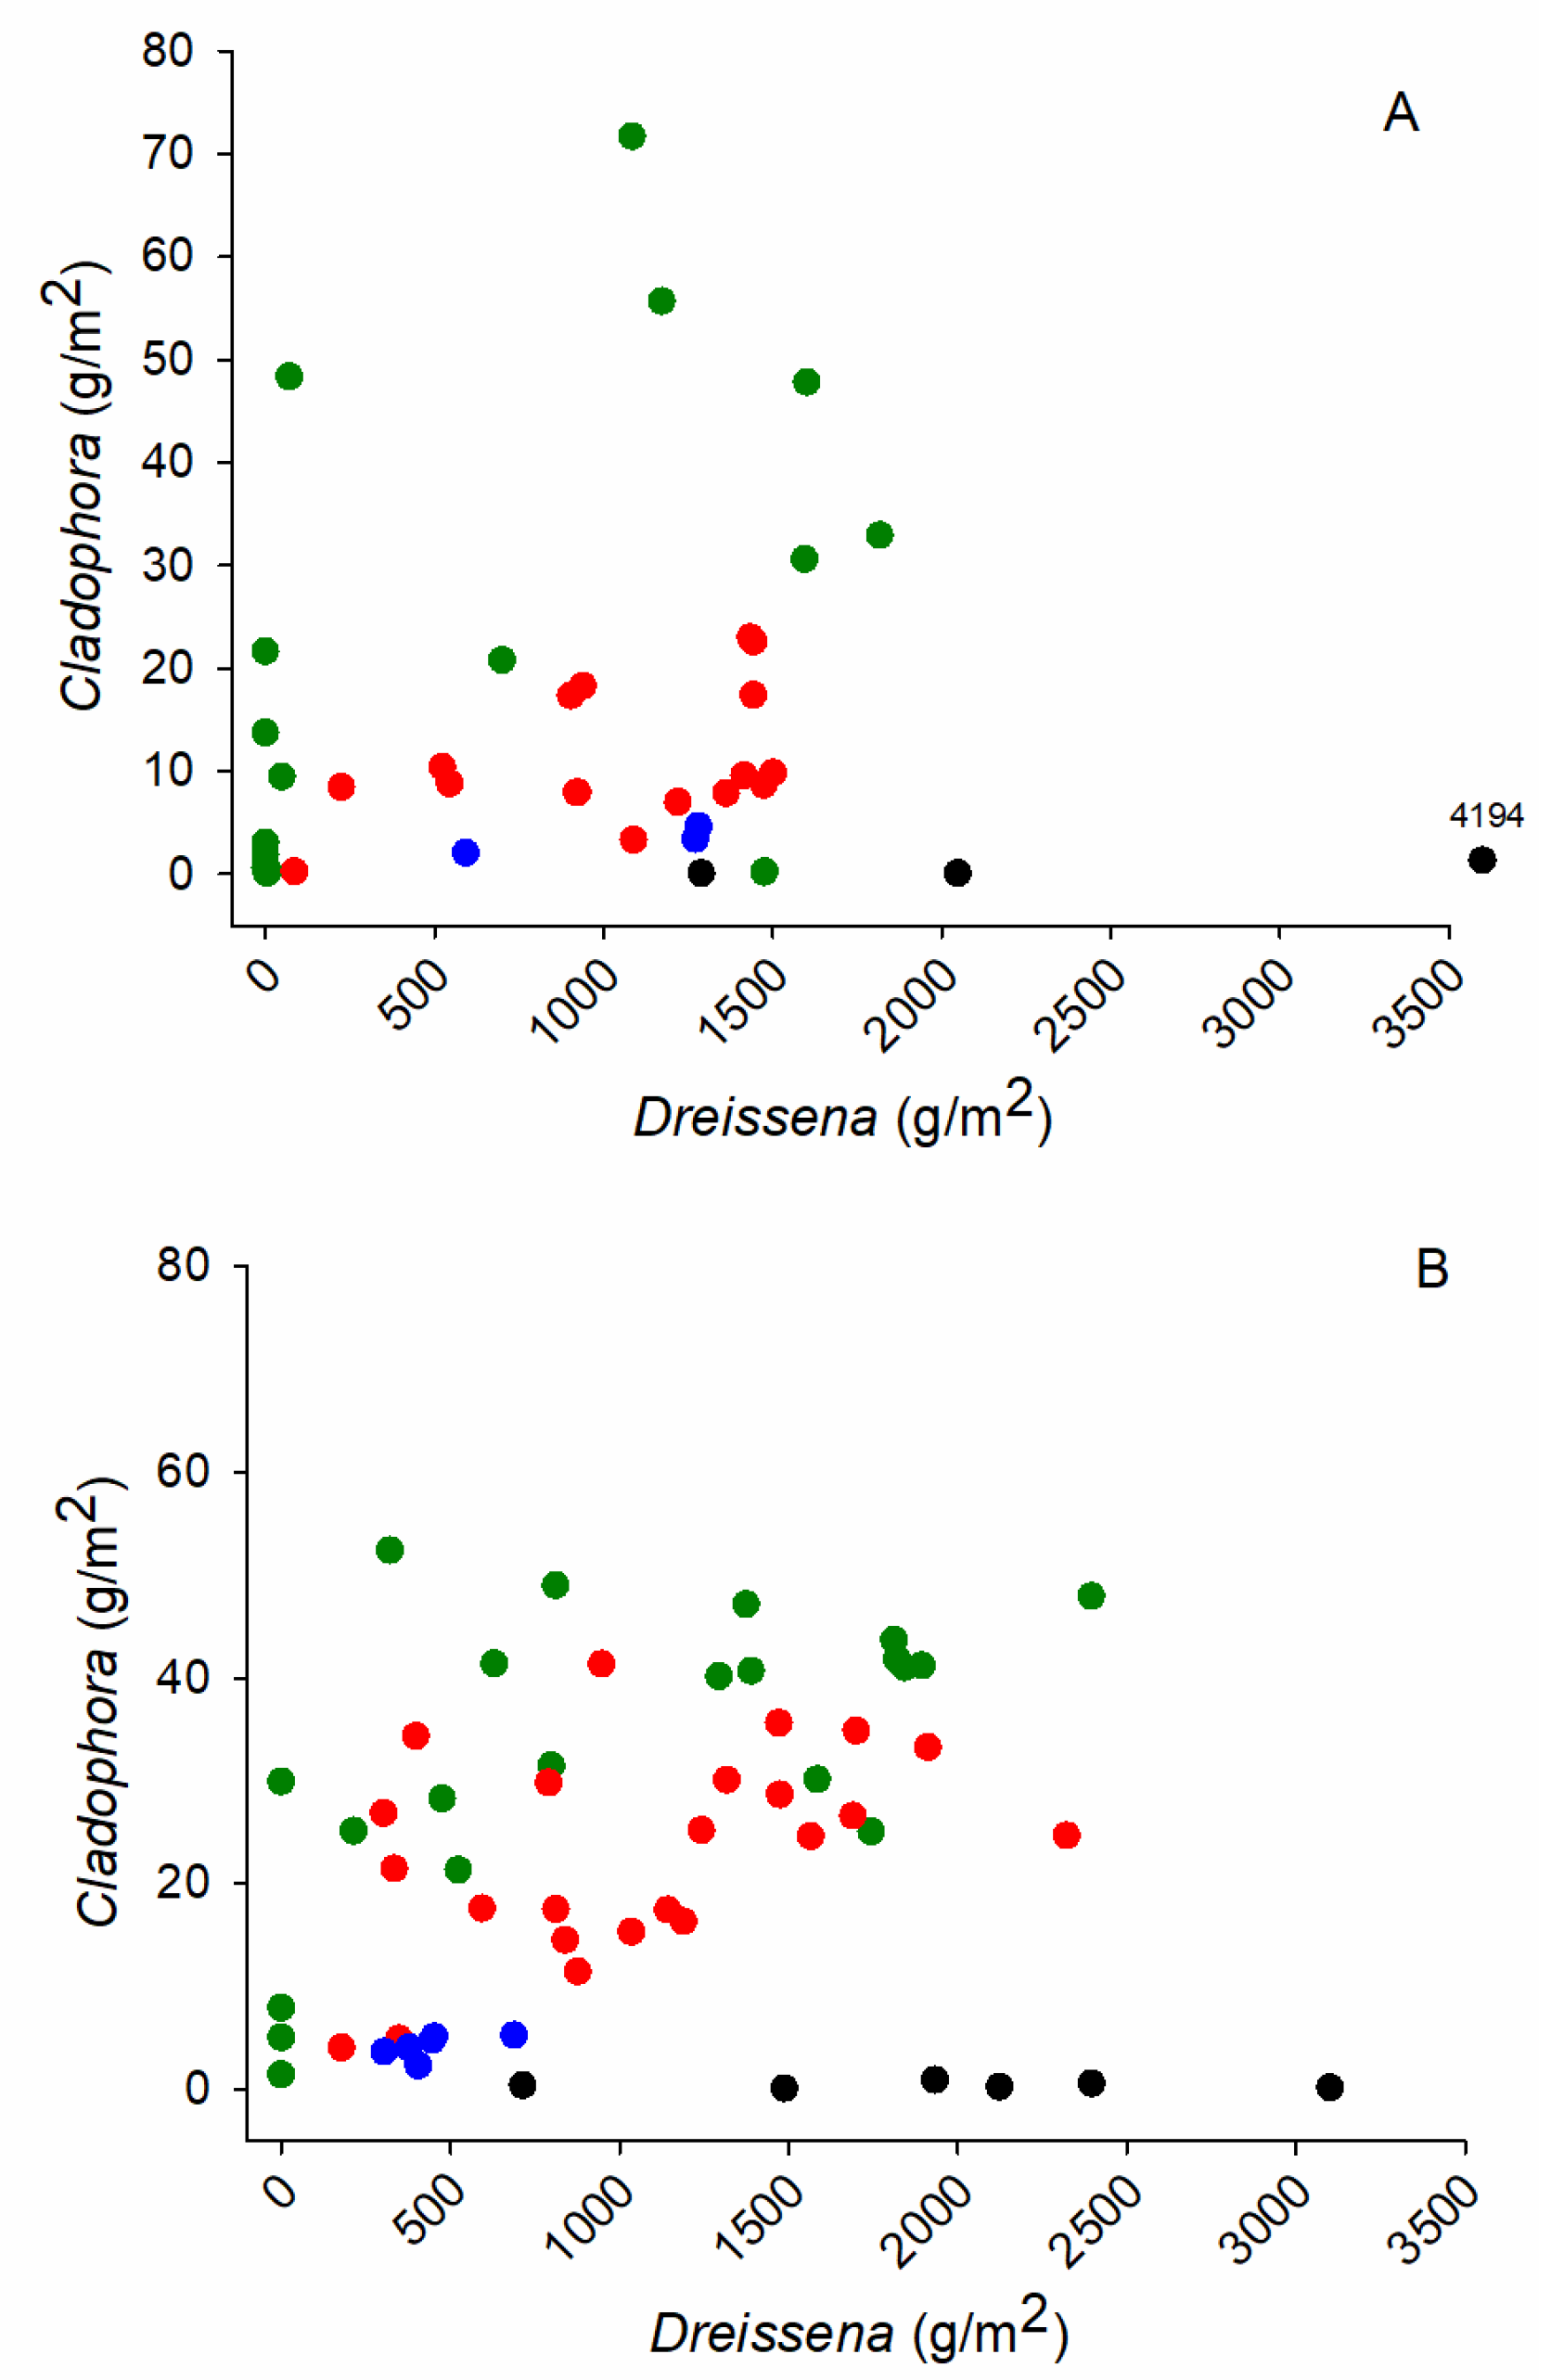
| (A) | |||||
|---|---|---|---|---|---|
| Parameter | Station Depth | Station Depth | Station Depth | Station Depth | Station Depth |
| 3 to 5 m | 5 to 8 m | 8 to 12 m | 12 to 25 m | >25 m | |
| TP (μg/L) | 7.6 (3.9–18.6) | 6.9 (3.0–16.2) | 8.8 (4.4–37.9) | 6 (4–7) | 4.7 (3.5–6.2) |
| DP (μg/L) | 4.4 (2.4–7.0) | 4.8 (2.9–8.9) | 5.4 (2.4–20.8) | 3.4 (2.4–5.7) | 2.7 (1.9–4.9) |
| Nitrate + Nitrite (μg/L) | 462 (245–678) | 504 (245–819) | 535 (251–1270) | 410 (237–592) | 409 (245–532) |
| Ammonia + Ammonium (μg/L) | 27 (14–70) | 29 (16–110) | 37 (15–93) | 28 (10–114) | 17 (6–38) |
| Silicates (mg/L) | 0.18 (0.04–1.20) | 0.25 (0.02–0.52) | 0.28 (0.08–0.52) | 0.29 (0.02–0.48) | 0.34 (0.16–0.60) |
| Chlorophyll a (μg/L) | 0.5 (0.2–2.2) | 0.4 (0.2–2.8) | 0.6 (0.2–2.1) | 0.5 (0.2–1.8) | 0.5 (0.2–1.7) |
| Suspended Solids (mg/L) | 0.7 (0.5–9.5) | 0.6 (0.25–1.9) | 0.5 (0.5–2.3) | 0.5 (0.5–2.1) | 0.5 (0.5–3.8) |
| Turbidity (FTU) | 0.7 (0.2–6) | 0.5 (0.2–1.1) | 0.43 (0.19–0.74) | 0.35 (0.19–0.49) | 0.24 (0.14–0.63) |
| Chloride (mg/L) | 25.1 (23.6–50.0) | 26.0 (23.5–34.2) | 27.3 (23.69–39.2) | 24.5 (23.7–32.1) | 23.8 (22.9–28.1) |
| Conductivity (uS/cm) | 317 (306–486) | 322 (306–361) | 324 (307–384) | 317 (306–353) | 310 (308–329) |
| DOC (mg/L) | 2.0 (1.7–2.7) | 1.9 (1.8–2.4) | 1.9 (1.8–2.2) | 1.9 (1.8–2.2) | 1.9 (1.7–2.1) |
| Calcium (mg/L) | 33.9 (31.5–51.4) | 34.0 (31.4–35.4) | 33.7 (31.6–35.1) | 33.3 (31.5–34.9) | 33.1 (31.7–34.1) |
| E. coli (CFU/100 mL) | 2 (2–38) | 2 (2–8) | 2 (2–42) | 2 (2–2) | 2 (2–2) |
| Fecal Streptococci (CFU/100 mL) | 2 (2–58) | 2 (2–4) | 2 (2–42) | 2 (2–58) | 2 (2–2) |
| Sample Number | 34 | 24 | 16 | 16 | 11 |
| SRP (μg/L) a | 0.7 (0.5–1.7) | 0.8 (<0.2–2.5) | 0.7 (0.4–3.3) | 1.1 (0.4–1.9) | nd |
| % DP of TP | 57 (33–97) b | 71 (36–94) b | 57 (38–87) | 63 (36–88) | 60 (48–83) |
| %Nitrate + Nitrite of TIN | 95 (87–97) | 95 (84–97) | 95 (83–97) | 95 (81–98) | 96 (87–99) |
| (B) | |||
|---|---|---|---|
| Parameter | Station Depth | Station Depth | Station Depth |
| 8 to 12 m | 12 to 25 m | >25 m | |
| TP (μg/L) | 7.0 (5.2–56.4) | 5.0 (3.9–7.3) | 4.3 (2.4–5.2) |
| DP (μg/L) | 5.6 (3.0–38.0) | 3.3 (1.8–5.4) | 3.2 (1.9–4.4) |
| Nitrate + Nitrite (μg/L) | 584 (298–2940) | 378 (269–541) | 397 (288–449) |
| Ammonia + Ammonium (μg/L) | 44 (12–73) | 19 (13–47) | 17 (6–47) |
| Silicates (mg/L) | 0.37 (0.2–0.74) | 0.30 (0.08–0.50) | 0.44 (0.18–0.52) |
| Suspended Solids (mg/L) | <0.5 (<0.5–2.2) | <0.5 (<0.5–2.7) | <0.5 (<0.5–1.6) |
| Turbidity (FTU) | 0.44 (0.24–0.83) | 0.27 (0.15–0.52) | 0.19 (0.13–0.62) |
| Chloride (mg/L) | 30.0 (23.9–56.7) | 23.7 (23.7–28.4) | 23.3 (23.0–24.1) |
| Conductivity (μS/cm) | 341 (312–465) | 312 (305–332) | 310 (304–315) |
| DOC (mg/L) | 2.1 (1.9–2.7) | 1.9 (1.5–2.0) | 1.8 (1.7–2.0) |
| Calcium (mg/L) | 34.1 (32.5–40.7) | 32.9 (31.8–34.3) | 32.6 (31.5–33.9) |
| % DP of TP | 67 (48–81) | 62 (38–93) b | 79 (50–86) |
| % Nitrate + Nitrite of TIN | 96 (89–98) | 95 (89–97) | 95 (88–99) |
| Sample Number | 8 | 16 | 11 |
Notes: a SRP data are for two survey events in 2013, June and July, respectively. SRP sample numbers for shallowest to deepest groupings are 10, 9, 13 and 4, respectively; b single result where DP exceeded TP was omitted from calculations.
Table 2.
Water quality variable correlations with PCA axes.
| Parameter | Axis 1 | Axis 2 | Axis 3 |
|---|---|---|---|
| Eigenvalue | 5.1 | 2.4 | 1.7 |
| Variability Explained (%) | 46 | 22 | 16 |
| TP | 0.73 | −0.25 | 0.58 |
| DP | 0.76 | 0.27 | 0.43 |
| Nitrate + Nitrite | 0.68 | −0.62 | 0.28 |
| Ammonia + Ammonium | 0.30 | 0.42 | 0.71 |
| Silicates | 0.23 | −0.65 | −0.36 |
| Chlorophyll a | −0.10 | 0.83 | −0.10 |
| Turbidity | 0.66 | 0.63 | −0.20 |
| Conductivity | 0.95 | −0.15 | −0.18 |
| Chloride | 0.95 | −0.10 | −0.14 |
| Calcium | 0.74 | 0.11 | −0.54 |
| DOC | 0.77 | 0.33 | −0.31 |
| Interpretation (order in decreasing scores on axis) | Land-affected to ambient lake | Spring to late summer | Duffin Creek WPCP outfall Influence |
Table 3.
Pearson correlation coefficients between field measurements of nitrate, CDOM fluorescence, conductivity, water temperature and depth with TP and DP for water quality sampling events in 2012 and 2013. The data were log10 transformed.
Table 3.
Pearson correlation coefficients between field measurements of nitrate, CDOM fluorescence, conductivity, water temperature and depth with TP and DP for water quality sampling events in 2012 and 2013. The data were log10 transformed.
| Survey 1 | Survey 2 | Survey 3 | Survey 4 | |||||
|---|---|---|---|---|---|---|---|---|
| TP | DP | TP | DP | TP | DP | TP | DP | |
| CDOM Fluorescence | 0.64 ** | 0.72 | 0.89 | 0.75 | 0.67 | 0.58 ** | 0.89 | 0.66 |
| Conductivity | 0.71 | 0.79 | 0.60 ** | 0.54 ** | 0.81 | 0.73 | 0.92 | 0.87 |
| Nitrate | 0.68 | 0.78 | 0.86 | 0.75 | 0.91 | 0.89 | 0.70 | 0.90 |
| Depth | ns | ns | ns | ns | ns | ns | no data | no data |
| Temperature | ns | ns | ns | ns | ns | ns | 0.37 * | 0.46 * |
| Sample Number | 21 | 21 | 26 | 26 | 25 | 25 | 29 | 29 |
Note: ns—p > 0.05; * significant at p < 0.05 and p > 0.01; ** significant at p < 0.01 and p > 0.001; no superscript—p < 0.001.
Table 4.
Frequency of current direction and average speed among 16 compass points at AJ3. Surface data are for averages of ADCP bins approximately 2 to 4 m from the surface. Near-bottom data are for bins approximately 2.5 to 4.5 m from the lakebed. Site depth is 13.9 m.
Table 4.
Frequency of current direction and average speed among 16 compass points at AJ3. Surface data are for averages of ADCP bins approximately 2 to 4 m from the surface. Near-bottom data are for bins approximately 2.5 to 4.5 m from the lakebed. Site depth is 13.9 m.
| Direction | Surface | Near Bottom | ||
|---|---|---|---|---|
| Percent of Time | Average Speed (cm/s) | Percent of Time | Average Speed (cm/s) | |
| N | 2.6 | 5.3 | 8.9 | 4.7 |
| NNE | 3.1 | 7.8 | 8.4 | 5.0 |
| NE | 6.8 | 11.8 | 7.6 | 6.1 |
| ENE | 12.9 | 13.5 | 3.0 | 4.4 |
| E | 6.9 | 8.6 | 1.5 | 3.5 |
| ESE | 4.3 | 5.8 | 1.6 | 3.4 |
| SE | 2.8 | 3.9 | 1.6 | 3.4 |
| SSE | 3.4 | 4.3 | 4.1 | 5.7 |
| S | 5.0 | 4.6 | 8.6 | 7.2 |
| SSW | 5.6 | 4.7 | 9.6 | 6.3 |
| SW | 7.4 | 5.8 | 11.3 | 6.0 |
| WSW | 18.5 | 9.8 | 11.7 | 5.9 |
| W | 11.6 | 10.1 | 6.6 | 4.7 |
| WNW | 2.9 | 5.2 | 4.9 | 4.0 |
| NW | 1.8 | 4.7 | 4.5 | 3.9 |
| NNW | 1.7 | 4.6 | 6.0 | 4.3 |
Table 5.
Average concentrations of dissolved phosphorus (DP μg/L) above the lakebed for site groupings based on distances from the Duffins Creek WPCP outfall and the mouth of Duffins Creek oriented along the WSW-ESE alongshore axis. The number of sample points in brackets.
Table 5.
Average concentrations of dissolved phosphorus (DP μg/L) above the lakebed for site groupings based on distances from the Duffins Creek WPCP outfall and the mouth of Duffins Creek oriented along the WSW-ESE alongshore axis. The number of sample points in brackets.
| DP (μg/L) | Duffins Creek WPCP | Duffins Creek Mouth | ||||||
|---|---|---|---|---|---|---|---|---|
| Depth | WSW | WSW | ESE | ESE | ESE | ESE | Offshore | |
| (m) | >1 km | 0–1 km | 0–1 km | 0–1 km | 1–2 km | >2 km | ||
| 2012 | ||||||||
| 24–25 May | <6 | 4.3 (1) | 4.2 (2) | - | 2.9 (1) | 6.1 (1) | 6.1 (3) | - |
| 6–10 | - | 3.9 (3) | 3.9 (2) | - | 2.5 (1) | 5.4 (1) | - | |
| 20 | - | - | - | - | - | - | 2.7 (2) | |
| 14–25 June | <6 | 3.3 (2) | 3.6 (2) | - | 3.1 (2) | 2.7 (2) | 2.7 (3) | - |
| 6–10 | - | 3.2 (3) | 2.4 (1) | 2.9 (1) | - | 2.9 (1) | - | |
| 20 | - | - | - | - | - | - | 4.5 (2) | |
| 5–9 July | <6 | 5.6 (2) | 3.8 (2) | - | 3.7 (2) | 3.7 (2) | 3.0 (3) | - |
| 6–10 | - | 4.2 (3) | 3.1 (1) | 4.0 (1) | 4.0 (1) | 3.0 (1) | - | |
| 20 | - | - | - | - | - | - | 3.8 (2) | |
| 13–16 August | <6 | 4.4 (2) | 3.9 (2) | - | 4.3 (2) | 3.1 (2) | 3.6 (3) | - |
| 6–10 | - | 5.0 (3) | 4.6 (1) | 5.0 (1) | - | 3.2 (1) | - | |
| 20 | - | - | - | - | - | - | 4.8 (2) | |
| 16–19 October | <6 | 5.3 (2) | 5.4 (2) | - | 5.1 (2) | 3.3 (1) | 4.5 (3) | - |
| 6–10 | 12.3 (1) | 8.5 (5) | 6.3 (1) | 5.1 (1) | 5.0 (1) | 5.3 (1) | - | |
| 20 | - | - | - | - | - | - | 4.3 (2) | |
| 2013 | ||||||||
| 12–13 June | <6 | - | 4.1 (2) | - | 3.5 (1) | 4.5 (2) | 4.8 (3) | - |
| 6–10 | - | 4.4 (4) | 3.4 (2) | - | 4.1 (1) | 3.6 (1) | - | |
| 20 | - | - | - | - | - | - | 4.2 (2) | |
| 30–31 July | <6 | - | 3.9 (2) | - | 6.0 (1) | 9.8 (2) | 3.5 (3) | - |
| 6–10 | - | 4.6 (4) | 3.8 (2) | - | 3.9 (1) | 10.5 (1) | - | |
| 20 | - | - | - | - | - | - | 5.0 (2) | |
Table 6.
Average concentrations of total inorganic nitrogen (TIN μg/L) above the lakebed for site groupings based on distances from the Duffins Creek WPCP outfall and the mouth of Duffins Creek oriented along the WSW-ESE alongshore axis. The number of sample points in brackets.
Table 6.
Average concentrations of total inorganic nitrogen (TIN μg/L) above the lakebed for site groupings based on distances from the Duffins Creek WPCP outfall and the mouth of Duffins Creek oriented along the WSW-ESE alongshore axis. The number of sample points in brackets.
| TIN | Duffins Creek WPCP | Duffins Creek Mouth | ||||||
|---|---|---|---|---|---|---|---|---|
| (μg/L) | Depth | WSW | WSW | ESE | ESE | ESE | ESE | Offshore |
| (m) | >1 km | 0–1 km | 0–1 km | 0–1 km | 1–2 km | >2 km | ||
| 2012 | ||||||||
| 24–25 May | <6 | 418 (1) | 321 (2) | - | 292 (1) | 284 (1) | 299 (3) | - |
| 6–10 | - | 398 (3) | 298 (2) | - | 299 (1) | 325 (1) | - | |
| 20 | - | - | - | - | - | - | 344 (2) | |
| 14–25 June | <6 | 252 (2) | 177 (2) | - | 251 (2) | 201 (2) | 230 (3) | - |
| 6–10 | - | 239 (3) | 280 (1) | 270 (1) | - | 261 (1) | - | |
| 20 | - | - | - | - | - | - | 307 (2) | |
| 5–9 July | <6 | 247 (2) | 198 (2) | - | 160 (2) | 169 (2) | 160 (3) | - |
| 6–10 | - | 251 (3) | 214 (1) | 203 (1) | 153 (1) | 195 (1) | - | |
| 20 | - | - | - | - | - | - | 216 (2) | |
| 13–16 August | <6 | 284 (2) | 264 (2) | - | 293 (2) | 237 (2) | 222 (3) | - |
| 6–10 | - | 343 (3) | 325 (1) | 330 (1) | - | 230 (1) | - | |
| 20 | - | - | - | - | - | - | 390 (2) | |
| 16–19 October | <6 | 552 (2) | 556 (2) | - | 532 (2) | 461 (1) | 499 (3) | - |
| 6–10 | 514 (1) | 549 (5) | 478 (1) | 481 (1) | 474 (1) | 518 (1) | ||
| 20 | - | - | - | - | - | - | 435 (2) | |
| 2013 | ||||||||
| 12–13 June | <6 | - | 459 (2) | - | 450 (1) | 366 (2) | 373 (3) | - |
| 6–10 | - | 427 (4) | 421 (2) | - | 391 (1) | 344 (1) | - | |
| 20 | - | - | - | - | - | - | 418 (2) | |
| 30–31 July | <6 | - | 366 (2) | - | 470 (1) | 378 (2) | 326 (3) | - |
| 6–10 | - | 381 (4) | 380 (2) | - | 428 (1) | 352 (1) | - | |
| 20 | - | - | - | - | - | - | 418 (2) | |
Table 7.
Linear regressions predicting nearbed SRP from DP and TIN and DP from TIN.
| Date (n) | Predict SRP (μg/L) | Predict DP (μg/L) | |||||||
|---|---|---|---|---|---|---|---|---|---|
| From DP | From TIN | From TIN | |||||||
| R2 (p) | Slope | Intercept | R2 (p) | Slope | Intercept | R2 (p) | Slope | Intercept | |
| May 2012 (18) | 0.27 (0.028) | 0.17 | 0.72 | ns | ns | ||||
| June 2012 (19) | 0.42 (0.003) | 0.58 | −0.33 | ns | ns | ||||
| July 2013 (20) | ns | ns | 0.40 (0.003) | 0.014 | |||||
| August 2012 (19) | 0.57 (<0.001) | 0.77 | −2.15 | 0.74 (<0.001) | 0.011 | −2.24 | 0.65 (<0.001) | 0.010 | 1.15 |
| October 2012 (22) | 0.51 (<0.001) | 0.51 | 0.85 | 0.29 (0.009) | 0.011 | −2.17 | 0.30 (0.008) | 0.016 | −2.82 |
| June 2013 (19) | 0.32 (0.01) | 0.56 | −0.76 | 0.23 (0.039) | 0.0078 | 4.76 | ns | ||
| July 2013 (18) | 0.34 (0.012) | 0.31 | 1.28 | ns | ns | ||||
| Summer (94) | 0.29 (<0.001) | 0.41 | −0.14 | 0.20 (<0.001) | 0.006 | −0.19 | 0.11 (0.0014) | 0.0055 | 2.44 |
| All (134) | 0.33 (<0.001) | 0.45 | −0.45 | 0.41 (<0.001) | 0.0077 | −0.74 | 0.14 (<0.001) | 0.0058 | 2.40 |
Table 8.
Dreissena and Cladophora surface cover at benthic sites grouped by distance from the mouth of Duffins Creek. Cover was estimated by divers on 14–25 June and 13–16 August 2012. Mean values of observations are given with minimum and maximum values in brackets (replicates at stations treated as individual results). N indicates the number of sample points in June and August, S1 and S2, respectively.
| Area | Depth (m) | N | Dreissena Cover (%) | Cladophora Cover (%) | Cladophora Height (cm) | |||
|---|---|---|---|---|---|---|---|---|
| S1/S2 | June | August | June | August | June | August | ||
| WSW of Duffins Creek | 3–5 | 6/6 | 40 | 35 | 45 | 55 | 5 | 6 |
| (20–80) | (15–60) | (10–80) | (30–60) | (3–7) | (4–7) | |||
| 5–8 | 12/12 | 50 | 50 | 50 | 45 | 6 | 5 | |
| (25–70) | (10–90) | (20–75) | (10–70) | (4–7) | (3–6) | |||
| 8–12 | 6/6 | 20 | 20 | 30 | 30 | 4 | 3 | |
| (15–30) | (10–30) | (20–60) | (15–55) | (4–5) | (2–3) | |||
| <2 km ENE of Duffins Creek | 3–5 | 9/9 | 10 | 20 | 40 | 45 | 5 | 4 |
| (0–45) | (0–55) | (<5–90) | (10–80) | (1–9) | (1–7) | |||
| 5–8 | 6/6 | 35 | 30 | 45 | 60 | 6 | 4 | |
| (5–70) | (10–40) | (<5–60) | (50–75) | (4–8) | (4–5) | |||
| 8–12 | nd | nd | nd | nd | nd | nd | nd | |
| >2 km ENE of Duffins Creek | 3–5 | 6/6 | 25 | 45 | 50 | 50 | 6 | 7 |
| (0–70) | (30–90) | (15–80) | (40–70) | (2–9) | (6–9) | |||
| 5–8 | 3/3 | 40 | 40 | 45 | 45 | 7 | 6 | |
| (10–70) | (20–60) | (35–50) | (25–60) | (6–9) | (6–6) | |||
| 8–12 | 3/3 | 90 | 40 | 85 | 60 | 4 | 7 | |
| (80–95) | (40–50) | (80–90) | (60–70) | (3–4) | (6–8) | |||
| Offshore Sites | 18–21 | 6/6 | 50 | 80 | 25 | 35 | 4 | 3 |
| (5–95) | (35–100) | (15–40) | (5–80) | (4–5) | (3–3) | |||
© 2018 by the author. Licensee MDPI, Basel, Switzerland. This article is an open access article distributed under the terms and conditions of the Creative Commons Attribution (CC BY) license (http://creativecommons.org/licenses/by/4.0/).
Share and Cite
MDPI and ACS Style
Howell, E.T. Influences on Water Quality and Abundance of Cladophora, a Shore-Fouling Green Algae, over Urban Shoreline in Lake Ontario. Water 2018, 10, 1569. https://doi.org/10.3390/w10111569
AMA Style
Howell ET. Influences on Water Quality and Abundance of Cladophora, a Shore-Fouling Green Algae, over Urban Shoreline in Lake Ontario. Water. 2018; 10(11):1569. https://doi.org/10.3390/w10111569
Chicago/Turabian StyleHowell, E. Todd. 2018. "Influences on Water Quality and Abundance of Cladophora, a Shore-Fouling Green Algae, over Urban Shoreline in Lake Ontario" Water 10, no. 11: 1569. https://doi.org/10.3390/w10111569
Note that from the first issue of 2016, this journal uses article numbers instead of page numbers. See further details here.