Analysis of the Public Flood Risk Perception in a Flood-Prone City: The Case of Jingdezhen City in China


1
State Key Laboratory of Hydrology-Water Resources and Hydraulic Engineering, Hohai University, Nanjing 210098, China
2
Department of Civil Engineering, Water and Environmental Management Research Centre, University of Bristol, Bristol BS8 1TR, UK
3
Institute of Management Science, Business School, Hohai University, Nanjing 211100, China
*
Authors to whom correspondence should be addressed.
Water 2018, 10(11), 1577; https://doi.org/10.3390/w10111577
Submission received: 13 October 2018
/
Revised: 31 October 2018
/
Accepted: 1 November 2018
/
Published: 4 November 2018
(This article belongs to the Special Issue Flood Risk and Resilience)
Abstract
:Understanding and improving public flood risk perception is conducive to the implementation of effective flood risk management and disaster reduction policies. In the flood-prone city of Jingdezhen, flood disaster is one of the most destructive natural hazards to impact the society and economy. However, few studies have been attempted to focus on public flood risk perception in the small and medium-size city in China, like Jingdezhen. Therefore, the purpose of this study was to investigate the public flood risk perception in four districts of Jingdezhen and examine the related influencing factors. A questionnaire survey of 719 randomly sampled respondents was conducted in 16 subdistricts of Jingdezhen. Analysis of variance was conducted to identify the correlations between the impact factors and public flood risk perception. Then, the flood risk perception differences between different groups under the same impact factor were compared. The results indicated that the socio-demographic characteristics of the respondents (except occupation), flood experience, flood knowledge education, flood protection responsibility, and trust in government were strongly correlated with flood risk perception. The findings will help decision makers to develop effective flood risk communication strategies and flood risk reduction policies.
1. Introduction
Natural disasters are a major threat to the social and economic structure and they can easily wipe out the wealth accumulated in the past. In the future, flood risk is projected to increase in many regions due to effects of climate change and an increased concentration of people and economic properties [1,2]. Besides, the natural disaster frequency appears to be increasing in recent years [3], and the threat to development and economic losses from flood disasters are increasing too. Although many efforts have been done to reduce the risk and damage from natural disasters, floods remain the most devastation natural hazard in the world (World Bank, 2012). In 2017, Emergency Events Database (EM-DAT) data showed 318 natural disasters in the world, affecting 122 countries. These disasters resulted in 9503 deaths, 96 million people affected, and $314 billion in economic losses. Among them, nearly 60% of the population affected by the disaster in 2017 were affected by the flood. Similar to previous years, China was the most disaster-affected country, with 25 events (c): 15 floods/landslides and 6 storms. During 2006–2015, flood disasters in China killed 6641 people, affected about one half billion people, and caused more than US$87.5 billion damage (https://www.cred.be).
In order to study and reduce the negative impact of flood disasters on society and economy, researchers began to pay attention to flood risk assessment and flood risk management. Many researchers studied the objective flood risk, such as flood occurrence probability, flood inundation, and economic loss based on risk perspective. Other researchers believe that the subjective factors of the individuals can influence the judgment of the objective flood disaster risk. One of the important factors is the individuals’ flood risk perception, and it has become an important topic to policy makers that are concerned with flood risk management [4]. Generally, risk perception refers to people’s beliefs, attitudes, judgements and feelings towards events, and researchers believe that flood risk perception is the direct cause of flood risk prevention awareness and response behaviors [5,6,7]. Studying people’s risk perception level is conducive to the implementation of effective flood risk management and disaster reduction policies, which has very important practical significance [8,9]. This is because:
- People’s behaviors are influenced by their risk attitudes towards the event;
- People with different characteristics have different attitudes toward the same kind of event, and this difference can be useful for improving flood risk control and management;
- Existing flood control engineering measures can reduce the real flood risk, but human behaviors is irrational, and their understanding of things is not sufficient, which can easily lead to behavioral deviation. It is difficult to achieve the desired results by only using technical means to reduce the risk of flooding;
- Residents are both victims of disasters and executors of flood disaster prevention and mitigation policies. Studying their flood risk perception is helpful to understand their attitudes towards policies and possible behaviors.
Actually, research on risk perception began in the 1940s, when Gilbert White published the human adjustments to floods in the United States [10]. White found that people’s behaviors could be directly affected by their previous flood experience, which created a precedent for study on human dimensions of risk in a multi-hazard environment [11,12]. The key early paper about public risk perception was written in 1960s by Chauncey Starr. Starr explored the correlation between the social acceptance of technological risks and the perception of social benefits and justified social costs from these technologies [13,14]. This method of revealed preference influenced the subsequent research. In 1978, Fischhoff and Slovic first proposed the use of psychometrics to assess risk. They used a scaled questionnaire of expressed preferences to directly capture people’s different perceptions of risk and benefits, responding to limitation of Starr’s revealed preference [15]. In the flood disasters area, relevant studies are based on their research, using psychological experiments and social surveys to assess people’s flood risk perceptions. These studies on flood risk perception are mainly:
- Identify and analyze a number of impact factors of flood risk perception. These impact factors include perception about the cause of hazard [9,22,23,24,25], previous flood experience [9,26,27,28,29], respondent’s demographics [27,28], geographic location [28,30], residential history [28,31], the perception of responsibilities [32,33,34], trust in local government or institutions [27,33], different information source [30,35,36], and the public knowledge of risk mitigation actions [28,33,35].
- Study the application of flood risk perception in actual flood disaster reduction [27,33,37,38]. For example, Daniel, etc. found the households’ choice to purchase flood insurance was positively and significantly correlated with risk preference data and subjective risk perception data [38]. Paul, etc. studied the flood risk perception and implications for flood risk management such as flood protection plans in the Netherlands [37].
- Study different risk perception measurement paradigms and indicators of risk perception. Psychometric paradigm and heuristics were the influential and popular theoretical framework in risk perception research [15,39,40]. With regard to the indicators of risk perception, Miceli indicate that flood risk perception encompasses both cognitive (likelihood, knowledge, etc.) and affective (feelings, perceived control, etc.) aspects. Most studies use a different set of items to measure the flood risk perception. However, Gotham [41] and Horney [42] measured the risk perception with only one item or question.
Although China is a country with a long history of flood disasters, few studies have assessed the flood risk perception and analyzed the influence factors of flood risk perception. Kellens reviewed 57 studies of flood risks perception in leading journals and found the study of flood risk perception is mainly in the Western world (more than 40 studies) [43]. Related research in China is still in its infancy, and the published literature is very limited. Besides, the current study areas were usually rural area or the area near the river, less concerned about the differences of flood risk perception in different regions of the same small and medium-sized and flood prone city. Given the lack of research of flood risk perception in China and the significance and important role of risk perception research in flood risk management, the aims of this study are
- to evaluate the public flood risk perception in Jingdezhen City and compare the flood risk perception differences between the different districts,
- identify the key impact factors of the flood risk perception of respondents,
- to examine the influence of the impact factors of the flood risk perception, and
- to discuss the recommendations for the flood risk reduction measures based on the public flood risk perception.
2. Materials and Methods
2.1. Study Area
The study was undertaken in the Jingdezhen City as it is seriously affected by floods almost every year, causing huge economic losses and wide impacts. At the same time, Jingdezhen City is a typical small and medium-sized city in China, with rapid social and economic development. The local economic structure is more fragile than the bigger cities, and the structure and function of the river network can be more easily damaged.
In addition, the Jingdezhen government is also actively developing Integrated Flood Risk Management Plan to reduce the flood risk and it is expected to provide reference for other small and medium-sized cities in China. The concept of the plan is fully realized by the transition from flood control to flood risk management, combining engineering and non-engineering measures to form a comprehensive flood control and disaster reduction system for cities and meeting the needs of the whole society for water security. Therefore, it is very practical to choose Jingdezhen City as a research area. This study is one part of the proposed Integrated Flood Risk Management in Jingdezhen City.
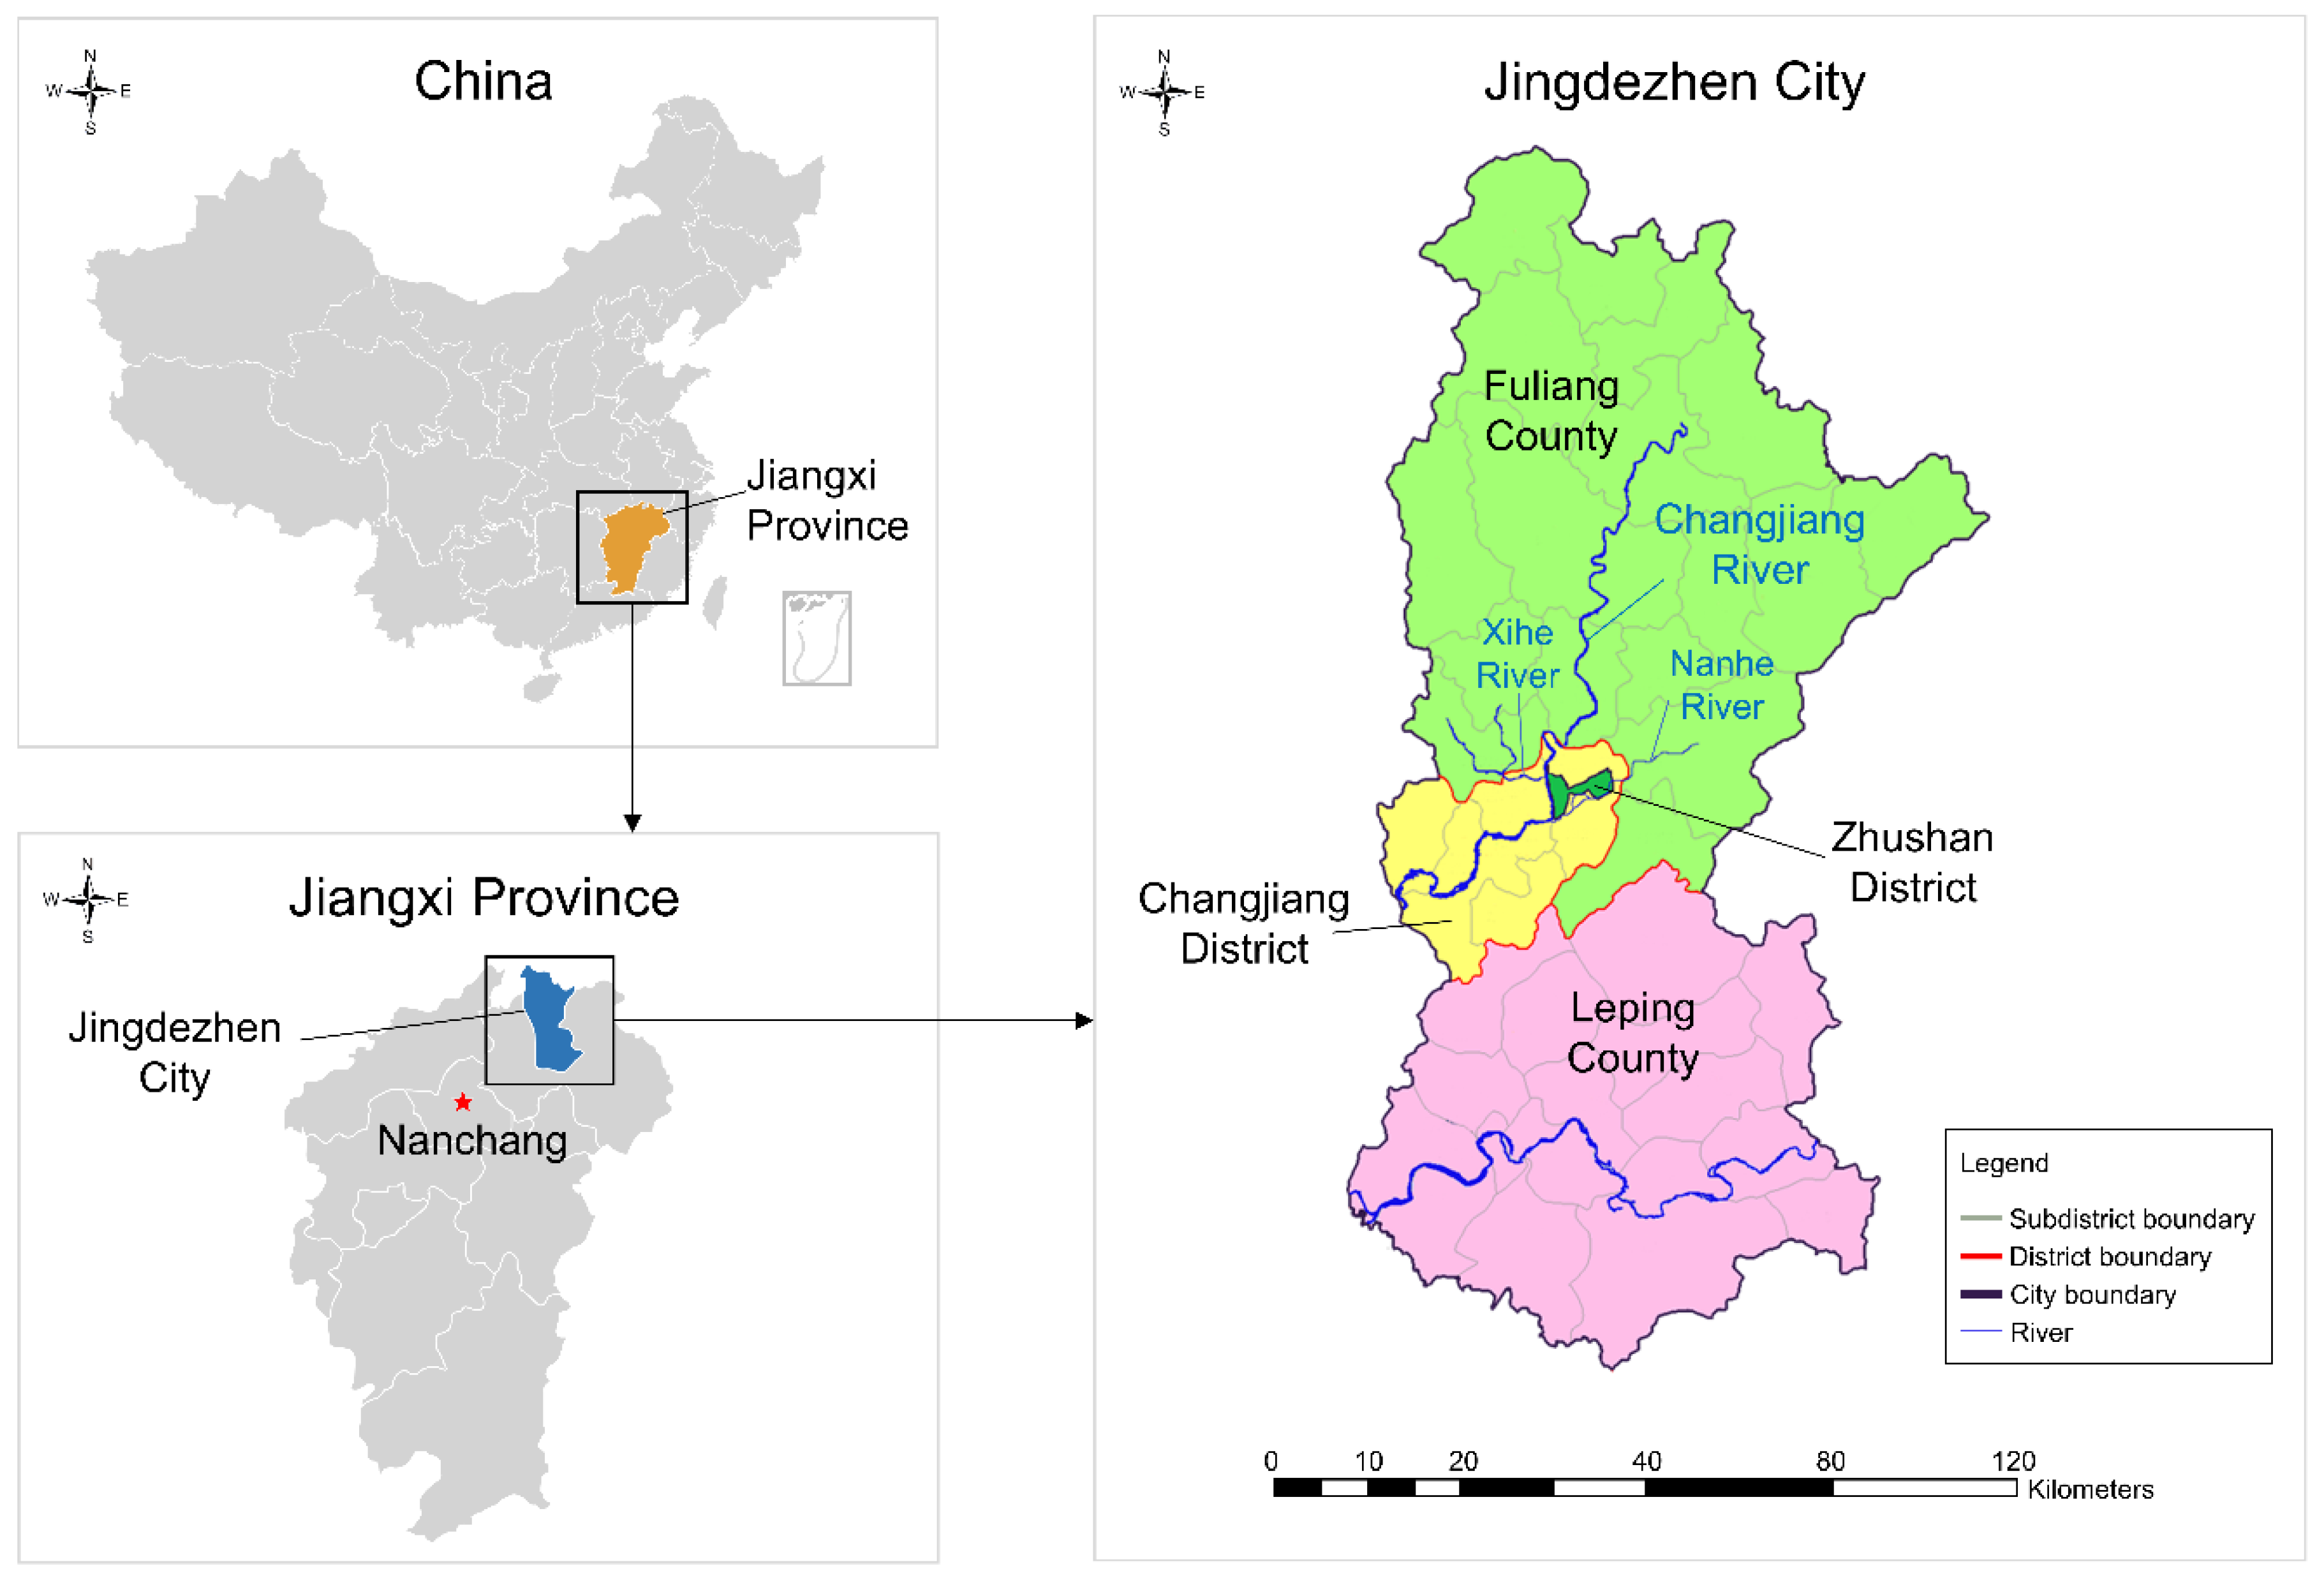
Jingdezhen is located in the northeast of Jiangxi Province, China, and it belongs to the transition zone between the extension of Huangshan Mountain, Huaiyu Mountain and Poyang Lake Plain (as shown in Figure 1). It lies between 116°57′–117°42′ E longitude and 28°44′–29°56′ N latitude. Jingdezhen City covers a total area of 5256.23 km2 and governs two counties and two districts, namely Leping County (1982.76 km2), Fuliang County (2580.84 km2), the Changjiang District (391.83 km2), and Zhushan District (30.80 km2). The agricultural land, construction land, and unused land in Jingdezhen City are 4754.47 km2, 355.9 km2 and 147.8 km2, respectively, accounting for 90.4%, 6.8%, and 2.8% of the total area of the city. The highest and lowest elevations in Jingdezhen are 1618 m and 20 m, respectively, with plains on the southern part having an average altitude of 200 m. This region is characterized by a subtropical monsoon climate, with abundant sunshine and rainfall. The annual average temperature is 17 °C and the annual average sunshine time is 2009.8 h. The annual precipitation is 1763.5 mm, and the distributions of precipitation are quite uneven, with about 46% of precipitation occurring in the rainy season (from April to June). In the past 10 years, the economy of Jingdezhen has grown at an annual rate of more than 8%. In 2017, the regional GDP reached 87.825 billion Yuan. At the end of 2017, the total resident population was 1.665 million, of which the urban resident population was 1.098 million.
Jingdezhen City is prone to floods. On the one hand, this is due to the extreme rainfall and flow during the flood season. Taking the flood in 2016 as an example, the city’s 24-h average rainfall exceeded 200 mm with a return period of 20 years and the maximum flow of the Changjiang River was 7090 m3/s. The flood return period of the main stream of the Changjiang River was 20 years, and some river sections were 50 years. On the other hand, Jingdezhen City lacks an effective flood control and drainage project. The existing flood control project can only defend floods with 5–8 years return period. The drainage site design standards are low as well, and some sites stopped working due to flooding. Besides, the length of the urban drainage pipe network is only 26.4 km and only 19% meets the drainage standard of 1-year return period flooding event. Meanwhile, Jingdezhen City has problems with its drainage pipe network, such as many bottleneck pipe sections, mild pipe network slopes, and insufficient pipe network outlet, resulting in regular flooding in Jingdezhen City.
Floods in Jingdezhen City
The climate of the Changjiang River Basin in Jingdezhen is significantly changeable, and the precipitation distribution is extremely uneven. The central city of Jingdezhen is located on both sides of the Changjiang River and its tributaries, the Nanhe River and the Xihe River. The terrain along the rivers are low, with an elevation of 24–31 m, which is threatened by floods. In 1955, 1996, 1998, 1999, 2010 to 2012, 2016, and 2017, the floods occurred in the Changjiang River, which caused serious flooding in Jingdezhen City, resulting in large economic losses and social impact.
According to historical records, in 1998, Jingdezhen City suffered a serious flood. The flooding time in the urban area reached 94 h, and the water depth in the urban low-lying area reached 10 m. The urban flooded area reached 31.4 square kilometers, accounting for 94.6% of the total urban area. Besides, the flood affected 354 thousand people and caused 3.23 billion Yuan damage. The flood in 2010 was also very serious, affected 32.52 thousand hectares of crops, with 666.8 thousand people affected and 1284 collapsed houses. The direct economic loss was about 2.96 billion Yuan. In 2016, from 4 pm on June 18 to 4 pm on the 19th, the rainfall in the Changjiang river basin reached 200.9 mm. The flood level of Dufengkeng Hydrological Station increased by 9.35 m in one day. The city has relocated a total of 119.7 thousand people, which was the largest relocation number of people since the past 10 years. And the direct economic losses amounted to 1.90 billion Yuan.
2.2. Sample Selection
All four districts were chosen as survey sampling sites because the floods affected all of them and the comparison was need latter. In the heavily flood-hit areas and those in city center, more subdistricts were selected, while fewer subdistricts were chosen in less affected areas. Changjiang District and Zhushan District are the urban centers of Jingdezhen City. The population is large and concentrated. The Changjiang River passes through these two areas and has many low-lying areas. There are more affected populations, so more questionnaires have been set up. Fuliang and Leping are far away from the city center, and their populations are relatively scattered. It is difficult to carry out all investigations in these two areas, thus fewer questionnaire surveys have been set up. As a result, five subdistricts were selected in Changjiang District, eight subdistricts were chosen in Zhushan District, one subdistrict was selected in Leping County, and two townships were selected in Fuliang County.
2.3. Questionnaire Design
This survey was part of the World Bank Project JIANGXI WUXIKOU INTEGRATED FLOOD MANAGEMENT PROJECT and it was approved by the Jingdezhen City Government. A semi-structured questionnaire was designed to investigate the public flood risk perception. In order to eliminate misunderstanding of the questionnaire, before the formal survey, some respondents with different educational levels were chosen to complete the questionnaire, and their feedbacks on the content of the questionnaire were collected. Then, based on these feedbacks, the project team changed all obscure and professional vocabulary into simple and easy to understand vocabulary. At the same time, the number of questions in the questionnaire was reduced too.
In the introduction part of the questionnaire, the purpose of the investigation and the relevant confidentiality principles were highlighted. This was used to inform respondents that the survey is anonymous and what data were collected. The main content of the questionnaire was divided into three main sections (Table 1). Each section had several items to measure. The first section included six items determining the most important sociodemographic factors of the respondents such as place of residence, gender, age, education level, occupation, and income per month [43]. The second section was other four important factors that could influence the public flood risk perception. The four impact factors were flood experience, flood knowledge education, flood protection responsibility, and trust in government. One impact factor comprised one item. The third section was the measurement of public flood risk perception. The impact and likelihood are most often employed variables to measure the flood risk perception as the flood risk is usually defined by the product of the likelihood of flood disaster with its consequences (impact) [43]. In this study, Jingdezhen City suffers from the flood almost every two years in history. Thus, the impact of the flood was more important than likelihood and only the flood impact was defined as the measurement of flood risk perception.
As mention above, some researchers include many other impact factors such as distance from the river, residence history, etc. But in this study, these factors were not included. This is because in this study, Jingdezhen City is a small and medium-sized city with a small migrant population and local people have lived here for a long time. In addition, not only people near the river are affected by flood, but people living in the low-lying city center are often affected. Likert scale technique was employed for the impact factors in Table 1.
2.4. Data Collection
The data used in this study came from a face-to-face questionnaire survey that was conducted from 8 July 2016 to 14 July 2016. Investigators who attended to the survey were Ph.D. students and MSc students. All of them had basic knowledge and background of natural disaster management. The project team invited four experts in the field of flood risk management to conducted four standardized training sessions for the investigators to make sure that the survey can be carried out smoothly. These trainings mainly focused on the introduction of project objectives and the basic skills for the investigation.
According to the sample selection, in total, 16 subdistricts were selected. Based on the distribution of subdistricts, investigators were divided into four groups of at least four investigators. In each group, there was a senior researcher who monitored the survey process, coordinated the questionnaires collection and checked the completeness and validity of collected questionnaires. Before each interview began, the purpose of the investigation and confidentiality principles were verbally explained by the investigators again. The participation of the respondents in this study was voluntary and consented, and enough time was given. Any confusions of the questions during the survey were explained by the investigators and the respondents had the rights to refuse to participate or withdraw from the survey at any time. In order to incentivize the public to participate the survey, every respondent was given a gift after they completed the questionnaire. At last, 900 questionnaires were distributed, 852 were collected, and the number of valid responses after the exclusion of incomplete questionnaires was 719 (the response rate was 84.4%).
2.5. Statistical Analysis
Firstly, descriptive statistics were applied to quantitatively describe and summarize the features of the socio-demographic characteristics of the respondents and the other four impact factors (flood experience, flood knowledge education, flood protection responsibility, trust in government). Secondly, analysis of variance (ANOVA) was conducted to examine the mean ranks of two or more independent variables with the null hypothesis of equality. This was to identify whether there existed correlations between the impact factors and public flood risk perception or not. Then, Post Hoc Tests was employed to find and compare the flood risk perception differences between different groups under the same impact factor among all respondents. Thus, the correlations were confirmed to be positive or negative. Besides, with regard to the gender variable, the mean difference comparison among gender using independent T test because only two groups exist, male and female.
All statistical analysis was carried out under a significance test value of 0.05 to confirm whether these impact factors affected the public flood risk perception. Impact factors with the significance value of less than 0.05 were considered to be significantly influential to public flood risk perception, as proposed in similar questionnaire-based studies [2,17,44]. The data was analyzed using the IBM SPSS Statistics software (Version 24.0.0.2, SPSS Inc., Chicago, IL, USA).
3. Results and Discussion
3.1. Preliminary Analysis
In this study, 719 valid survey questionnaires were analyzed. Table 2 summarized the response number for each area and the Socio-Demographic Variables of the respondents. The number of respondents in Changjiang District and Zhushan District were higher than in the other areas. Because the more subdistricts were selected, the more responses were collected. Table 3 summarized the distribution of other four important impact factors (flood experience, flood knowledge education, flood protection responsibility, and trust in government).
3.1.1. Socio-Demographic Characteristics of Respondents
Of the 719 respondents, 244 (33.9%) were from Changjiang District, 362 (50.3%) from Zhushan District, 52 (7.2%) from Leping County, and 61 (8.5%) from Fuliang County (Table 2). Among the 719 respondents, the percentage of male respondents and female respondents were close, accounting for 46.5% and 53.5%, respectively. Respondents aged from 21 to 50 years old were the majority, with the percentage of 21–35 years old and 35–50 years old were 37.8% and 35.5%, respectively. With regard to the education level, most of the respondents were primary school and below (38.0%) and middle school (42.7%), whereas the percentage of high school, bachelor’s degree, and master’s degree were only 13.4%, 5.7%, and 0.3%, respectively. Six occupation types were classified, 42.4% and 19.6% of the respondents were self-employed person and worked in company, respectively. Most of respondents earned less than 5000 Chinese Yuan (CNY) every month, income less than 2000 CNY per month accounted for 45.1% and monthly income between 2001 and 5000 CNY were majority, accounting for 49.1%. Only 5.8% earned more than 5000 CNY per month. The specific ratios of the four districts/counties were similar to those of the entire city of Jingdezhen.
3.1.2. Other Important Impact Factors
In this study, when considering the characteristics of Jingdezhen City and the objectives of the study, the flood experience, flood knowledge education, flood protection responsibility, and trust in government were considered as other important factors influencing the public flood risk perception (as shown in Table 3).
Most studies revealed that the flood experience can increase flood risk perception and people with recent flood experience would acquire good knowledge of flood and do well in flood mitigation [9,28]. Most of the respondents in Jingdezhen City were influenced by the flood every year, with 47.5% of the respondents experienced at least one flood every year and only 37.3% of respondents experienced less than one flood every two years. Meanwhile, about 25.4% of respondents in Changjiang District and 15.7% of respondents in Zhushan District were seriously affected by the flood, experiencing more than 2 times flood every year.
It has been found the flood knowledge had a positive correlation with the flood risk perception [45]. Medium level was the largest percentage (28.0%) and only 19.6% of respondents had received many flood knowledge education sessions in Jingdezhen. Besides, 26.3% of respondents never received flood knowledge education. Among the four areas, the respondents in Zhushan District received more knowledge education with 31.5% chosen the answer of “Medium” and 27.9% selected the answer of “Many”.
Flood protection responsibility, in many studies, was found to reflect the degree of responsibility to which a person took protection behaviors [46]. In this study, most of the respondents thought the government and flood management experts should take the responsibilities to protect the public from the flood disaster, accounting for 48.4% and 24.6%. In contrast, only 13.9% of respondents believed that they themselves should also be responsible for flood protection and disaster mitigation.
Many findings had showed that people with higher degrees of trust in government perceive lower consequences of disaster and tend to prepare less [47]. When asked about their trust in the local government for protecting them from floods, respondents showed low trust levels in Jingdezhen City, with “low trust” answers accounting for 54.1%, followed by not trust (21.0%), medium trust (18.5%), and high trust (6.4%). In addition, Leping County had the largest percentage of high trust in the government (13.5%), followed by Changjiang District (6.6%), Zhushan District (6.4%).
3.2. Public Flood Risk Perception in Four Districts in Jingdezhen
The public flood risk perception was compared among four districts. Here, the p value was less than 0.05 (Table 4), which showed that the public flood risk perceptions among four districts were statistically significant. Therefore, the comparison of scores between the four districts afterwards was credible and reliable.
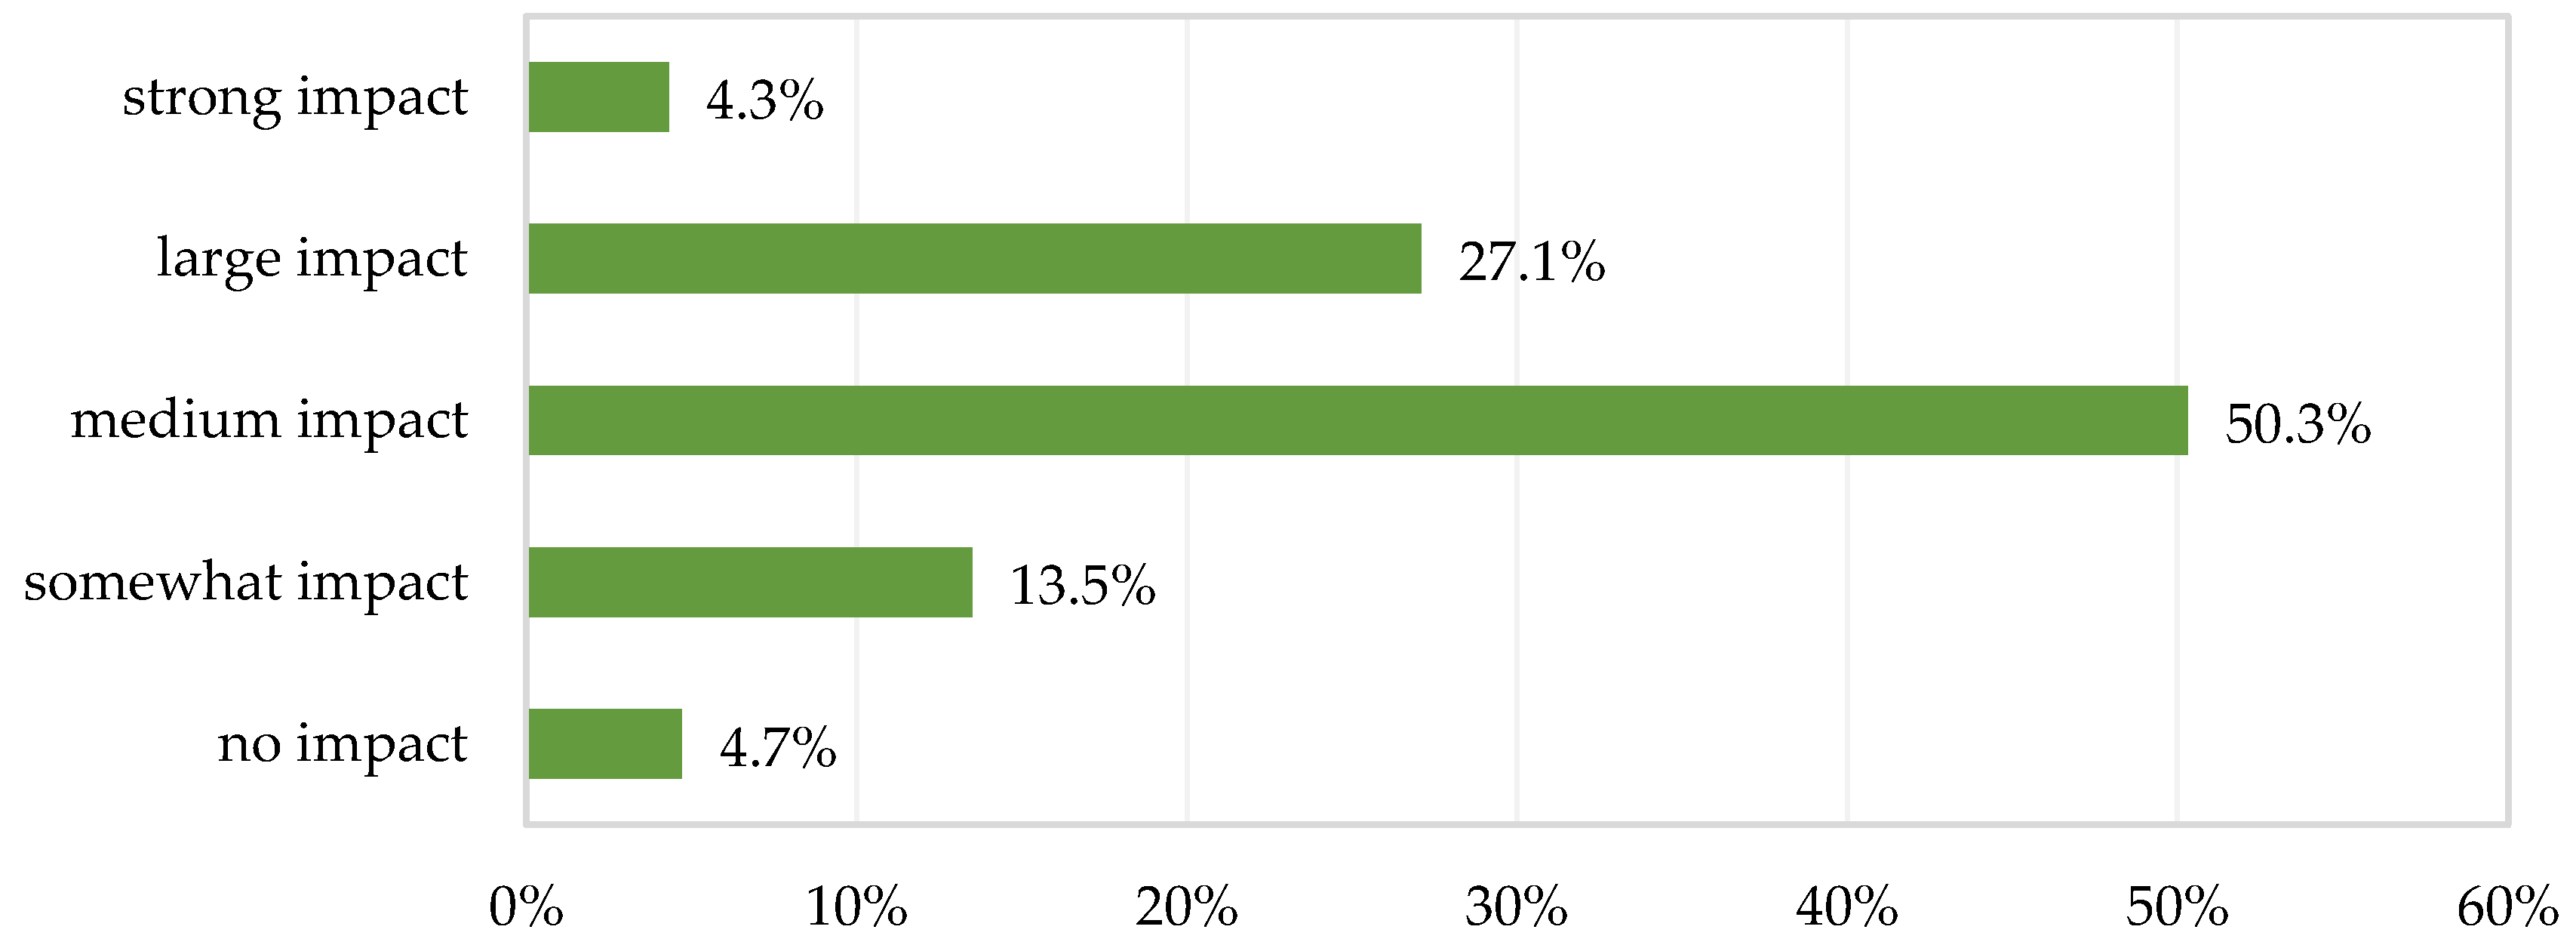
When asked about the flood impact, the respondents in Jingdezhen City showed different flood risk perception level. As shown in Figure 2, more than half the respondents selected “medium impact”, accounting for 50.3%, and they thought the flood affected their daily life and work but not serious. And 27.1% of the respondents thought that they were largely affected by the flood, causing inconvenience to life and some loss of property, sometimes unable to work or shutdown. Besides, 4.3% of the respondents felt strongly affected by the flood, and they thought their lives and work were greatly affected and sometimes life-threatening property-damaging. On the contrary, “somewhat impact” and “no impact” recorded a small percentage. In specific, 13.5% of respondents thought they were affected by the flood, but this situation only lasted a very short time and 4.7% of the respondents never felt affected by the flood.
The specific difference of flood risk perception was compared among four districts in Jingdezhen City. As shown in Table 4, the mean score of flood risk perception for the respondents in the Jingdezhen City was 3.13. This represented the level of flood risk perception among the Jingdezhen City was not high, close to medium level. Among the four districts, Changjiang District had the highest score of flood risk perception, which was 3.24, 0.11 higher than the whole city average level. In the actual investigation, this may be because the area is the city center, where the wealth and population density are large, and the damage that is caused by the disaster was serious in the past. Meanwhile, some streets and plazas got flooded every year, resulting in a high flood risk perception among the respondents in Changjiang District. The lowest score of flood risk perception was 2.65 in Leping County. This may be due to the respondents in Leping County thought the flood was not a serious disaster. The possible reason is 71.2% of the respondents in Leping County experienced less than one flood every two years (Table 3). With less likelihood of future flood as well as the less flood experience, people in Leping County might believe that flood risk had lower importance. In addition, the flood risk perception in Zhushan District and Fuliang County were similar, being 3.12 and 3.11, respectively.
Overall, these results showed that the respondents in the whole Jingdezhen city had a medium level of flood risk perception, and there were large differences among four districts with the respondents in Changjiang District having the highest flood risk perception while the respondents in Leping County had the lowest.
3.3. Impact Factors of Public Flood Risk Perception
ANOVA was conducted to examine and analyze the links between the impact factors and public flood risk perception in Jingdezhen City (as shown in Table 5). In this study, the impact factors were related to:
- individual socio-demographic characteristics and
- other four important factors. 95% confidence interval was used. When the p < 0.05, it means the impact factor would influence the flood risk perception.
The ANOVA results showed that the impact factors, such as district, gender, age, education level, income per month, flood experience, flood knowledge education, flood protection responsibility and trust in the government have significant relationships with the flood risk perception. Only the occupation factor has insignificant relationship with p > 0.05. Then, Post Hoc Tests was conducted to find the flood risk perception differences between different groups under the same impact factor among all respondents (Table 6).
As far as the district was concerned, the above analysis has found that there was a statistically significant difference between the flood risk perceptions in four districts in Jingdezhen City (see Table 4 and Table 5). Compared with other three districts, the respondents in Changjiang District perceived the highest flood risk. Besides, the respondents in Leping County showed the lowest flood risk perception, and this may be because they did not think the flood risk was very important and they believed that the likelihood of future flood in this area was very low.
With regard to gender, the female respondents had higher flood risk perception than the male respondents (p < 0.05). This is because women had lower socioeconomic status than men and were more vulnerable when facing the floods, which caused women to be more willing to seek flood information, pay more attention to property losses, and more likely to take self-protection measures in advance. Therefore, female perceived higher flood risk than male. This result was in line with the findings in most published studies [4,48].
In this study, there was a significant positive correlation between age and flood risk perception. In general, the older the respondent, the higher the flood risk perception level. Among the age groups, the respondents aged 51–70 years old had the highest flood risk perception comparing with other age groups younger than 51 years old. This may be because the respondents aged 50–71 years old experienced many historical serious floods and more likely to take the responsibilities in family safety. So, they perceived higher flood risk than other age groups. These results were similar to the findings in most published studies [4,48], although some studies thought that age negatively influenced the flood risk perception [43].
It can be seen from Table 6 that the respondents with higher education level had lower flood risk perception. The respondents with bachelor’s degree had lower flood risk perception than those with primary school degree, middle school degree, or high school degree. Meanwhile, there was no big difference between bachelor and master or above. Relevant studies also confirmed the significance of education for risk perception with negative correlation [16]. Ho et al. thought that people with higher education level had lower risk perception because highly educated people were more likely to better understand the flood information and government flood mitigation actions, and thus might feel a higher degree of controllability over a disaster [7].
With regard to the occupation factor, in this study, it had no statistically significant relation to the flood risk perception of the respondents. But, from the empirical data, the self-employed respondents had the highest flood risk perception. This may be because, for the self-employed respondents, the damage caused by the flood needs to be borne by themselves. In the relevant studies, Arnaud et al. revealed that, when discussed about the flood risk reduction, the factor of occupation was never significant [49].
With regard to the monthly income of the respondents, in general, higher educated people had higher income and thus their relation to the flood risk perception was similar. This study found that the respondents with lower income per month showed higher level of risk perception for flood. Compared with the respondents whose average monthly income was less than ¥2000, other three groups had poorer flood risk perception (p < 0.05 for all). This result was similar to the findings in some previous studies [43]. For example, Kellens et al. reviewed many relevant studies and found that there was a negative correlation between income and risk perception [50,51], though statistical significance was often absent [7,16,52].
The flood experience of the respondents had been found to be positively correlated with the flood risk perception and it was highly significant in this study, i.e., those with more flood experiences had higher flood risk perception than those with less flood experiences. The respondents experienced more than 2 times flood every year had the highest flood risk perception compared to other three groups. This was because people with more flood experience had more knowledge and better understanding of historical floods, and they were more likely to seek flood information and take measure to protect themselves. In fact, in our field research, it was discovered that the residents who were often affected by disasters made small flood control facilities in front of their homes, stored food during the flood season, and established mutual assistance agreements between neighbors. These results were also confirmed by the studies of Pagneux et al. [53] and Kellens W et al. [4].
With regard to the flood knowledge education, the flood knowledge is generally found strongly related to the feeling of security. Individuals with little knowledge of the causes of floods had lower flood risk perception [9]. In this study, it has a similar result that the individuals with more flood knowledge education showed higher flood risk perception. Compared with the respondents who received more flood knowledge education, the other three group showed lower flood risk perception. But the difference between the three groups (“Never”, “Few” and “Medium”) were small, while the gaps between the group of “Many” and other three groups were large. This means that the level of public flood risk perception would be improved only after a certain amount of flood knowledge education. Thus, the government need to adhere to more flood knowledge education.
The view of flood protection responsibilities has been found that can influence the public flood risk perception [33]. In this study, the respondents who believed themselves should be responsible for the flood protection showed higher flood risk perception than other groups. The reason may be that people who feel responsible for taking protective actions usually doubt the effectiveness of ‘public’ protective measures [34], thus, they perceived higher flood risk perception and preferred to take self-protection measures. Besides, the difference between other groups were not big. These results also reflect the fact that raising public responsibility for flood protection is very helpful for flood mitigation and risk management.
With regard to the trust in the government, it was found to be negatively related to the flood risk perception in this study (see Table 6). The respondents held the “Very low” trust in the government perceived highest flood risk than other three groups (p < 0.05 for all). The reason may be that trust in the government is represented by the trust of the government, experts, and the mass media [26]. The high level of trust showed that the respondents believe that the government can cope with flood hazards and do not need to do too much preparedness themselves. People who have lower trust in the government do not believe that the government can issue early flood warning and timely rescue. Instead, they choose to actively understand flood knowledge, seek flood information, and take measures to protect themselves. These results also were confirmed in most published studies [27,54].
4. Conclusions
This study analyzed the public flood risk perception in Jingdezhen City and explored the impact factors on flood risk perception. Results of ANOVA showed that many impact factors were strongly correlated with the flood risk perception. These include the socio-demographic characteristics of the respondents, previous flood experience, flood knowledge education, flood protection responsibility, and trust in government. The key findings are:
- the flood risk perceptions of most respondents were in the medium level, which accounted for 50.3% of the total respondents. Only 4.3% of the total respondents recorded high level of flood risk perception and 4.7% of total respondents thought they were not affected by flood;
- the respondents in the four districts of Jingdezhen City had different levels of flood risk perception, among which the respondents in Changjiang District had the highest level of perception due to this district is the city center and the flood-prone area. The female respondents had higher flood risk perception than male. The respondents with older age, more flood experience, more flood knowledge, lower income per month, less education, and less trusted in government showed higher flood risk perception. The occupation variable did not significantly influence the public flood risk perception, but the self-employed person had higher flood risk perception than other groups from the empirical data. The respondents who thought themselves should also be responsible for flood protection showed higher flood risk perception; and,
- these results of this study were consistent with the findings in previous studies with few contrasts only.
But, the limitation of the study should also be taken into consideration. First, due to the financial and time limitation, only one subdistrict in Leping County and two downtowns in Fuliang District were chosen to carry out the survey. This may influence the results in these two districts. Second, we used a single measure of risk perception that some researchers might not consider to be optimal. Other research tends to use a set of items (e.g., impact, awareness, likelihood and fear) to measure the flood risk perception. Third, although we told respondents that the survey was anonymous, some respondents were still cautious and avoided choosing extreme answers about the government, which could cause some uncertainty in the results. Despite this, we believe that our analysis will help decision makers to develop effective flood risk communication strategies and flood risk reduction policies. First, it can help decision-makers to grasp the difference between the flood risk perceived by residents and the real flood risk, make reasonable risk regulation according to the characteristics of the people, and reduce the irrational behavior caused by this risk perception deviation. For example, too high-risk perception could lead to social panic while too low risk perceptions could lead to negative flood mitigation. Second, this study can be used to understand which groups have a higher risk perception, and the government can specifically encourage and promote flood prevention products such as flood insurance to reduce flood losses. Third, these results about the “flood protection responsibility” and “trust in government” can provide references for local government to strengthen the relationship between the government and the public because the responsibility and trust are very important for policy promotion and implementation.
Future work will focus on how flood risk perception affects people’s flood mitigation behavior; conduct a more detailed survey of flood risk perception for specific vulnerable populations, such as students, females, and farmers; highlight the dominant role of the government in flood risk mitigation in small and medium-sized cities, and refine and select more variables related to government; and, analyze and compare the changes in flood risk perception before and after flood disasters. Finally, our findings suggest that the local government should actively promote the government’s credibility and enhance the trust between residents and the government. Although this may partially reduce the flood risk perception of residents, higher trust is conducive to the implementation of the government’s disaster reduction policy, and also enables residents to cooperate with the government’s disaster reduction work. At the same time, it is important to strengthen flood knowledge education and training for residents based on their socio-demographic characteristics to improve the public flood risk perception and the ability of self-protect. Moreover, the government should reconsider their disaster emergency drills, making it simple and understandable, and more operational.
Author Contributions
Zhiqiang Wang was responsible for literature search, survey design, data collection, data analysis and he also wrote the initial draft of the manuscript. Huimin Wang, Jing Huang principally conceived the idea for the study and provided financial support. Jinle Kang was responsible for field interviews and data collection. Dawei Han contributed to the figures and the revision of English and style.
Funding
This research was funded by Jiangxi Wuxikou Integrated Flood Management Project (Grant number JDZ-WXK-ZX-9), National Natural Science Foundation of China (Grant number 71601070), Postgraduate Research & Practice Innovation Program of Jiangsu Province of China (Grant number KYCX17_0517) and China Scholarship Council (Grant number 201706710094).
Acknowledgments
We would like to express our gratitude to the Jingdezhen district office and street office for the authorization and support to carry out the study. Finally, we thank all the investigators and respondents who participated in the survey.
Conflicts of Interest
The authors declare no conflicts of interest.
References
- Bradford, R.A.; O’Sullivan, J.J.; van der Craats, I.M.; Krywkow, J.; Rotko, P.; Aaltonen, J.; Bonaiuto, M.; De Dominicis, S.; Waylen, K.; Schelfaut, K. Risk perception—Issues for flood management in Europe. Nat. Hazards Earth Syst. Sci. 2012, 12, 2299–2309. [Google Scholar] [CrossRef]
- Liu, D.L.; Li, Y.; Shen, X.; Xie, Y.L.; Zhang, Y.L. Flood risk perception of rural households in western mountainous regions of Henan Province, China. Int. J. Disaster Risk Reduct. 2018, 27, 155–160. [Google Scholar] [CrossRef]
- Mackay, A. Climate change 2007: Impacts, adaptation and vulnerability. Contribution of working group II to the fourth assessment report of the intergovernmental panel on climate change. J. Environ. Qual. 2008, 37, 2407. [Google Scholar] [CrossRef]
- Kellens, W.; Zaalberg, R.; Neutens, T.; Vanneuville, W.; De Maeyer, P. An analysis of the public perception of flood risk on the Belgian coast. Risk Anal. 2011, 31, 1055–1068. [Google Scholar] [CrossRef] [PubMed] [Green Version]
- Peacock, W.G.; Brody, S.D.; Highfield, W. Hurricane risk perceptions among Florida’s single family homeowners. Landsc. Urban Plan. 2005, 73, 120–135. [Google Scholar] [CrossRef]
- Grothmann, T.; Reusswig, F. People at risk of flooding: Why some residents take precautionary action while others do not. Nat. Hazards 2006, 38, 101–120. [Google Scholar] [CrossRef]
- Ho, M.C.; Shaw, D.; Lin, S.Y.; Chiu, Y.C. How do disaster characteristics influence risk perception? Risk Anal. 2008, 28, 635–643. [Google Scholar] [CrossRef] [PubMed]
- Pidgeon, N. Risk assessment, risk values and the social science programme: Why we do need risk perception research. Reliab. Eng. Syst. Saf. 1998, 59, 5–15. [Google Scholar] [CrossRef]
- Botzen, W.J.W.; Aerts, J.; van den Bergh, J. Dependence of flood risk perceptions on socioeconomic and objective risk factors. Water Resour. Res. 2009, 45, 15. [Google Scholar] [CrossRef]
- White, G.F. Human Adjustment to Floods: A Geographical Approach to the Flood Problem in the United States; University of Chicago: Chicago, IL, USA, 1945. [Google Scholar]
- Brilly, M.; Polic, M. Public perception of flood risks, flood forecasting and mitigation. Nat. Hazards Earth Syst. Sci. 2005, 5, 345–355. [Google Scholar] [CrossRef] [Green Version]
- Bird, D.K. The use of questionnaires for acquiring information on public perception of natural hazards and risk mitigation—A review of current knowledge and practice. Nat. Hazards Earth Syst. Sci. 2009, 9, 1307–1325. [Google Scholar] [CrossRef]
- Starr, C. Social benefit versus technological risk. Science 1969, 165, 1232–1238. [Google Scholar] [CrossRef] [PubMed]
- Sjöberg, L.; Moen, B.; Rundmo, T. Explaining Risk Perception. An Evaluation of the Psychometric Paradigm in Risk Perception Research; Norwegian University of Science and Technology, Department of Psychology: Trondheim, Norway, 2004; ISBN 82-7892-024. [Google Scholar]
- Fischhoff, B.; Slovic, P.; Lichtenstein, S.; Read, S.; Combs, B. How safe is safe enough? A psychometric study of attitudes towards technological risks and benefits. Policy Sci. 1978, 9, 127–152. [Google Scholar] [CrossRef]
- Qasim, S.; Khan, A.N.; Shrestha, R.P.; Qasim, M. Risk perception of the people in the flood prone Khyber Pukhthunkhwa province of Pakistan. Int. J. Disaster Risk Reduct. 2015, 14, 373–378. [Google Scholar] [CrossRef]
- Diakakis, M.; Priskos, G.; Skordoulis, M. Public perception of flood risk in flash flood prone areas of Eastern Mediterranean: The case of Attica Region in Greece. Int. J. Disaster Risk Reduct. 2018, 28, 404–413. [Google Scholar] [CrossRef]
- Mabuku, M.P.; Senzanje, A.; Mudhara, M.; Jewitt, G.; Mulwafu, W. Rural households’ flood preparedness and social determinants in Mwandi district of Zambia and Eastern Zambezi region of Namibia. Int. J. Disaster Risk Reduct. 2018, 28, 284–297. [Google Scholar] [CrossRef]
- Ullah, R.; Shivakoti, G.P.; Ali, G. Factors effecting farmers’ risk attitude and risk perceptions: The case of Khyber Pakhtunkhwa, Pakistan. Int. J. Disaster Risk Reduct. 2015, 13, 151–157. [Google Scholar] [CrossRef]
- Luo, X.F.; Lone, T.; Jiang, S.Y.; Li, R.R.; Berends, P. A study of farmers’ flood perceptions based on the entropy method: An application from Jianghan Plain, China. Disasters 2016, 40, 573–588. [Google Scholar] [CrossRef] [PubMed]
- Bosschaart, A.; Kuiper, W.; van der Schee, J.; Schoonenboom, J. The role of knowledge in students’ flood-risk perception. Nat. Hazards 2013, 69, 1661–1680. [Google Scholar] [CrossRef]
- Armas, I.; Avram, E. Perception of flood risk in Danube Delta, Romania. Nat. Hazards 2009, 50, 269–287. [Google Scholar] [CrossRef]
- Lo, A.Y. The role of social norms in climate adaptation: Mediating risk perception and flood insurance purchase. Glob. Environ. Chang. 2013, 23, 1249–1257. [Google Scholar] [CrossRef]
- Salvati, P.; Bianchi, C.; Fiorucci, F.; Giostrella, P.; Marchesini, I.; Guzzetti, F. Perception of flood and landslide risk in Italy: A preliminary analysis. Nat. Hazards Earth Syst. Sci. 2014, 14, 2589–2603. [Google Scholar] [CrossRef]
- Spitalar, M.; Gourley, J.J.; Lutoff, C.; Kirstetter, P.E.; Brilly, M.; Carr, N. Analysis of flash flood parameters and human impacts in the us from 2006 to 2012. J. Hydrol. 2014, 519, 863–870. [Google Scholar] [CrossRef]
- Lin, S.Y.; Shaw, D.G.; Ho, M.C. Why are flood and landslide victims less willing to take mitigation measures than the public? Nat. Hazards 2008, 44, 305–314. [Google Scholar] [CrossRef]
- Hung, H.C. The attitude towards flood insurance purchase when respondents’ preferences are uncertain: A fuzzy approach. J. Risk Res. 2009, 12, 239–258. [Google Scholar] [CrossRef]
- Terpstra, T.; Lindell, M.K. Citizens’ perceptions of flood hazard adjustments: An application of the protective action decision model. Environ. Behav. 2013, 45, 993–1018. [Google Scholar] [CrossRef]
- Knuth, D.; Kehl, D.; Hulse, L.; Schmidt, S. Risk perception, experience, and objective risk: A cross-national study with European emergency survivors. Risk Anal. 2014, 34, 1286–1298. [Google Scholar] [CrossRef] [PubMed]
- Wachinger, G.; Renn, O.; Begg, C.; Kuhlicke, C. The risk perception paradox-implications for governance and communication of natural hazards. Risk Anal. 2013, 33, 1049–1065. [Google Scholar] [CrossRef] [PubMed]
- Thieken, A.H.; Kreibich, H.; Muller, M.; Merz, B. Coping with floods: Preparedness, response and recovery of flood-affected residents in Germany in 2002. Hydrol. Sci. J. 2007, 52, 1016–1037. [Google Scholar] [CrossRef]
- Lopez-Marrero, T.; Yarnal, B. Putting adaptive capacity into the context of people’s lives: A case study of two flood-prone communities in Puerto Rico. Nat. Hazards 2010, 52, 277–297. [Google Scholar] [CrossRef]
- Becker, G.; Aerts, J.; Huitema, D. Influence of flood risk perception and other factors on risk-reducing behaviour: A survey of municipalities along the R hine. J. Flood Risk Manag. 2014, 7, 16–30. [Google Scholar] [CrossRef]
- Birkholz, S.; Muro, M.; Jeffrey, P.; Smith, H.M. Rethinking the relationship between flood risk perception and flood management. Sci. Total Environ. 2014, 478, 12–20. [Google Scholar] [CrossRef] [PubMed]
- Martens, T.; Garrelts, H.; Grunenberg, H.; Lange, H. Taking the heterogeneity of citizens into account: Flood risk communication in coastal cities—A case study of Bremen. Nat. Hazards Earth Syst. Sci. 2009, 9, 1931–1940. [Google Scholar] [CrossRef]
- Ryan, B. Information seeking in a flood. Disaster Prev. Manag. 2013, 22, 229–242. [Google Scholar] [CrossRef] [Green Version]
- Baan, P.J.; Klijn, F. Flood risk perception and implications for flood risk management in The Netherlands. Int. J. River Basin Manag. 2004, 2, 113–122. [Google Scholar] [CrossRef]
- Petrolia, D.R.; Landry, C.E.; Coble, K.H. Risk preferences, risk perceptions, and flood insurance. Land Econ. 2013, 89, 227–245. [Google Scholar] [CrossRef]
- Tversky, A.; Kahneman, D. Judgment under uncertainty: Heuristics and biases. Science 1974, 185, 1124–1131. [Google Scholar] [CrossRef] [PubMed]
- Slovic, P. Perception of risk. Science 1987, 236, 280–285. [Google Scholar] [CrossRef] [PubMed]
- Gotham, K.F.; Campanella, R.; Lauve-Moon, K.; Powers, B. Hazard experience, geophysical vulnerability, and flood risk perceptions in a postdisaster city, the case of New Orleans. Risk Anal. 2018, 38, 345–356. [Google Scholar] [CrossRef] [PubMed]
- Horney, J.A.; MacDonald, P.D.M.; Van Willigen, M.; Berke, P.R.; Kaufman, J.S. Individual actual or perceived property flood risk: Did it predict evacuation from Hurricane Isabel in North Carolina, 2003? Risk Anal. 2010, 30, 501–511. [Google Scholar] [CrossRef] [PubMed]
- Kellens, W.; Terpstra, T.; De Maeyer, P. Perception and communication of flood risks: A systematic review of empirical research. Risk Anal. 2013, 33, 24–49. [Google Scholar] [CrossRef] [PubMed] [Green Version]
- Peng, Y.; Zhu, X.T.; Zhang, F.Y.; Huang, L.; Xue, J.B.; Xu, Y.L. Farmers’ risk perception of concentrated rural settlement development after the 5.12 Sichuan earthquake. Habitat Int. 2018, 71, 169–176. [Google Scholar] [CrossRef]
- Raaijmakers, R.; Krywkow, J.; van der Veen, A. Flood risk perceptions and spatial multi-criteria analysis: An exploratory research for hazard mitigation. Nat. Hazards 2008, 46, 307–322. [Google Scholar] [CrossRef]
- Lara, A.; Sauri, D.; Ribas, A.; Pavon, D. Social perceptions of floods and flood management in a Mediterranean area (Costa Brava, Spain). Nat. Hazards Earth Syst. Sci. 2010, 10, 2081–2091. [Google Scholar] [CrossRef] [Green Version]
- Han, Z.Q.; Lu, X.L.; Horhager, E.I.; Yan, J.B. The effects of trust in government on earthquake survivors’ risk perception and preparedness in China. Nat. Hazards 2017, 86, 437–452. [Google Scholar] [CrossRef]
- Kung, Y.W.; Chen, S.H. Perception of earthquake risk in Taiwan: Effects of gender and past earthquake experience. Risk Anal. 2012, 32, 1535–1546. [Google Scholar] [CrossRef] [PubMed]
- Reynaud, A.; Nguyen, M.H. Valuing flood risk reductions. Environ. Model. Assess. 2016, 21, 603–617. [Google Scholar] [CrossRef]
- Lindell, M.K.; Hwang, S.N. Households’ perceived personal risk and responses in a multihazard environment. Risk Anal. 2008, 28, 539–556. [Google Scholar] [CrossRef] [PubMed]
- Zhang, Y.; Hwang, S.N.; Lindell, M.K. Hazard proximity or risk perception? Evaluating effects of natural and technological hazards on housing values. Environ. Behav. 2010, 42, 597–624. [Google Scholar] [CrossRef]
- Ling, F.H.; Tamura, M.; Yasuhara, K.; Ajima, K.; Van Trinh, C. Reducing flood risks in rural households: Survey of perception and adaptation in the Mekong delta. Clim. Chang. 2015, 132, 209–222. [Google Scholar] [CrossRef]
- Pagneux, E.; Gisladottir, G.; Jonsdottir, S. Public perception of flood hazard and flood risk in Iceland: A case study in a watershed prone to ice-jam floods. Nat. Hazards 2011, 58, 269–287. [Google Scholar] [CrossRef]
- Terpstra, T. Emotions, trust, and perceived risk: Affective and cognitive routes to flood preparedness behavior. Risk Anal. 2011, 31, 1658–1675. [Google Scholar] [CrossRef] [PubMed]
Figure 1.
Study area: Jingdezhen City, Jiangxi Province, China.

Figure 2.
Distribution of the responses regarding the flood impact, the measurement of the flood risk perception.
Figure 2.
Distribution of the responses regarding the flood impact, the measurement of the flood risk perception.


Table 1.
Definition of measurement and impact factors of public flood risk perception.
| Section | Details | Item |
|---|---|---|
| Socio-demographic | Socio-demographic Characteristics of respondents |
|
| Other important impact factors | Respondents’ flood experience |
|
| Flood protection responsibility |
| |
| Flood knowledge education |
| |
| Trust in the government work |
| |
| Flood risk perception | Respondents’ perceived flood risk |
|
Table 2.
The Socio-Demographic variables of the respondents (N = 719).
| Variable | Jingdezhen City (Total) | Changjiang District | Zhushan District | Leping County | Fuliang County |
|---|---|---|---|---|---|
| Number of respondents n (%) | 719 (100%) | 244 (33.9%) | 362 (50.3%) | 52 (7.2%) | 61 (8.5%) |
| Gender n (%) | |||||
| Male | 334 (46.5%) | 128 (52.5%) | 157 (43.4%) | 22 (42.3%) | 27 (44.3%) |
| Female | 385 (53.5%) | 116 (47.5%) | 205 (56.6%) | 30 (57.7%) | 34 (55.7%) |
| Age n (%) | |||||
| 16–20 years | 49 (6.8%) | 15 (6.1%) | 15 (4.1%) | 15 (28.8%) | 4 (6.6%) |
| 21–35 years | 272 (37.8%) | 97 (39.8%) | 121 (33.4%) | 30 (57.7%) | 24 (39.3%) |
| 36–50 years | 255 (35.5%) | 83 (34.0%) | 144 (39.8%) | 4 (7.7%) | 24 (39.3%) |
| 51–70 years | 129 (17.9%) | 44 (18.0%) | 74 (20.4%) | 3 (5.8%) | 8 (13.1%) |
| ≥ 71 years | 14 (1.9%) | 5 (2.0%) | 8 (2.2%) | 0 (0.0%) | 1 (1.6%) |
| Education level n (%) | |||||
| Primary school and below | 273 (38.0%) | 91 (37.3%) | 137 (37.8%) | 18 (34.6%) | 27 (44.3%) |
| Middle school | 307 (42.7%) | 104 (42.6%) | 152 (42.0%) | 29 (55.8%) | 22 (36.1%) |
| High school | 96 (13.4%) | 29 (11.5%) | 56 (15.5%) | 4 (7.7%) | 8 (13.1%) |
| Bachelor | 41 (5.7%) | 20 (8.2%) | 16 (4.4%) | 1 (1.9%) | 4 (6.6%) |
| Master and above | 2 (0.3%) | 1 (0.4%) | 1 (0.3%) | 0 (0.0%) | 0 (0.0%) |
| Occupation n (%) | |||||
| Work in company | 141 (19.6%) | 34 (13.9%) | 73 (20.2%) | 12 (23.1%) | 22 (36.1%) |
| Work in government | 45 (6.3%) | 8 (3.3%) | 33 (9.1%) | 2 (3.8%) | 2 (3.3%) |
| Self-employed person | 305 (42.4%) | 122 (50.0%) | 128 (35.4%) | 27 (51.9%) | 28 (45.9%) |
| Student | 37 (5.1%) | 11 (4.5%) | 24 (6.6%) | 0 (0.0%) | 2 (3.3%) |
| Retired person | 78 (10.8%) | 23 (9.4%) | 48 (13.3%) | 4 (7.7%) | 3 (4.9%) |
| Others | 113 (15.7%) | 46 (18.9%) | 56 (15.5%) | 7 (13.5%) | 4 (6.6%) |
| Income per month n (%) | |||||
| ¥0–2000 | 324 (45.1%) | 108 (44.3%) | 173 (47.8%) | 20 (38.5%) | 23 (37.7%) |
| ¥2001–5000 | 353 (49.1%) | 122 (50.0%) | 171 (47.2%) | 28 (53.8%) | 32 (52.5%) |
| ¥5001–8000 | 36 (5.0%) | 12 (4.9%) | 15 (4.1%) | 4 (7.7%) | 5 (8.2%) |
| ≥¥8000 | 6 (0.8%) | 2 (0.8%) | 3 (0.8%) | 0 (0.0%) | 1 (1.6%) |
Table 3.
The distribution of the respondents regarding flood experience and trust in government (N = 719).
Table 3.
The distribution of the respondents regarding flood experience and trust in government (N = 719).
| District | Jingdezhen City (Total) | Changjiang District | Zhushan District | Leping County | Fuliang County |
|---|---|---|---|---|---|
| Number of respondents n (%) | 719 (100%) | 244 (33.9%) | 362 (50.3%) | 52 (7.2%) | 61 (8.5%) |
| Flood experience n (%) | |||||
| Less than once every two years | 268 (37.3%) | 81 (33.2%) | 123 (34.0%) | 37 (71.2%) | 27 (44.3%) |
| Once every two years | 109 (15.2%) | 23 (9.4%) | 78 (21.5%) | 4 (7.7%) | 4 (6.6%) |
| One or two times every year | 211 (29.3%) | 78 (32.0%) | 104 (28.7%) | 8 (15.4%) | 21 (34.4%) |
| More than two times every year | 131 (18.2%) | 62 (25.4%) | 57 (15.7%) | 3 (5.8%) | 9 (14.8%) |
| Flood knowledge education n (%) | |||||
| Never | 189 (26.3%) | 79 (32.4%) | 63 (17.4%) | 22 (42.3%) | 25 (41.0%) |
| Few | 188 (26.1%) | 71 (29.1%) | 84 (23.2%) | 16 (30.8%) | 17 (27.9%) |
| Medium | 201 (28.0%) | 61 (25.0%) | 114 (31.5%) | 10 (19.2%) | 16 (26.2%) |
| Many | 141 (19.6%) | 33 (13.5%) | 101 (27.9%) | 4 (7.7%) | 3 (4.9%) |
| Flood protection responsibility n (%) | |||||
| Government | 348 (48.4%) | 99 (40.6%) | 196 (54.1%) | 28 (53.8%) | 25 (41.0%) |
| Flood management experts | 177 (24.6%) | 86 (35.2%) | 62 (17.1%) | 13 (25.0%) | 16 (26.2%) |
| Company | 12 (1.7%) | 4 (1.6%) | 7 (1.9%) | 0 (0.0%) | 1 (1.6%) |
| Community committee | 83 (11.5%) | 35 (14.3%) | 38 (10.5%) | 0 (0.0%) | 10 (16.4%) |
| Public | 99 (13.8%) | 20 (8.2%) | 59 (16.3%) | 11 (21.2%) | 9 (14.8%) |
| Trust in government n (%) | |||||
| Not trust | 151 (21.0%) | 62 (25.4%) | 60 (16.6%) | 8 (15.4%) | 21 (34.4%) |
| Low trust | 389 (54.1%) | 129 (52.9%) | 195 (53.9%) | 29 (55.8%) | 36 (59.0%) |
| Medium trust | 133 (18.5%) | 37 (15.2%) | 84 (23.2%) | 8 (15.4%) | 4 (6.6%) |
| High trust | 46 (6.4%) | 16 (6.6%) | 23 (6.4%) | 7 (13.5%) | 0 (0.0%) |
Table 4.
The descriptive statistic of the flood risk perception of case areas.
| Residents | Mean | N | Std. Deviation | Std. Error | p Value |
|---|---|---|---|---|---|
| Changjiang District | 3.24 | 244 | 0.842 | 0.054 | 0.000 * |
| Zhushan District | 3.12 | 362 | 0.867 | 0.046 | |
| Leping County | 2.65 | 52 | 1.027 | 0.142 | |
| Fuliang County | 3.11 | 61 | 0.686 | 0.088 | |
| Total | 3.13 | 719 | 0.867 | 0.032 |
Note: * with statistical difference (p < 0.05).
Table 5.
Analysis of variance (ANOVA) results of impact factors and public flood risk perception.
| Variables | p Value | Variables | p Value |
|---|---|---|---|
| District | 0.000 * | Income per month | 0.000 * |
| Gender | 0.000 * | Flood experience | 0.000 * |
| Age | 0.000 * | Flood knowledge education | 0.001 * |
| Education level | 0.000 * | Flood protection responsibility | 0.030 * |
| Occupation | 0.994 | Trust in government | 0.000 * |
Note: * with statistical difference (p < 0.05).
Table 6.
Multiple Comparisons for factors affecting public flood risk perception.
| Variable | Mean Difference | Std. Error | Sig. | 95% Confidence Interval | |
|---|---|---|---|---|---|
| Lower Bound | Upper Bound | ||||
| District (vs. Leping) | |||||
| Changjiang | 0.584 * | 0.131 | 0.000 * | 0.33 | 0.84 |
| Zhushan | 0.470 * | 0.127 | 0.000 * | 0.22 | 0.72 |
| Fuliang | 0.461 * | 0.162 | 0.005 * | 0.14 | 0.78 |
| Gender (vs. Male) | |||||
| Female | 0.228 * | 0.064 | 0.000 * | 0.101 | 0.354 |
| Age (vs. 51–70 years) | |||||
| 16–20 years | −0.851 * | 0.140 | 0.000 * | −1.13 | −0.58 |
| 21–35 years | −0.555 * | 0.089 | 0.000 * | −0.73 | −0.38 |
| 36–50 years | −0.304 * | 0.090 | 0.001 * | −0.48 | −0.13 |
| ≥ 71 years | −0.004 | 0.235 | 0.987 | −0.47 | 0.46 |
| Education level (vs. Bachelor) | |||||
| Primary School and below | 0.608 * | 0.143 | 0.000 * | 0.33 | 0.89 |
| Middle school | 0.512 * | 0.142 | 0.000 * | 0.23 | 0.79 |
| High school | 0.324 * | 0.160 | 0.043 * | 0.01 | 0.64 |
| Master and above | 0.366 | 0.620 | 0.555 | −0.85 | 1.58 |
| Occupation (vs. Work in company) | |||||
| Work in government | 0.034 | 0.149 | 0.819 | −0.26 | 0.33 |
| Self-employed person | 0.052 | 0.089 | 0.561 | −0.12 | 0.23 |
| Student | 0.009 | 0.161 | 0.956 | −0.31 | 0.32 |
| Retired person | 0.029 | 0.123 | 0.814 | −0.21 | 0.27 |
| Others | 0.007 | 0.110 | 0.950 | −0.21 | 0.22 |
| Income per month (vs. ≤¥2000) | |||||
| ¥2001–5000 | −0.356 * | 0.065 | 0.000 * | −0.48 | −0.23 |
| ¥5001–8000 | −0.472 * | 0.149 | 0.002 * | −0.76 | −0.18 |
| ≥¥8000 | −0.833 * | 0.349 | 0.017 * | −1.52 | −0.15 |
| Flood experience (vs. Less than once every two years) | |||||
| Once every two years | −0.265 * | 0.095 | 0.005 * | 0.08 | 0.45 |
| 1–2 times every year | −0.501 * | 0.077 | 0.000 * | 0.35 | 0.65 |
| More than 2 times every year | 0.576 * | 0.089 | 0.000 * | 0.40 | 0.75 |
| Flood Knowledge Education (vs. Many) | |||||
| Never | −0.362 * | 0.096 | 0.000 * | −0.55 | −0.17 |
| Few | −0.330 * | 0.096 | 0.001 * | −0.52 | −0.14 |
| Medium | −0.264 * | 0.094 | 0.005 * | −0.45 | −0.08 |
| Protection responsibility (vs. Public) | |||||
| Government | −0.262 * | 0.098 | 0.008 * | −0.45 | −0.07 |
| Flood management experts | −0.303 * | 0.108 | 0.005 * | −0.52 | −0.09 |
| Company | −0.270 * | 0.264 | 0.307 | −0.79 | 0.25 |
| Community committee | −0.173 * | 0.129 | 0.180 | −0.43 | 0.08 |
| Trust in government (vs. Not Trust) | |||||
| Low Trust | −0.237 * | 0.082 | 0.004 * | 0.08 | 0.40 |
| Medium Trust | −0.395 * | 0.102 | 0.000 * | −0.60 | −0.19 |
| High Trust | −0.445 * | 0.145 | 0.002 * | −0.73 | −0.16 |
Note: * with statistical difference (p < 0.05). The mean difference among gender using independent T test because of only two group exist, male and female.
© 2018 by the authors. Licensee MDPI, Basel, Switzerland. This article is an open access article distributed under the terms and conditions of the Creative Commons Attribution (CC BY) license (http://creativecommons.org/licenses/by/4.0/).
Share and Cite
MDPI and ACS Style
Wang, Z.; Wang, H.; Huang, J.; Kang, J.; Han, D. Analysis of the Public Flood Risk Perception in a Flood-Prone City: The Case of Jingdezhen City in China. Water 2018, 10, 1577. https://doi.org/10.3390/w10111577
AMA Style
Wang Z, Wang H, Huang J, Kang J, Han D. Analysis of the Public Flood Risk Perception in a Flood-Prone City: The Case of Jingdezhen City in China. Water. 2018; 10(11):1577. https://doi.org/10.3390/w10111577
Chicago/Turabian StyleWang, Zhiqiang, Huimin Wang, Jing Huang, Jinle Kang, and Dawei Han. 2018. "Analysis of the Public Flood Risk Perception in a Flood-Prone City: The Case of Jingdezhen City in China" Water 10, no. 11: 1577. https://doi.org/10.3390/w10111577
Note that from the first issue of 2016, this journal uses article numbers instead of page numbers. See further details here.