Socioeconomic and Environmental Proxies for Comparing Freshwater Ecosystem Service Threats across International Sites: A Diagnostic Approach

 ,
,  , , ,
, , ,
Abstract
:1. Introduction
2. Methods
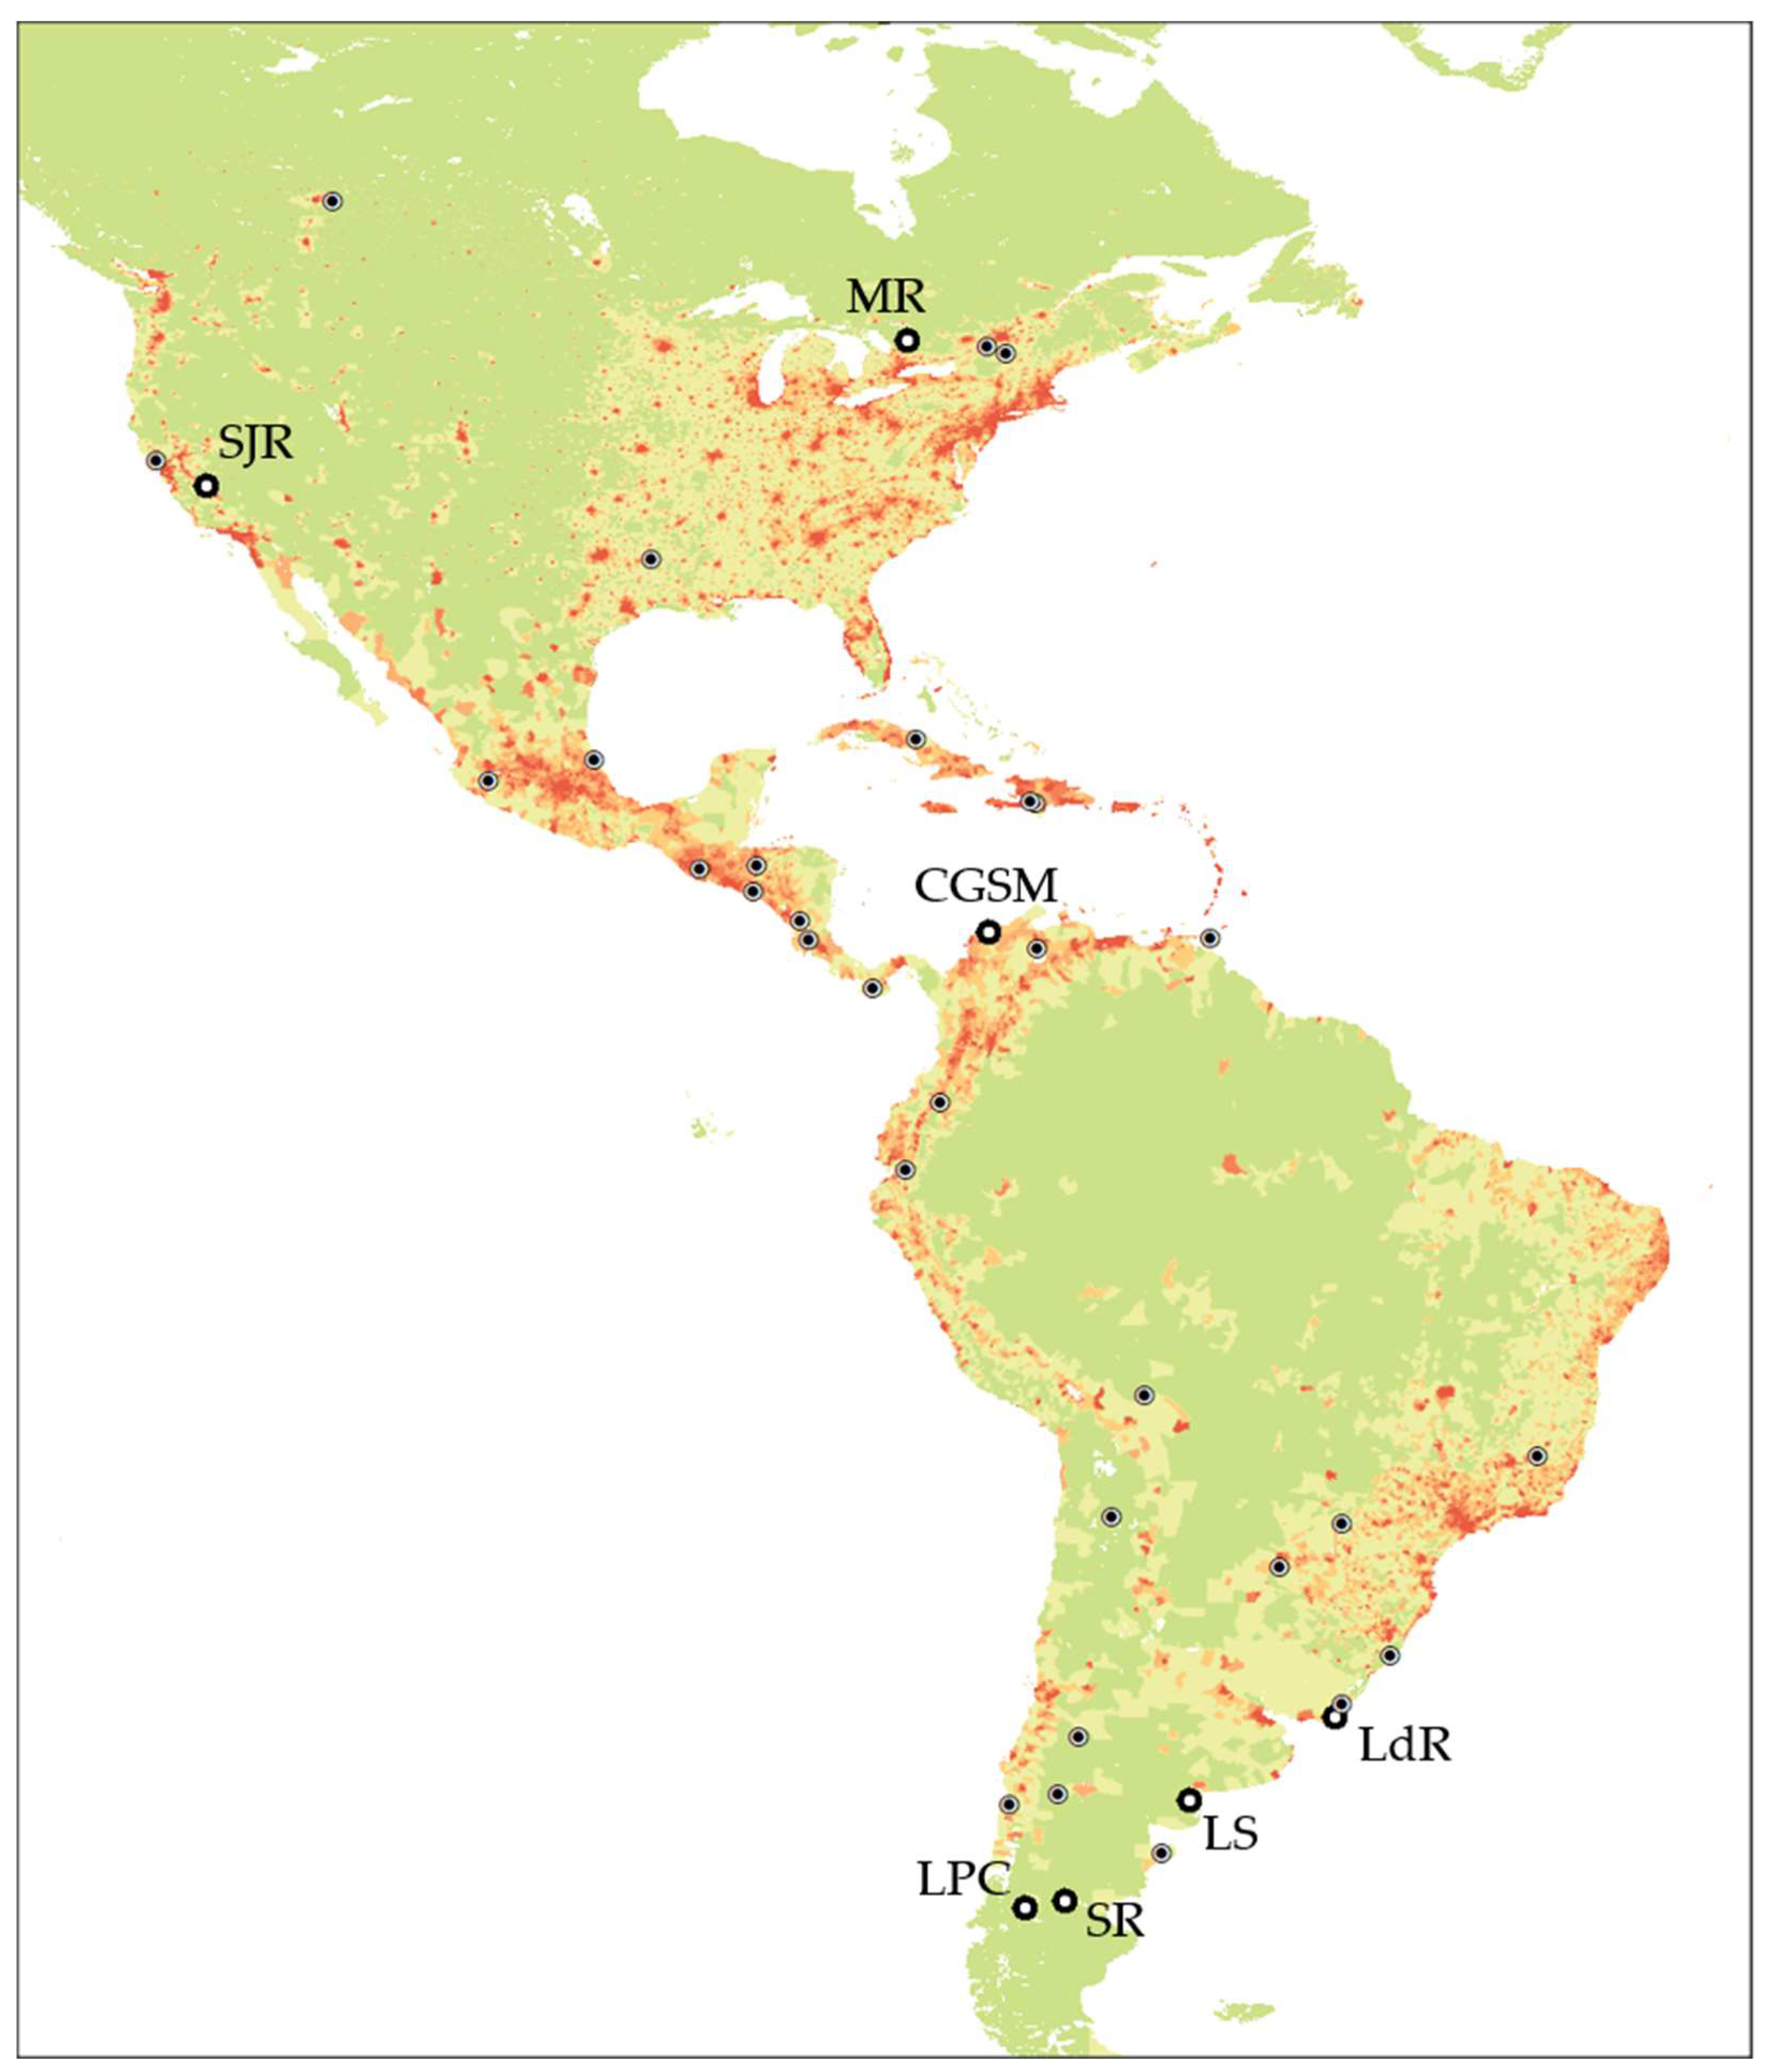
2.1. Study Sites
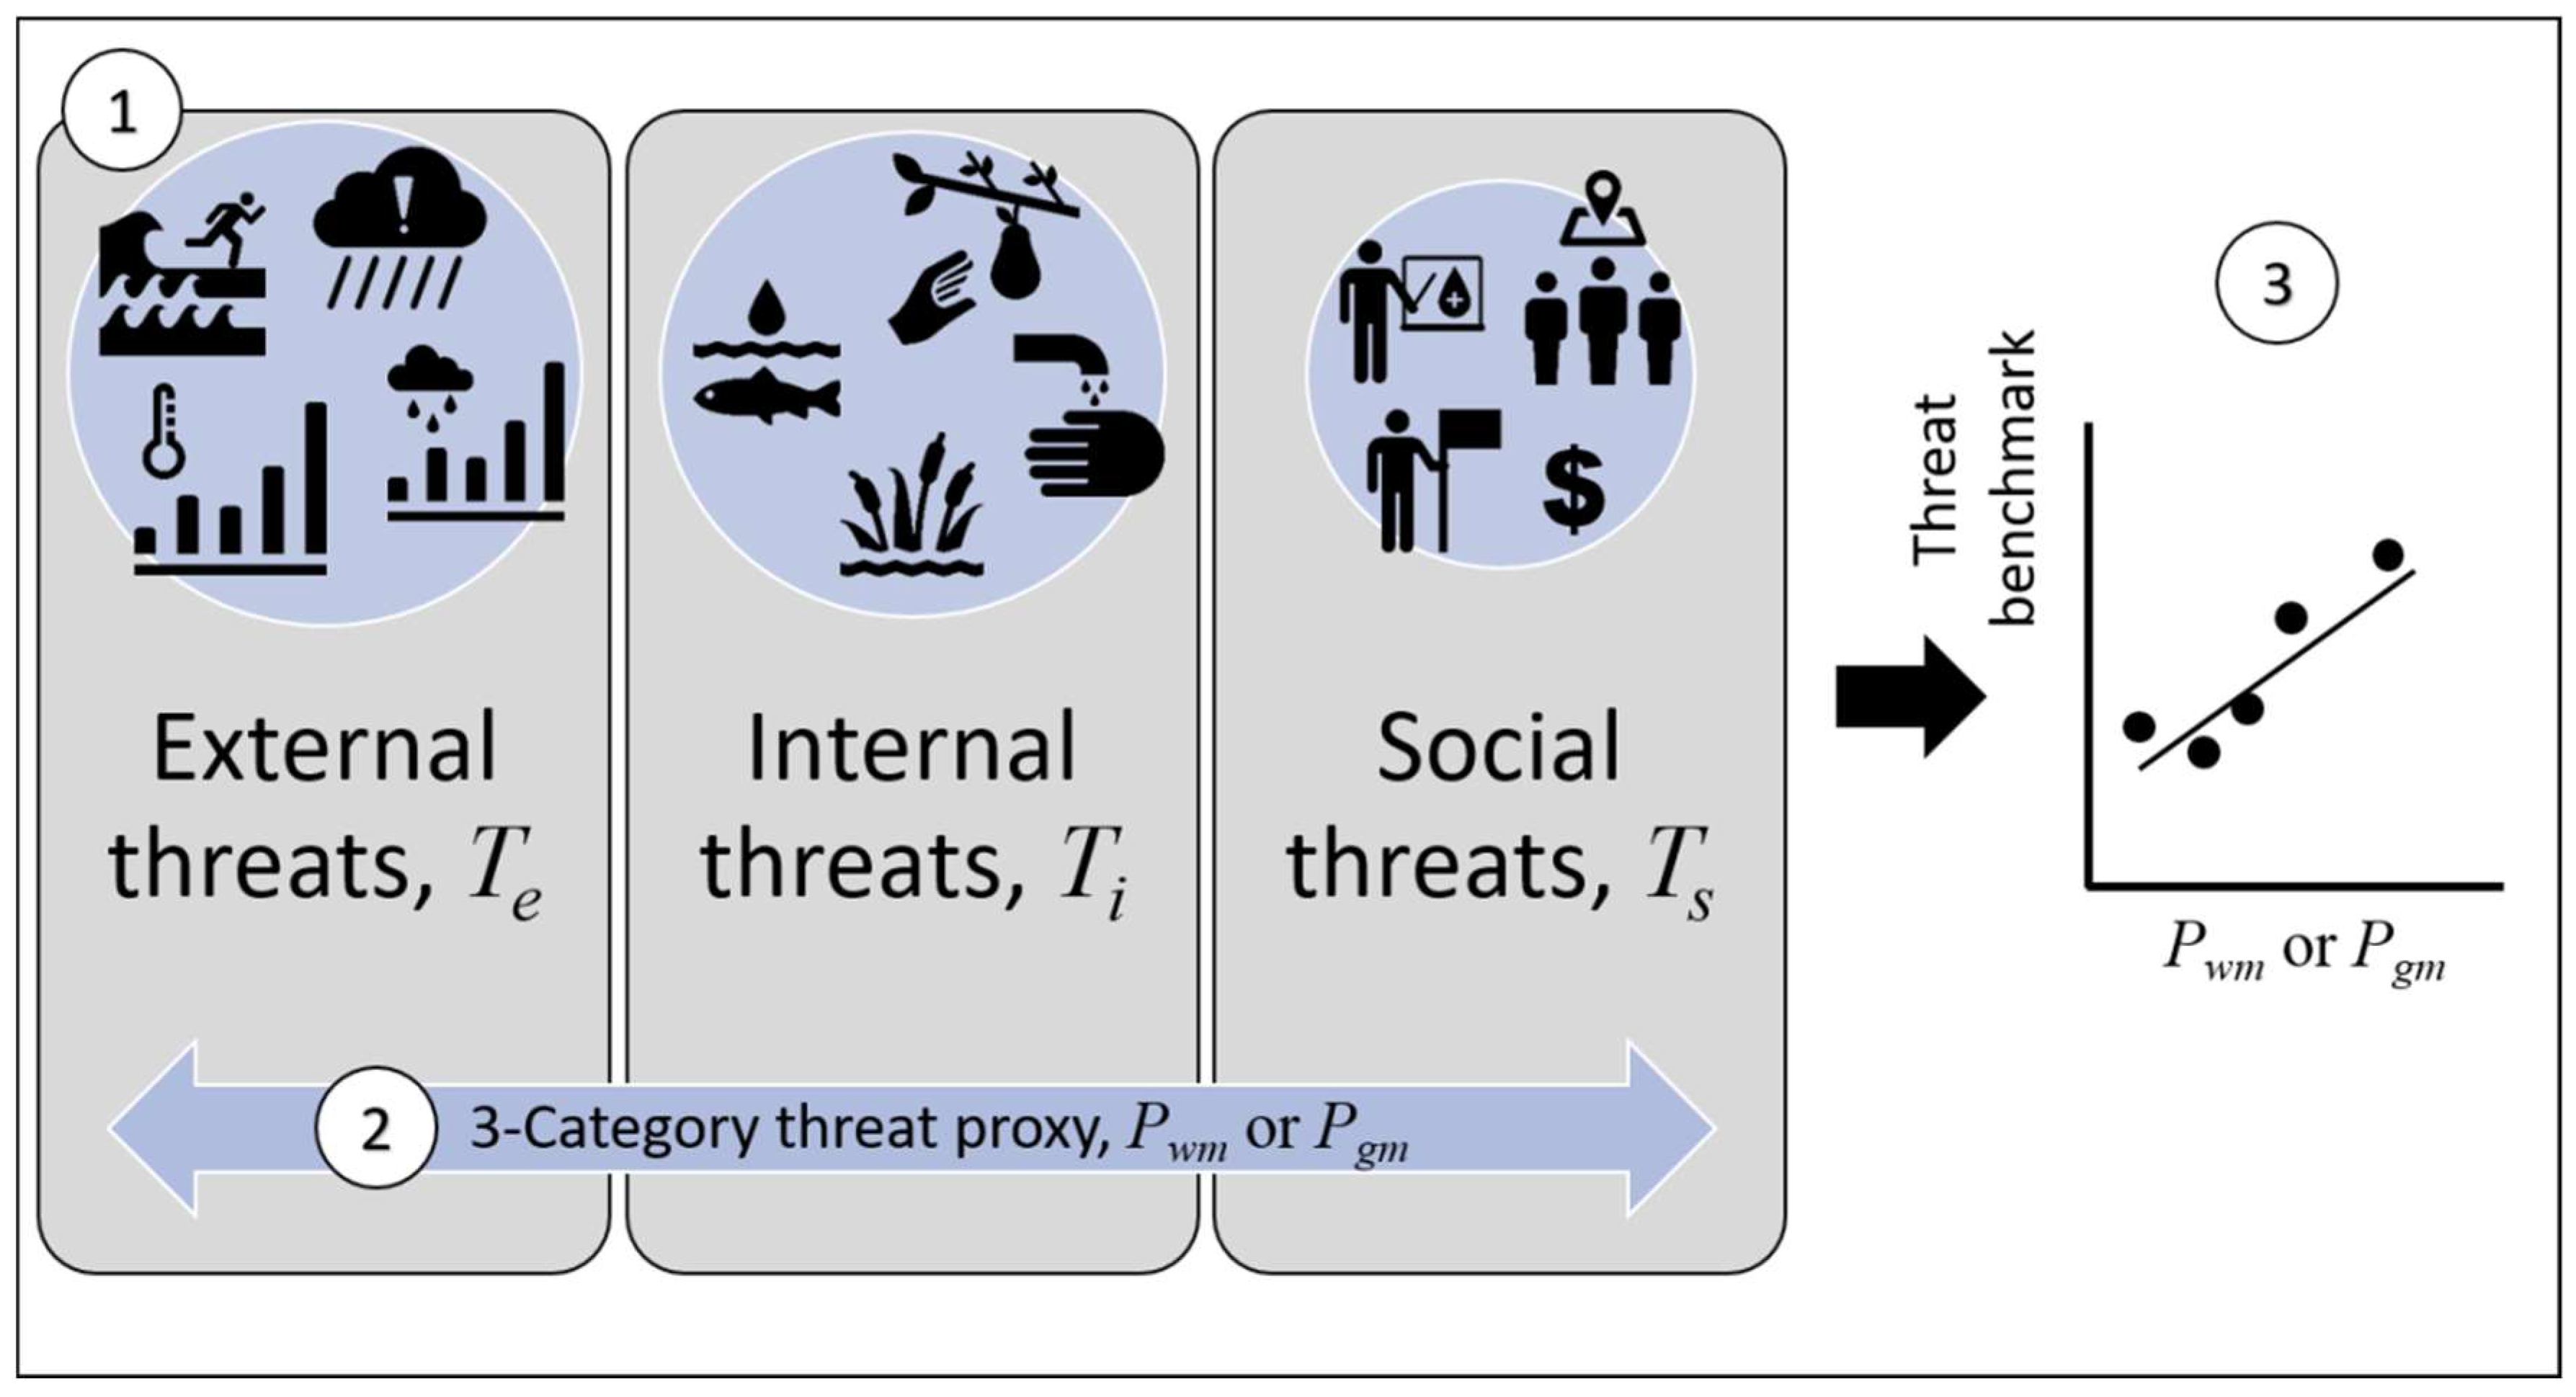
2.2. Identifying Freshwater Ecosystem Service Threat Benchmarks
2.3. Identifying Proxies for Threat Benchmarks
3. Results
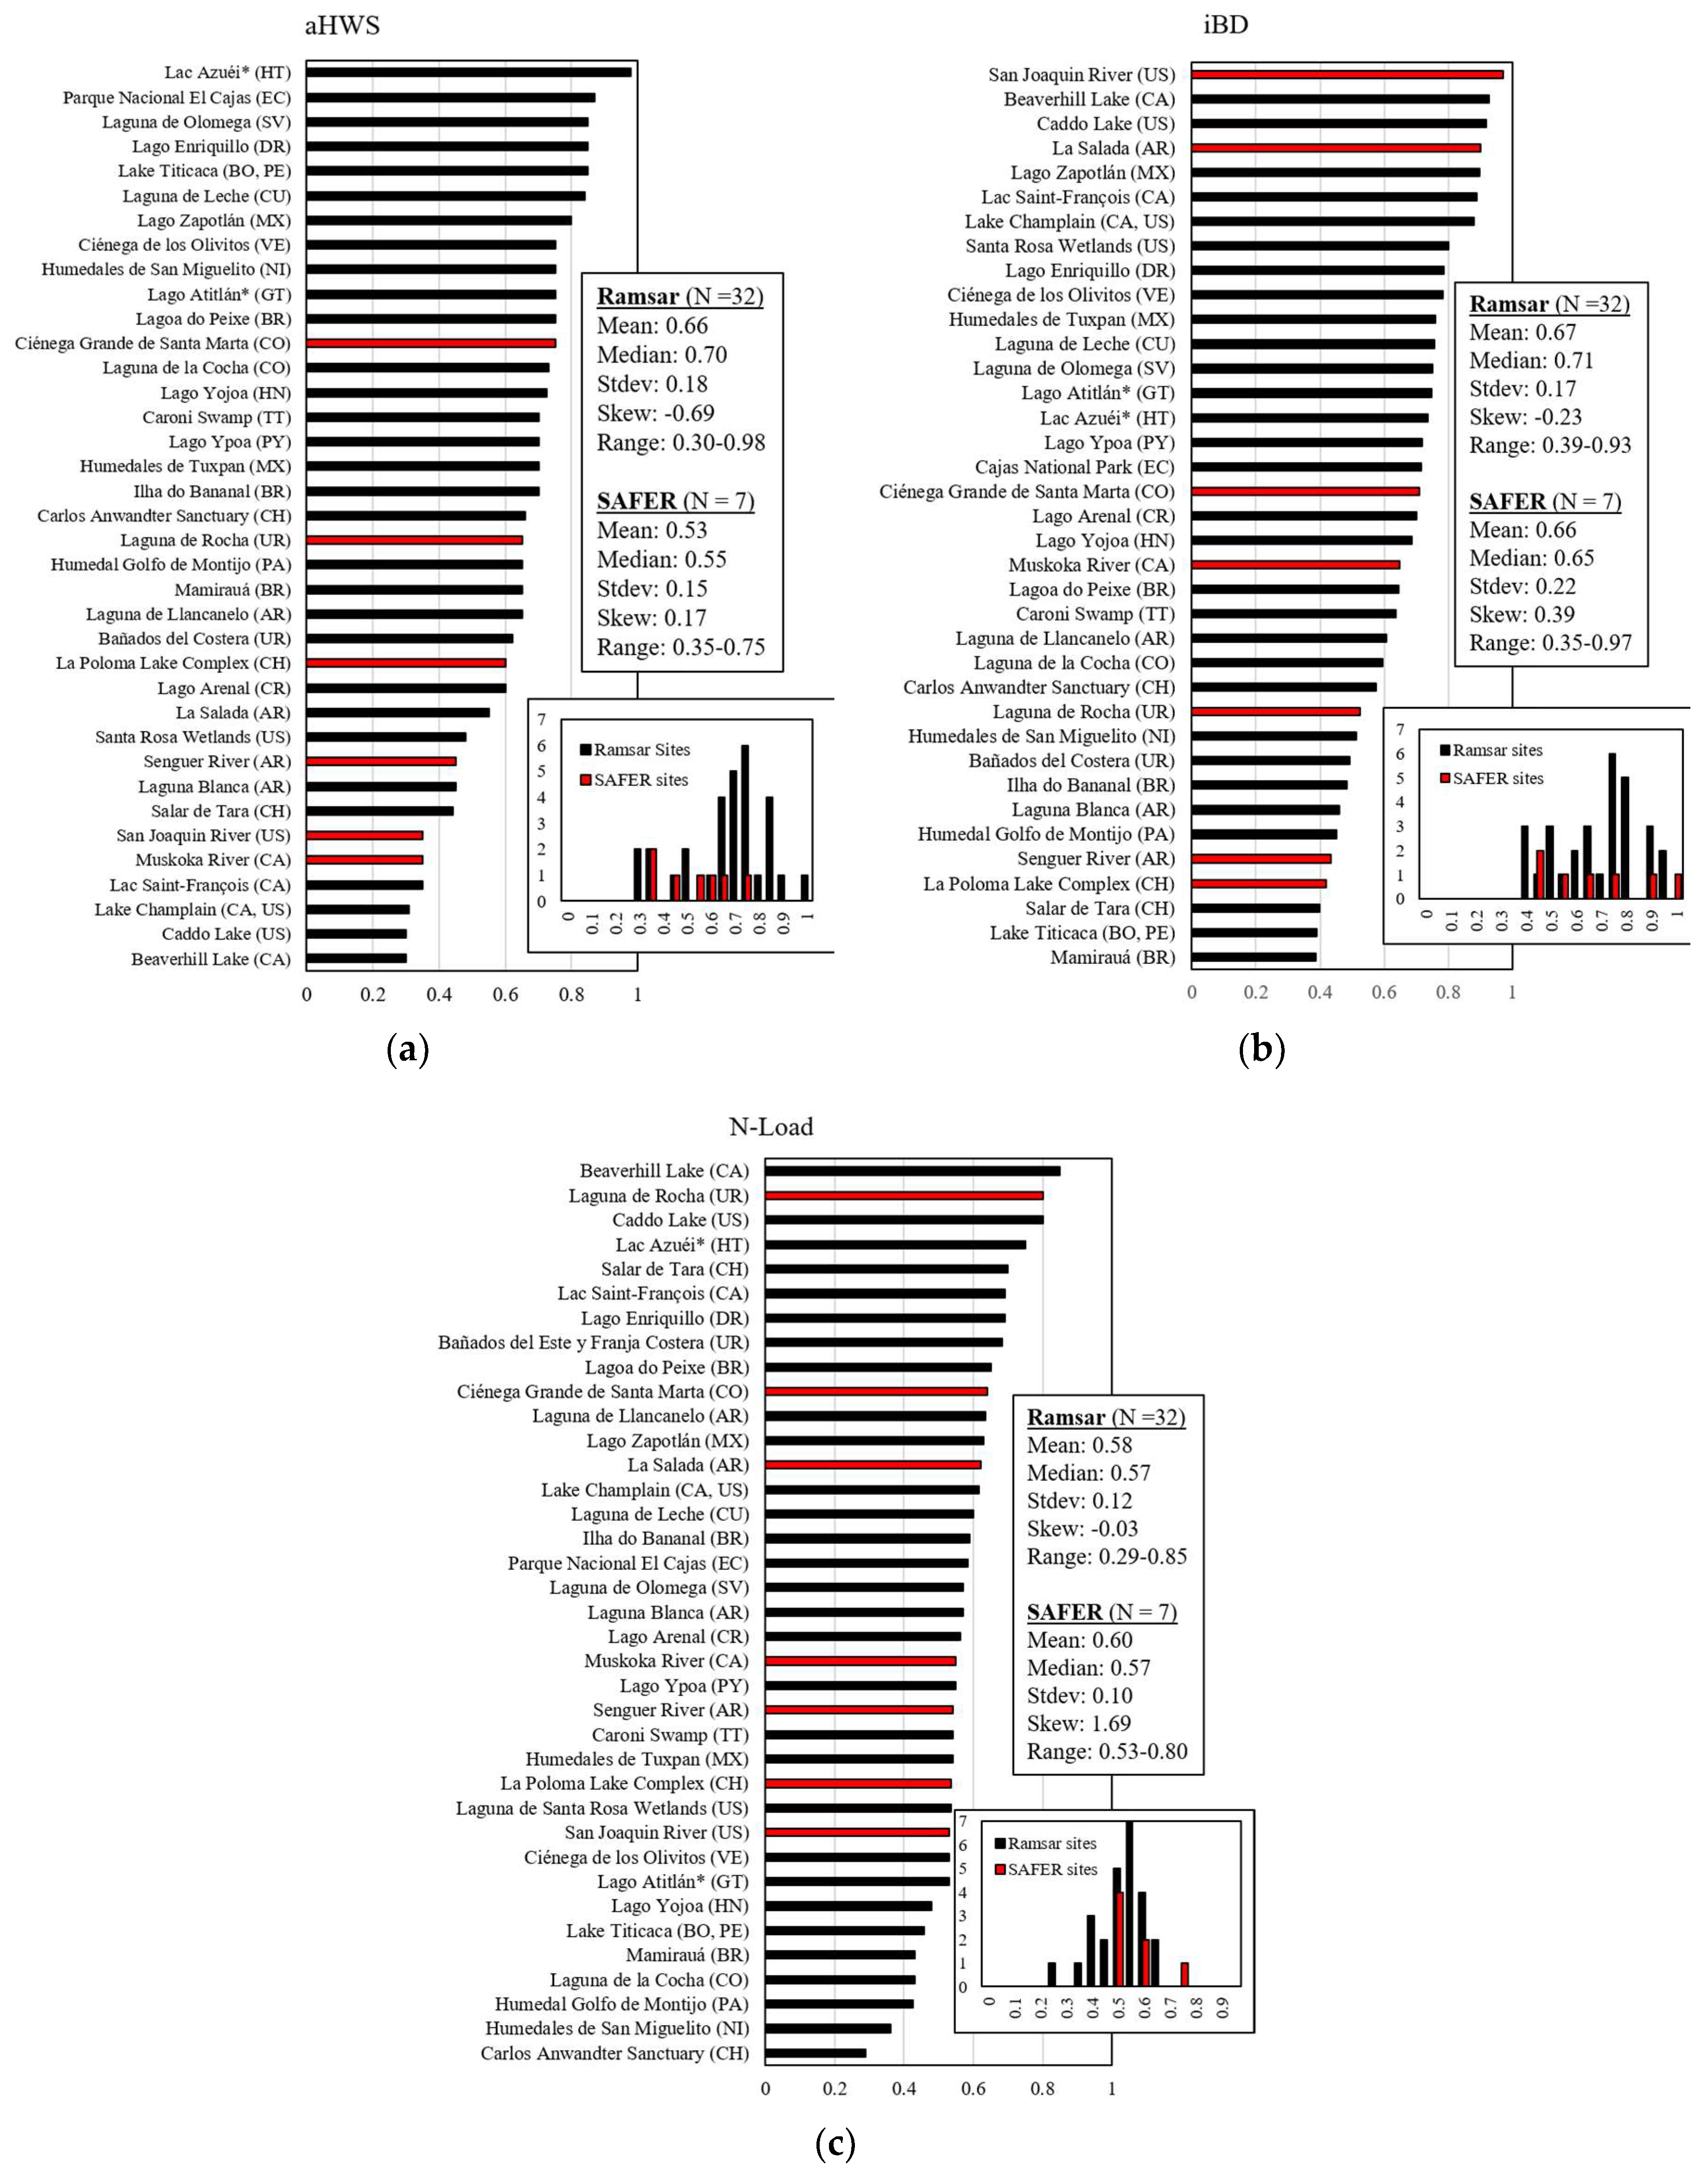
3.1. Freshwater Ecosystem Service Threat Benchmarks
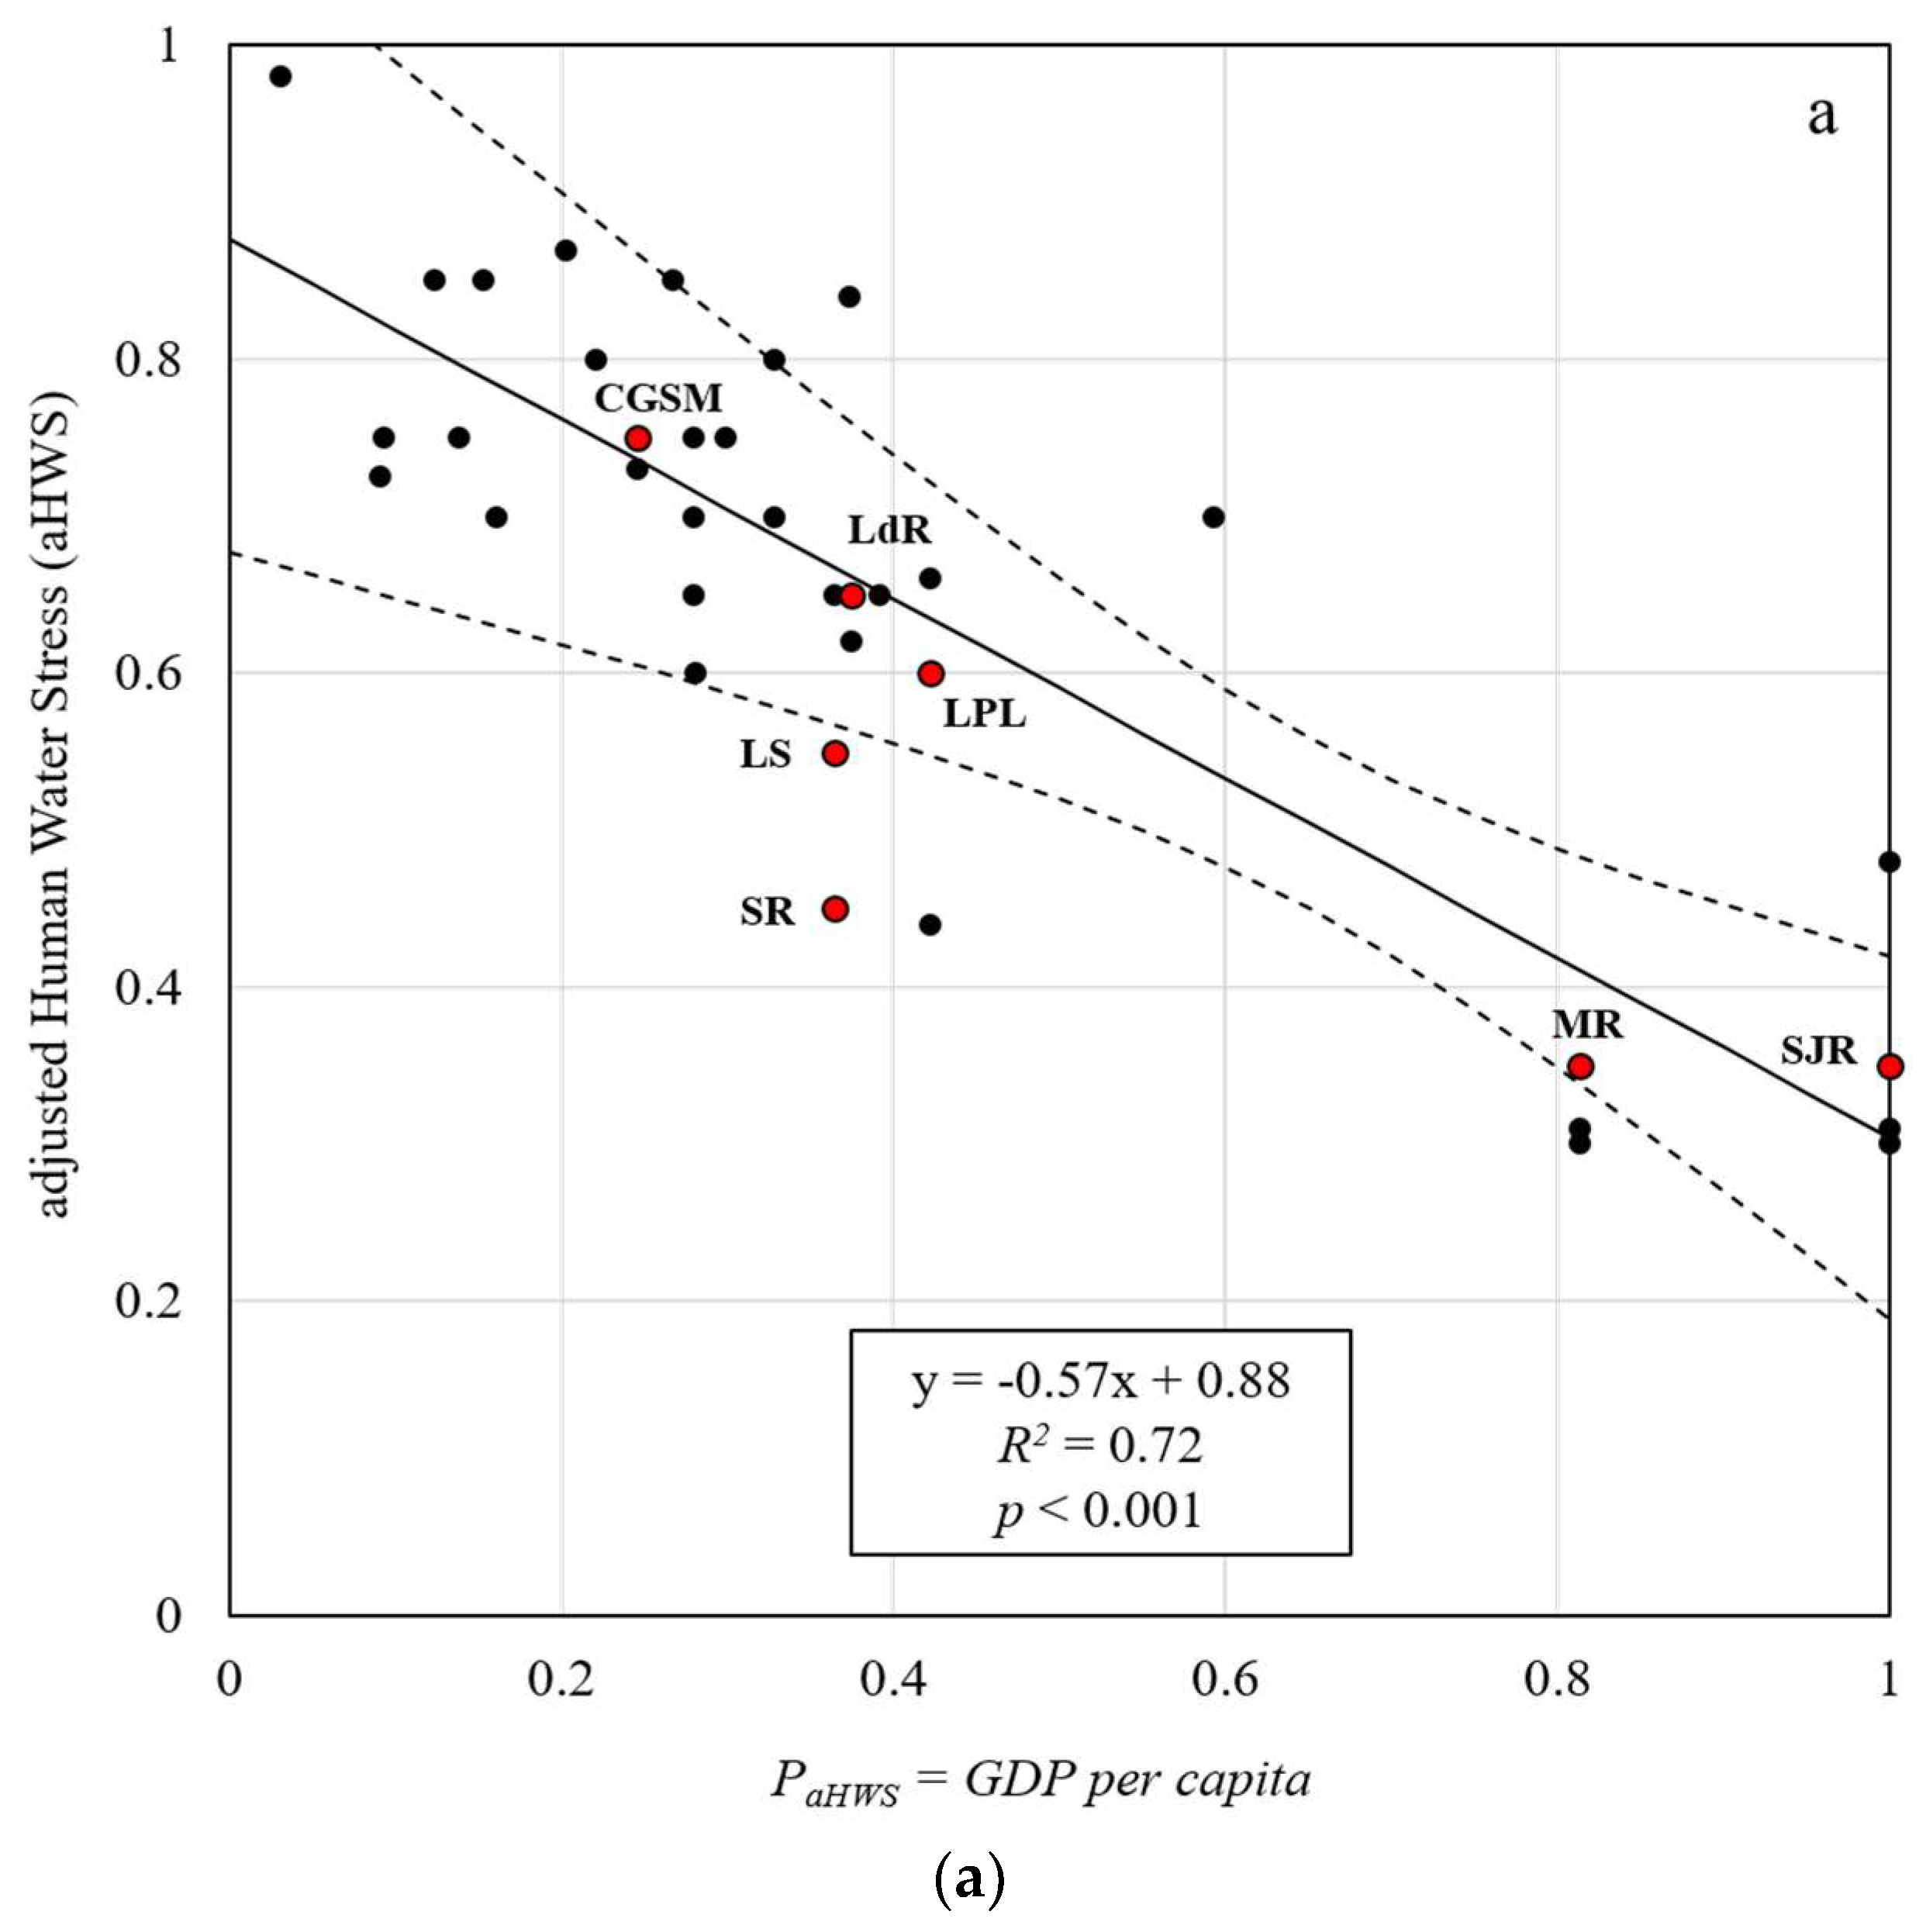
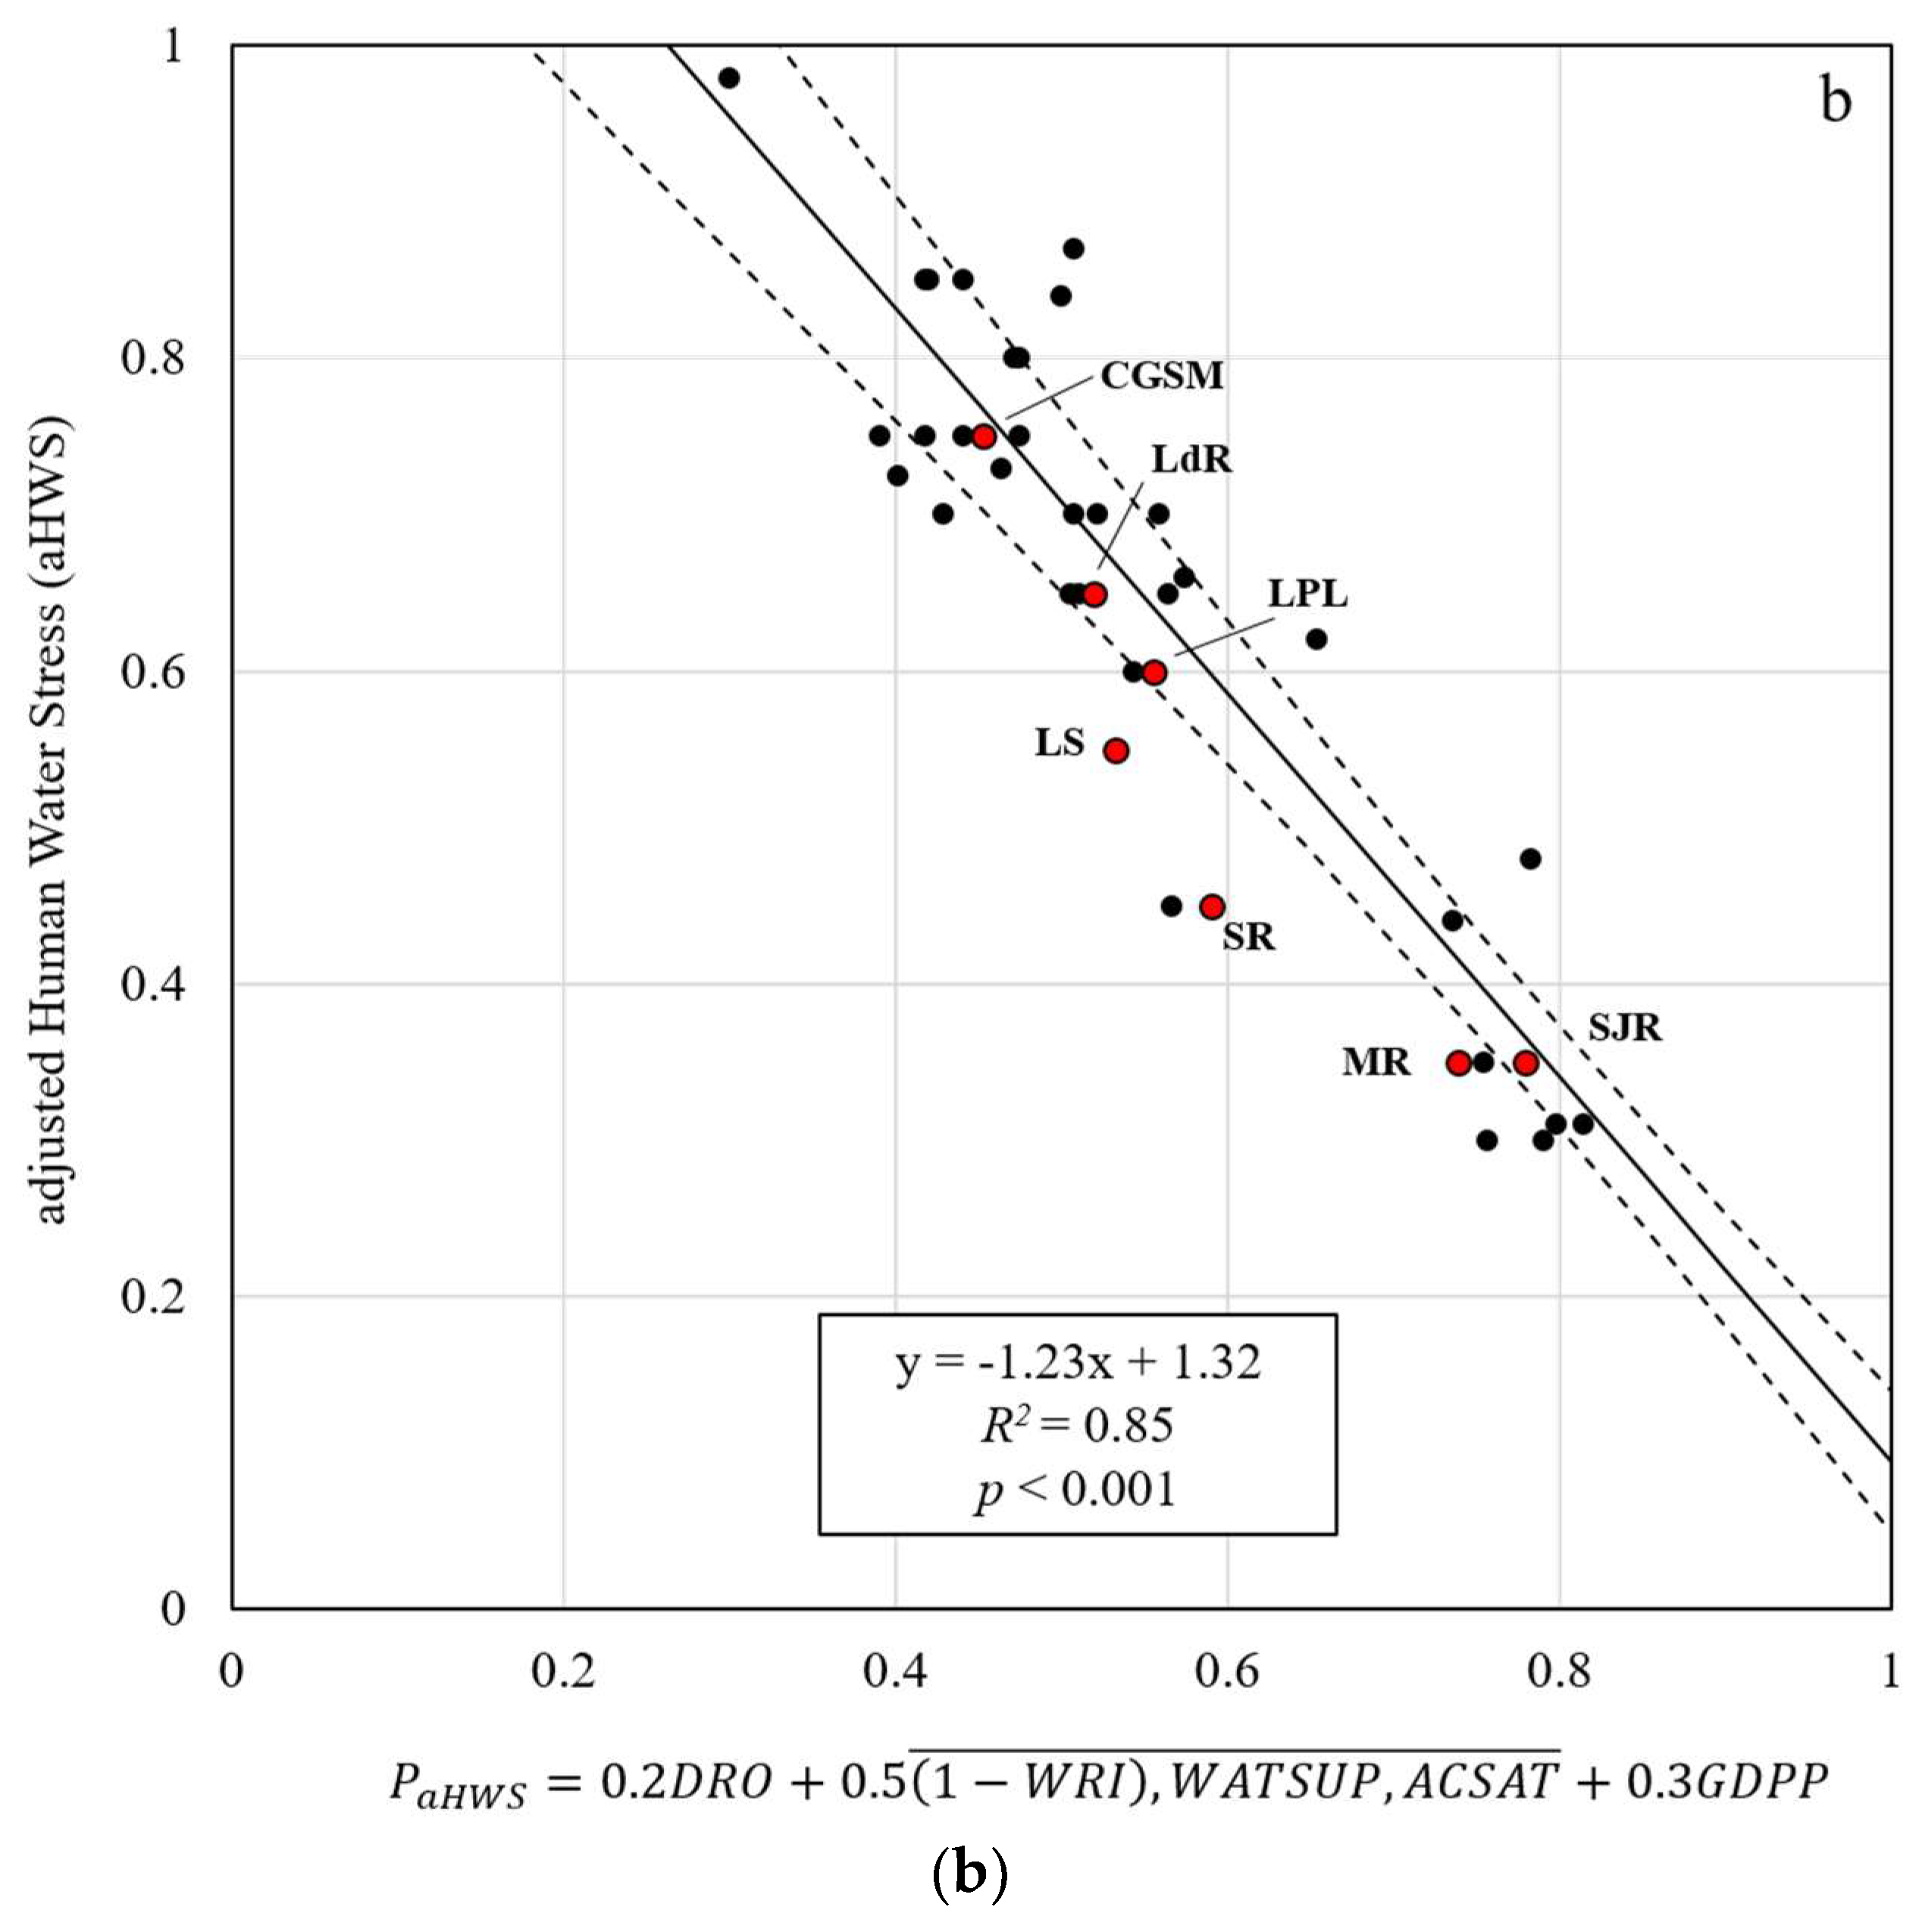
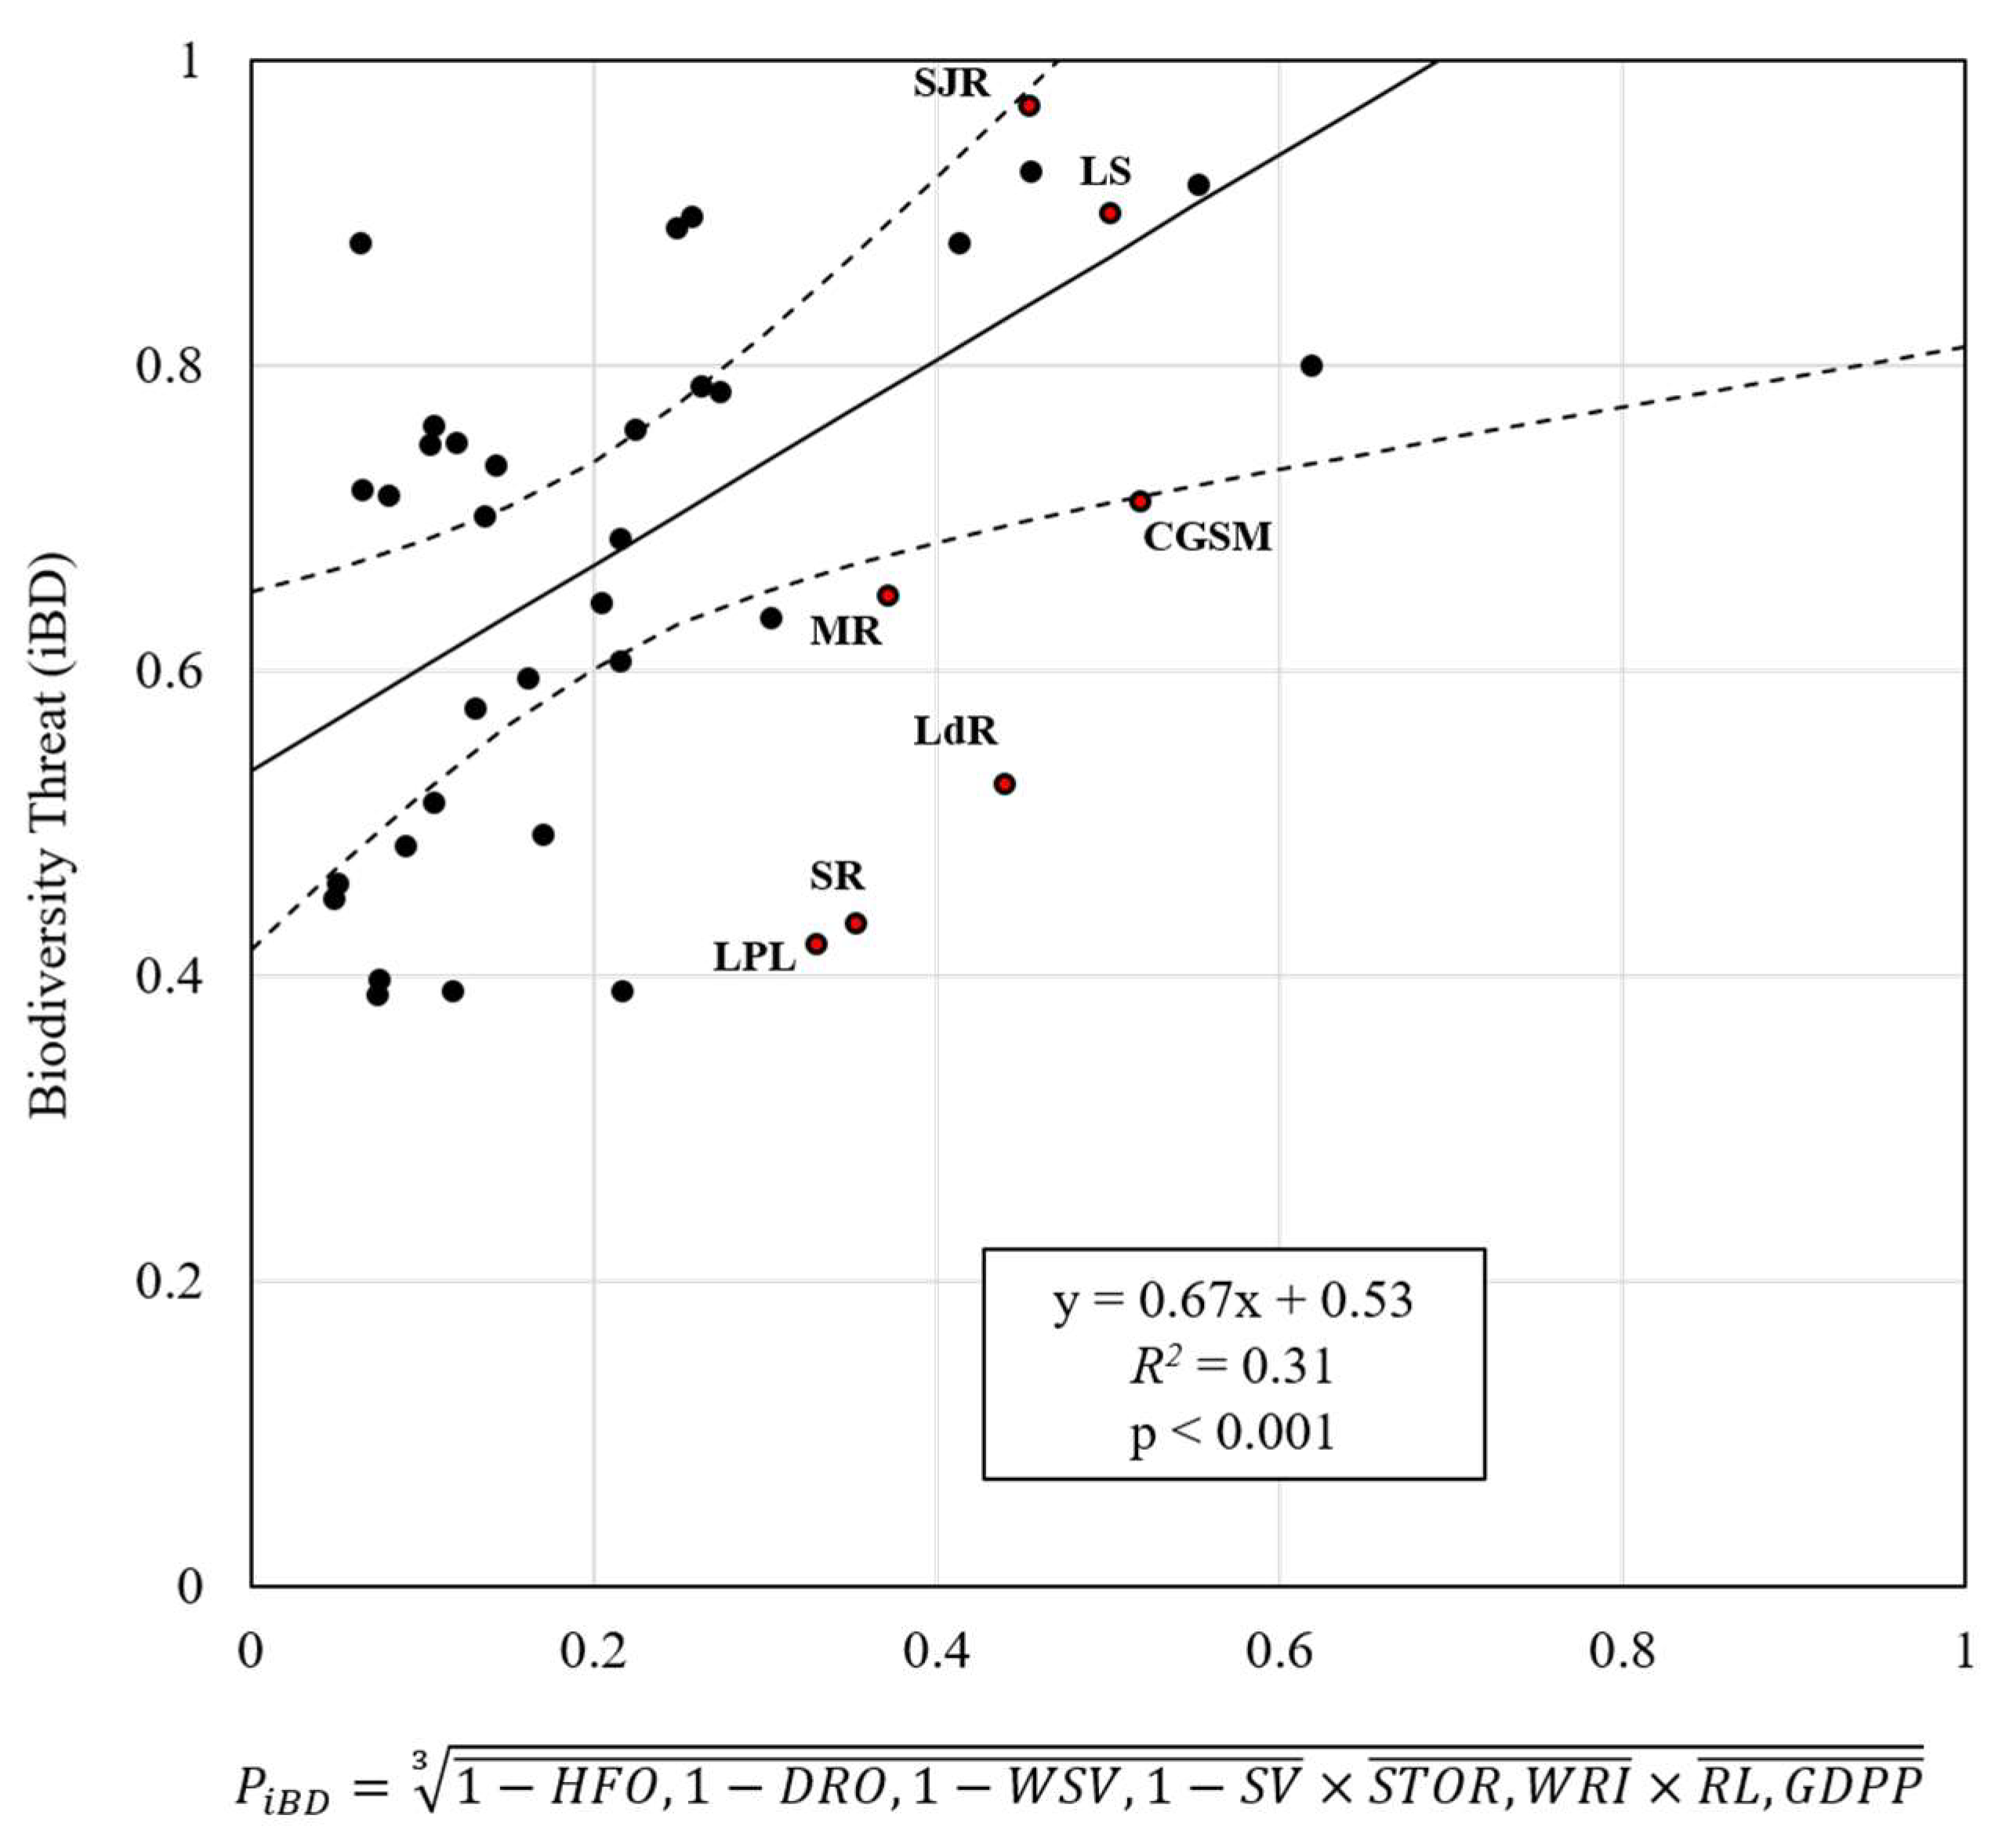
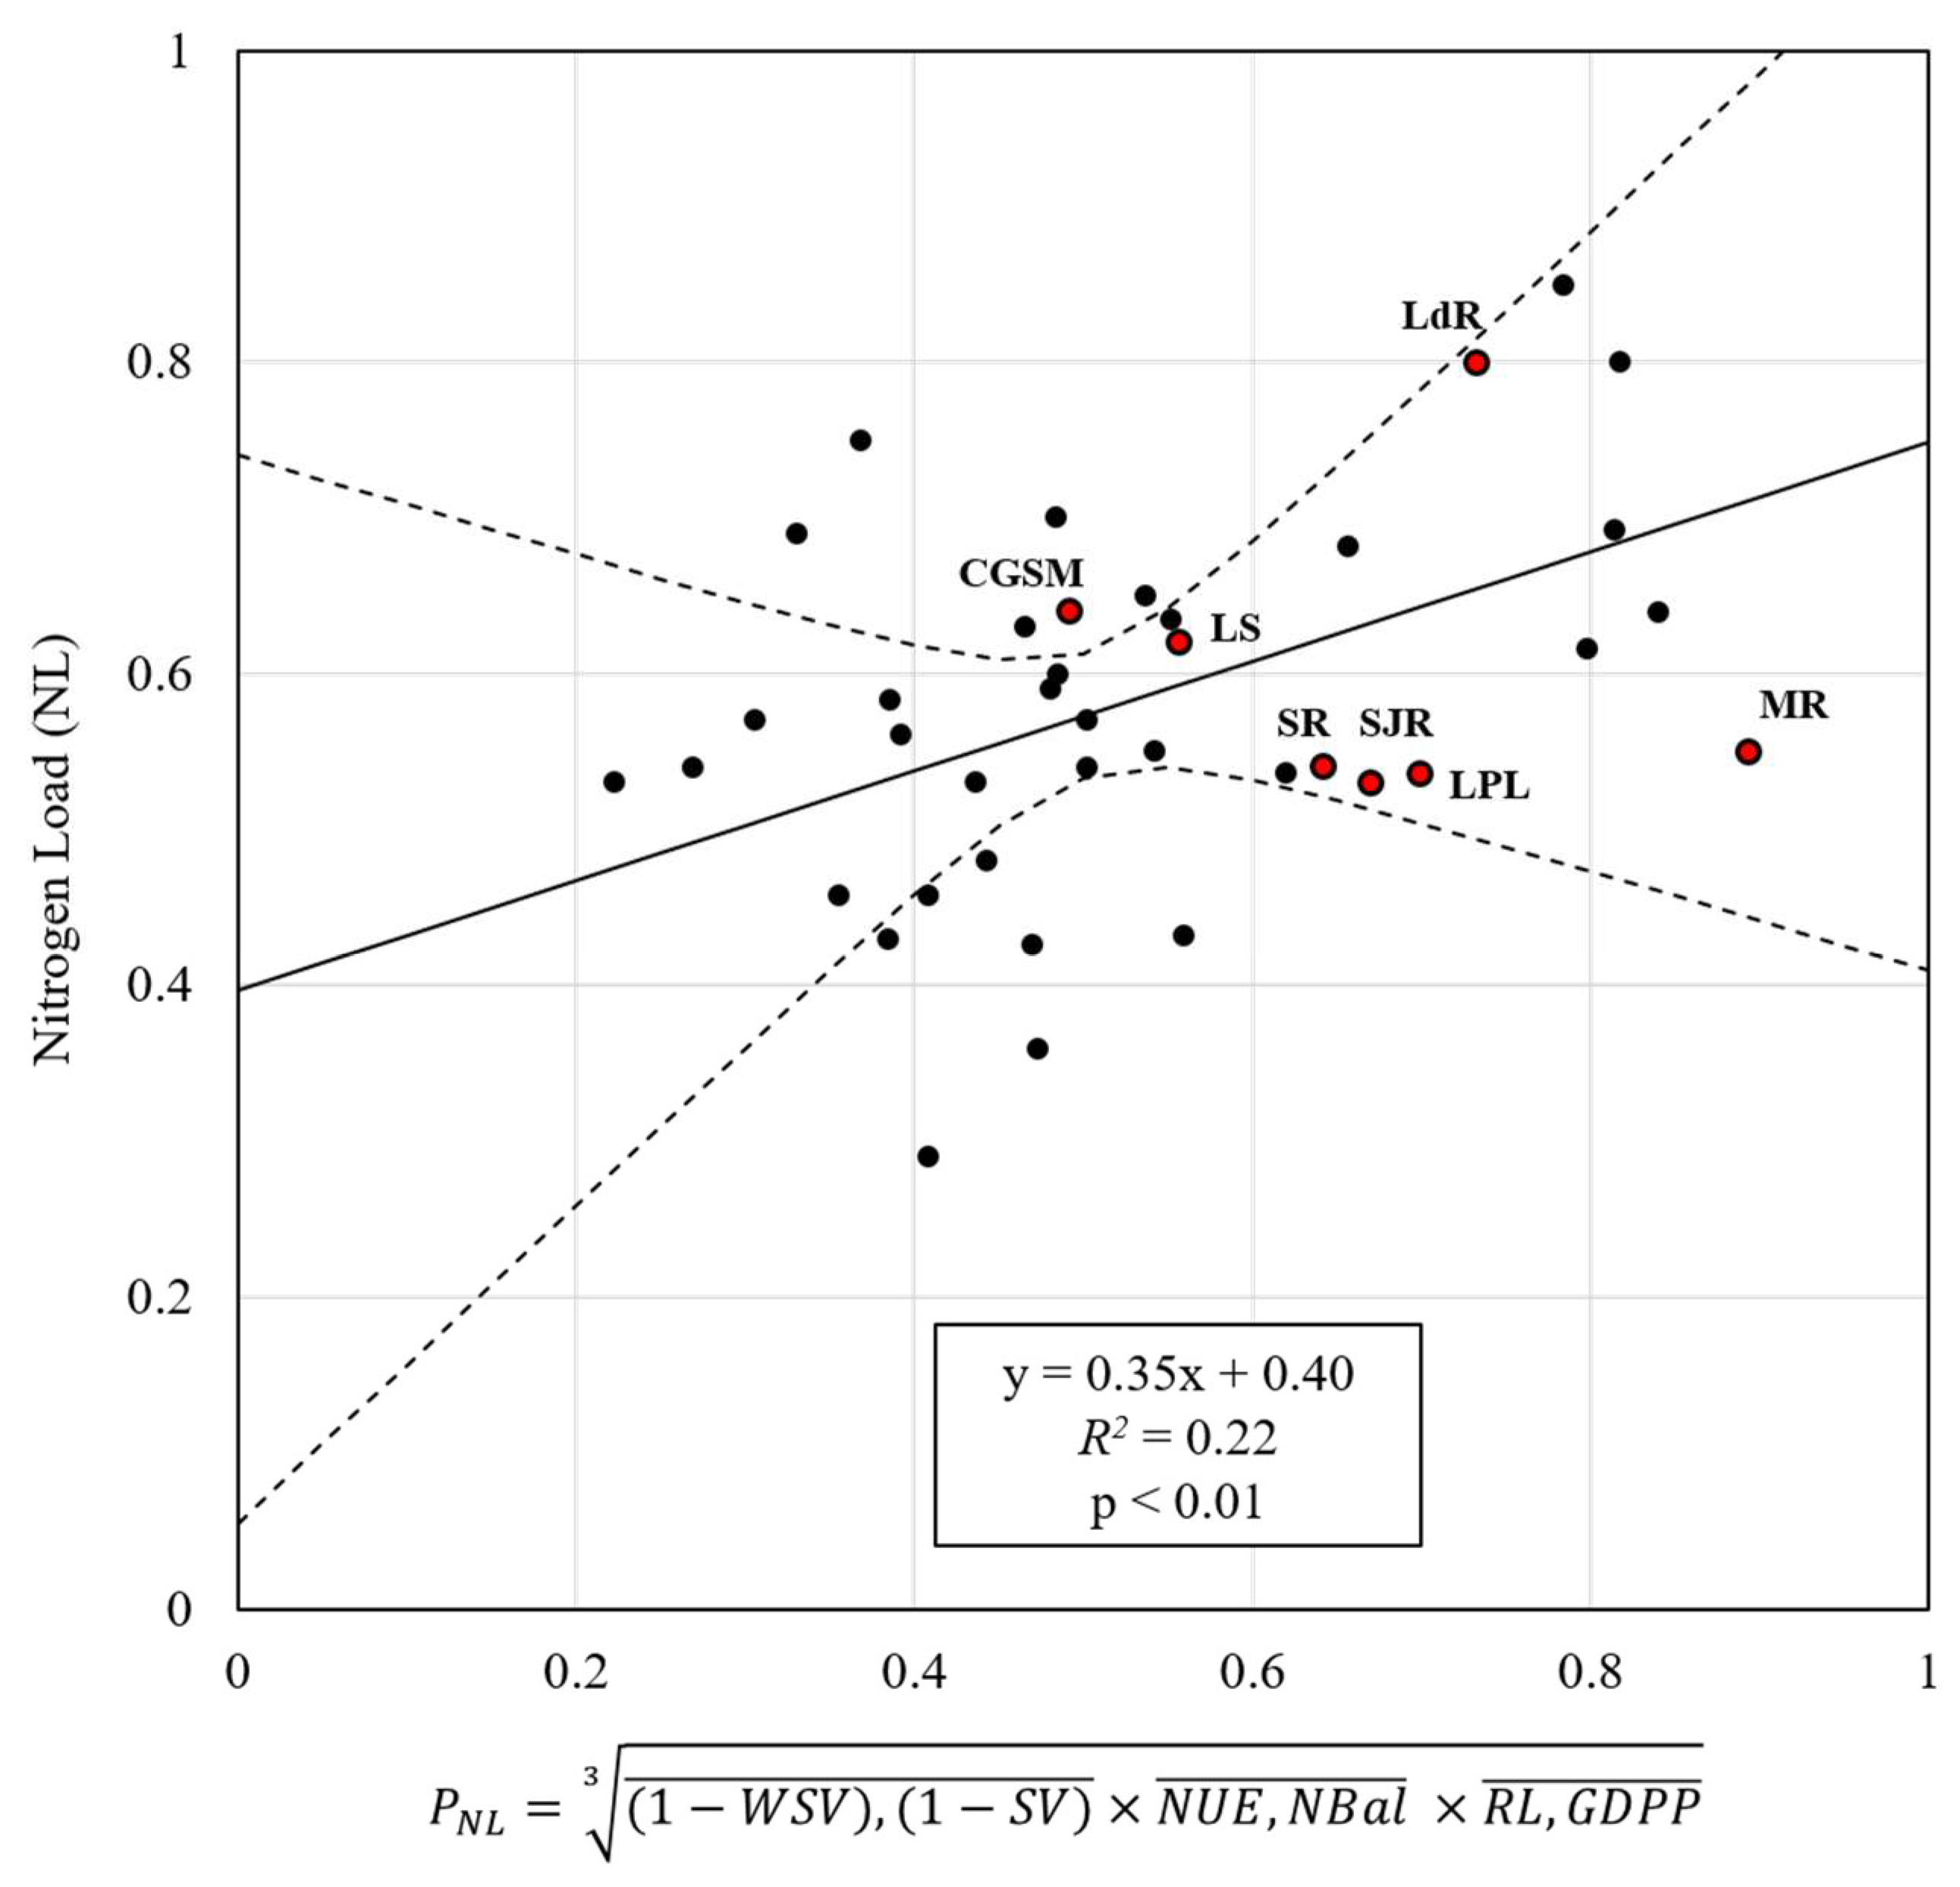
3.2. Proxies for Freshwater Ecosystem Service Threat Benchmarks
4. Discussion
4.1. Freshwater Ecosystem Service Threat Benchmarks
4.2. Proxies for Threat Benchmarks
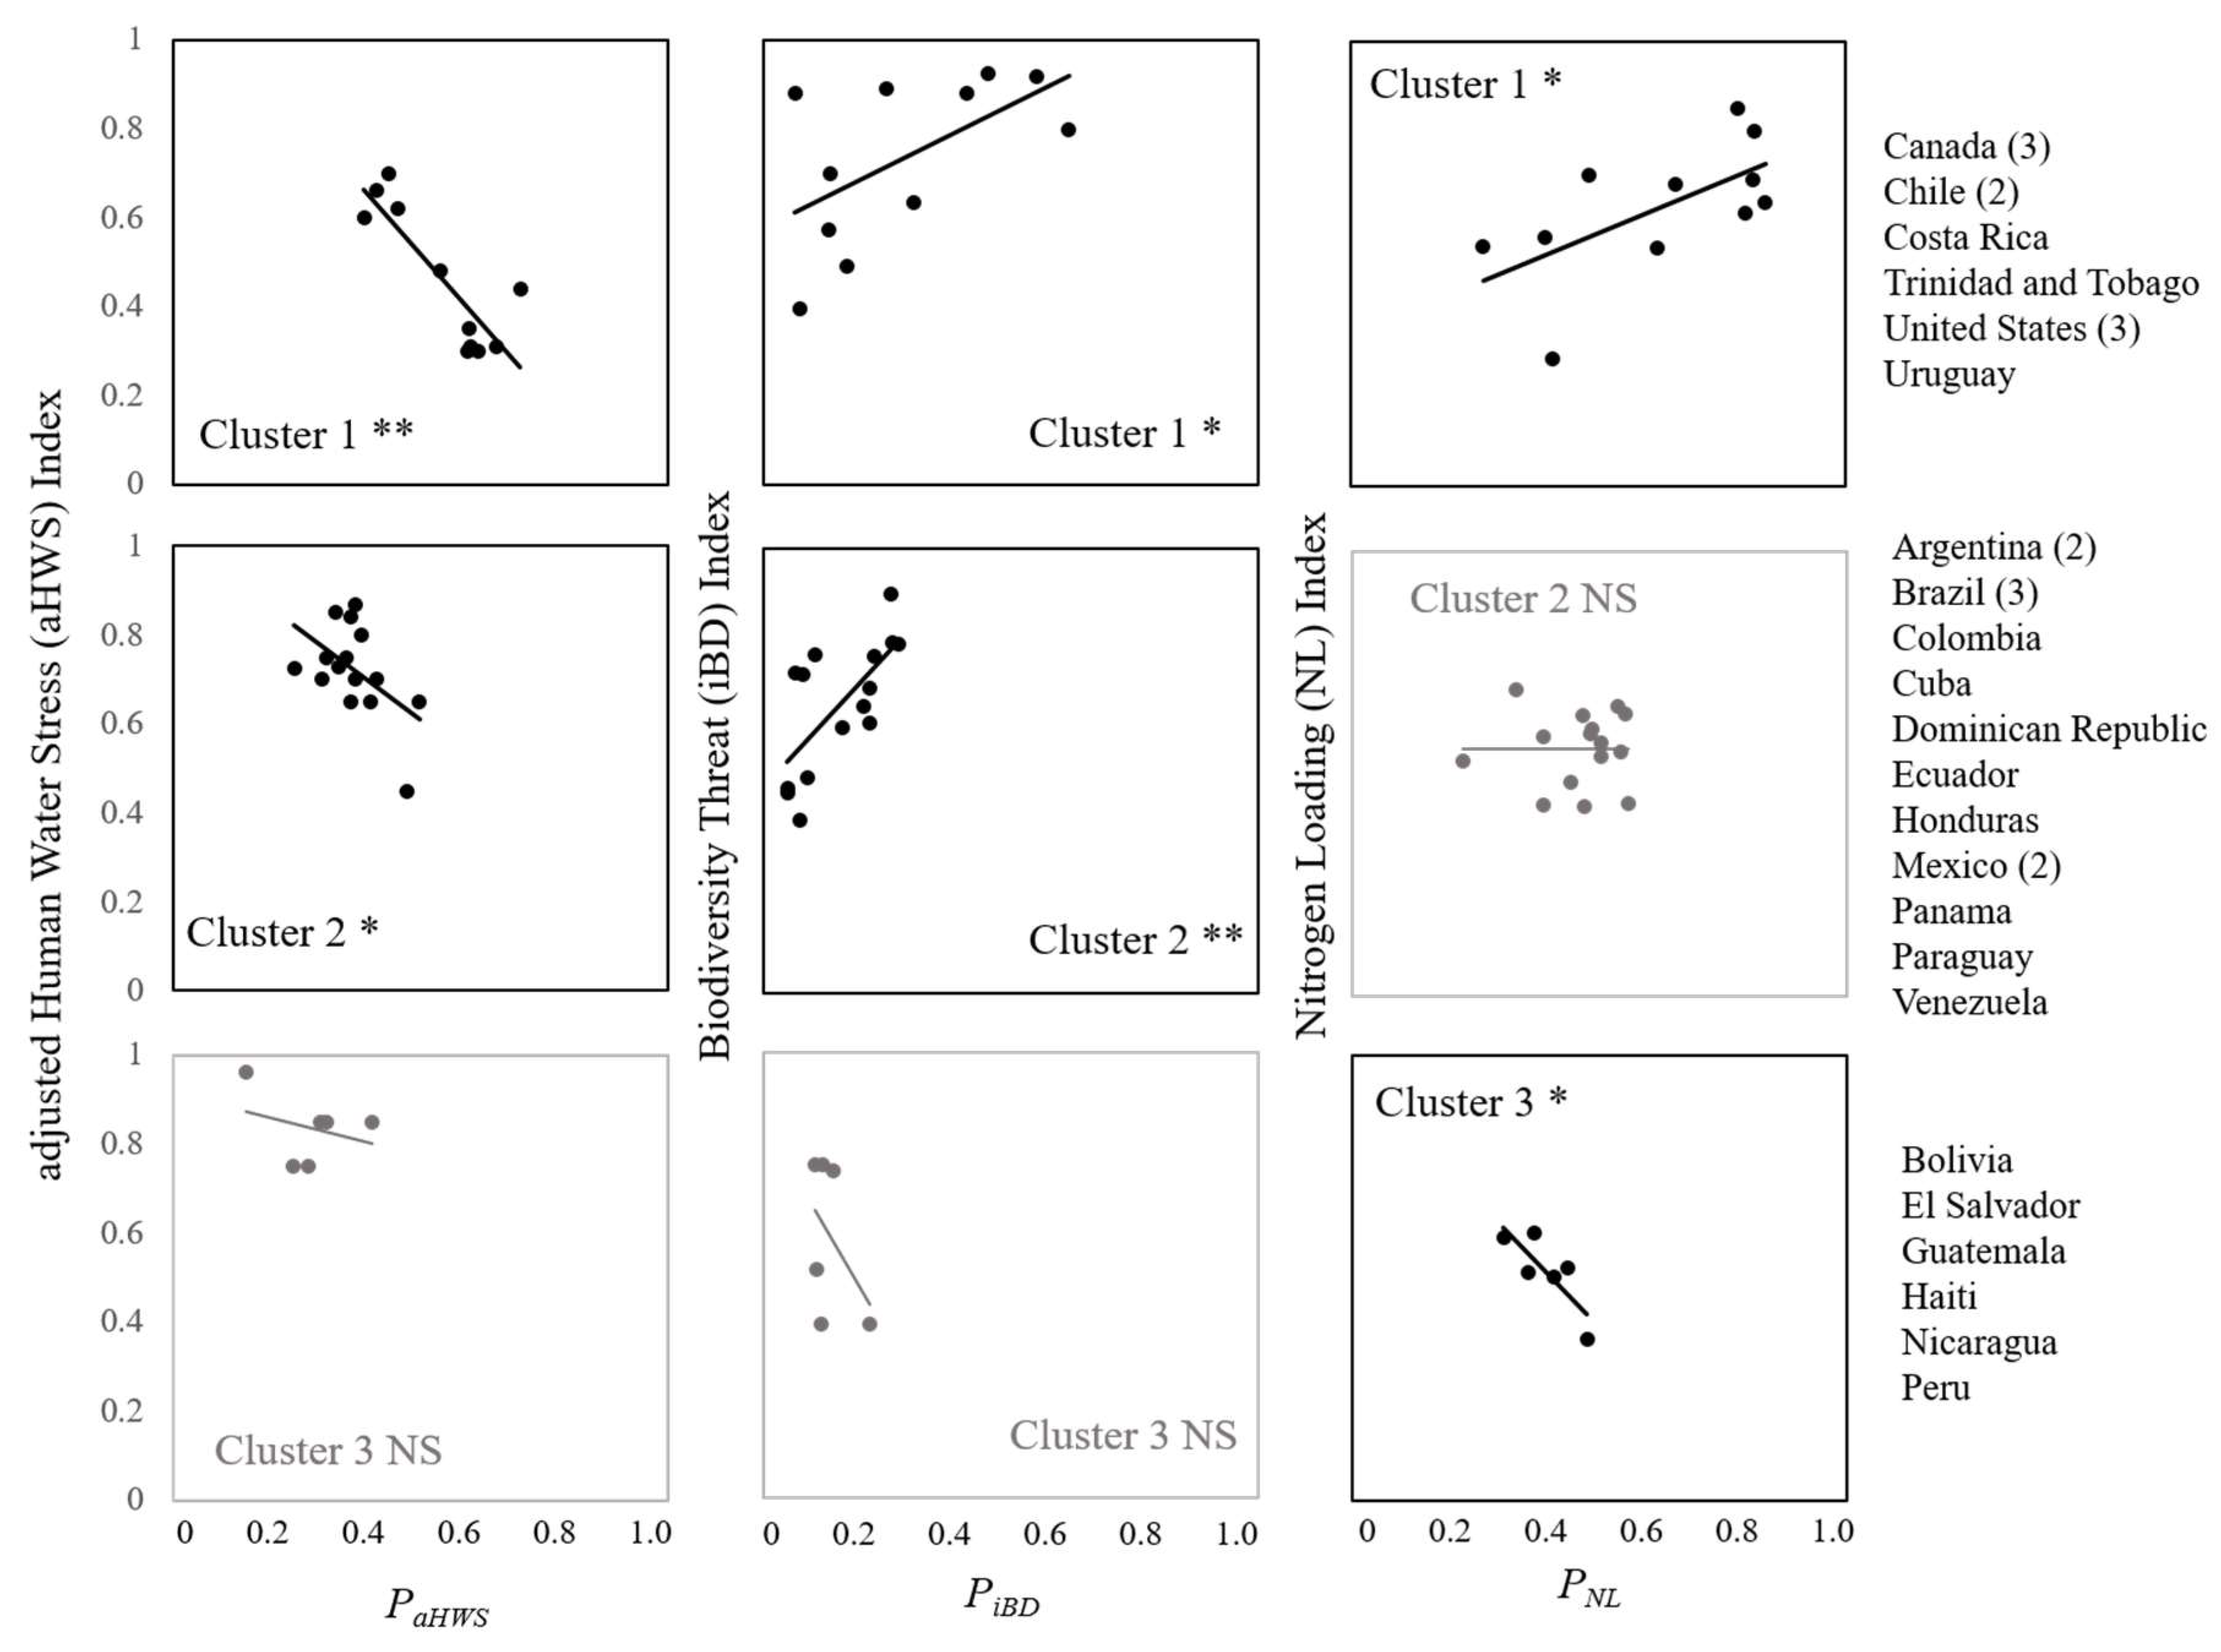
4.3. Testing for Nationally Clustered Behavior
5. Conclusions
Author Contributions
Funding
Acknowledgments
Conflicts of Interest
Appendix A.

| Site Name | Nation | Coordinates | Ramsar Sites Link |
|---|---|---|---|
| Beaverhill Lake | Canada | 53°30′ N, 113°30′ W | https://rsis.ramsar.org/ris/370 |
| Lake Champlain | Canada, US | 44°57′ N, 73°10′ W | https://rsis.ramsar.org/ris/2200 |
| Lac Saint-Francois | Canada | 45°02′ N, 74°29′ W | https://rsis.ramsar.org/ris/361 |
| Laguna de Santa Rosa | US | 38°24′ N, 122°47′ W | https://rsis.ramsar.org/ris/1930 |
| Caddo Lake | US | 32°45′ N, 94°08′ W | https://rsis.ramsar.org/ris/633 |
| Laguna de Zapotlán | Mexico | 19°45′ N, 103°29′ W | https://rsis.ramsar.org/ris/1466 |
| Manglares y Humedales de Tuxpan | Mexico | 21°00′ N, 097°21′ W | https://rsis.ramsar.org/ris/1602 |
| Lago Atitlán | Guatemala | 15°25′ N, 89°22′ W | Not a Ramsar site |
| Lago Yojoa | Honduras | 14°51′ N, 88°00′ W | https://rsis.ramsar.org/es/ris/1467 |
| Lago Arenal | Costa Rica | 0°30′ N, 84°51′ W | https://rsis.ramsar.org/ris/1022 |
| Golfo de Montijo | Panama | 7°45′ N, 81°07′ W | https://rsis.ramsar.org/ris/510 |
| Laguna de Olomega | El Salvador | 13°19′ N, 88°04′ W | https://rsis.ramsar.org/ris/1899 |
| Sistema de Humedales de San Miguelito | Nicaragua | 11°25′ N, 84°51′ W | https://rsis.ramsar.org/ris/1140 |
| Laguna de Leche | Cuba | 22°19′ N, 78°29′ W | https://rsis.ramsar.org/ris/1235 |
| Lago Enriquillo | Dominican Republic | 18°28′ N, 71°39′ W | https://rsis.ramsar.org/es/ris/1179 |
| Lac Azuéi | Haiti | 18°35′ N, 72°0′ W | Not a Ramsar site |
| Laguna de Cocha | Colombia | 01°03′ N, 77°12′ W | https://rsis.ramsar.org/es/ris/1047 |
| Caroni Swamp | Trinidad and Tobago | 10°34′ N, 61°27′ W | https://rsis.ramsar.org/ris/1497 |
| Parque Nacional Cajas | Ecuador | 02°50′ N, 79°14′ W | https://rsis.ramsar.org/ris/1203 |
| Lago Titicaca | Bolivia, Peru | 16°10′ S, 68°52′ W | https://rsis.ramsar.org/ris/959 |
| Cienega de los Olivitos | Venezuela | 10°55′ N, 71°26′ W | https://rsis.ramsar.org/es/ris/859 |
| Lagoa do Peixe | Brazil | 31°14′ S, 50°57′ W | https://rsis.ramsar.org/ris/603 |
| Ilha do Bananal | Brazil | 10°31′ S, 50°12′ W | https://rsis.ramsar.org/ris/624 |
| Mamirauá | Brazil | 2°18′ S, 66°02′ W | https://rsis.ramsar.org/ris/623 |
| Laguna Blanca | Argentina | 39°02′ S, 70°21′ W | https://rsis.ramsar.org/ris/556 |
| Laguna de Llancanelo | Argentina | 35°45′ S, 69°08′ W | https://rsis.ramsar.org/ris/759 |
| Bañados del Este y Franja Costera | Uruguay | 33°48′ S, 53°50′ W | https://rsis.ramsar.org/ris/290 |
| Salar de Tara | Chile | 22°56′ S, 67°15′ W | https://rsis.ramsar.org/ris/875 |
| Carlos Anwandter Sanctuary | Chile | 39°41′ S, 73°11′ W | https://rsis.ramsar.org/ris/222 |
| Lago Ypoa | Paraguay | 26°30′ S, 57°33′ W | https://rsis.ramsar.org/ris/728 |
| Sites (by Nation) | Benchmark Indicator | Slope (Regr. Coeff.) | R2 | p-Value | |
|---|---|---|---|---|---|
| Cluster 1 | Canada (3), Chile (2), Costa Rica, Trinidad and Tobago, United States (3), Uruguay | aHWS iBIO NL | −1.26 0.56 0.45 | −0.85 0.61 0.62 | <0.001 0.05 0.05 |
| Cluster 2 | Argentina (2), Brazil (3), Colombia, Cuba, Dominican Republic, Ecuador, Honduras, Mexico (2), Panama, Paraguay, Peru, Venezuela | aHWS iBIO NL | −0.82 1.20 0 | −0.51 0.68 0 | 0.05 <0.01 NS |
| Cluster 3 | Bolivia, El Salvador, Guatemala, Haiti, Nicaragua | aHWS iBIO NL | −0.47 −1.89 −1.15 | −0.49 −0.45 −0.81 | NS NS 0.05 |

References
- De Groot, R.S.; Wilson, M.A.; Boumans, R.M.J. A typology for the classification, description and valuation of ecosystem functions, goods and services. Ecol. Econ. 2002, 41, 393–408. [Google Scholar] [CrossRef] [Green Version]
- Millennium Ecosystem Assessment Panel (MEAP). Ecosystems and Human Well Being: Synthesis; Island Press: Washington, DC, USA, 2005; ISBN 1-59726-040-1. [Google Scholar]
- Haines-Young, R.; Potschin, M. Common International Classification of Ecosystem Services CICES Version 4: Response to Consultation; Center for Environmental Management, University of Nottingham: Nottingham, UK, 2012. [Google Scholar]
- Daily, G.C.; Polasky, S.; Goldstein, J.; Kareiva, P.M.; Mooney, H.A.; Pejchar, L.; Ricketts, T.H.; Salzman, J.; Shallenberger, R. Ecosystem services in decision making: Time to deliver. Front. Ecol. Environ. 2009, 7, 21–28. [Google Scholar] [CrossRef]
- Bull, J.W.; Jobstvogt, N.; Böhnke-Henrichs, A.; Mascarenhas, A.; Sitas, N.; Baulcomb, C.; Lambini, C.K.; Rawlins, M.; Baral, H.; Zähringer, J.; et al. Strengths, Weaknesses, Opportunities and Threats: A SWOT analysis of the ecosystem services framework. Ecosyst. Serv. 2016, 17, 99–111. [Google Scholar] [CrossRef]
- Maron, M.; Mitchell, M.G.E.; Runting, R.K.; Rhodes, J.R.; Mace, G.M.; Keith, D.A.; Watson, J.E.M. Towards a threat assessment framework for ecosystem services. Trends Ecol. Evol. 2017, 32, 240–248. [Google Scholar] [CrossRef] [PubMed]
- Redman, C.L.; Grove, J.M.; Kuby, L.H. Integrating social science into the Long-Term Ecological Research (LTER) Network: Social dimensions of ecological change and ecological dimensions of social change. Ecosystems 2004, 7, 161–171. [Google Scholar] [CrossRef]
- Montgomery, J.L.; Harmon, T.; Haas, C.N.; Hooper, R.; Clesceri, N.L.; Graham, W.; Kaiser, W.; Sanderson, A.; Minsker, B.; Schnoor, J.; et al. The waters network: An integrated environmental observatory network for water research. Environ. Sci. Technol. 2007, 41, 6642–6647. [Google Scholar] [CrossRef] [PubMed]
- Keller, M.; Schimel, D.S.; Hargrove, W.W.; Hoffman, F.M. A continental strategy for the National Ecological Observatory Network. Front. Ecol. Environ. 2008, 6, 282–284. [Google Scholar] [CrossRef] [Green Version]
- Hanson, P.C.; Weathers, K.C.; Kratz, T.K. Networked lake science: How the Global Lake Ecological Observatory Network (GLEON) works to understand, predict, and communicate lake ecosystem response to global change. Inland Waters 2016, 4, 543–554. [Google Scholar] [CrossRef]
- Ebert, U.; Welsch, H. Meaningful environmental indices: A social choice approach. J. Environ. Econ. 2004, 47, 270–283. [Google Scholar] [CrossRef]
- Niemeijer, D.; de Groot, R.S. A conceptual framework for selecting environmental indicator sets. Ecol. Indic. 2008, 8, 14–25. [Google Scholar] [CrossRef]
- Raudsepp-Hearne, C.; Peterson, G.D.; Tengoe, M.; Bennett, M.E.; Holland, T.; Benessaiah, K.; MacDonald, G.K.; Pfeifer, L. Untangling the environmentalist’s paradox: Why is human well-being increasing as ecosystem services degrade? BioScience 2010, 60, 576–589. [Google Scholar] [CrossRef]
- Vörösmarty, C.J.; McIntyre, P.B.; Gessner, M.O.; Dudgeon, D.; Prusevich, A.; Green, P.; Glidden, S.; Bunn, S.E.; Sullivan, C.A.; Reidy Liermann, C.; et al. Global threats to human water security and river biodiversity. Nature 2010, 467, 555. [Google Scholar] [CrossRef] [PubMed]
- Hsu, A.; Emerson, J.; Levy, M.; de Sherbinin, A.; Johnson, L.; Malik, O.; Schwartz, J.; Jaiteh, M. The 2014 Environmental Performance Index. New Haven, CT: Yale Center for Environmental Law and Policy. Available online: http://www.epi.yale.edu. (accessed on 15 November 2017).
- Gassert, F.; Rieg, P.; Shiao, T.; Luck, M.; Landis, M. Aqueduct Global Maps 2.1 Indicators: Constructing Decision-Relevant Global Water Risk Indicators, Working Paper, 2015. Available online: http://www.wri.org/publication/aqueduct-global-maps-21-indicators (accessed on 11 May 2017).
- Cosens, B.; Gunderson, L.; Allen, C.; Benson, M.; Cosens, B.; Gunderson, L.; Linkov, I. Identifying legal, ecological and governance obstacles, and opportunities for adapting to climate change. Sustainability 2014, 6, 2338–2356. [Google Scholar] [CrossRef]
- Angeler, D.G.; Allen, C.R.; Garmestani, A.S.; Gunderson, L.H.; Linkov, I. Panarchy use in environmental science for risk and resilience planning. Environ. Syst. Decis. 2016, 36, 225–228. [Google Scholar] [CrossRef] [Green Version]
- Burkhard, B.; Kroll, F.; Nedkov, S.; Müller, F. Mapping ecosystem service supply, demand and budgets. Ecol. Indic. 2012, 21, 17–29. [Google Scholar] [CrossRef]
- Albert, C.; Bonn, A.; Burkhard, B.; Daube, S.; Dietrich, K.; Engels, B.; Frommer, J.; Götzl, M.; Grêt-Regamey, A.; Job-Hobenet, B.; et al. Towards a national set of ecosystem service indicators: Insights from Germany. Ecol. Indic. 2016, 61, 38–48. [Google Scholar] [CrossRef]
- Diamantini, E.; Lutz, S.R.; Mallucci, S.; Majone, B.; Merz, R.; Bellin, A. Driver detection of water quality trends in three large European river basins. Sci. Total Environ. 2018, 612, 49–62. [Google Scholar] [CrossRef] [PubMed]
- Liefferink, D.; Wiering, M.; Uitenboogaart, Y. The EU Water framework directive: A multi-dimensional analysis of implementation and domestic impact. Land Use Policy 2011, 28, 712–722. [Google Scholar] [CrossRef]
- Collins, A.; Ohandja, D.-G.; Hoare, D.; Voulvoulis, N. Implementing the water framework directive: A transition from established monitoring networks in England and Wales. Environ. Sci. Policy 2012, 17, 49–61. [Google Scholar] [CrossRef]
- Arle, J.; Mohaupt, V.; Kirst, I.; Arle, J.; Mohaupt, V.; Kirst, I. Monitoring of surface waters in Germany under the water framework directive—A review of approaches, methods and results. Water 2016, 8, 217. [Google Scholar] [CrossRef]
- Voulvoulis, N.; Arpon, K.D.; Giakoumis, T. The EU Water Framework Directive: From great expectations to problems with implementation. Sci. Total Environ. 2017, 575, 358–366. [Google Scholar] [CrossRef] [PubMed]
- Abell, R.; Thieme, M.L.; Revenga, C.; Bryer, M.; Kottelat, M.; Bogutskaya, N.; Coad, B.; Mandrak, N.; Balderas, S.C.; Bussing, W.; et al. Freshwater ecoregions of the world: A new map of biogeographic units for freshwater biodiversity conservation. BioScience 2008, 58, 403–414. [Google Scholar] [CrossRef]
- Carr, G.M.; Neary, J.P. Water Quality for Ecosystem and Human Health, 2nd ed.; UNEP/Water Programme: Burlington, ON, Canada, 2008; ISBN 92-95039-51-7. [Google Scholar]
- Seitzinger, S.P.; Harrison, J.A.; Dumont, E.; Beusen, A.H.W.; Bouwman, A.F. Sources and delivery of carbon, nitrogen, and phosphorus to the coastal zone: An overview of Global Nutrient Export from Watersheds (NEWS) models and their application. Glob. Biogeochem. Cycles 2005, 19. [Google Scholar] [CrossRef] [Green Version]
- Groombridge, B.; Jenkins, M.D. Freshwater Biodiversity: A Preliminary Global Assessment—UNEP. WCMC Biodiversity Series 8; UNEP-WCMC: Cambridge, UK, 1998; ISBN 1-899628-12-6. [Google Scholar]
- Center for International Earth Science Information Network (CIESIN)—Columbia University, and Centro Internacional de Agricultura Tropical (CIAT). Gridded Population of the World, Version 3 (GPWv3): Population Density Grid, Future Estimates; NASA Socioeconomic Data and Applications Center (SEDAC): Palisades, NY, USA, 2005.
- Dartmouth Flood Observatory. 2011. Available online: http://floodobservatory.colorado.edu/ (accessed on 20 January 2018).
- Sheffield, J.; Wood, E.F. Characteristics of global and regional drought, 1950–2000: Analysis of soil moisture data from off-line simulation of the terrestrial hydrologic cycle. J. Geophys. Res. Atmos. 2007, 112, 1–21. [Google Scholar] [CrossRef]
- FAO AQUASTAT 2012. Available online: http://www.fao.org/nr/water/aquastat/main/index.stm (accessed on 10 February 2018).
- World Bank, 2014 Governance. Available online: http://info.worldbank.org/governance/wgi/index.aspx#home (accessed on 30 November 2017).
- World Bank, 2014 National Accounts Data. Available online: https://data.worldbank.org/indicator/NY.GDP.PCAP.CD (accessed on 2 December 2017).
- Chiarucci, A.; Bacaro, G.; Scheiner, S.M. Old and new challenges in using species diversity for assessing biodiversity. Philos. Trans. R. Soc. Lond. B Biol. Sci. 2011, 366, 2426–2437. [Google Scholar] [CrossRef] [PubMed] [Green Version]
- McKinney, M.L. Effects of urbanization on species richness: A review of plants and animals. Urban Ecosyst. 2008, 11, 161–176. [Google Scholar] [CrossRef]
- Pauchard, A.; Aguayo, M.; Peña, E.; Urrutia, R. Multiple effects of urbanization on the biodiversity of developing countries: The case of a fast-growing metropolitan area (Concepción, Chile). Biol. Conserv. 2006, 127, 272–281. [Google Scholar] [CrossRef]
- Lu, C.; Tian, H. Global nitrogen and phosphorus fertilizer use for agriculture production in the past half century: shifted hot spots and nutrient imbalance. Earth Syst. Sci. Data 2017, 9, 181–192. [Google Scholar] [CrossRef] [Green Version]
- Seitzinger, S.P.; Mayorga, E.; Bouwman, A.F.; Kroeze, C.; Beusen, A.H.W.; Billen, G.; Drecht, G.V.; Dumont, E.; Fekete, B.M.; Garnier, J.; et al. Global river nutrient export: A scenario analysis of past and future trends. Glob. Biogeochem. Cycles 2010, 24. [Google Scholar] [CrossRef] [Green Version]
- Bouwman, L.; Goldewijk, K.K.; Hoek, K.W.V.D.; Beusen, A.H.W.; Vuuren, D.P.V.; Willems, J.; Rufino, M.C.; Stehfest, E. Exploring global changes in nitrogen and phosphorus cycles in agriculture induced by livestock production over the 1900–2050 period. PNAS 2013, 110, 20882–20887. [Google Scholar] [CrossRef] [PubMed]
- Lehner, B.; Grill, G. Global river hydrography and network routing: Baseline data and new approaches to study the world’s large river systems. Hydrol. Process. 2013, 27, 2171–2186. [Google Scholar] [CrossRef]
- Dallaire, C.O.; Lehner, B.; Sayre, R.; Thieme, M. A multidisciplinary framework to derive global river reach classifications at high spatial resolution. Environ. Res. Lett. 2018. [Google Scholar] [CrossRef]
- McGranahan, G.; Satterthwaite, D.; Tacoli, C. Rural-Urban Change, Boundary Problems and Environmental Burdens. Human Settlements Working Paper Series Rural-Urban Interactions and Livelihood Strategies No. 10; IIED: London, UK, 2004; ISBN 978-1-84369-538-7. [Google Scholar]
- Wang, J.; Webber, M.; Finlayson, B.; Barnett, J. Rural industries and water pollution in China. J. Environ. Manag. 2008, 86, 648–659. [Google Scholar] [CrossRef] [PubMed]
- Smyth, R.L.; Ratima, U.; Segarra, M.; Borre, L.; Reid, B.; Pincetl, S.; Zilio, M.I.; Astorga, A.; Huamantinco Cisneros, M.A.; Conde, D.; et al. Engaging stakeholders in water research across socio-environmental gradients in the Americas. Water 2018, in press. [Google Scholar]
- Barandiaran, J. Chile’s environmental assessments: Contested knowledge in an emerging democracy. Sci. Cult. 2015, 24, 251–271. [Google Scholar] [CrossRef]


| Site Name, ID | Nation | Key Ecosystem Services | Major Threats to Ecosystem Services |
|---|---|---|---|
| La Paloma Complex, LPC | Chile | Livestock water supply Hydropower Recreation | Forestry (artisanal wood gathering) Livestock, grazing Aquaculture Hydropower development Recreational pressure Invasive species |
| La Salada, LS | Argentina | Water quality regulation Biodiversity conservation Recreation, education | Recreational pressure Hydro-climate change Land use/land cover change Overfishing Wastewater and irrigation drainage Water diversion |
| Senguer River, SR | Argentina | Irrigation water supply Drinking water supply Water quality regulation | Water diversions Flood control engineering Pollution (agriculture and oil exploration) Dewatering (agriculture and oil exploration) Hydro-climate change Population increase (oil discovery) |
| Ciénaga Grande de Santa Marta, CGSM | Colombia | Irrigation water supply Water quality regulation Biodiversity conservation | Overfishing Wastewater discharge Agricultural drainage Grazing Sea level rise Hydro-climate change Diversions (agriculture) |
| Laguna de Rocha, LdR | Uruguay | Water quality regulation Recreation Cultural/aesthetic | Recreational pressure (tourism) Hydraulic engineering Land use/land cover change (urbanization) Storm surge Flooding Coastal erosion |
| San Joaquin River, SJR | USA | Irrigation water supply Water quality regulation Biodiversity conservation | Population increase Hydro-climate change Diversions (agriculture) Wastewater return flow and agricultural drainage Land use/land cover change Flood control engineering Groundwater overdraft Invasive species |
| Muskoka River Watershed, MRW | Canada | Water quality regulation Recreation Cultural/aesthetic | Population increase Invasive species Land use/land cover change Recreational pressure Precipitation regime change (rain on frozen ground) Temperature increase Eutrophication |
| Proxy ID | Proxy Name | Description (0–1 = Low–High Threat Range Unless Otherwise Noted) | References |
|---|---|---|---|
| External Proxies (Hydro-Climate, Water Demand) | |||
| WSV | Water supply inter-annual variability | Water supply variation from year to year | [16] |
| SV | Water supply seasonal variability | Water supply variation from month to month | [16] |
| HFO | Flood occurrence | Number of floods in recent history (1985–2011) | [31] |
| DRO | Drought severity | Product of the average drought length and drought dryness soil dryness (1901–2008) | [16,32] |
| Internal Proxies (Water Access, Watershed Management, Water Quality, Nutrient Management) | |||
| WRI | Water return index | Fraction of available water previously used and discharged upstream as wastewater effluent (0–1 = high–low threat for water supply ES; 0–1 = low–high threat for biodiversity-related and nutrient regulation ES) | [16,33] |
| AGSUB | Agricultural subsidies | Degree of environmental pressure exerted by subsidizing agricultural inputs (0–1 = high–low threat) | [15] |
| NUE | Nitrogen use efficiency | Measure of the appropriate management of nitrogen resources for agricultural production (0–1 = high–low threat) | [15] |
| NBal | Nitrogen use balance | Measure of the appropriate management of nitrogen resources for agricultural production (0–1 = high–low threat) | [15] |
| STOR | Upstream storage | Upstream water storage capacity relative to total water supply (0–1 = high–low threat for water supply ES; 0–1 = low-high threat for biodiversity-related and nutrient regulation ES) | [16] |
| ECO_S | Upstream protected land | Fraction of total water supply that originates from protected watersheds (0–1 = high–low threat) | [16] |
| WATSUP | Access to drinking water | Fraction of nation’s population with access to improved drinking water (0–1 = high–low threat to water supply) | [15] |
| ACSAT | Access to sanitation | Fraction of a nation’s population with access to improved sanitation (0–1 = high–low threat to water supply) | [15] |
| WWT | Wastewater treated | Fraction of collected wastewater that is treated (0–1 = high–low threat) | [15] |
| TPA | Terrestrial protected Areas | Degree to which a nation achieves target of protecting 17% of its biomes (0–1 = high–low threat) | [15] |
| Socioeconomic and Governance Proxies | |||
| RL | Rule of Law | Captures perceptions of the extent to which agents have confidence in and abide by rules of society (especially quality of contract enforcement, property rights, police, courts and likelihood of crime and violence) | [34] |
| VA | Voice & Accountability | Captures perceptions of the extent to which a country’s citizens are able to participate in selecting their government, as well as freedom of expression, freedom of association, and a free media | [34] |
| GE | Government Effectiveness | Captures perceptions of a nation’s quality of public services and civil services, the degree of its independence from political pressures, the quality of policy formulation and implementation, and the credibility of the government’s commitment to such policies | [34] |
| GDPP | Gross Domestic Product per Capita | Value of annual goods produced and services provided by a nation divided by its population (0–1 = low–high normalized GDPP; threat scale tested in both directions) | [35] |
© 2018 by the authors. Licensee MDPI, Basel, Switzerland. This article is an open access article distributed under the terms and conditions of the Creative Commons Attribution (CC BY) license (http://creativecommons.org/licenses/by/4.0/).
Share and Cite
Harmon, T.C.; Smyth, R.L.; Chandra, S.; Conde, D.; Dhungel, R.; Escobar, J.; Hoyos, N.; Lozoya, J.P.; Nin, M.; Perillo, G.M.E.; et al. Socioeconomic and Environmental Proxies for Comparing Freshwater Ecosystem Service Threats across International Sites: A Diagnostic Approach. Water 2018, 10, 1578. https://doi.org/10.3390/w10111578
Harmon TC, Smyth RL, Chandra S, Conde D, Dhungel R, Escobar J, Hoyos N, Lozoya JP, Nin M, Perillo GME, et al. Socioeconomic and Environmental Proxies for Comparing Freshwater Ecosystem Service Threats across International Sites: A Diagnostic Approach. Water. 2018; 10(11):1578. https://doi.org/10.3390/w10111578
Chicago/Turabian StyleHarmon, Thomas C., Robyn L. Smyth, Sudeep Chandra, Daniel Conde, Ramesh Dhungel, Jaime Escobar, Natalia Hoyos, Juan Pablo Lozoya, Mariana Nin, Gerardo M.E. Perillo, and et al. 2018. "Socioeconomic and Environmental Proxies for Comparing Freshwater Ecosystem Service Threats across International Sites: A Diagnostic Approach" Water 10, no. 11: 1578. https://doi.org/10.3390/w10111578