Multi-Water Source Joint Scheduling Model Using a Refined Water Supply Network: Case Study of Tianjin


1
Renewable Energy School, North China Electric Power University, Beijing 102206, China
2
School of Environment, Beijing Normal University, Beijing 100875, China
*
Authors to whom correspondence should be addressed.
Water 2018, 10(11), 1580; https://doi.org/10.3390/w10111580
Submission received: 19 September 2018
/
Revised: 18 October 2018
/
Accepted: 2 November 2018
/
Published: 5 November 2018
(This article belongs to the Special Issue Integrated Water Resource System Modeling to Support Sustainable Water Management)
Abstract
:Water shortage problems are increasing in many water-deficient areas. Most of the current research on multi-source combined water supplies depends on an overall generalization of regional water supply systems, which are seldom broken down into the detail required to address specific research objectives. This paper proposes the concept of a water treatment and distribution station (water station), and generalizes the water supply system into three modules: water supply source, water station, and water user. Based on a topological diagram of the water network (supply source–station–user), a refined water resource allocation model was established. The model results can display, in detail, the water supply source, water supply quantity, water distribution engineering, and other information of all users in each water distribution area. This makes it possible to carry out a detailed analysis of the supply and demand of users, and to provide suggestions and theoretical guidance for regional water distribution implementation. Tianjin’s water resource allocation was selected as a case study, and a water resource allocation scheme for a multi-source, combined water supply, was simulated and discussed.
1. Introduction
Water resources play an indispensable role in the process of social development. Due to economic development and climate change, water shortages in many parts of the world are increasing [1,2]. In some areas where water resources are scarce, local conventional supplies have been unable to meet the water demand, and this has seriously hampered the sustainable development of the area [3]. The combined effects of dependence on the unicity of local conventional water sources, and the instability of water supply, pose great risks to the water supply system [4]. To meet this challenge, more alternative water sources need to be introduced to increase water supplies to reduce the pressure on local conventional water supply, and multi-source combined water supply systems need to be built. Unconventional water sources, such as reclaimed water and desalinated seawater, have been developed and utilized in many countries for multi-source water supply systems [5,6]. Inter-basin water transfers also play a significant role in alleviating the limitations created by the spatial and temporal distribution of water resources. Large-scale water transfer projects include long-distance water transfer projects, such as the Central Valley Project and the Los Angeles Aqueduct in the United States [7], the Snowy Mountain Project in Australia [8], the Great Basin Lake Drainage Project in the United States [9], and China’s South-to-North Water Transfer Project [10]. Multi-source combined water supplies can guarantee the security of regional water supplies and effectively reconcile the supply and demand of regional water resources [11]. However, because of the complexity of multi-source combined water supply systems, their optimization presents significant challenges in practice.
Many factors need to be taken into account in the decision-making regarding multi-source combined water supply systems, such as selecting water supply sources, economic costs, and addressing water user requirements. These factors are not independent of each other, and need to be balanced in the process of optimizing the allocation of water resources. In particular, when the amount of available water resources cannot meet water demand, water conflicts often occur between different water user sectors [12]. Multi-objective algorithms are the main tool for solving the optimal allocation of water resources, and can effectively reduce the conflicts between competing water user sectors. There has been much research on multi-source and multi-objective water resource allocation. Wong et al. proposed the principle and method of multi-objective and multi-stage optimization management to support the combined use of surface water and groundwater, and considered the combined use of local surface water, groundwater, and external water sources in the prediction of water demand [13]. Percia et al. incorporated sewage, surface water, and groundwater in the Eilat area in southern Israel in a water management model that had the aim of maximizing economic benefits, and addressing the different water quality requirements of different sectors [14]. Zhong et al. established a multi-objective decomposition model of a large system for water resource optimization and scheduling, and provided solutions to problems at different levels according to the characteristics of the mathematical model by taking into account the importance of different users [15]. Ma et al. established a fuzzy linear programming model for the optimal allocation of multi-objective water resources (including reclaimed water) that can be used for the rational allocation of multi-water resources [16]. Kilic et al. developed a multi-objective model for large-scale irrigation systems that increased production value by increasing irrigation areas and reducing water losses [17]. Eskandar et al. proposed a new heuristic water cycle optimization algorithm that is based on the simulation of the water cycle process in nature, and has been used to solve water resource problems with multiple objectives and multiple constraints [18]. Roozbahani et al. proposed a multi-objective optimization model for the sharing of water resources among transboundary river stakeholders by converting the multi-objective problem into a three-step, single-objective problem [19]. Based on the middle route of China’s South-to-North Water Transfer Project, which was opened in 2014, Zhang et al. set up a multi-water resource joint scheduling model for the combined water supply of multiple sources (external water transfer, local surface water, and groundwater) in Beijing, aimed at minimizing water shortages and water wastage [20]. Yu et al. researched the optimal allocation of water resources in Tianjin based on two scheduling objectives of a system network topology (social benefit and water supply cost) by establishing a multi-source joint scheduling model of the urban water supply system [21]. Roozbahani et al. established a multi-objective optimal water resource allocation model to address water resource competition between different water use sectors and to simultaneously address economic, social, and environmental problems [22].
These models, which address the optimal allocation of water resources, are usually a general simplification of the regional water supply system [23], and are seldom divided in detail according to the specific characteristics and objectives of water users and water supply. The allocation results only consider the total allocation relationship between water supply and water demand, and insufficient consideration is given to the detailed water distribution process, such as the distribution of water infrastructure pipelines, water transmission capacity, water purification capacity of water treatment plants, and the spatial distribution of water resources. Consequently, the theoretical configuration can only be used for macro guidance, and cannot provide detailed guidance for water supply schemes. To address this knowledge gap, this study proposes a virtual water treatment and distribution station (a “water station”) to take into account the water resources, the administrative division of regional water supply, and the complexity and diversity of water users. The study also proposes to build a detailed water resource allocation model based on a network topology diagram of water supply source–station–user (WSSU). Using Tianjin’s water resource allocation in a typical year (2020) as an example, water distribution schemes for the combined water supply from multi-water sources are simulated, and optimal allocation schemes for different water sources and different water supply targets are investigated, and the optimal allocation of water resources based on the detailed water distribution process is solved.
2. Methods
2.1. Hierarchical Structure Analysis of the WSSU Distribution System
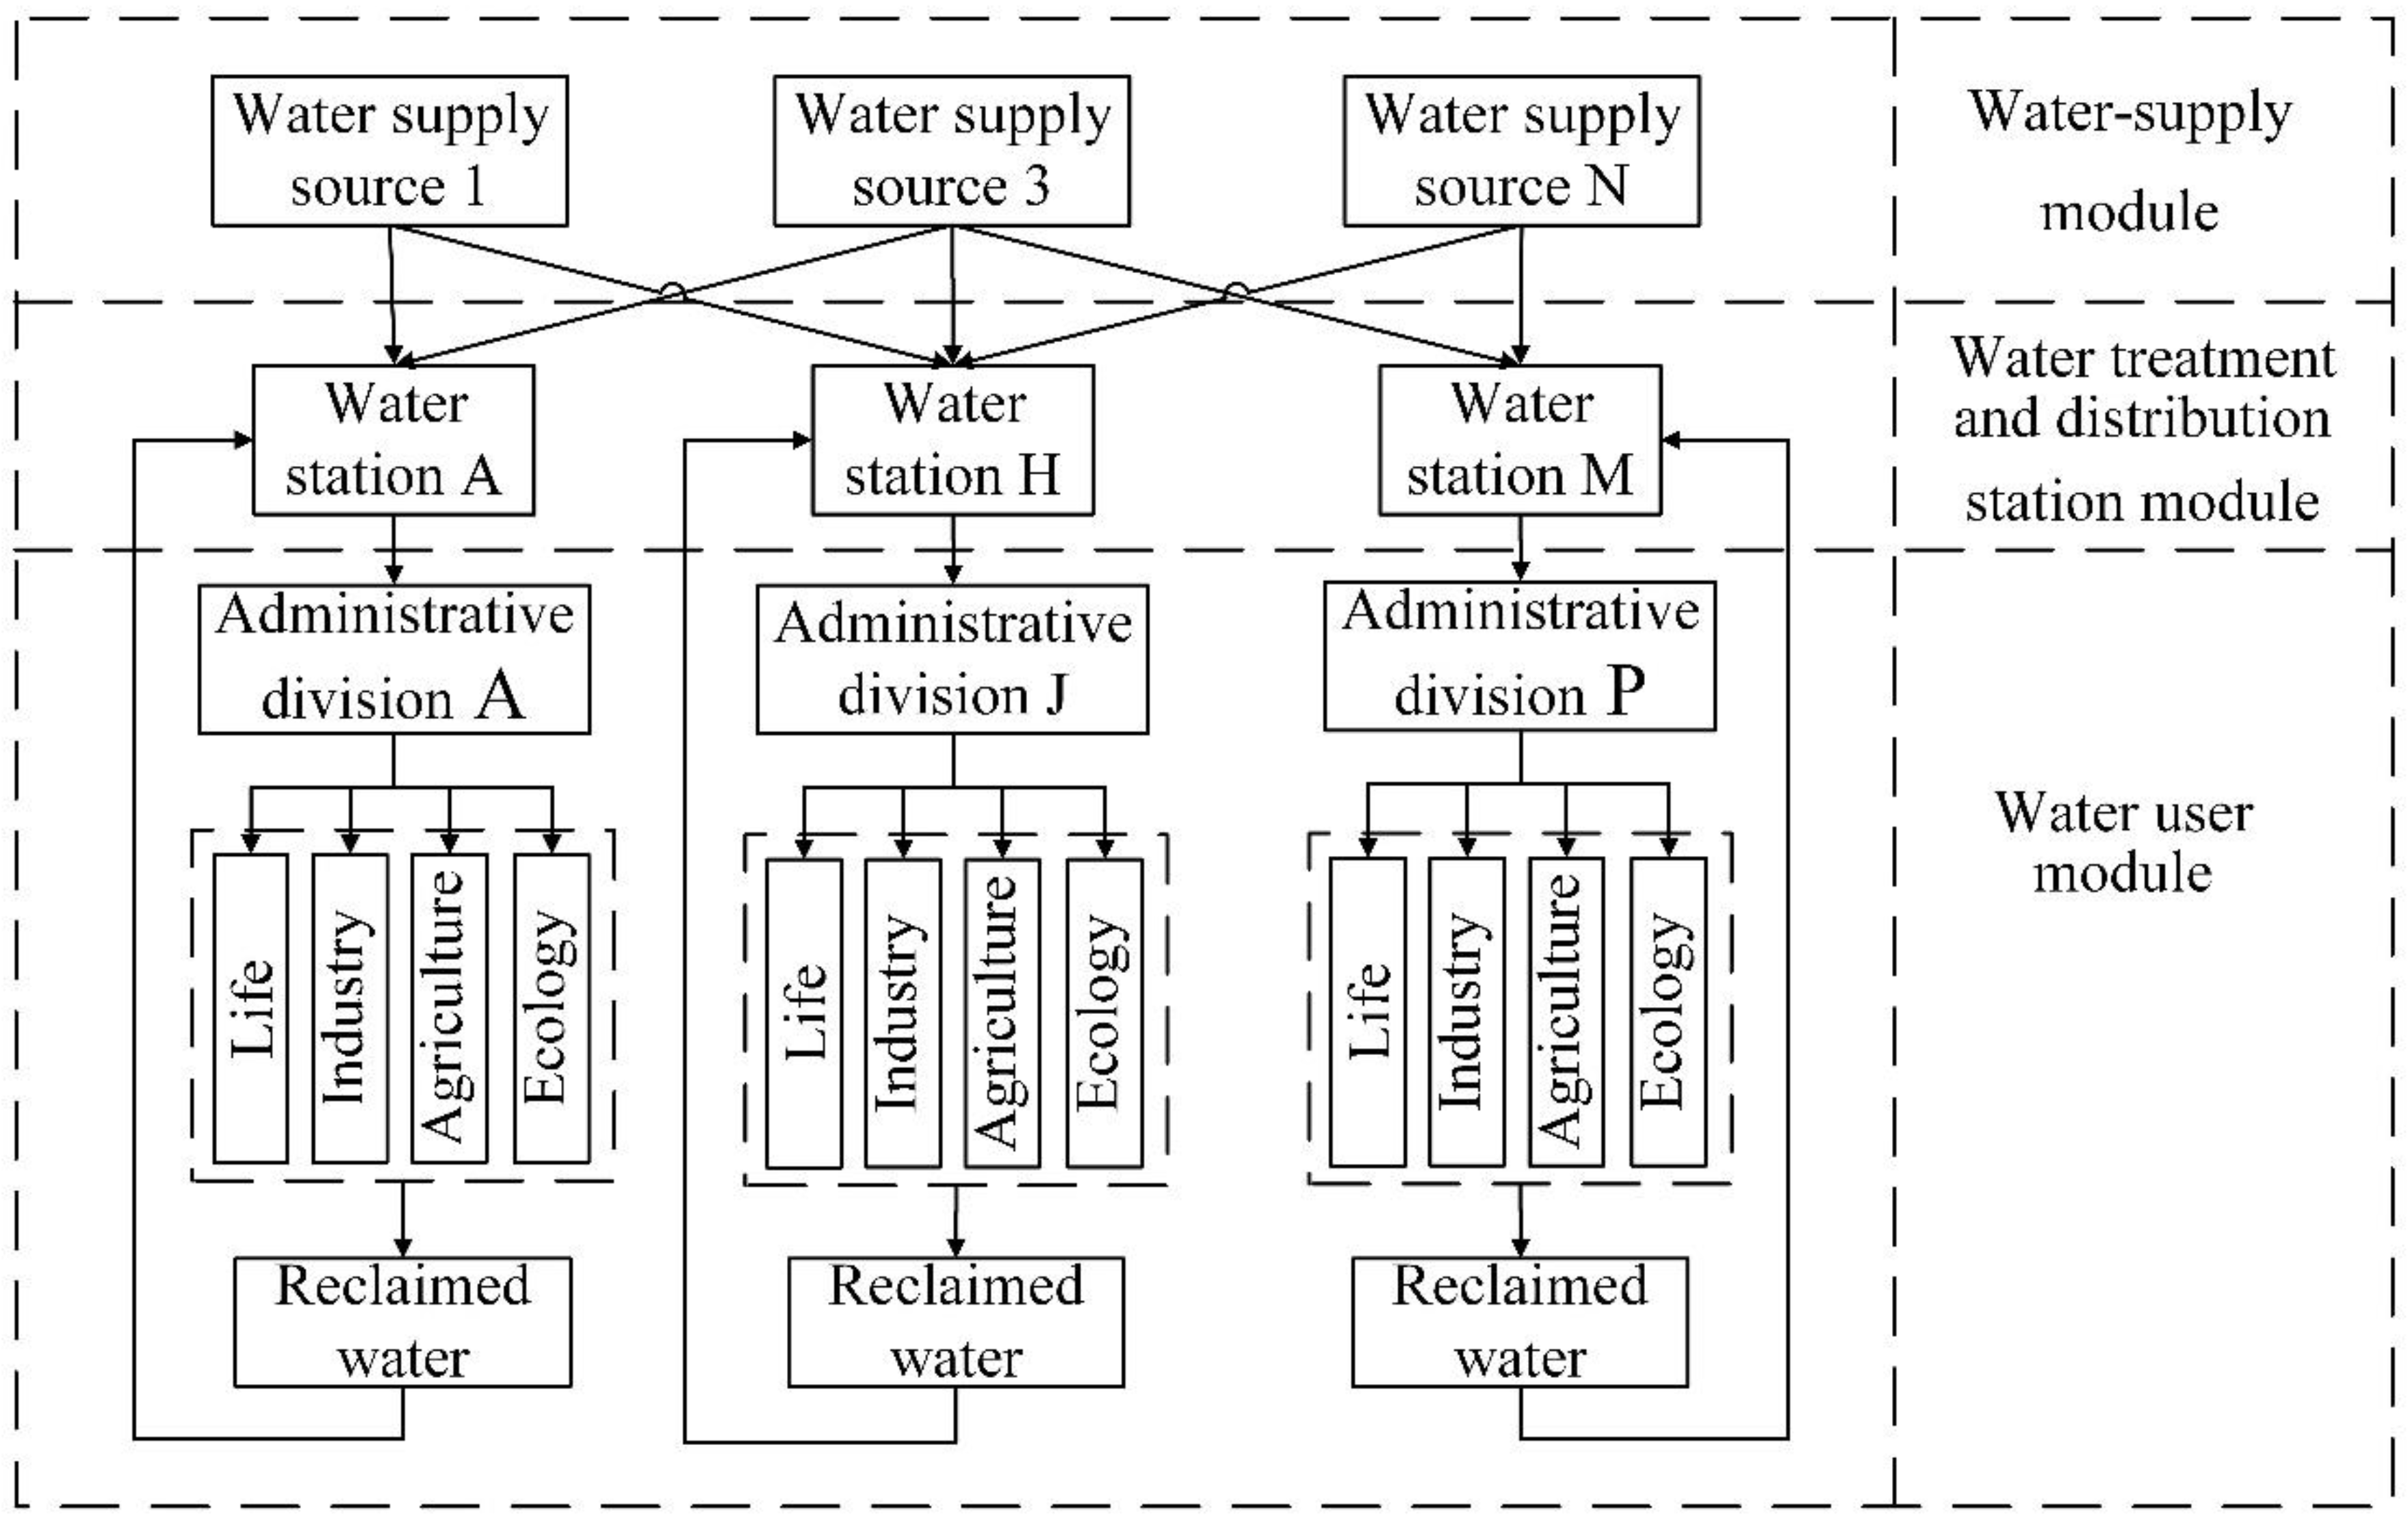
An optimal allocation model for water resources needs to reflect the hierarchical structure of water supply sources and water users in the water resource system, and clearly describe the relationship between water distribution infrastructure, water sources, and water users. Current urban water supply system research usually takes a water plant as the connecting point between water sources and users to build the water supply model [20]. However, the urban water supply model has limited applicability to agricultural water supplied from rivers and lakes [21] because the agricultural water does not pass through water plants, and because there are many water intake points that are difficult to calculate uniformly. Therefore, the present study proposes a virtual water treatment and distribution station concept, referred to as a water station for brevity. The water station integrates the functions of existing surface water plants, underground water plants, sewage treatment plants, and desalination plants, as well as the functions of the management and distribution of water resources, in order to make a comprehensive water allocation for regional water users. It is assumed that all the water resources supplying a certain region are, first, summarized to a water station of the region through the water distribution network. Subsequently, some of the water passes through water treatment processes at the water station, i.e., the purification capacity of each water plant is distributed throughout the water distribution network to specific users who need purified water. The rest of the water is not treated or simply filtered (which does not involve the water purification capacity of the water station), and then distributed to water users. Reclaimed water is returned as sewage generated by the user to the water station, and is then purified by the sewage treatment plant, and transported to specific users for secondary use. By introducing the concept of a water station, the water supply of each user can be uniformly coordinated in a water station, which facilitates water balance calculations. Moreover, the functional integration of water stations simplifies the water supply route (supply source > distribution pipeline > water plant > distribution pipeline > user). This facilitates the reasonable generalization of water sources, water stations, and water users in different regions in the construction of the refined WSSU scheduling model.
The refined WSSU model is a multi-level water resource scheduling model, and includes the water supply source, water station, administrative division, and water user. There are a large number of individuals involved, and there may be one-to-one, one-to-many, many-to-one, and many-to-many connections between them, which makes the model more complex. To reduce the model dimensions and to reduce the number of system variables, a two-layer programming model was adopted for the model structure [24,25,26]. The first layer is the water supply system from the water supply source to the water station, and the second layer is the water demand system from the water station to the users. The upper and lower layers of the model are relatively independent, with independent decision variables, objective functions, and constraint conditions. However, the two layers are related to each other. The decision variables given at the upper level will be passed to the lower level as parameters to participate in the constraint decisions at the lower level. The objective functions at the lower level will be passed to the upper level as important feedback indicators for the optimization of the upper model. This process is repeated until the optimal feedback is found, and the upper layer obtains an overall optimal solution. The WSSU system diagram is shown in Figure 1.
2.2. Objective Functions
From the point of view of social equity, regional water systems require as much water as possible to meet the needs of all users. Thus, the water shortage rate reaches a minimum. From the perspective of water supply cost, the total cost of the regional water supply system should be as small as possible, and the water resources should be distributed to the users with higher incomes, in order to obtain the maximum benefit with the lowest water supply cost. In this study, four objective functions were set up, i.e., social benefit target, economic benefit target, water supply cost target, and social equity target [27]. To realize the rational allocation of water resources in the complex WSSU system, a multi-source combined water supply scheduling model was constructed, and an appropriate multi-objective algorithm was selected to solve the model.
2.2.1. The Upper Layer: Social Benefit Target
The social benefit value is calculated in the form of a water benefit coefficient for different users to directly reflect the total benefit value of the water distribution scheme. Previous research has paid more attention to the development and utilization of water for the economy, and has ignored the importance of water demand from the ecological environment. In this study, the priority of water use by the ecological environment is raised. Hence, the efficiency coefficients for domestic and ecological water use are assigned large values. The social benefit function is expressed as follows:
where represents the social benefits after the completion of water supply tasks in various districts during the year (1 × 10⁸ yuan); represents the annual amount of water that the water source supplied through the water station to the user of administrative division , (1 × 10⁸ m³); and represents the benefit coefficient of unit water supply to user (yuan/m³).
2.2.2. The Upper Layer: Economic Benefit Target
Many indicators (e.g., GDP and profit) reflect economic benefit targets. To more directly reflect the economic benefits of water distribution, the economic benefits were calculated by using the efficiency coefficient of water consumption per unit, i.e., market water price. The economic benefit target function is expressed as follows:
where represents the economic benefits after the completion of water supply tasks in various districts during the year (1 × 10⁸ yuan); represents the annual amount of water that the water source supplied through the water station to the user of administrative division (1 × 10⁸ m³); and represents the economic benefit coefficient of unit water supply to user, i.e., market water price (yuan/m³).
2.2.3. The Lower Layer: Water Supply Cost Target
There can be many kinds of water sources in regional water supply systems. Water transmission projects and raw water prices determine the cost and scope of water supply. Water supply cost adopts unit raw water price as the calculation standard, and the calculated total raw water supply cost is the target of the water supply cost. A minimum water supply cost is sought, while maintaining optimal regional benefits. The water supply cost target function is expressed as follows:
where represents the water supply cost of each district after completion of water supply tasks in the year (1 × 10⁸ yuan); represents the annual amount of water that the water source supplied through the water station to the user of administrative division (1 × 10⁸ m³); and represents the price of raw water per unit of water supply of source (yuan/m³).
2.2.4. The Lower Layer: Social Equity Target
A minimum total regional water shortage was adopted as the goal of social equity, and reflects the fairness of water resource allocation. The social equity target function is expressed as follows:
where represents the water shortage after the completion of water supply tasks in each district in the year (1 × 10⁸ m³); represents the annual water requirements of the user in administrative division (1 × 10⁸ m³); and represents the annual amount of water that the water source supplied through the water station to the user of administrative division , (1 × 10⁸ m³).
2.3. Constraints
(1) Water supply capacity constraints: The total amount of water supplied annually to the connected water stations by the source during the year was not greater than the maximum capacity of the source.
(2) Pipe network capacity constraints: The amount of water supplied by the source to the water station during a year was not greater than the maximum pipe capacity of the water supplied by the source to the water station.
(3) Water station purification capacity constraints: During a year, the total amount of purified water supplied to each partition user by the water station was not greater than the maximum capacity of the water purification station.
(4) Water station constraints: The total amount of water supplied by the water station to users in each district must not be greater than the sum of water supplied by each water source to this water station.
(5) Water supply constraints: The total amount of water provided by the water station to users in each district must not be greater than the maximum amount of water required by the users.
(6) Non-negative constraints: The model satisfies the non-negative constraint of decision variables.
2.4. Objective Function Processing
Since the results of the objective function are in different dimensions, dimensionless processing is needed. This study adopts the standard deviation method, which is a deformation based on the standard method. The function expression is as follows:
where represents the standard deviation of the objective function; and represents the objective function ( = 1, 2, 3, 4).
2.5. Multi-Objective Weight Processing and Solution
The linear weighting method is used to transform each objective function into a single objective optimization function, and then the overall optimization of the whole region is solved. The function expression is as follows:
where represents the weight coefficient of four targets; and represents the objective function after standard difference processing ( = 1, 2, 3, 4).
LINGO software (www.lindo.com, Lindo Systems, Chicago, IL, USA) was used to solve the model. LINGO software has a built-in modeling language, which provides multiple internal functions. The overall efficiency of this software, from modeling to solving, is very high. The objective function data and constraint data (water supply source data, user water demand data, water supply network capacity data, daily water plant capacity data, etc.) are input in the form of formulas. The modeling language built into LINGO then automatically transforms the mathematical model into matrix form, and automatically selects the appropriate solver to solve the problem in terms of the model.
3. Case Study
Tianjin is situated on the banks of the Haihe River, in China. Tianjin has a developed economy and a large population. Water resources are in great demand, and there are large local water supply shortages. Per capita water use was only 124.84 m³ per annum [28]. This is the smallest per capita water use of all the provinces and cities in China. Severe water shortages have greatly restricted the sustainable development of Tianjin. After the opening of the middle water supply route of China’s South-to-North Water Transfer Project, water sources available to Tianjin include local surface water, groundwater, groundwater source field, reclaimed water, desalinated seawater, Luanhe River water, and water from the South-to-North Water Transfer Project (subsequently referred to as River water). A multi-source water supply system has been created. Water is mainly supplied from two external water sources, with local water sources providing auxiliary supplies. Since there are so many different water sources, and because the water supply infrastructure is so complex, the potential for water user conflicts over limited resources is high. The management of resource allocation for this complex, multi-source water supply is difficult. Therefore, using the water supply system of Tianjin as a case study will provide results that can be extrapolated to other areas.
3.1. Network Diagram of Water Supply System
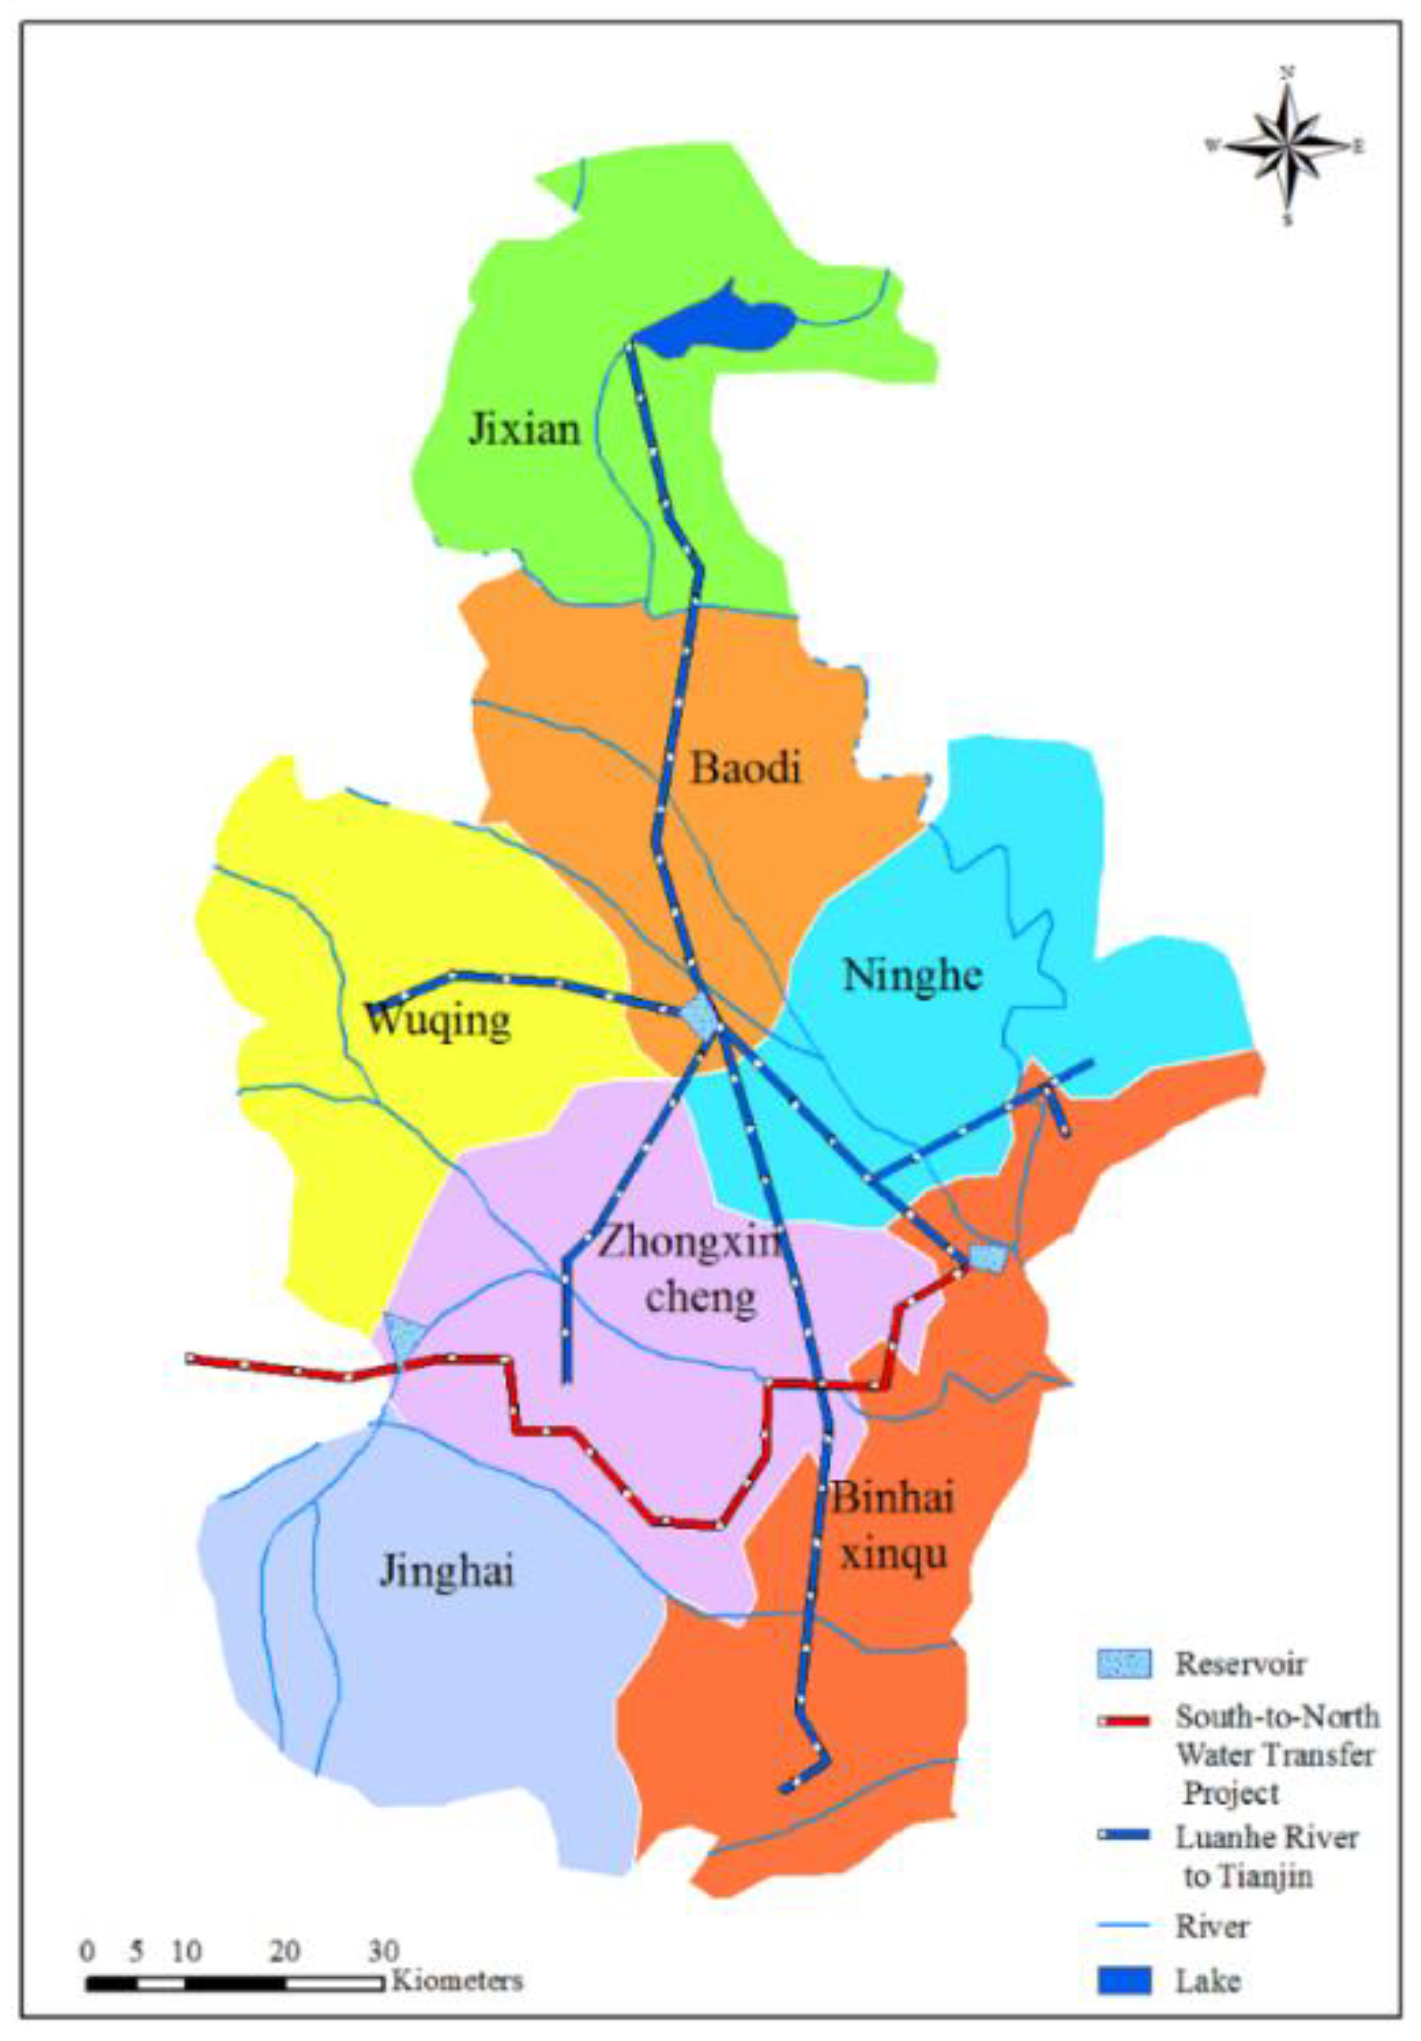
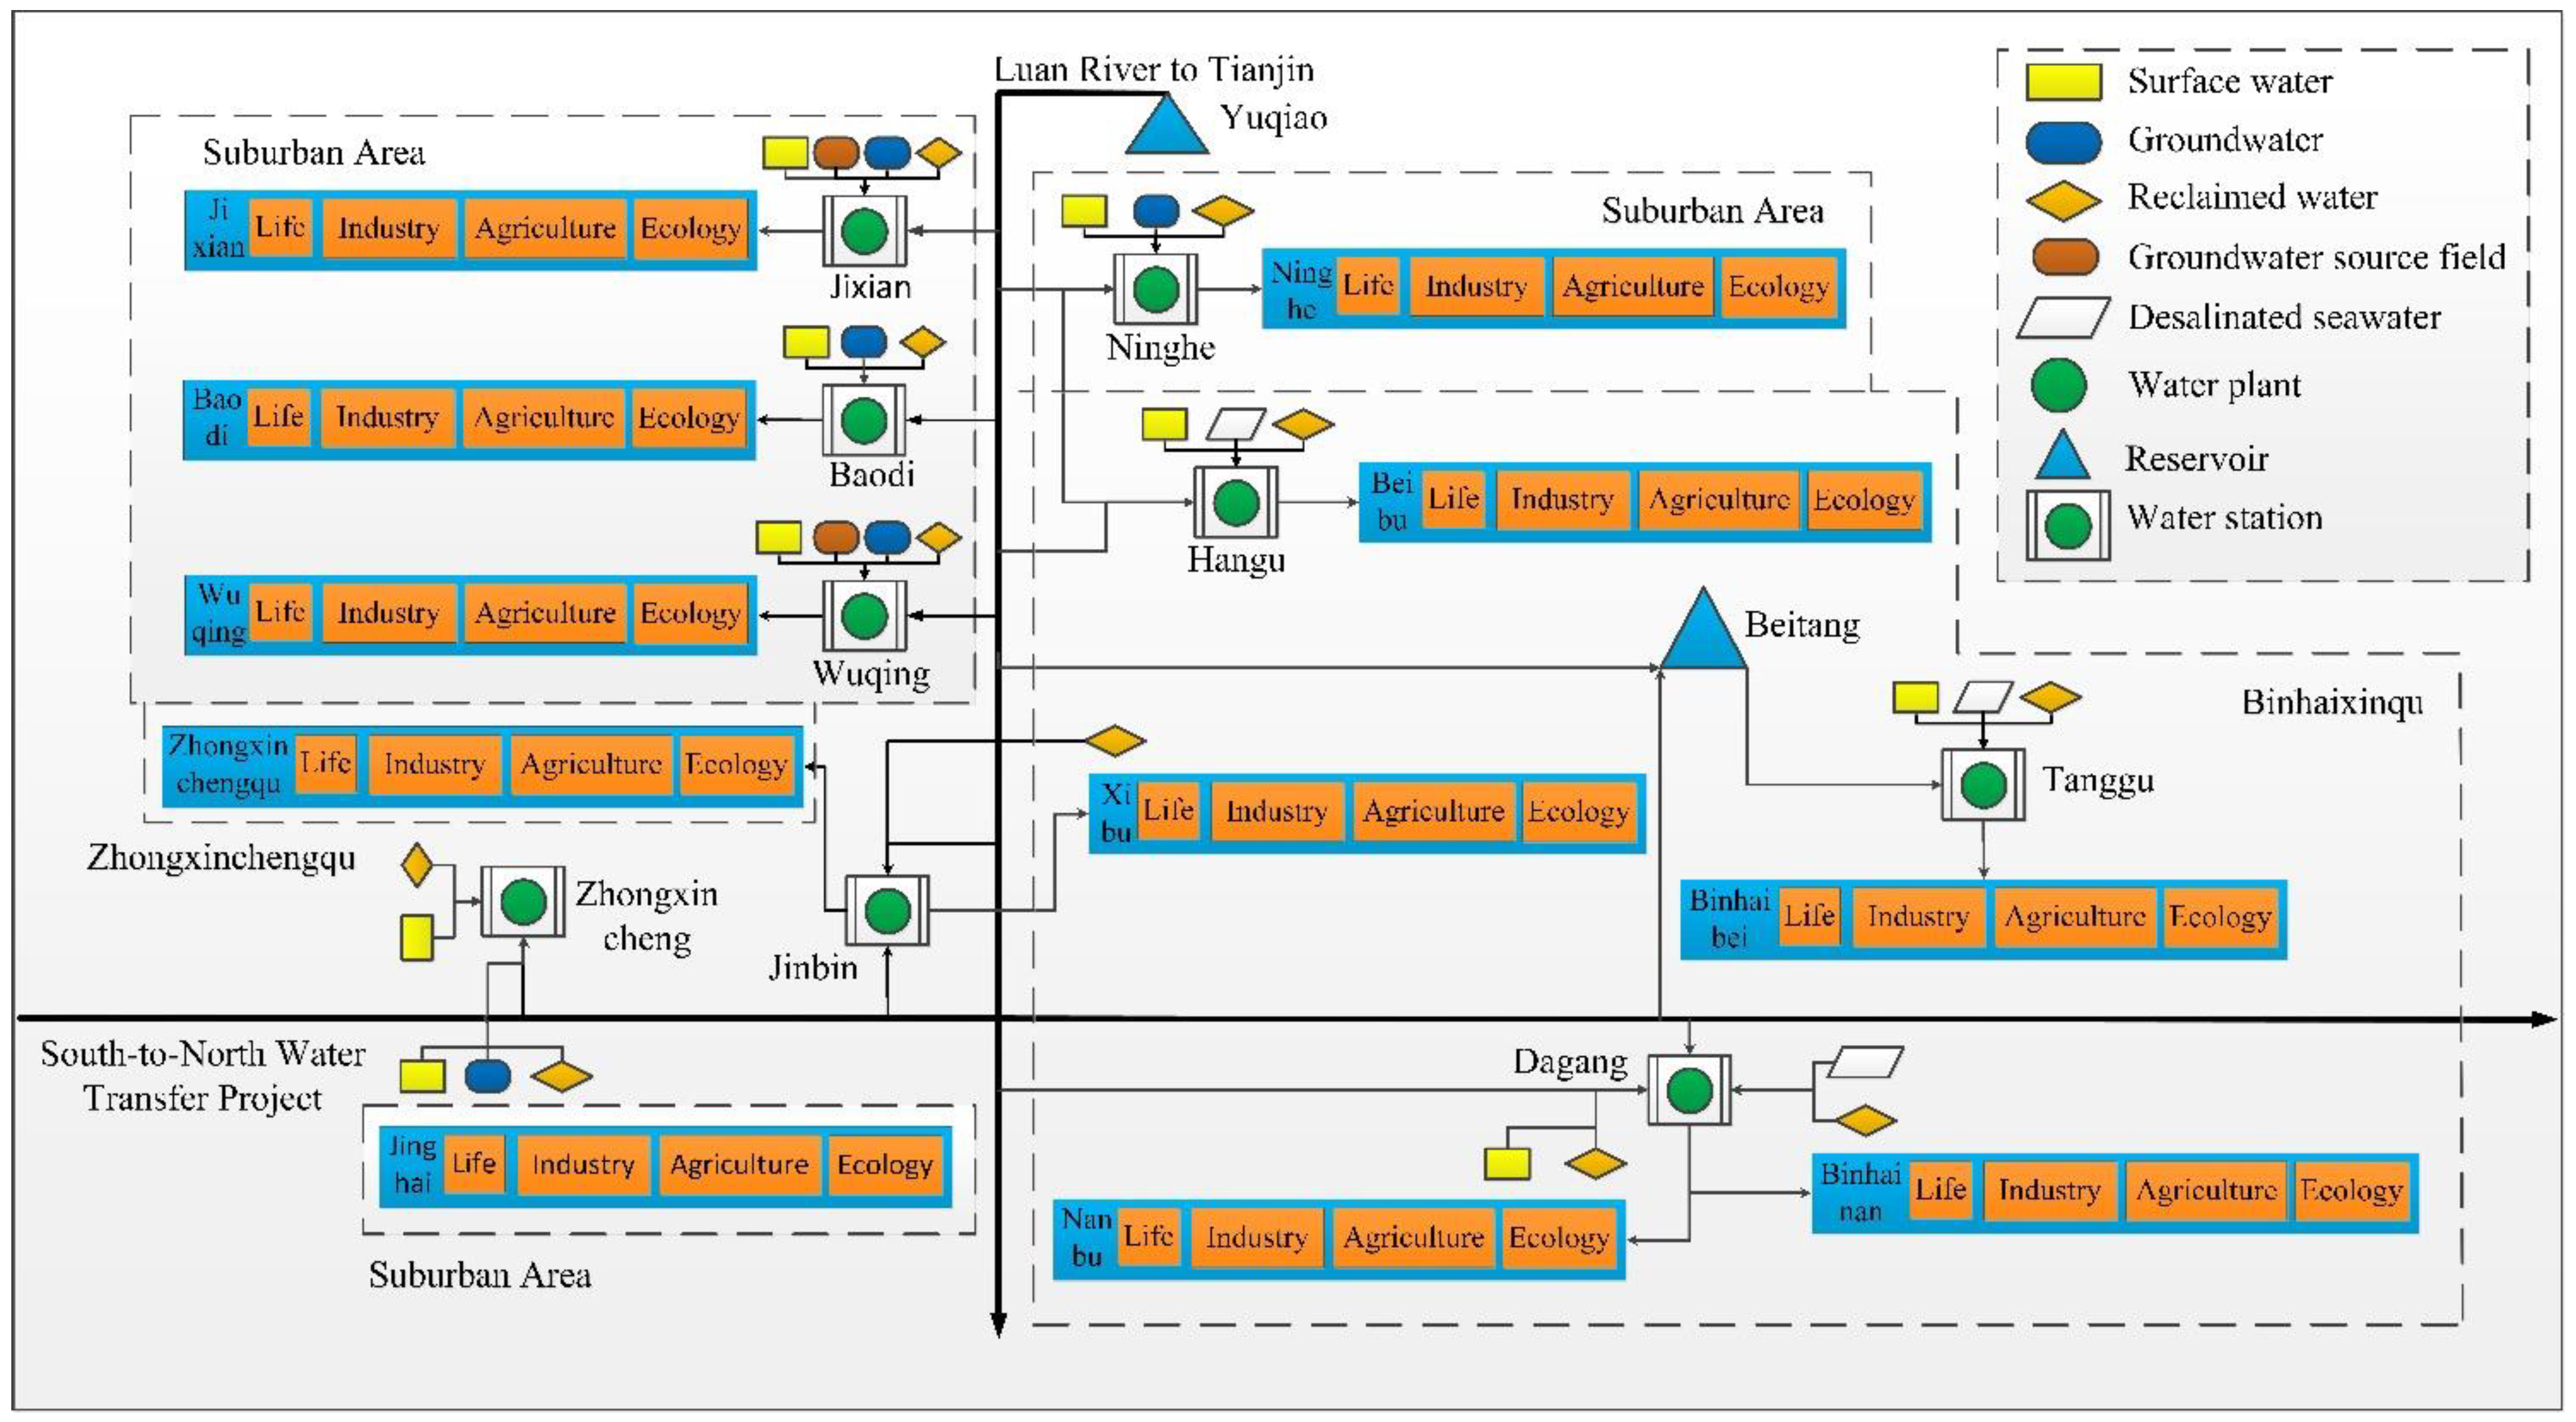
The overall urban planning and spatial development strategy of Tianjin was combined with the location of the Luanhe River and the South-to-North Water Transfer Project [29]. The water plant and water transmission networks were systematically generalized in accordance with the water station concept. Tianjin can be divided spatially into a horizontal and a vertical linear feature, three large areal features, eleven partitions, and four users. The linear features refer to the two major external water diversion projects, i.e., the middle route of the South-to-North Water Transfer Project and the Luanhe River to Tianjin project. Two straight lines are used to represent the main water supply lines, ignoring the water quantity adjustment function of the reservoir. The three large areal features are the suburban area, the Zhongxincheng area, and the Binhaixinqu area. The eleven partitions refers to eleven administrative divisions within the three large areal features. Suburban areas include Jixian, Baodi, Wuqing, Jinghai, and Ninghe. The Zhongxincheng area includes Zhongxinchengqu and six districts of the city. The Binhaixinqu area includes Beibu, Xibu, Nanbu, Binhaibei, and Binhainan (Figure 2). The four users refer to the four types of water users in each administrative division, namely, domestic, industrial, agricultural, and ecological water demand. The topological map of the Tianjin water supply network generalized water plants into water stations, and all water supplies to the administrative divisions were summarized into water stations. The external water source and the water station are directly connected through the water pipeline, and the water supply is provided to the users in each administrative division through the water station. Local water sources are assumed to connect directly to the water station through water pipelines, and are then assigned to users. The Zhongxincheng area is jointly supplied by the Zhongxincheng and Jinbin water station. Within the Binhaixinqu area, Beibu is supplied by the Hangu water station, Xibu is supplied by the Jinbin water station, Binhaibei is supplied by the Tanggu water station, and Binhainan and Nanbu are supplied by the Dagang water station. Within the suburban area, Jixian is supplied by the Jixian water station, Baodi is supplied by the Baodi water station, Wuqing is supplied by the Wuqing water station, Jinghai is supplied by the Zhongxincheng water station, and Ninghe is supplied by the Ninghe water station. The generalized water supply network diagram is shown in Figure 3.
3.2. Water Supply Rules
3.2.1. Users’ Available Water Sources
There are many kinds of water sources available in Tianjin, and the water quality of these water sources varies. Different water users have different water quality requirements and, thus, it is necessary to determine the water users of various types of water sources [30,31,32]. The details are shown in Table 1.
3.2.2. Rules of Water Source Priority Utilization
Due to the high cost of external water supplies, local water sources (conventional and non-conventional) are preferred, with the shortfall met by external water. Two preferential rules for water supply from external water sources were set up to take into account (a) the difference in water prices for the Luanhe River water and River water, (b) the priority of water supply from two external water sources, and (c) China’s minimum water supply requirements for River water from the South-to-North Water Project. The first of these rules is the priority of Luanhe River water when there are water shortages after running out of local water sources. When Luanhe River water is insufficient, the shortfall is met by River water. The second rule is the priority of part of the River water for meeting minimum water supply requirements (4 × 10⁸ m³), with excess water requirements met by Luanhe River water. When the total water supply of Luanhe River water is unable to meet the water demand, the remaining water shortages are met by River water.
3.2.3. Water Demand Forecasting
Water demand forecasting is the basis of, and the primary work in, the optimal allocation of water resources. The data on water demand for each partition in Tianjin in 2020 were derived from Ye’s study “Analysis of Tianjin urban demand and water supply” [33]. The water users are divided into four types: domestic, industrial, agricultural, and ecological water demand. Details are provided in Table 2.
3.2.4. Water Supply Forecasting
From an analysis of the current water resources development and utilization situation in Tianjin, water resources available for 2020 will include surface water, groundwater, groundwater source field, reclaimed water, desalinated seawater, Luanhe River water, and River water. The amount of water resources available for Tianjin in the year 2020 is shown in Table 3.
3.2.5. Simulation Scheme Setting
The available water quantity for local conventional water sources (surface water = 9.37 × 10⁸ m³, groundwater = 0.6 × 10⁸ m³, groundwater source field = 0.52 × 10⁸ m³) and unconventional water sources (reclaimed water = 4.51 × 10⁸ m³, desalination seawater = 2.98 × 10⁸ m³) are based on the estimated average requirements for 2020 (total = 17.98 × 10⁸ m³). Historical data on the quantity of Luanhe River water and River water were used to determine the minimum amount of external water available (Luanhe River water = 5.32 × 10⁸ m³ and River water = 4.87 × 10⁸ m³). The minimum amount was used as the initial condition, and the available quantity of external water was then increased in steps of 0.25 or 0.5 × 10⁸ m³ to the maximum value (Luanhe River water = 9.06 × 10⁸ m³ and River water = 12.16 × 10⁸ m³). A 17 × 27 matrix was constructed to simulate the water resource allocation schemes for different combinations of the available external water supplies.
3.2.6. Objective Function
(1) Social Benefit Target
Based on the principle of making water use a priority for domestic and ecological demand, the efficiency coefficient for domestic and ecological water use was assigned a large value. The industrial benefit coefficient was allocated using the gross industrial output value method [34]. The other benefit coefficients relate to social, ecological, economic, and other factors, and were assigned a proportion of the industrial efficiency coefficient [35]. The details of the coefficients are shown in Table 4.
(2) Economic Benefit Target
In Tianjin, the price of domestic water is currently 4.9 yuan/m³, the price of industrial water is 7.85 yuan/m³, and the price of agricultural water is 0.21 yuan/m³. Assigning a price to the cost of ecological environment water is not straightforward. In most cases, the value of ecological water derives from public welfare as determined by government, rather than economic activity. Therefore, the direct economic benefits are small, and this study assumes a small value of 0.1 yuan/m³.
(3) Water Supply Cost Target
Local water resources are limited, and the cost of external water is high. Therefore, only the water supply cost of the external water is calculated. The price of raw Luanhe River water is currently 0.91 yuan/m³, and the price of raw River water is currently 2.16 yuan/m³.
3.2.7. Multi-Target Weight Processing
The benefit generated by water supply is far more than the economic cost of water supply. Therefore, this study assigns high weights to economic, social, and social equity targets. The weights for (economic + social): social equity: water supply cost targets = 0.4:0.4:0.2. The Chinese government’s protection policy for the ecological environment assigns a high weight to the social benefit targets in the economic/social benefit targets. Consequently, the economic/social benefit target = 0.4:0.6. Based on these ratios, the final weight ratio for economic benefit/social benefit/water supply cost/social equity = 0.16:0.24:0.2:0.4. The approach used in determining the ratios is consistent with methods used in similar research in the study area [35].
3.2.8. Calculation Results and Analysis
(1) Analysis of Minimum Water Shortage
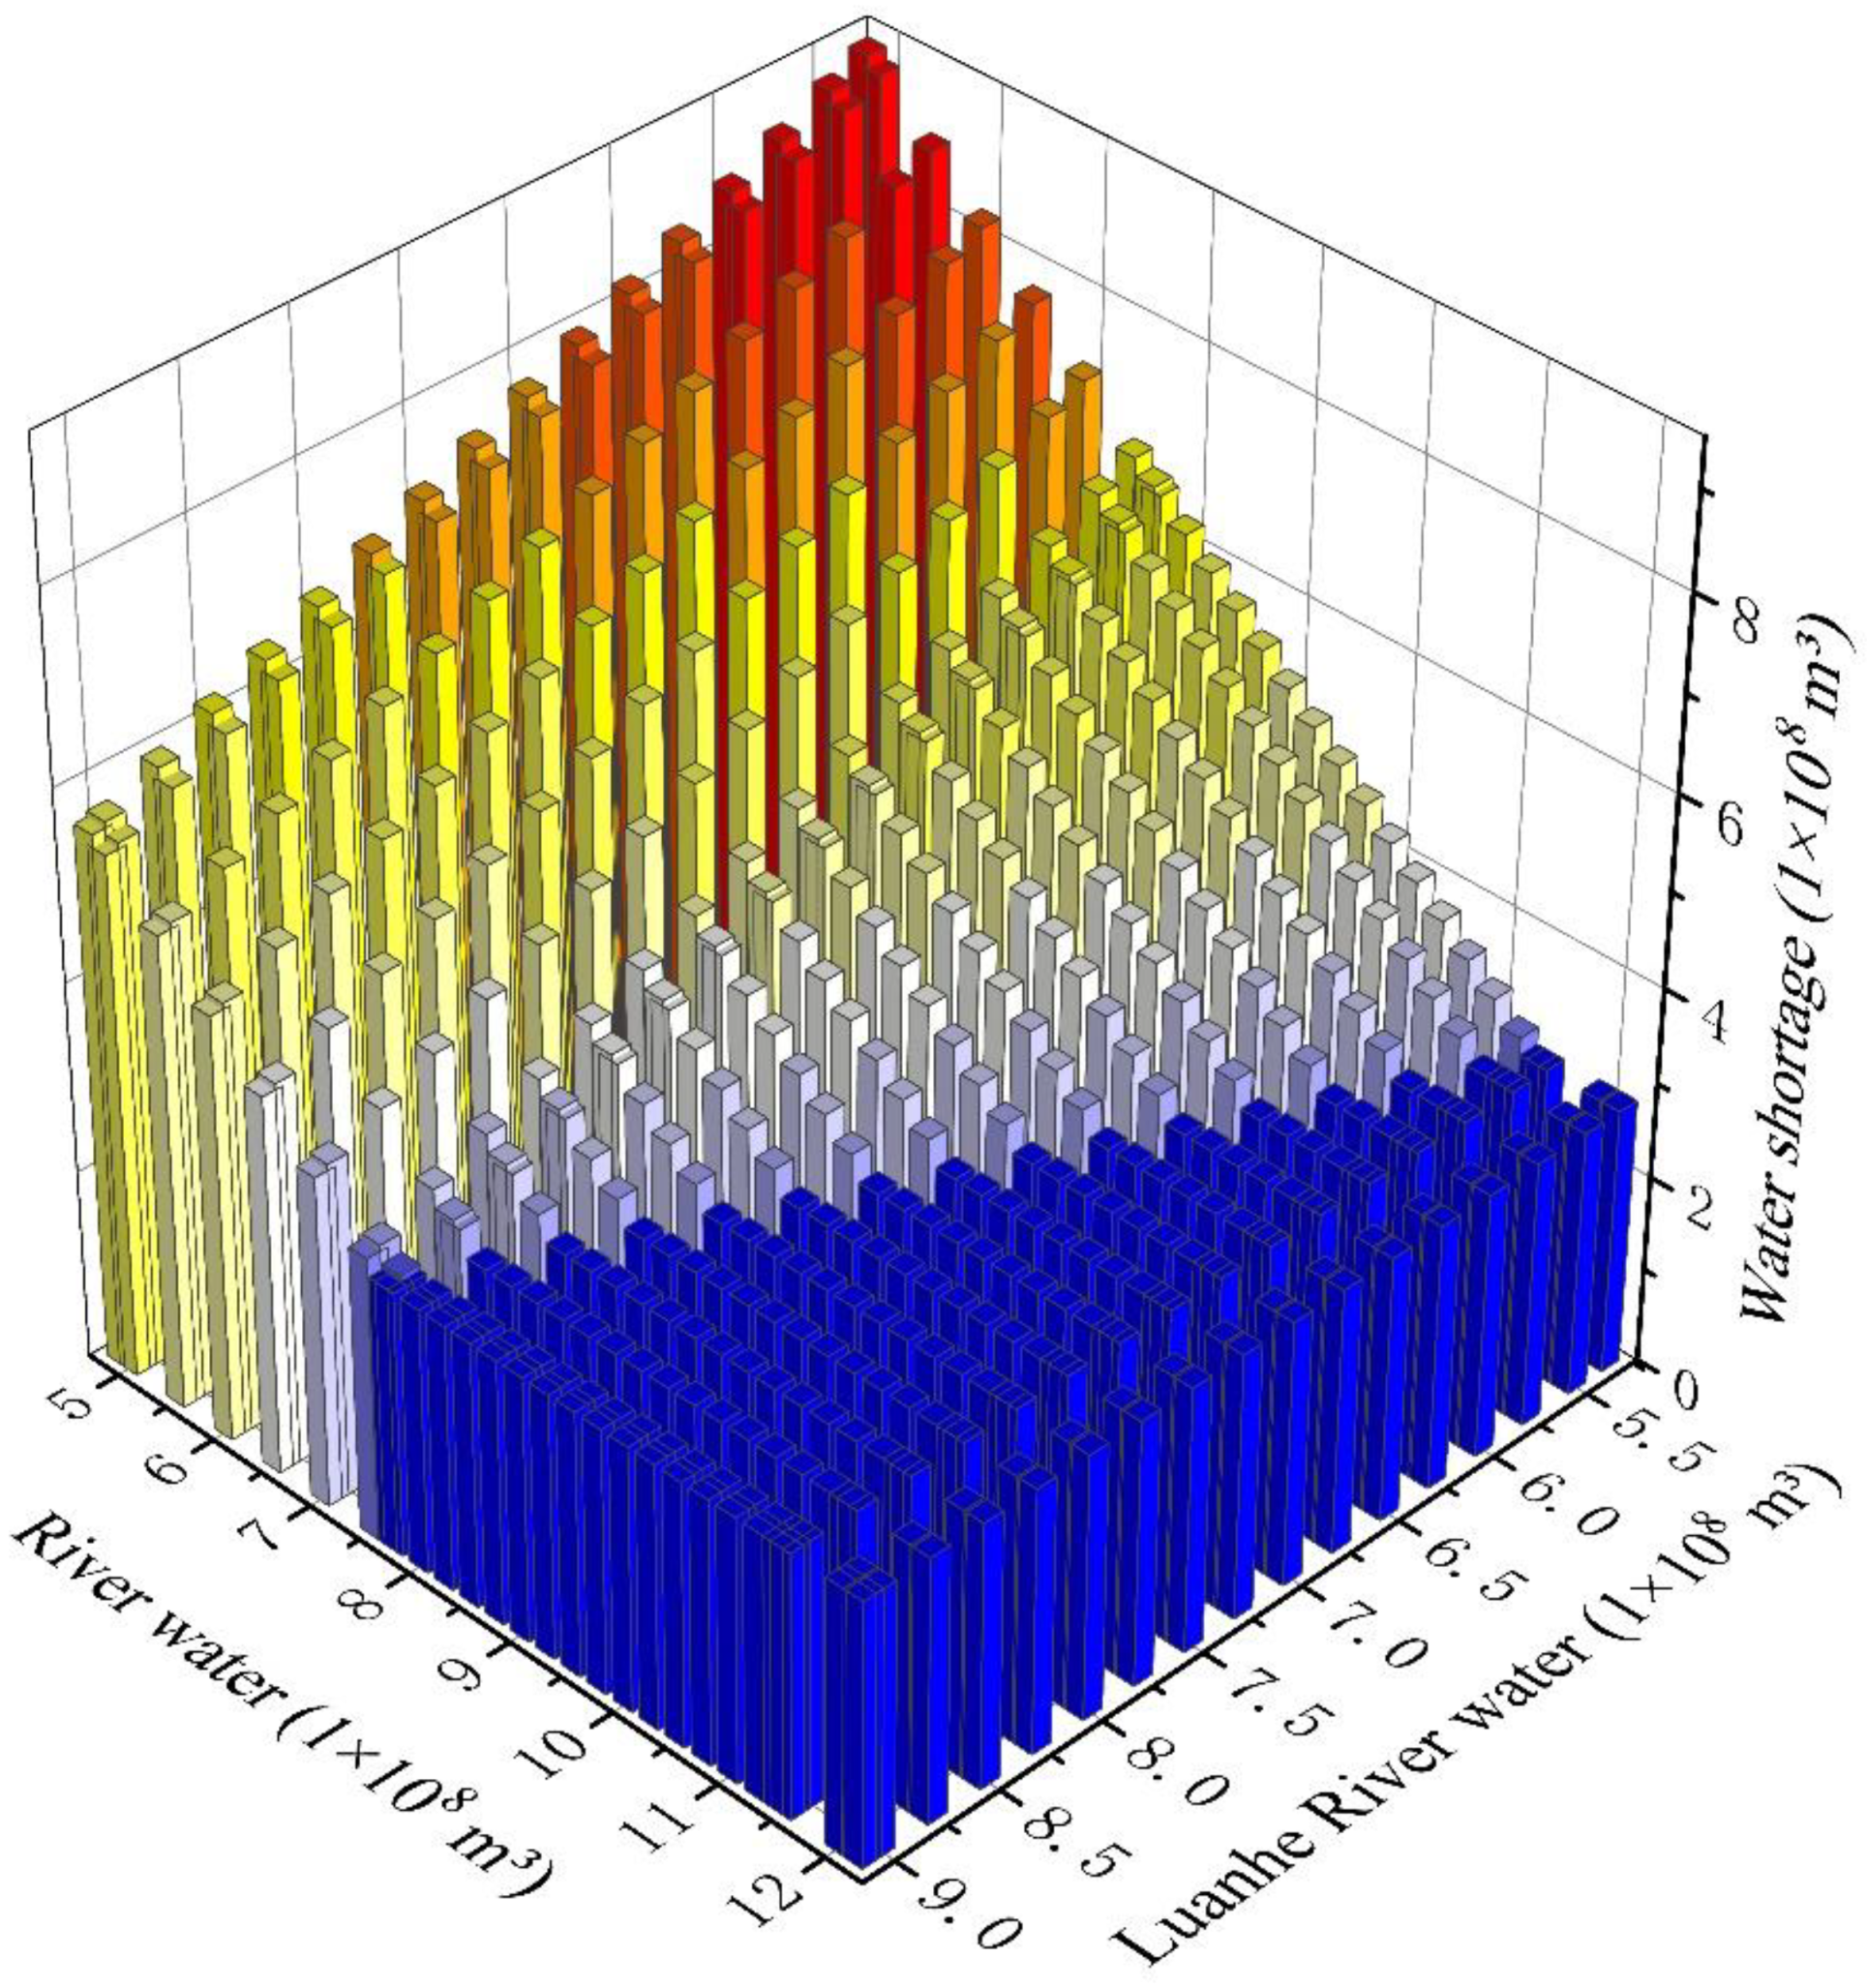
Figure 4 shows a graph of Tianjin’s minimum water shortage in 2020 for different water supply source schemes. It can be seen that, with the increase in the amount of Luanhe River water and River water supplied, the total water shortage is gradually reduced, and the minimum water shortage stabilizes at 2.82 × 10⁸ m³. Based on a simple water supply and demand balance, Tianjin’s total water supply (35.98 × 10⁸ m³) will have exceeded the predicted water demand (35.43 × 10⁸ m³) when the cumulative amount of water from the Luanhe River water and River water exceeds 18 × 108 m³. However, the water demand has not been completely met, which shows that Tianjin’s water shortage is not a simple matter of water resource shortages.
A scheme was chosen with 7.5 × 10⁸ m³ of Luanhe River water available at a 75% guarantee rate, and 12 × 108 m³ from River water available at an 80% guarantee rate. An analysis of the water distribution for water users in this scheme revealed that water shortages for agricultural users occurred at Baodi, Wuqing, Ninghe, and Beibu (Table 5). An analysis of the capacity of the water pipeline in these four areas revealed that the maximum water transmission capacity has been reached. However, the two rules for external water supply allocation allow surplus water from River water to be available to meet all the water requirements of the users (Table 6). Thus, the water shortages in Tianjin under the scheme chosen are the result of infrastructure limitations, rather than a lack of available water. In the four regions of Baodi, Wuqing, Ninghe, and Beibu, the water infrastructure connecting to the River water supplies is not adequate. At the same time, the pipelines’ capacity from the Luanhe River water to these four regions are limited, and cannot meet the requirements of all water users.
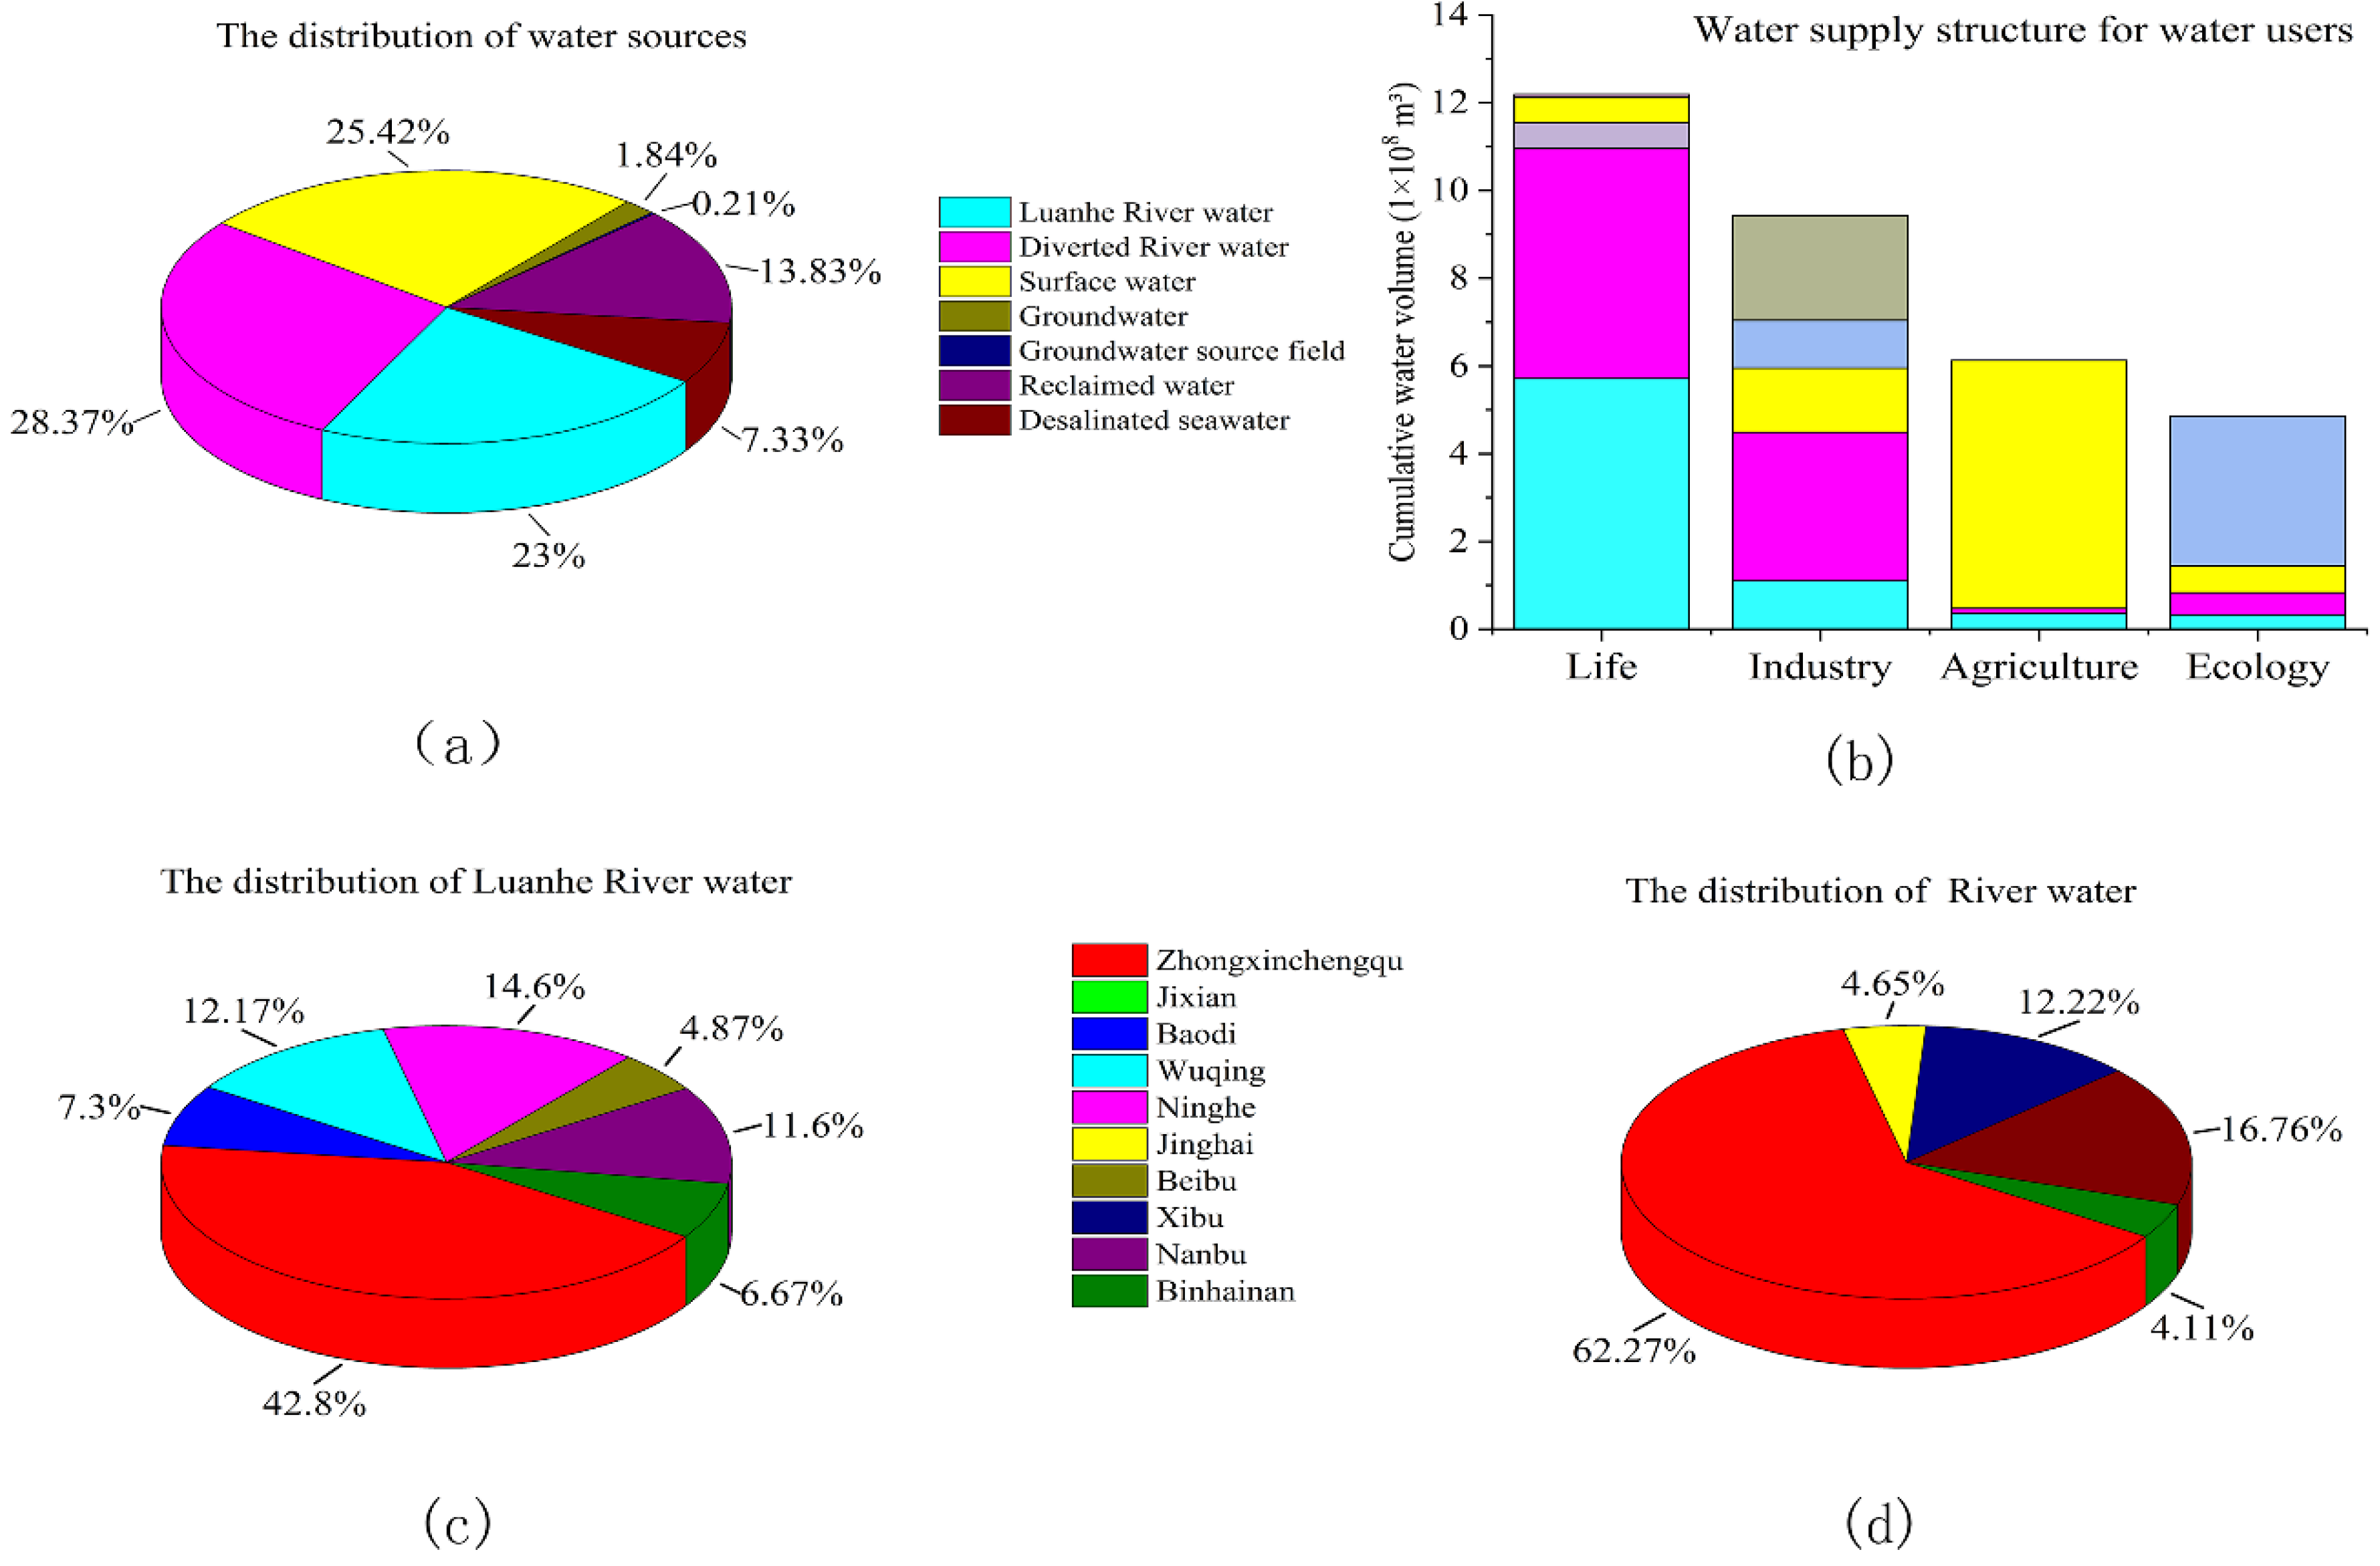
The water supply distribution and trends are shown in Figure 5. Surface water, Luanhe River water, and River water make up the bulk of water supplies, with the largest amount of water being supplied by River water. Domestic water is mainly provided by Luanhe River water and River water. Industrial water supplies are more evenly spread among the different water sources, with River water providing the highest proportion. Agricultural water is mainly derived from local surface water, while ecological water is mainly provided by reclaimed water. The biggest users of external water are Zhongxinchengqu, followed by Binhaixinque. The consumption of external water in the suburban areas is very small, with only Jinghai suburban areas supplied by River water. The reason for this is that there is no water transmission infrastructure to distribute water from River water supply in areas other than Jinghai. This finding is consistent with the earlier findings regarding the effects of a lack of pipeline infrastructure in these areas. An analysis of the use of water sources in Table 6 indicates that water shortages could be caused by both lack of water infrastructure capacity and lack of external water in Tianjin when there are insufficient supplies of Luanhe River water and River water. Therefore, it is necessary to either expand the maximum water transmission capacity of the pipeline from the Luanhe River to Tianjin, or add water transmission infrastructure in the water shortage areas so that more water from River water can be utilized. This will enable supplies to be augmented, while ensuring the stability of external water supply sources.
(2) Analysis of the Cost of Water Supply
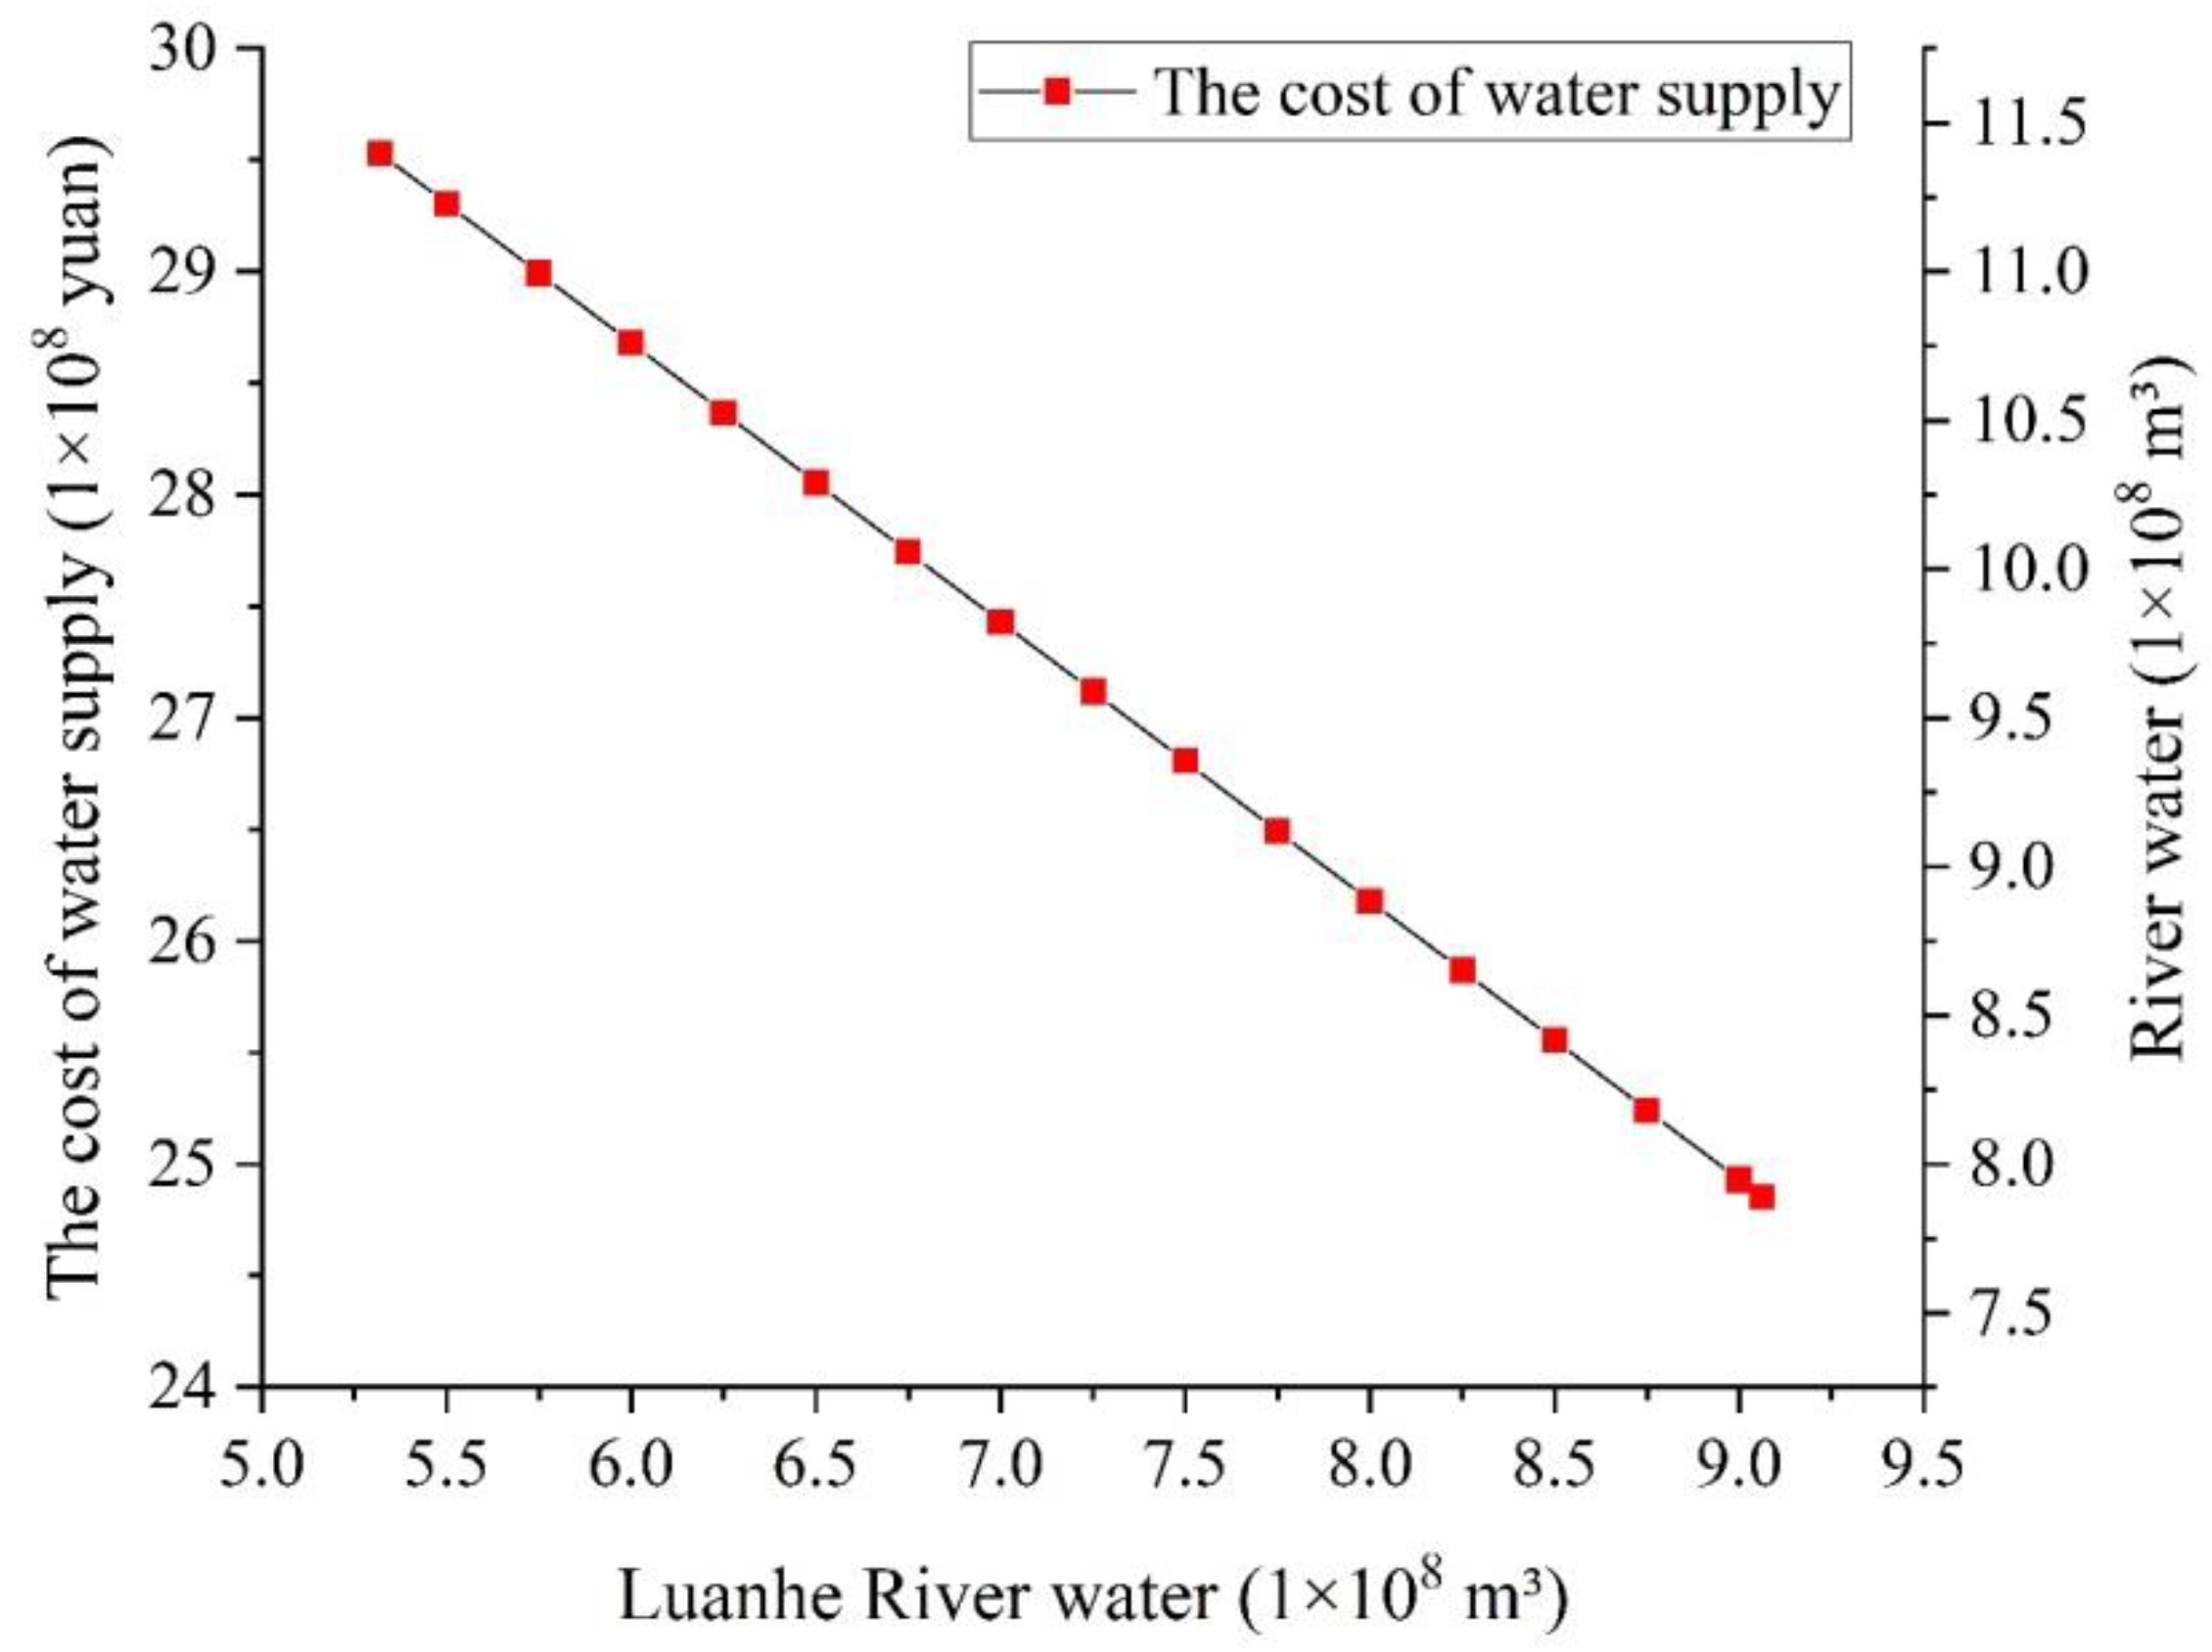
All the schemes that meet the minimum water shortage of 2.82 × 10⁸ m³ will have reached the minimum water requirement of the River water (greater than 4 × 10⁸ m3), irrespective of the two priority rules for external water. Therefore, the cost of water supply in Tianjin is not affected by the priority rules for external water. The cost of water supply for all the schemes (with water shortages of 2.82 × 10⁸ m3) was calculated by analyzing the relationship between the cost of water supply and two external water supplies. As can be seen from Figure 6, the maximum cost of water supply is 29.53 × 10⁸ yuan, with the amount of water supplied by the Luanhe River water and River water being 5.32 × 10⁸ m³ and 11.43 × 10⁸ m³, respectively. The minimum cost of water supply is 24.86 × 10⁸ yuan, with the amount of water supplied by the Luanhe River and River water being 9.06 × 10⁸ m³ and 7.69 × 10⁸ m³, respectively. With the decrease in water from River water and the increase in water from the Luanhe River water, the cost of water gradually decreases. The reason for this is that the price of River water is higher than that of the Luanhe River water. When the amount of River water increases, the cost of water supply will inevitably increase. Therefore, the cost of water supply can be effectively controlled by setting a limit for River water.
(3) Competition between Social and Economic Benefit Targets
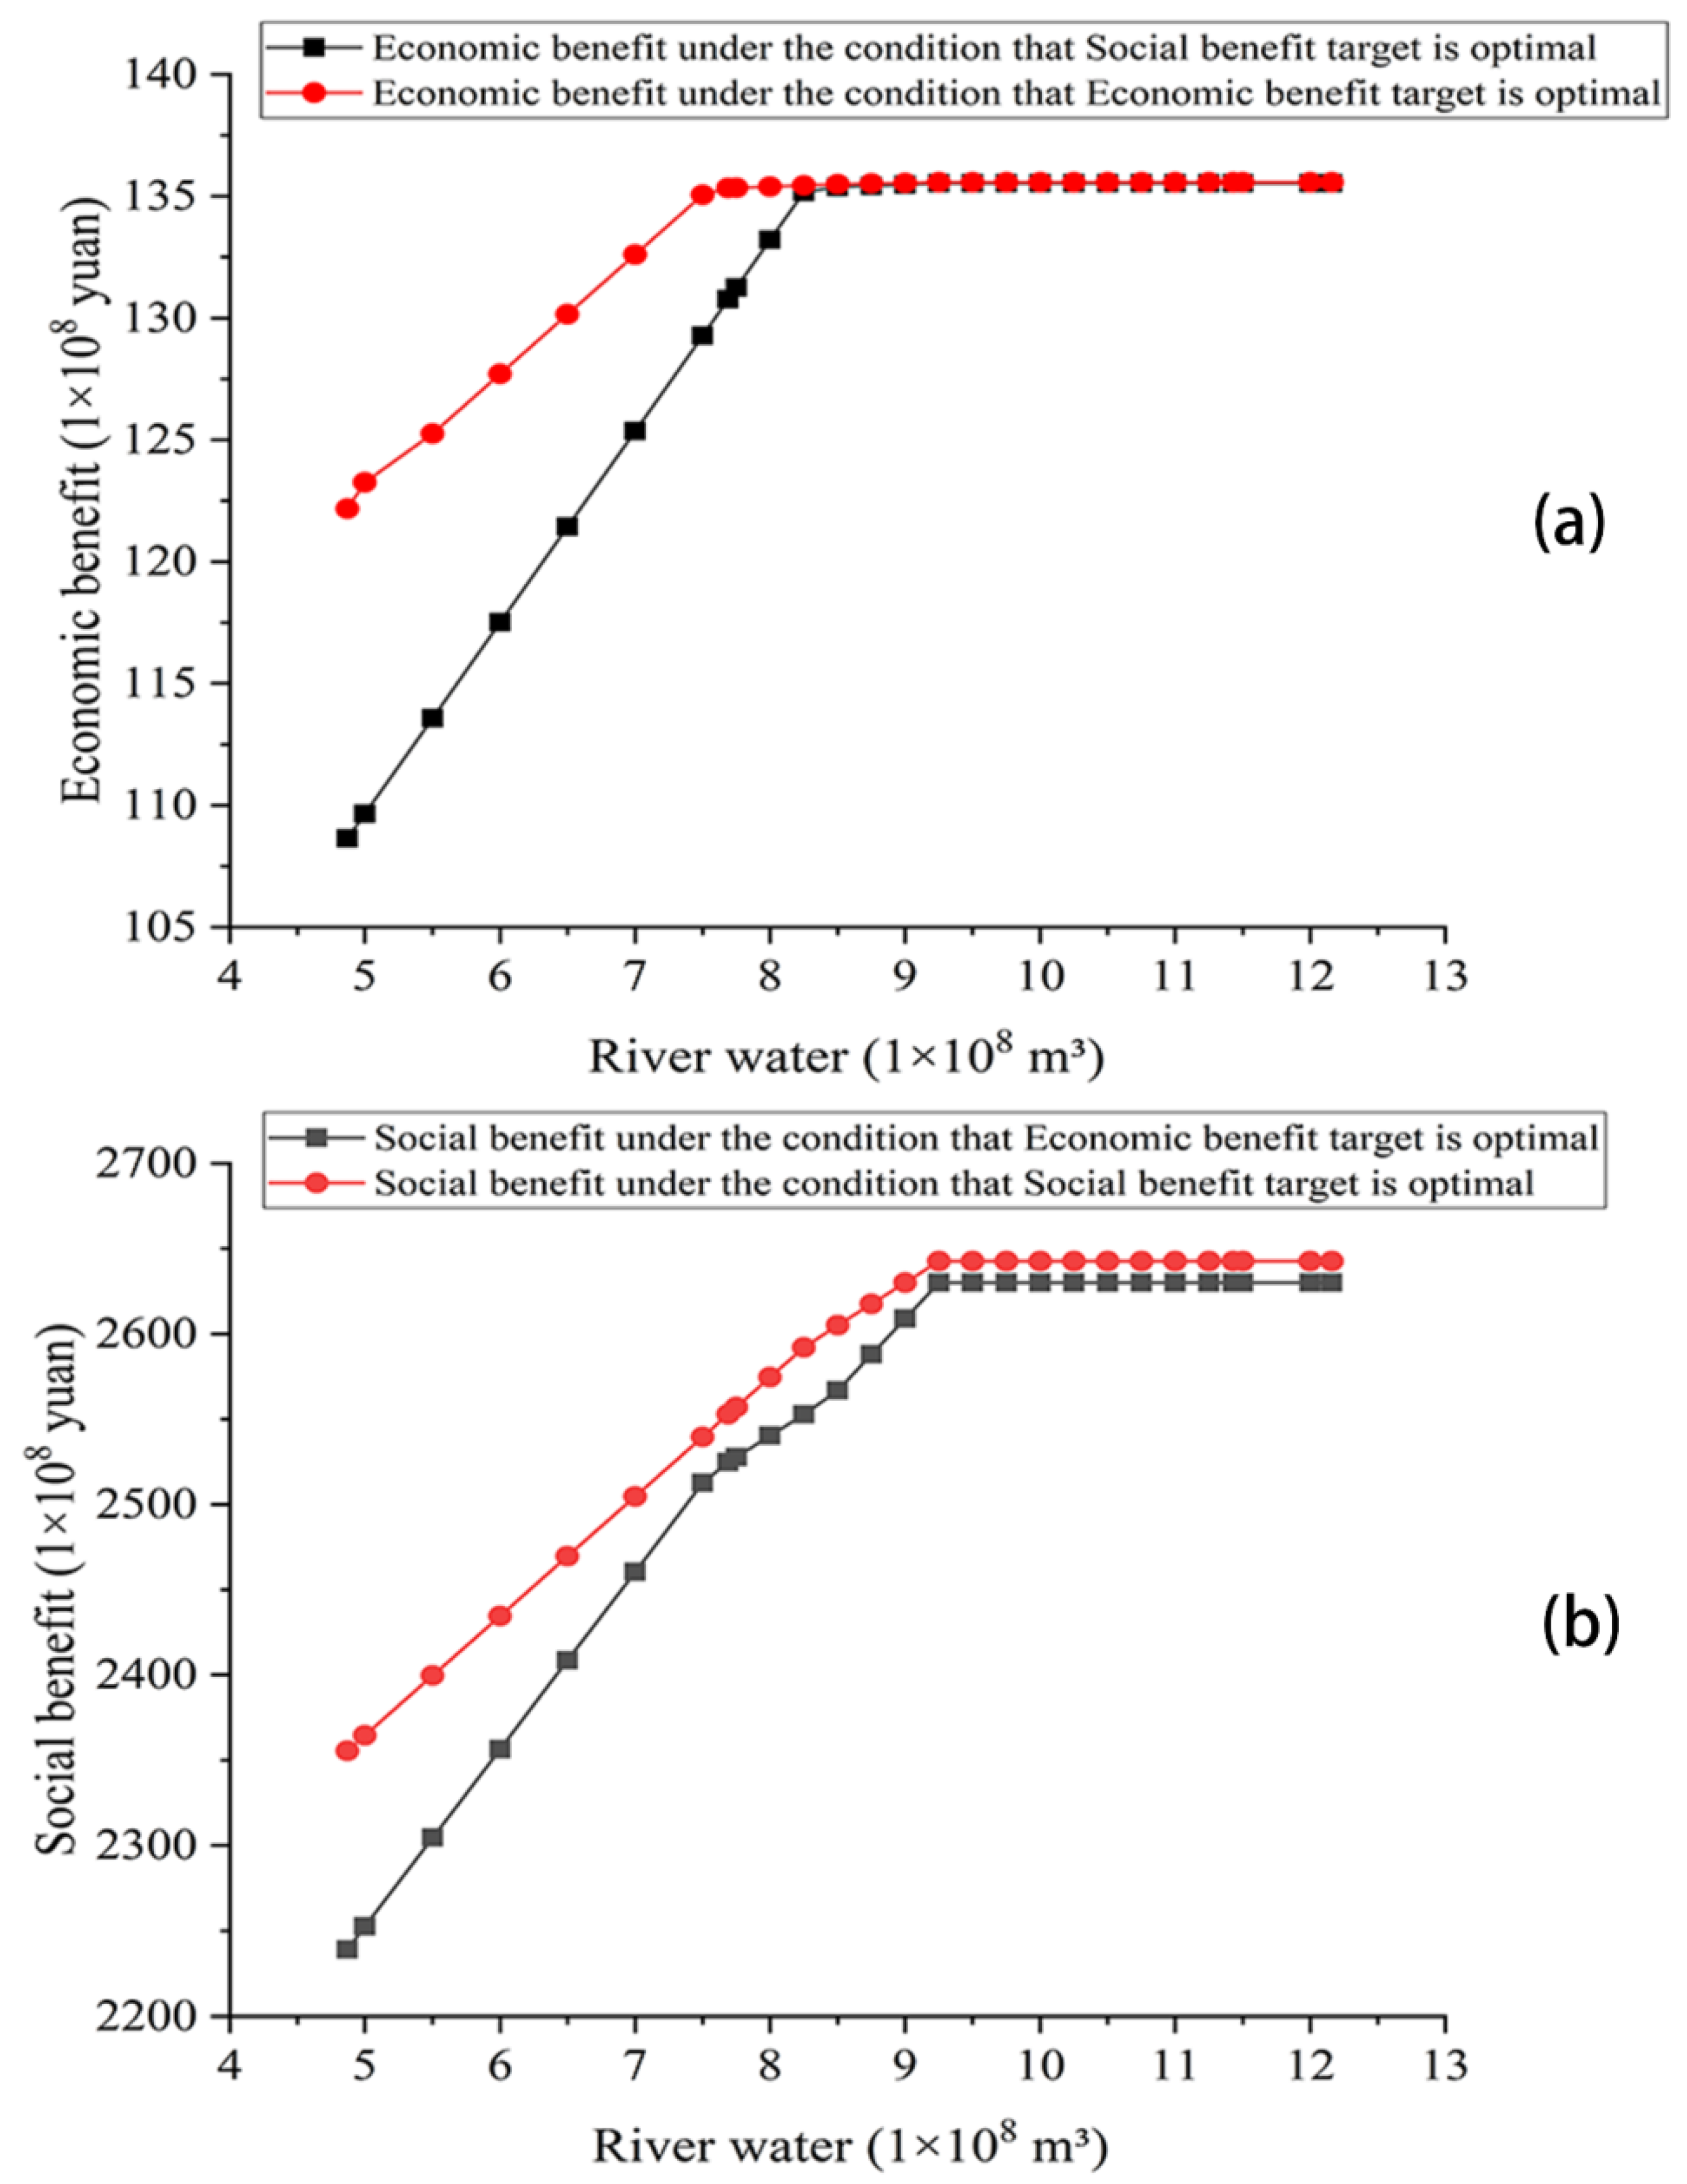
The main conflict between social benefit and economic benefit targets arises from the different water resource priorities of different water users. Domestic water demand is the highest priority of the two targets and, thus, water competition can be avoided. The remaining three water users have different priorities for the two targets. When the total available water cannot meet the total water demand, there will be strong competition for water. To more directly reflect the competition relationship between social and economic benefit targets, the schemes with 7.5 × 10⁸ m³ of Luanhe River water at a 75% guarantee rate were selected for analysis. As can be seen from Figure 7a, when the available amount of River water is low, and the social benefit target is optimal, the economic benefit is obviously lower than that when the economic benefit target is optimal. As the amount of River water increases, the gap between the two benefits gradually narrows and, at a minimum water shortage of 2.82 × 10⁸ m3, the benefits are almost same. The difference in values is caused by the priority of the water supply. The benefit coefficient of the two targets is different, resulting in different final values. Similarly, as shown in Figure 7b, the gap between the social benefit when the economic benefit target is optimal and social benefit when the social benefit target is optimal gradually narrows as the amount of River water is increased, and the final trends are the same. In conclusion, when the total water supply to Tianjin cannot meet all the water requirements, the water supply priority of different water users will have a large impact on the social and economic benefit targets, especially when the water shortage is large. Therefore, reasonable setting of water supply priorities and water supply guarantee rates for water users can effectively maintain the balanced development of social and economic benefits.
(4) Trend Analysis of Objective Function and Water Shortage
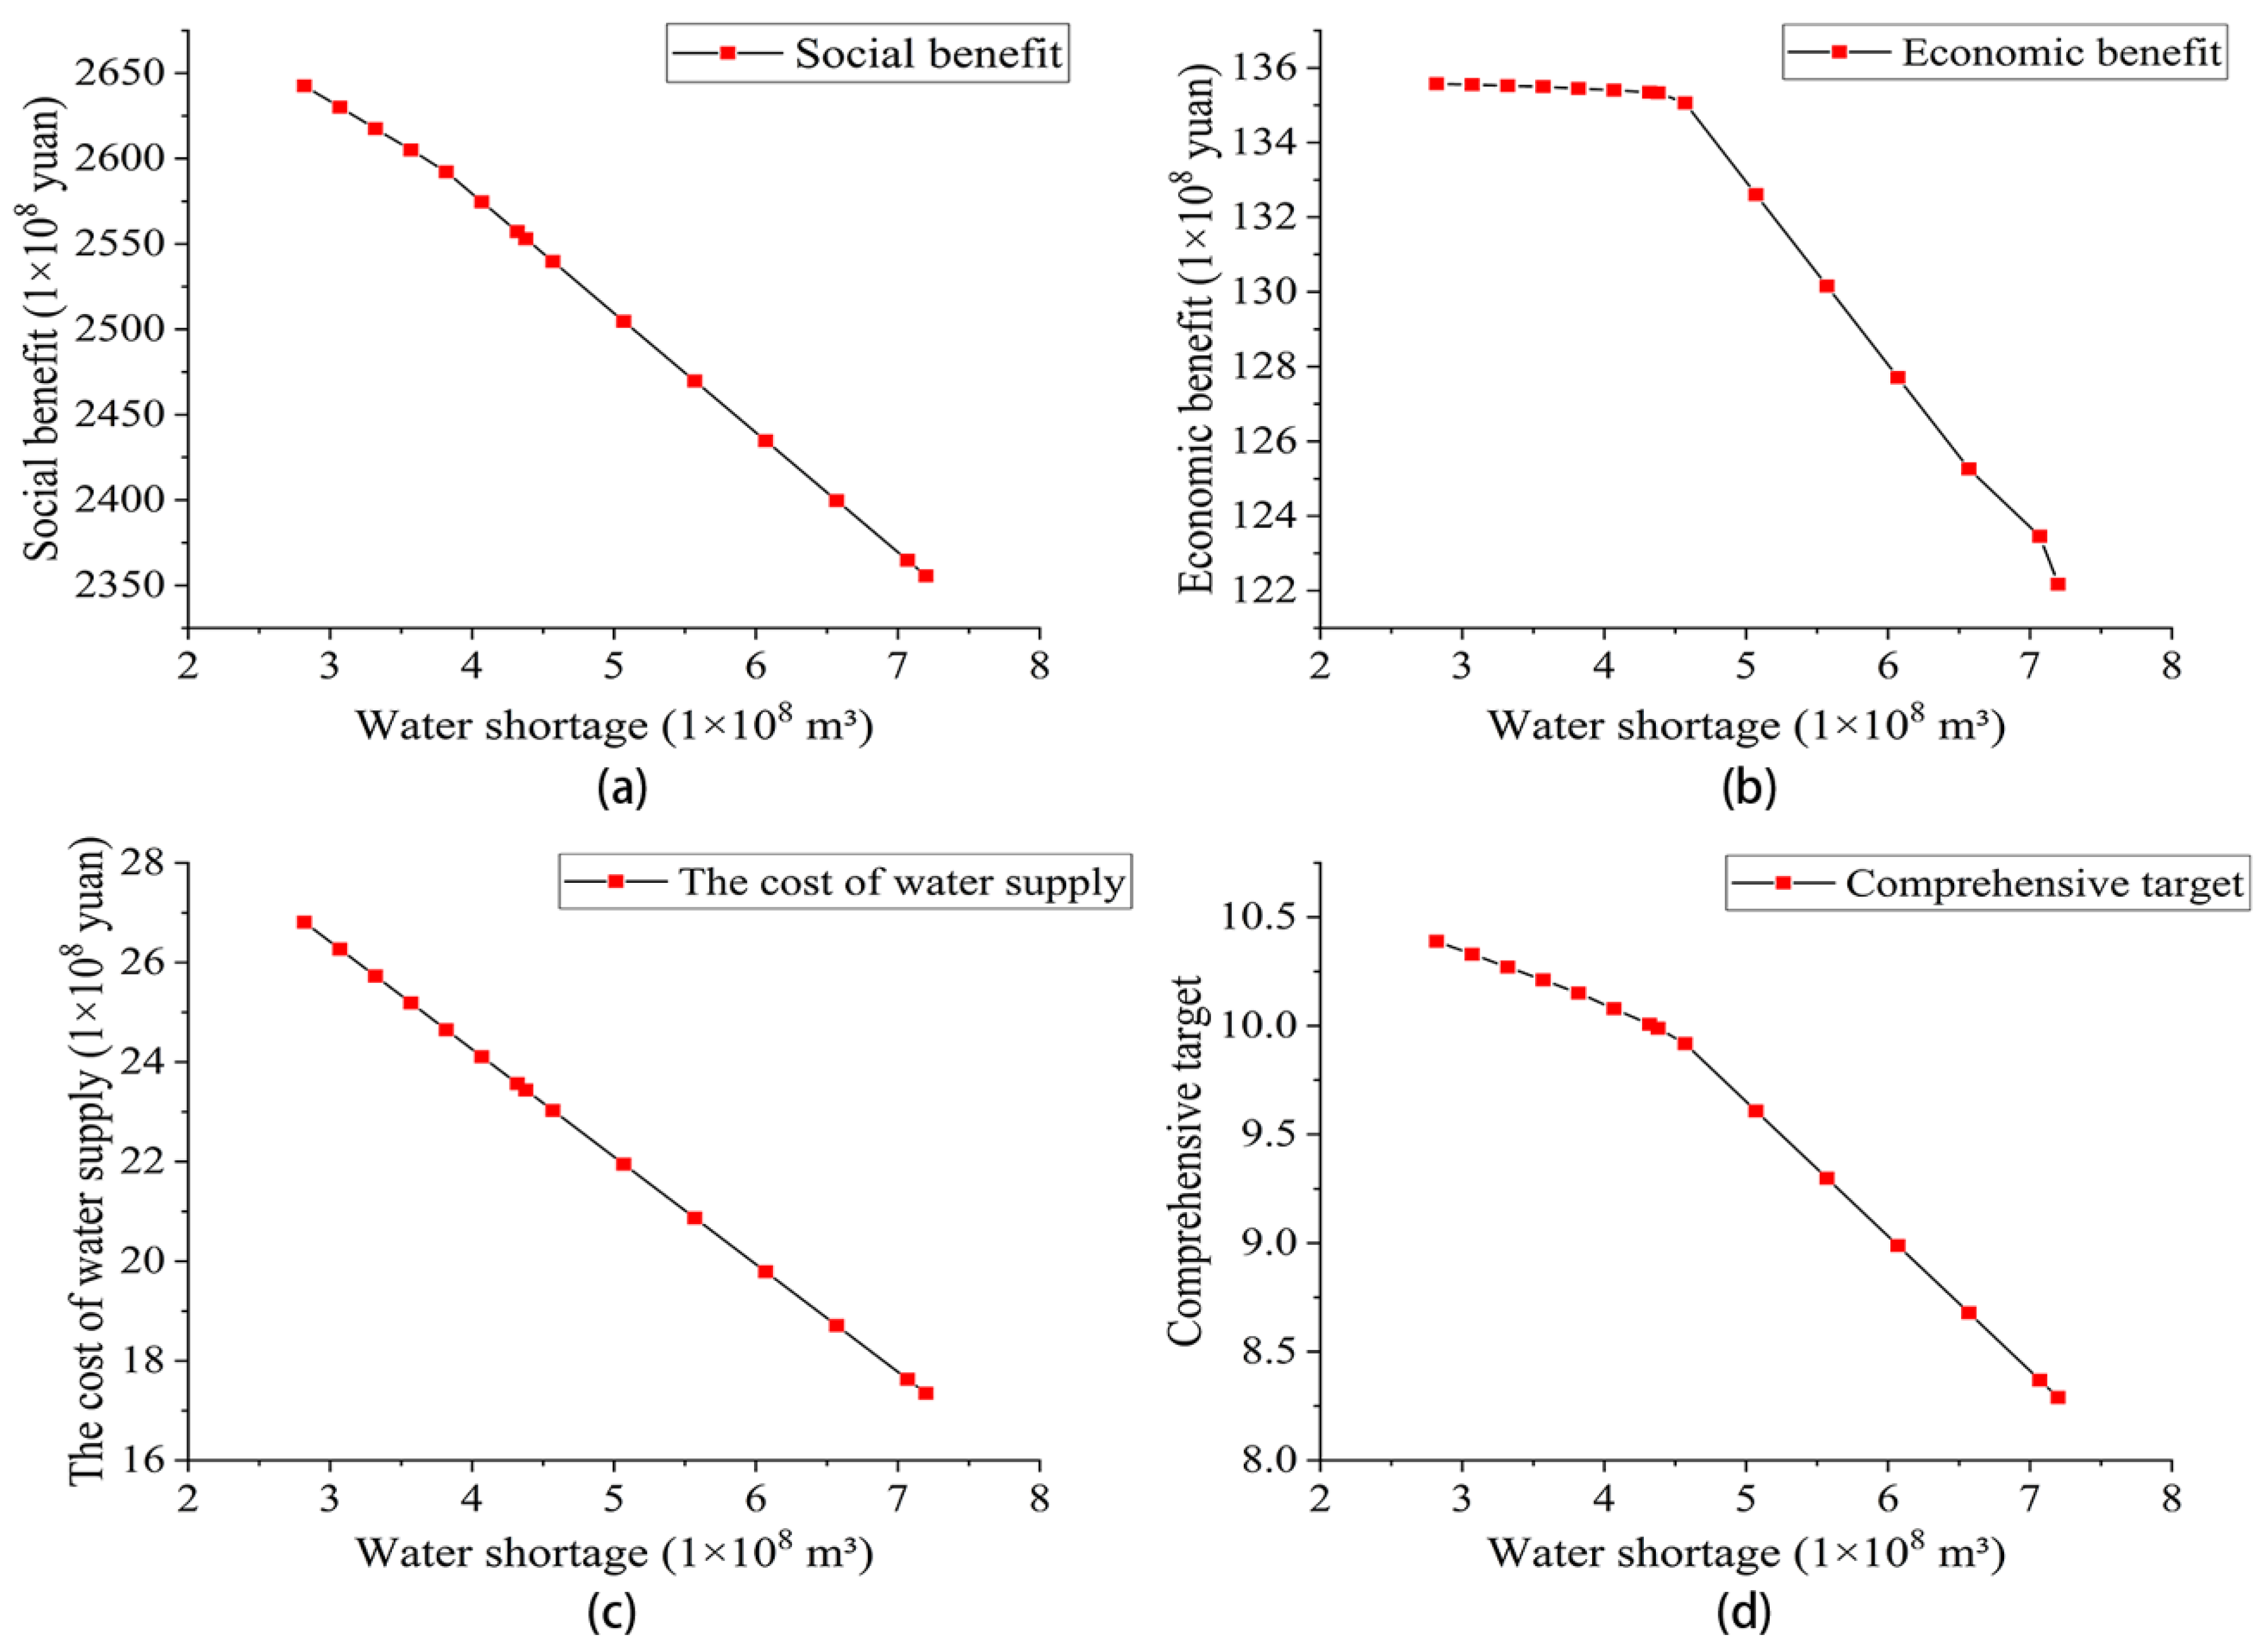
The schemes with 7.5 × 10⁸ m³ of diverted Luanhe River water, available at a 75% guarantee rate, were selected for analyzing the relationships between water shortage and social benefit, economic benefit, water supply cost, and comprehensive targets. As can be seen from Figure 8, with a decrease in water shortage, all four target values show an increasing trend. When the water shortage is in the range of 2.82–4.57 × 10⁸ m3, the change trend for economic benefits and comprehensive targets is relatively smooth, and the change range for social benefits and water supply cost targets is large. The comprehensive target was obtained by weighted calculations after the standard deviation treatment of the four objective functions. The gentle trend within the 2.82–4.57 × 10⁸ m³ water shortage range is mainly affected by the economic benefit target, and the overall trend increases as the water shortages decrease. It can be seen from Figure 8d that there is an inflection point when the water shortage is 4.57 × 10⁸ m3. The water shortage on the left side of the inflection point is small, and the change trend is gentle, but the cost of water supply is high. The water shortage on the right side of the inflection point is large, and the change trend is obvious. Therefore, it is recommended that a water supply scheme on the left of the inflection point is chosen. If the cost of water supply is sufficient, it is recommended that a water supply scheme with a minimum water shortage of 2.82 × 10⁸ m³ is chosen to meet the water demand of the region as far as possible. At this time, the diverted amounts of Luanhe River water and River water will be 7.5 × 10⁸ m³ and 9.25 × 10⁸ m³, respectively, and the cost of water supplied is 26.81 × 10⁸ yuan. If the cost of water needs to be controlled, it is recommended that a water supply scheme in the middle of the 2.82–4.57 × 10⁸ m³ water shortage range be chosen, such as the scheme with the water shortage at 3.32 × 10⁸ m³. At this time, the diverted amounts of Luanhe River water and River water will be 7.5 × 10⁸ m³ and 8.5 × 10⁸ m³, respectively, and the cost of the water supplied will be 25.19 × 10⁸ yuan.
4. Discussion
This study addressed a regional water resources system with high complexity. A refined multi-source, multi-user, and multi-target water resource allocation model was constructed. The concept of a water resource treatment and distribution station (water station) was proposed to integrate the functions of water plants and manage the water resources uniformly. The overall allocation of agricultural and urban water was realized, while taking into consideration the urban complex water pipe network. When compared with existing research, the characteristics and innovation of study are as follows:
(1) The proposed water station concept solves the problem of agricultural water supply by either (a) not being considered in the study of urban water supply system, or (b) being modeled separately so that regional water supply cannot be unified and integrated. The integrated generalization of a regional water distribution network is realized, and the modeling process is simplified.
(2) The model developed in this paper is capable of refined simulation: the simulation results can display the water supply source type and water supply quantity data of each user in each area in detail. Consequently, information, such as the direction of water supply, the remaining capacity of the water pipeline network, and the water shortage of users, can be obtained through statistics. In addition, the water supply proportion of users in each area can be analyzed, as well as the reasons for users’ water shortages, which can provide detailed guidance for water resource allocation in the research area.
However, the model developed in this study has some limitations:
(1) The amount of input data required by the model is large and requires extensive data support, such as user’s water demand for administrative divisions, water supply pipe network and water supply capacity, and water plant treatment capacity. Therefore, the model is a more appropriate choice when a research area has detailed data, but has difficulties in providing refined simulations when an area lacks sufficient data.
(2) Although the present research intended to develop a refined configuration model, many simplified treatments remained of various aspects of water resource allocation. Issues, such as the water loss caused by water passing through the water pipe network and the cost of the water supply transportation process were not taken into account in the model. Therefore, the impact of local engineering factors on water resource allocation cannot be identified. We intend to investigate these factors in further research.
5. Conclusions
(1) To investigate a complex regional water resources system, the concept of a water resource treatment and distribution station (water station) was proposed. A water distribution hierarchy for the regional WSSU was constructed to clarify the relationship between supply and demand. A refined multi-source, multi-user, multi-target water resource allocation model was constructed.
(2) Tianjin’s water resource allocation in the average year of 2020 was used as a case study. The results show that, even with adequate external water supplies, Tianjin will have water shortages. Some areas do not have a water infrastructure network connecting them to the River water transfer project. In addition, the capacity of the pipeline from the Luanhe River water to some areas is limited, which leads to water shortages caused by infrastructure limitations. Therefore, it is necessary to optimize the water supply network and increase the amount of external water in the water shortage areas.
(3) The cost of water supplies can be effectively controlled by setting a limit for River water. If the costs of water supply are sufficient, it is recommended that the water supply scheme with a minimum water shortage of 2.82 × 10⁸ m³ be chosen to meet the water demand of the region to the maximum extent. If the costs of water supplies need to be controlled, it is suggested that a plan to meet water shortages within the range of 2.82–4.57 × 10⁸ m³ be selected.
Author Contributions
Conceptualization, S.Z. and J.Y.; Methodology, S.Z., J.Y., Z.W. and Y.Y.; Software, J.Y.; Validation, S.Z., J.Y., Z.W. and Y.Y.; Formal Analysis, J.Y.; Investigation, S.Z. and Y.Y.; Resources, S.Z.; Data Curation, S.Z., Y.Y. and J.Y.; Writing—Original Draft Preparation, J.Y.; Writing—Review & Editing, S.Z. and J.Y.; Visualization, J.Y.; Supervision, S.Z., Y.Y. and Z.W.; Project Administration, S.Z.; Funding Acquisition, S.Z. and Y.Y.
Funding
This study was funded by [the 13th Five-Year National Key Research and Development Program of China] grant number [2016YFC0401406, 2016YFC0401407] and [the National Natural Science Foundation of China] grant number [51722901].
Acknowledgments
The authors thank the Haihe River Water Conservancy Commission for providing water plant and pipeline network data, the Tianjin Water Bureau for providing surface water, groundwater, Luanhe River water, and River water data. We thank Paul Seward from Liwen Bianji, Edanz Group China (www.liwenbianji.cn/ac), for editing the English text of a draft of this manuscript.
Conflicts of Interest
The authors declare no conflict of interest.
References
- Yu, J.W.; Da, H.Q. Influence of climate change and human activity on water resources in arid region of Northwest China: An overview. Adv. Clim. Chang. Res. 2017, 8, 268–278. [Google Scholar] [CrossRef]
- Durán-Sánchez, A.; Álvarez-García, J.; de la Cruz del Río-Rama, M. Sustainable Water Resources Management: A Bibliometric Overview. Water 2018, 10, 1191. [Google Scholar] [CrossRef]
- Higgins, A.; Archer, A. A stochastic non-linear programming model for a multi-period water resource allocation with multiple objectives. Water Resour. Manag. 2008, 22, 1445–1460. [Google Scholar] [CrossRef]
- Gu, H. Inter-basin water transfer and sustainable development. J. Beijing Norm. Univ. 2009, 45, 473–477. (In Chinese) [Google Scholar]
- Paton, F.L.; Dandy, G.C.; Maier, H.R. Integrated Framework for Assessing urban Water Supply Security of Systems with Non-Traditional Sources under Climate Change; Elsevier: Amsterdam, The Netherlands, 2014. [Google Scholar]
- Dolnicar, S.; Schäfer, A.I. Desalinated versus recycled water: Public perceptions and profiles of the accepters. J. Environ. Manag. 2009, 90, 888–900. [Google Scholar] [CrossRef] [PubMed]
- Mariño, M.A.; Loaicigab, H.A. Quadratic model for reservoir management: Application to the Central Valley Project. Water Resour. Res. 1985, 21, 631–641. [Google Scholar] [CrossRef]
- Bergmann, M. The Snowy Mountains Hydro-Electric Scheme: How Did It Manage without an EIA? Australian National University: Canberra, Australia, 1999. [Google Scholar]
- Becker, N.; Easter, K.W. Water diversions in the great lakes basin analyzed in a game theory framework. Water Resour. Res. 1995, 9, 221–242. [Google Scholar] [CrossRef]
- Berkoff, J. China: The South–North Water Transfer Project—Is it justified? Water Policy 2003, 5, 1–28. [Google Scholar] [CrossRef]
- Yan, H.; Shi, G.X. Modeling multisource multiuser water resources allocation. Water Resour. Manag. 2008, 22, 911–923. [Google Scholar]
- Huang, G.H.; Chang, N. The perspectives of environmental informatics and systems analysis. J. Environ. Inform. 2003, 1, 1–7. [Google Scholar] [CrossRef]
- Wong, H.S.; Sun, N.Z.; Yeh, W.W.G. Optimization of conjunctive use of surface water and groundwater with water quality constraints. In Proceeding of the Annual Water Resources Planning and Management Conference, Houston, TX, USA, 6–9 April 1997. [Google Scholar]
- Percia, C.; Oron, G.; Mehrez, A. Optimal Operation of Regional System with Diverse Water Quality Sources. J. Water Resour. Plan. Manag. 1998, 123, 105–115. [Google Scholar] [CrossRef]
- Zhong, P.; Wang, H.; Liu, J. Optimal dispatching model for Shenzhen water resources system. J. Hehai Univ. Nat. Sci. 2003, 31, 616–620. (In Chinese) [Google Scholar]
- Ma, W.F.; Zhao, X.H.; Wang, H.Y. Fuzzy optimal allocation of reclaimed and natural water resources for agricultural irrigation. J. Agro-Environ. Sci. 2004, 23, 770–773. [Google Scholar]
- Kilic, M.; Anac, S. Multi-objective planning model for large scale irrigation systems: Method and application. Water Resour. Manag. 2010, 24, 3173–3194. [Google Scholar] [CrossRef]
- Eskandar, H.; Sadollah, A.; Bahreininejad, A. Water cycle algorithm—A novel metaheuristic optimization method for solving constrained engineering optimization problems. Comput. Struct. 2012, 110–111, 151–166. [Google Scholar] [CrossRef]
- Roozbahani, R.; Abbasi, B.; Schreider, S. A multi-objective approach for transboundary river water allocation. Water Resour. Manag. 2014, 28, 5447–5463. [Google Scholar] [CrossRef]
- Zhang, Y.N.; Tian, F.Q.; Hu, Y.C. Joint operation model of multiple water sources in Beijing. J. Hydraul. Eng. 2014, 45, 844–849. (In Chinese) [Google Scholar]
- Yu, B.; Liang, G.H.; He, B. Modeling of joint operation for urban water-supply system with multi-water sources and its application. Adv. Water Sci. 2015, 26, 874–884. (In Chinese) [Google Scholar]
- Roozbahani, R.; Schreider, S.; Abbasi, B. Optimal water allocation through a multi-objective compromise between environmental, social, and economic preferences. Environ. Model. Softw. 2015, 64, 18–30. [Google Scholar] [CrossRef]
- Ostfeld, A.; Asce, M. Water distribution systems connectivity analysis. J. Water Resour. Plan. Manag. 2005, 131, 58–66. [Google Scholar] [CrossRef]
- Xu, J.P. Bilevel optimization of regional water resources allocation problem under fuzzy random environment. J. Water Resour. Plan. Manag. 2013. [Google Scholar] [CrossRef]
- Hu, Z.N. Integrating equality and stability to resolve water allocation issues with a multiobjective bilevel programming model. J. Water Resour. Plan. Manag. 2016. [Google Scholar] [CrossRef]
- Han, Q.; Tan, G.M.; Fu, X. Water Resource Optimal Allocation Based on Multi-Agent Game Theory of HanJiang River Basin. Water 2018, 10, 1184. [Google Scholar] [CrossRef]
- Chong, F.R. Multiobjective stochastic fractional goal programming model for water resources optimal allocation among industries. J. Water Resour. Plan. Manag. 2016. [Google Scholar] [CrossRef]
- Tianjin Municipal Bureau of Statistics. Tianjin’s Statistical Yearbook; Tianjin Municipal Bureau of Statistics: Tianjin, China, 2015. (In Chinese) [Google Scholar]
- Tianjin Development and Reform Commission. Tianjin’s South to North Water Transfer Project Planning; Tianjin Development and Reform Commission: Tianjin, China, 2005. (In Chinese) [Google Scholar]
- Loucks, D.P.; Gladwell, J.S. Sustainability Criteria for Water Resources System; Cambridge University Press: Cambridge, UK, 1999; Volume 154. [Google Scholar]
- Yuan, G.Y. Introduction to Sustainable Development; China Environmental Science Press: Beijing, China, 2000. (In Chinese) [Google Scholar]
- Qian, Y.; Liu, C.M. China’s sustainable development of water resources strategy report set. In The Fifth Volume: Sustainable Development and Utilization of Urban Water Resources in China; China Water Power Press: Beijing, China, 2002; Volume 17, pp. 112–118. (In Chinese) [Google Scholar]
- Ye, J.H. Analysis on Tianjin Urban Demand and Water Supply; Tianjin University: Tianjin, China, 2015. (In Chinese) [Google Scholar]
- Lavric, V.; Lancu, P.; Pleşu, V. Optimal water system topology through genetic algorithm under multiple contaminated-water sources constraint. Comput. Aided Chem. Eng. 2004, 18, 433–438. [Google Scholar]
- Wang, L.T. Detailed Water Allocation of Urban Complex Water Utilization System—Case Study in New District of Tianjin; China Institute of Water Resource and Hydropower Research (IWHR): Beijing, China, 2015. (In Chinese) [Google Scholar]
Figure 1.
WSSU system diagram.

Figure 2.
Administrative and water distribution map for Tianjin.

Figure 3.
Generalized water supply network. (Two straight lines represent the main water supply line of the South-to-North Water Transfer Project and the Luanhe River to Tianjin project in Tianjin. Eleven blocks represent the eleven administrative divisions, and nine “water stations” are connected to two major water supply routes through a network of water pipes. All available water sources are transferred to the corresponding administrative divisions through the “water station” after unified treatment, and distributed to the four users (domestic, industrial, agricultural, and ecological water demand) in need of water.

Figure 4.
Tianjin’s minimum water shortage in 2020 for different external water supplies.

Figure 5.
Distribution of water sources. (a)The distribution of seven water resources, (b)Water supply structure of water users, (c)The distribution of Luanhe River water, (d)The distribution of River water.
Figure 5.
Distribution of water sources. (a)The distribution of seven water resources, (b)Water supply structure of water users, (c)The distribution of Luanhe River water, (d)The distribution of River water.

Figure 6.
The cost of water supply.

Figure 7.
Benefit trends along the River water. (a) Economic benefit trends; (b) Social benefit trends.
Figure 7.
Benefit trends along the River water. (a) Economic benefit trends; (b) Social benefit trends.

Figure 8.
Relationship between water shortages and the four benefit targets. (a) Social benefits increase with the decrease of water shortage, (b) Economic benefits increase with the decrease of water shortage, (c) The cost increase with the decrease of water shortage, (d) The comprehensive target value increase with the decrease of water shortage.


Table 1.
Water supply users for different water sources.
| Water Users | Surface Water | Groundwater | Groundwater Source Field | Reclaimed Water | Desalinated Seawater | Luanhe River Water | River Water |
|---|---|---|---|---|---|---|---|
| Life | √ | √ | √ | √ | √ | ||
| Industry | √ | √ | √ | √ | √ | ||
| Agriculture | √ | √ | √ | ||||
| Ecology | √ | √ | √ | √ |
Note: The √ in Table 1 represents the available water sources for water users in Tianjin.
Table 2.
Water demand forecasting for Tianjin in 2020 (units = 108 m³).
| Water Users Administrative Divisions | Domestic Water Demand | Industrial Water Demand | Agricultural Water Demand | Ecological Water Demand | Total | |
|---|---|---|---|---|---|---|
| Zhongxincheng Area | Zhongxin Chengqu | 5.46 | 3.06 | 1.17 | 2.89 | 12.58 |
| Suburban Area | Jixian | 0.46 | 0.46 | 0.73 | 0.05 | 1.7 |
| Baodi | 0.47 | 0.18 | 2.63 | 0.1 | 3.38 | |
| Wuqing | 0.84 | 0.3 | 2.16 | 0.1 | 3.4 | |
| Ninghe | 0.36 | 0.37 | 1.16 | 0.46 | 2.35 | |
| Jinghai | 0.54 | 0.28 | 0.5 | 0.05 | 1.37 | |
| Binhaixinqu Area | Beibu | 0.63 | 0.3 | 0.12 | 0.23 | 1.28 |
| Xibu | 0.63 | 0.33 | 0.12 | 0.26 | 1.34 | |
| Nanbu | 0.87 | 1.81 | 0.12 | 0.24 | 3.04 | |
| Binhaibei | 1.55 | 1.52 | 0.12 | 0.37 | 3.56 | |
| Binhainan | 0.38 | 0.82 | 0.12 | 0.11 | 1.43 | |
| City | 12.19 | 9.43 | 8.95 | 4.86 | 35.43 | |
Table 3.
Water supply forecasts for Tianjin in 2020 (units = 108 m³).
| Water Sources Administrative Divisions | Surface Water | Groundwater | Groundwater Source Field | Reclaimed Water | Desalinated Seawater | Luanhe River Water | River Water | |
|---|---|---|---|---|---|---|---|---|
| Zhongxincheng Area | Zhongxin chengqu | 1.75 | 1.86 | |||||
| Suburban Area | Jixian | 2.24 | 0.16 | 0.45 | 0.16 | |||
| Baodi | 1.02 | 0.1 | 0.12 | |||||
| Wuqing | 1.02 | 0.13 | 0.07 | 0.21 | ||||
| Ninghe | 0.92 | 0.1 | 0.13 | |||||
| Jinghai | 0.9 | 0.11 | 0.15 | |||||
| Binhaixinqu Area | Beibu | 0.35 | 0.2 | 1.58 | ||||
| Xibu | 0.21 | |||||||
| Nanbu | 0.66 | 0.56 | 1.1 | |||||
| Binhaibei | 0.51 | 0.66 | ||||||
| Binhainan | 0.25 | 0.3 | ||||||
| City | 9.37 | 0.6 | 0.52 | 4.51 | 2.98 | 9.06 | 12.16 | |
| Total | 17.98 | 21.22 | ||||||
Table 4.
Social benefit coefficients.
| Category | Calculation Formula |
|---|---|
| Industrial benefit coefficient | = 70 yuan/m³ |
| Domestic benefit coefficient | = 104 yuan/m³ |
| Agricultural benefit coefficient | = 50 yuan/m³ |
| Ecological benefit coefficient | = 84 yuan/m³ |
Note: represents the water consumption of industrial output of 1 × 10⁴ yuan in value (1 × 10⁻⁴ m³/yuan).
Table 5.
Water distribution for areas with forecasted water shortages in 2020 (units = 108 m³).
| Administrative Division | Category | Luanhe River Water | Groundwater | Surface Water | Reclaimed Water | Groundwater Source Field | Desalinated Seawater | Total | Water Demand | Water Shortage |
|---|---|---|---|---|---|---|---|---|---|---|
| Baodi | Life | 0.37 | 0.1 | 0 | 0 | 0 | 0 | 0.47 | 0.47 | 0 |
| Industry | 0.16 | 0 | 0 | 0.02 | 0 | 0 | 0.18 | 0.18 | 0 | |
| Agriculture | 0.0175 | 0 | 1.02 | 0 | 0 | 0 | 1.0375 | 2.63 | 1.5925 | |
| Ecology | 0 | 0 | 0 | 0.1 | 0 | 0 | 0.1 | 0.1 | 0 | |
| Total | 0.5475 | 0.1 | 1.02 | 0.12 | 0 | 0 | 1.7875 | 3.38 | 1.5925 | |
| Wuqing | Life | 0.64 | 0.13 | 0 | 0 | 0.07 | 0 | 0.84 | 0.84 | 0 |
| Industry | 0.19 | 0 | 0 | 0.11 | 0 | 0 | 0.3 | 0.3 | 0 | |
| Agriculture | 0.0825 | 0 | 1.02 | 0 | 0 | 0 | 1.1025 | 2.16 | 1.0575 | |
| Ecology | 0 | 0 | 0 | 0.1 | 0 | 0 | 0.1 | 0.1 | 0 | |
| Total | 0.9125 | 0.13 | 1.02 | 0.21 | 0.07 | 0 | 2.3425 | 3.4 | 1.0575 | |
| Ninghe | Life | 0.26 | 0.1 | 0 | 0 | 0 | 0 | 0.36 | 0.36 | 0 |
| Industry | 0.37 | 0 | 0 | 0 | 0 | 0 | 0.37 | 0.37 | 0 | |
| Agriculture | 0.135 | 0 | 0.92 | 0 | 0 | 0 | 1.055 | 1.16 | 0.105 | |
| Ecology | 0.33 | 0 | 0 | 0.13 | 0 | 0 | 0.46 | 0.46 | 0 | |
| Total | 1.095 | 0.1 | 0.92 | 0.13 | 0 | 0 | 2.245 | 2.35 | 0.105 | |
| Beibu | Life | 0.365 | 0 | 0.265 | 0 | 0 | 0 | 0.63 | 0.63 | 0 |
| Industry | 0 | 0 | 0 | 0 | 0 | 0.3 | 0.3 | 0.3 | 0 | |
| Agriculture | 0 | 0 | 0.055 | 0 | 0 | 0 | 0.055 | 0.12 | 0.065 | |
| Ecology | 0 | 0 | 0.03 | 0.2 | 0 | 0 | 0.23 | 0.23 | 0 | |
| Total | 0.365 | 0 | 0.35 | 0.2 | 0 | 0.3 | 1.215 | 1.28 | 0.065 | |
| Total | 2.82 | |||||||||
Table 6.
Water resource use (units = 108 m³).
| Category | Amount of Use | Available Amount | Residual Amount |
|---|---|---|---|
| Luanhe River water | 7.5 | 7.5 | 0 |
| River water | 9.25 | 12 | 2.75 |
| Surface water | 8.288 | 9.37 | 1.082 |
| Groundwater | 0.6 | 0.6 | 0 |
| Reclaimed water | 4.51 | 4.51 | 0 |
| Groundwater source field | 0.07 | 0.52 | 0.45 |
| Desalinated seawater | 2.39 | 2.95 | 0.56 |
| Total | 32.608 | 37.45 | 4.842 |
© 2018 by the authors. Licensee MDPI, Basel, Switzerland. This article is an open access article distributed under the terms and conditions of the Creative Commons Attribution (CC BY) license (http://creativecommons.org/licenses/by/4.0/).
Share and Cite
MDPI and ACS Style
Zhang, S.; Yang, J.; Wan, Z.; Yi, Y. Multi-Water Source Joint Scheduling Model Using a Refined Water Supply Network: Case Study of Tianjin. Water 2018, 10, 1580. https://doi.org/10.3390/w10111580
AMA Style
Zhang S, Yang J, Wan Z, Yi Y. Multi-Water Source Joint Scheduling Model Using a Refined Water Supply Network: Case Study of Tianjin. Water. 2018; 10(11):1580. https://doi.org/10.3390/w10111580
Chicago/Turabian StyleZhang, Shanghong, Jiasheng Yang, Zhongyu Wan, and Yujun Yi. 2018. "Multi-Water Source Joint Scheduling Model Using a Refined Water Supply Network: Case Study of Tianjin" Water 10, no. 11: 1580. https://doi.org/10.3390/w10111580
Note that from the first issue of 2016, this journal uses article numbers instead of page numbers. See further details here.