Analysis and Optimization of Open Circulating Cooling Water System


1
Department of Thermal Engineering, School of Metallurgy, Northeastern University, Shenyang 110819, Liaoning, China
2
State Key Laboratory of Eco-Industry, Northeastern University, Shenyang 110819, Liaoning, China
3
School of Civil Engineering, University of Science and Technology Liaoning, Anshan 114051, Liaoning, China
*
Author to whom correspondence should be addressed.
Water 2018, 10(11), 1592; https://doi.org/10.3390/w10111592
Submission received: 22 September 2018
/
Revised: 19 October 2018
/
Accepted: 26 October 2018
/
Published: 7 November 2018
(This article belongs to the Section Water Use and Scarcity)
Abstract
:Open circulating cooling water system is widely used in process industry. For a system with a fixed structure, the water consumption and blowdown usually change with the varying parameters such as quality and temperature. With the purpose of water saving, it is very important to optimize the operation strategy of water systems. Considering the factors including evaporation, leakage, blowdown and heat transfer, the mass and energy conservation equations of water system are established. On this basis, the quality and temperature models of makeup and blowdown water are, respectively, developed. The water consumption and discharge profiles and the optimal operating strategy of the open recirculating cooling water system under different conditions are obtained. The concept of cycles of temperature is proposed to evaluate the temperature relationship of various parts of the open circulating cooling water system. A mathematical relationship is established to analyze the influence of the water temperature on the makeup water rate of the system under the condition of insufficient cooling capacity of the cooling tower. In addition, the co-influences of quality and temperature parameters on the system are analyzed.
1. Introduction
Open circulating cooling water system is widely used in process industry to cool off equipment and product, and to transfer waste heat into the environment [1,2]. Due to the evaporation and leakage of water, as well as the sewage of the system, this process brings about the consumption of water resources and the sewage drainage. As water resources decrease year by year and the serious environmental pollution increases [3], more and more attention has been paid to water conservation and emission reduction of the open cooling water system. At present, the research of industrial water saving mainly includes two aspects [4]: using water-saving equipment or water-alternative technology (such as air cooling instead of water cooling) and optimizing the structure and operating parameters of the water system as a whole, which is the focus of this paper.
The optimization of industrial water systems mainly includes two categories. (1) Water pinch analysis [5,6,7,8,9] belongs to the graphic method and has the advantages of clearly physical meaning and simple solution. However, in general, it is only valid for a single impurity system, and cannot give the corresponding optimal structure of water consumption systems. (2) Mathematical programming method: Apart from water pinch analysis, more and more research employs the mathematical programming method [10,11,12,13]. For the optimization of water systems by mathematical programming, it is necessary to establish an objective function and a set of appropriate equality and/or inequality constraint equations. Depending on task requirement, the objective function can generally be either the minimum fresh water consumption or investment, or a multi-objective function. This method can solve the relatively complicated water system optimization problem, but none or multiple global optimal solution could be obtained, which may lead to poor engineering feasibility [14]. In recent years, much attention has been paid to the optimization of open circulating cooling water systems, that is a particular kind of industrial water system. Castro et al. [15] developed the concept of multiple pinches for minimum water consumption of regeneration reuse system. Kim and Smith [16] presented a new method for the design of cooling water systems with lower water usage based on the interactions between the cooling tower performance and the cooling water users by combining mathematical model with pinch analysis method. Meanwhile, the water saving methods in debottlenecking situations are analyzed qualitatively. Kim et al. [17] discussed the design of a cooling water system under the condition of effluent temperature reduction by using pinch analysis method. Jiang et al. [18] developed a production scheduling optimization model to solve the excessive water consumption caused by product adjustment in the dyeing industry. The model can be used to reduce the production line cleaning time by optimizing the production schedules. Ponce-Ortega et al. [19] built a superstructure model for the whole cooling water system, and then translated it into a mixed-integer nonlinear programming problem. The objective is to find the minimized equipment investment and the total cost of filling water for the cooling water systems. The system structure parameter is determined by optimal computation. Sun et al. [20] presented a novel two-step sequential methodology for the optimization of cooling water system. The first step is to use a thermodynamic model to obtain the optimal cooler network. In the second step, the hydraulic model is established to obtain the optimal pump network. The proposed model can identify the optimal distribution of cooling water within the network and the optimal installation locations and pressure head of pumps required for CWS. Bu [21] analyzed the characteristics of water systems in steel industry, established mathematical models, and discussed the relationship between water recharge and the cycles of concentration.
In the above-mentioned studies, the role of the system operating parameters (water quality and temperature) is to restrict the import and export limit parameters of each water flow and cooling tower as constraints, with the aim of obtaining an optimal system architecture. Few studies discussed the effects of different water quality and temperature parameters on water consumption and drainage. In [16], the trend of water consumption with the change in water temperature has been qualitatively discussed. The mathematical relationship between cooling capacity and makeup water temperature has not been reported in previous studies; thus, the influences of makeup water temperature and the cooling capacity on the system makeup rate are not analyzed. Conversely, for a fixed structure of an open circulating cooling water system, the system parameters (such as quality, temperature, etc.) and the operation strategies are variable, which inevitably causes changes of indices such as water consumption and blowdown. It is of great significance for water saving and drainage reduction to analyze the aforementioned relationships.
The water quality and temperature will change in an open cooling water system and this change has a significant impact on the makeup, drainage and operating strategies of the system. In this work: (1) The mode and characteristics of the water that are used in the open cooling water system are analyzed, and then the physical and mathematical models are established to describe the relationship between water supply and drainage, water quality and water temperature. (2) The influence of water quality on water consumption and blowdown is obtained by solving the mathematical model. In addition, the influence of the actual factors such as water leakage and the installation of purification equipment are analyzed, and then the optimal operation strategies for the system under different leakage conditions are obtained. (3) The evaluation index used to evaluate the cooling capacity of the cooling tower and the water temperature of the system is established. The influence of water temperature parameters on water supply under the condition of insufficient cooling capacity of the cooling tower is proposed. Although the water, material and energy balance models have often been applied to cooling tower systems, in this paper, the water evaporation, leakage, blowdown and heat transfer are integrated into the traditional mass and energy conservation models, which is more consistent with the practice. Another novelty of this paper is the proposal of the concept of cycles of temperature. It is proposed to evaluate the temperature relationship of various parts of the open circulating cooling water system. The novel mathematical model is established between the makeup water rate and the cycles of temperature. In addition, the co-effect of quality and temperature parameters on the system is analyzed, which is different from previous studies considering only one parameter as the constraint.
2. Methods
In this part, the physical model of the open cooling water system is firstly established. Based on the principle of energy conservation and mass conservation, the mathematical model is established to describe the relationships between water supply and drainage, water quality and water temperature.
2.1. Physical Model
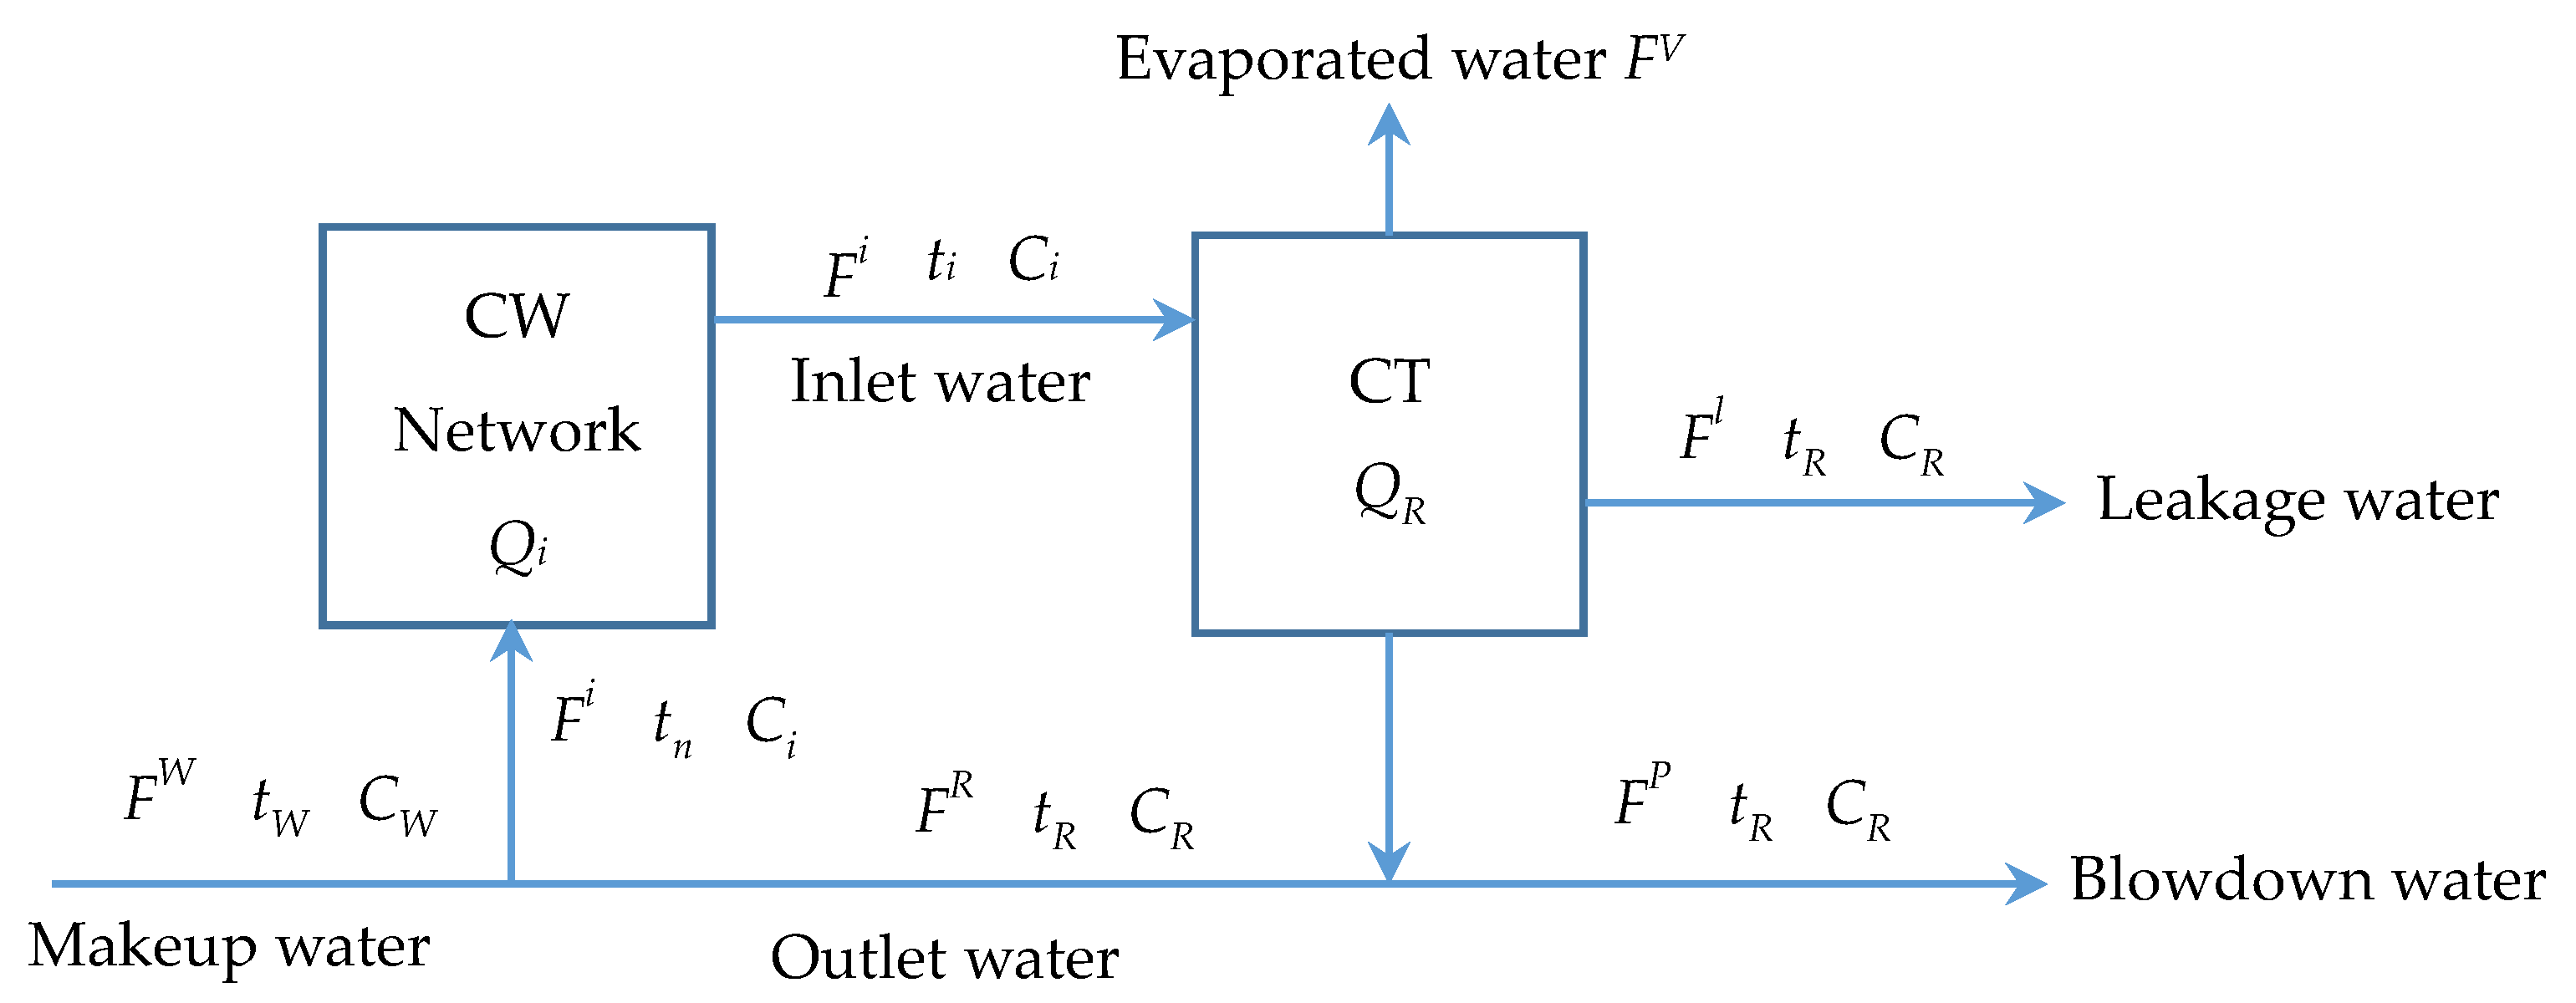
Figure 1 shows a typical open circulating cooling water system. The waste heat that exists in the cooling network (CW) needs to be taken away by a cooling water. Cooling water enters the cooling tower (CT) to release heat to the environment after leaving the cooling network. Water evaporation and leakage may happen during this process. After cooling, the water returns to the cooling network for reuse. Due to evaporation, impurities (such as salt) in the water are concentrated. Excessive concentration of cooling water would result in the damage of heat transfer equipment. Therefore, makeup water is usually used to partly replace the circulating water in the system, and to keep the impurity concentration in moderation. To maintain water balance, the system makeup water should include all the water losses caused by evaporation, leakage and blowdown. The water quantity, water temperature and water quality of the system are represented by different symbols, as shown in Figure 1.
The open cooling water model is based on the following assumptions:
The system is in a stable state.
The heat radiation is ignored.
The specific heat of water is supposed independent of impurities and temperature.
Drift from the cooling tower is negligible.
All dissolved constituents of interest are conservative.
The heat transfer of other parts except the cooling network and the cooling tower is ignored.
All water leakage loss of the system is generated at the outlet of the cooling tower.
With regard to the assumption of the open circulating cooling water system, this paper refers to the related practices in the literature [16,17,19,20,22]. A significant difference is that, instead of being ignored, the water leakage loss of the system is analyzed as an important factor to be closer to reality.
2.2. Mathematical Models
2.2.1. Water Quantity, Impurity and Energy Balance Models
The water quantity, impurity mass and heat conservation equation are established based on the heat and impurity exchange characteristics of the system. According to Kim et al. [17], the relationship between the total heat dissipation of the cooling tower and the latent heat of water evaporation can be expressed as:
where is the ratio of evaporation heat transfer and total heat transfer with the value of 0.75–1.0, and is the latent heat of vaporization of water.
For the cooling network,
Water balance:
Impurity mass balance:
Heat balance:
where c is the constant pressure specific heat of water.
For the cooling tower,
Water balance:
Impurity mass balance:
Heat balance:
The control equations of the system can be obtained by the following:
Water balance:
Impurity mass balance:
Heat balance:
where , , and are defined as the makeup rate, leakage rate, blowdown rate and evaporation rate, respectively, and thus , , and .
According to Equations (1) and (8),
where and are the inlet and outlet water temperatures of the cooling tower, respectively.
Then, Equations (9)–(11) can be rewritten as:
Water balance:
Impurity mass balance:
Heat balance:
2.2.2. System Makeup and Drainage Rate vs. Water Quality and Temperature Models
Firstly, the mathematical relationship between water makeup rate and water quality parameters is established. There are many kinds of water quality parameters in the water system. According to Rahmani [23], the key factor in the design and operation of open circulating cooling water system is the cycles of concentration. The cycles of concentration () is defined as the ratio of the concentration of a soluble component in the blowdown stream to that in the makeup stream. In this paper, the cycles of concentration is used as a representative indicator of water quality. Hereafter, the reference to water quality means the cycles of concentration.
According to Equations (13) and (14),
According to Bu [21], for the open cooling water system, it is more appropriate to control the cycles of concentration within the range of 3–5. Low cycles of concentration can result in excessive makeup rate; on the contrary, it can lead to a large increase in the risk of equipment corrosion and scaling. Indeed, the system’s cycles of concentration is affected by many factors, especially the quality of makeup water. The scope described in this paper refers to the recommended range of general industrial open cooling water systems (the quality of makeup water meets the industrial water standards).
Then, models of water makeup rate vs. cycles of concentration can be written as:
The blowdown rate and the leakage rate of the cooling water system are related to the water consumption of the system itself, and also to the blowdown of the system to the environment. By Equations (12) and (13), the relationship between leakage rate, blowdown rate and cycles of concentration is obtained as below:
In practice, some cooling water systems target “zero emissions” to achieve water saving and emission reduction. In this work, “zero emissions” refers to a system that does not actively drain outside, i.e., . However, for many “zero blowdown” systems, the cycles of concentration are not in a reasonable range; that is, the water-saving effect is not obvious. Under the premise of , according to Equation (15), it is easy to get the relationship between the cycles of concentration of the system and the leakage rate and evaporation rate:
In practical operation, the purification device can be set up to purify a part of circulating water and improve the water quality to reduce the system makeup rate. At this time, the purification device is generally installed on the outlet line of the cooling tower. It is assumed that the impurity removal rate of the filter is . Then, the system’s impurity mass balance equation is:
By combining Equation (17), Equation (20) becomes:
As mentioned above, , thus the operation strategy under different impurity removal rates can be analyzed. Combining Equations (15) and (21), it is easy to get:
The cooling tower is assumed to be able to completely eliminate the equipment cooling load, and therefore the outlet temperature of the cooling tower is equal to that of . At this point, there is no requirement for the temperature of the makeup water. In practice, circulating water may not be completely cooled by the cooling tower for some reason, such as cooling tower fouling or excessive outdoor air temperature, resulting in . When this happens, the inlet water temperature of cooling network will continue to rise. Theoretically, to increase the tower efficiency is more realistic. However, it should be noted that in some industrial applications the cooling tower cannot cool the circulating water of the system for some reasons, e.g., heat exchanging effect is deteriorated, or outdoor air temperature is too high. Rather than improve the cooling effect of the cooling tower, instead, users employ fresh water to replace part of the circulating water directly to reduce the temperature of the circulating water. At this time, it is necessary to use a certain proportion of new water with a lower temperature to replace the circulating water, to keep the inlet water temperature of cooling network at the required level. Because of the consumption of new water, it is necessary to establish the relationship between the makeup rate and the temperature of makeup water and the circulating water.
Combining Equations (12) and (14), it is easy to get:
To describe the cooling capacity of the cooling tower, the cooling index is defined in this work as . If = 1, the cooling tower can completely take away the heat load of the equipment, i.e., . On the contrary, if < 1, the tower cooling capacity is insufficient, i.e., . To evaluate the influence of water temperature on the heat balance of the system, according to the definition of cycles of concentration, this paper puts forward the concept “cycles of temperature”. The value is the ratio of the circulating water temperature to the makeup water temperature and is written as:
where is the cycles of temperature of the cooling tower outlet, and is the cycles of temperature of the cooling network inlet. Combining Equations (23) and (24), the relationship of makeup rate and temperature can be written as:
This model is used to evaluate the influence of water temperature on the makeup rate under the condition of insufficient cooling capacity.
3. Model Verification
To verify the accuracy of the proposed model, experimental data were contrasted with the simulation results from the model. The experimental results were from the field test of four open cooling water systems. The data from the test were also used for the input parameters of the model calculation to ensure the effectiveness of the contrast. Based on the correlation between these models, only the two following models are validated.
3.1. Verification of the Makeup Rate and the Cycles of Concentration Model
Four open circulating cooling water systems were tested. The experimental data included , and . and are the measured and calculated values of makeup rate, respectively. Based on the experimental data, Equation (17) was used to calculate the theoretical makeup rate. Table 1 shows the comparison between experimental and calculated results. The results show that the error between the calculated and experimental results is less than 2%.
3.2. Verification of the Makeup Rate and the Temperature Model
Four open circulating cooling water systems were tested. was higher than . The experimental data included , , and . Based on the experimental data, and were calculated, and Equation (25) was used to calculate the theoretical makeup rate. Table 2 shows the makeup rate comparison between experimental and calculated results. The results show that the error between the calculated and the experimental results is less than 2%.
4. Results and Discussion
Applying the proposed models, this section analyzes the effect of system water quality and water temperature parameters on water consumption and blowdown indicators. It is obvious that the evaporation rate of the CT is a key parameter for the established models. According to Zubair et al. [24], the evaporation rate is mainly affected by outdoor air parameters (dry bulb temperature and wet bulb temperature), inlet and outlet temperatures of cooling water, and the air-to-water ratio. In [25], 22 sets of measured evaporation rates of cooling towers are analyzed, and the values varied from 0.004 to 0.024. In the following discussions, evaporation rates are chosen from this range.
4.1. Relationships between the Makeup Rate and the Cycles of Concentration
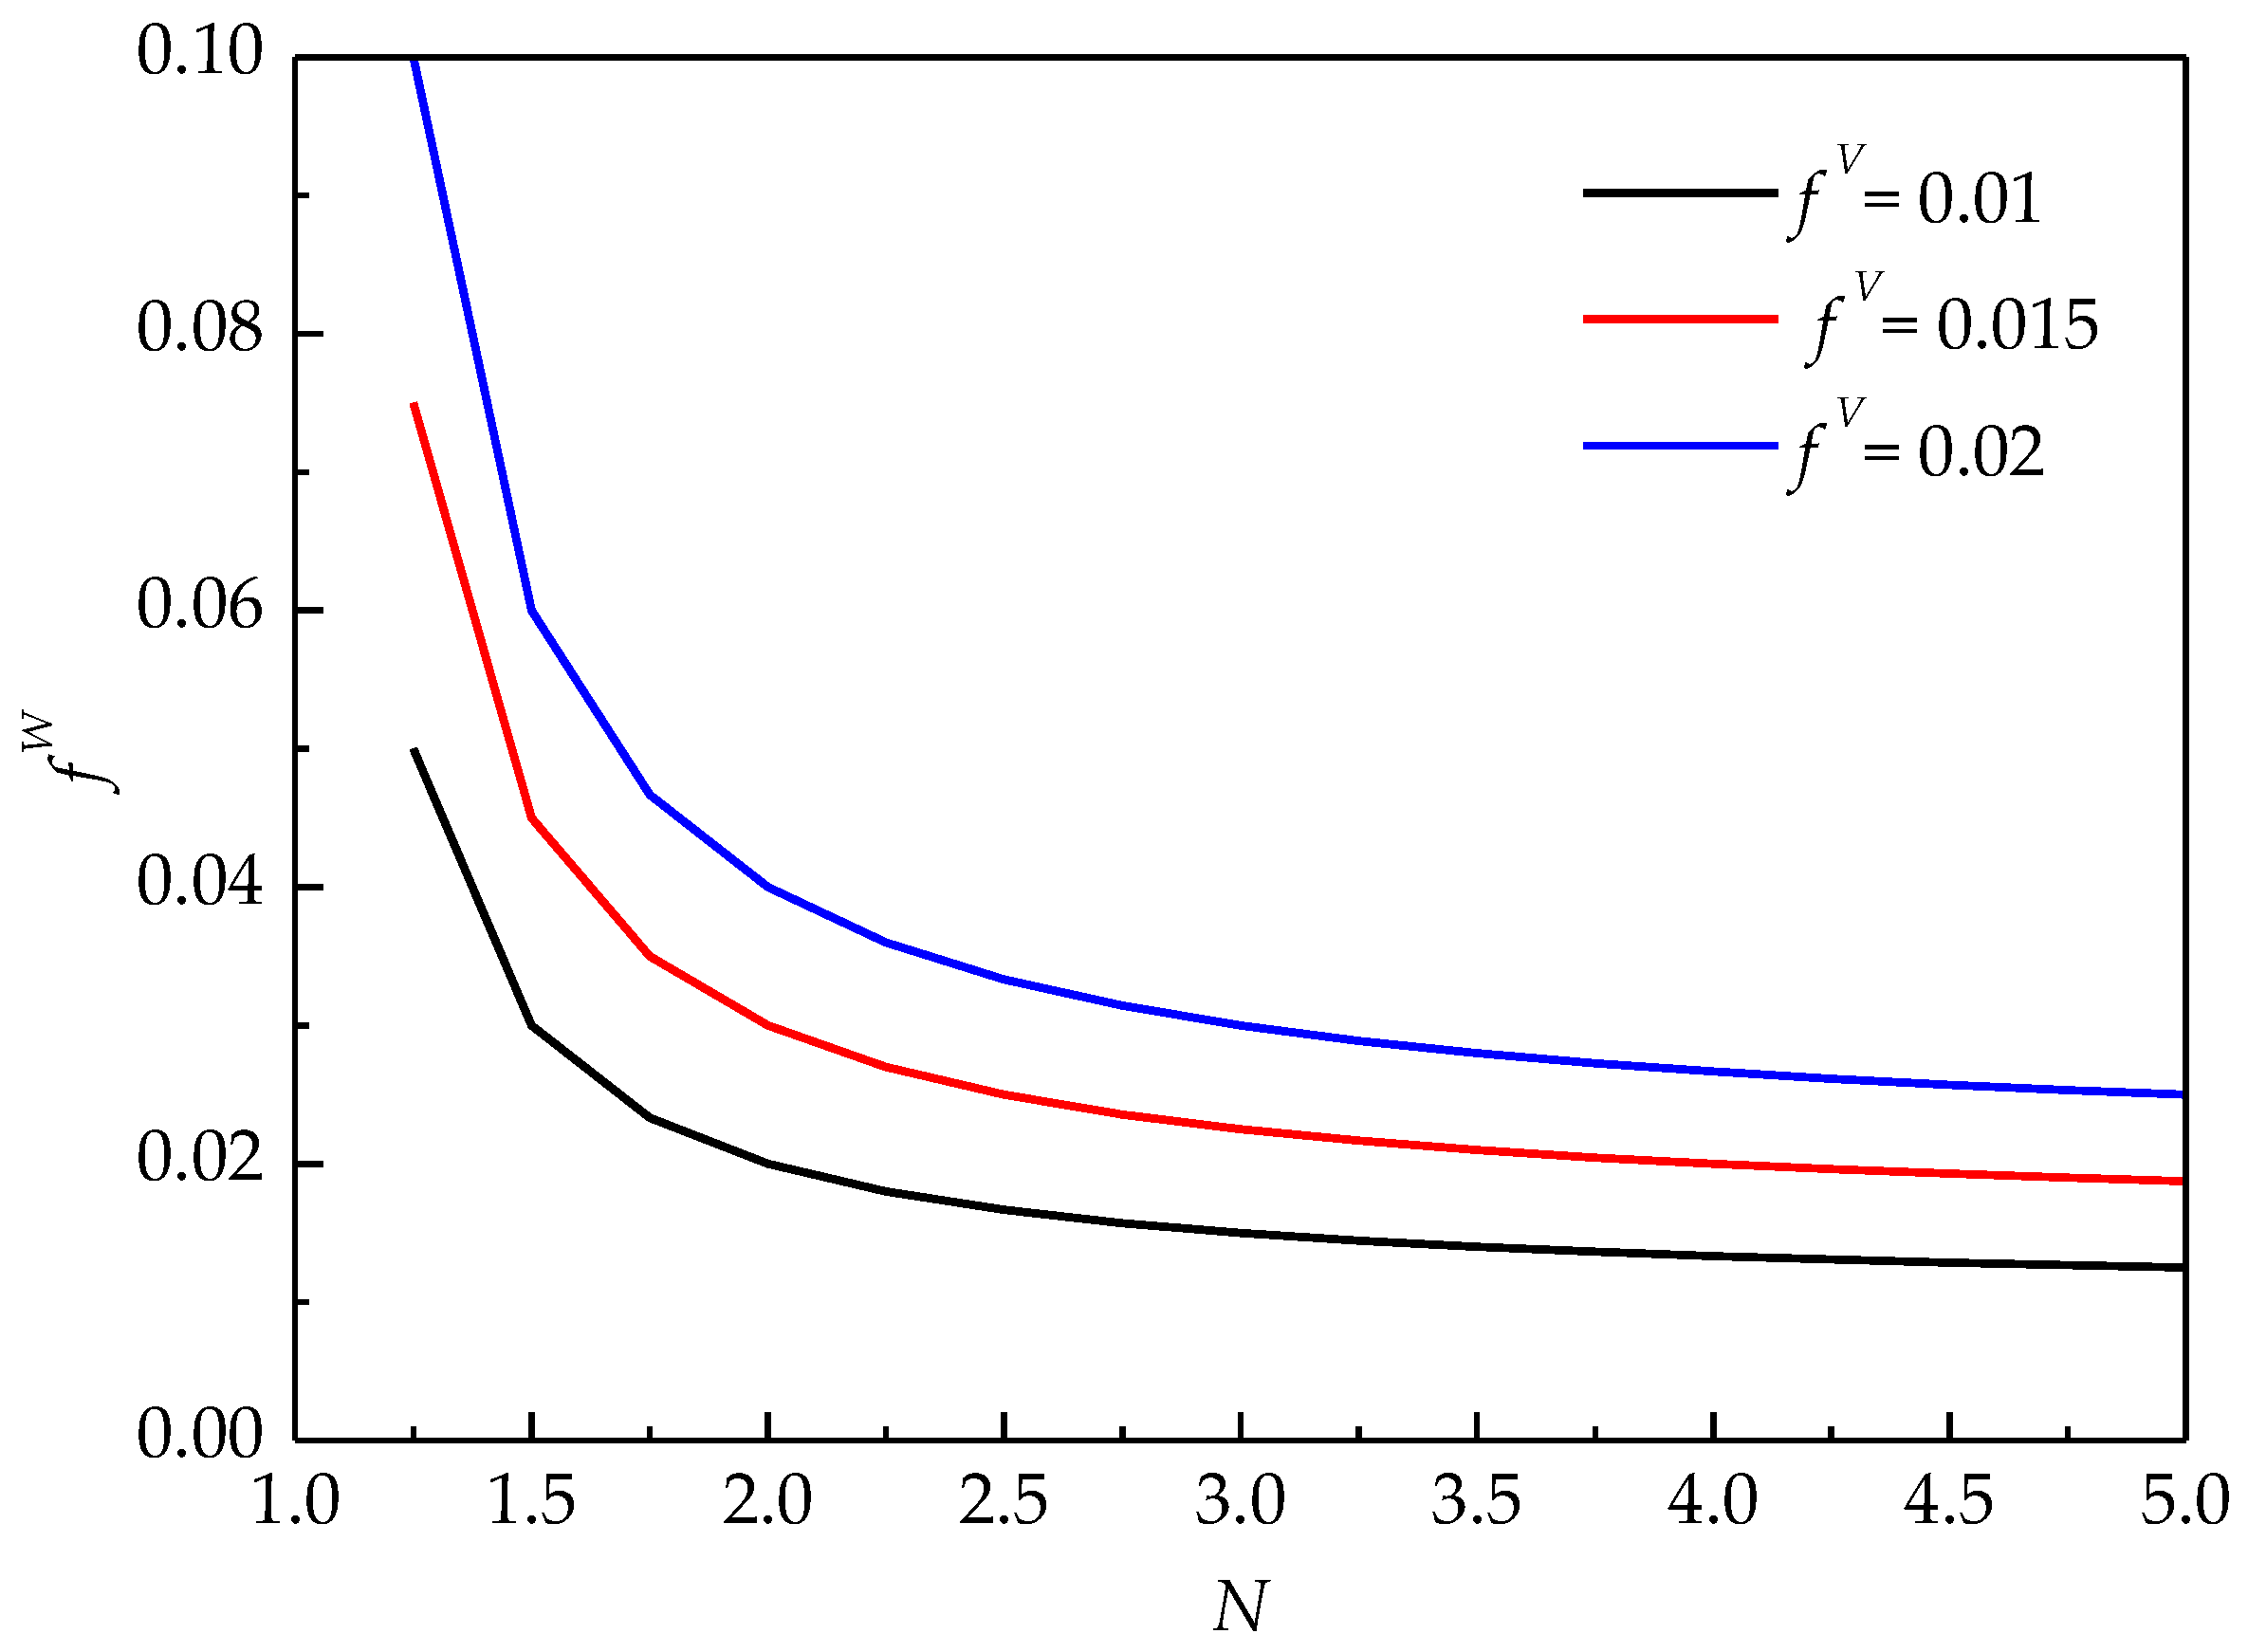
According to Equation (17), the relationship between the makeup rate and the cycles of concentration can be analyzed. Figure 2 shows this relationship when the evaporation rate takes different values.
According to Figure 2, lower cycles of concentration lead to higher makeup rates. This trend becomes more apparent when the cycles of concentration is less than 2.0. It can be seen that increasing the cycles of concentration is one of the important methods to reduce water consumption. In addition, the makeup rate increases with the increasing of the evaporation rate. In other words, if the cooling load is constant, the freshwater consumption will increase with the increasing ratio of evaporation heat transfer. It can be seen that if the cooling tower is combined with other equipment to cool the cooling water to reduce the evaporation of water, the makeup rate can be reduced. For example, in [16], a low temperature seawater heat exchanger is set at the outlet of the cooling tower to reduce evaporation.
4.2. Blowdown Rate and Leakage Control of the System
The water loss of the system includes evaporation, sewage blowdown and leakage. The influence of water leakage on makeup rate and blowdown rate is often overlooked. However, the effect of leakage rate on the system is very important. According to Equation (18), the blowdown rate of the system is analyzed when the leakage rate is fixed. Figure 3 shows the relationship between the blowdown rate and the cycles of concentration at the leakage rate of 0.003.
As shown in Figure 3, if the leakage rate of the system remains the same, with the increase of the cycles of concentration, the blowdown rate gradually declines until stopped. On the contrary, with the decrease of cycles of concentration, the blowdown rate of the system increases rapidly. When the value (cycles of concentration) is less than 2.0, this trend becomes more evident.
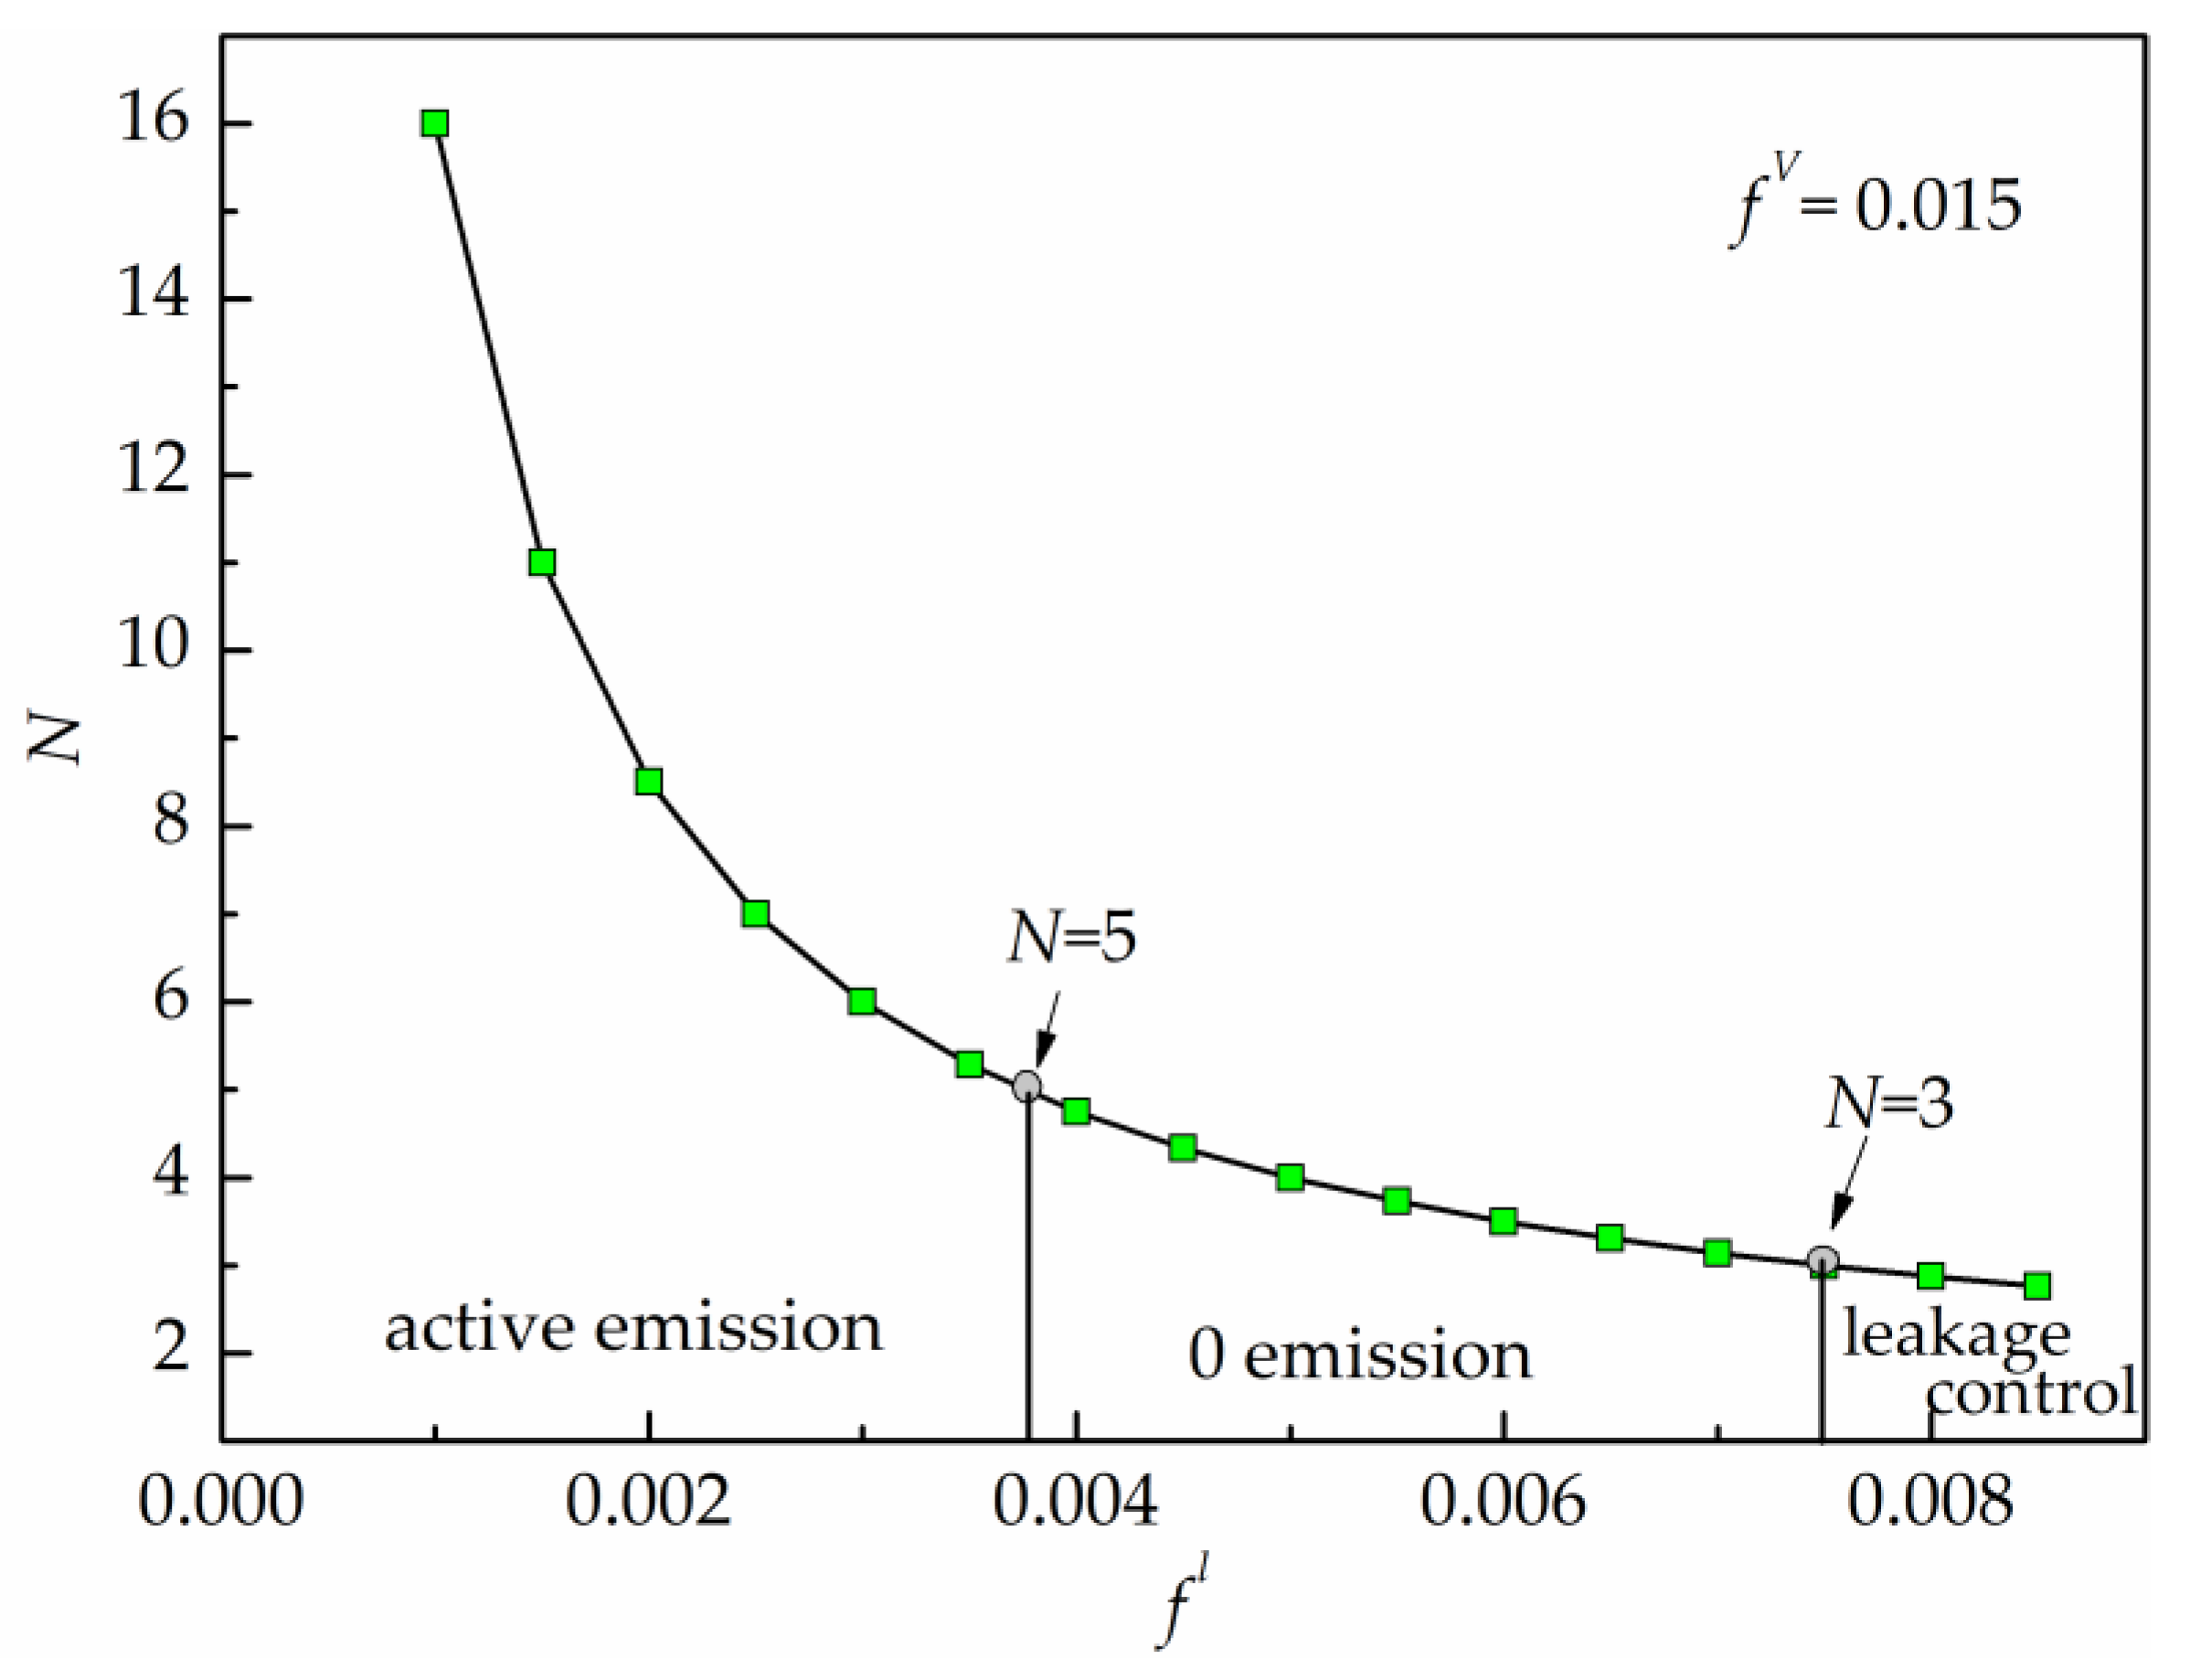
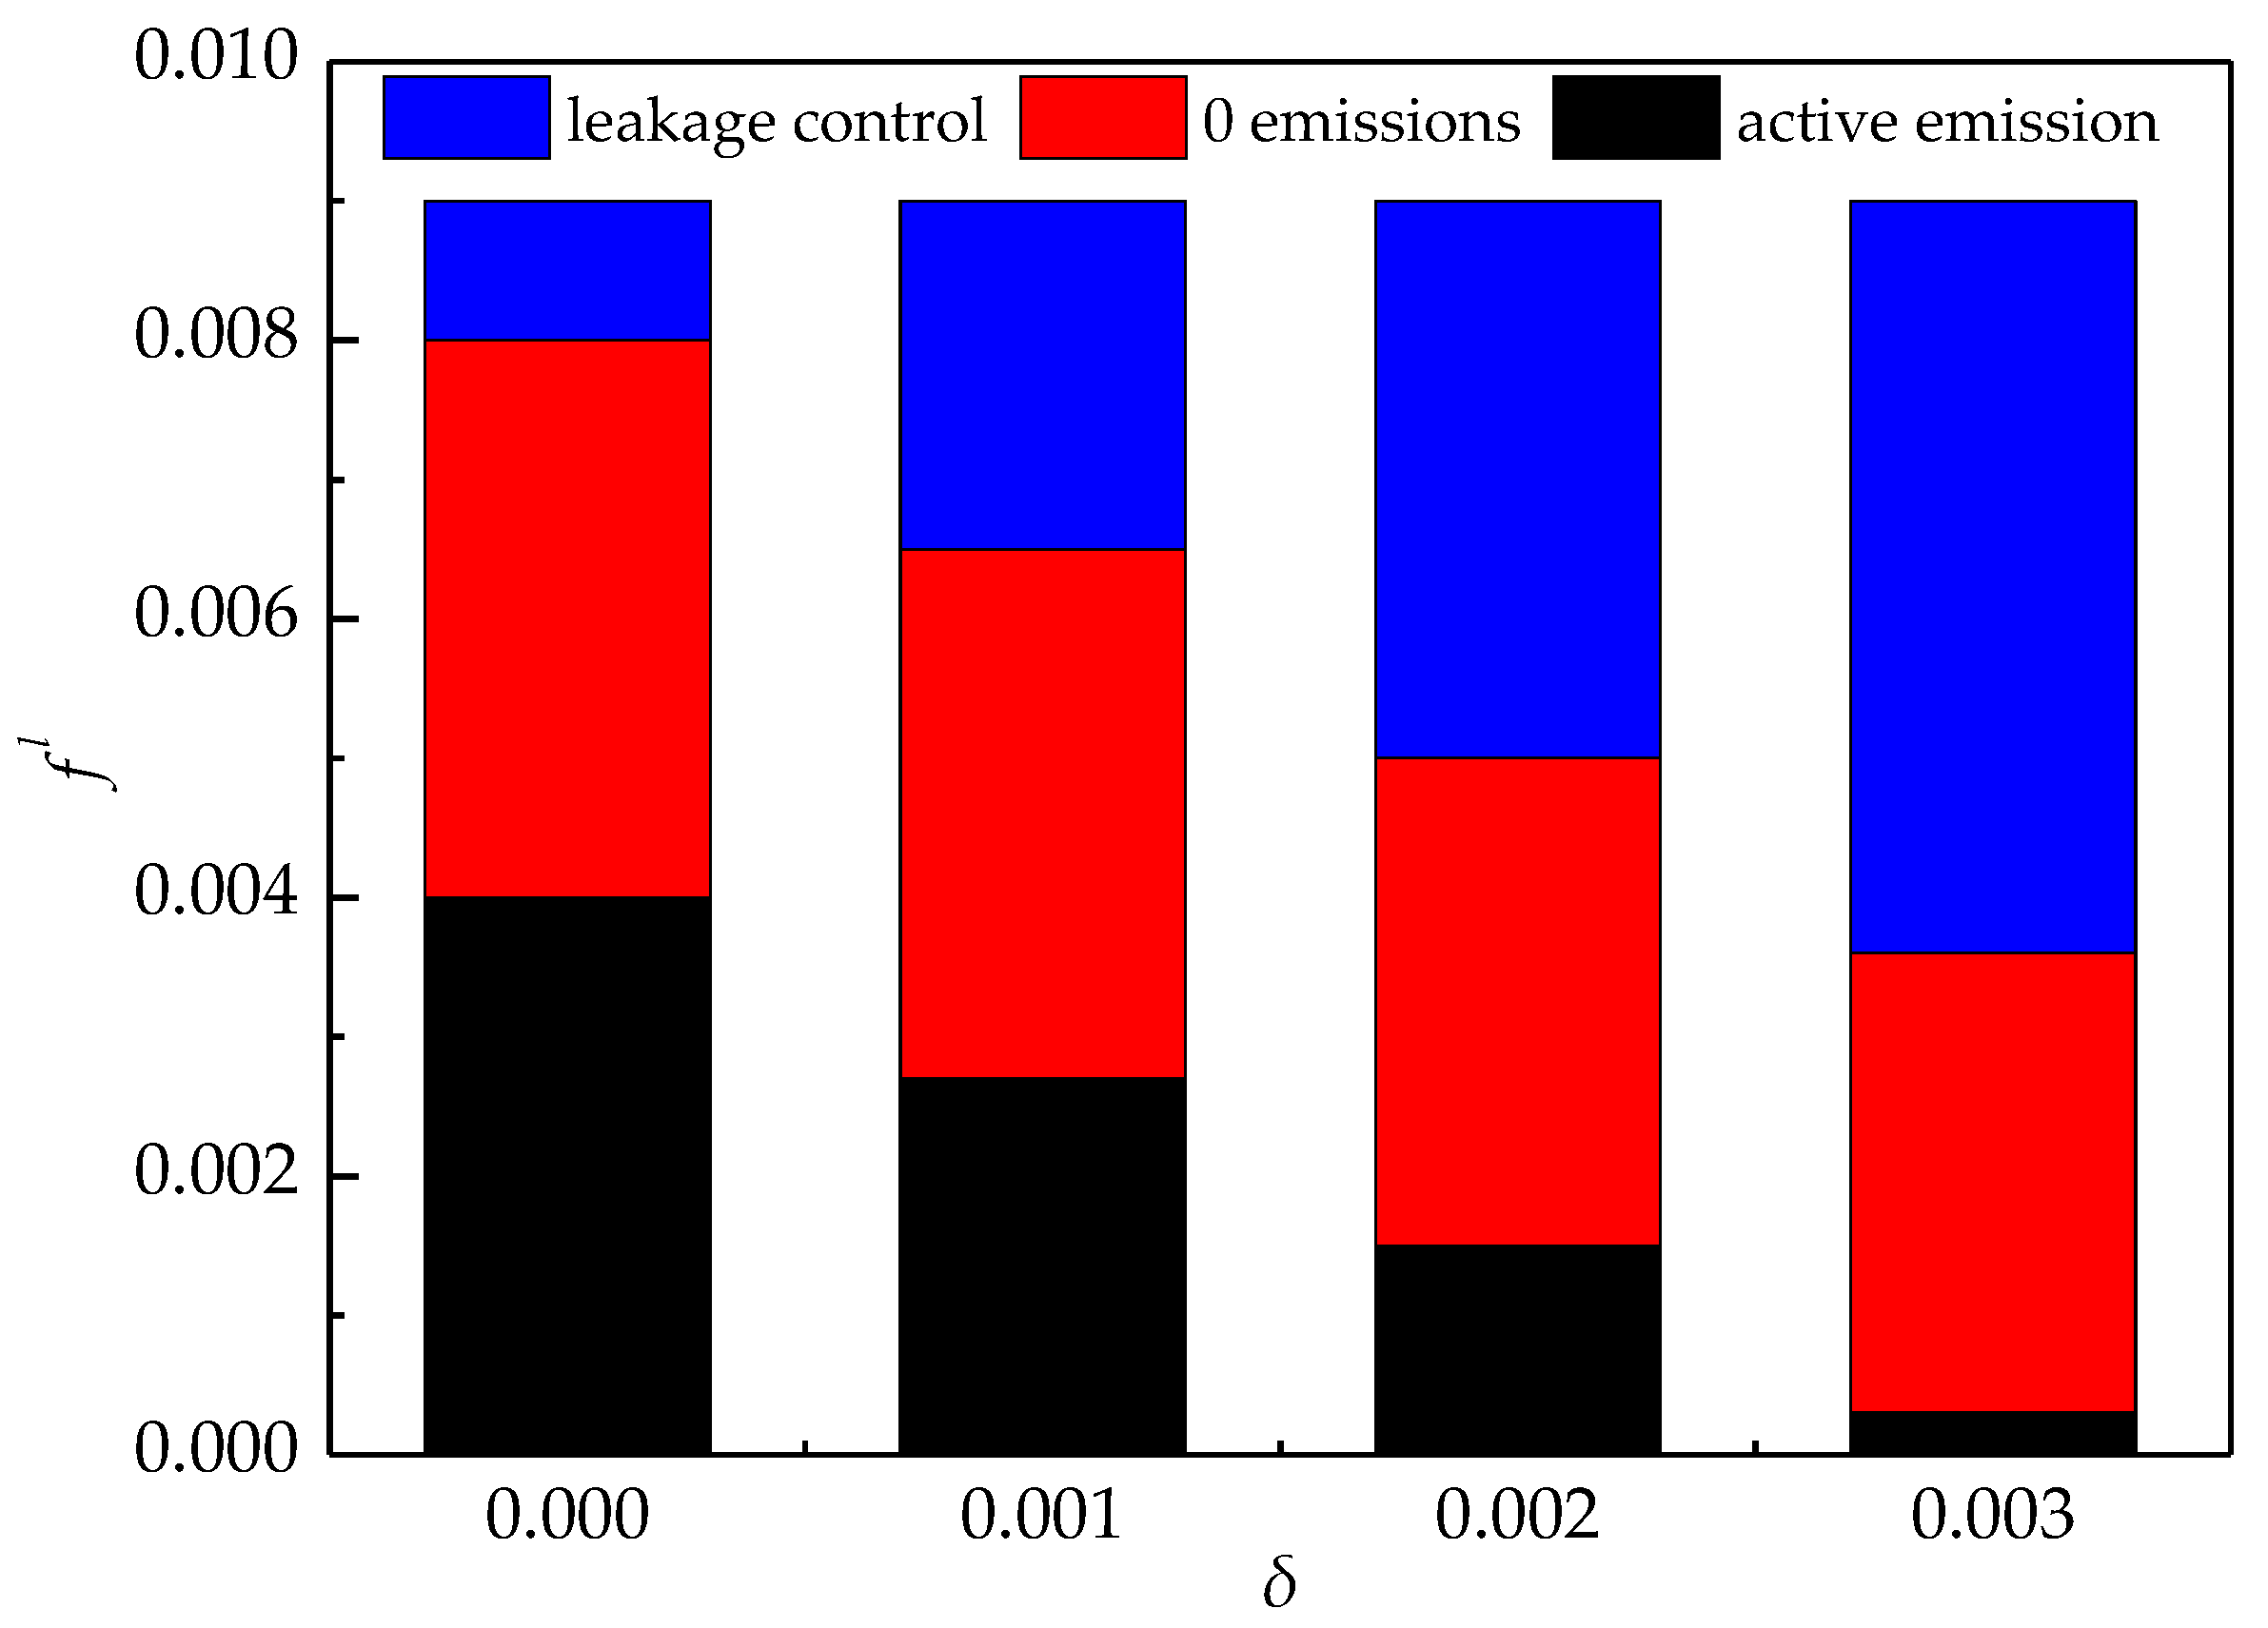
A key factor in the design and operation of open circulating cooling water system is the cycles of concentration. As mentioned previously, for the open cooling water system, it is more appropriate to control the cycles of concentration within the range of 3–5. According to Equation (19), there is a certain relationship between leakage and cycles of concentration, which often determines the optimal operating strategy of the system. Figure 4 is the optimal operation strategy under different leakage conditions when the evaporation rate is 0.015.
As shown in Figure 4, the cycles of concentration decrease with the increase of leakage rate under the strategy that the system maintains “zero emissions”. As mentioned earlier, the cycles of concentration of the system should be controlled within the range of 3–5 to save freshwater as well as ensure the safety of heat exchange equipment. The curve was divided into three parts, left, middle, and right, by the points of N = 3 and N = 5 on the curve. In the left area, because of the low leakage rate, if the system maintains “zero emissions”, the cycles of concentration will be too high, and then cause adverse effects on the heat exchanger. Thus, this region belongs to “active emission area”. In this region, the system must adopt the strategy of “active emission” instead of “zero emissions” to stop the cycles of concentration from being too high. The intermediate region is truly “zero emissions”. When the system is in the region, the cycles of concentration can still be controlled within a reasonable range even without active blowdown. The leakage rate on the right side is too large, which leads to a low cycles of concentration, even if the system achieves a “zero emissions”. Therefore, in the left area, measures should be taken to control the leakage of the system, and this area is named as the “leakage control area”. To sum up, the leakage of an open circulating cooling water system needs to be evaluated, and then the optimal operation strategy can be obtained according to the leakage rate.
4.3. The Impact of Water Purification Equipment
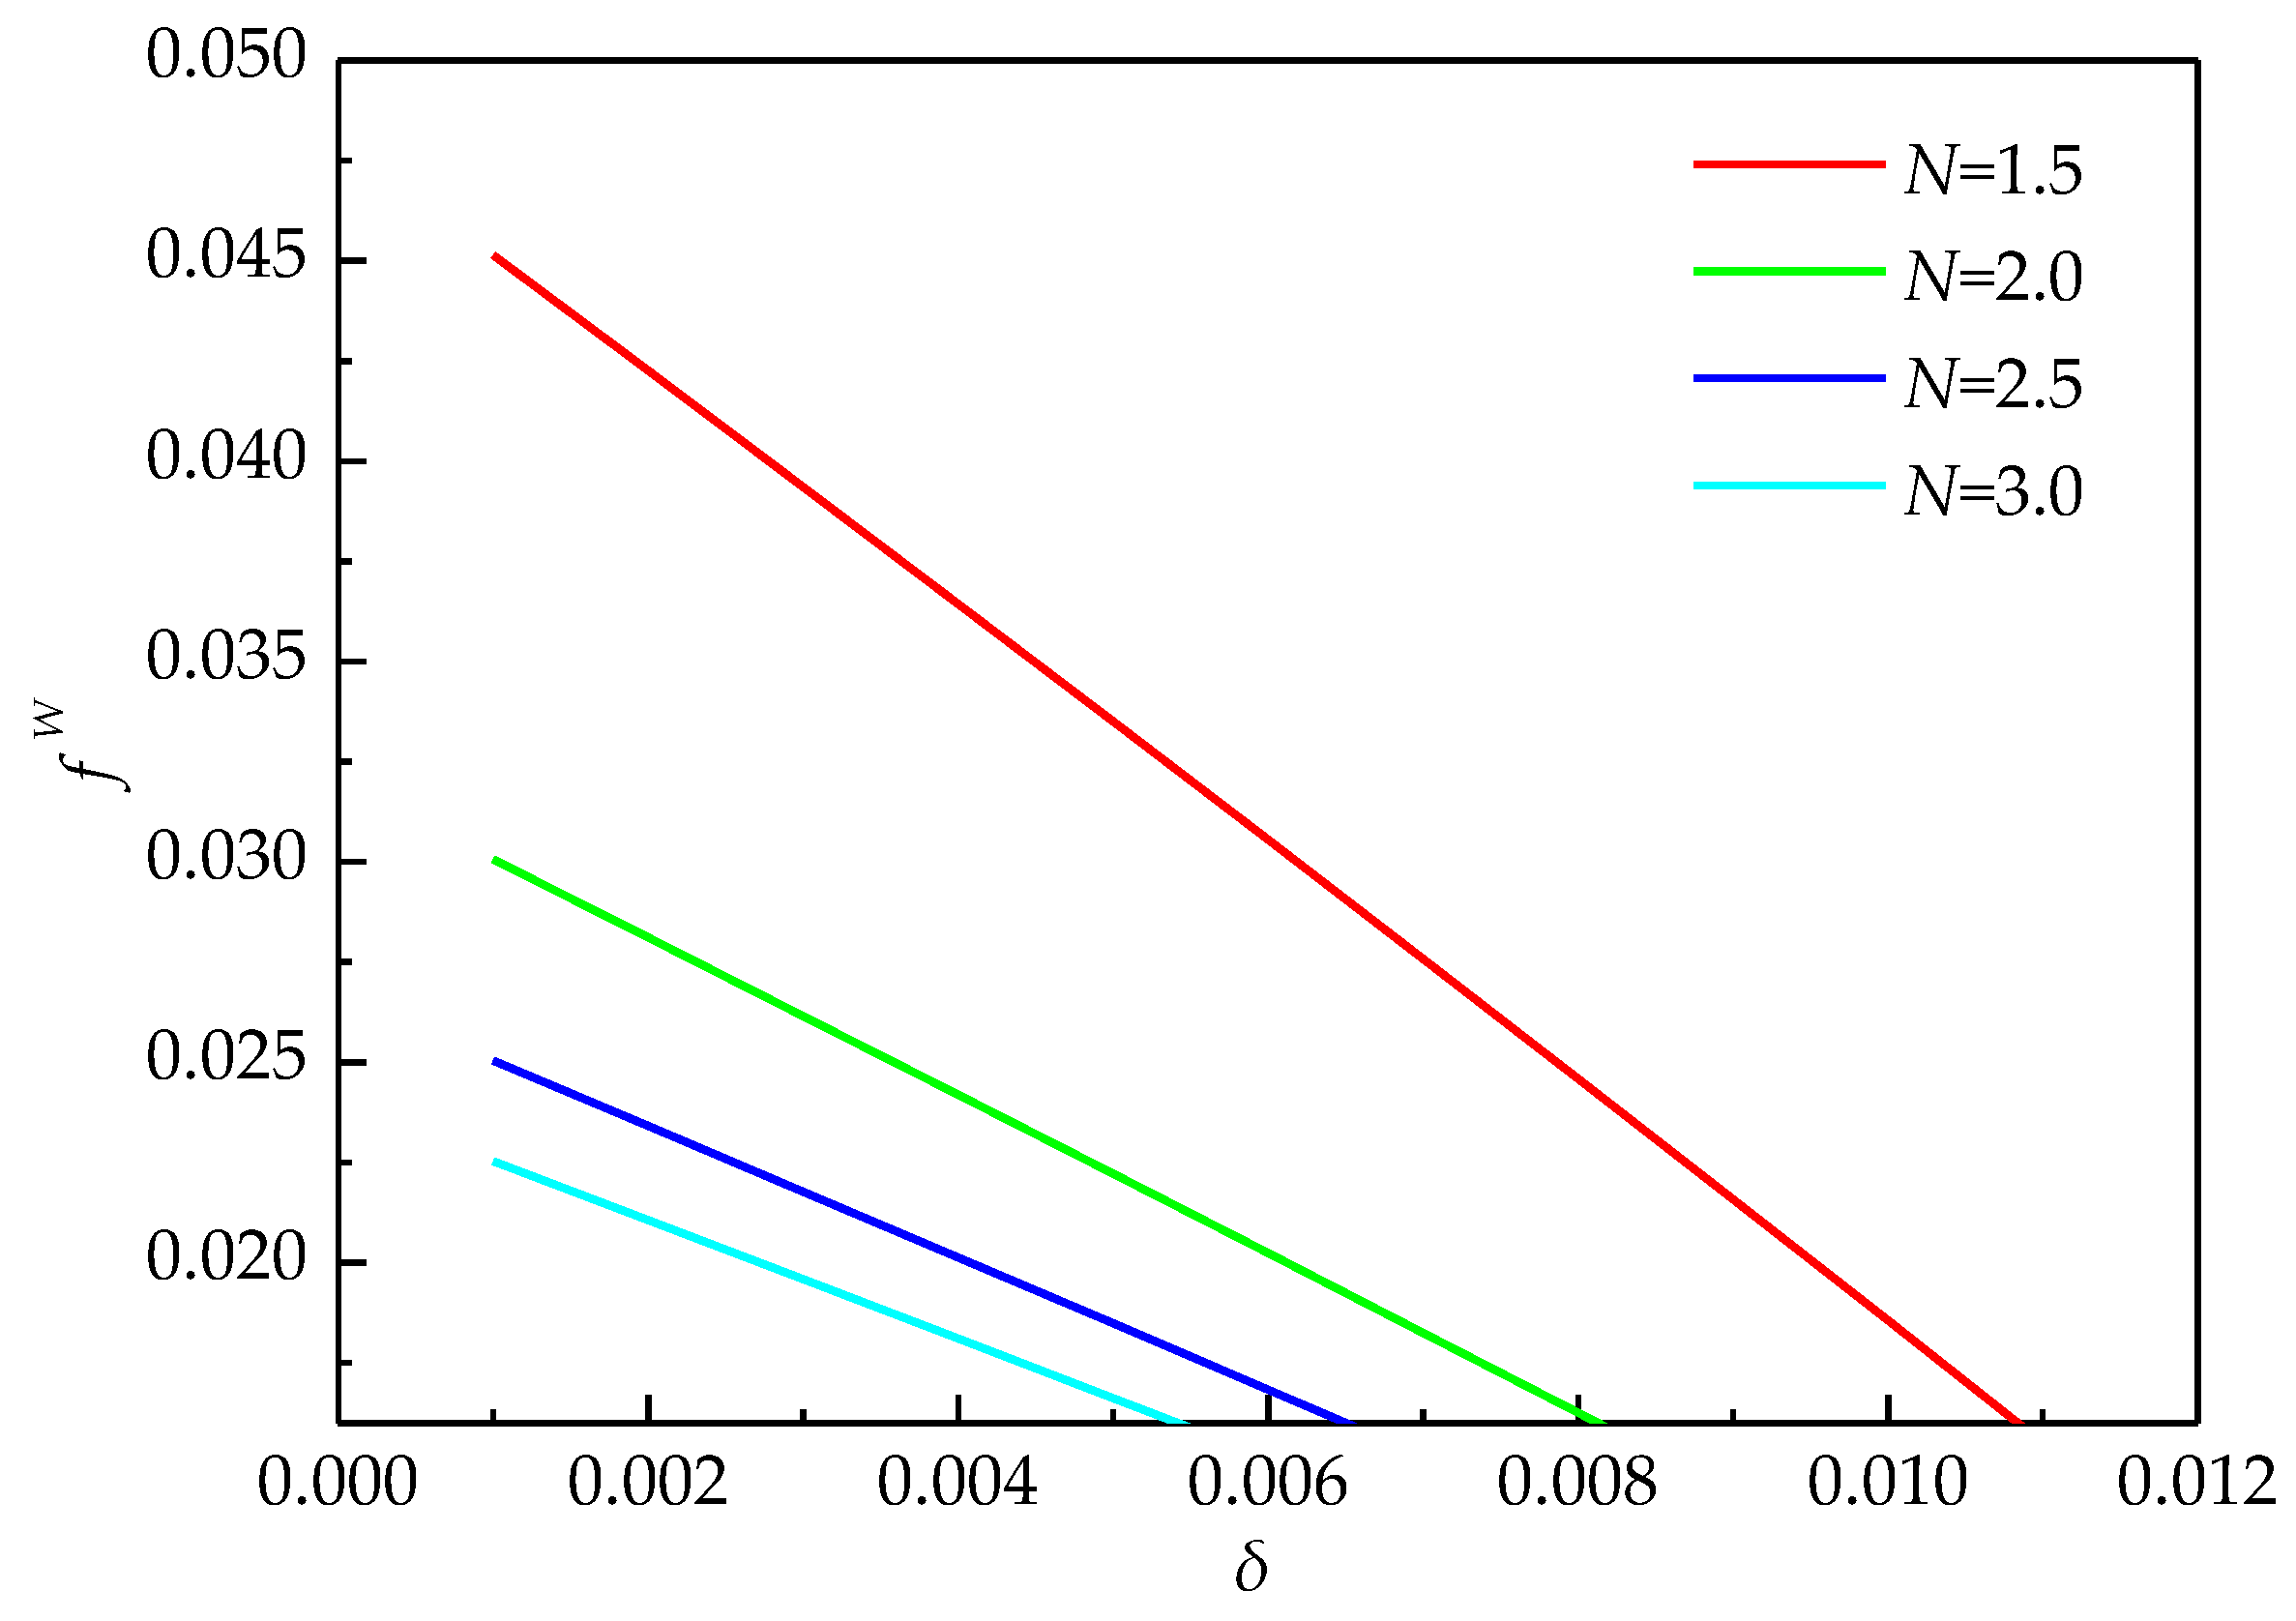
According to Equation (21), the relationship between the makeup rate and , can be analyzed in Figure 5.
As shown in Figure 5, when the cycles of concentration remains constant, with the increase of impurity removal rate, the water makeup rate will decrease. That is to say, the proper purification of circulating water can achieve the purpose of water saving and emission reduction. As mentioned above, to analyze the optimal water use strategy of the system, it has and Equation (19) is selected. Then, the relationship between the cycles of concentration and the leakage rate under different impurity removal rates is shown in Figure 6 and Figure 7.
Figure 6 shows that, under the condition of invariable leakage rate, increasing the impurity removal rate will reduce the cycles of concentration of the system, which means the risk of fouling and corrosion of the heat exchanger will decline. This trend will be more pronounced in areas with lower leakage rates. The optimal operation strategy for different leakage rates is shown in Figure 7. Under the condition of low impurity removal rate, it makes little sense to the system for maintaining a lower blowdown rate; on the contrary, to control the cycles of concentration in this interval, the system even needs to blowdown a part of the water actively. In the case of high impurity removal rate, it is important to control the leakage rate to control the cycles of concentration and consume less fresh water.
4.4. Influence of Water Temperature
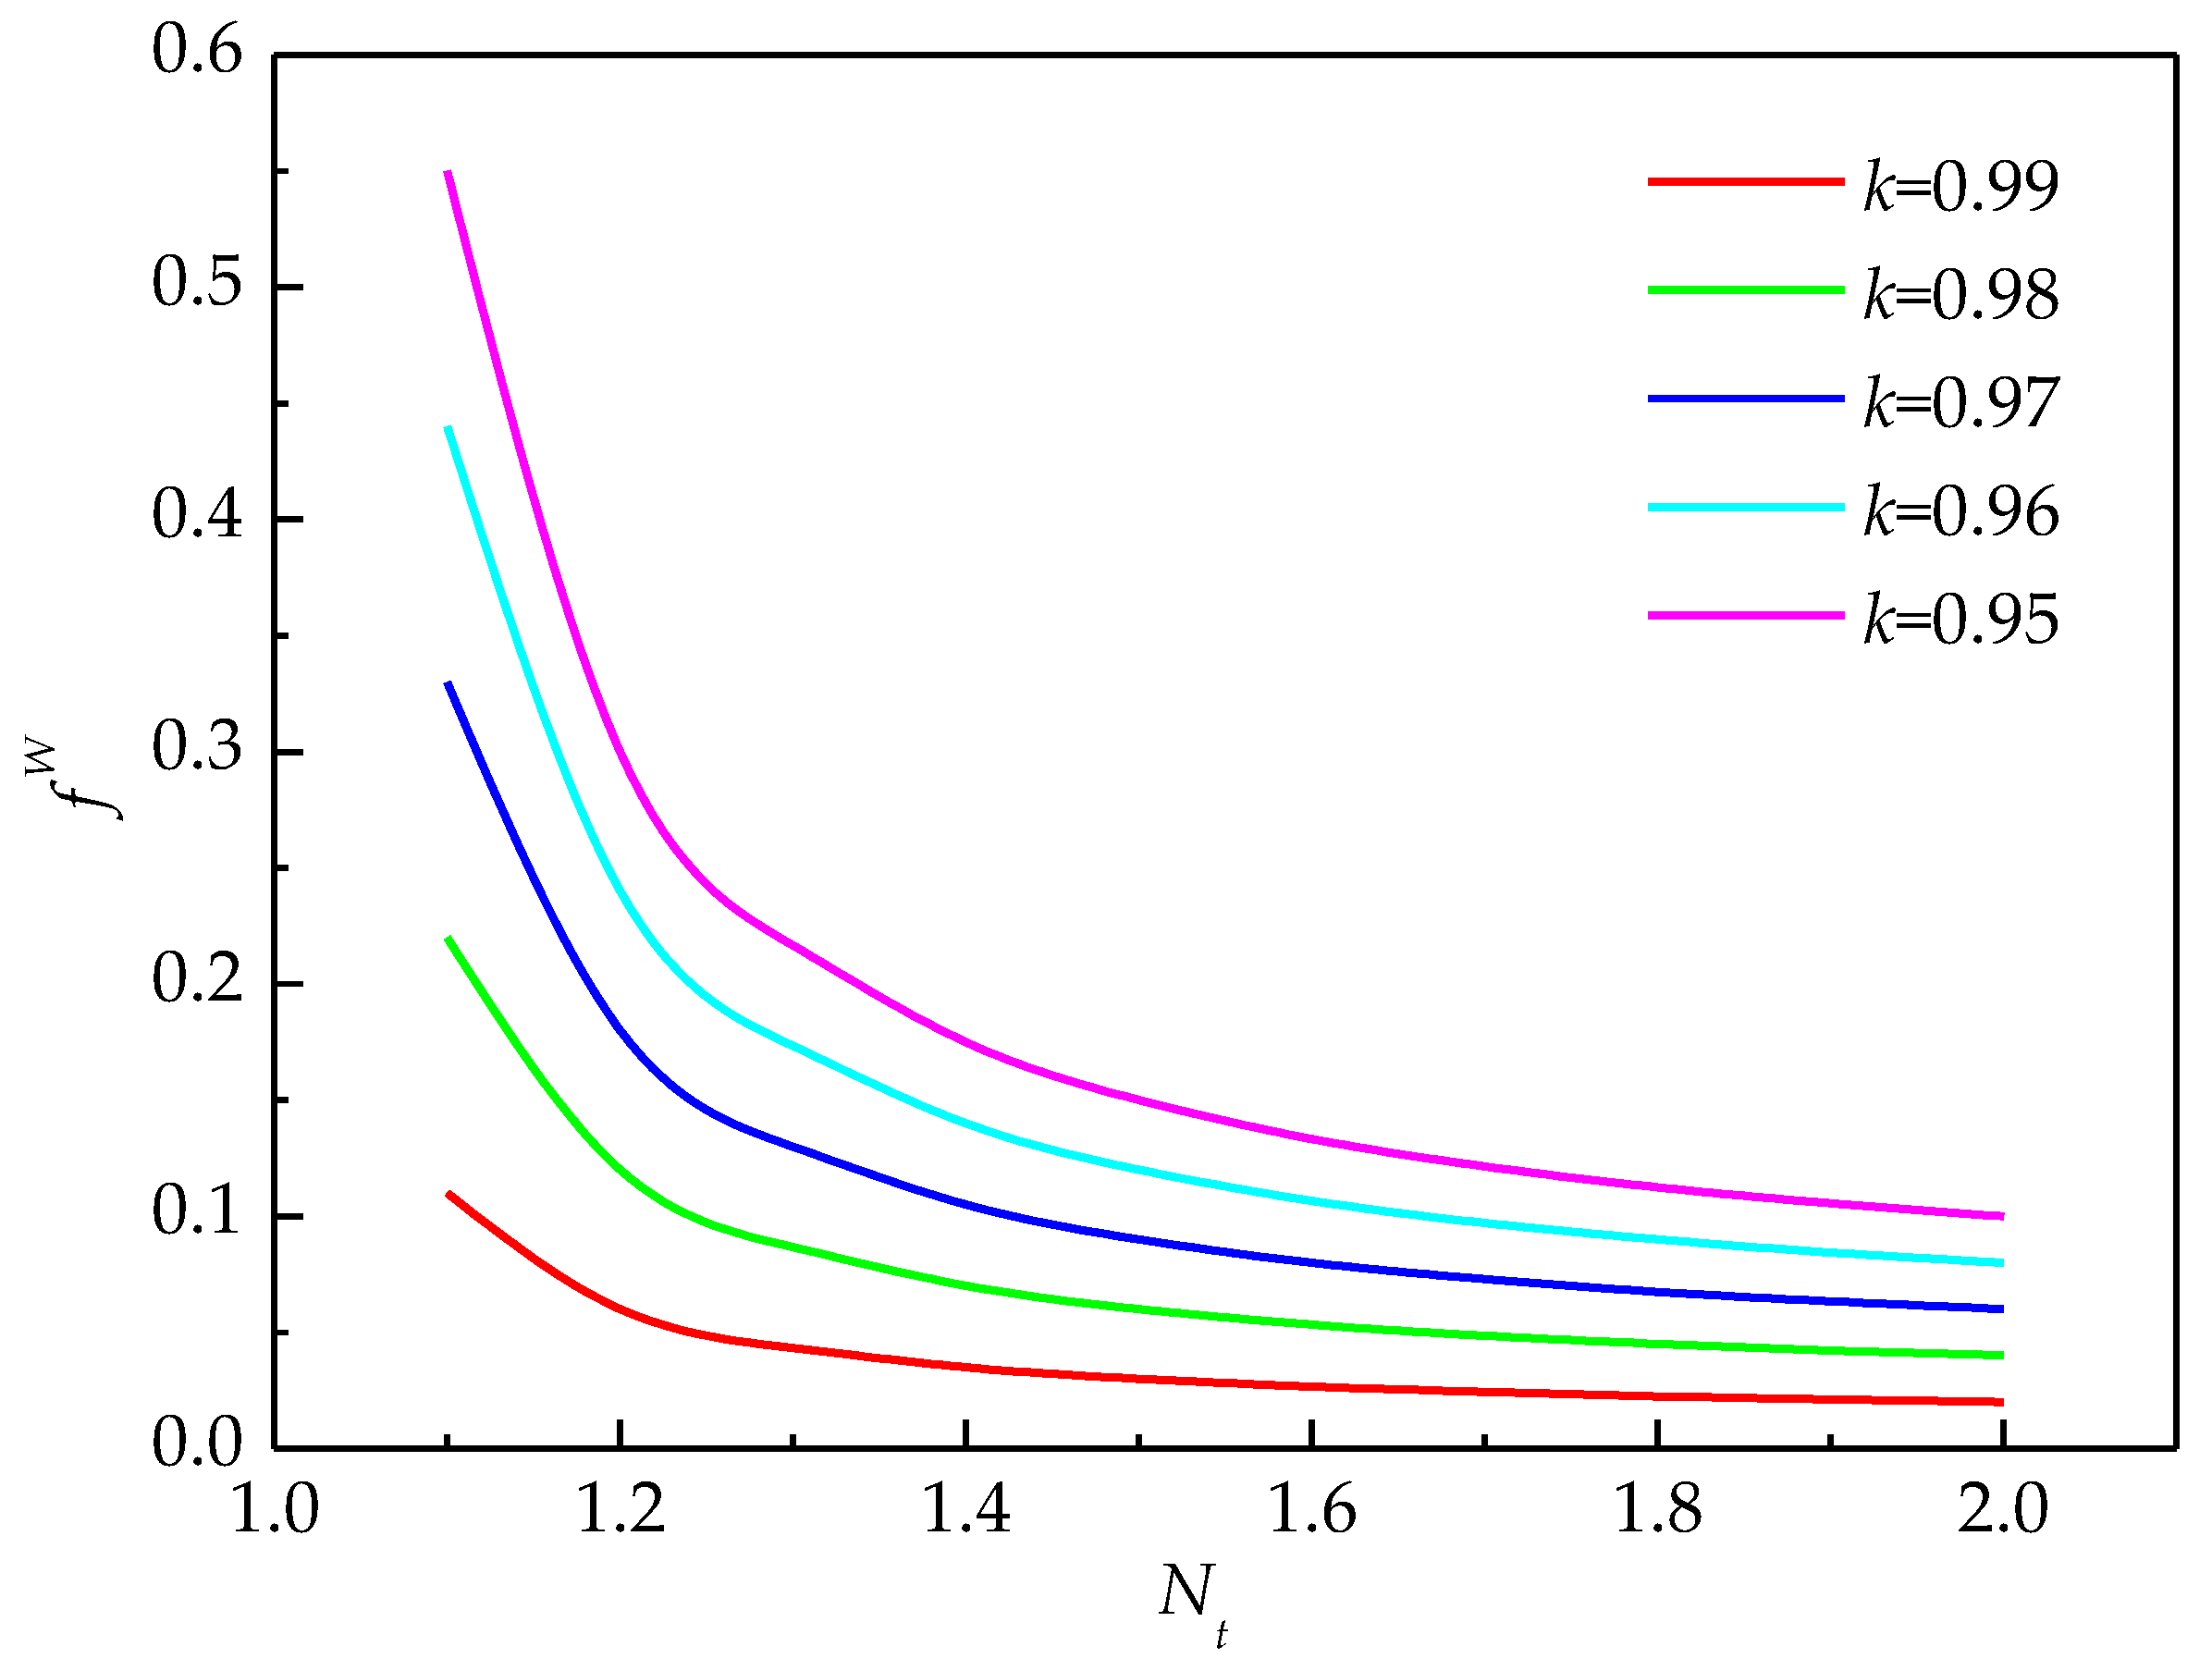
As mentioned previously, when the cooling capacity for the cooling tower is insufficient, Equation (25) can be applied to analyze the influence of water temperature on the makeup rate of the system. Hence, the relation between the cooling index (), the cycles of temperature () and the system makeup rate () is shown in Figure 8 and Figure 9.
As shown in Figure 8, when the cooling capacity of the system is insufficient ( < 1), the makeup rate will increase with the decrease of the cycles of temperature (), and the change rate will increase significantly when the is lower than 1.4. It shows that reducing the makeup water temperature will help to reduce fresh water consumption, but, when the temperature decreases to a certain value, it makes little sense to continue to decline. As shown in Figure 9, the makeup rate increases with the decrease of . To ensure that the inlet temperature of the cooling network remains constant, 1% of the reduction of cooling index will enhance 2% of the makeup rate (under the condition of ) if there are no other assistant methods. This shows that the cooling capacity of the cooling tower is very important for reducing the consumption of fresh water when makeup is chosen to maintain a desired temperature in the recirculation line.
4.5. Coupling Effect of Quality and Temperature on the Makeup Rate
For a certain process, the effects of quality and temperature on the system do coexist, such as their impact on the makeup rate. In practice, when the cooling capacity of the cooling tower is insufficient or the makeup water temperature is over-rising, the open circulating cooling water system is faced with a relatively high rate of makeup water and drainage, then causing an excessive low cycles of concentration, and thus, the water resources are wasted. That is, whether the system has the appropriate cycles of concentration is not only a question of water quality, but also involves the impact of the temperature and the cooling capacity of the cooling tower. According to Equation (17), the corresponding makeup water rate of = 3 is calculated. Then, this makeup water rate is taken as input, and the cycles of temperature values under different cooling tower conditions () are calculated according to Equation (25), as shown in Table 3.
The first column in Table 3 is the cooling index of the cooling tower (). The values gradually decrease from top to bottom, which indicates that the cooling capacity of the cooling tower gradually decreases. The first row of Table 3 is the evaporation rate of the system (), gradually increasing from left to right, indicating that the proportion of evaporating heat transfer in the total heat exchange gradually increases. Under certain conditions of and , when the actual is greater than or equal to the values in Table 3, the makeup rate calculated by Equation (17) is greater than or equal to the makeup rate calculated by Equation (25). The actual makeup rate takes the larger value of the two, so the cycles of concentration of the system will be equal to 3.0. Conversely, when the actual is less than the values in Table 3, the makeup rate will rise because of the heat emission, and the cycles of concentration of the system will be less than 3.0. As an example, if the actual value of is 2.0, then, according to Table 3, it is possible to achieve a cycles of concentration of the system of 3.0 in the colored region; however, the remaining part of the region cannot achieve its goal ( > 3). In addition, increasing the and values can reduce the system requirement for . This shows that, since the water quality and the temperature simultaneously impact the system makeup rate, these two parameters must be considered to control the makeup rate. Under the same evaporation rate of the system, keeping cooling capacity of the cooling tower (increase in the value) is crucial for water-saving and drainage reduction. In Table 3, under the = 0.016 condition, if the value increases from 0.986 to 0.988, the water system requirement for decreases from 2.4 to 2.0. This shows that, as the cooling capacity of the cooling tower increases, less waste heat needs to be removed by means of water replenishment, and then a very low makeup temperature is unnecessary. Similarly, when the value remains constant, if the value increases, the value of the system can be increased. In Table 3, under the = 0.988 condition, if the value increases from 0.014 to 0.016, then the water system requirement for decreases from 2.33 to 2.0. This shows that, with the increase of evaporation rate, the enrichment of impurities has become the dominant factor in water replenishment. At this point, it is no longer important whether the makeup water temperature is low enough.
5. Conclusions
This work uses the equations of mass conservation and energy conservation to analyze the open cooling water systems. The mathematical models of the relationship among water consumption, blowdown rate, water quality and water temperature parameters have been established, which can be used to analyze the change of water supply and blowdown of open cooling water systems under various water quality and water temperature parameters.
A key indicator in water-saving and drainage reduction is the cycles of concentration. The results calculated by the models show that the makeup rate and the blowdown rate of the system decline with the increase of the cycles of concentration. This trend becomes more apparent when the cycles of concentration is less than 2.0. That is to say, for an open cooling water system, the cycles of concentration should be at least 2.0. In a practical system, the appropriate cycles of concentration should be between 3 and 5.
To keep the cycles of concentration in a reasonable range, the leakage rate of the system is assessed. Then, the operation strategies of “active discharge”, “zero emissions” and “leakage rate control” in the range of different cycles of concentration is proposed. After removing some of the impurities in the circulating water by filtration, the concentration of the system water can be slowed down and the resulting makeup rate can be reduced. Such a measure is even more important for the systems with lower leakage rates.
The concepts of cooling index of cooling tower and cycles of temperature in water system are put forward. By applying these concepts and related models, the influence of water temperature on system makeup rate can be evaluated under the condition of insufficient cooling capacity of cooling tower. The effects of quality and temperature on system makeup rate coexist. For a certain system, to maintain the cycles of concentration not less than 3.0, it is necessary to ensure that the cycles of temperature of the system is not less than a corresponding value. The corresponding relation of this value varies with the change of the evaporation rate and the cooling index.
Author Contributions
Z.L.: literature search, data analysis, writing, revision, and final approval; J.C.: study design; W.S.: figures, and revision; L.W.: data collection.
Funding
This work was supported by the National Natural Science Foundation of China (51704069 and 51734004), the China Scholarship Council—International Clean Energy Talent Program (CSC-iCET-201802180028) and the Fundamental Research Funds for the China Central Universities (N162504011).
Conflicts of Interest
The authors declare no conflicts of interest.
Notation
| heat capacity of water, kJ/(kg·°C) | |
| ratio of evaporation heat transfer and total heat transfer, - | |
| concentration of inlet water of cooling tower, kg/t | |
| concentration of outlet water of cooling tower, kg/t | |
| concentration of makeup water, kg/t | |
| CT | cooling tower |
| CW | cooling water |
| leakage rate, - | |
| blowdown rate, - | |
| evaporation rate, - | |
| makeup rate, - | |
| inlet water flowrate of cooling tower, t/h | |
| flowrate of Leakage water, t/h | |
| flowrate of blowdown water, t/h | |
| outlet water flowrate of cooling tower, t/h | |
| flowrate of makeup water, t/h | |
| calculated value of makeup rate, - | |
| measured value of makeup rate, - | |
| flowrate of evaporated water, t/h | |
| cooling index of cooling tower, - | |
| cycles of concentration, - | |
| cycles of temperature of the cooling tower outlet, - | |
| cycles of temperature of the cooling network inlet, - | |
| waste heat in the cooling network, kJ | |
| release heat from the cooling tower to the environment, kJ | |
| latent heat of water evaporation, kJ | |
| latent heat of vaporization of water, kJ/kg | |
| cooling water temperature flowing into the cooling water network, °C | |
| inlet water temperature of cooling tower, °C | |
| outlet water temperature of cooling tower, °C | |
| cooling water temperature range of the cooling tower, °C | |
| temperature of makeup water, °C | |
| impurity removal rate of the filter, - |
References
- Liu, W.; Chien, S.H.; Dzombak, D.A.; Vidic, R.D. Scaling Control for Heat Exchangers in Recirculating Cooling Systems Using Treated Municipal Wastewater. Ind. Eng. Chem. Res. 2014, 53, 16366–16373. [Google Scholar] [CrossRef]
- Sun, W.; Yue, X.; Wang, Y.; Cai, J. Energy and exergy recovery from exhaust hot water using ORC (organic Rankine cycle) and a retrofitted configuration. J. Cent. South Univ. 2018, 25, 1464–1474. [Google Scholar] [CrossRef]
- Colla, V.; Matino, I.; Branca, T.A.; Fornai, B.; Romaniello, L.; Rosito, F. Efficient use of water resources in the steel industry. Water 2017, 9, 874. [Google Scholar] [CrossRef]
- Kremes, J.J. Industrial water recycle/reuse. Curr. Opin. Chem. Eng. 2012, 1, 238–245. [Google Scholar]
- Linnhoff, B.; Vredeveld, R. Pinch technology has come of age. Chem. Eng. Prog. 1984, 80, 33–40. [Google Scholar]
- Wang, Y.; Smith, R. Wastewater minimization. Chem. Eng. Sci. 1994, 49, 981–1006. [Google Scholar] [CrossRef]
- Dunn, R.F.; El-Halwagi, M. Process integration technology review: Background and applications in the chemical process industry. Chem. Technol. Biotechnol. 2003, 78, 1011–1021. [Google Scholar] [CrossRef]
- Jacob, J.; Viviant, C.; Houle, J.F.; Paris, J. Analyses et optimization des réseaux d’eau dans les procédés de fabrication des pâtes et papiers. Tech. Pincement À L’oeuvre Pulp. Pap. Can. 2002, 103, 24–27. [Google Scholar]
- Manan, Z.A.; Wan Alwi, S.R.; Ujang, Z. Water pinch analysis for an urban system: A case study on the Sultan Ismail Mosque at the Universiti Teknologi Malaysia (utm). Desalination 2006, 194, 52–68. [Google Scholar] [CrossRef]
- Wang, T.; Fang, G.; Xie, X.; Liu, Y.; Ma, Z. A multi-dimensional equilibrium allocation model of water resources based on a groundwater multiple loop iteration technique. Water 2017, 9, 718. [Google Scholar] [CrossRef]
- Feng, X.; Bai, J.; Wang, H.; Zheng, X. Grass-roots design of regeneration recycling water networks. Comput. Chem. Eng. 2008, 32, 1892–1907. [Google Scholar] [CrossRef]
- Sun, W.; Wang, Y.; Zhang, F.; Zhao, Y. Dynamic allocation of surplus byproduct gas in steel plant by dynamic programming with reduced state space algorithm. Eng. Opt. 2018, 50, 1578–1592. [Google Scholar] [CrossRef]
- Bagajewicz, M. A review of recent design procedures for water networks in refineries and process plants. Comput. Chem. Eng. 2000, 24, 2093–2113. [Google Scholar] [CrossRef] [Green Version]
- Ramos, M.A.; Boix, M.; Montastruc, L.; Domenech, S. Multiobjective optimization using goal programming for industrial water network design. Ind. Eng. Chem. Res. 2014, 53, 17722–17735. [Google Scholar] [CrossRef]
- Castro, P.; Matos, P.; Fernandes, M.C.; Nunes, C.P. Improvements for mass-exchange networks design. Chem. Eng. Sci. 1999, 54, 1649–1665. [Google Scholar] [CrossRef]
- Kim, J.K.; Smith, R. Cooling water system design. Chem. Eng. Sci. 2001, 56, 3641–3658. [Google Scholar] [CrossRef]
- Kim, J.K.; Savulescu, L.; Smith, R. Design of cooling systems for effluent temperature reduction. Chem. Eng. Sci. 2001, 56, 1811–1830. [Google Scholar] [CrossRef]
- Jiang, W.; Yuan, Z.; Bi, J.; Sun, L. Conserving water by optimizing production schedules in the dyeing industry. J. Clean. Prod. 2010, 18, 1696–1702. [Google Scholar] [CrossRef]
- Ponce-Ortega, J.M.; Serna-González, M.; Jiménez-Gutiérrez, A. Optimization model for re-circulating cooling water systems. Comput. Chem. Eng. 2010, 34, 177–195. [Google Scholar] [CrossRef]
- Sun, J.; Feng, X.; Wang, Y. Cooling-water system optimisation with a novel two-step sequential. Appl. Therm. Eng. 2015, 89, 1006–1013. [Google Scholar] [CrossRef]
- Bu, Q. Substance Flow Analysis and Its Application in Steel Industry; Northeastern University: Shenyang, China, 2005. [Google Scholar]
- Qureshi, B.A.; Zubair, S.M. A comprehensive design and rating study of evaporative coolers and condensers. Part I. Performance evaluation. Int. J. Refrig. 2006, 29, 645–658. [Google Scholar] [CrossRef]
- Rahmani, K. Reducing water consumption by increasing the cycles of concentration and Considerations of corrosion and scaling in a cooling system. Appl. Therm. Eng. 2017, 114, 849–856. [Google Scholar] [CrossRef]
- Zubair, S.M. Prediction of evaporation losses in wet cooling towers. Heat Transf. Eng. 2006, 27, 86–92. [Google Scholar]
- GŐsi, P. Method and chart for the determination of evaporation loss of wet cooling towers. Heat Transf. Eng. 1989, 10, 44–49. [Google Scholar] [CrossRef]
Figure 1.
Physical model of open circulating cooling water system.

Figure 2.
The relationship between fW and N.

Figure 3.
The relationship between fP and N ().

Figure 4.
The relationship between N and fl ().

Figure 5.
The relationship between fW and δ.

Figure 6.
The relationship between N and fl.

Figure 7.
Optimal operating strategy for systems with different impurity removal rates.

Figure 8.
The relationship between fW and Nt.

Figure 9.
The relationship between fW and k.


Table 1.
Comparison of experimental and calculated results.
| Case | Error (%) | ||||
|---|---|---|---|---|---|
| 1 | 0.0121 | 1.2512 | 0.0592 | 0.0603 | −1.81 |
| 2 | 0.0133 | 2.2034 | 0.0247 | 0.0244 | 1.41 |
| 3 | 0.0125 | 2.6169 | 0.0206 | 0.0202 | 1.79 |
| 4 | 0.0164 | 1.8233 | 0.0362 | 0.0363 | −0.33 |
Table 2.
Comparison of experimental and calculated results.
| Case | Error (%) | |||||||
|---|---|---|---|---|---|---|---|---|
| 1 | 31.0297 | 30.0586 | 20.2632 | 0.9687 | 1.5313 | 0.092 | 0.0902 | –1.96 |
| 2 | 37.3506 | 35.1201 | 20.358 | 0.9479 | 2.0182 | 0.1052 | 0.1033 | –1.83 |
| 3 | 43.5605 | 40.2203 | 22.334 | 0.945 | 2.3214 | 0.0956 | 0.0966 | 1.04 |
| 4 | 41.9361 | 40.7968 | 29.2768 | 0.9728 | 1.4324 | 0.0885 | 0.09 | 1.67 |
Table 3.
The of the system in the case of N = 3.
| 0.01 | 0.012 | 0.014 | 0.016 | 0.018 | 0.02 | 0.022 | 0.024 | 0.026 | |
|---|---|---|---|---|---|---|---|---|---|
| (= 0.990) | 3.00 | 2.25 | 1.91 | 1.71 | 1.59 | 1.50 | 1.43 | 1.38 | 1.34 |
| ( = 0.988) | 5.00 | 3.00 | 2.33 | 2.00 | 1.80 | 1.67 | 1.57 | 1.50 | 1.44 |
| ( = 0.986) | 15.00 | 4.50 | 3.00 | 2.40 | 2.08 | 1.88 | 1.74 | 1.64 | 1.56 |
| ( = 0.984) | - | 9.00 | 4.20 | 3.00 | 2.45 | 2.14 | 1.94 | 1.80 | 1.70 |
| ( = 0.982) | - | - | 7.00 | 4.00 | 3.00 | 2.50 | 2.20 | 2.00 | 1.86 |
| ( = 0.980) | - | - | 21.00 | 6.00 | 3.86 | 3.00 | 2.54 | 2.25 | 2.05 |
| ( = 0.978) | - | - | - | 12.00 | 5.40 | 3.75 | 3.00 | 2.57 | 2.29 |
| ( = 0.976) | - | - | - | - | 9.00 | 5.00 | 3.67 | 3.00 | 2.60 |
| ( = 0.974) | - | - | - | - | 27.00 | 7.50 | 4.71 | 3.60 | 3.00 |
| ( = 0.972) | - | - | - | - | - | 15.00 | 6.60 | 4.50 | 3.55 |
| ( = 0.970) | - | - | - | - | - | - | 11.00 | 6.00 | 4.33 |
© 2018 by the authors. Licensee MDPI, Basel, Switzerland. This article is an open access article distributed under the terms and conditions of the Creative Commons Attribution (CC BY) license (http://creativecommons.org/licenses/by/4.0/).
Share and Cite
MDPI and ACS Style
Lv, Z.; Cai, J.; Sun, W.; Wang, L. Analysis and Optimization of Open Circulating Cooling Water System. Water 2018, 10, 1592. https://doi.org/10.3390/w10111592
AMA Style
Lv Z, Cai J, Sun W, Wang L. Analysis and Optimization of Open Circulating Cooling Water System. Water. 2018; 10(11):1592. https://doi.org/10.3390/w10111592
Chicago/Turabian StyleLv, Ziqiang, Jiuju Cai, Wenqiang Sun, and Lianyong Wang. 2018. "Analysis and Optimization of Open Circulating Cooling Water System" Water 10, no. 11: 1592. https://doi.org/10.3390/w10111592
Note that from the first issue of 2016, this journal uses article numbers instead of page numbers. See further details here.