Article

Key Climate Oscillation Factors Controlling Precipitation Variability during the Dry Season in Eastern Northeast Brazil: Study Case of Mundaú and Paraíba Do Meio River Basins

by
Thiago Alberto Da Silva Pereira
1,
Denis Duda Costa
2,3,*,
Carlos Ruberto Fragoso Jr.
4,
Suzana Maria Gico Lima Montenegro
5 and
Cintia Bertacchi Uvo
2
1
Campos Sertão, Universidade Federal de Alagoas, Delmiro Gouveia 57480-000, Brazil
2
Department of Water Resources Engineering, Lund University, Lund 221 00, Sweden
3
CAPES, Ministério da Educação do Brasil, Brasília 70040-031, Brazil
4
Centro de Tecnologia, Universidade Federal de Alagoas, Maceió 57072-900, Brazil
5
Centro de Tecnologia e Geociências, Universidade Federal de Pernambuco, Recife 50740-540, Brazil
*
Author to whom correspondence should be addressed.
Water 2018, 10(11), 1617; https://doi.org/10.3390/w10111617
Submission received: 24 September 2018 / Revised: 2 November 2018 / Accepted: 7 November 2018 / Published: 9 November 2018
(This article belongs to the Section Hydrology)

Abstract

:
In Brazil, the northeastern region (NEB) is considered one of the most vulnerable areas of the country in terms of precipitation variability due to frequent drought episodes during the rainy season. Differently from the Northern NEB (NNEB), where dry season is consistently dry, the Eastern NEB (ENEB) exhibits a high interannual variability of precipitation during the dry season, including years exceeding 400 mm. This work aims at understanding key large-scale climate factors that modulate the high pluviometric variability of ENEB during the dry season. Multivariate statistical techniques were applied to identify the time-frequency relationship between precipitation variability and global climate phenomena. The results suggested that hydrological extreme events during the dry season became more frequent after the 1990s. Moreover, our findings also indicated a relationship, at multiannual time scales, between the state of El Niño Southern Oscillation (ENSO) and Atlantic Meridional Mode (AMM) and precipitation variability during the dry season. This additional knowledge may contribute to the formation of new perspectives of drought management, leading support to the development of a long-term drought forecasting framework, as well as to the improvement of the water resources management of the region.

1. Introduction

How large-scale climate variability impacts local hydrology is strategic information regarding the water resources management of a hydrological region, allowing a better understanding of the occurrence of extreme events such as droughts and floods [1,2]. Thus, the characterization of local rainfall regimes may improve the short and long-term hydrological prediction, assisting in the formation of a strategic view of unwanted impacts which leads to their mitigation [3,4,5].
The Northeastern region of Brazil (NEB) is the most vulnerable socio-economic area of the country [6,7]. It exhibits a very large interannual variability of precipitation [8,9,10] during the rainy season with a high intensity of extreme events such as the drought from 2012 to 2016 [11] and the 2010 flood episodes [12]. These extreme events are normally associated with large-scale climate phenomena such as ENSO [13,14,15] and/or anomalous position or intensity of the Intertropical Convergence Zone—ITCZ due to sea surface temperature (SST) variabilities in the tropical Atlantic Ocean [8,16,17]. The NEB is exposed to different spatial-temporal rainfall regimes throughout the year. Precipitation at the Northern NEB (NNEB) is characterized by a rainy season from January to May marked by expressive interannual variability [8,16,18,19], and a dry season from June to December characterized by very low amounts of precipitation (near zero). On the other hand, Eastern NEB (ENEB) has the highest annual average precipitation of the NEB, with a wet season from March to August, is also susceptible to annual variations [20,21], but in a different way than the NNEB, while the ENEB dry season might receive substantial amount of precipitation in some years.
Many studies have been conducted in order to analyze and characterize such interannual variability of precipitation in NEB, which, however, were predominantly focused on NNEB rainy season [8,10,17,22,23,24,25,26]. There is also a growing interest in understanding the dynamics of the precipitation variability over the ENEB [18,20,27,28,29,30]. However, most of these are focused on the rainy season of the region, its relationship with Atlantic SST patterns and the occurrence of easterly wave disturbance over the tropical Atlantic [18,19,31]. Nevertheless, the dry season in the ENEB may also exhibit high variabilities in terms of volume precipitated, as seen recently (e.g., 96 mm was precipitated in 2016–2017, and more than 400 mm in 2017–2018), and low-rainfall indices during the dry season of this region may directly impact basic economic activities (i.e., mainly rainfed agriculture) and water supply security.
The spatio-temporal evolution of drought episodes during the dry season in the ENEB was recently studied by Costa et al. [29]. However, important knowledge gaps regarding temporal variability of large-scale climate phenomena influencing the dry season in the ENEB still remain. The non-stationarity of the relationship between global climate indicators and the precipitation over the ENEB during the rainy season may also be a key factor that controls the amount of rainfall received during the dry season. It may also provide an understanding of periodicity patterns, such as the interannual-to-multiannual precipitation dynamics during this season. Therefore, this study aims to analyze the role of large-scale climate phenomena played in the temporal dependency of precipitation variability during the dry season in the ENEB using a time-frequency analysis, such as wavelet techniques, which is applied in the formation of a case study consisting of two representative river basins which exist in the central parts of ENEB. The knowledge achieved in this study may be a promising step towards drought management tools, such as a long-term drought forecasting system, contributing to the water resources management of the region.

2. Materials and Methods
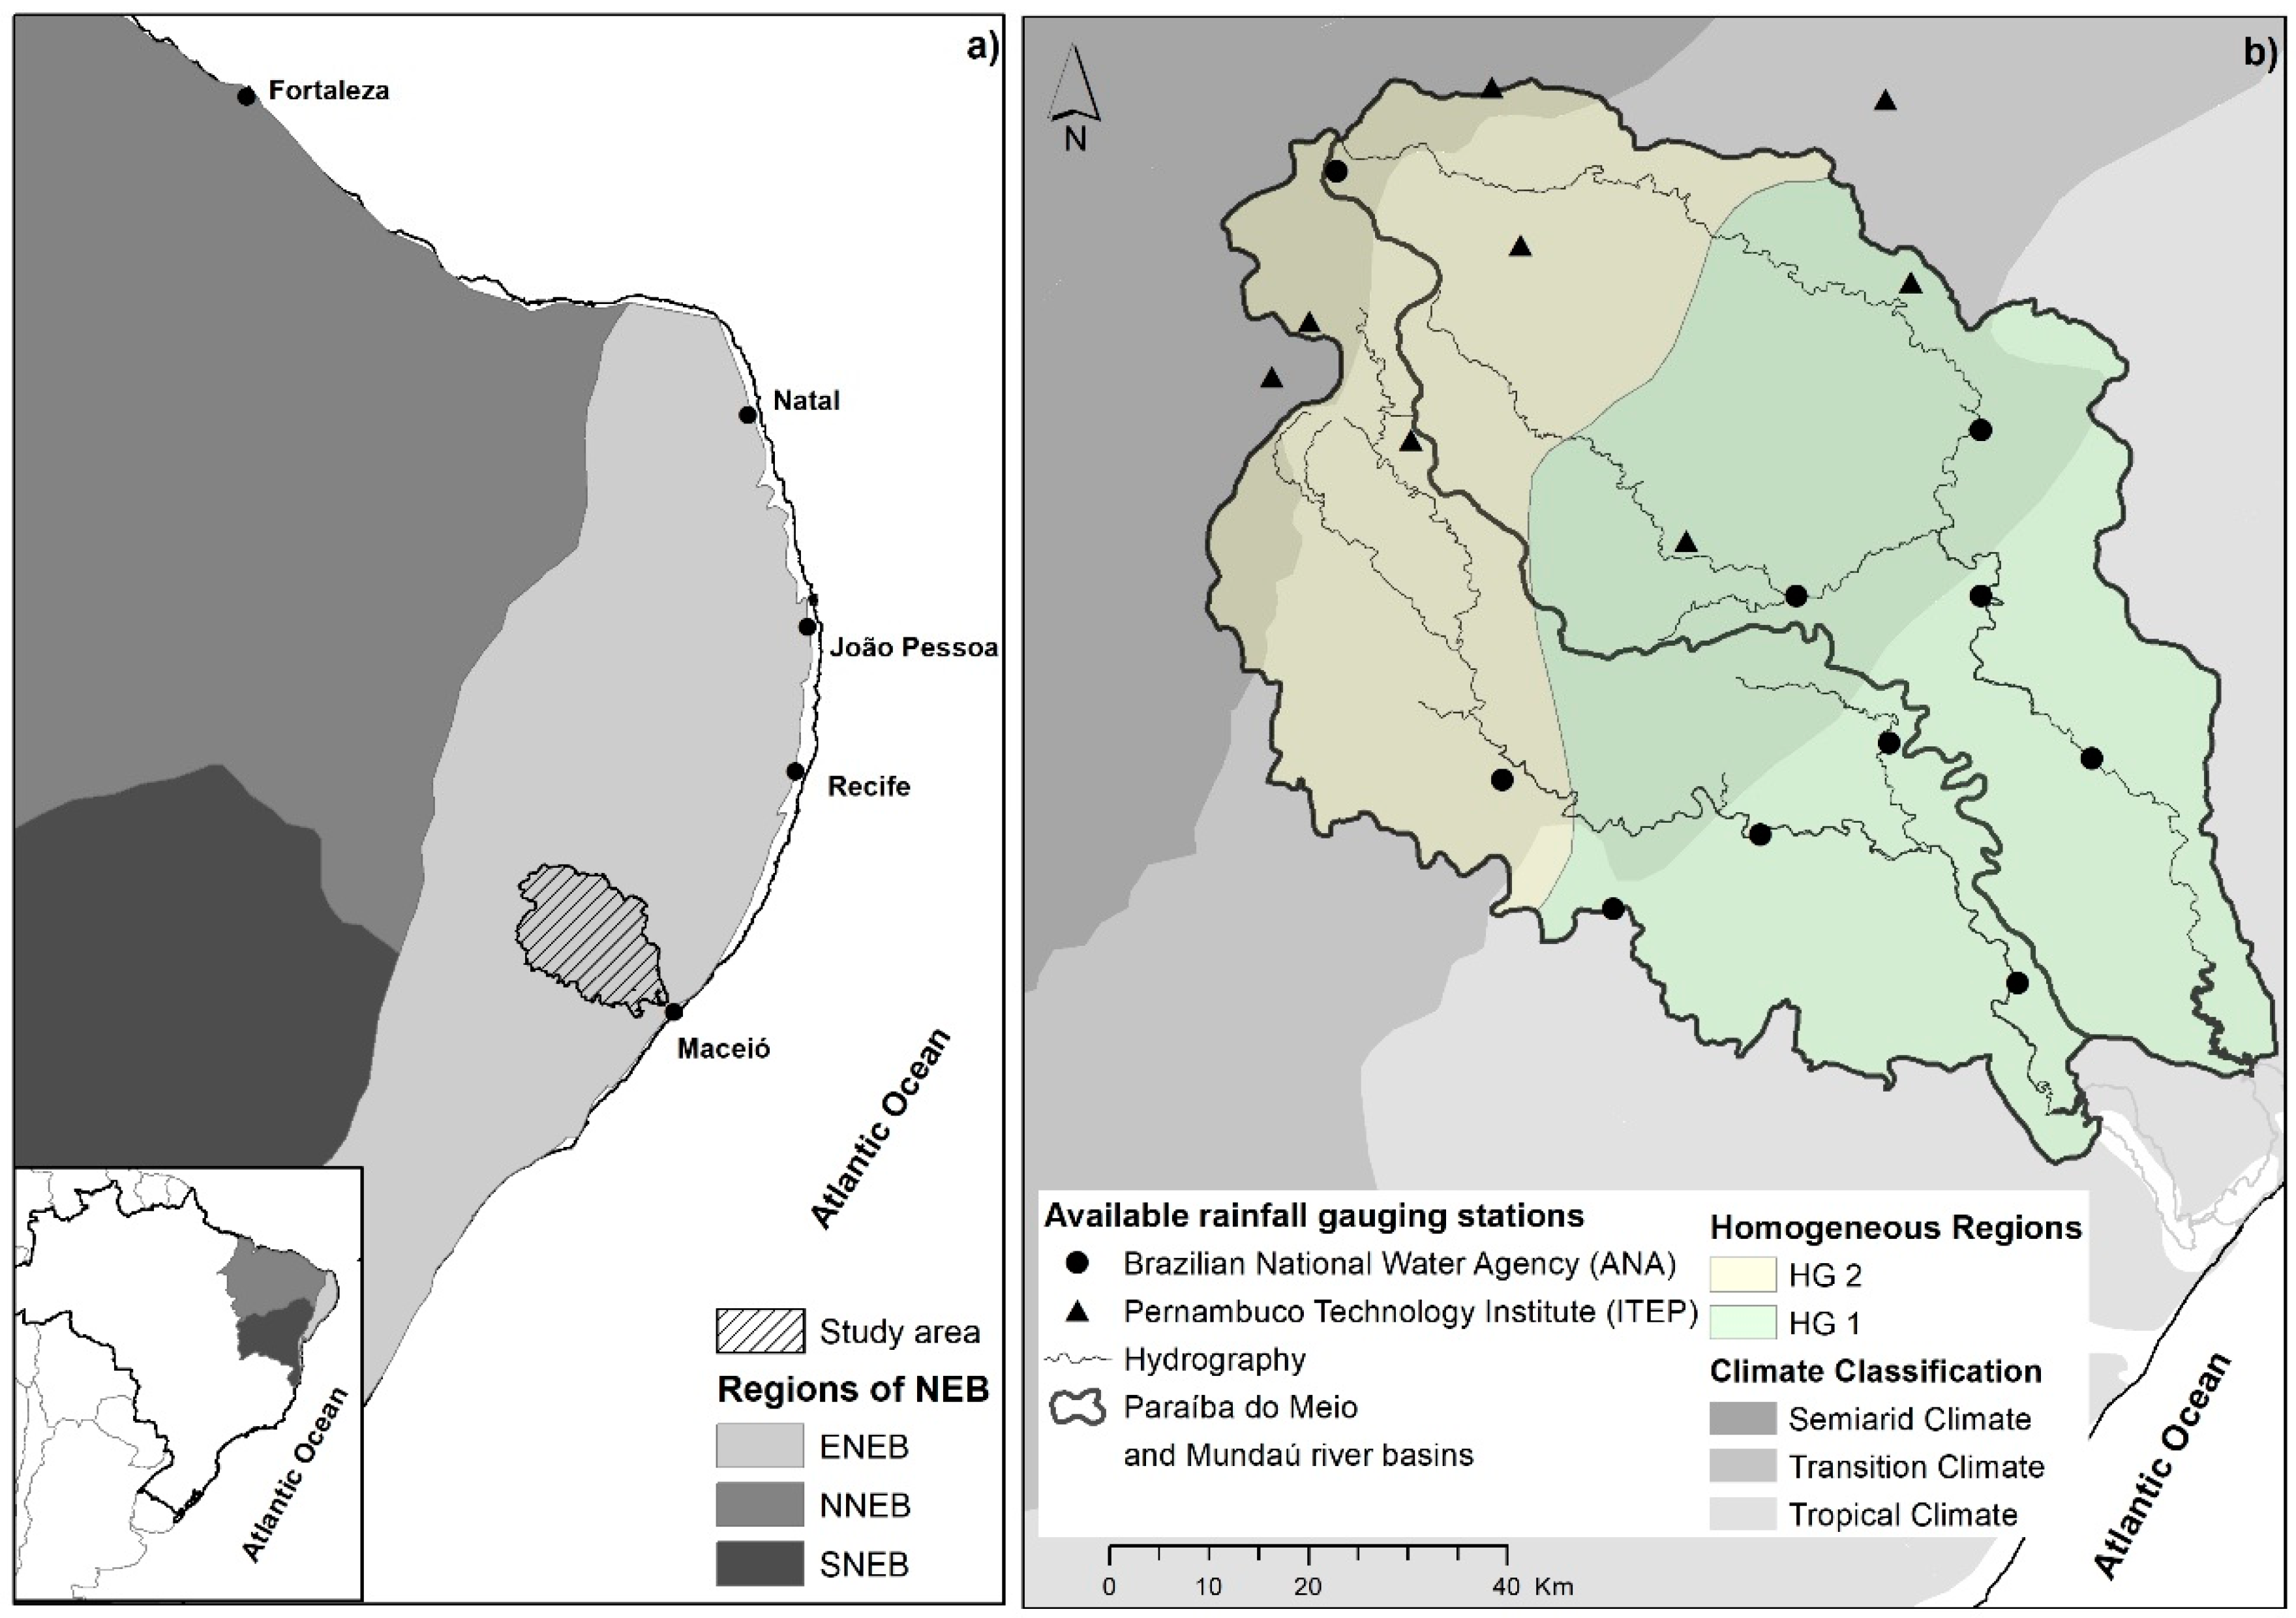
2.1. Study Area

The study area consists of two neighboring river basins in the central ENEB (8°30′00″ S to 10°00′00″ S latitude and 35°30′00″ W to 37°00′00″ W longitude), the Mundaú river basin (4126 km2) and the Paraíba do Meio river basin (3157 km2), which together covers an area of 7283 km2 (Figure 1). This study area is the same as the one described by Costa et al. [29], an area with large variation in climate and physiographic properties from the littoral (humid climate with tropical forest), to the headwaters (semiarid region). The semiarid part of the basins exhibits an average annual precipitation of c.a. 800 mm, while the coastal zone, c.a. 2000 mm [32]. As usual in tropical areas, the annual precipitation regime is basically divided in two seasons, a dry season between September and February, and a wet season from March to August, concentrating 70% of the total annual precipitation. The driest period includes October, November and December, which on average explain only 8% of the annual rainfall; however, the dry season is also marked by a high interannual variability of precipitation, including years exceeding 400 mm. Figure 2 shows the average annual regime of precipitation of the study area.
The spatial-temporal features of the rainfall regime of these basins are characteristic of the ENEB, as described by Rao et al. [20], with the rainy season explaining 60% of the annual precipitation while the dry season only 10%. Thus, even though the study area is small compared to the ENEB area, it might represent the climate of the central part of the ENEB.

2.2. Data

The data collection and quality control analysis (e.g., data quality check and missing data fill) used here was used in [29]. It is composed by daily data from 1938 to 2008 with 18 precipitation stations (Figure 1b), where 10 stations belong to the Brazilian National Water Agency (ANA) and 8 stations to Pernambuco State Technology Institute (ITEP). The time series of the accumulated precipitation for the driest trimester (October to December—OND) were obtained from the daily data series.
Global climate phenomena were represented in this study by 5 climate indices depicting anomalies of large-scale climate conditions, which are as follows: (a) ENSO by Southern Oscillation Index (SOI) and Niño 3.4 [34], (b) Pacific Decadal Oscillation—PDO [35], (c) North Atlantic Oscillation—NAO [36], (d) Atlantic Multidecadal Oscillation—AMO [37], and (e) Atlantic Meridional Mode—AMM [38]. The monthly time series of the climate indices were obtained from the National Center for Atmospheric Research—NCAR (http://www.cgd.ucar.edu/cas/catalog/climind/) and the National Oceanic and Atmospheric Administration—NOAA (http:/www.esrl.noaa.gov/psd/data/climateindices/list/).

2.3. Standard Precipitation Index—SPI

The accumulated precipitation OND from 1938 to 2008 was used to obtain the 3-months Standard Precipitation Index (SPI—3OND). The SPI is a useful technique in measuring rainfall anomalies, indicating drought/wet intensity over a period [39,40]. In this study, the SPI values were calculated for the driest trimester of the study area. Table 1 shows the SPI classification.
A filtering was performed on the SPI values proposed by Agnew [40]. The values were standardized by the value of the normal category, defined as 0.84, and a new variable called SPI3* was calculated. Absolute values below 0.84 were assigned as zero value, and absolute values above 0.84 were diminished by 0.84.

2.4. Wavelet Analysis

To evaluate the temporal variability between SPI3* and lagged climate indices, a time-frequency analysis was performed by using wavelet techniques. Wavelet is a more powerful method to analyze nonstationary series compared to other techniques such as Fourier analysis [41,42,43]. The continuous wavelet transform (CWT) allows for the investigation of time series at a different scale of periodicity, highlighting dominant modes of variability over the time scale with statistical level of significance [44,45,46]. The CWT of a time series X may be defined as:
W X , Ψ ( s , t ) = ( X ( t ) × Ψ s ( t ) ) ,
where t is the time and Ψ s is the mother wavelet at the scale s. The Morlet mother wavelet is widely used in geophysical signal analysis [45,46,47], and its equation is defined as:
Ψ s ( η ) = π 1 / 4 e i ω s η e η 2 / 2 ,
where, η and ωs are time and frequency respectively, both non-dimensional. Cross wavelet analysis (XWT) was also applied to evaluate the covariance of two variables (X and Y), leading to the identification of periods with high common power between SPI3* and climate indices in their time-frequency domain [41,45], and to improving the understanding of occurrences of temporal cycles in the SPI3* time series linked with global climate phenomena. The XWT spectrum is defined by:
W XY ( s , t ) = W X ( s , t ) W Y * ( s , t ) ,
where * denotes the complex conjugate of W Y ( s , t ) .
In addition, wavelet coherence (WTC) was applied to measure the intensity of the common power. The WTC is defined as the square of the smoothed cross-spectrum, normalized by smoothed spectra of two time series, and may be interpreted as a local correlation (R) over the time-frequency domain, i.e., it yields the quantity between 0 and 1 in their time-frequency space [45]. The WTC is presented as:
R 2 ( s , t ) = | S ( s 1 W XY ( s , t ) ) | 2 S ( s 1 | W X ( s , t ) | 2 ) × S ( s 1 | W Y ( s , t ) | 2 ) ,
where S is the smoothing operator [46,47]. The WTC enhances the reliability of the time-frequency analysis, signaling the case of local variable correlation while avoiding pitfalls created by strong CWT signal of one of the time series [42].
All calculations were performed using the MATLAB® software suite. The output maps were produced in ArcGIS® 10.2. The CWT was computed using the software provided by Torrence and Compo [45] (http://atoc.colorado.edu/research/wavelets/), while the Cross Wavelets and Wavelet Coherence Analysis was computed using a software package provided by Jevrejeva et al. [41], at the URL: http://www.pol.ac.uk/home/research/waveletcoherence/.

3. Results and Discussion

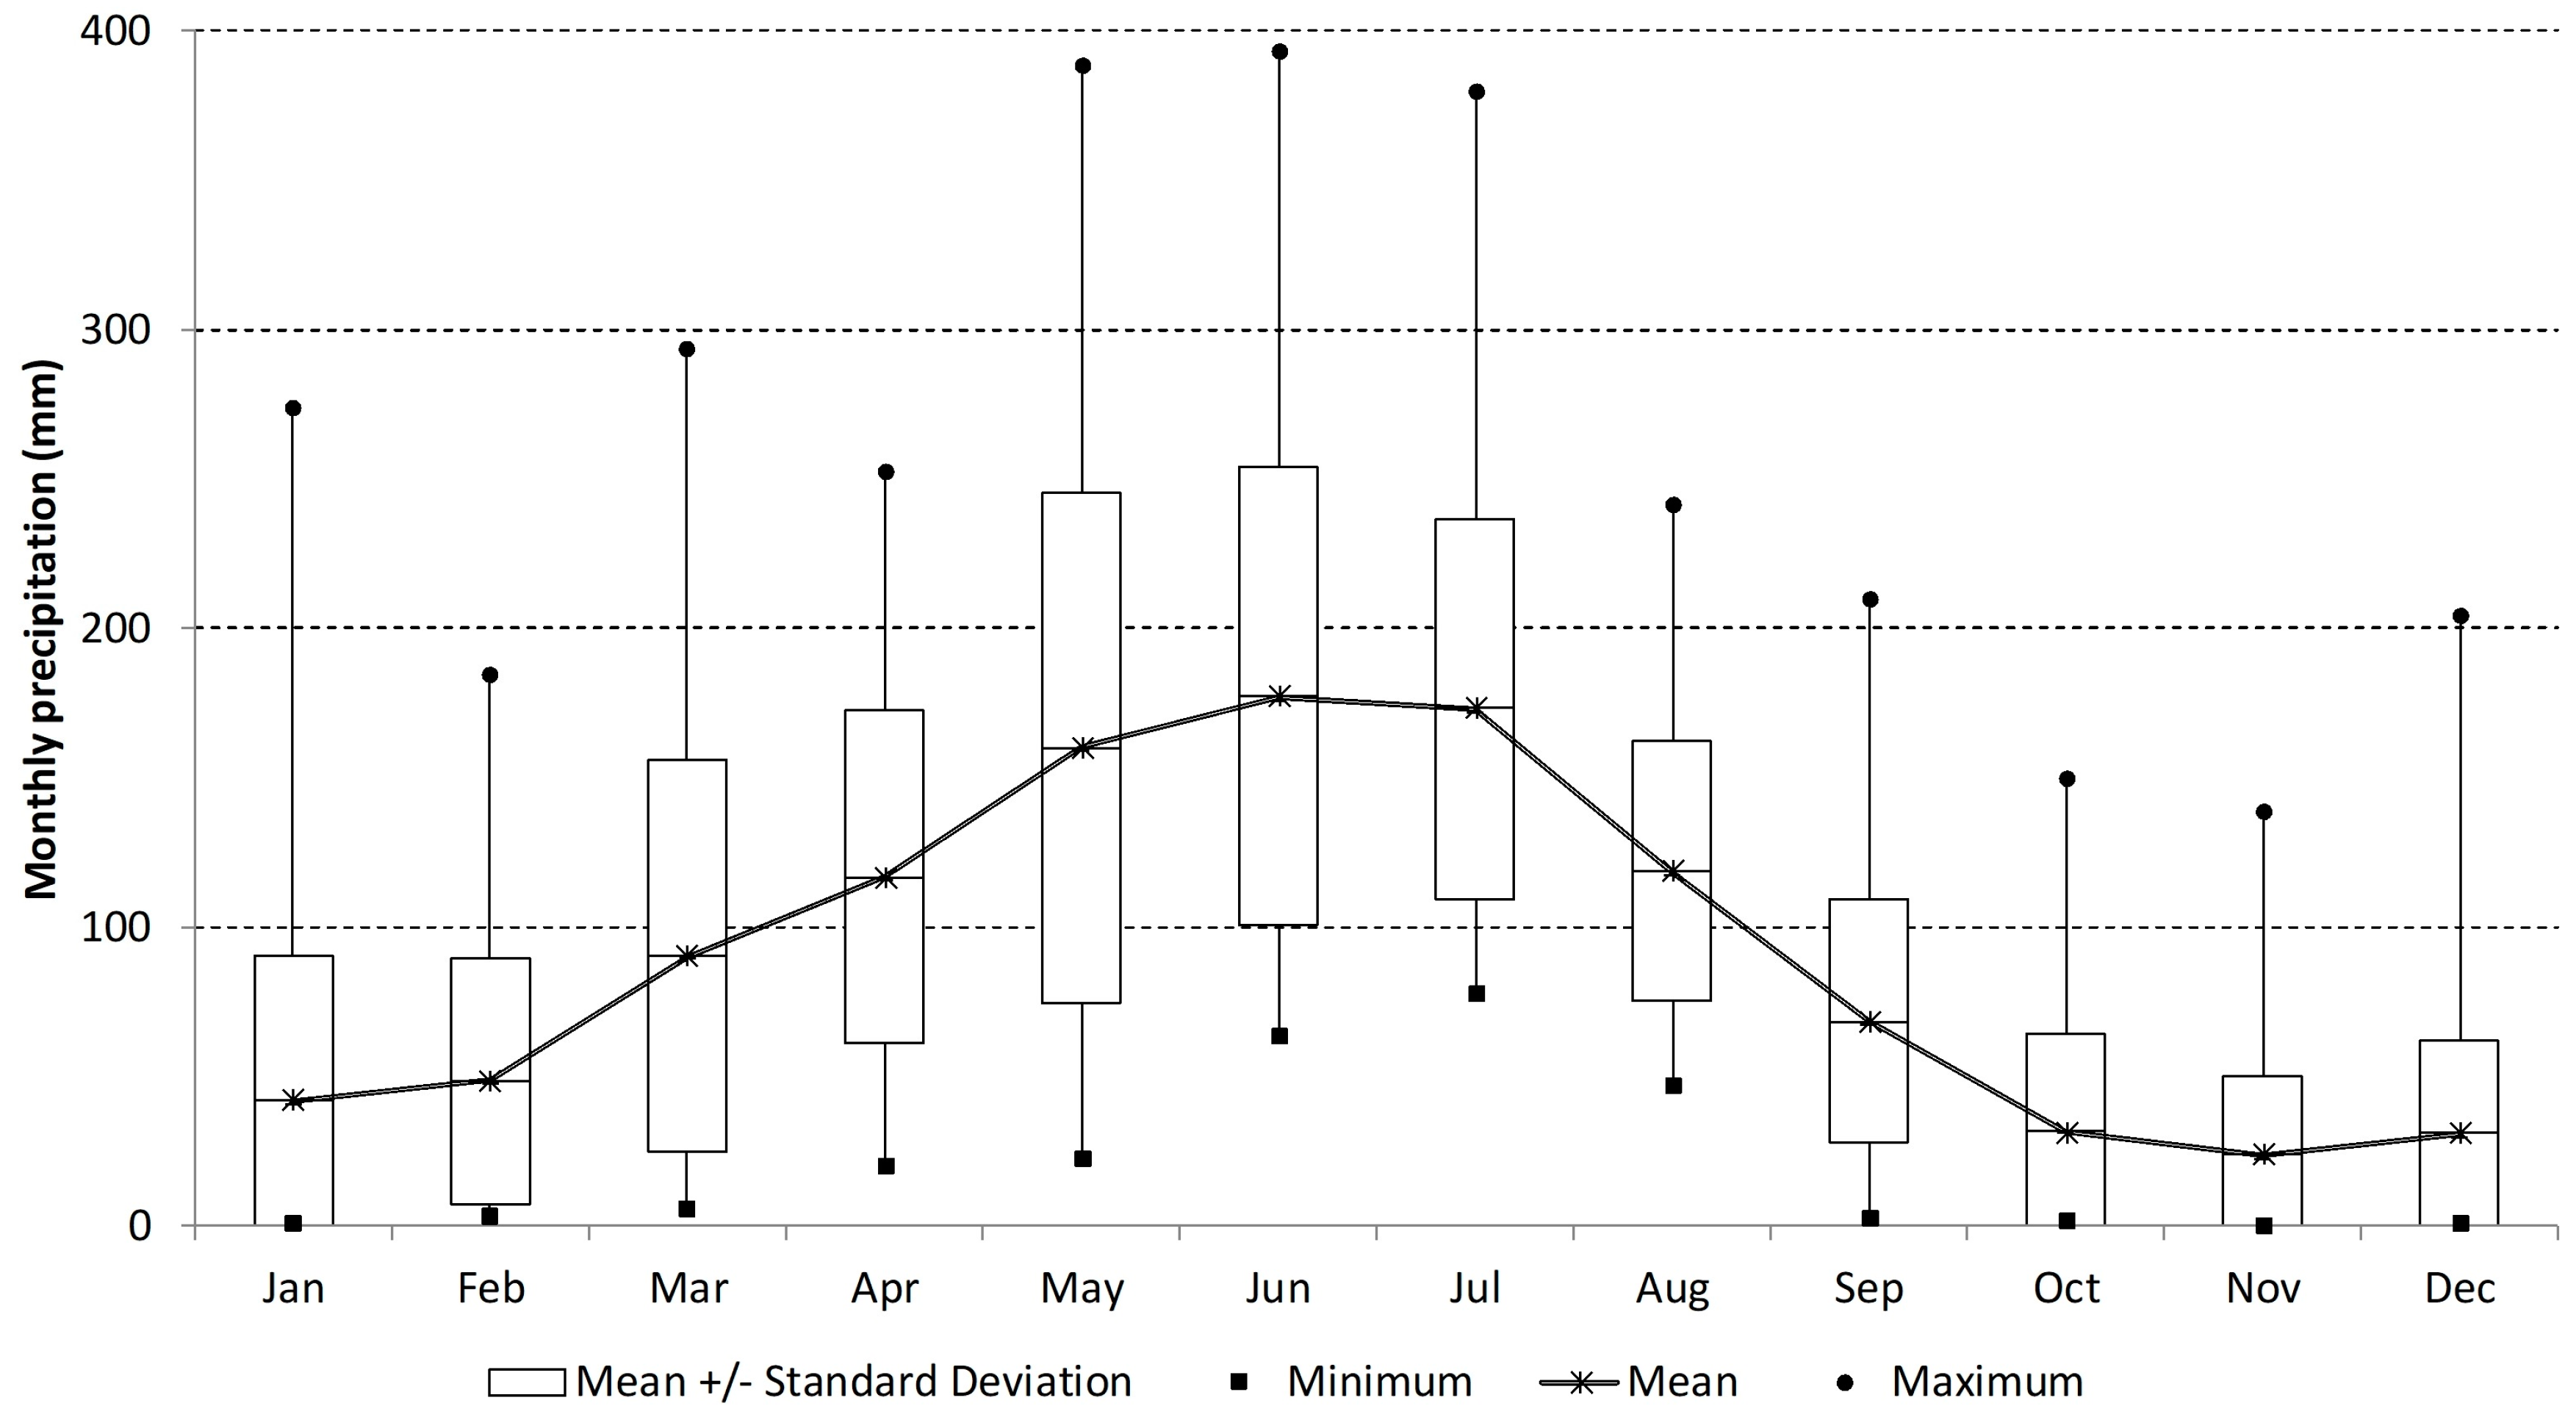
3.1. Variability Patterns of Precipitation in ENEB

To represent the overall variance of the OND precipitation, Ref. [29] have applied cluster analysis on the precipitation data after filtering them by means of Principal Component Analysis (PCA), preserving 75% of the original data variability. Their results pointed to two sub-regions of homogeneous precipitation variability (HG1 and HG2) which are presented in Figure 1b and are used in this work.
The CWT analysis for each Homogeneous Group (HG) shows the periodicity patterns of the SPI3* time series (Figure 3). For HG1, the CWT displayed high power with statistical significance mainly in low frequencies (10- to 16-year period) in the 1950s to 1980s period (Figure 3a). Significant power in high frequencies (2- to 5-year period) is also noticed in the 1980s to 2000s period.
The CWT for HG2 shows higher power in low frequency (10- to 15-year period) in the 1960s to 1990s period; however, this signal is not statistically significant (Figure 4a). Power spectrum with statistical significance can only be seen at a 6- to 8-year period during the 1990s.
Analyzing the SPI3* time series for HG1 (Figure 3b dashed line), it is possible to notice a remarkable periodicity of dry and wet cycles with a multiannual time scale. We have found cycles of around 15 years from 1947 to 1976, and cycles with higher magnitudes around 7–8 years from 1986, indicating an increase on the frequency of hydrological extreme events, mainly drought episodes. Indeed, these multiannual cycles have a high correspondence with the periodicity patterns found in Figure 3a, which clearly show cycles around 15 years before 1980s and a tendency of interannual periodicity after the 1980s.
On the other hand, it was not possible to identify an interannual-to-multiannual dominant time scale of the SPI3* for HG2 (Figure 4b dashed line). In this case, the SPI3* time series clearly show two distinguished cycles, a wetter multidecadal cycle from 1938 to 1977, when it changed to a drier one from 1977 to 2008, and with higher frequency. The lack of a significant power signal in low frequencies for HG2 (Figure 4a) may be explained by this multidecadal pattern observed in Figure 4b, where the size of the SPI3* time series obstructed the CWT from revealing periodicity signals lower than around 16-year period. This multidecadal cycle is coincident with PDO patterns, as described by Mantua et al. [35] and Lucena et al. [48]. These authors highlighted that the PDO had a phase changed from negative to positive values after 1970s, with direct impact on the occurrence of El Niño episodes, which is a well-known climate phenomena affecting the precipitation regime over the semiarid NEB [8,10,13,24,49]. Da Silva et al. [11] also suggested a possible influence of PDO on the variability of the rainy season of this region before and after the 1970s. Djebou [50] noticed similar patterns of increasing drought frequency in a watershed in the USA after the 1980s; however explaining that such changes does not necessarily mean dryer climatology, but may also result from interactions of global-scale and local scale phenomena [51], which could also account the regional differences found in our results between HG1 and HG2.

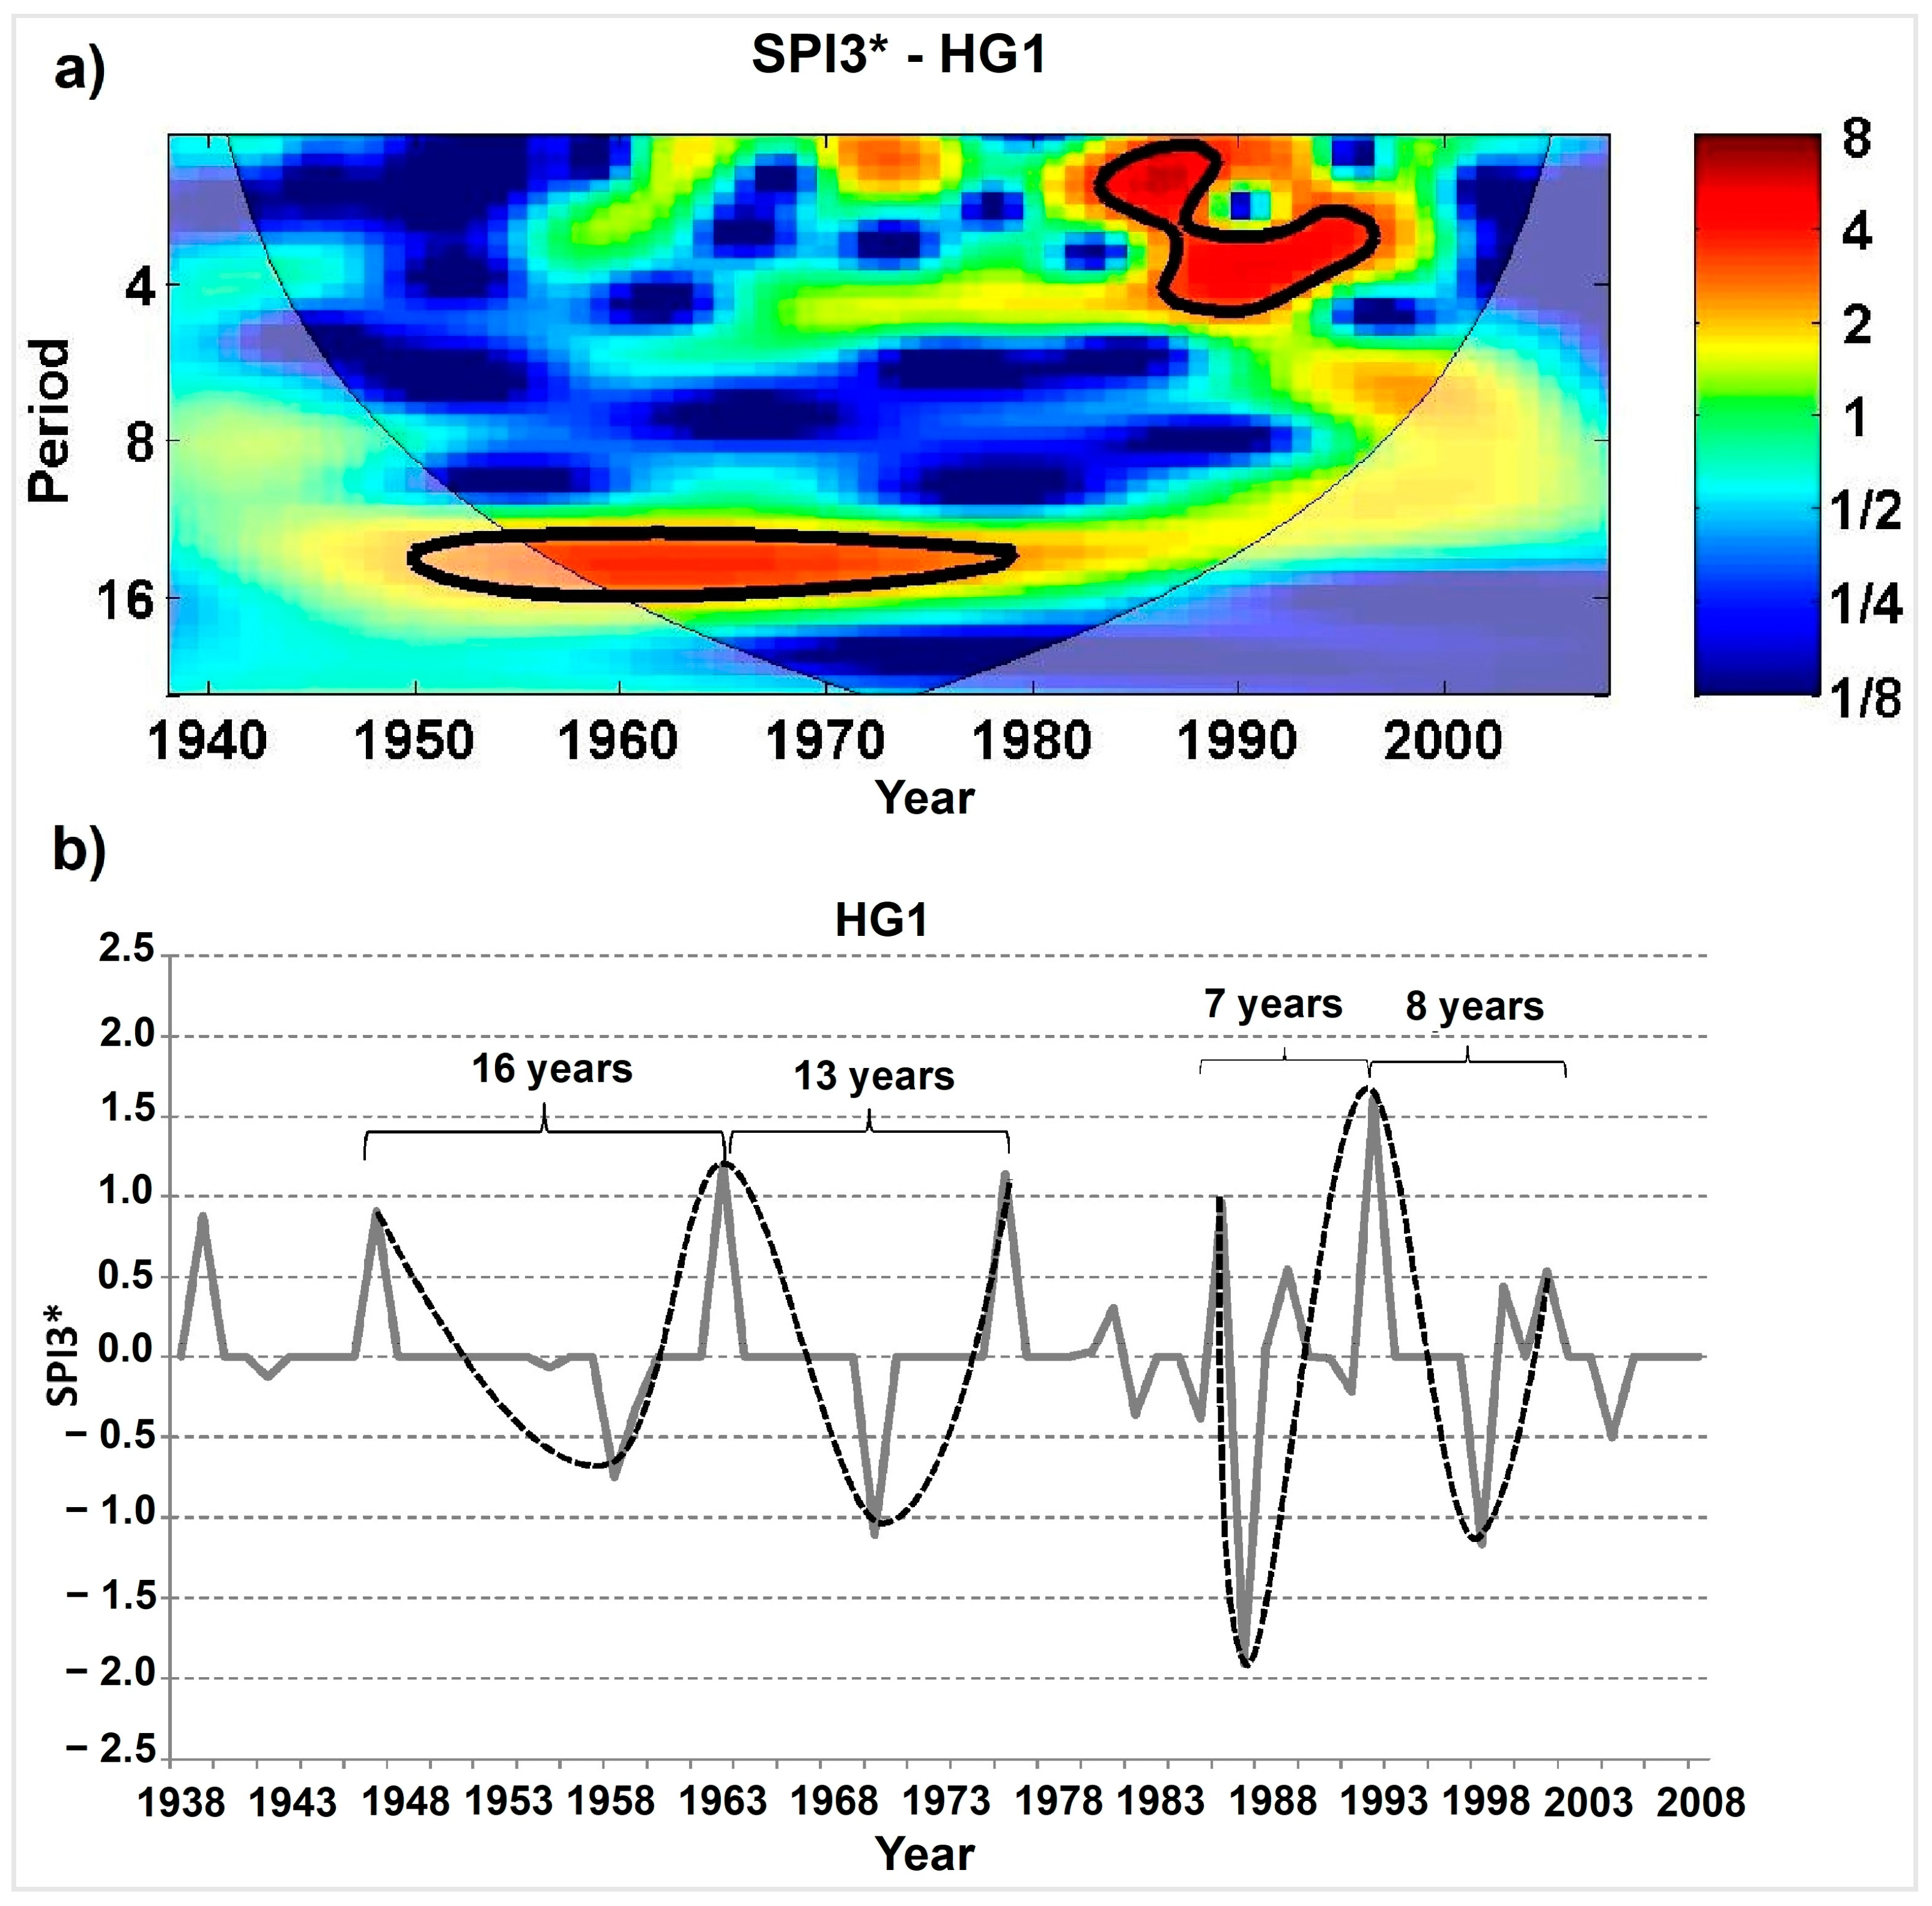
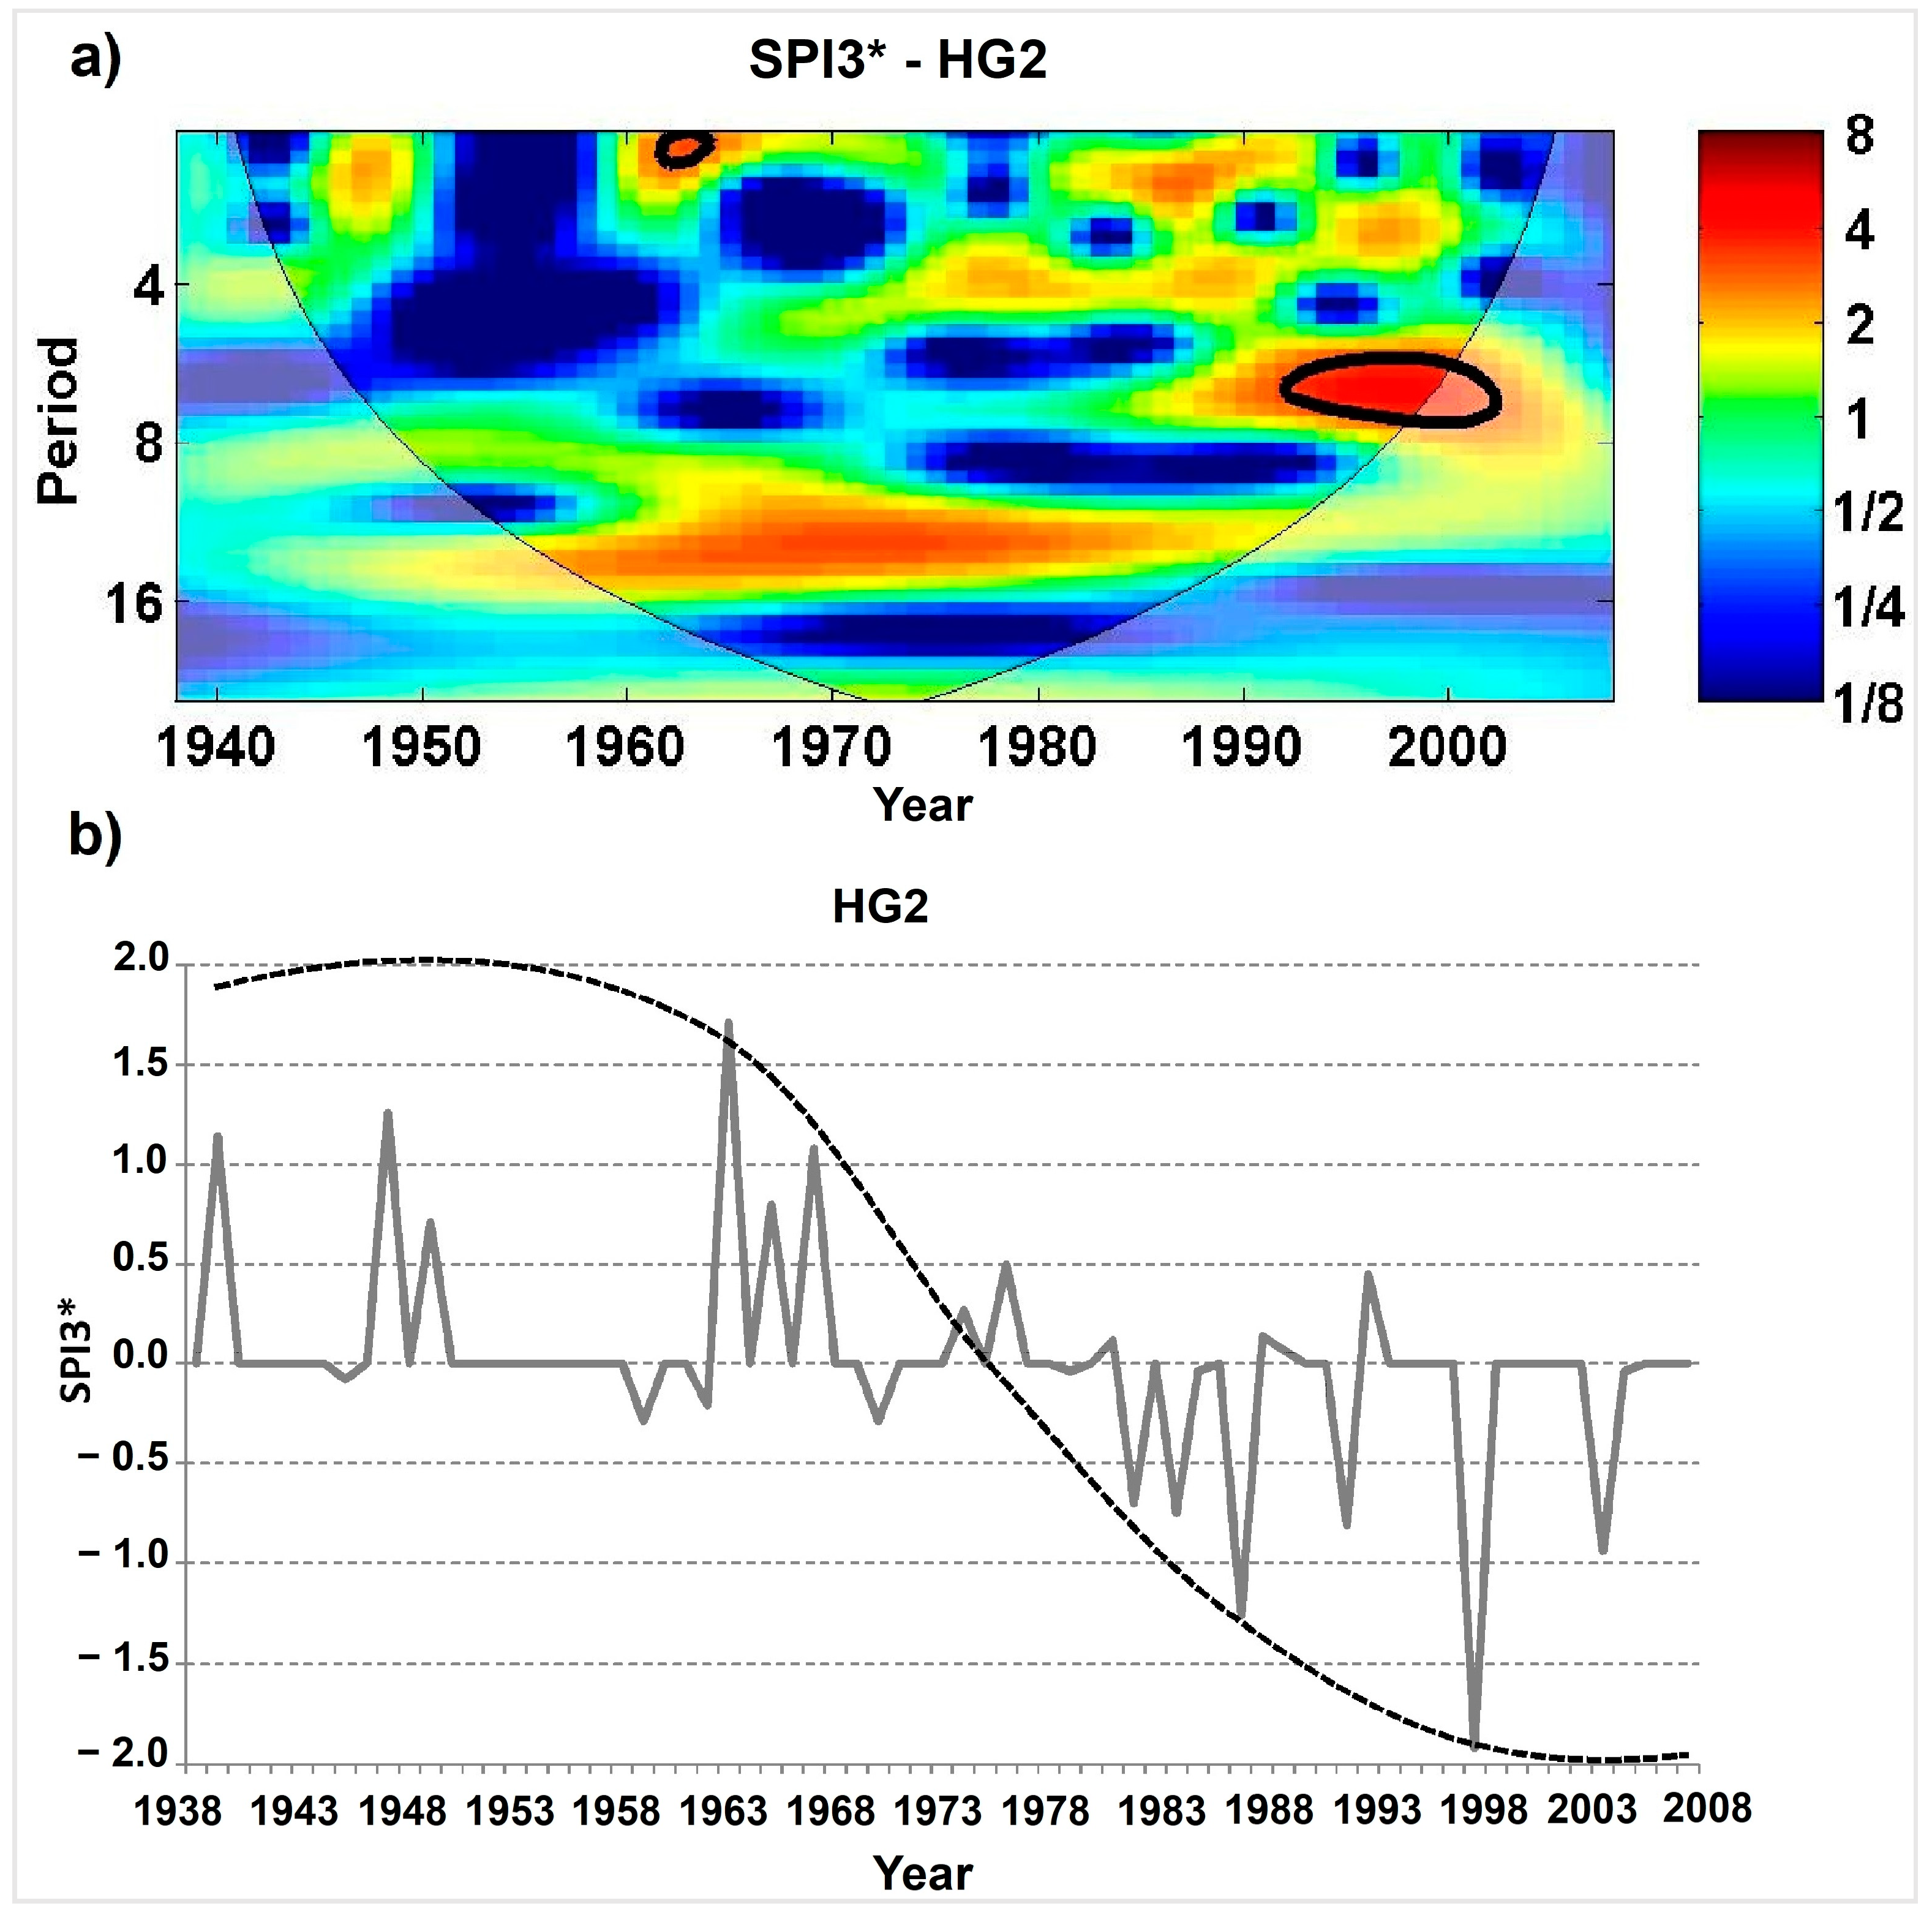
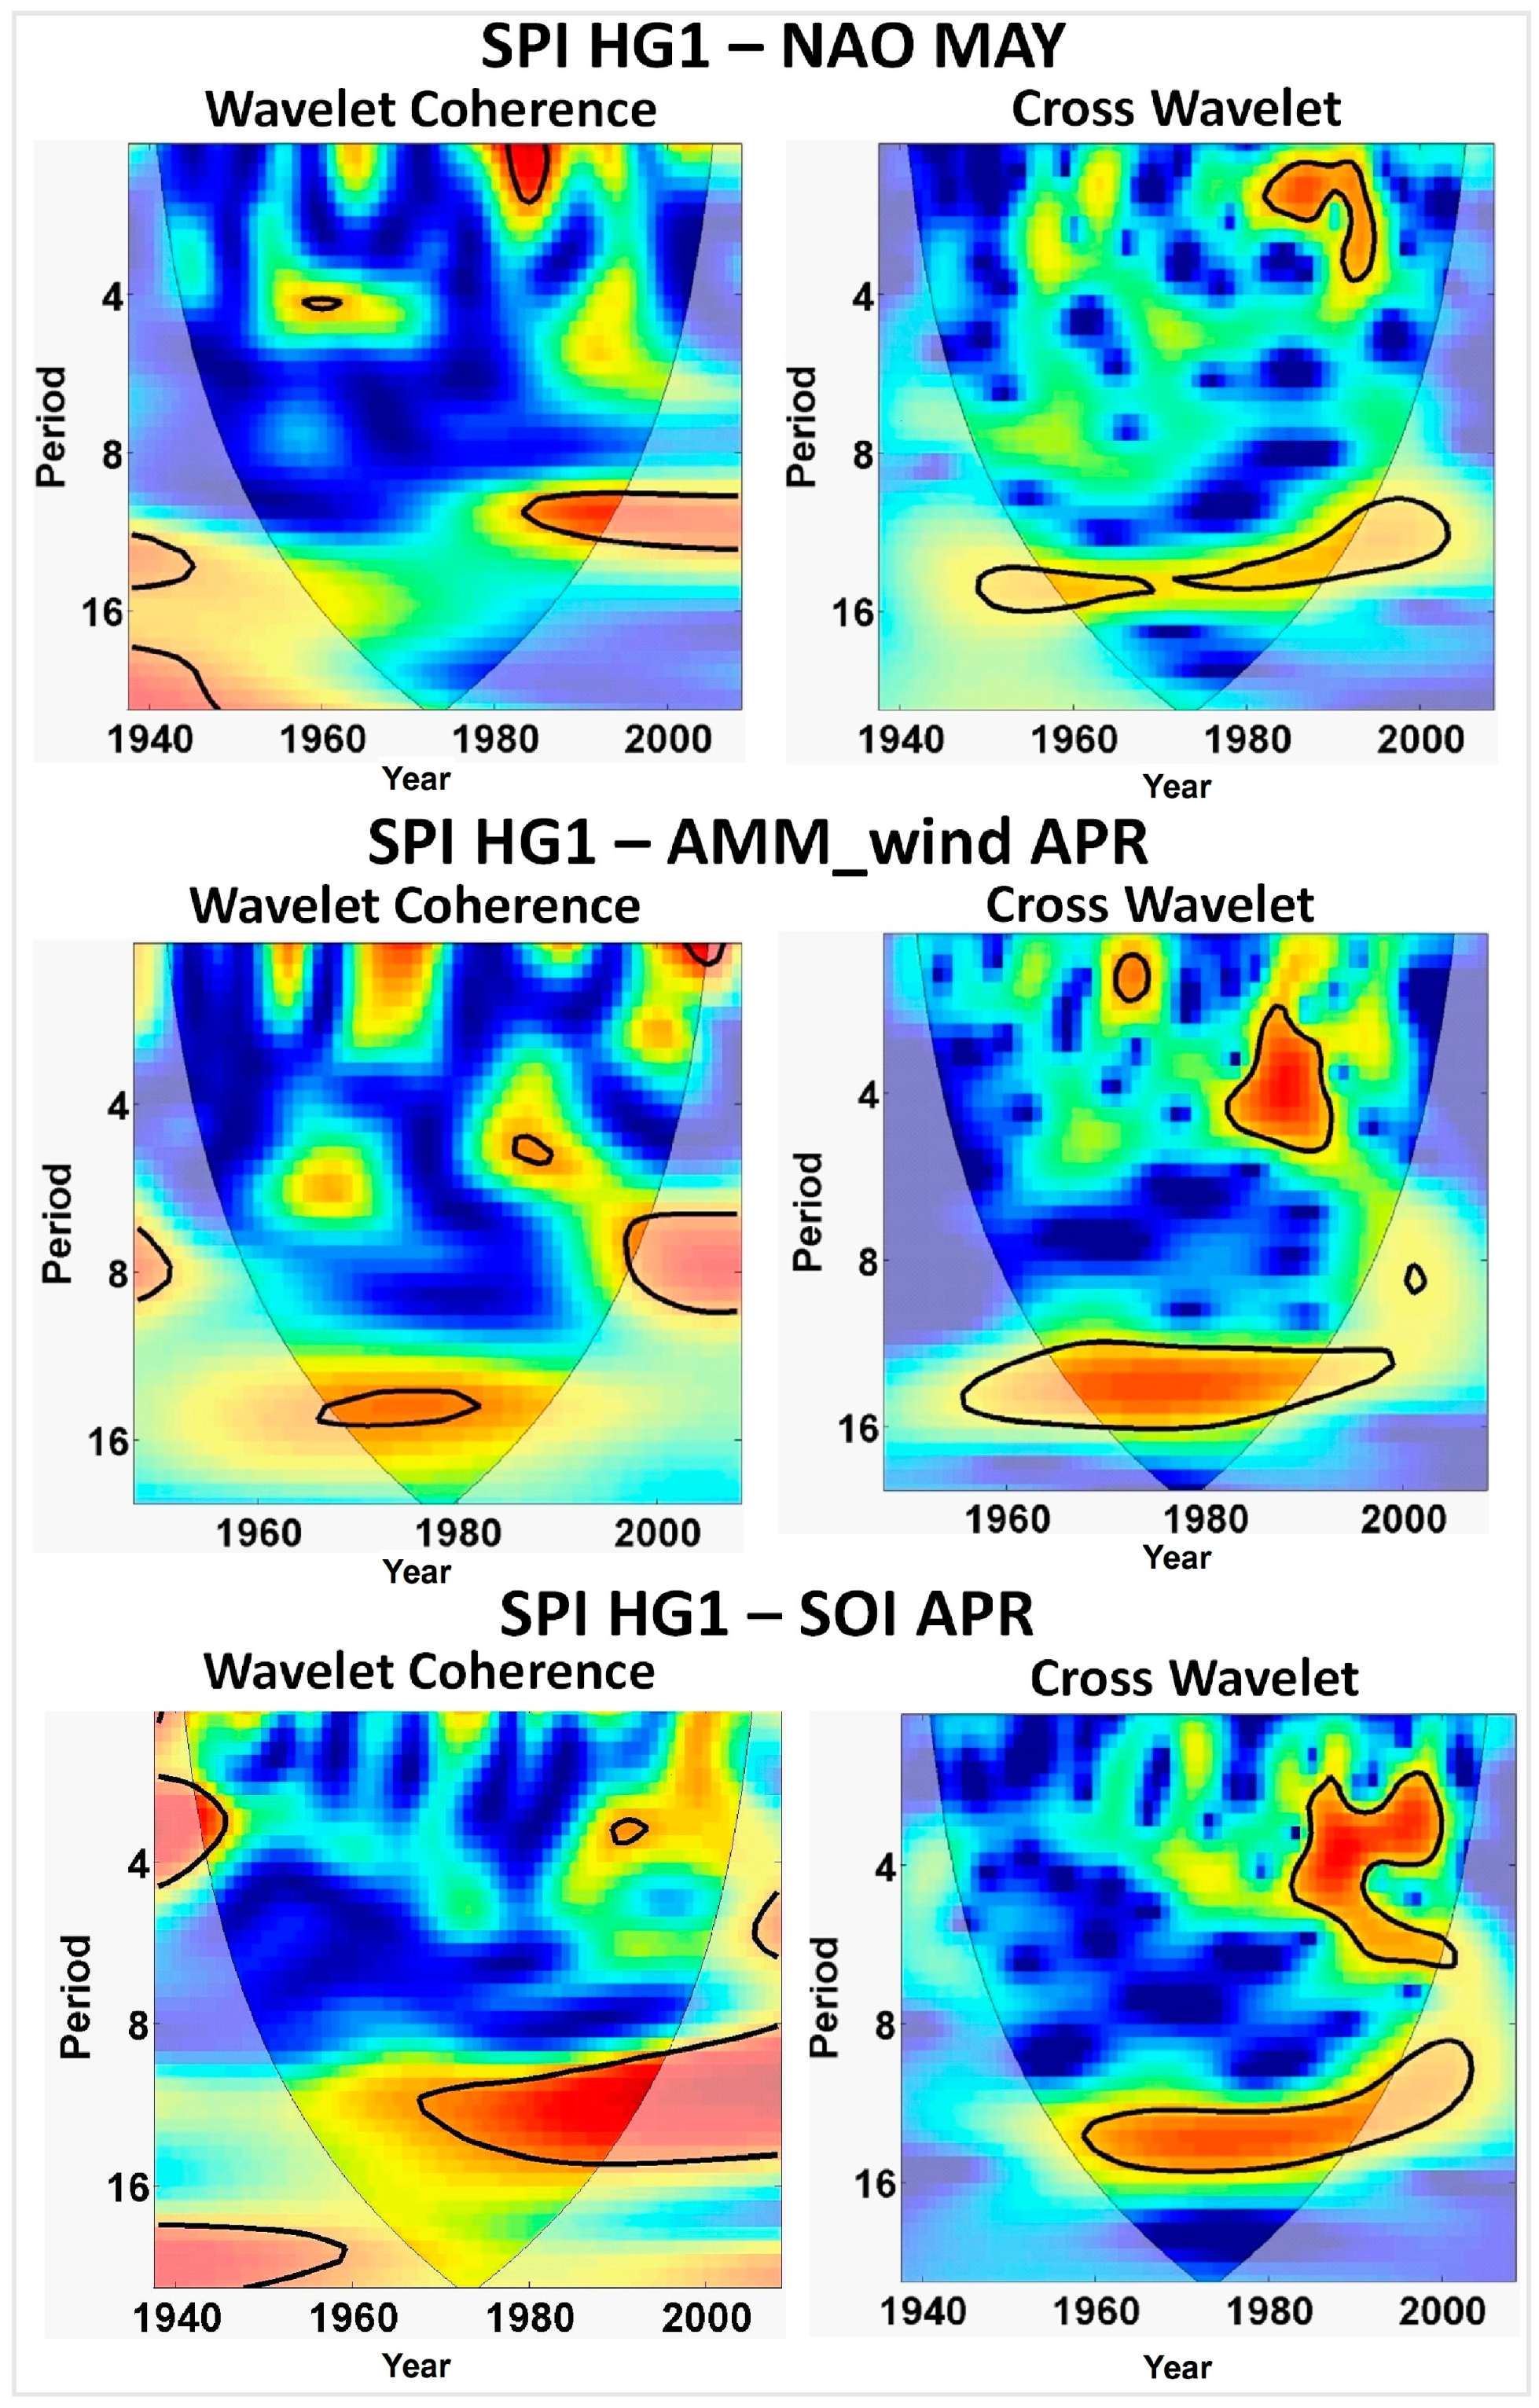
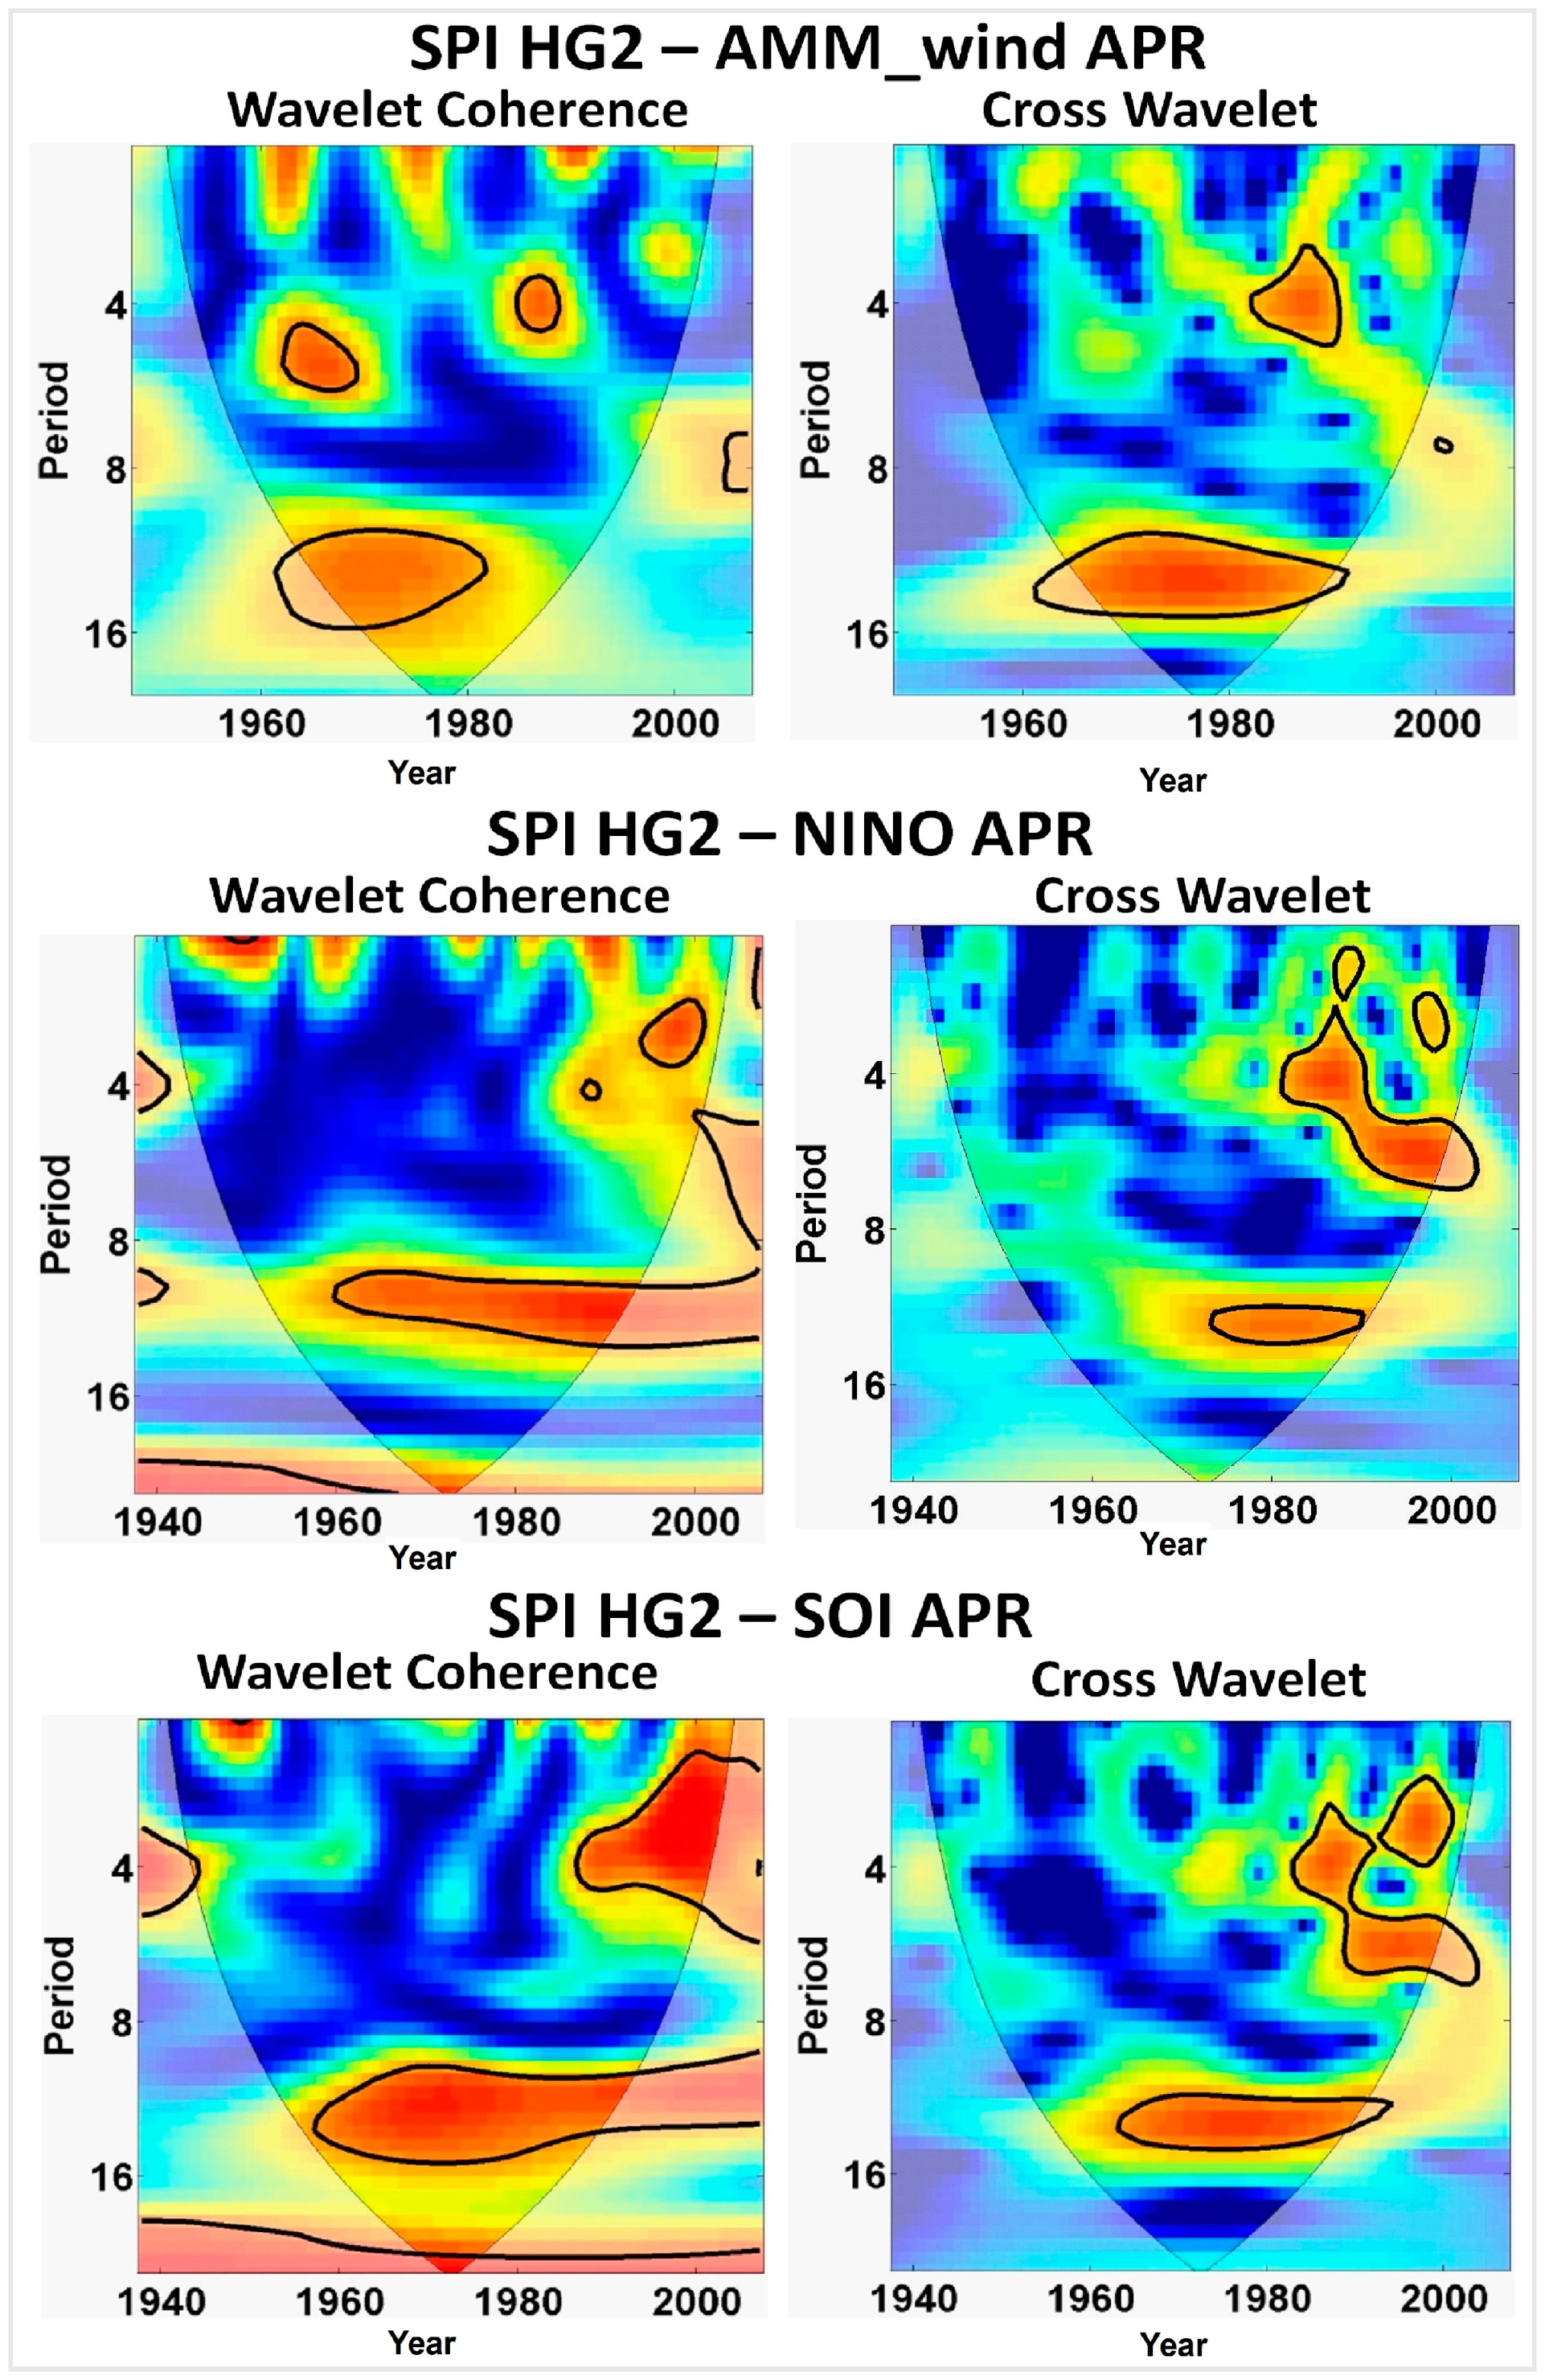
3.2. Effect of Large-Scale Climate Oscillation on ENEB Precipitation Variability

The XWT analysis revealed that the periodicity patterns of AMM-wind and SOI in April (i.e., 6 months before the dry season) influence the precipitation variability in both HG1 and HG2 (Figure 5 and Figure 6, right column respectively). This is shown by the significant high common power, predominantly in low frequencies (10- to 15-year period), from the 1960s to the 1990s in HG1 and mid-1960s to 2000 in HG2. A significant common power at high frequencies (2- to 5-year period) was also found for both HGs, but only from the 1980s to the 1990s. In addition, the local correlation, represented by the WTC power spectrum, confirms that high coherence values occur mainly at low frequencies (Figure 5 and Figure 6, left column, respectively). The effect of Niño 3.4 on precipitation variability of the HGs, is similar, in general, to the one of SOI in April. However, a significant relationship was only found for HG2 (Figure 6), accompanied by a slight reduction on the significant area of the diagram of common power/local correlation at both low and high frequencies, which may suggest that the SOI index is a better indicator of the influence of ENSO over the study area.
These results suggest that the state of both Atlantic and Pacific oceans can influence precipitation variability during the dry season in ENEB. The interannual-to-decadal variability of the AMM phase is directly associated with the ITCZ position over the tropical Atlantic [38], and hence with the variations in the rainy season of the NEB ([8,24], among many others). Our results also showed a possible influence of the AMM phase over the dry season of the region at multiannual time scale. Such influence was mainly noticed in the wind component of AMM in April than the SST component. Chiang and Vimont [38] observed that wind variance reaches its peak around the boreal spring (austral autumn, i.e., around April), and that there is a lag correlation of one month between wind and SST, where the wind may drive the SST variabilities. Our results also are in accordance with [13], which suggested that in the northern tropical Atlantic the trade winds precede the tropical basin wide SST anomalies. Therefore, the interannual-to-decadal variability of the AMM_wind seems to play an important role in modulating the SST conditions in the southern tropical Atlantic and consequently in the formation of drier or wetter periods during the dry season in ENEB.
ENSO episodes are also frequently associated with drought/rainy years over NEB [8,10,13,24,49]. Tedeschi et al. [52] showed that different types of ENSO (East or Central ENSO) together with its phase (El Niño or La Nina years) have different impacts in the rainy season of the NEB during the austral autumn and winter. However, as the ENSO phase might persist for a year or more, its effects may also be seen during the austral spring and summer, which agrees with our results, considering the periodicity pattern of the SOI index mainly at multiannual time scale. Tedeschi et al. [53] also studied the influence of ENSO during the austral spring and summer in South America, but their findings revealed a higher influence of ENSO in central and southern Brazil, when it is the rainy season of those regions. Nevertheless, they also pointed out that during the occurrence of Central ENSO episodes, the rainfall over tropical South America may also be affected, suggesting that ENSO might also have a long-term relationship with drier or wetter years during the dry season in ENEB.
The time-frequency analysis also indicated that the NAO index may influence SPI3* in HG1. The XWT analysis (Figure 5, right column) shows that SPI3* and NAO have significant common power mainly in low frequencies (10- to 16-year period) from the 1950s to the 2000s. A common power in high frequencies is only noticed during a short period from the 1980s to the 1990s at a 2- to 4-year period. However, the WTC spectrum (Figure 5, left column) depicts a highly significant local correlation only between the 1980s to the mid-1990s (10- to 12-year period). The NAO phase is strongly related to the interannual variability of the Northern Hemispheric, such as in droughts and floods [54,55]. However, studies have also suggested that the NAO may remotely influence the SST conditions in the tropical Atlantic [56,57,58], with evidence of anomalies during the rainy season of the NEB [59].
Lucena et al. [48] suggested that the climate in the NNEB is subject to low frequencies variability influenced by the Northern Atlantic, but also clarify that after 1970s both NAO and PDO presented a long-term change on their phases, resulting in more extreme events in the NEB, but also inhibiting their indirect influence in the NNEB. Our results also indicated a remarkable change in SPI3* values after the 1970s for HG1, which also presented higher peaks (Figure 3b) in comparison with HG2, and a significant local correlation of WTC coherence spectrum between NAO and SPI3* (Figure 5, left column).
The absence of an XWT/WTC power signal between NAO and SPI3* at HG2 might be related with the inhibition suggested by Lucena et al. [48], caused by the PDO-NAO signal changes, since HG2 is mostly inserted in the semiarid region, close to the NNEB region. Moreover, SPI3* time series present cycles coincident with the PDO patterns, as discussed before and showed in Figure 4b. In general, it seems that the NAO might have a secondary role in precipitation variability during the dry season in the ENEB as previously suggested by Costa et al. [29] by means of an interhemispheric connection [5,38,51,56].

4. Conclusions

Global climate phenomena play an important role over the rainy season variability of ENEB [18,19,30,31]. However, this work has also shown that the periodicity modes of precipitation during the dry season in the ENEB, or more specifically in its central parts, is also affected by large-scale climate factors.
Cycles of variability were identified, mainly in a multiannual scale, underlining a temporal dependency related to the state of the Pacific and Atlantic oceans. Such temporal dependency suggests a long-term effect of both ocean’s conditions over the dry season of the region with periodicity modes of 12- to 15-year duration. Moreover, our results indicated that the states of both ENSO and AMM seems to be potential indicators in predicting precipitation anomalies during the dry season over the ENEB. The effect of the NAO on precipitation variability during the dry season was not too clear, but its anomaly might be linked to the increase of frequency of extreme events in the HG1 after the 1980s. On the other hand, it may be acting in the opposite way in the semiarid region [48]. Therefore, further investigation is needed to reveal the role of the NAO in the precipitation variability of ENEB.
A remarkable multidecadal pattern was also observed in the precipitation time series during the dry season of the ENEB, although no strong signal was captured by wavelet analysis with indices such as PDO and AMO. The size of the precipitation time series probably creates a limitation on catching low-frequency signals beyond the 16-year period. However, such multidecadal cycles of around 20 years, mainly for the semiarid region, are similar to the PDO variations [35,48], which may indicate an influence of the PDO on precipitation variability during the dry season in the ENEB.
In general, this work may contribute to the improving of the understanding of how climate variability may impact precipitation during dry season in the ENEB. The study area has a high dependency of precipitation conditions throughout the year, with direct effects over basic activities developed in the ENEB (e.g., rainfed agriculture and livestock activities). Thus, a better comprehension of interactions between global climate oscillations and local precipitation regime may lead to new perspectives in drought management. Besides that, the results also showed the possibility of developing a long-term forecasting system, which might support decision-making on water resources management, avoiding conflicts and reducing socio-economic losses caused by droughts.

Author Contributions

T.A.d.S.P. and D.D.C. developed the study conception and design. T.A.d.S.P., D.D.C., C.R.F.J. and C.B.U. responsible for the construction and validation of the dataset. T.A.d.S.P., D.D.C., C.R.F.J., S.M.G.L.M. and C.B.U. analysis and interpretation of dataset, critical revision, discussion and conclusions. D.D.C. finalized the manuscript. All authors read and approved the manuscript.

Funding

The author D.D.C. would like to thank CAPES Foundation, Ministry of Education of Brazil by the scholarship granted [Grant nº BEX 13470/13-2]. S.M.G.L.M. would like to thank the Conselho Nacional de Desenvolvimento Científico e Tecnologico (CNPq) for the PQ grant. We also are grateful to institutional grants provided from The Swedish Research Council (Vetenskapsrådet) through Research Links Project, which funded the international cooperation among Lund University and Federal University of Alagoas, and partially financed C. B. Uvo.

Acknowledgments

The authors would like to thank the anonymous reviewers, who contributed significantly to improve the quality and clarity of this work.

Conflicts of Interest

The authors declare no conflict of interest.

References

  1. Panagoulia, D.; Dimou, G. Sensitivity of flood events to global climate change. J. Hydrol. 1997, 191, 208–222. [Google Scholar] [CrossRef]
  2. Panagoulia, D. Artificial neural networks and high and low flows in various climate regimes. Hydrol. Sci. J. 2006, 51, 563–587. [Google Scholar] [CrossRef] [Green Version]
  3. Paz, A.R.; Uvo, C.B.; Bravo, J.M.; Collischonn, W.; da Rocha, H.R. Seasonal precipitation Forecast Based on Artificial Neural Network. In Computational Methods for Agricultural Research: Advances and Applications; Prado, H.A., Chaib Filho, H., Luiz, A.J.B., Eds.; Hershey: New York, NY, USA, 2011; Chapter 16; pp. 326–354. ISBN 978-1-61692-873-5. [Google Scholar]
  4. Wang, Y.; Zhang, J.; Guo, E.; Dong, Z.; Quan, L. Estimation of variability characteristics of regional drought during 1964-2013 in Horqin Sandy Land, China. Water 2016, 8, 543. [Google Scholar] [CrossRef]
  5. Garcia, B.N.; Libonati, R.; Nunes, A. Extreme drought events over the Amazon basin: The perspective from the reconstruction of South American hydroclimate. Water 2018, 10, 1594. [Google Scholar] [CrossRef]
  6. Sena, A.; Barcellos, C.; Freitas, C.; Corvalan, C. Managing the Health Impacts of Drought in Brazil. Int. J. Environ. Res. Public Health 2014, 11, 10737–10751. [Google Scholar] [CrossRef] [PubMed] [Green Version]
  7. Cunha, A.P.M.; Alvalá, R.C.; Nobre, C.A.; Carvalho, M.A. Monitoring vegetative drought dynamics in the Brazilian semiarid region. Agric. For. Meteorol. 2015, 214–215, 494–505. [Google Scholar] [CrossRef]
  8. Uvo, C.B.; Repelli, C.A.; Zebiak, S.E.; Kushnir, Y. The relationships between tropical Pacific and Atlantic SST and northeast Brazil monthly precipitation. J. Clim. 1998, 11, 551–562. [Google Scholar] [CrossRef]
  9. Molion, L.C.B.; Bernardo, S.O. Uma revisão da dinâmica das chuvas no Nordeste Brasiliero. Rev. Bras. Meteorol. 2002, 17, 1–10. [Google Scholar]
  10. Giannini, A.; Saravanan, R.; Chang, P. The preconditioning role of Tropical Atlantic Variability in the development of the ENSO teleconnection: Implications for the prediction of Nordeste rainfall. Clim. Dyn. 2004, 22, 839–855. [Google Scholar] [CrossRef]
  11. Marengo, J.A.; Torres, R.R.; Alves, L.M. Drought in Northeast Brazil—Past, present, and future. Theor. Appl. Climatol. 2017, 129, 1189–1200. [Google Scholar] [CrossRef]
  12. Monte, B.E.O.; Costa, D.D.; Chaves, M.B.; de Oliveira Magalhães, L.; Uvo, C.B. Hydrological and hydraulic modelling applied to the mapping of flood-prone areas. Rev. Bras. Recur. Hídricos 2016, 21, 152–167. [Google Scholar] [CrossRef]
  13. Nobre, P.; Srukla, J. Variations of Sea Surface Temperature, Wind Stress, and Rainfall over the Tropical Atlantic and South America. J. Clim. 1996, 9, 2464–2479. [Google Scholar] [CrossRef] [Green Version]
  14. Andreoli, R.V.; Kayano, M.T. ENSO-related rainfall anomalies in South America and associated circulation features during warm and cold Pacific decadal oscillation regimes. Int. J. Climatol. 2005, 25, 2017–2030. [Google Scholar] [CrossRef] [Green Version]
  15. Da Silva, D.F.; Kayano, M.T.; de Sousa, F.D. Escalar temporais da Variabilidade Pluviométrica na bacia do hidrográfica do rio Mundaú. Rev. Bras. Meteorol. 2010, 25, 324–332. [Google Scholar] [CrossRef]
  16. Uvo, C.B.; Berndtsson, R. Regionalization and Spatial properties of Ceará State Rainfall in Northeast Brazil. J. Geophys. Res. 1996, 101, 4221–4233. [Google Scholar] [CrossRef]
  17. Andreoli, R.V. Multi-scale variability of the sea surface temperature in the Tropical Atlantic. J. Geophys. Res. 2004, 109, 1–12. [Google Scholar] [CrossRef]
  18. Amorim, A.C.B.; Chaves, R.R.; Silva, C.M.S. Influence of the Tropical Atlantic Ocean’s Sea Surface Temperature in the Eastern Northeast Brazil Precipitation. Atmos. Clim. Sci. 2014, 4, 874–883. [Google Scholar] [CrossRef]
  19. Gomes, H.B.; Ambrizzi, T.; Herdies, D.L.; Hodges, K.; Francisco, B. Easterly Wave Disturbances over Northeast Brazil: An Observational Analysis. Adv. Meteorol. 2015, 2015, 1–20. [Google Scholar] [CrossRef]
  20. Rao, V.B.; De Lima, M.C.; Franchito, S.H. Seasonal and interannual variations of rainfall over eastern northeast Brazil. J. Clim. 1993, 6, 1754–1763. [Google Scholar] [CrossRef]
  21. Costa, D.D.; Uvo, C.B.; Rolim da Paz, A.; de Oliveira Carvalho, F.; Fragoso, C.R., Jr. Long-term relationships between climate oscillation and basin-scale hydrological variability during rainy season in eastern Northeast Brazil. Hydrol. Sci. J. 2018, 63, 1636–1652. [Google Scholar] [CrossRef]
  22. Kane, R.P. Prediction of droughts in north-east Brazil: Role of ENSO and use of periodicities. Int. J. Climatol. 1997, 17, 655–665. [Google Scholar] [CrossRef]
  23. Andreoli, R.V.; Kayano, M.T.; Guedes, R.L.; Oyama, M.D.; Alves, M.A.S. A influência da temperatura da superfície do mar dos Oceanos Pacifico e Atlântico na variabilidade de precipitação em Fortaleza. Rev. Bras. Meteorol. 2004, 19, 337–344. [Google Scholar]
  24. Andreoli, R.V.; Kayano, M.T. Tropical Pacific and South Atlantic effects on rainfall variability over Northeast Brazil. Int. J. Climatol. 2006, 26, 1895–1912. [Google Scholar] [CrossRef] [Green Version]
  25. Dos Santos, C.A.; Manzi, A.O. Eventos extremos de precipitação no estado do Ceará e suas relações com a temperatura dos oceanos tropicais. Rev. Bras. Meteorol. 2011, 26, 157–165. [Google Scholar] [CrossRef] [Green Version]
  26. Hastenrath, S. Exploring the climate problems of Brazil’s Nordeste: A review. Clim. Chang. 2012, 112, 243–251. [Google Scholar] [CrossRef]
  27. Geber, B.D.; de Aragão, J.O.; de Melo, J.S.; da Silva, A.P.; Giongo, P.R.; Lacerda, F.F. Relação entre a precipitação do leste do Nordeste do Brasil e a temperatura dos oceanos. Rev. Bras. Eng. Agrícola Ambient. 2009, 13, 462–469. [Google Scholar] [CrossRef] [Green Version]
  28. Guedes, R.V.D.S. Análise e Previsão de Eventos Críticos de Precipitação com Base no SPI e em Redes Neurais Artificiais para o Estado de Pernambuco. Ph.D. Thesis, Federal University of Campina Grande, Campina Grande, Brazil, 18 December 2015. [Google Scholar]
  29. Costa, D.D.; da Silva Pereira, T.A.; Fragoso, C.R.; Madani, K.; Uvo, C.B. Understanding Drought Dynamics during Dry Season in Eastern Northeast Brazil. Front. Earth Sci. 2016, 4, 39. [Google Scholar] [CrossRef]
  30. Da Silva, D.F. Aplicação de Anàlises de Ondaletas para Detecção de Ciclos e Extremos Pluviomëtricos no Leste do Nordeste do Brasil. Rev. Bras. Meteorol. 2017, 32, 187–198. [Google Scholar] [CrossRef]
  31. Kouadio, Y.K.; Servain, J.; MacHado, L.A.T.; Lentini, C.A.D. Heavy rainfall episodes in the eastern northeast brazil linked to large-scale ocean-atmosphere conditions in the tropical atlantic. Adv. Meteorol. 2012, 2012, 1–16. [Google Scholar] [CrossRef]
  32. Kousky, V.E. Frontal Influences on Northeast Brazil. Mon. Weather Rev. 1979, 107, 1140–1153. [Google Scholar] [CrossRef] [Green Version]
  33. Peel, M.C.; Finlayson, B.L.; McMahon, T.A. Updated world map of the Köppen-Geiger climate classification. Hydrol. Earth Syst. Sci. 2007, 11, 1633–1644. [Google Scholar] [CrossRef]
  34. Trenberth, K.E. The Definition of El Niño. Bull. Am. Meteorol. Soc. 1997, 78, 2771–2777. [Google Scholar] [CrossRef] [Green Version]
  35. Mantua, N.J.; Hare, S.R.; Zhang, Y.; Wallace, J.M.; Francis, R.C. A Pacific interdecadal climate oscillation with impacts on salmon production. Bull. Am. Meteorol. Soc. 1997, 78, 1069–1079. [Google Scholar] [CrossRef]
  36. Hurrell, J.W. Decadal trends in the North Atlantic Oscillation: Regional temperatures and precipitation. Science 1995, 269, 676–679. [Google Scholar] [CrossRef] [PubMed]
  37. Schlesinger, M.E.; Ramankutty, N. An oscillation in the global climate system of period 65–70 years. Nature 1994, 367, 723–726. [Google Scholar] [CrossRef]
  38. Chiang, J.C.H.; Vimont, D.J. Analogous Pacific and Atlantic meridional modes of tropical atmosphere-ocean variability. J. Clim. 2004, 17, 4143–4158. [Google Scholar] [CrossRef]
  39. Mckee, T.B.; Doesken, N.J.; Kleist, J. The relationship of drought frequency and duration to time scales. In Proceedings of the AMS 8th Conference on Applied Climatology, Anaheim, CA, USA, 17–22 January 1993; pp. 179–184. [Google Scholar]
  40. Agnew, C.T. Using the SPI to Identify Drought. Drought Netw. News 2000, 12, 6–12. [Google Scholar]
  41. Jevrejeva, S.; Moore, J.C.; Grinsted, A. Influence of the Arctic Oscillation and El Niño-Southern Oscillation (ENSO) on ice conditions in the Baltic Sea: The wavelet approach. J. Geophys. Res. 2003, 108, 1–11. [Google Scholar] [CrossRef]
  42. Maraun, D.; Kurths, J. Cross wavelet analysis: Significance testing and pitfalls. Nonlinear Process. Geophys. 2004, 11, 505–514. [Google Scholar] [CrossRef] [Green Version]
  43. Labat, D. Cross wavelet analyses of annual continental freshwater discharge and selected climate indices. J. Hydrol. 2010, 385, 269–278. [Google Scholar] [CrossRef]
  44. Grossmann, A.; Morlet, J. Decomposition of Hardy Functions into Square Integrable Wavelets of Constant Shape. SIAM J. Math. Anal. 1984, 15, 723–736. [Google Scholar] [CrossRef]
  45. Torrence, C.; Compo, G.P. A Practical Guide to Wavelet Analysis. Bull. Am. Meteorol. Soc. 1998, 79, 61–78. [Google Scholar] [CrossRef] [Green Version]
  46. Grinsted, A.; Moore, J.C.; Jevrejeva, S. Application of the cross wavelet transform and wavelet coherence to geophysical time series. Nonlinear Process. Geophys. 2004, 11, 561–566. [Google Scholar] [CrossRef] [Green Version]
  47. Liu, Y.; Brown, J.; Demargne, J.; Seo, D.J. A wavelet-based approach to assessing timing errors in hydrologic predictions. J. Hydrol. 2011, 397, 210–224. [Google Scholar] [CrossRef]
  48. Lucena, D.B.; Servain, J.; Gomes Filho, M.F. Rainfall Response in Northeast Brazil from Ocean Climate Variability during the Second Half of the Twentieth Century. J. Clim. 2011, 24, 6174–6184. [Google Scholar] [CrossRef]
  49. Saravanan, R.; Chang, P. Interaction between Tropical Atlantic Variability and El Niño—Southern Oscillation. J. Clim. 2000, 13, 2177–2194. [Google Scholar] [CrossRef]
  50. Sohoulande Djebou, D.C. Bridging drought and climate aridity. J. Arid Environ. 2017, 144, 170–180. [Google Scholar] [CrossRef]
  51. Sohoulande Djebou, D.C. Spectrum of climate change and streamflow alteration at a watershed scale. Environ. Earth Sci. 2017, 76, 1–13. [Google Scholar] [CrossRef]
  52. Tedeschi, R.G.; Grimm, A.M.; Cavalcanti, I.F.A. Influence of Central and East ENSO on precipitation and its extreme events in South America during austral autumn and winter. Int. J. Climatol. 2016, 36, 4797–4814. [Google Scholar] [CrossRef]
  53. Tedeschi, R.G.; Grimm, A.M.; Cavalcanti, I.F.A. Influence of Central and East ENSO on extreme events of precipitation in South America during austral spring and summer. Int. J. Climatol. 2015, 35, 2045–2064. [Google Scholar] [CrossRef]
  54. Uvo, C.B. Analysis and regionalization of northern European winter precipitation based on its relationship with the North Atlantic oscillation. Int. J. Climatol. 2003, 23, 1185–1194. [Google Scholar] [CrossRef] [Green Version]
  55. Berton, R.; Driscoll, C.T.; Adamowski, J.F. The near-term prediction of drought and flooding conditions in the northeastern United States based on extreme phases of AMO and NAO. J. Hydrol. 2017, 553, 130–141. [Google Scholar] [CrossRef]
  56. Robertson, A.W.; Mechoso, C.R.; Kim, Y.-J. The Influence of Atlantic Sea Surface Temperature Anomalies on the North Atlantic Oscillation. J. Clim. 2000, 13, 122–138. [Google Scholar] [CrossRef]
  57. Mo, K.C.; Hakkinen, S. Interannual variability in the tropical Atlantic and linkages to the Pacific. J. Clim. 2001, 14, 2740–2762. [Google Scholar] [CrossRef]
  58. Czaja, A.; Van der Vaart, P.; Marshall, J. A diagnostic study of the role of remote forcing in tropical Atlantic variability. J. Clim. 2002, 15, 3280–3290. [Google Scholar] [CrossRef]
  59. Palmer, T. Drought in Brazil, sea surface temperature and the North Atlantic Oscillation. Trop. Ocean. Newsl. 1986, 35, 3–5. [Google Scholar]
Figure 1. (a) the different precipitation regions of NEB (NNEB-medium gray, ENEB-light gray and SNEB-dark gray) and the overview location of the study area in NEB and Brazil (adapted from [21]). (b) the study area (Paraíba do Meio and Mundaú river basins) with the precipitation homogeneous regions adapted from [29]. The climate classification (shades) is in accordance with [33].
Water 10 01617 g001
Figure 2. Monthly average precipitation (from 1938 to 2008) over the study area from the 18 selected precipitation stations with the degree of dispersion.
Water 10 01617 g002
Figure 3. (a) Continuous wavelet power spectrum from SPI3* at HG1. The thick black contours highlight the 95% of confidence level. (b) SPI3* time series for HG1 with the temporal cycle of variability.
Water 10 01617 g003
Figure 4. Same as Figure 3 for HG2.
Water 10 01617 g004
Figure 5. Wavelet Coherence (left column) and Cross Wavelet Transform (right column) between climate indices and SPI3* at HG1 from 1938 to 2008 (except AMM, from 1950 to 2008). The thick black contours represent 95% of confidence level.
Water 10 01617 g005
Figure 6. Same as Figure 5 for HG2.
Water 10 01617 g006
Table 1. Drought categorization based on SPI index.
Non-Exceedance Probability SPIDrought Category
0.05>1.65Extremely Wet (EW)
0.10>1.28Severely Wet (SW)
0.20>0.84Moderate Wet (MW)
0.60>−0.84 and <0.84Normal (N)
0.20<−0.84Moderate Drought (MD)
0.10<−1.28Severe Drought (SD)
0.05<−1.65Extreme Drought (ED)
Adapted from [40].

