Long-Term GIS Analysis of Seaside Impacts Associated to Infrastructures and Urbanization and Spatial Correlation with Coastal Vulnerability in a Mediterranean Area


Department of Civil Engineering, Technical University of Cartagena, Cartagena 30203, Spain
Water 2018, 10(11), 1642; https://doi.org/10.3390/w10111642
Submission received: 10 October 2018
/
Revised: 7 November 2018
/
Accepted: 9 November 2018
/
Published: 13 November 2018
(This article belongs to the Special Issue Coastal Vulnerability and Mitigation Strategies: From Monitoring to Applied Research
)
Abstract
:The relationship between the impacts of coastal perimeter transformations derived from human activity and coastal vulnerability is not easy to assess. The impacts associated with coastal dynamics are phenomena that usually develop very extensively over a considerable time. These are transformations that cause significant environmental damage in vulnerable coastal areas, but whose results are very often not really visible until 10, 20, or even 40 years have elapsed. In addition, the analysis and quantification of the current context in complex territories is particularly difficult, since the spatial feedback of various issues and its consequences can generate an uncertain scenario with many interrelated variables. In this field, the use of GIS tools can be of great help to objectively analyze the relationship between coastal anthropization and its impact on its vulnerability in order to correct wrong inertias in vulnerable coastal areas. To this end, a long-term GIS analysis has been carried out of the impacts from urbanization and seaside infrastructures suffered by a complex Mediterranean coastal area in Spain. This territory, with singular elements such as dune ridges, beaches located in protected areas, and a coastal lagoon, will be evaluated using GIS spatio-temporal indicators over the last 90 years and geostatistical correlation methods. This approach will allow us to better understand the relationship between territorial transformations on the coast and the current coastal vulnerability of this area.
1. Introduction
1.1. The Concept of Coastal Vulnerability: Causes and Assessment
The concept of coastal vulnerability presents a very broad field of study that has been analyzed from different points of view for some time [1]. There are several approaches that focus on, for example, their analysis of the environmental [2], economic [3], physical [4], or social impact [5], and some that even consider the combination of several of them [6,7]. This problem can affect various environments such as large cities [8], natural areas [9], tourist beaches [10], developing countries [11], or small islands [12], among others, and is often associated with phenomena such as urbanization and the construction of infrastructures [13,14], hazards [15,16], and in recent years, the global climate change of the planet [8,17]. However, there are many other less common reasons that may bring about this problem, such as land subsidence [4], hydrology [18], or soil erosion [19] for example, with a complex set of these causes ultimately being the final origin of the vulnerability of a coastal territory in many cases.
Monitoring this phenomenon for the performance of strategies for its mitigation is not straight forward [20,21]. The scientific bibliography provides several analysis tools such as the classical study of sedimentary transport [22], the development of risk management matrixes [18] or the analysis of the rise in sea level [23] of current scenarios. In this field, it is evident that the physical transformations of the territory derived from human activity inevitably modify the coastal vulnerability of an area. That is why it is very important to understand the negative repercussions of human activities in order to avoid undesirable tendencies that accentuate its coastal vulnerability. Nevertheless, how can we determine the extent to which the constructions or land transformations increase the coastal vulnerability of a large-scale territory? The effects appear slowly and are very often difficult to measure [1]. Furthermore, there is usually no clear interconnection between causes and effects in this matter. The question becomes even more complex when several variables are interwoven in the analysis.
A habitually complex context in this matter is the determination of coastal vulnerability in urbanized areas. This phenomenon is particularly challenging if we seek to determine the origin of the current effects in areas that have been subjected to fast urbanization processes, because of the difficulty of evaluating multiple long-term impacts in short periods of time [24]. In this case, integrated analysis such as the DPSIR (Drivers forces, Pressures, State, Impact & Response) method [25] or multi-level nested frameworks for socioecological systems [26,27], for example, are also recommended. Due to that, despite being a more recent technique in this field, the implementation of multivariable GIS analysis is today becoming more and more widespread, thanks to the progressive improvement in the method’s accuracy [28]. This tool allows the spatial variable in the analysis to be introduced and is transversal to the diverse origins of the issues.
A problem usually faced by this methodology is the difficulty in modeling the different physical phenomena that contribute to impacts in the coastal area [20]. It should also be noted that current issues associated with coastal vulnerability require a precise analysis of subjects whose time frame in reality extends over a period of years or even decades [1,29]. The effects of buildings and infrastructures, hazards or climate change in coastal dynamics, the transformation of the territory, or the alteration of the soil usually require a precise evaluation over 10, 30, or even 50 years to be reliably appreciated.
In this context, GIS analysis can prove very interesting if we have the necessary geo-referenced information [30,31,32]. In this field, several interesting studies are available that parameterize the coastal vulnerability of a territory through some spatial indicator [8,33,34]. Nevertheless, the retro-historic GIS type of analysis in this matter from an integrated perspective is a very scarcely studied field of research [35]. The implementation of GIS indicators through historical spatial information allows modeling the phenomenon from a numerical approach that can additionally be analyzed from a statistical perspective [36]. This approach becomes even more infrequent in scientific studies if we are faced with territorially complex areas in which there are several interrelated causes whose effects feed on each other. In this context, the use of geo-statistical tools can be very useful and innovative since it enables spatially cause-effect relationships to be correlated in these complex environments.
1.2. The Mar Menor Case Study: A Coastal Complex and Antropized Territory
In this study, the relationship between coastal transformations and the current vulnerability for a complex territory such as the Mar Menor, a coastal lagoon located in the Southeast of Spain, will be evaluated. This is a coastal territory of high environmental value [37,38,39] and with a 20 km long dune cord that separates two seas with very different characteristics (Figure 1). The area has been subjected to the impact of an intense human activity linked to tourism [40,41] in recent decades, which has resulted in massive urbanization, the construction of marine infrastructures, and the land transformation of its coastal perimeter [42].
Several studies have examined the impact of these and other activities in the area at a biological and ecological level [44,45,46]. However, the assessment of the physical vulnerability of the coastal territory as a result of human activity remains scarcely investigated since it is a very long-term impact that is not easy to visualize at a glance, requiring large-scale and long-term analysis. In this sense, the extent to which the different constructions and transformations of the territory have affected its current coastal vulnerability is not known, and has been the subject of social controversy on different occasions. Consequently, through the development of a retrospective GIS analysis, the physical impact of different phenomena in the coastal perimeter will be evaluated from the 1970’s (moment when mass tourism began in the area) to the present day. This impact will be correlated at a spatial level with the different current coastal risks by using geo-statistical tools in order to determine the extent to which human actions have contributed positively or negatively to the coastal vulnerability of the area during the last decades (analyzed area included in a KML file as supplementary material).
2. Materials and Methods
The selected territory is a very interesting case in which to propose this new methodology of long-term GIS retro-historic geo-statistical analysis of coastal vulnerability for several reasons. In the first place, it is a complex case of evaluation in which the different parameters of analysis may have certain interrelationship of feedback, generating a framework of difficult identification of the cause-effect relationships. Secondly, it deals with a series of impacts and physical transformations in the coastal perimeter whose overall effects are not easy to evaluate, since they are phenomena whose incidence emerges over decades. Finally, it is a territory in which geo-referenced spatial information is available for almost 90 years (the first aerial photographs were taken in 1929), thus enabling a wide retro-historic GIS analysis with numerous data.
The analysis of its coastal vulnerability will be carried out from an evaluation perspective of its physical support against the different impacts of direct and indirect human activity. This evaluation will focus on how the human transformations of the territory during the last decades have increased, or not, its current coastal vulnerability. It should be noted that this territory has been subjected to human action since Roman times; since then some small fishing population settlements have existed for example [47]. Nevertheless, it was with the arrival of tourism from the 1960’s [40] that the current main coastal impacts started (urbanization, construction of ports, and marine infrastructures, artificial widening of the communication channels between the Mar Menor and the Mediterranean, land fillings of beaches, etc.).
Therefore, based on all the above, a diagnosis of the long-term impacts of physical transformations on this coastal area will be performed using GIS retro-historic indicators; the following three global phenomena are used as evaluation variables: The urbanization of the coastal perimeter, the incidence of ports and marine infrastructures, and the alteration of coastal edges uses. Later, the geo-statistical correlation between these GIS indicators and current coastal vulnerabilities will be spatially assessed. Below, the modeling criteria of the retro-historic GIS indicators, vulnerability evaluation, and geo-statistical methodology are presented.
2.1. Retrohistoric GIS Indicators of Impact
2.1.1. Analysis of the Impact of Urbanization on the Coastal Perimeter: UTD Index
The phenomena of fast urbanization are one of the elements most commonly associated with coastal vulnerability. On the one hand, this fast urbanization usually introduces an important process of physical transformation of the coast that generates important environmental impacts on the original status of the territory. These impacts may cause alterations in coastal dynamics whose effects may not become apparent for years or even decades. The situation became especially interesting in this complex territorial context where we have a coastal perimeter that is highly urbanized as a consequence of tourism in the last decades and two seas separated by an ancient dune cord now strongly urbanized since the middle of the 1960’s (Figure 2).
On the other hand, fast and uncontrolled urbanization processes tend to notably increase the vulnerability risks associated with natural hazards such as floods. In this case, the coastal perimeter is strongly threatened as it is the mouth of numerous wadis in its Eastern and Southern perimeters. This context, coupled with the accelerated urban growth on the coast and the Mediterranean weather in which the rains are scarce but torrential, form a dangerous cocktail. In this sense, we can find several recent episodes in which these runoff waterways (through which water usually does not circulate), have become the natural floods channels, devastating important coastal settlements such as Los Alcazares (Figure 3).
To evaluate the impact of the urbanization processes in the coastal perimeter in the last decades, a long-term analysis will be carried out using a GIS indicator of urban transformation density (1). This indicator will make a comparison between the state of a territory during a period − and the intensity of urbanization detected during a similar previous period of time − . In this way, the indicator will take into account both the processes of transformation of natural areas into urbanized ones, as well as the transformation of areas already urbanized by new buildings. This will give us at the surface level not only an idea of the intensity of transformation of the coastal territory, but also a map of its building density. The indicator is formulated as follows:
with being the distribution of building density increase between and and the building density increase between and for a coastal buffer of 2 km.
2.1.2. Analysis of the Impact of the Construction of Marine Infrastructures (CIR)
The Mar Menor and the Mediterranean Sea have in these coastal perimeters a varied catalog of marinas (11) and seaside infrastructures such as dikes and breakwaters (>20, Figure 4). All these elements have been built mainly during the 1970’s, 1980’s, and 1990’s with the arrival of tourism.
To evaluate the impact of these infrastructures, the evolution of the changes in the coastal perimeter over time associated with their construction will be analyzed spatially. The analysis will be carried out through the use of a GIS indicator. This indicator will measure the surface area of the seaside perimeter altered derived from the construction of each infrastructure during a period of time, in relation to the alteration observed during an analogous period on the same stretch of coastline before the construction of the infrastructure. As the area of influence of each of the infrastructures, a length of 200 m buffer will be taken upstream and downstream on the coastline perimeter from the location of the infrastructure. This length of analysis will be reduced if unchanged behavior is detected during 50 consecutive meters, since the coastal area of influence of the infrastructure is understood as minor. The GIS indicator will be called the Index of Coastal Infrastructure Repercussion (CIR) and it is obtained, as shown in Reference (2):
with being the function that spatially quantifies the neighboring coastal surface area modified from the construction of an infrastructure from the time of its construction () to the present () and the function that spatially quantifies the evolution of this coastal surface into a period − analogous in time and prior to the construction of the infrastructure (see null-hypothesis in Section 2.1.4).
2.1.3. Analysis of Direct Land Transformations (DLT) in the Coastal Edge
There are other factors with major impacts that may generate an artificial alteration of the coastal configuration by direct anthropization not linked to building constructions or marine infrastructures. This is the case, for example, of channel dredging, agricultural land use modifications, coastal landfills, or simply alterations of the coastal space that cannot be attributed to a single cause or whose origin is unknown. In the case analyzed, we have a varied catalog of anthropic activities in this field (Figure 5), to which the territorial complexity of the existence of the ancient dune cord that separates the Mar Menor from the Mediterranean Sea must also be added. These two water masses are connected through 5 channels called “golas”, whose configuration is quite heterogeneous. On the one hand we find three such channels in the Northern area, which, being located in an environmentally protected area, remain theoretically unaltered. On the other hand, the other two channels are further South and there is also an interior dredged area in the shape of a clover in the North, whose natural configurations were altered, with its bottom having been widened and dredged to facilitate maritime navigation of large boats. This last phenomenon has given rise to controversies about a possible “mediterraneanisation” process of the Mar Menor, which will be discussed later.
Another important issue in this section is the alteration of the coastal territory through land fillings or land use change. In the first case, we find important alterations of the original profile of the beaches with sand landfills or land gained from the sea, especially in La Manga area. In the second case, the transformation of land for agricultural activities stands out especially in the innermost perimeter of the Mar Menor. This transformation affects the urbanized and non-urbanized areas of the coast by modifying the natural relief of the soil, influencing the arrival of water and sludge as a result of flooding.
All these concepts represent different forms of anthropization of the coastal perimeter through different processes of direct transformation of land that will be grouped in the index of direct land transformation ():
with being the function that quantifies direct land transformations by the dredging actions (1), coastal landfills (2), and non-urban land use changes (3) for a coastal strip 2 km wide between and , and the function that spatially quantifies the same coastal area transformed because of these three phenomena during a period − analogous in time and prior to − (see null-hypothesis in Section 2.1.4).
2.1.4. The Null Hypothesis: Zero-Effect Reference Sample
One of the basic aspects of this GIS retro-historical evaluation methodology of human impacts in the territory is inter-temporal comparative analysis [35]. In this context, an analogous concept to a control sample of a laboratory test or the null hypothesis of a statistical analysis is necessary. In this sense, the case analyzed is very interesting because it has spatially geo-referenced information of all its territory with aerial photography in the years 1929, 1932, 1945, and 1956. This information is of great interest since this period between 1929 and the mid-1960s predates the arrival of tourism and the urbanization process of the coast, allowing a geo-referenced spatial comparative analysis.
We should also take into account that the level of accuracy in the geo-referenced information of both periods (1929–1956 and 1956–2017) is not the same. However, as can be seen in Table 1, the information available is sufficiently accurate to enable a temporary comparative analysis to be performed using GIS indicators of the impact of the urbanization process, the construction of ports and coastal infrastructures, and the development of large transformation of lands in the coastal perimeter.
2.2. Spatial Coastal Vulnerability Assessment: Methodological Considerations to the Model
The assessment of coastal vulnerability must be carried out through contrasted and homogeneous scientific methodologies at a spatial level. An approximate estimation of a coastal global vulnerability of the different areas of a territory can be obtained by means of an indicator that groups together the most common existing risks. This approximation can be estimated as the homogenous sum of the different existing vulnerabilities as a result of natural hazards modeled through GIS indices and weighted by corrective coefficients to statistically assess their probability. The format of global index (4), partial indexes (5), and weighting coefficients (6) will be as follows:
where partial indexes of vulnerability risks are detected in a territory and the weighting coefficients are obtained as follows:
The function will model the risk maps for each hazard variable in a dimensionless way. This function is made up of a density map of average values T for each one of the j areas of the territory divided by the maximum values U of the territory. The function will establish the values of the weighting coefficients as a function of a probability ratio of each of the variables in relation to an average value . This probabilistic assessment should be carried out based on a statistical evaluation criterion that can be modeled in a common way for all the risk variables (in this case, the measurement will be based on the different return periods for flooding for example). It should be noted that the different GIS indicators may be modeling phenomena of a very different nature (floods of different origin, earthquakes, hurricanes, impacts of climate change, fire risk, etc.). Nevertheless, it is important to remember that the effect derived from these elements must be implemented in a homogeneous manner by generating as output units that can be added in a dimensionless way to perform the global coastal vulnerability index.
In this study, the flooding of land and marine origin have been selected as major risks to analyze the global assessment of the coastal vulnerability index of this territory. Other natural hazards, such as those derived from the risk of fire, seismic movements, or hurricanes, have not been taken into account since they are not significant cases with a negligible historical occurrence rate. The methodology for the evaluation of both flood risks has been developed as follows.
2.2.1. Flood Risk of Marine Origin
To face the complexity of the different aspects that make up the calculation of the flood throughout this coastal territory, a three-phase methodology based on the criteria of the Methodological Guide of the Spanish National Flood Mapping System [48] has been followed.
In the first phase, the entire coastline is flooded only by the dynamics of the sea level (derived from the effects of astronomical and meteorological tides) without surf. With this approach, there are valid results in the areas where the waves have no relevance (inside estuaries or sheltered from external infrastructures). To do this, the extreme regime of flood elevation from the series of sea level data (available for more than 60 years of data) is adjusted for each position along the coast, calculating the level of flood associated with the return period T = 100 years with the Peaks Over Threshold (POT) technique [49] and adjusting the distribution function by means of the Generalized Extreme Value (GEV) statistical distribution. As a result, the sea level is obtained for each position, from which the corresponding Digital Terrain Model (hereinafter, DTM) benchmark will have to be subtracted from the coast to obtain the openwork on the ground.
In the second phase, the coastal areas where the waves hit directly are corrected, which is the coast line which is not protected from the waves. In this second approach, terrain profiles are drawn to resolve the flood in two dimensions, profile by profile, incorporating the combined effect of waves and sea level. The effect of the swell is evaluated by means of the two-dimensional numerical model IH-2VOF [50], which solves the Navier-Stokes equations, by using the Downscaled Ocean Waves (DOW) wave database [51], obtained from the data series of the C3E project [52]. This allows us to correctly characterize the wave propagated to the coast with a spatial resolution of at least 200 m.
Finally, in the third phase, the flood envelope is obtained by the sum of the flood zone by level and the flood zone by swell.
2.2.2. Flood Risk of Land Origin
The delimitation of the flood zones is carried out by defining the so-called Significant Potential Flood Hazard Areas (SPFHAs). These areas are obtained from the Preliminary Flood Risk Assessment (hereinafter, PFRA) in accordance with Directive 2007/60 of the European Commission [53] in several ways:
- From a hydrological study in which the flow rates are determined associated to the corresponding Return Period considered in the PFRA, in this case 100 years. Once the flows have been defined, a hydraulic study determines the levels reached by the sheet of water and with them the extension of the flooded area associated with that frequency.
- From geomorphological-historical studies that allow the delimitation of areas with a low probability of flooding, based on historical evidence, and identified geo-morphologically.
- Based on a mixed methodology, which includes the two previous methods, allowing more reliable results.
In the case of considering structures of rolling or derivation of flows in the hydrological calculation it is considered that the flows are in an altered regime; otherwise they are deemed to be in a natural regime. For the analysis of the flood risks of land origin, the protocols established in the Methodological Guide for the development of the Spanish National Flood Mapping System [48] to model cartographic, hydrologic, geomorphologic and hydraulic boundary conditions have been used. In this case, since the most affected area has a more complex orography (see the results section below), Laser Imaging Detection and Ranging (LIDAR) tools have been used to generate the DTM. This higher level of precision is justified by the need for modeling the surfaces of the watersheds in a reliable way with the actual drainage directions. The cells used are at least 25 × 25 in agricultural or natural land and 5 × 5 in urban areas.
For this method, in relation to the concept of return period, it is important to make certain clarifications. In numerical terms, it is equivalent to the probability of having an equal or higher avenue flow in a given year, that is, the probability of exceeding the flow in a year. For example, for a return period of 100 years, that probability F(x) = 1/T = 1/100 = 0.01 = 1%. Thus, there is a 1% probability that one year this flow value will be exceeded and a 99% probability that it will not be exceeded. However, this does not imply that two or more avenues of such or higher intensity cannot occur within the same year, since the return period is a statistical concept and depends on the duration of the interval considered. Should we wish to calculate the probability of equaling or exceeding this value during a period of N years (statistical concept of Risk) for a return period T, it would be calculated by means of the following expression (9):
Thus, according to Table 2, an area affected by flooding in a period of 100 years return zone has a probability of 22.2% of being flooded in a period of 25 consecutive years and 39.5% to be flooded in 50 consecutive years.
On the other hand, it should also be noted that the calculated flood areas have important limitations regarding the flood that would occur in a specific event. Current techniques, although they are very precise, have important restrictions that make the actual flood of an event vary significantly from what was calculated. In this sense, we must highlight two important limitations:
- The first is related to the effects of erosion, landslides, sedimentations, etc. Herein they are only taken into account by means of geomorphological criteria, and in a specific situation, especially in high slopes, the geomorphological changes can be very important and the results differ significantly.
- The second is that the existing mathematical models cannot take into account the effects that certain elements can produce by obstructions and derivations of the flow. For example, fallen trees, vehicles, etc., can obstruct bridges, streets, etc., thus deriving the flow in any direction, which is unpredictable. In this same context, we have the cases of large flood areas in large (concentrated or dispersed) urban settlements. The difficulties to adequately represent all the artificial elements that influence the characteristics of the flow in the hydraulic model, and the computational limitations derived from a large amount of processed data, may also cause the flood results to differ from the model forecasts.
2.3. Geostatistical Correlation between Human Actions and Coastal Vulnerability
Once the distributions at the spatial level of the impact and coastal vulnerability indexes have been obtained, we can evaluate the possible spatial correlation between them by using geo-statistical methods. This analysis will allow us to assess to what extent the transformations made by human activity in the coastal perimeter of a territory have influenced the current coastal vulnerability existing in it. The spatial relationships will be parameterized and assessed through the use of Global Moran’s I [54] and Anselin Local Moran’s I [55] bivariate statistics, both are geo-processing tools from ArcGIS Pro 10.5.0 (ESRI Corporation, Redlands, CA, USA).
Bivariate global spatial autocorrelation will allow us to assess the statistical correlation of a set of geo-located data obtained spatially and the sign of this autocorrelation (positive or negative). Bivariate Global Moran’s I statistic formula is given as (9):
where is the deviation of an attribute for feature from its mean , is the spatial weight between feature and , is equal to the total number of features, and is the aggregate of all the spatial weights of (11):
The -score for the statistic is computed, as in Reference (12):
where and can be calculated as follows:
Global spatial GIS autocorrelation will return three values: the Moran’s I Index, z-score, and p-value. Given a series of spatial features and an associated attribute, bivariate Global Moran’s I statistic indicates whether the pattern expressed is clustered, dispersed, or random and its degree of statistical correlation. When the z-score or p-value indicates statistical significance, a positive Moran’s I index value indicates a tendency toward clustering, while a negative Moran’s I index value indicates tendency toward dispersion. The z-score and p-value are measures of statistical significance which inform us whether or not to reject the null hypothesis. For this analysis, the null hypothesis states that the values associated with features do not have any statistical correlation.
From this information, we will be able to implement, in a geo-located way, the so-called hot and cold points in the mapping through the Local Indicators of Spatial Association (LISA) from Anselin [55]. Each Anselin Local Moran’s I statistic of spatial association is given as:
where is an attribute for feature , is the mean of the corresponding attribute, is the spatial weight between feature and , and:
with n equating to the total number of features. The -score for the statistic is computed as:
where and can be calculated as follows:
For this analysis, the null hypothesis states that the values correlation of two elements are randomly distributed. Thus, the higher (or lower) the z-score, the stronger the intensity of the clustering of these values. A z-score near zero indicates no apparent clustering within the study area. A positive z-score indicates clustering of high values. A negative z-score indicates clustering of low values. This numerical evaluation will be implemented through GIS mapping to distinguish configuration patterns of High-High clusters (high levels of impact associated with high levels of vulnerability), Low-Low clusters (low levels of impact associated with low levels of vulnerability), and spatial outliers, either High-Low (high levels of impact associated with low levels of vulnerability) or Low-High (low levels of impact associated with high levels of vulnerability).
Therefore, the bivariate statistical correlation analysis between the distributions of different GIS indicators will help us to understand, spatially, the extent to which the impacts produced by human action affect coastal vulnerability.
3. Results
The exposed methodology has been applied to the surface area detailed above with the following results. In the first place, the retro-historic GIS analysis of the impacts on the coastal edge has been carried out. Secondly, the coastal vulnerability of each area has been spatially evaluated. Finally, the spatial correlation of both phenomena has been evaluated by geo-statistical methods.
3.1. GIS Retrohistoric Analysis of the Anthropization Impacts in the Coastal Perimeter
A long-time spatial analysis of the seaside impacts in the area has been carried out through GIS retro-historic methods from the 1960’s to the present. The results obtained in the analysis have been differentiated according to the structure detailed in the methodology section.
3.1.1. Urbanization Impacts
The transformation density of the urbanization processes can be observed in a summarized way in Figure 6. To simplify the spatial representation of the GIS indicators for the transformation of the coastal perimeter as a result of urbanization, outputs have been tessellated using the ArcGIS Pro 10.5.0 program (ESRI Corporation, Redlands, CA, USA). The tessellated polygons have a size of 25 × 25 m to allow an understandable visualization of the results at a large scale (in case a tile has a surface area in two or more categories, it is assigned to the category with the most surface area present). At the intensity level, it is observed how the largest and fastest-growing population densities have been generated in the ancient dune cord called La Manga. At a quantitative level of surface transformation, it can be observed that the greatest results in absolute values are found in the urban sprawl from the settlements of the inner perimeter (San Javier and Los Alcazares coastal towns).
It is interesting to observe in the area of La Manga how sometimes there is no correspondence between the initial natural surface and the actual urbanized surface at the two-dimensional level. The incidents detected correspond mainly to retraction phenomena on the beaches of the ancient dune cord of the Mar Menor. These beaches were formerly fed by the sand from the beaches of the Mediterranean thanks to the prevailing winds from the East. The current “screen effect” generated by the massive construction of buildings in the old dune belt has caused retraction effects in a generalized manner in the dune profile of the Mar Menor beaches, with alarming cases being observed in which the disappearance of the beaches reaches the very foundations of some houses.
It is interesting to observe how the phenomenon of dune shrinkage of the beaches occurs mainly in the lower half of the old dune cord. This question is explained by La Manga being chronologically urbanized progressively from the South to the North, from the mid-1960’s to the late 1990’s. As a consequence of this, the phenomena of dune shrinkage (which are deferred in time and often require an average of 10–15 years to significantly emerge) appear mainly in the buildings of the Southern half that were built in the decades of the 1970’s and 1980’s. In addition, this duality is accentuated by the fact that the so-called “screen effect” is more intense in the Southern half, given that the urbanization in that area is denser. However, this does not mean that the same situation will not occur in the northern half in the future, when the construction in that area (which is not yet fully built) has been consolidated and the dune shrinkage phenomena has taken enough time to bring out its first consequences.
3.1.2. Ports and Coastal Infrastructure Impacts
The detected impacts derived from marinas and coastal infrastructures are widely distributed spatially (Figure 7). The distribution of the impacts has also been tessellated in meshes of 25 × 25 m to make the characterization of the phenomenon on a large scale more understandable.
Its impact on the coastal perimeter extends over the last decades and it is observed that it varies depending on two main parameters. On the one hand, it is necessary to take the geographical situation of each element into account. Variables such as the proximity of golas, tall buildings, or the mouths of the wadis can influence the global impact. Obviously, the behavior of a coastal infrastructure in the Mar Menor will be very different from that of one in the Mediterranean Sea. However, even the situation of the infrastructure within the Mar Menor shows influence in its effects on the coast.
On the other hand, the type of infrastructure built exerts the main influences. In the case of breakwater dikes, there is no great variability, with only their length being the differentiating variable. Nevertheless, in the case of ports, regardless of their size (those of greater size may have a greater impact), we find three distinct impact typologies. First, we have the traditional ports whose dock is on land reclaimed from the sea through sheltered dikes. Secondly, we find ports built with interior marinas inland, or naturally sheltered in bays. These ports are usually located in the urban plot of the coastal towns. As the third and last case, we have so-called “island ports”. This mixed case includes the ports that are separated from the coastline and are linked to it through an element that allows the passage of water and sedimentary dynamics.
In the case of the dikes or breakwaters we find elements that do have an impact on the coastal dynamics, as well as elements that do not, the length of each element being a determining factor of the intensity from the impact. Among the elements that have an impact, it should be noted that there are positive, negative, and mixed consequences. Positive impacts are understood as those that contribute to stabilize the dune profile for the maintenance of the beach surface or those that correct the negative impacts of an area derived from the action of ports or dikes from neighboring areas. Negative impacts are understood to be those that negatively affect the dune stability of the area in which they are located, causing generalized phenomena of dune retraction. Finally, mixed elements are those that simultaneously generate results that can be cataloged as negative and as positive, such as increasing the beach surface on one side at the cost of reducing it on another, or maintaining the dune stability of one area, generating instability in another nearby area.
In the case of marinas, their size does seem to be directly correlated with their coastal impact. For example, the Tomas Maestre marina (numbered as 7 in Figure 4), the largest marina in Spain (and one of the largest in Europe with 1700 moorings) located in the North of La Manga and crossed by one of the golas, does not offer a remarkable behavior at the level of alteration of the dune profile. Nevertheless, we find common differentiated behaviors based mainly on the location and typology.
In the case of ports located on land reclaimed from the sea and harboring the port dock through breakwaters, we can find usual coastal behavior in these infrastructures in the Mediterranean. The beaches located to the North of the port increase their surface area while those located to the South experience important retraction phenomena over the years. In this section, the case of the San Pedro del Pinatar marina (numbered as 1 in Figure 7), located on the Mediterranean side, is especially interesting, and it has made almost 80% of the well-known La Llana Beach disappear within a period of 20 years (see the evolution in the upper part of Figure 7).
In the case of exempt ports called “island ports”, the detected behavior is different. The area in front of the port experiences a growth of the dune surface according to the port-coast union axis. This growth has constituted, in the ports of this typology, what we would call a half-tombolo after 20–30 years of impact and it is foreseeable that it will end up eventually forming a complete tombolo (a bar of sand or shingle joining the port to the mainland). This dune growth also tends to be controversial, since when it is generated in the bottom of the sea currents, it tends to accumulate sludge on the beach that turns out to be very annoying for bathers. In addition, this growth takes place at the expense of the neighboring beaches North and South of the port, which tend to shrink and even in some cases disappear.
Finally, in the case of the marinas located in the interior of the land zone, the casuistic is more varied and depends more on the geographical position and the physical conditions that surround the port. In the case of the port of Cape of Palos (numbered as 6 in Figure 7) in the Southern Mediterranean end of La Manga, a pure inner land port, it can be seen in Figure 7 that there is no effect on the neighboring beaches (when, on the contrary, there are alterations on the beaches on the other side of the cape as a result of a dike construction, as can be seen in the Northern part of the photos). Nevertheless, we also find other cases such as the port of Lo Pagan (numbered as 4) and the Dos Mares yacht club (numbered as 5), rather half-inner land infrastructures, in which there are hard accumulations around the port. These growths are related to the boundary conditions of each port infrastructure and also lead to the accretion of sludge that damages neighboring beaches. The most significant set of impacts are detailed in Table 3.
3.1.3. Coastal Land Alterations Impacts
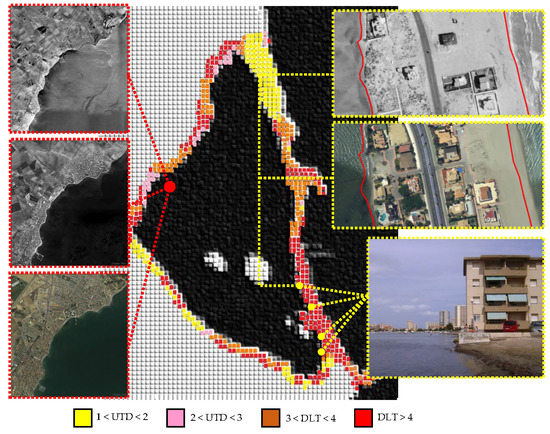
The analysis of the impacts derived from the direct alterations of the coastal space denotes a heterogeneous distribution associated to specific actions with diverse results. The area most subjected to this type of impact is mainly the old dune cord currently urbanized called La Manga (Figure 8). This area has various actions such as the direct alteration of its surface geometry, the artificial modification of two of the so-called “golas” (natural communication channels between the Mar Menor and the Mediterranean Sea, numbered as 1), the internal dredging of some areas such as the artificial clover called Veneziola (numbered as 3), or the landfilling of large marine areas such as the one called El Vivero (numbered as 2), or the road to connect the inland area with the Ciervo Island (numbered as 5).
The behavior of the GIS evolution for all these elements is not homogeneous either. On the one hand, we find those whose new physical configuration has consolidated over time reaching a static equilibrium situation. This is the case of alterations in the layout of the dune cord consolidated by road infrastructures and buildings or the landfilling of El Vivero. On the other hand, we find cases in which there is a certain dynamic equilibrium (in which a static equilibrium position is not reached) or in which nature always directly opposes with forcefulness in the same sense as human action in a reiterative way. The first case can be found in the two so-called artificial “golas” or the dredging of Veneziola. In these cases, the artificial dredging made to reach a larger draft thus enabling large vessels to navigate it is not maintained at stable depths due to coastal dynamics, forcing periodical dredging. The other three natural golas also warrant special mention, whose surface and depth have moved in different directions over the last decades. However, in this case, a clear and direct cause cannot be established, since there are several nearby elements with a certain impact capacity such as sports ports, dredging, or alterations to the coastal surface. Finally, we found situations whose completely unbalanced configuration generated important alterations and whose impacts were not acceptable either environmentally or socially by the population, forcing the restoration of them to their original situation. One such case is of the road that connected the Ciervo island, whose obstruction of the sea currents generated such a “dam effect” to the North of the same that forced its dismantling.
For the mapping of the distribution of the DLT transformation indicator during the period 1967-2107, four different levels have been established to categorize the four most representative casuistic of the phenomenon. In the first place we have those cases in which the transformations are limited to the change of land use, with which the functions and barely have differences of less than 20%. This category fundamentally includes transformations from natural to agricultural land or significant changes in the type of agricultural use (urbanization transformations are assessed in the 3.1.1 indicator). Within this first case, the substitution of the old terraced crops by horticultural plantations of intensive agriculture stands out in the area. In the second category, we find those cases in which there has been an alteration of the land-sea configuration, but which has been consolidated in a static equilibrium over time without new alterations. This is the case of the mentioned coastal landfills and geometry changes consolidated by the road infrastructures in the old dune cord. In the third level we find those transformations of the land-sea geometry that have not reached a static equilibrium and are currently in what we have called a dynamic equilibrium. This is the case of artificially-dredged golas whose draft tends to be reduced by the effect of coastal dynamics, or of the golas that still remain natural, whose surface and draft has been changing in the last decades in different directions as a side effect of several nearby impacts. Finally, in the fourth category we find land-sea configurations that have undergone important transformations in different ways as a result of the generation of a dynamic equilibrium that is “not stable”. This is the case of the execution of coastal infrastructures such as the road that connected the old dune cord with Ciervo Island, whose serious alteration of coastal dynamics forced the infrastructure to be dismantled.
In Figure 8, the distribution of the impact has been tessellated in meshes of 25 × 25 m to make the characterization of the phenomenon on a large scale more understandable. For this analysis, we must highlight that in the case of the golas, the z parameter is not obtained by geo-referencing. It has been obtained based on the abundant bathymetric documentation of the nautical charts of the area that exist for many dates. It should be noted that the level of detail of these charts for navigation is lower than in the case of the rest of the information; with the information basically being lines of homogeneous depth. However, this can be understood as an acceptable simplification of the model, since in artificial golas the depth is the result of dredging to facilitate navigation, so the bottom tends to be of a homogeneous depth. Likewise, in the so-called natural golas, since these are fairly shallow waters located between the two seas, the slope of the terrain is usually flat.
3.2. GIS Analysis of Coastal Vulnerability
A spatial analysis of the coastal vulnerability for land and marine flooding has been carried out based on the geo-referenced data available in the Ministry of Environment, Agriculture, and Water of Spain [56]. A return period of T = 100 years has been chosen for the forecast simulation, since it provides spatially significant results, whilst at the same time it results in an order of magnitude close to the total period evaluated, making the results more interesting in order to establish conclusions later.
3.2.1. Coastal Vulnerability Associated to Risk of Marine Flooding
A forecast simulation of coastal vulnerability in the territory analyzed was carried out for a return period of T = 100 years according to the criteria set out in the methodology section. The envelope of worst case scenarios for maximum events indicates an impact mainly concentrated in the Mediterranean side of the old dune cord of La Manga (Figure 9). The inner coastal perimeter of the Mar Menor scarcely suffers from the flooding of the beaches, apart from occasionally some single-family homes located on the front line of the coast. In the case of La Manga, the most affected part surpassed by a possible flood is the area corresponding to the natural golas, located in the far North (which is logical). Regarding the urbanized areas, it is interesting to observe how the effects in the Northern area are much greater than in the Southern zone. The urban configuration of the Southern area is more resistant to the phenomena of flooding of marine origin due to its greater density and more compact structure.
The most vulnerable urban areas are found in the Northern section (especially in the points with the smallest width of the dune cord and with low density urban configurations or with partial building) and in areas with artificial “golas”, which are completely flooded by water. Given that a homogeneous distribution of coastal vulnerability is not found, this will be discussed in the discussion section, based on the results of the geo-statistical analysis as to whether the action of man has contributed to worsen or improve the existing situation in this section.
3.2.2. Coastal Vulnerability Associated to Risk of Land Flooding
The analysis of coastal vulnerability associated with flood risk of river origin is even more interesting. In this case, the reverse phenomenon occurs, with the interior coastal perimeter of the Mar Menor being the area where the impact is concentrated (Figure 10). This is a consequence of the existing orographic distribution with numerous wadis that flow into that stretch of coast. In this case, the natural areas are not actually the most affected (despite the existence of crypto-wetlands theoretically within these protected areas), but the areas of greatest concentration are urban and agricultural ones. Due to this, a detailed DTM has been incorporated into these urban areas using LIDAR technology to obtain more precise results.
In the West side we find large urban areas subject to an intense phenomenon of flooding throughout its urban surface (particularly close to the coastal town of Los Alcazares). This phenomenon is mainly a consequence of the urban configuration and the growth patterns of the town during recent decades, which have not taken the risks associated with the orography of the land into account. This growth pattern and urban structure of medium-low density have only aggravated existing problems. However, it should be noted that the highway (built in the 1990’s) that surrounds the town exerts a “dam effect”. This new local configuration greatly protects the town, being possibly related to the fact that the recent floods in the town have been less catastrophic than the last ones of 60 years ago. Even so, this configuration is a double-edged sword, since the possibility of occurrence of a maximal event of greater dimensions (for example, with a return period T = 500 years) could suppose the blockage of the drainage elements of the highway, thus making this dam overflow directly into the population, which would significantly aggravate the consequences for the town.
In the Southern area, we find a very different problem. In this case, the agricultural areas are the most affected. However, the current orographic configuration of the agricultural lands allows easy access of the waters to several small coastal towns, flooding them. As we have already seen, this orographic configuration has not always been thus, but has been subjected to various land processes of transformation of use and structure over the last decades. We find transformations throughout these last decades that may be susceptible to worsening as well as improving the status quo of the territory analyzed. Therefore, in the last section the extent to which human action has contributed to worsen or improve the existing situation in this field will also be discussed, based on the results of the geo-statistical analysis.
3.3. Geostatistical Bivariate Analysis of GIS Indicators
In the first place, we have made the two GIS indicators of the distribution of flood risks of marine and land origin dimensionless, as explained in the methodology section. Then, we have integrated them into a single statistically homogenous GIS indicator, called index of global coastal vulnerability . This indicator has been spatially correlated with the different UTD, CIR, and DLT impact indicators through the Global Moran’s I statistic. This bivariate analysis assesses the relationship two to two between the indicators at the level of two-dimensional autocorrelation in the spatial plane. The aggregate result of this first global correlation can be summarized for the scope of study in Table 4.
The results show positive global statistical autocorrelation between indices, but higher levels of correlation for the - and - couples than the - one. This difference may be due to the more direct incidence at a spatial level of the processes of urbanization and direct transformation of the coastal edge, rather than the execution of marine and port infrastructures. The incidence of the latter can be derived indirectly at a spatial level far from the focus of the impact through the coastal dynamics, so a more local geo-statistical analysis is necessary in order to analyze this relationship.
The level of local correlation between the different pairs of indices was evaluated by means of the Anselin Local Moran’s I (LISA) statistic. This statistic allows us to transpose at a local spatial level the so-called hot spots (high impact-high vulnerability), cold spots (low impact–low vulnerability) and significant outliers (Low-High and High-Low cross-links) to avoid the limitations of global geo-statistical analysis. A varied catalog of different situations can be observed; the most significant results of this statistic are summarized in the tessellated mesh distribution of Figure 11.
We can here observe how the processes of urbanization in the inner perimeter of the Mar Menor have notably increased the coastal vulnerability of land origin in the territory, despite the theoretical beneficial impact of some infrastructures such as the highway. Similarly, the transformation of agricultural orography in the Southern perimeter has favored this type of vulnerability, increasing the risk of flooding of land origin. Nevertheless, it is paradoxical in this case to observe how the impact of the so-called island-ports in the Mar Menor has increased the protection against the marine flooding of the Mar Menor in some villages such as Los Nietos.
On the other hand, the progressive dislocation of beaches in the Northern area of La Manga as a result of artificial dredging and the development of port infrastructures has increased the coastal vulnerability of the Northern half of La Manga due to flooding of marine origin coming from the Mediterranean. A different situation is found in the Southern half. There, the same dense and compact urbanization process that mitigates the impact of the coastal vulnerability of marine origin from the Mediterranean on the urban plot is responsible for the indirect vulnerability that occurs on the side of the Mar Menor by the disappearance of several beaches due to the effect on coastal dynamics.
4. Discussion
The Mar Menor, La Manga and its neighboring coastal territory have long been a common object of social and scientific controversy. As mentioned before, there are numerous studies in the scientific bibliography related to the Mar Menor [57,58,59,60,61,62,63,64] and the problems derived from its unique configuration and high environmental value. Most of them converge in associating the environmental impacts of the territory individually, mainly with the intensive urbanization of the coastal perimeter, the construction of marine infrastructures and the anthropization of the environment with actions such as intensive agriculture or the artificial widening of the “golas”. Nevertheless, practically none of them address the problems of this territory in a global way from the perspective of the physical impact on the territory. They focus instead on analyzing the existing segmented consequences from the point of view of water quality [65,66], marine fauna [37,61], seabed vegetation cover [38,60], birds [39,67], landscape [47], etc.
In addition, the main biological, chemical, or ecological approach of most of the existing studies in the area has traditionally focused on variables with little connection with the coastal vulnerability of the territory as impact factors (nitrates from agriculture, heavy metals from old mining areas, etc.). Therefore, except for a number of specific and segmented studies in the field of coastal hydrodynamics [68,69], sea level [70], or territorial anthropization [34,47] there was no analysis from the physical perspective of the coastal territory that allows a diagnosis of the global vulnerability in this area.
This study presents a different approach to all the existing analyses to date. The different factors related to the current coastal vulnerability of the territory at a global level have been analyzed spatially. Additionally, through an innovative methodology based on the retrohistoric GIS analysis of anthropization processes derived from human activity, it has been possible to geo-statistically correlate the link between the impacts of phenomena such as the construction of ports or the change of land use, with the current coastal vulnerability. This type of diagnosis may prove to be of great interest in order to develop strategies for mitigating coastal vulnerability in a complex territory, since it not only analyzes existing risks through hazard maps, but takes into account how human activity contributes to current problems.
In this sense, to correctly implement these strategies to mitigate the existing vulnerability, it is very important to know which elements have a negative impact and which have a positive or negative impact, both in the current scenario and in their trend trajectory. In addition, it must be taken into account that complex environments such as the one analyzed can have cross-linked impacts, generating a negative effect in one place, while generating a positive effect in another. This mapping context with different scenarios of the couple human impact-vulnerability (HH, LL, HL, and LH) would allow us to implement a segmented mitigation strategy with different sub-strategies depending on how different impacts of human activity affect the current coastal vulnerability at a spatial level.
For example, in the case study analyzed, in the inland Western area of the Mar Menor, one should preferably act on the orography of the wadis, making it compatible with the current urban layout and preventing future urban developments from being carried out in the areas of greatest risk. In the Southern perimeter, attention must also be paid to the flood risk of land origin. However, where it is really necessary to act is in the configuration of the agricultural areas, since the current urban settlements have a fairly stabilized growth and it is the transformation of the agricultural orography that fosters the greatest risk of flooding at present. On the other hand, in the La Manga area, the need to implement at least two different sub-strategies is observed. In the Northern zone, it would be necessary to act in the urban plot configuration (since it is observed that it is continuing to be urbanized at present) against the risk of flooding of marine origin from the Mediterranean (in this case aggravated by the impact of the sedimentary dynamics of the area linked to the port infrastructures located further North). A very different strategy would be needed in the Southern area, where the configuration of the urban plot mitigates the risk of flooding of marine origin from the Mediterranean, while indirectly promoting negative effects on coastal vulnerability on the Mar Menor side. In this case it would be necessary to implement a strategy to rebalance the current situation between the two sides of the ancient dune cord.
This approach is especially interesting for a coastal vulnerability study given that in territories such as this one, issues like the impact of rising sea levels as a result of climate change have been socially very controversial. In fact, approaches in this territory have traditionally existed that lack a solid scientific basis; these have generated some social alarm about the impact of the risk of a sea level rise due to climate change (Figure 12). In complex environments such as this one, approaches with great scientific rigor, such as can be seen in Reference [70], may even be insufficient to assess coastal vulnerability at a comprehensive level, since it is also necessary to take into account the impacts and cross-links of other variables related to the anthropization processes of human activity and to develop detailed digital models of the terrain and urban plot able of simulating the physical reality at the local level.
In this sense, possible lines of future research in this area for this territory to formulate more precise and segmented mitigation strategies could be carried out to deepen the study at the local level of certain elements whose performance was positive or negative depending on the context of analysis. For example, retrospective GIS analysis and geo-statistical correlation could be used to determine in greater detail which seaside dikes are detrimental or beneficial to the stability of sedimentary dynamics, or to assess the long-term effect of dredging on the golas at an environmental level. Both issues have traditionally generated important social debates in the area: In the first case in relation to the need to eliminate or not the marine dikes to improve the quality of beaches, and in the second, on the possibility of further expanding the golas with the aim of improving the quality of the waters in the Mar Menor, despite the risk of deepening the process of “mediterraneanisation” of the lagoon and increasing the risk of marine flooding.
Another important issue concerns the limitations of the methodology used. In the analyzed case, a very accurate geo-referenced cartography was available for different dates, as well as a DTM model that enables the orographic natural and urban reality to be represented in a reliable way. Additionally, the existence of an orographically simple terrain and an urban configuration without great constructive singularities have both considerably facilitated the work. It was only necessary to calibrate the mathematical models to represent the “dam effect” of the AP-7 highway, and the marine flooding in the golas as a result of the dredging presents some minor uncertainties. However, the model at the global level can be considered very robust, with the data used as input to the geo-statistical analysis being considered very reliable. Even so, this statement clearly cannot be extended to every study, and it is thus necessary to maximize the precision in the DTM model and take caution in mathematical models when we are faced with complex natural orography or urban configurations with several constructive singularities.
Consequently, it is clear that this diagnostic methodology can be very beneficial to improve current coastal vulnerability assessment systems and implement more accurate mitigation strategies. It is true that it is a methodology that requires an important geo-referenced database of historical character and with a great deal of precision. In this context, it cannot be said that this new technique can currently be applied in a generalized manner for analysis of coastal vulnerability in any territory. Nevertheless, we must bear in mind that national GIS databases and international Spatial Data Infrastructures (SDI) systems are becoming generalized throughout the world and perfecting their level of accuracy. Therefore, it may be an approach with a promising future that in the coming years will allow for the opening of increasingly sophisticated new lines of research in the field of coastal vulnerability.
5. Conclusions
This study has presented an innovative methodology for analyzing the coastal vulnerability of a territory based on the GIS evaluation of the spatial statistical correlation of long-term anthropic impacts and the distribution of current risks. The geo-statistical analysis carried out for the case of the Mar Menor Mediterranean lagoon reveals that the urbanization processes being developed in the last decades have generated imbalances. On the one hand, they provoke the retraction of the coastline in the old dune cord called La Manga, increasing coastal vulnerability due to flooding of marine origin. On the other hand, the inadequate urban sprawl has notably increased the vulnerability in the interior coastal perimeter due to flooding of fluvial origin in some coastal towns.
In the case of infrastructures, we find a catalog of very heterogeneous situations. The construction of some ports (although not all) have severely affected the balance of beaches, making them expand or almost disappear (and therefore increasing the risk of marine flooding). The role of several motorways, whose barrier effect theoretically mitigates the risk of terrestrial flooding in some coastal towns, should also be highlighted. This situation is actually a double-edged sword because, in the event of a flood that overcomes that dam effect, the consequences could be catastrophic. Finally, land use transformations or dredging and earthmoving in the coastal strip have also caused different impacts on the vulnerability of the territory. Changes in agricultural use in the Southern fringe have increased the risk of land-based flooding, while dredging in the La Manga golas increases that of marine origin.
Supplementary Materials
The KML file including the area of analysis is available online at https://www.mdpi.com/2073-4441/10/11/1642/s1.
Funding
This research received no external funding.
Conflicts of Interest
The author declares no conflict of interest.
References
- Bevacqua, A.; Yu, D.; Zhang, Y. Coastal vulnerability: Evolving concepts in understanding vulnerable people and places. Environ. Sci. Policy 2018, 82, 19–29. [Google Scholar] [CrossRef]
- Denner, K.; Phillips, M.R.; Jenkins, R.E.; Thomas, T. A coastal vulnerability and environmental risk assessment of Loughor Estuary, South Wales. Ocean Coast. Manag. 2015, 116, 478–490. [Google Scholar] [CrossRef]
- Kantamaneni, K. Counting the cost of coastal vulnerability. Ocean Coast. Manag. 2016, 132, 155–169. [Google Scholar] [CrossRef]
- Rimba, A.B.; Osawa, T.; Parwata, I.N.S.; As-syakur, A.R.; Kasim, F.; Astarini, I.A. Physical assessment of coastal vulnerability under enhanced land subsidence in Semarang, Indonesia, using multi-sensor satellite data. Adv. Space Res. 2018, 61, 2159–2179. [Google Scholar] [CrossRef]
- Su, S.; Pi, J.; Wan, C.; Li, H.; Xiao, R.; Li, B. Categorizing social vulnerability patterns in Chinese coastal cities. Ocean Coast. Manag. 2015, 116, 1–8. [Google Scholar] [CrossRef]
- Kantamaneni, K.; Phillips, M.; Thomas, T.; Jenkins, R. Assessing coastal vulnerability: Development of a combined physical and economic index. Ocean Coast. Manag. 2018, 158, 164–175. [Google Scholar] [CrossRef] [Green Version]
- Tragaki, A.; Gallousi, C.; Karymbalis, E. Coastal Hazard Vulnerability Assessment Based on Geomorphic, Oceanographic and Demographic Parameters: The Case of the Peloponnese (Southern Greece). Land 2018, 7, 56. [Google Scholar] [CrossRef]
- Mavromatidi, A.; Briche, E.; Claeys, C. Mapping and analyzing socio-environmental vulnerability to coastal hazards induced by climate change: An application to coastal Mediterranean cities in France. Cities 2018, 72, 189–200. [Google Scholar] [CrossRef]
- Lee, Y.-J. Relationships among Environmental Attitudes, Risk Perceptions, and Coping Behavior: A Case Study of Four Environmentally Sensitive Townships in Yunlin County, Taiwan. Sustainability 2018, 10, 2663. [Google Scholar] [CrossRef]
- Toubes, D.R.; Gössling, S.; Hall, C.M.; Scott, D. Vulnerability of Coastal Beach Tourism to Flooding: A Case Study of Galicia, Spain. Environments 2017, 4, 83. [Google Scholar] [CrossRef]
- Ahmed, B.; Kelman, I.; Fehr, H.K.; Saha, M. Community Resilience to Cyclone Disasters in Coastal Bangladesh. Sustainability 2016, 8, 805. [Google Scholar] [CrossRef]
- Becker, P. Dark Side of Development: Modernity, Disaster Risk and Sustainable Livelihoods in Two Coastal Communities in Fiji. Sustainability 2017, 9, 2315. [Google Scholar] [CrossRef]
- Brown, J.M.; Morrissey, K.; Knight, P.; Prime, T.D.; Almeida, L.P.; Masselink, G.; Bird, C.O.; Dodds, D.; Plater, A.J. A coastal vulnerability assessment for planning climate resilient infrastructure. Ocean Coast. Manag. 2018, 163, 101–112. [Google Scholar] [CrossRef]
- Kantamaneni, K.; Du, X.; Aher, S.; Singh, R.M. Building Blocks: A Quantitative Approach for Evaluating Coastal Vulnerability. Water 2017, 9, 905. [Google Scholar] [CrossRef]
- Sahoo, B.; Bhaskaran, P.K. Multi-hazard risk assessment of coastal vulnerability from tropical cyclones—A GIS based approach for the Odisha coast. J. Environ. Manag. 2018, 206, 1166–1178. [Google Scholar] [CrossRef] [PubMed]
- Pérez-Maqueo, O.; Martínez, M.L.; Sánchez-Barradas, F.C.; Kolb, M. Assessing Nature-Based Coastal Protection against Disasters Derived from Extreme Hydrometeorological Events in Mexico. Sustainability 2018, 10, 1317. [Google Scholar] [CrossRef]
- Santos-Lacueva, R.; Clavé, S.A.; Saladié, Ò. The Vulnerability of Coastal Tourism Destinations to Climate Change: The Usefulness of Policy Analysis. Sustainability 2017, 9, 2062. [Google Scholar] [CrossRef]
- Amuzu, J.; Jallow, B.P.; Kabo-Bah, A.T.; Yaffa, S. The Climate Change Vulnerability and Risk Management Matrix for the Coastal Zone of The Gambia. Hydrology 2018, 5, 14. [Google Scholar] [CrossRef]
- Lins-de-Barros, F.M. Integrated coastal vulnerability assessment: A methodology for coastal cities management integrating socioeconomic, physical and environmental dimensions–Case study of Região dos Lagos, Rio de Janeiro, Brazil. Ocean Coast. Manag. 2017, 149, 1–11. [Google Scholar] [CrossRef]
- Di Luccio, D.; Benassai, G.; Di Paola, G.; Rosskopf, C.M.; Mucerino, L.; Montella, R.; Contestabile, P. Monitoring and Modelling Coastal Vulnerability and Mitigation Proposal for an Archaeological Site (Kaulonia, Southern Italy). Sustainability 2018, 10, 2017. [Google Scholar] [CrossRef]
- Ruol, P.; Martinelli, L.; Favaretto, C. Vulnerability Analysis of the Venetian Littoral and Adopted Mitigation Strategy. Water 2018, 10, 984. [Google Scholar] [CrossRef]
- Ouillon, S. Why and How Do We Study Sediment Transport? Focus on Coastal Zones and Ongoing Methods. Water 2018, 10, 390. [Google Scholar] [CrossRef]
- Panpeng, J.; Ahmad, M.M. Vulnerability of Fishing Communities from Sea-Level Change: A Study of Laemsing District in Chanthaburi Province, Thailand. Sustainability 2017, 9, 1388. [Google Scholar] [CrossRef]
- Li, Y.; Zhang, X.; Zhao, X.; Ma, S.; Cao, H.; Cao, J. Assessing spatial vulnerability from rapid urbanization to inform coastal urban regional planning. Ocean Coast. Manag. 2016, 123, 53–65. [Google Scholar] [CrossRef]
- Newton, A.; Weichselgartner, J. Hotspots of coastal vulnerability: A DPSIR analysis to find societal pathways and responses. Estuar. Coast. Shelf Sci. 2014, 140, 123–133. [Google Scholar] [CrossRef]
- Ostrom, E. A General Framework for Analyzing Sustainability of Social-Ecological Systems. Science 2009, 325, 419–422. [Google Scholar] [CrossRef] [PubMed]
- Garcia-Ayllon, S. The Integrated Territorial Investment (ITI) of the Mar Menor as a model for the future in the comprehensive management of enclosed coastal seas. Ocean Coast. Manag. 2018, 166, 82–97. [Google Scholar] [CrossRef]
- Lathrop, R.; Auermuller, L.; Trimble, J.; Bognar, J. The Application of WebGIS Tools for Visualizing Coastal Flooding Vulnerability and Planning for Resiliency: The New Jersey Experience. ISPRS Int. J. Geo-Inf. 2014, 3, 408–429. [Google Scholar] [CrossRef] [Green Version]
- Williams, S.J.; Ismail, N. Climate Change, Coastal Vulnerability and the Need for Adaptation Alternatives: Planning and Design Examples from Egypt and the USA. J. Mar. Sci. Eng. 2015, 3, 591–606. [Google Scholar] [CrossRef] [Green Version]
- García-Ayllón, S. Integrated management in coastal lagoons of highly complexity environments: Resilience comparative analysis for three case-studies. Ocean Coast. Manag. 2017, 143. [Google Scholar] [CrossRef]
- Hou, D.; O’Connor, D.; Nathanail, P.; Tian, L.; Ma, Y. Integrated GIS and multivariate statistical analysis for regional scale assessment of heavy metal soil contamination: A critical review. Environ. Pollut. 2017, 231, 1188–1200. [Google Scholar] [CrossRef] [PubMed]
- Rahayuningsih, T.; Muntasib, E.K.S.H. Nature Based Tourism Resources Assessment Using Geographic Information System (GIS): Case Study in Bogor. Procedia Environ. Sci. 2016, 33, 365–375. [Google Scholar] [CrossRef]
- Zanetti, V.B.; de Sousa Junior, W.C.; De Freitas, D.M. A Climate Change Vulnerability Index and Case Study in a Brazilian Coastal City. Sustainability 2016, 8, 811. [Google Scholar] [CrossRef]
- García-Ayllón, S. GIS Assessment of Mass Tourism Anthropization in Sensitive Coastal Environments: Application to a Case Study in the Mar Menor Area. Sustainability 2018, 10, 1344. [Google Scholar] [CrossRef]
- García-Ayllón, S. Retro-diagnosis methodology for land consumption analysis towards sustainable future scenarios: Application to a mediterranean coastal area. J. Clean. Prod. 2018, 195, 1408–1421. [Google Scholar] [CrossRef]
- García-Ayllón, S. Diagnosis of complex coastal ecological systems: Environmental GIS analysis of a highly stressed Mediterranean lagoon through spatiotemporal indicators. Ecol. Indic. 2017, 83. [Google Scholar] [CrossRef]
- García-Sánchez, M.; Pérez-Ruzafa, I.M.; Marcos, C.; Pérez-Ruzafa, A. Suitability of benthic macrophyte indices (EEI, E-MaQI and BENTHOS) for detecting anthropogenic pressures in a Mediterranean coastal lagoon (Mar Menor, Spain). Ecol. Indic. 2012, 19, 48–60. [Google Scholar] [CrossRef]
- Pérez-Ruzafa, A.; Marcos, C.; Bernal, C.M.; García-Sánchez, M.; Pérez-Ruzafa, I.M. Cymodocea nodosa vs. Caulerpa prolifera: Causes and consequences of a long term history of interaction in macrophyte meadows in the Mar Menor coastal lagoon (Spain, southwestern Mediterranean). Estuar. Coast. Shelf Sci. 2012, 110, 101–115. [Google Scholar] [CrossRef]
- Robledano, F.; Esteve, M.A.; Martínez-Fernández, J.; Farinós, P. Determinants of wintering waterbird changes in a Mediterranean coastal lagoon affected by eutrophication. Ecol. Indic. 2011, 11, 395–406. [Google Scholar] [CrossRef]
- Garcia-Ayllon, S. Geographic Information System (GIS) Analysis of Impacts in the Tourism Area Life Cycle (TALC) of a Mediterranean Resort. Int. J. Tour. Res. 2016, 18, 186–196. [Google Scholar] [CrossRef]
- Perez-Ruzafa, A.; Marcos-Diego, C.; Ros, J.D. Environmental and biological changes related to recent human activities in the Mar Menor (SE of Spain). Mar. Pollut. Bull. 1991, 23, 747–751. [Google Scholar] [CrossRef]
- García-Ayllón, S. La Manga case study: Consequences from short-term urban planning in a tourism mass destiny of the Spanish Mediterranean coast. Cities 2015, 43, 141–151. [Google Scholar] [CrossRef]
- Region de Murcia SIT Murcia: Visor del Sistema de Informacion Territorial. Available online: http://sitmurcia.es/visor/? (accessed on 14 August 2018).
- De Pascalis, F.; Pérez-Ruzafa, A.; Gilabert, J.; Marcos, C.; Umgiesser, G. Climate change response of the Mar Menor coastal lagoon (Spain) using a hydrodynamic finite element model. Estuar. Coast. Shelf Sci. 2012, 114, 118–129. [Google Scholar] [CrossRef]
- Velasco, A.M.; Pérez-Ruzafa, A.; Martínez-Paz, J.M.; Marcos, C. Ecosystem services and main environmental risks in a coastal lagoon (Mar Menor, Murcia, SE Spain): The public perception. J. Nat. Conserv. 2018, 43, 180–189. [Google Scholar] [CrossRef]
- Robledano, F.; Esteve, M.A.; Calvo, J.F.; Martínez-Paz, J.M.; Farinós, P.; Carreño, M.F.; Soto, I.; Avilés, M.; Ballesteros, G.A.; Martínez-Baños, P.; et al. Multi-criteria assessment of a proposed ecotourism, environmental education and research infrastructure in a unique lagoon ecosystem: The Encañizadas del Mar Menor (Murcia, SE Spain). J. Nat. Conserv. 2018, 43, 201–210. [Google Scholar] [CrossRef]
- García-Ayllón, S.; Miralles, J.L. The environmental impacts of land transformation in the coastal perimeter of the mar menor lagoon (SPAIN). Int. J. Des. Nat. Ecodyn. 2014, 9, 109–128. [Google Scholar] [CrossRef]
- MARM. Guía Metodológica para el Desarrollo del Sistema Nacional de Cartografía de Zonas Inundables; MARM: Madrid, Spain, 2011; ISBN 978-84-491-1136-5. [Google Scholar]
- Laface, V.; Malara, G.; Romolo, A.; Arena, F. Peak over threshold vis-à-vis equivalent triangular storm: Return value sensitivity to storm threshold. Coast. Eng. 2016, 116, 220–235. [Google Scholar] [CrossRef]
- Iturrioz, A.; Guanche, R.; Armesto, J.A.; Alves, M.A.; Vidal, C.; Losada, I.J. Time-domain modeling of a fixed detached oscillating water column towards a floating multi-chamber device. Ocean Eng. 2014, 76, 65–74. [Google Scholar] [CrossRef]
- Camus, P.; Mendez, F.J.; Medina, R.; Tomas, A.; Izaguirre, C. High resolution downscaled ocean waves (DOW) reanalysis in coastal areas. Coast. Eng. 2013, 72, 56–68. [Google Scholar] [CrossRef]
- Universidad de Cantabria Proyecto C3E. Available online: http://www.c3e.ihcantabria.com/ (accessed on 18 August 2018).
- European Union. Directive 2007/60/EC of the European Parliament and of the Council of 23 October 2007 on the Assessment and Management of Flood Risks; European Union: Brussels, Belgium, 2007. [Google Scholar]
- Wu, C. Handbook of Applied Spatial Analysis: Software Tools, Methods and Applications edited by Manfred, M. Fischer and Arthur Getis. J. Reg. Sci. 2012, 52, 386–388. [Google Scholar] [CrossRef]
- Anselin, L. Local Indicators of Spatial Association—LISA. Geogr. Anal. 1995, 27, 93–115. [Google Scholar] [CrossRef]
- Ministry of Environment Agriculture and Water of Spain National System of Cartography of Floodplains. Available online: https://sig.mapama.gob.es/snczi/visor.html?herramienta=DPHZI (accessed on 14 August 2018).
- Stefanova, A.; Hesse, C.; Krysanova, V. Combined Impacts of Medium Term Socio-Economic Changes and Climate Change on Water Resources in a Managed Mediterranean Catchment. Water 2015, 7, 1538–1567. [Google Scholar] [CrossRef] [Green Version]
- Hesse, C.; Stefanova, A.; Krysanova, V. Comparison of Water Flows in Four European Lagoon Catchments under a Set of Future Climate Scenarios. Water 2015, 7, 716–746. [Google Scholar] [CrossRef] [Green Version]
- García-Ayllón, S.; Miralles, J.L. The feedback between a tourism model and urban planning in La Manga, a mass tourist destination on the Spanish coast. WIT Trans. Ecol. Environ. 2014, 187, 339–349. [Google Scholar] [CrossRef]
- García-Sánchez, M.; Korbee, N.; Pérez-Ruzafa, I.M.; Marcos, C.; Domínguez, B.; Figueroa, F.L.; Pérez-Ruzafa, Á. Physiological response and photoacclimation capacity of Caulerpa prolifera (Forsskål) J.V. Lamouroux and Cymodocea nodosa (Ucria) Ascherson meadows in the Mar Menor lagoon (SE Spain). Mar. Environ. Res. 2012, 79, 37–47. [Google Scholar] [CrossRef] [PubMed]
- Pérez-Ruzafa, A.; García-Charton, J.A.; Barcala, E.; Marcos, C. Changes in benthic fish assemblages as a consequence of coastal works in a coastal lagoon: The Mar Menor (Spain, Western Mediterranean). Mar. Pollut. Bull. 2006, 53, 107–120. [Google Scholar] [CrossRef] [PubMed]
- González-Wangüemert, M.; Giménez-Casalduero, F.; Pérez-Ruzafa, Á. Genetic differentiation of Elysia timida (Risso, 1818) populations in the Southwest Mediterranean and Mar Menor coastal lagoon. Biochem. Syst. Ecol. 2006, 34, 514–527. [Google Scholar] [CrossRef]
- García-Oliva, M.; Pérez-Ruzafa, Á.; Umgiesser, G.; McKiver, W.; Ghezzo, M.; De Pascalis, F.; Marcos, C. Assessing the Hydrodynamic Response of the Mar Menor Lagoon to Dredging Inlets Interventions through Numerical Modelling. Water 2018, 10, 959. [Google Scholar] [CrossRef]
- Pérez-Ruzafa, A.; De Pascalis, F.; Ghezzo, M.; Quispe-Becerra, J.I.; Hernández-García, R.; Muñoz, I.; Vergara, C.; Pérez-Ruzafa, I.M.; Umgiesser, G.; Marcos, C. Connectivity between coastal lagoons and sea: Asymmetrical effects on assemblages’ and populations’ structure. Estuar. Coast. Shelf Sci. 2018. [Google Scholar] [CrossRef]
- García-Pintado, J.; Martínez-Mena, M.; Barberá, G.G.; Albaladejo, J.; Castillo, V.M. Anthropogenic nutrient sources and loads from a Mediterranean catchment into a coastal lagoon: Mar Menor, Spain. Sci. Total Environ. 2007, 373, 220–239. [Google Scholar] [CrossRef] [PubMed]
- Moreno-González, R.; Campillo, J.A.; León, V.M. Influence of an intensive agricultural drainage basin on the seasonal distribution of organic pollutants in seawater from a Mediterranean coastal lagoon (Mar Menor, SE Spain). Mar. Pollut. Bull. 2013, 77, 400–411. [Google Scholar] [CrossRef] [PubMed]
- Campillo, J.A.; Sevilla, A.; Albentosa, M.; Bernal, C.; Lozano, A.B.; Cánovas, M.; León, V.M. Metabolomic responses in caged clams, Ruditapes decussatus, exposed to agricultural and urban inputs in a Mediterranean coastal lagoon (Mar Menor, SE Spain). Sci. Total Environ. 2015, 524–525, 136–147. [Google Scholar] [CrossRef] [PubMed]
- Baudron, P.; Cockenpot, S.; Lopez-Castejon, F.; Radakovitch, O.; Gilabert, J.; Mayer, A.; Garcia-Arostegui, J.L.; Martinez-Vicente, D.; Leduc, C.; Claude, C. Combining radon, short-lived radium isotopes and hydrodynamic modeling to assess submarine groundwater discharge from an anthropized semiarid watershed to a Mediterranean lagoon (Mar Menor, SE Spain). J. Hydrol. 2015, 525, 55–71. [Google Scholar] [CrossRef]
- García, G.; Muñoz-Vera, A. Characterization and evolution of the sediments of a Mediterranean coastal lagoon located next to a former mining area. Mar. Pollut. Bull. 2015, 100, 249–263. [Google Scholar] [CrossRef] [PubMed]
- Martínez-Graña, A.; Gómez, D.; Santos-Francés, F.; Bardají, T.; Goy, J.L.; Zazo, C. Analysis of Flood Risk Due to Sea Level Rise in the Menor Sea (Murcia, Spain). Sustainability 2018, 10, 780. [Google Scholar] [CrossRef]
Figure 1.
Scope of the study (source: SITmurcia [43]).
Figure 1.
Scope of the study (source: SITmurcia [43]).

Figure 2.
(a) Current situation of the Mar Menor: Urbanized areas, protected salt marshes and wadis. (b) La Manga ancient dune cord in 1950 (up) and now (down, source: Paisajes Españoles S.A.).
Figure 2.
(a) Current situation of the Mar Menor: Urbanized areas, protected salt marshes and wadis. (b) La Manga ancient dune cord in 1950 (up) and now (down, source: Paisajes Españoles S.A.).

Figure 3.
Floods occurred in the coastal town of Los Alcazares in (a) 1953 and (b) 2016 (source: Town Council of Los Alcazares).
Figure 3.
Floods occurred in the coastal town of Los Alcazares in (a) 1953 and (b) 2016 (source: Town Council of Los Alcazares).

Figure 4.
Marinas and coastal infrastructures built in the Mar Menor and the Mediterranean Sea since the 1950’s (data source: SITmurcia [43]).
Figure 4.
Marinas and coastal infrastructures built in the Mar Menor and the Mediterranean Sea since the 1950’s (data source: SITmurcia [43]).

Figure 5.
Marinas and coastal infrastructures of the Mar Menor and the Mediterranean Sea (data source: SITmurcia [43]).
Figure 5.
Marinas and coastal infrastructures of the Mar Menor and the Mediterranean Sea (data source: SITmurcia [43]).

Figure 6.
Mapping of index for seaside impacts associated to urbanization. The accelerated evolution of urban sprawl in the population of Los Alcazares in 1956–1981–2017 is detailed in red on the left. The most significant cases of dune shrinkage phenomena on the beaches of the Mar Menor in La Manga are indicated in yellow on the right (below) and the detailed evolution of the dune profile of one of them from 1981 (marked with a red line) until 2017 (above).

Figure 7.
Tessellation of significant structural CIR impacts in the seaside edge associated to coastal alterations caused by marinas and coastal infrastructures between 1970 and 2017.
Figure 7.
Tessellation of significant structural CIR impacts in the seaside edge associated to coastal alterations caused by marinas and coastal infrastructures between 1970 and 2017.

Figure 8.
Tessellation of the mapping for significant impacts in the seaside edge associated to land alteration transformations between 1974 and 2017.
Figure 8.
Tessellation of the mapping for significant impacts in the seaside edge associated to land alteration transformations between 1974 and 2017.

Figure 9.
Forecast modeling of the danger by marine flooding on a simplified MDT of the coastal strip for a return period T = 100 years. Several detailed examples of the impact in different areas are attached (data source for GIS analysis: see Reference [56]).
Figure 9.
Forecast modeling of the danger by marine flooding on a simplified MDT of the coastal strip for a return period T = 100 years. Several detailed examples of the impact in different areas are attached (data source for GIS analysis: see Reference [56]).

Figure 10.
Modeling of the danger by fluvial flooding on a LIDAR DTM of the coastal strip for a return period T = 100 years. Three detailed examples of the impact are attached: on the urban plot in the western urban settlements (top), in the protected natural areas (middle) and in the urbanized area of the southern perimeter (below), (data source for GIS analysis: see Reference [56]).

Figure 11.
Tessellated mesh distribution of Local Anselin Moran’s I statistic for aggregated impacts and vulnerability correlation analysis with hot (HH) and cold (LL) spots and outliers (LH and HL).
Figure 11.
Tessellated mesh distribution of Local Anselin Moran’s I statistic for aggregated impacts and vulnerability correlation analysis with hot (HH) and cold (LL) spots and outliers (LH and HL).

Figure 12.
Simulation carried out in 2007 of the estimated sea level rise in different sites of La Manga for the year 2050 as a result of climate change. Source: Greenpeace.
Figure 12.
Simulation carried out in 2007 of the estimated sea level rise in different sites of La Manga for the year 2050 as a result of climate change. Source: Greenpeace.


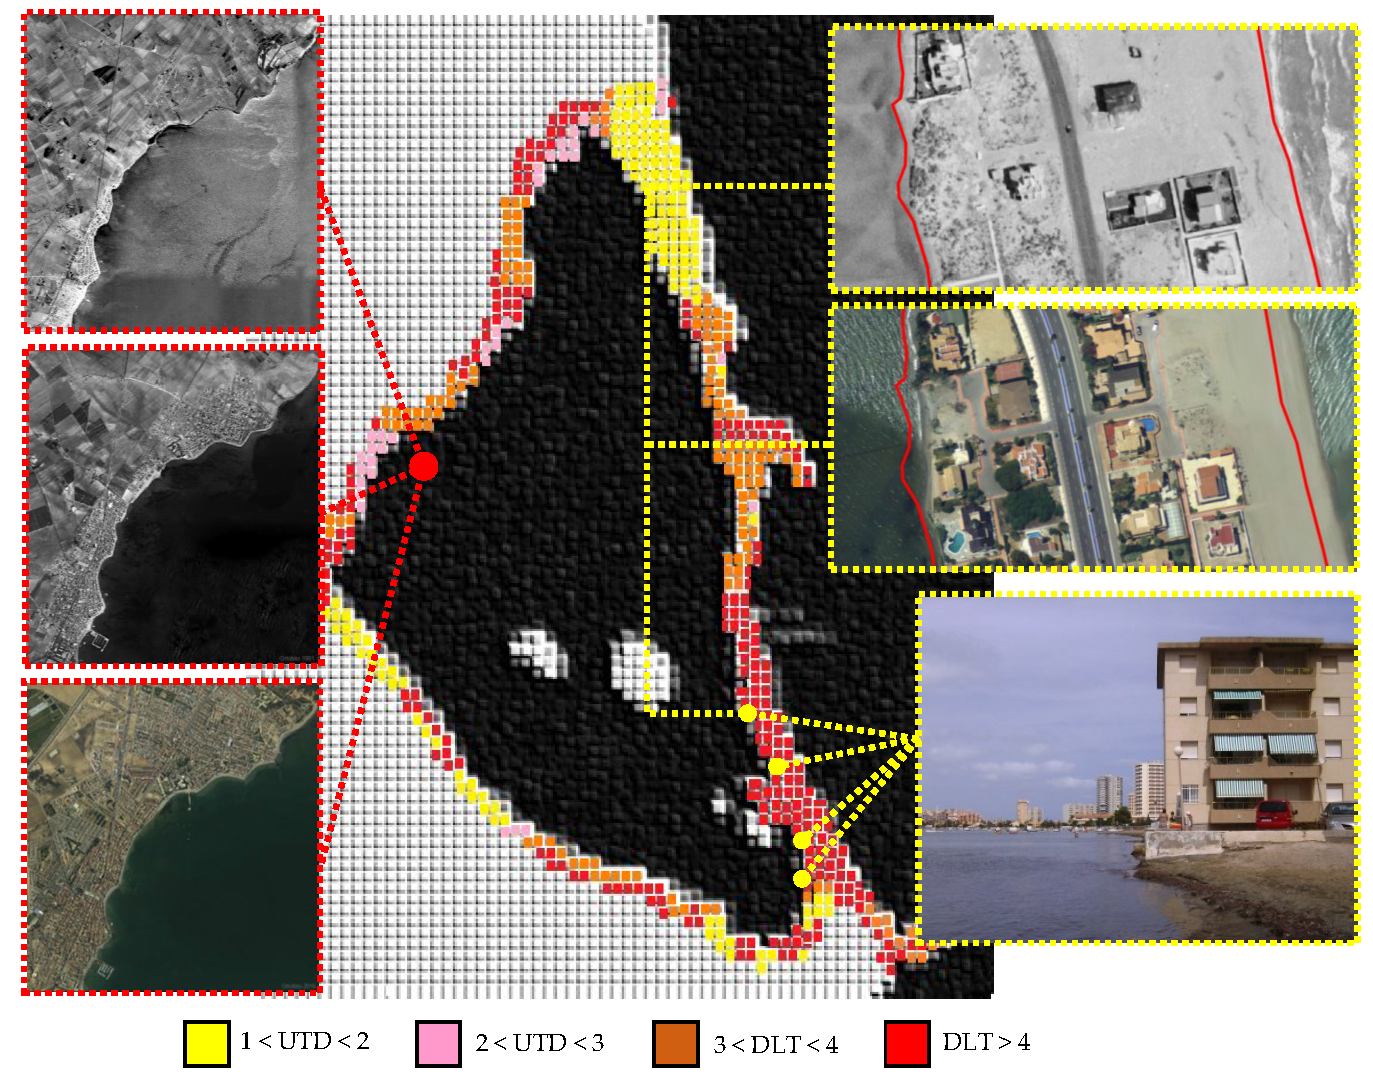
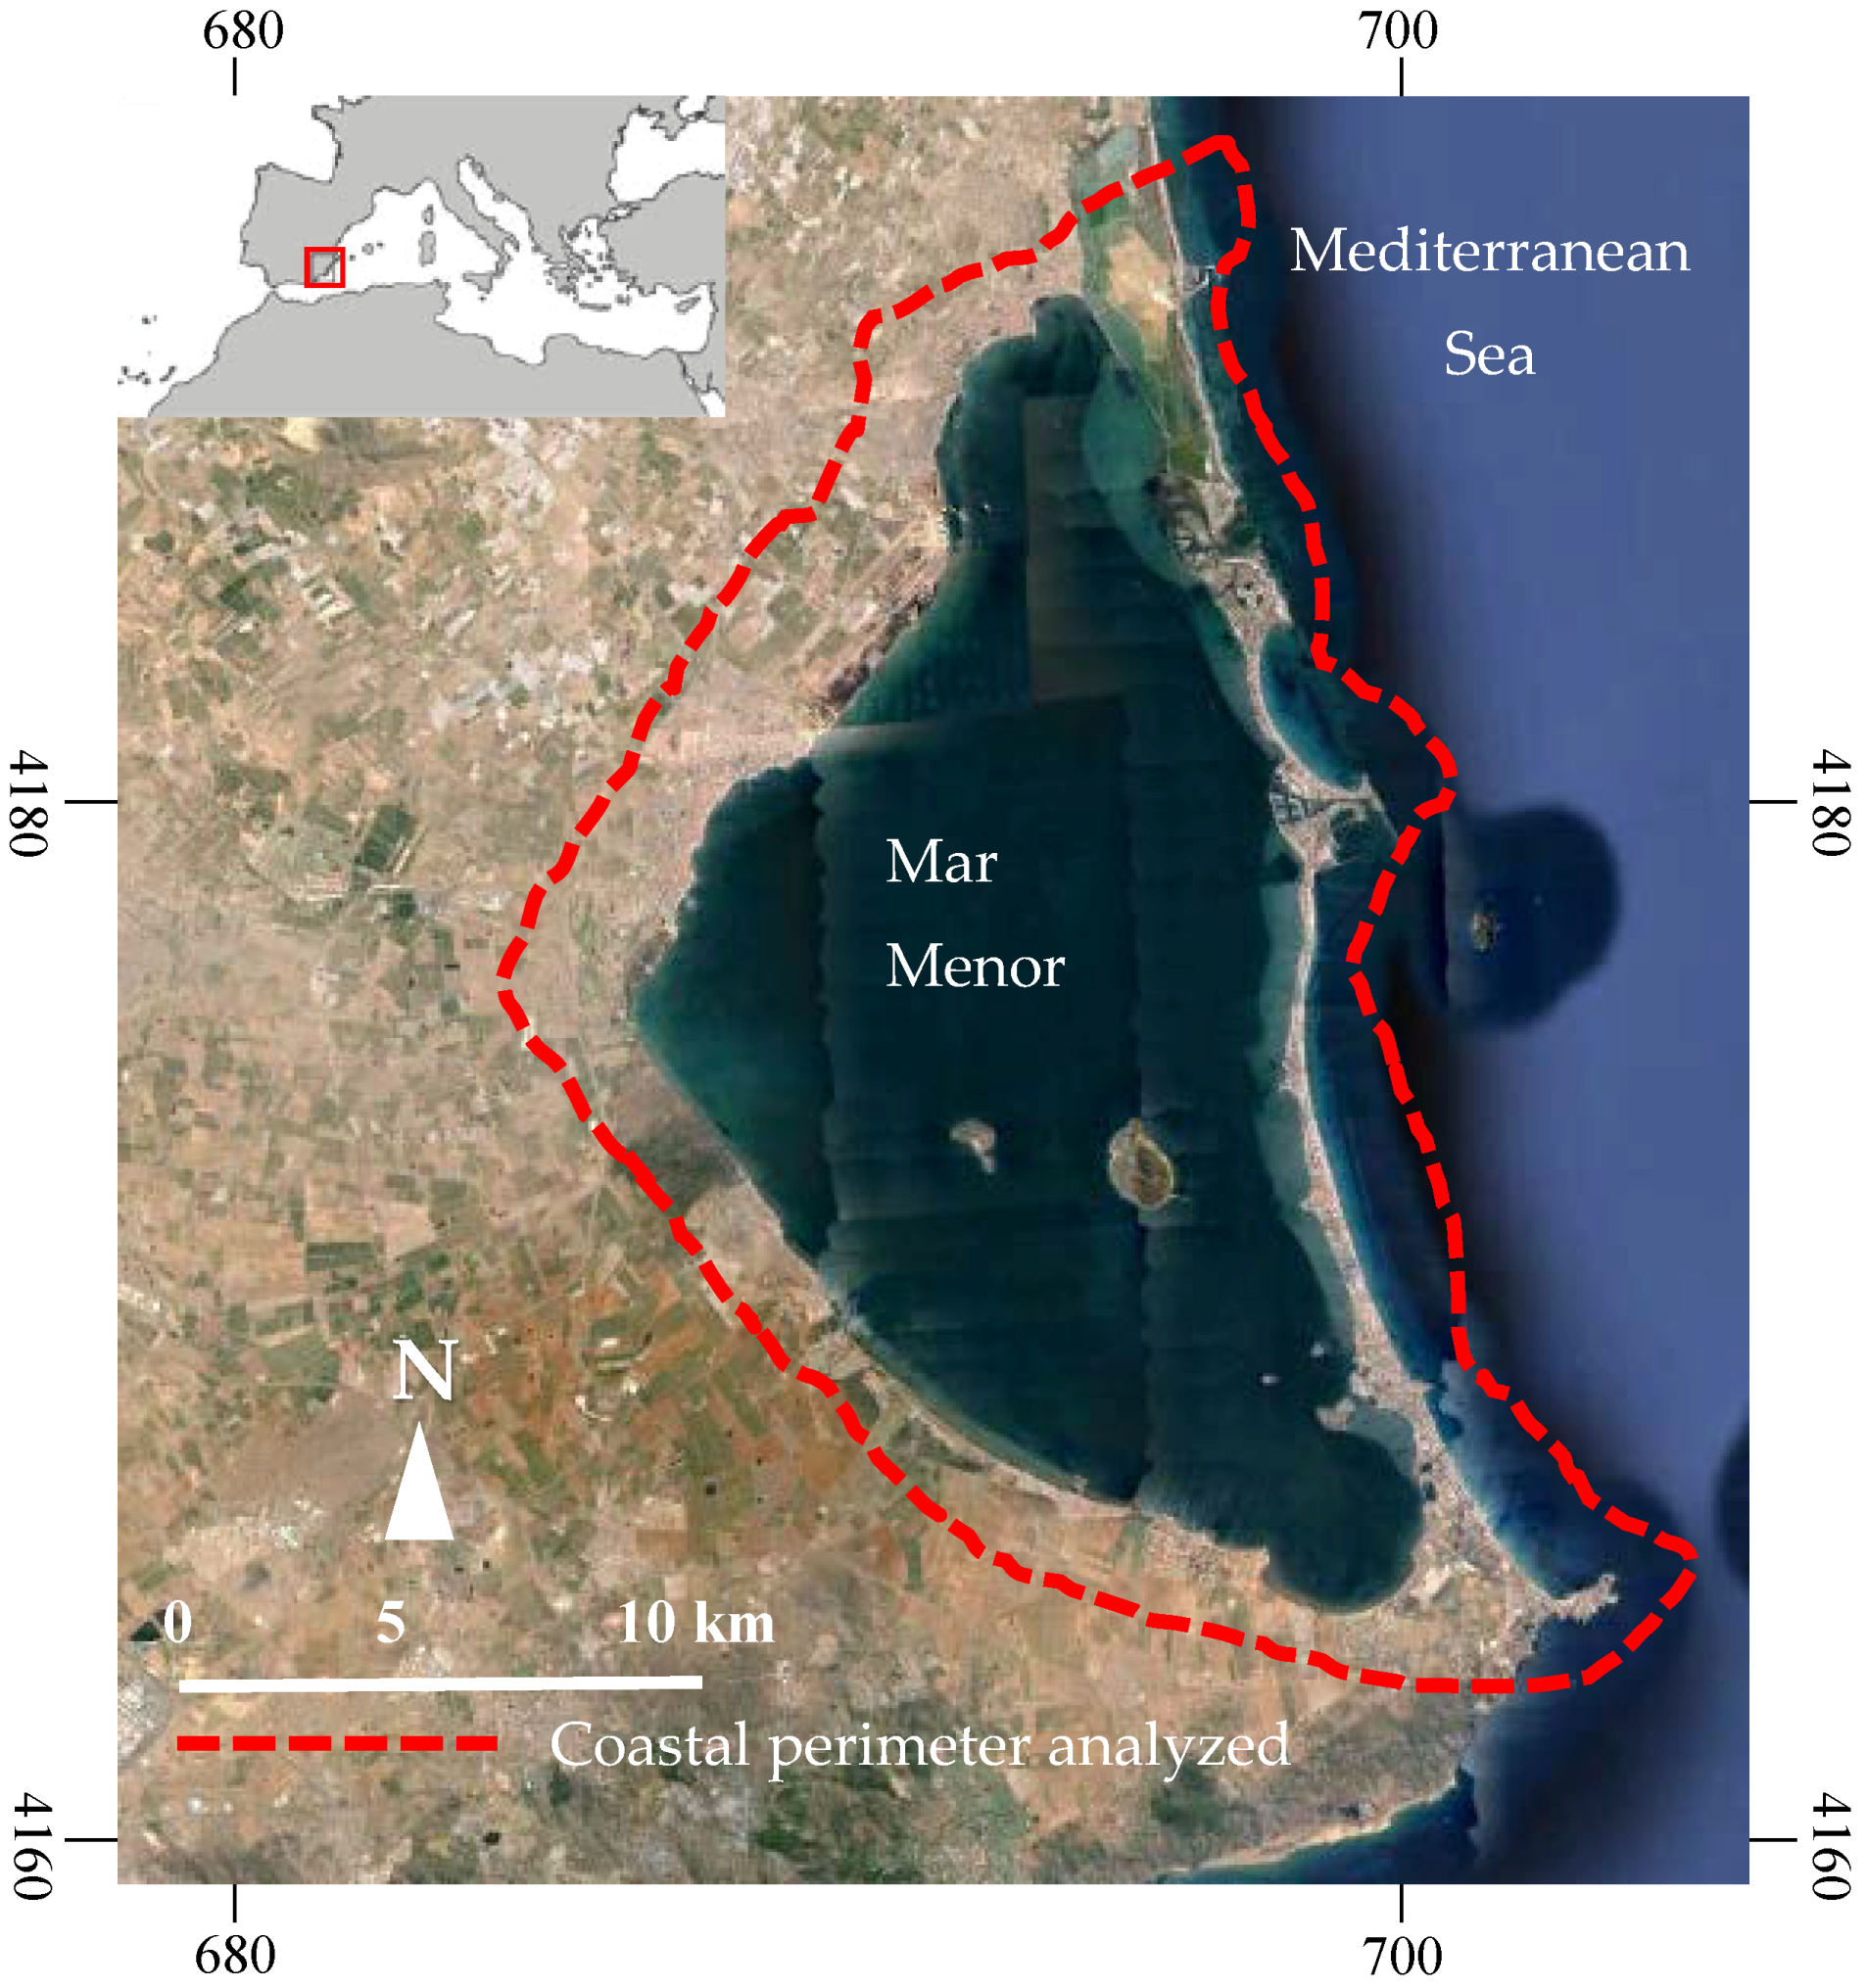
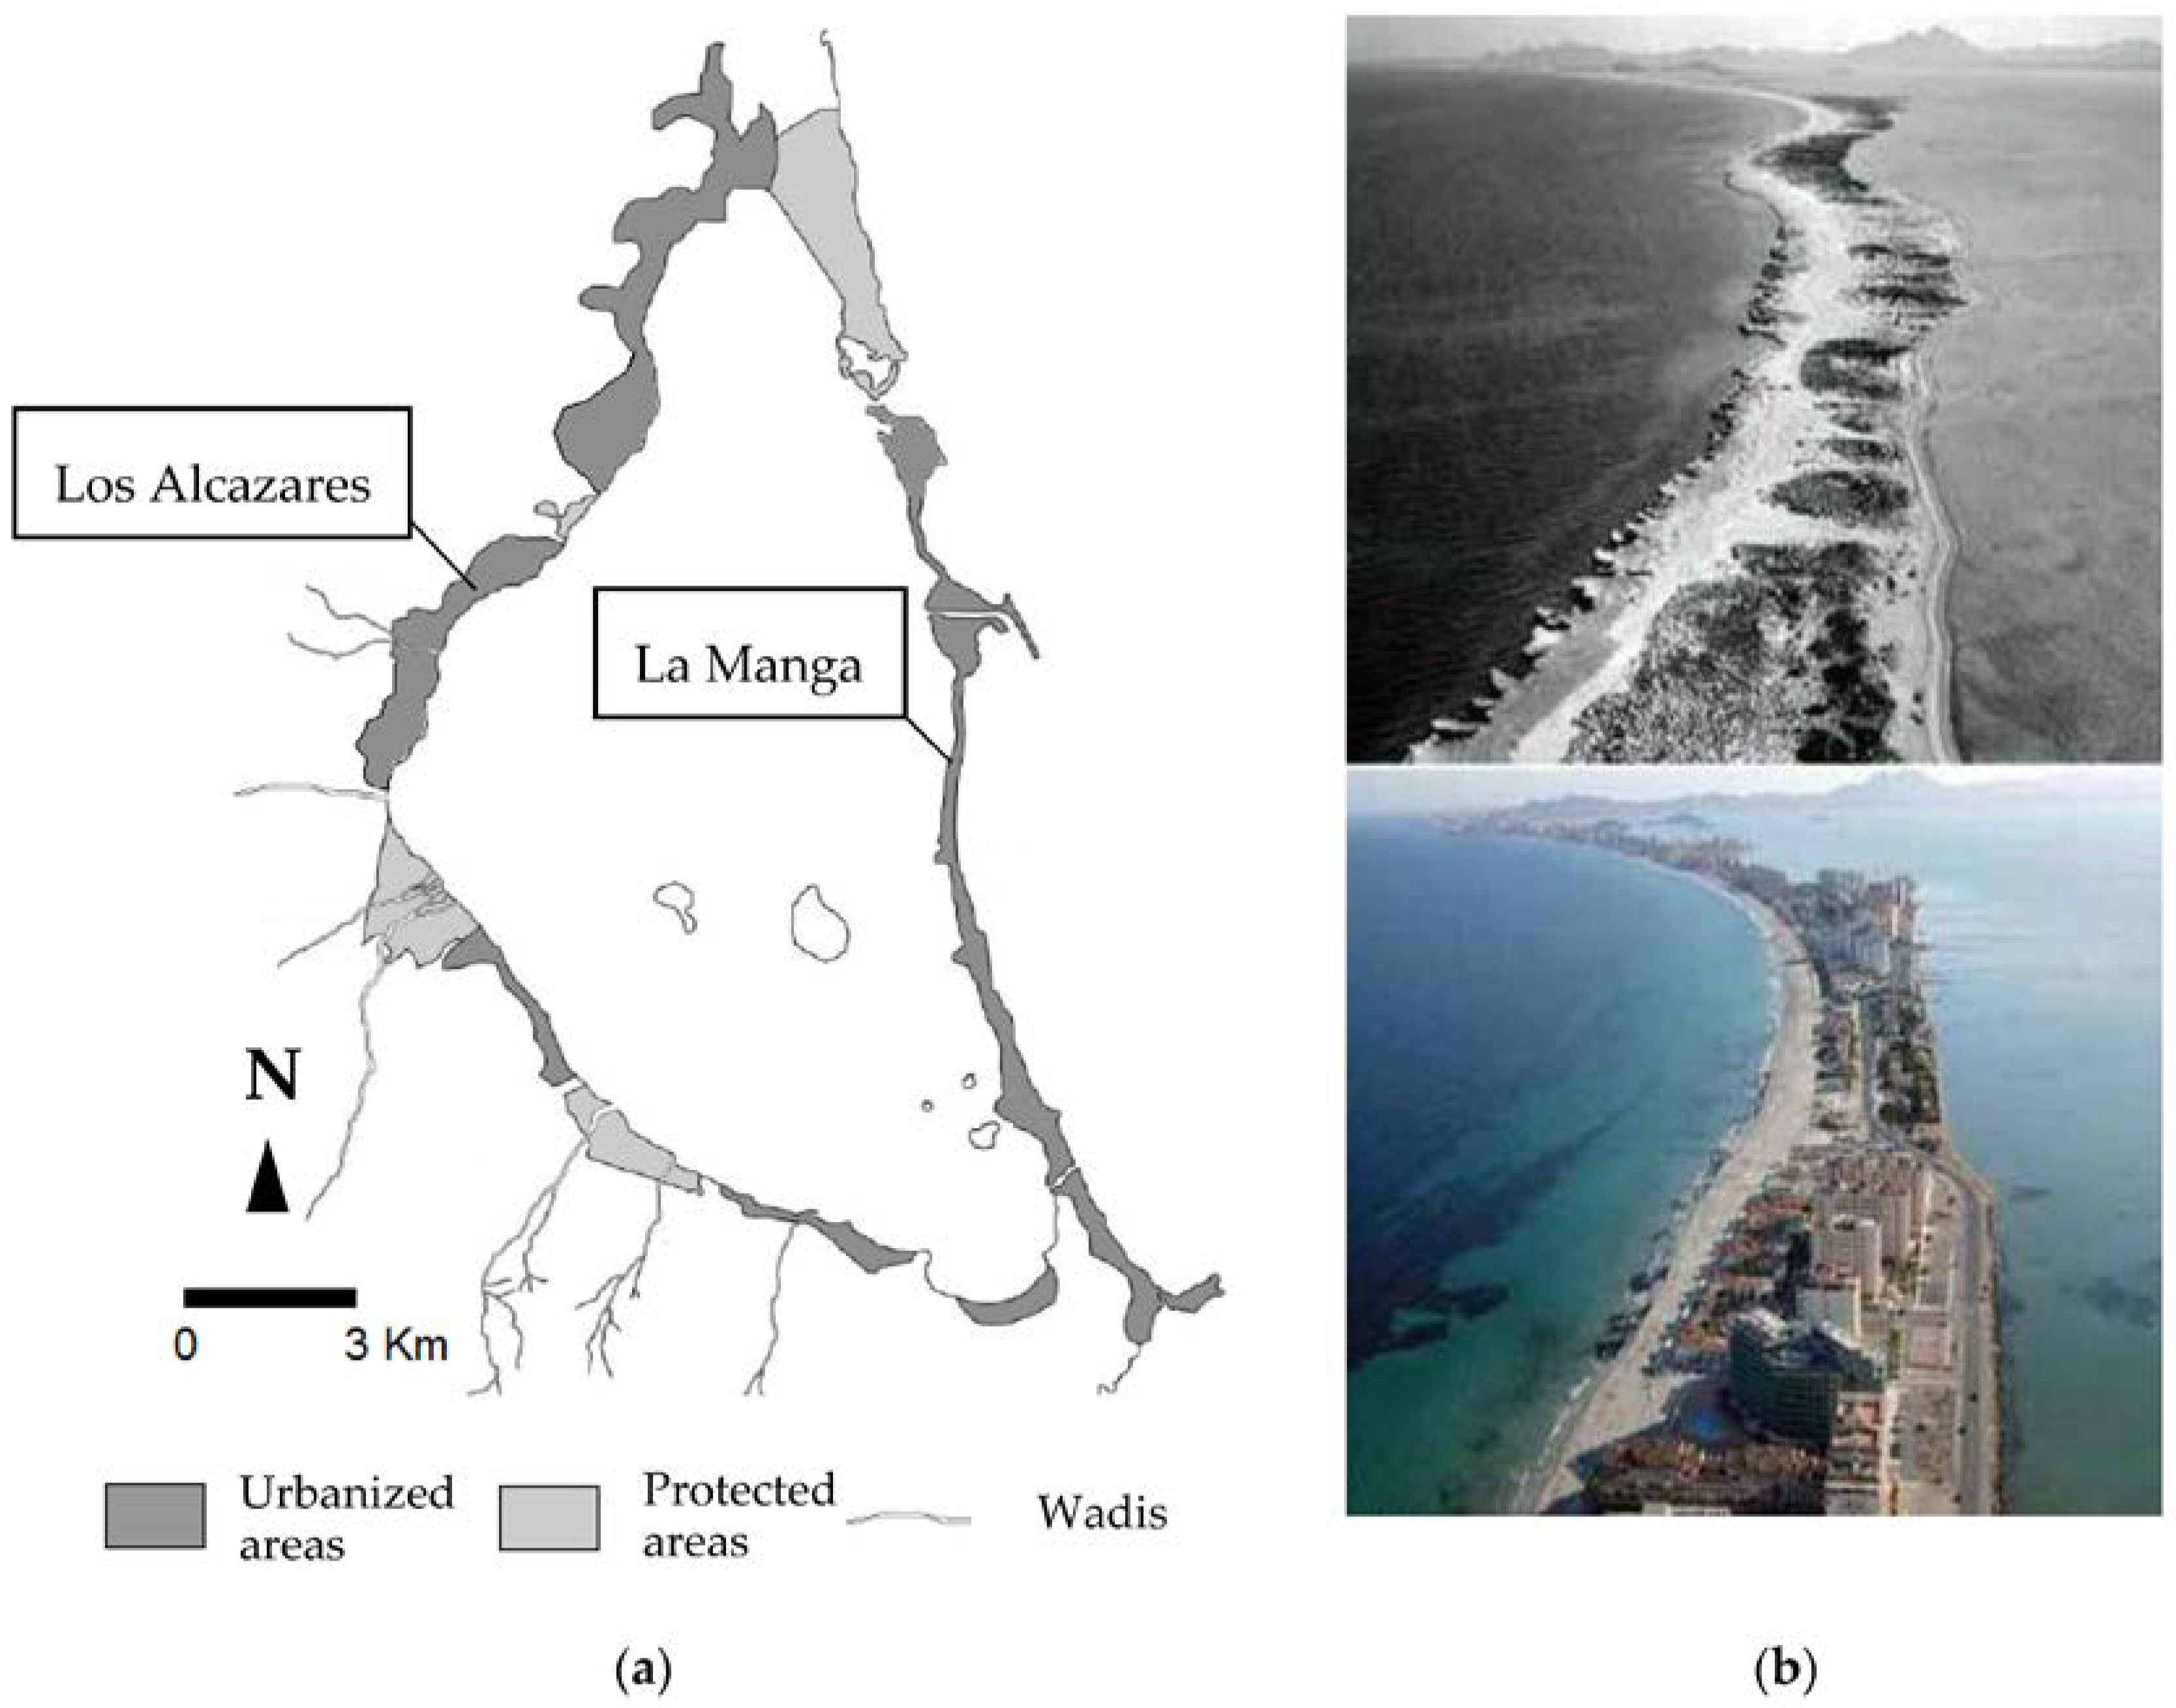
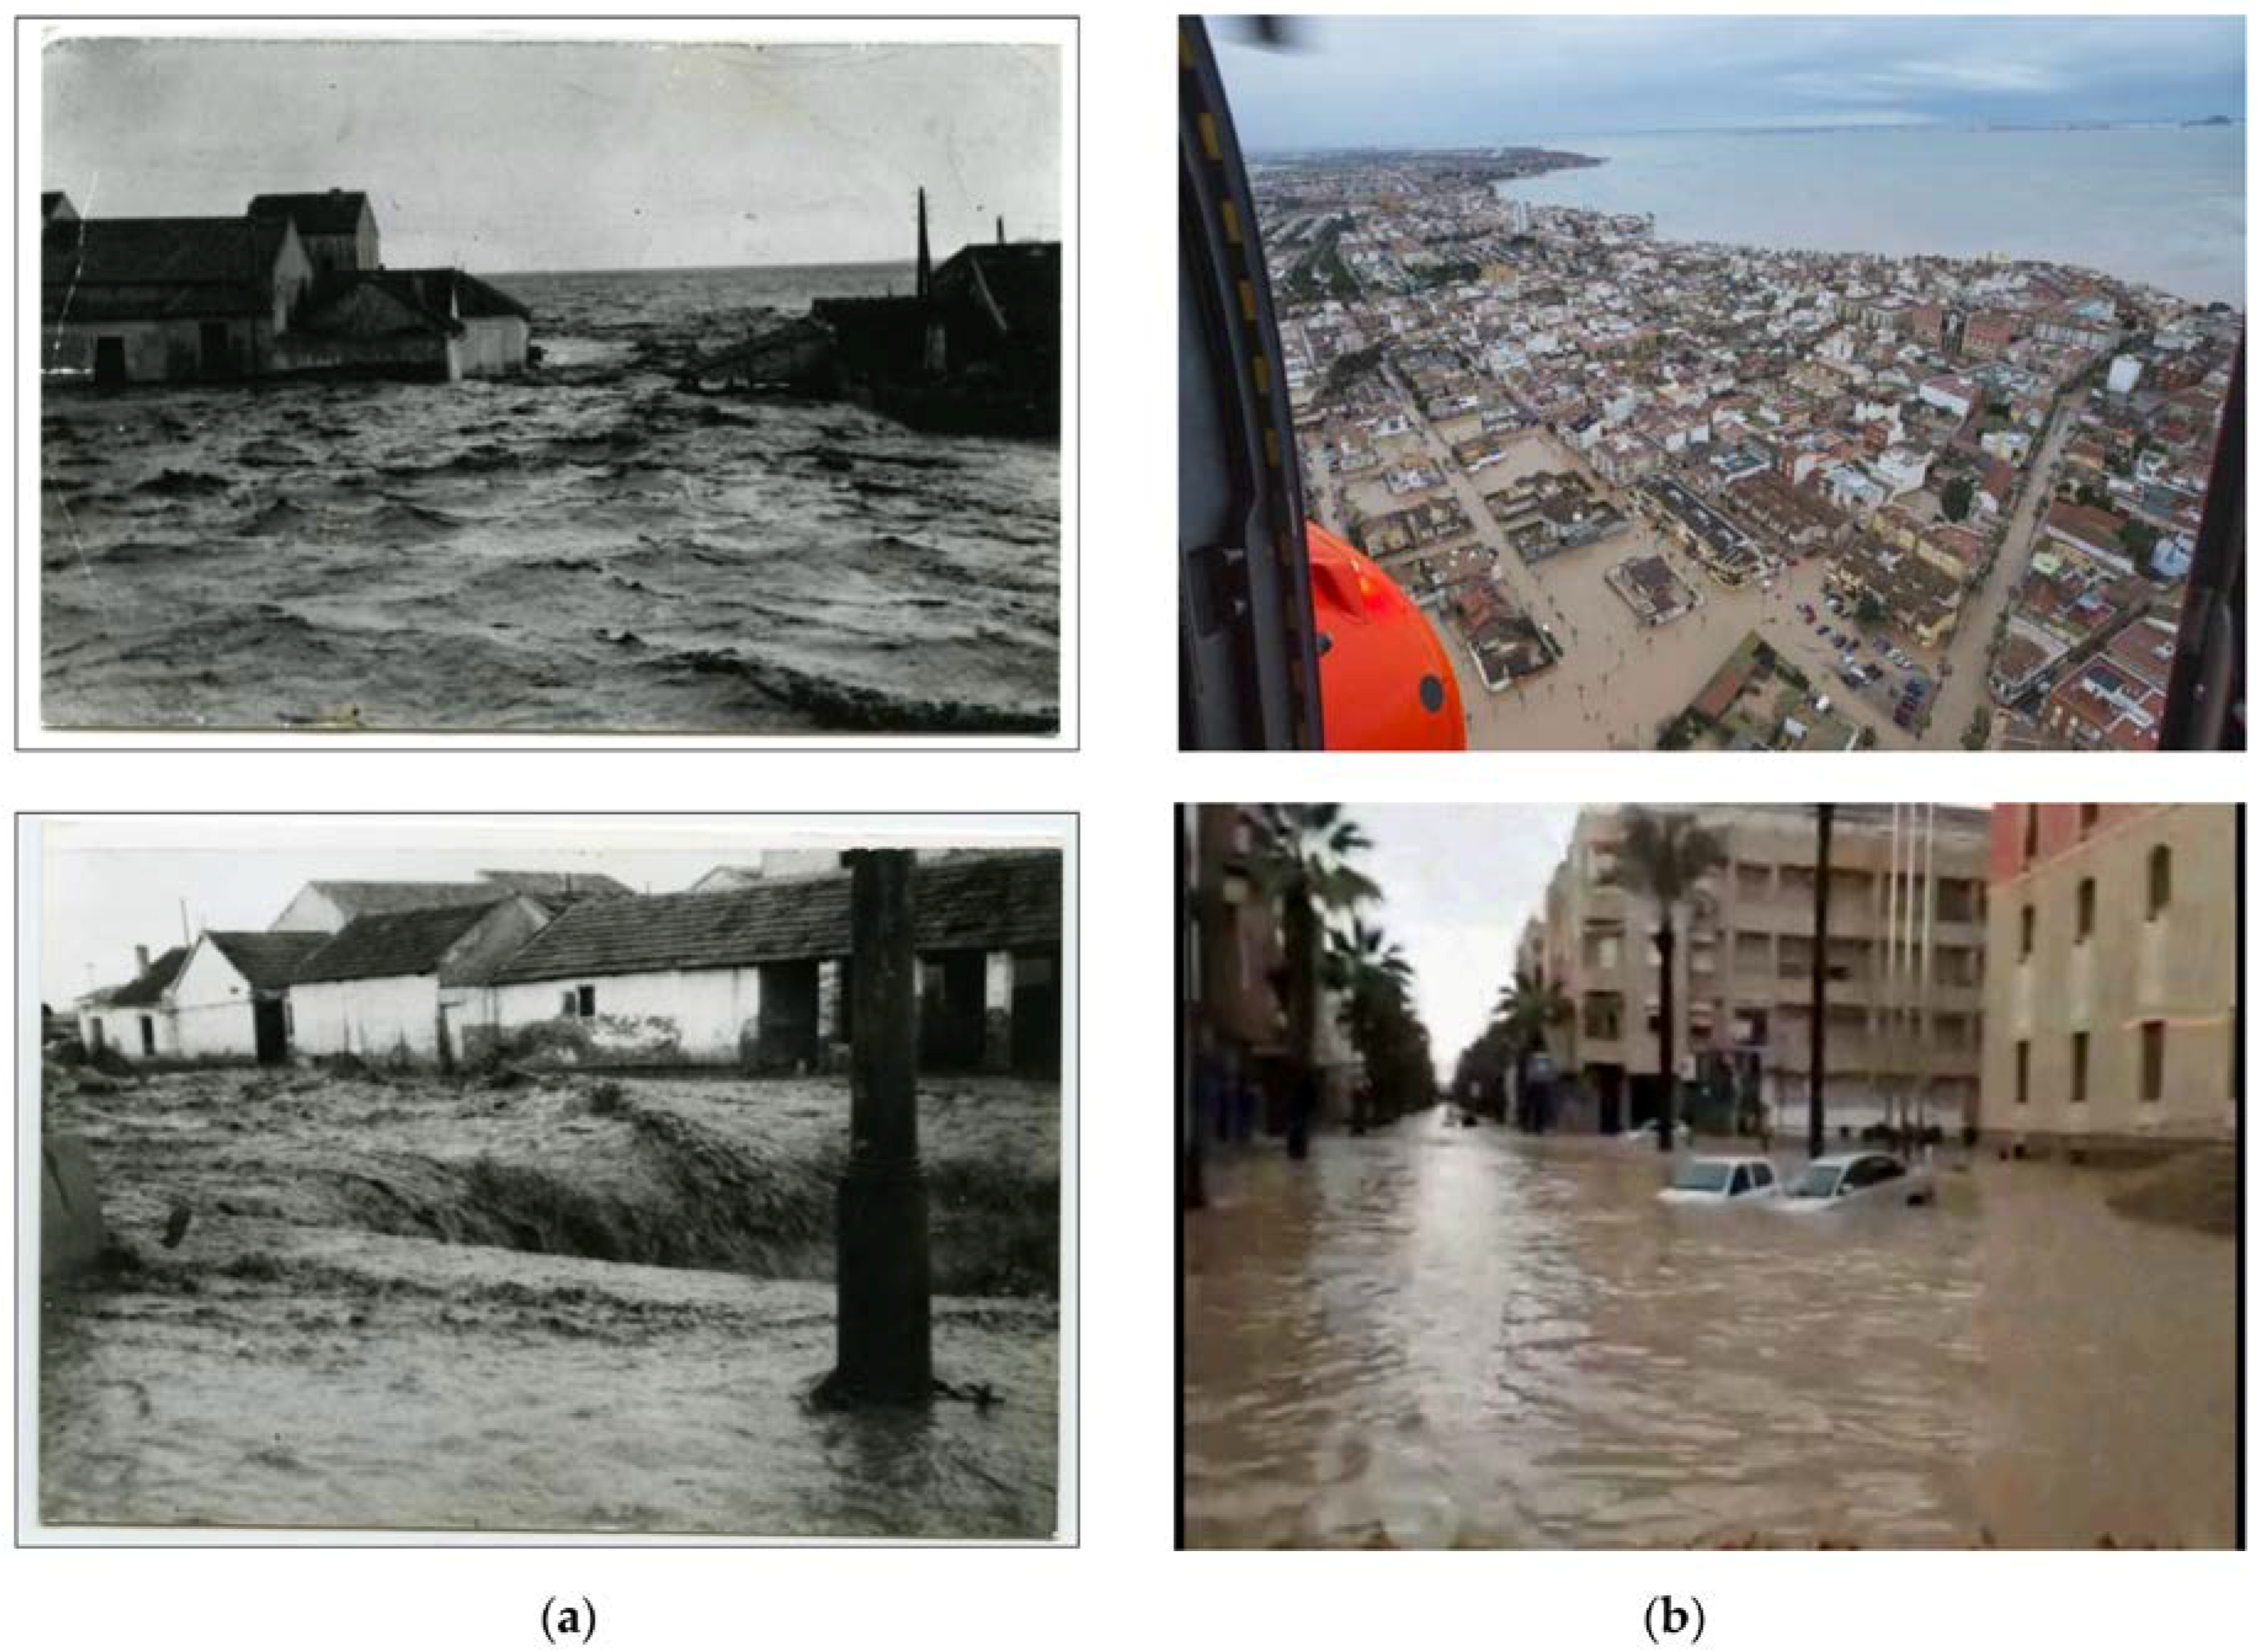
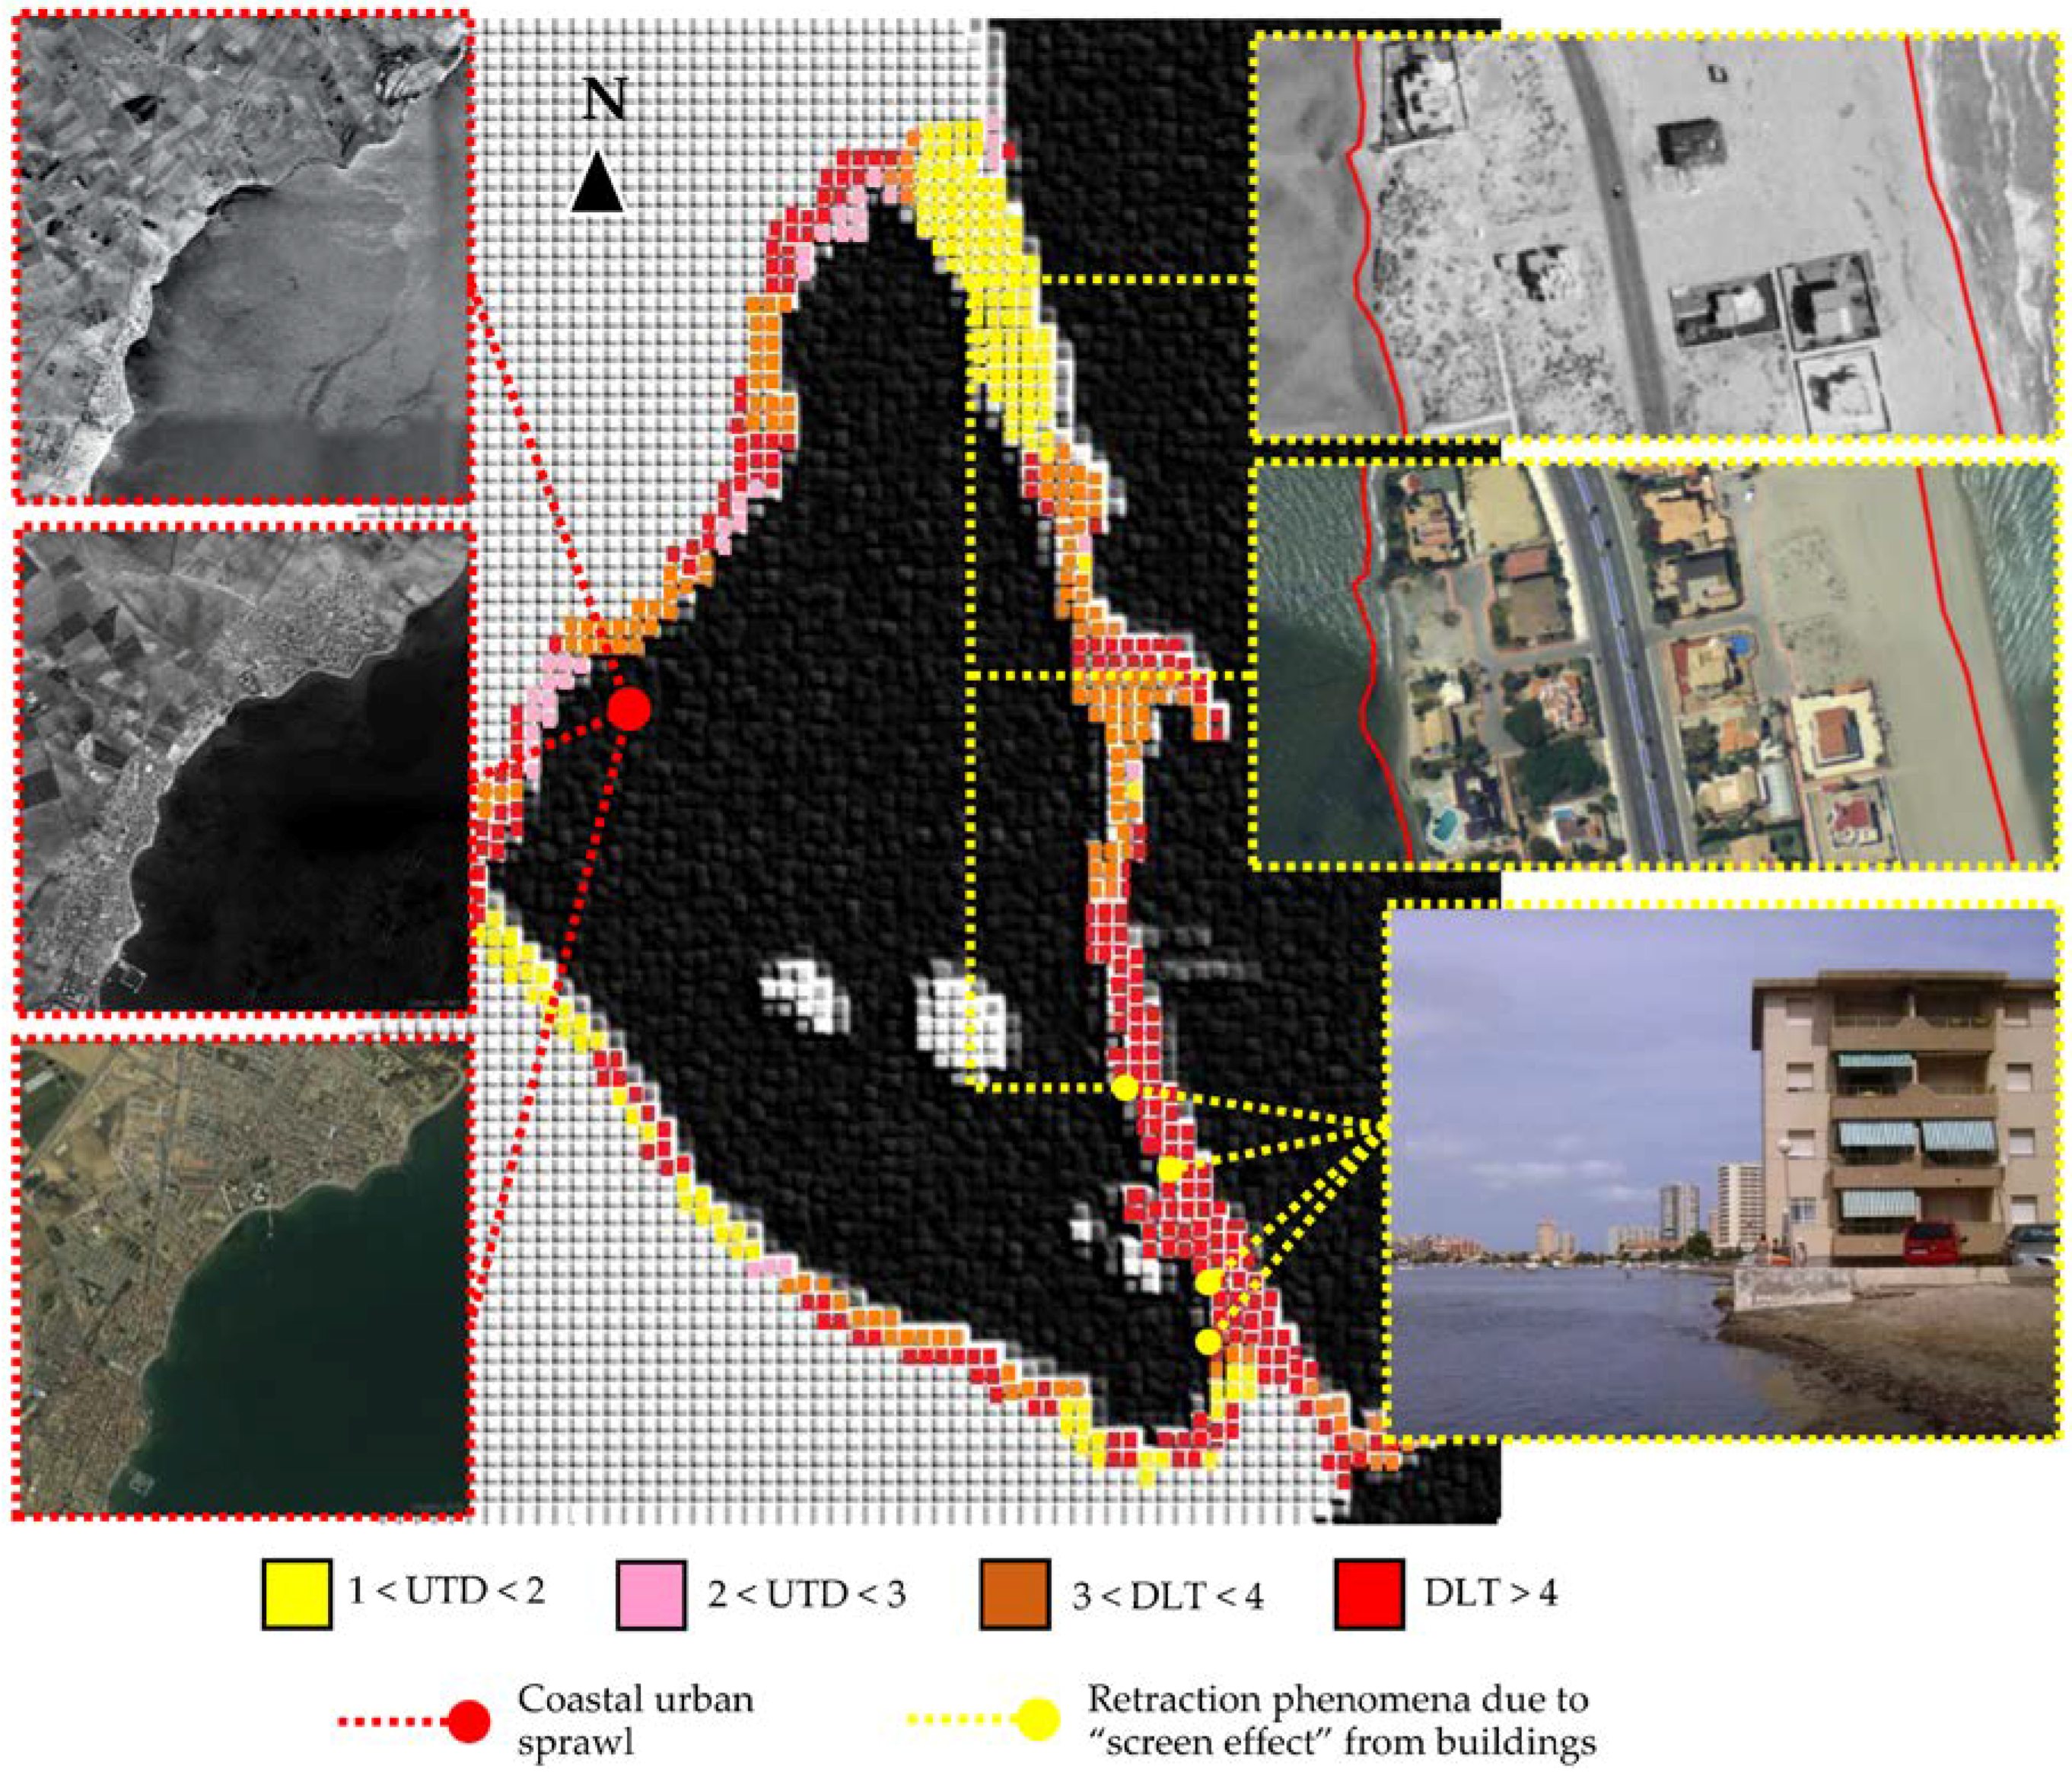
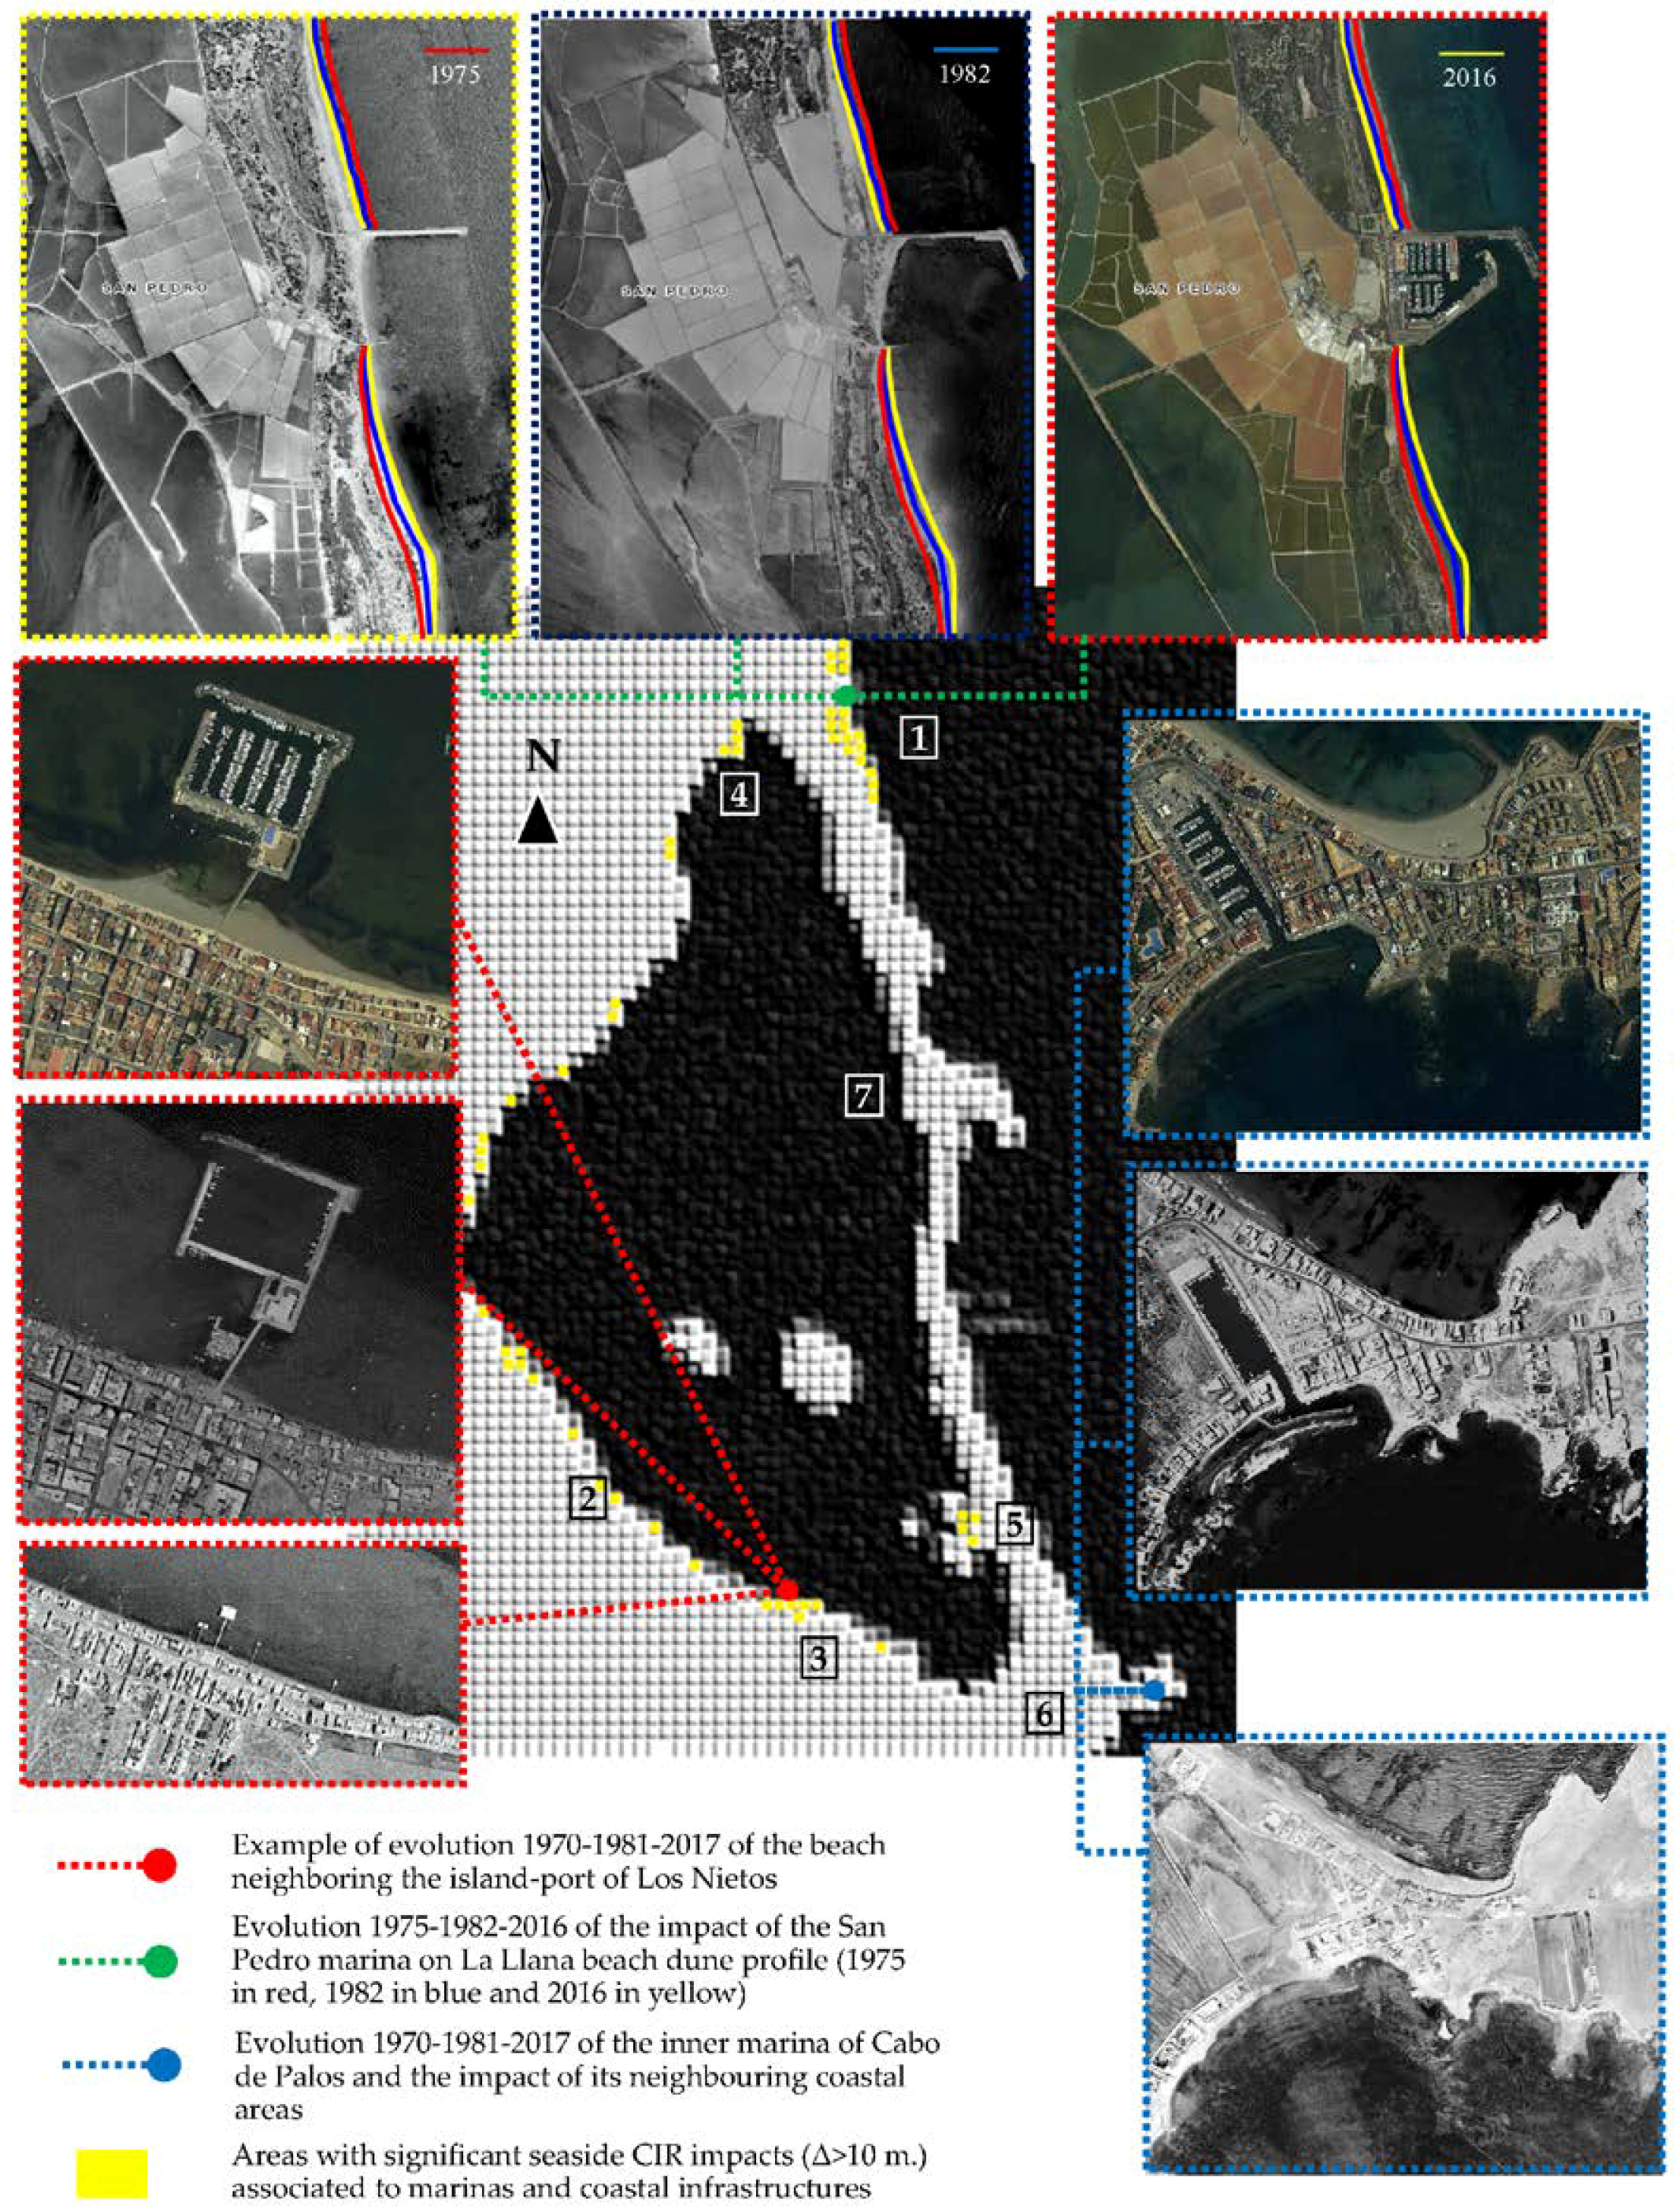
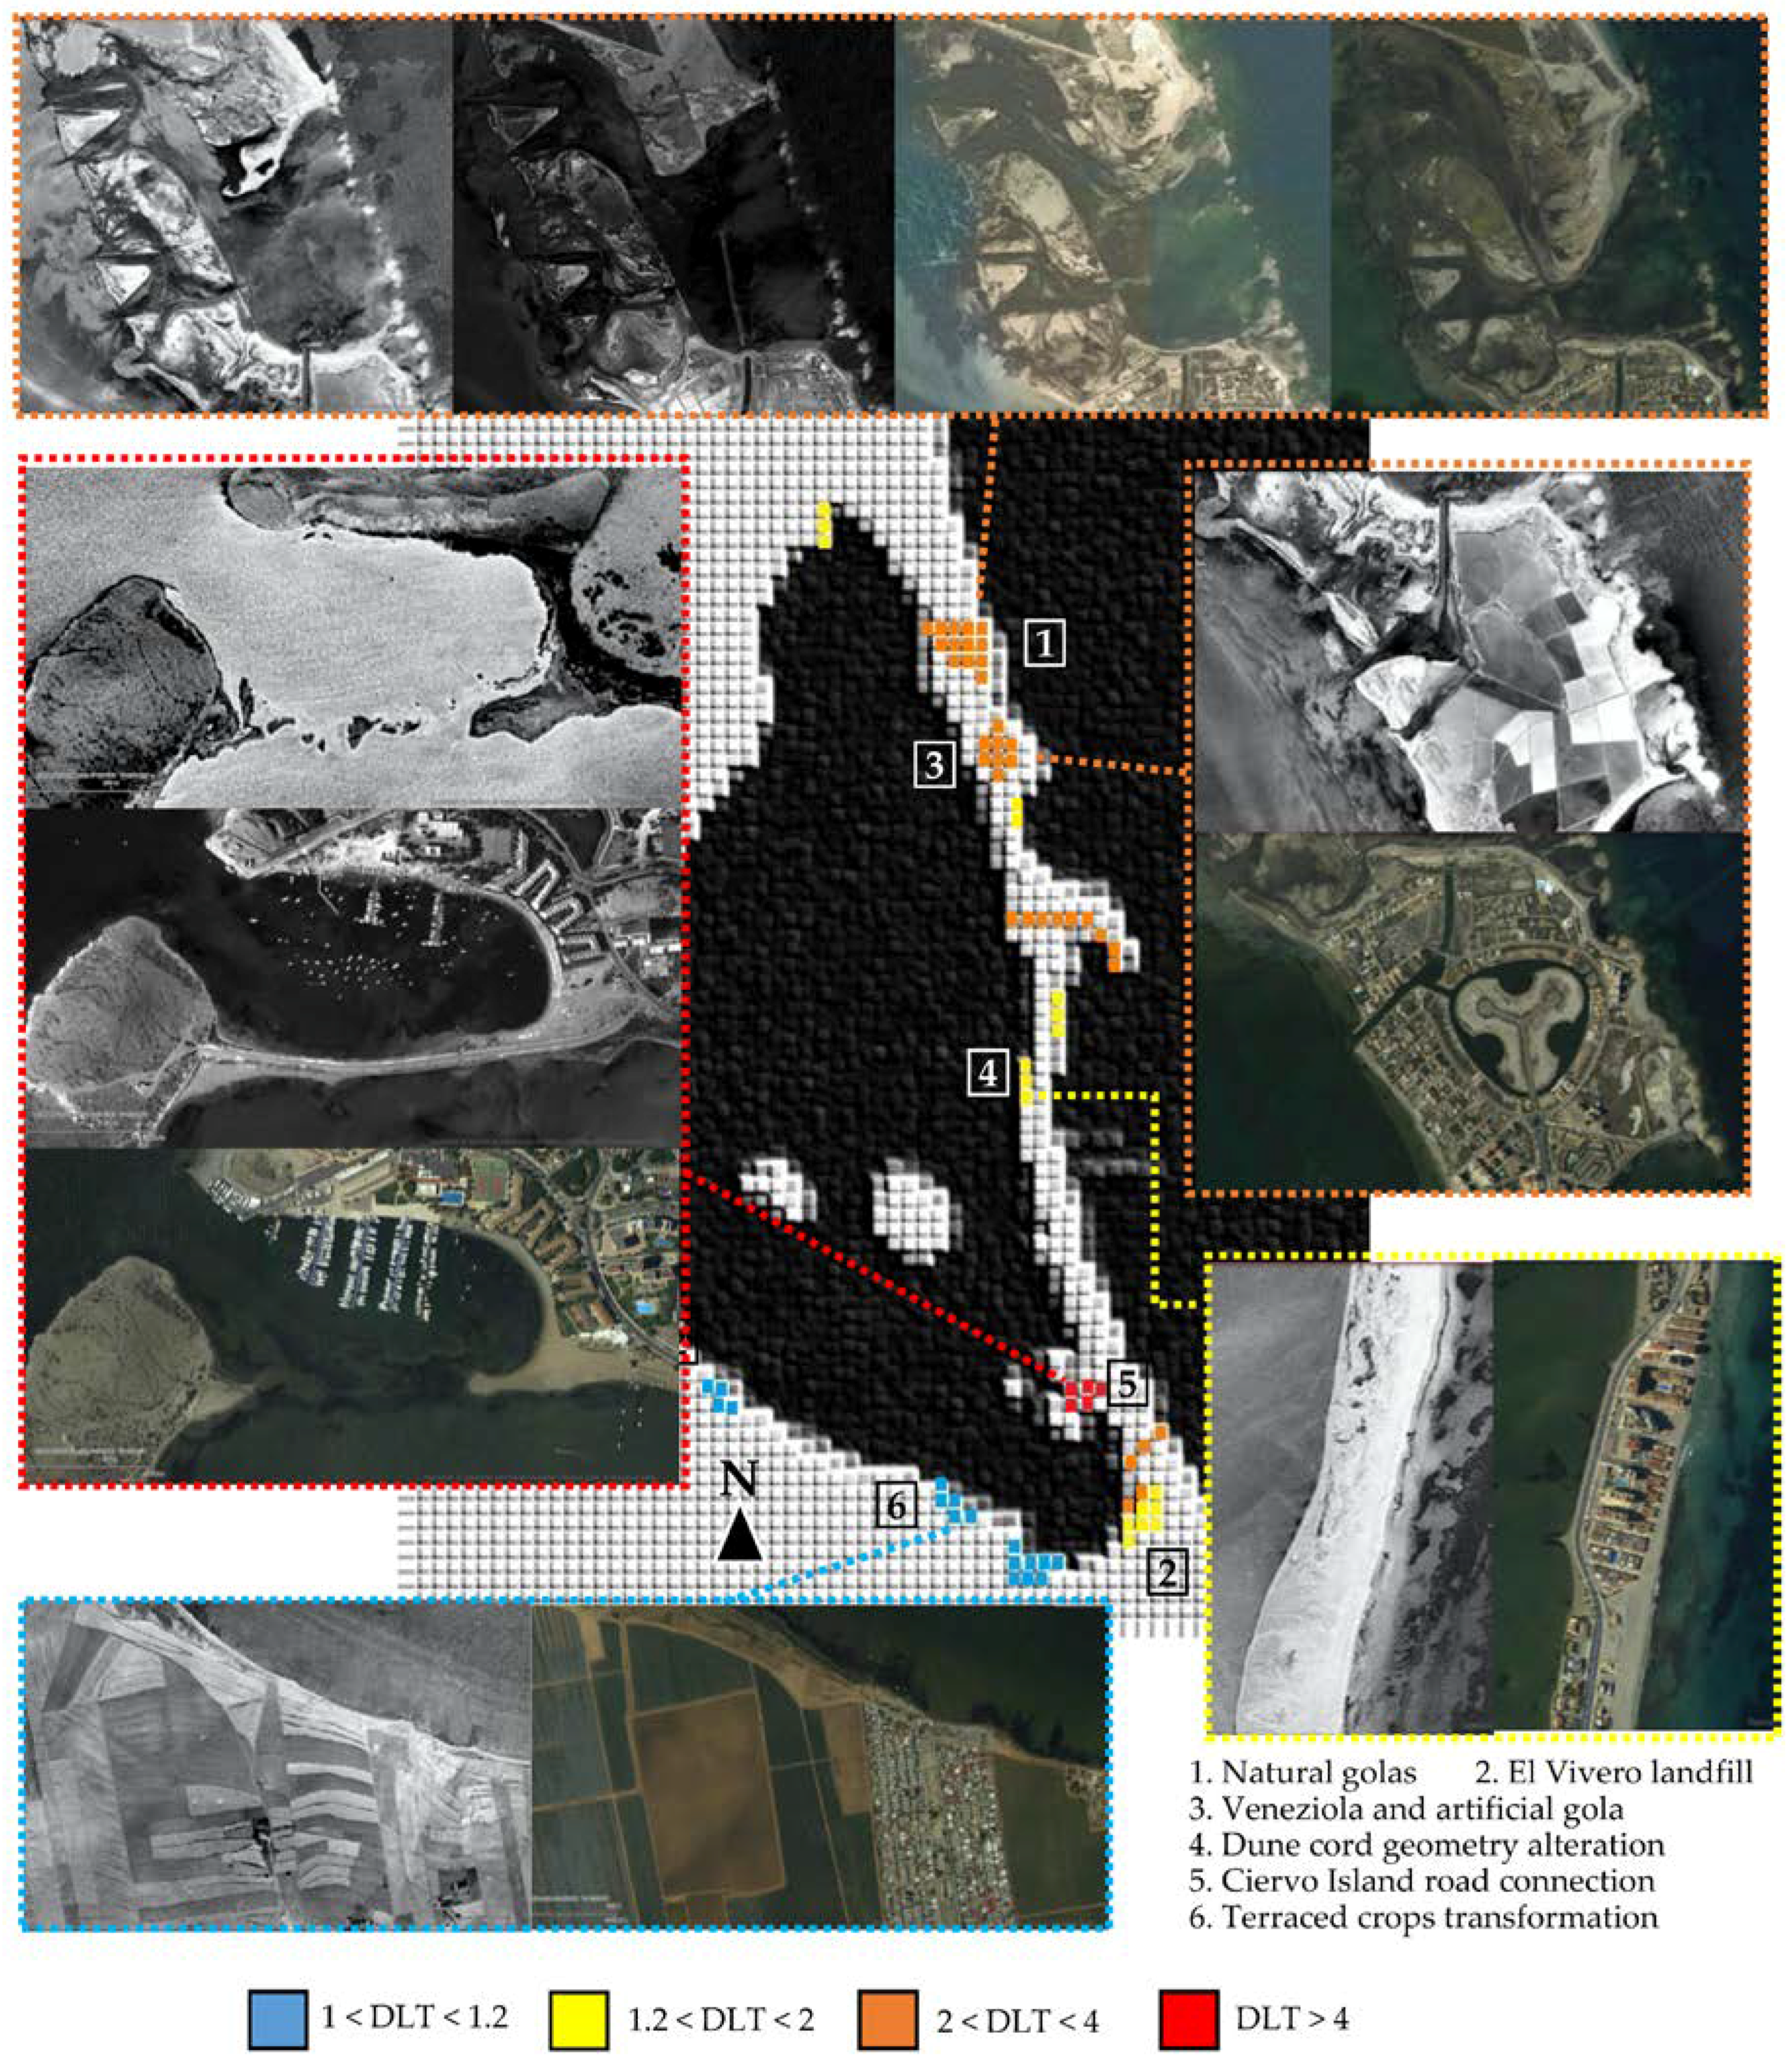
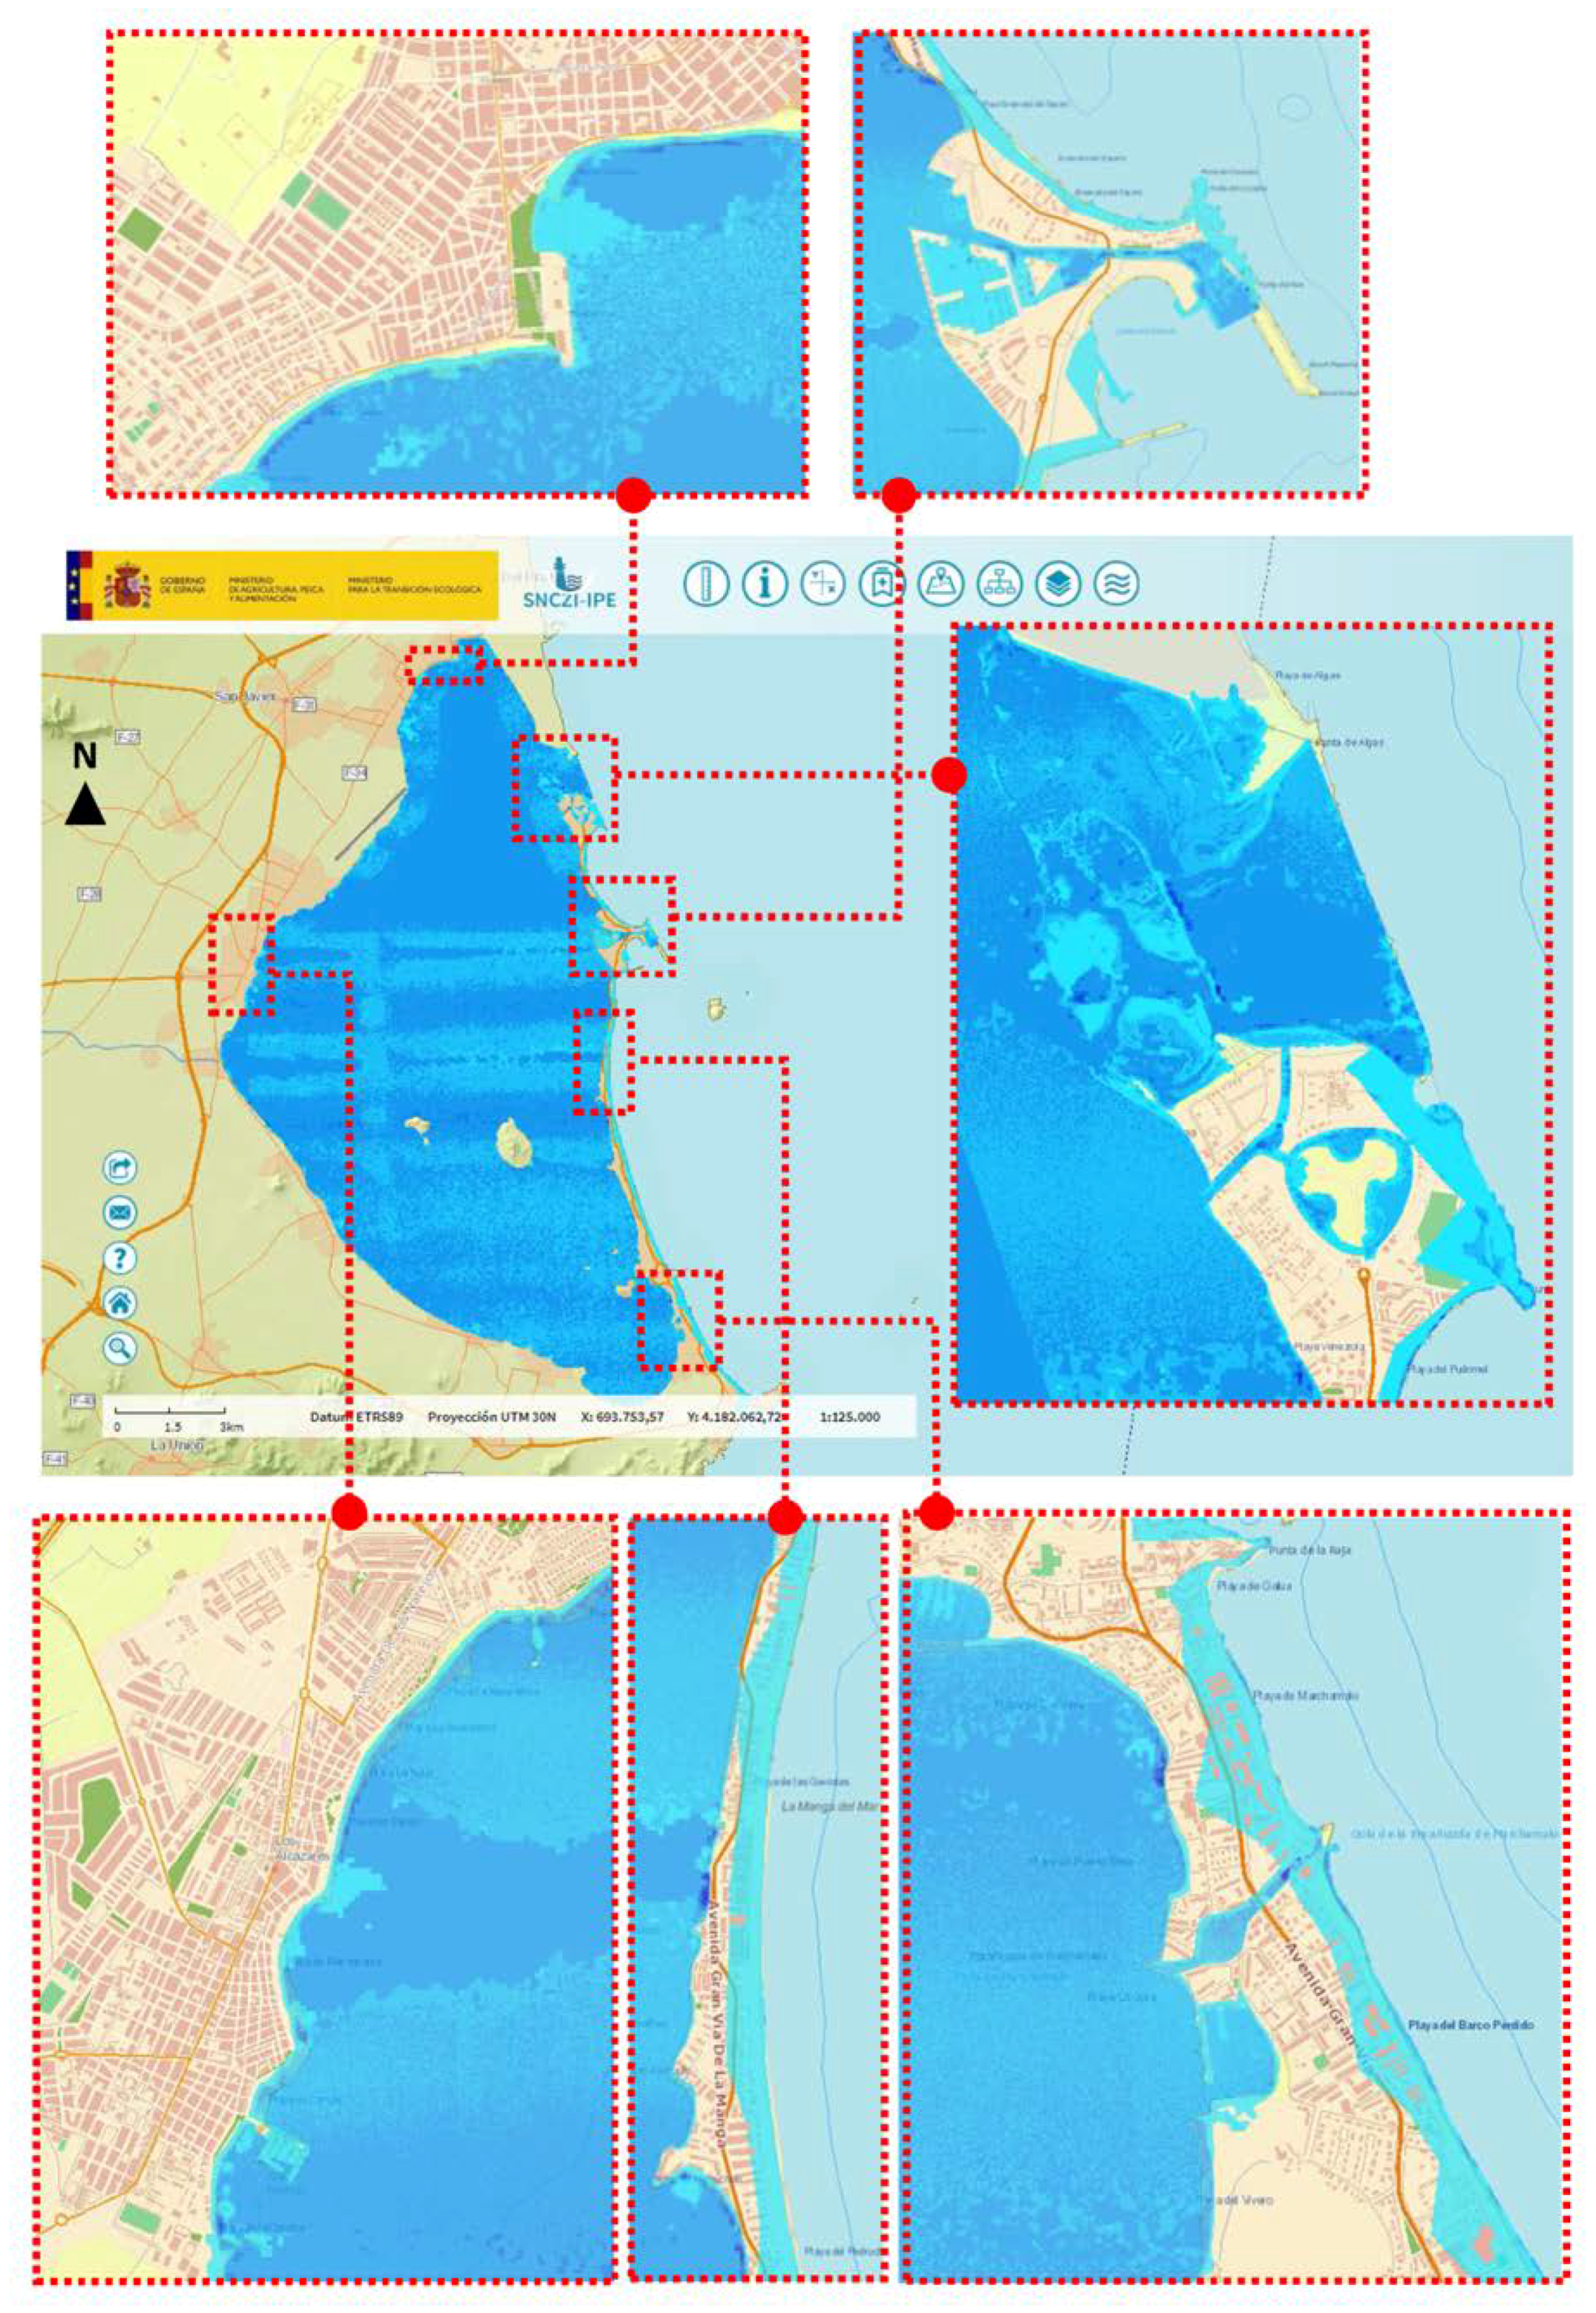
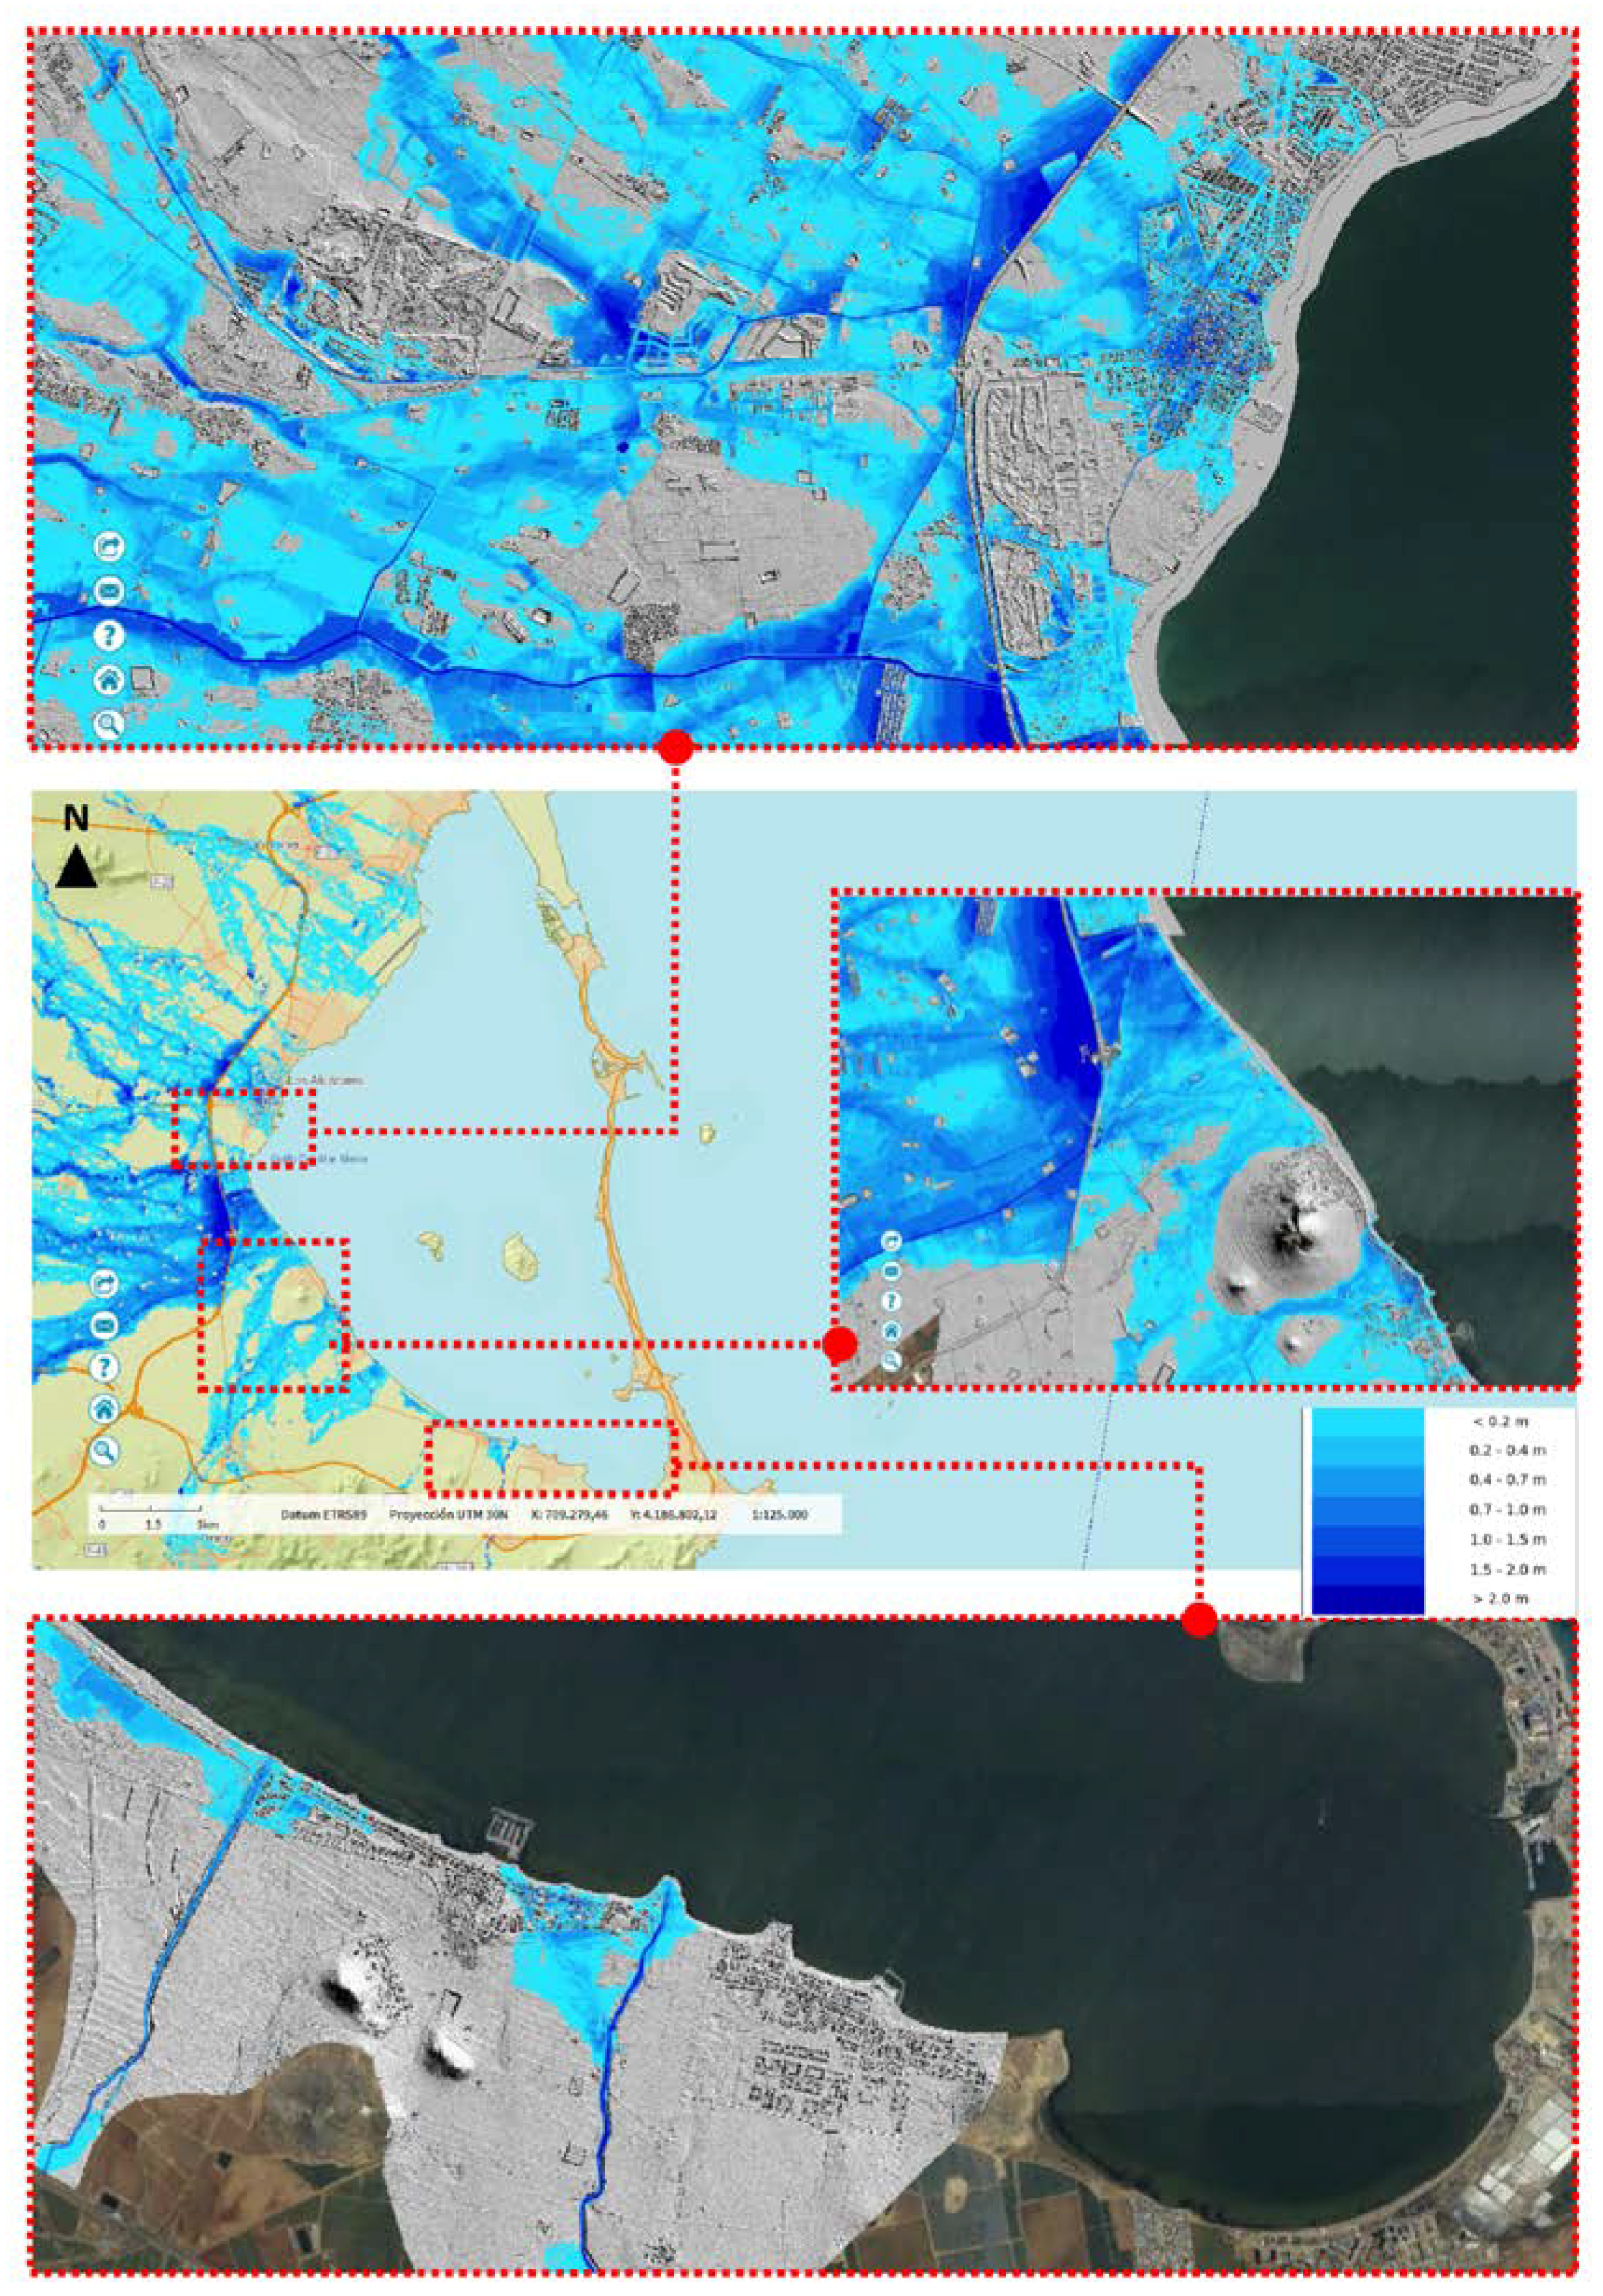
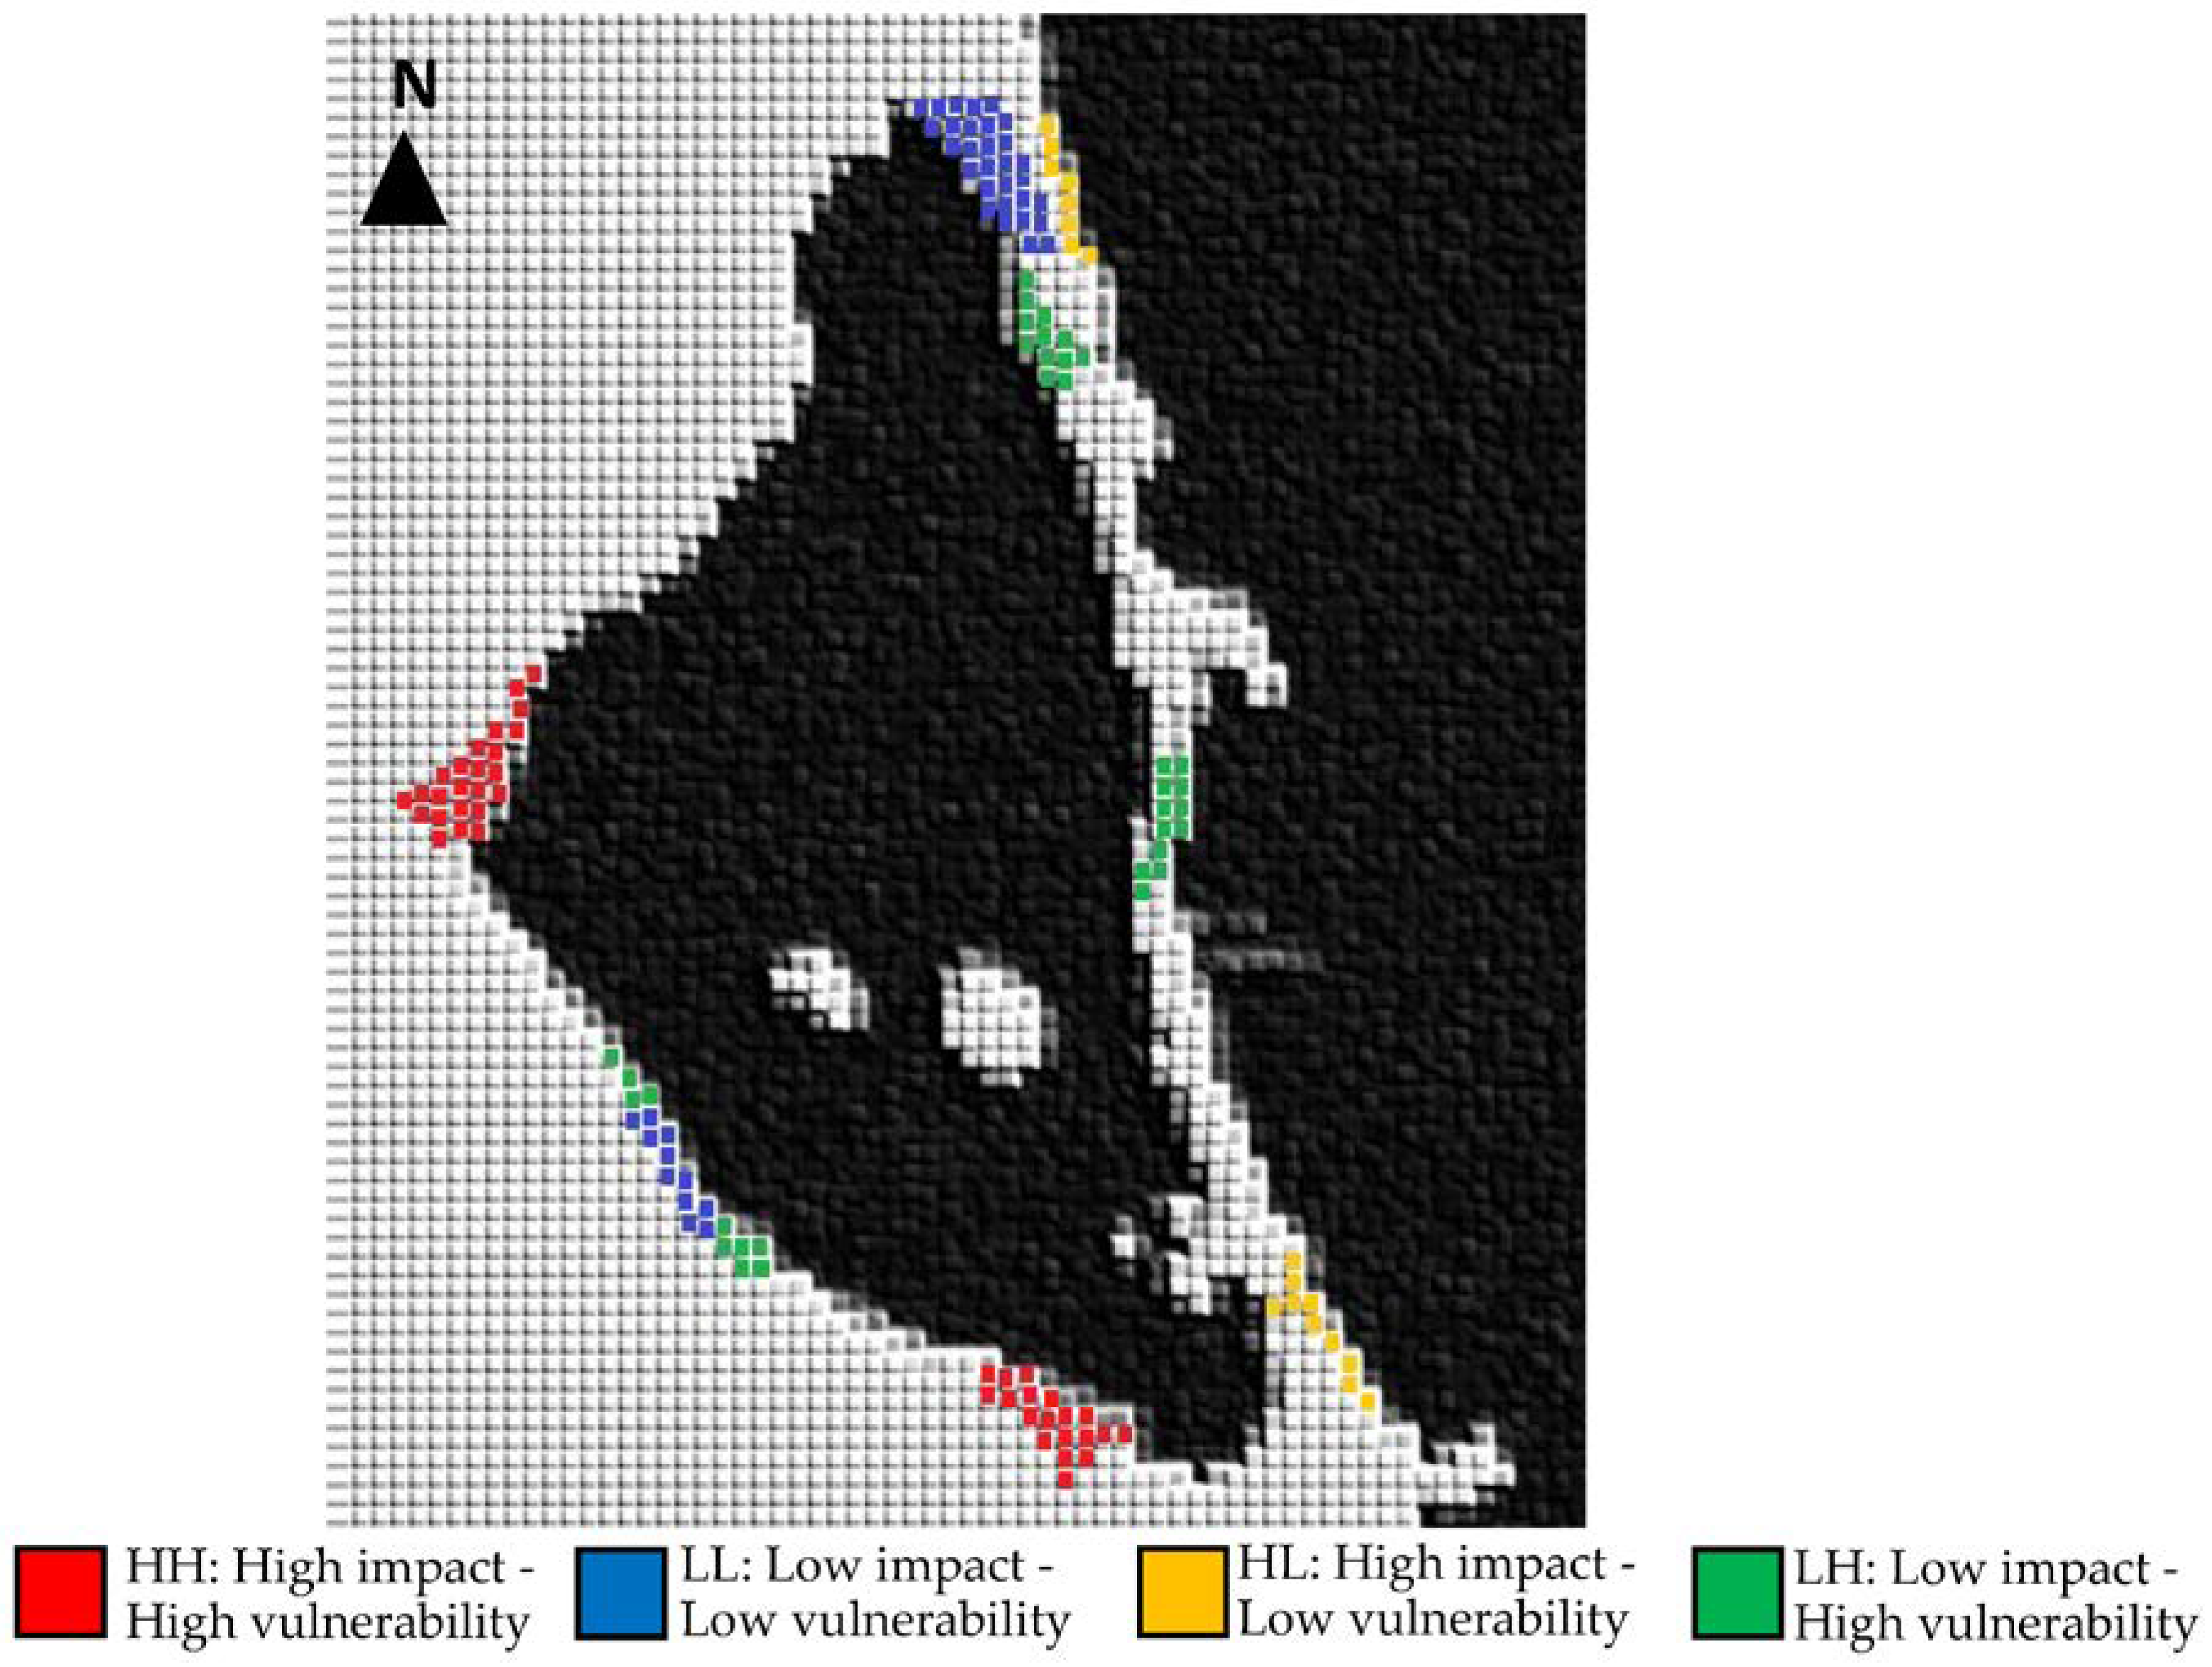
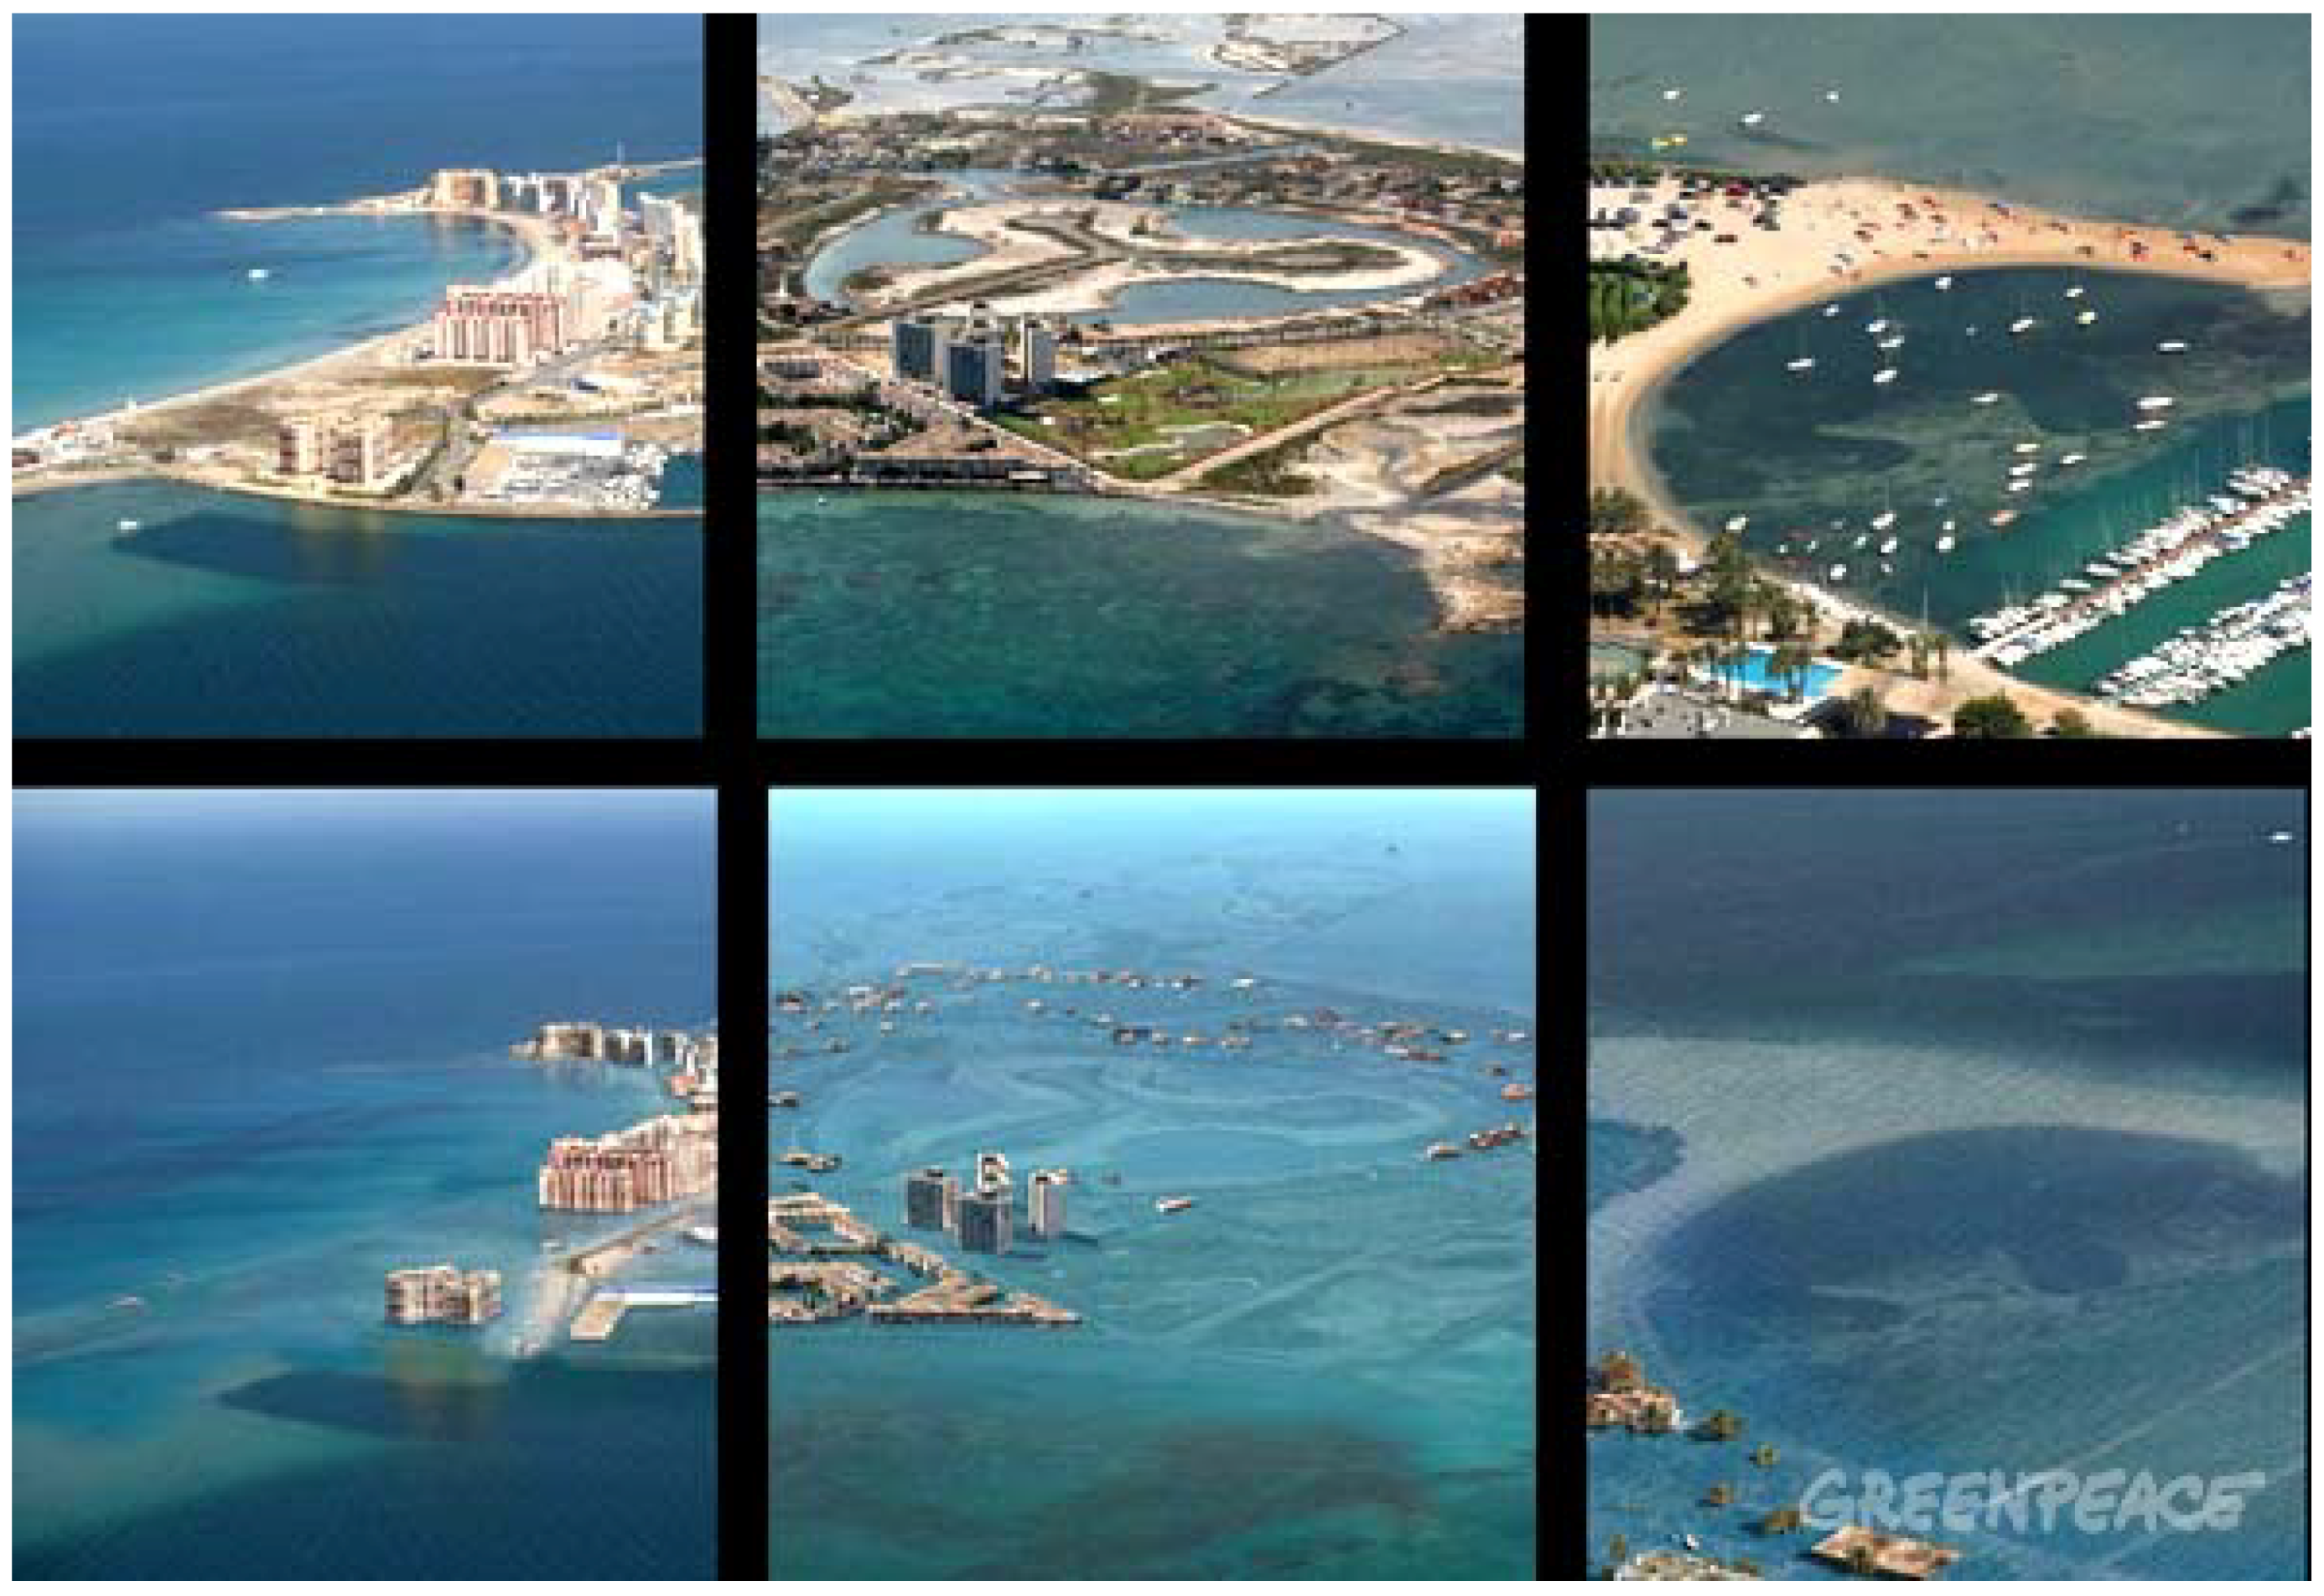
Table 1.
Technical characteristics of geo-referenced data used.
| Mapping Data | Pixel Size Projected on the GSD Ground (cm) | Planimetric Accuracy (X,Y) Mean Squared Error (m) | Altimetric Accuracy (Z) Mean Squared Error (m) | Mesh Step | |
|---|---|---|---|---|---|
| Flight | Orthophoto | ||||
| 1929–1956 | 45 | 50 | <1.00 | <2.00 | 5 × 5 |
| 1957–2017 | 22 | 25 | <0.50 | <1.00 | 5 × 5 |
Table 2.
Probability of occurrence for T = 100 years.
| Return Period T = 100 | Consecutive Years | |||||
|---|---|---|---|---|---|---|
| 1 | 2 | 5 | 25 | 50 | 100 | |
| Probability of occurrence (%) | 1 | 2 | 4.9 | 22.2 | 39.5 | 63.4 |
Table 3.
CIR and main impacts detected of the marinas on their neighboring beaches.
| Beach Area | Location (Figure 7) | Infrastructure Associated | Average Wide Variations (Δ) | Period Evaluated | CIR |
|---|---|---|---|---|---|
| La Llana | Mediterranean (1) | Marina of San Pedro del Pinatar | +51.67 m. (north) −84.42 m. (south) | 1978–2017 | 7.12 |
| Los Urrutias | Mar Menor (2) | Los Urrutias island-type port | +22.56 (max)/0 (min) −18.12 (average) | 1975–2017 | 2.54 |
| Los Nietos | Mar Menor (3) | Los Nietos island-type port | +59.17 (max)/0 (min) −10.12 (average) | 1970–2017 | 2.78 |
| Villananitos | Mar Menor (4) | Marina Lo Pagan half-innerland type | +14.27 m. (north) +26.97m. (south) | 1966–2016 | 1.95 |
| El Ciervo | Mar Menor (5) | Marina Dos Mares half-innerland type | +17.17 m. (max) −7.64 m. (min) | 1966–1999 | 1.89 |
Table 4.
Bivariate Global Moran’s I statistics for spatial autocorrelation between global coastal vulnerability index and the three GIS impact indices UTD, CIR, and DLT.
Table 4.
Bivariate Global Moran’s I statistics for spatial autocorrelation between global coastal vulnerability index and the three GIS impact indices UTD, CIR, and DLT.
| Bivariate Global Moran’s I | |||
|---|---|---|---|
| Global Moran’s Index | 0.57 | 0.41 | 0.60 |
| z-score | 52.8 | 37.4 | 55.8 |
| p-value | >0.01 | >0.01 | >0.01 |
| F-Statistic | 75.2 | 70.4 | 78.5 |
| R-Squared | 0.18 | 0.20 | 0.19 |
| Adjusted R-Squared | 0.19 | 0.22 | 0.20 |
| Number of observations | 1063 | 839 | 1291 |
© 2018 by the author. Licensee MDPI, Basel, Switzerland. This article is an open access article distributed under the terms and conditions of the Creative Commons Attribution (CC BY) license (http://creativecommons.org/licenses/by/4.0/).
Share and Cite
MDPI and ACS Style
Garcia-Ayllon, S. Long-Term GIS Analysis of Seaside Impacts Associated to Infrastructures and Urbanization and Spatial Correlation with Coastal Vulnerability in a Mediterranean Area. Water 2018, 10, 1642. https://doi.org/10.3390/w10111642
AMA Style
Garcia-Ayllon S. Long-Term GIS Analysis of Seaside Impacts Associated to Infrastructures and Urbanization and Spatial Correlation with Coastal Vulnerability in a Mediterranean Area. Water. 2018; 10(11):1642. https://doi.org/10.3390/w10111642
Chicago/Turabian StyleGarcia-Ayllon, Salvador. 2018. "Long-Term GIS Analysis of Seaside Impacts Associated to Infrastructures and Urbanization and Spatial Correlation with Coastal Vulnerability in a Mediterranean Area" Water 10, no. 11: 1642. https://doi.org/10.3390/w10111642
Note that from the first issue of 2016, this journal uses article numbers instead of page numbers. See further details here.