Robust Assessment of Uncertain Freshwater Changes: The Case of Greece with Large Irrigation—and Climate-Driven Runoff Decrease


Department of Physical Geography, Bolin Centre for Climate Research and Navarino Environmental Observatory, Stockholm University, 10691 Stockholm, Sweden
*
Author to whom correspondence should be addressed.
Water 2018, 10(11), 1645; https://doi.org/10.3390/w10111645
Submission received: 1 October 2018
/
Revised: 2 November 2018
/
Accepted: 8 November 2018
/
Published: 13 November 2018
(This article belongs to the Special Issue 10th Anniversary of Water)
Abstract
:We develop a data-driven approach to robustly assess freshwater changes due to climate change and/or human irrigation developments by use of the overarching constraints of catchment water balance. This is applied to and tested in the high-uncertainty case of Greece for five nested catchments of different scales across the country and for freshwater changes from an early period (1930–1949) with small human influences on climate and irrigation to a recent period (1990–2009) with expected greater such influences. The results show more or less equal contributions from climatic decrease in precipitation and from human irrigation development to a considerable total decrease in runoff (R) over Greece. This is on average −75 ± 10 mm/year and is greatest for the Ionian catchment in the west (−119 ± 18 mm/year) and the Peloponnese catchment in the south (−91 ± 16 mm/year). For evapotranspiration (ET), a climate-driven decrease component and an irrigation-driven increase component have led to a net total increase of ET over Greece. This is on average 26 ± 7 mm/year and is greatest for the Mainland catchment (29 ± 7 mm/year) and the Aegean catchment in the east (28 ± 6 mm/year). Overall, the resulting uncertainties in the water-balance constrained estimates of R and ET changes are smaller than the input data uncertainties.
Keywords:
freshwater changes; irrigation; climate change; evapotranspiration; runoff; catchments; Greece1. Introduction
Water is a peculiar liquid [1], critical for human existence and all life as we know it. Accurately understanding and being able to predict water conditions changes is among humanity’s greatest needs and challenges [2,3]. This does not only apply to the major ocean part of Earth’s hydrosphere but also to the essential freshwater on land. Freshwater changes on land interact with other Earth System changes, including changes in climate and in the landscape [4,5] and in both the ecosystems [6] and the societal systems [7,8,9] of the latter. In recognition of these interactions and critical open questions related to them, new hydrological research directions have developed such as the Panta Rhei community initiative [10] and the fields of ecohydrology [11] and sociohydrology [12].
The freshwater system itself includes various landscape manifestations and formations (streams, lakes, wetlands, water in biota, soil water, groundwater, glaciers, permafrost), with different aspects of variability and change interacting and propagating across them [13,14,15,16]. This propagation also involves interactions with different human uses of freshwater and structures for managing these, and all these freshwater interactions prevail and are organized within (the surface and subsurface parts of) hydrological catchments of different scales.
Furthermore, each hydrological catchment of any scale is subject to overarching water balance. In this, the total area-integrated water-fluxes of precipitation (P) and evapotranspiration (ET) and the concurrent water-storage changes occurring over the catchment are balanced with each other and the total runoff flux (R; area-normalized total discharge) from the catchment [17]. This emergent [18] catchment water balance is then also in simultaneous alignment with (i.e., both depends on and determines) and as such couples the different local water manifestations, formations, uses and management structures and the conditions of and changes in these over each catchment [19]. However, our ability to understand, interpret and predict these conditions and changes is currently fragmented among various research fields, associated with the different (liquid, frozen) freshwater manifestations and formations (e.g., surface water hydrology, hydrogeology, hydro-meteorology, ecohydrology, limnology, cryospheric science), or the different human uses of and management structures for freshwater (e.g., water resources engineering, hydraulic engineering, agricultural water management, urban water management, sociohydrology).
On the one hand, such freshwater fragmentation may be needed for in-depth process study and understanding. On the other hand, it may lead to important knowledge gaps and uncertainties between the fragments. Decrease of these gaps and uncertainties require ability to synthesize and jointly interpret various types of data, related to different freshwater aspects, which interact and coevolve with each other and other landscape and climate changes over hydrological catchments of different scales. For such synthesis and joint interpretation of different data for assessment of overall freshwater conditions and changes in a catchment of any scale, various studies have proposed [6,20] or indicated [4,5,19] that the constraints implied by catchment water balance may decrease the combined result uncertainties compared to the uncertainties associated with different underlying data and aspects.
In this paper, we put this indication to further testing for a case of particularly large underlying uncertainties [21]: Greece and five nested catchments of different scales across it. For these catchments, we investigate freshwater conditions and their changes over the time period 1930–2009, for which relevant data are available. Using the constraints implied by overarching water balance in each catchment, we develop, apply and test a general approach to synthesize, assess and interpret the available data for freshwater changes over the study period, the possible drivers of these changes and associated input-data and result uncertainties. Through the development and specific case quantification and testing of this approach, this study also outlines and uses advancements made in recent research on such long-term, large-scale freshwater changes.
2. Materials and Methods
2.1. Greece and Its Catchments
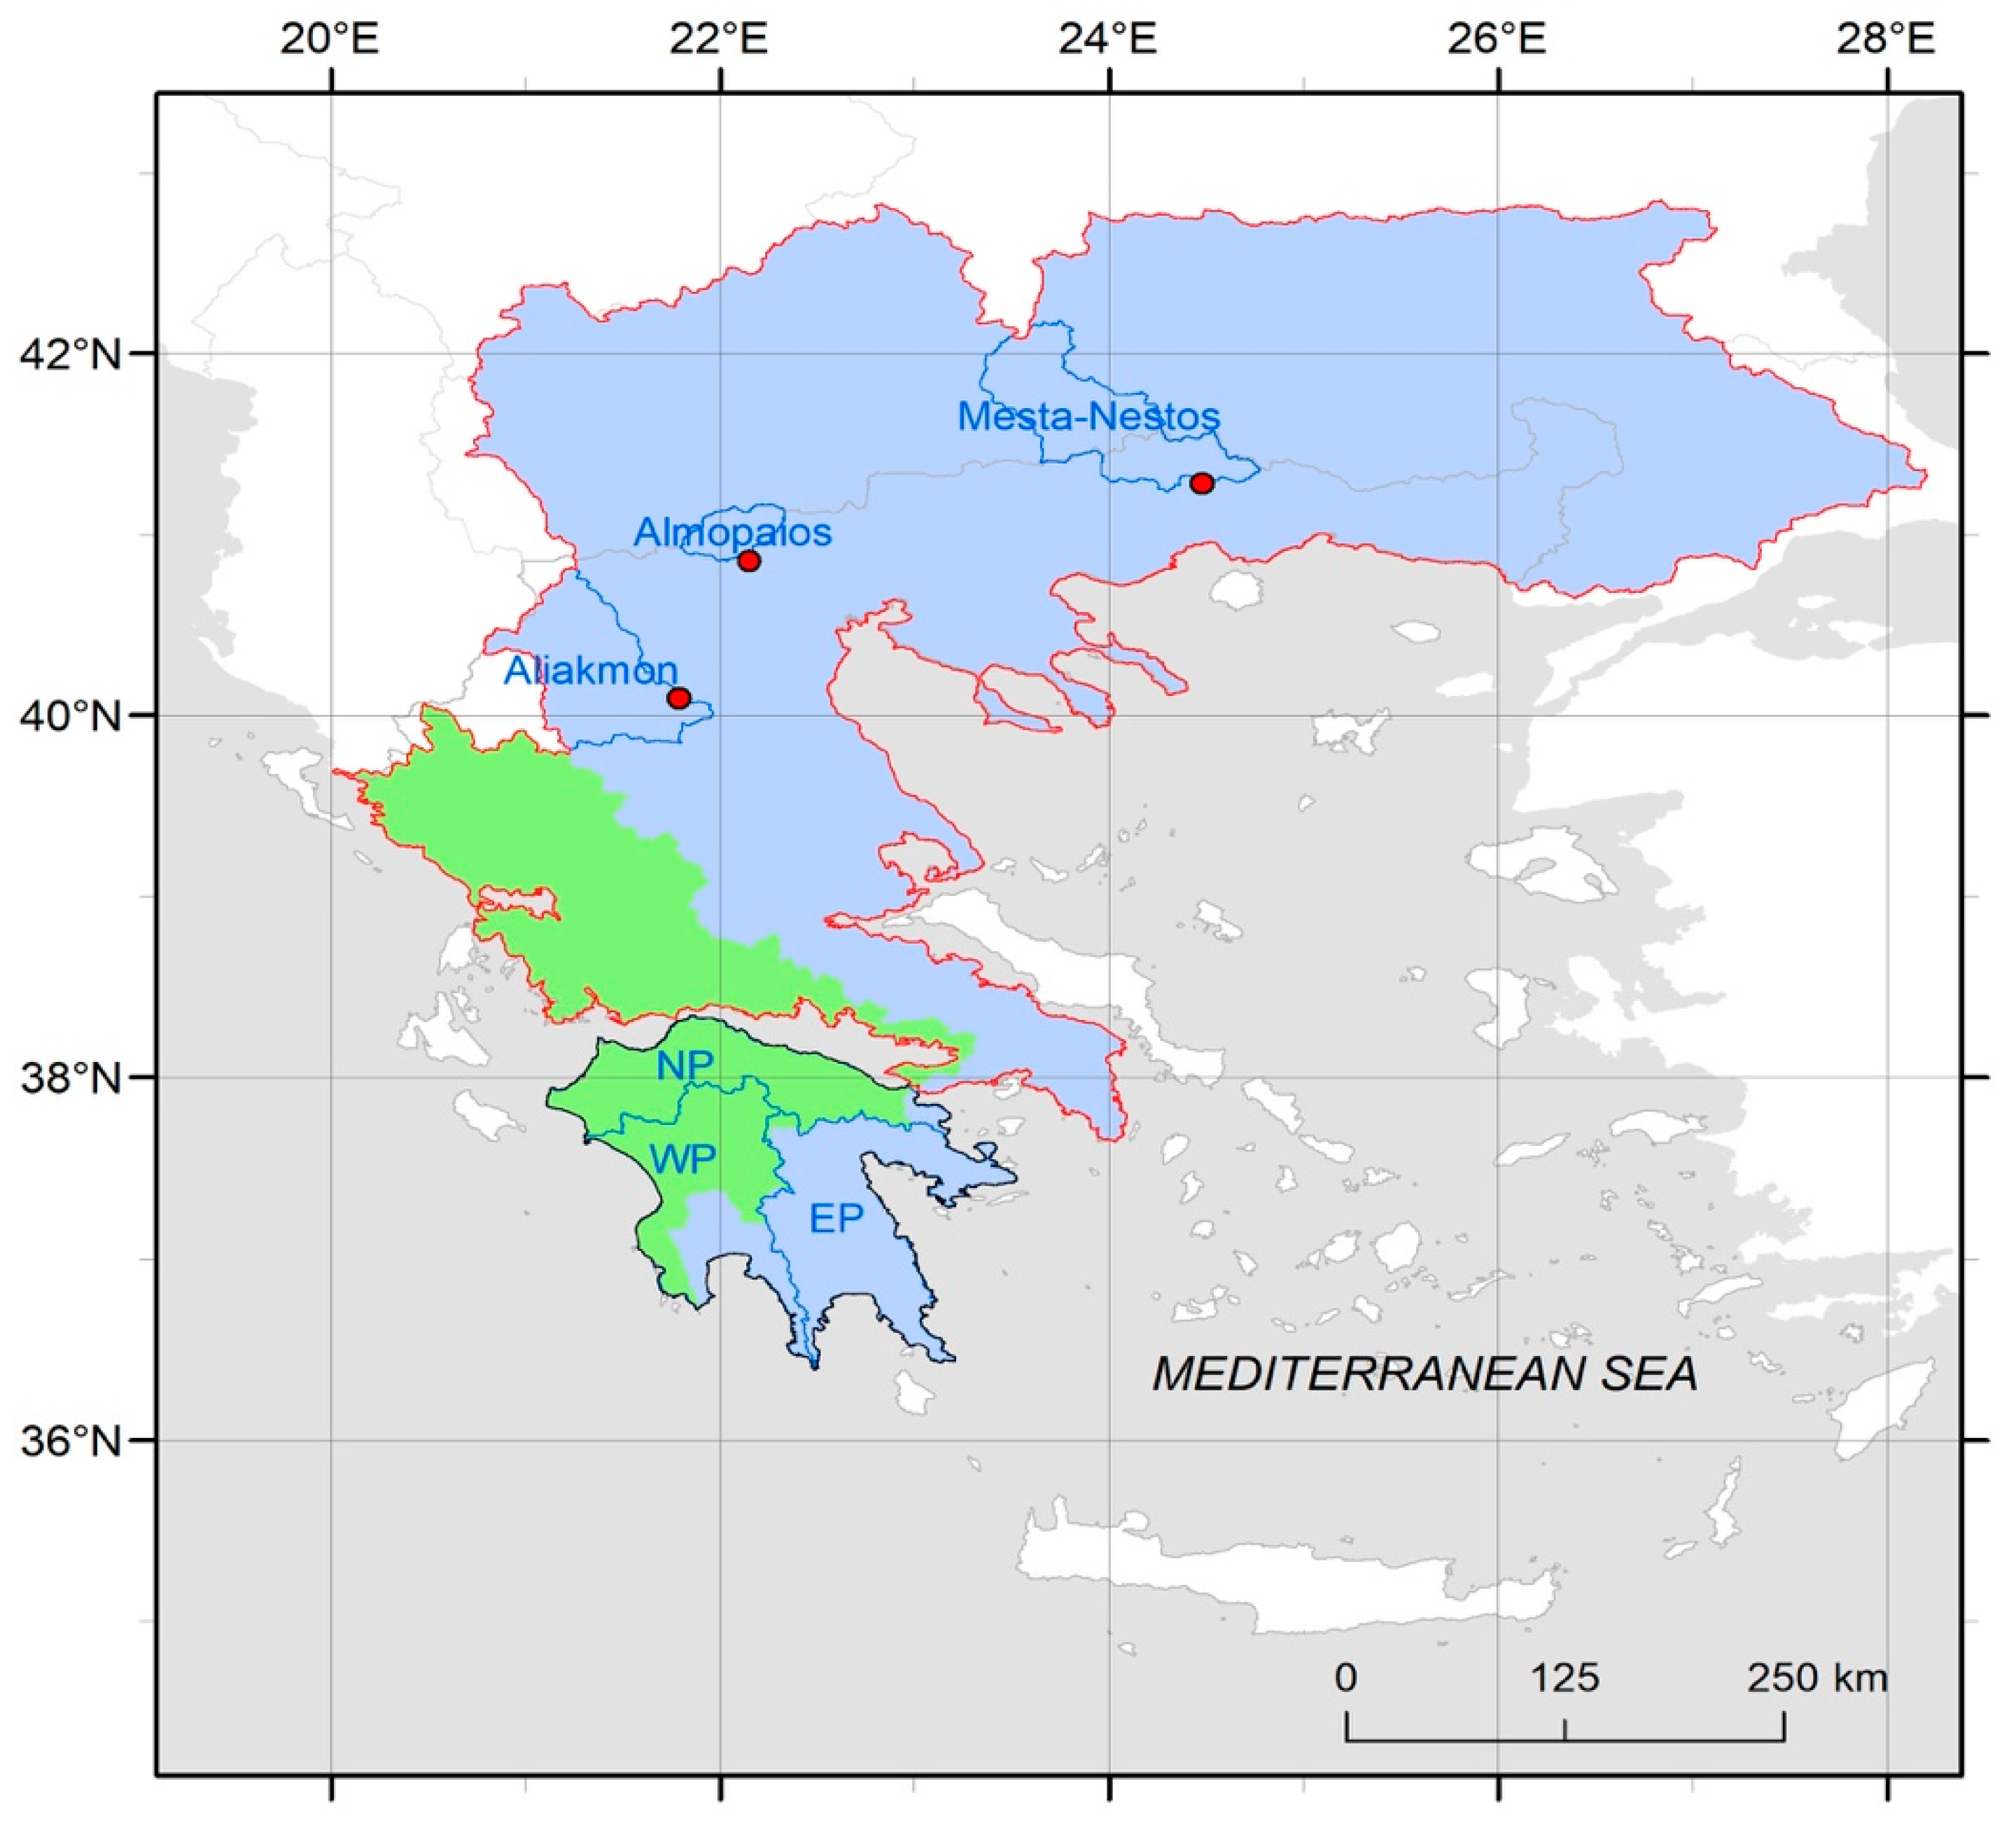
For several reasons, Greece is a relevant and useful case example for the present investigation. The country constitutes in itself the major part of a regional catchment draining into the Ionian and Aegean parts of the eastern Mediterranean Sea (Figure 1). Through Greece, this regional catchment is more or less peninsular and its long coastline facilitates selection of various nested coastal catchments of different scales within it, for comparative multi-catchment investigation using different parts of the available data for the total regional catchment.
Furthermore, previous comparative multi-catchment studies have shown that hydro-climatic changes and associated freshwater interactions with the atmosphere are subject to particularly large uncertainties in Greece [21]. These include: (a) uncertainties due to observation data limitations in terms of both temporal extent and spatial coverage across the country; and (b) climate model uncertainties for freshwater conditions, especially for model estimations of ET and, as a consequence, also of R and other related freshwater conditions in the Greek landscape for the reference period 1961–1990 [21]. These uncertainties make Greece a particularly important and useful case for investigating a possible robust methodology for catchment-wise data synthesis and interpretation and testing if the constraints implied by catchment water balance decrease the combined uncertainty effects for freshwater conditions and their changes.
Finally, in addition to climate change, Greece has undergone considerable agricultural irrigation developments over the study period 1930–2009, which is chosen due to availability of different types of relevant data for Greece over this period. Previous studies have reported such developments to be important drivers of freshwater changes in different parts of the world [7,8,17,22,23,24]. The occurrence of such developments over the study period in Greece contributes to making this a relevant case for studying freshwater changes and their interactions and co-evolution with such human-driven developments as well as with climate change.
Overall, freshwater conditions, interactions and changes across Greece are here quantified and interpreted from the available reported data on hydro-climate and irrigated land-use and water-use for the period 1930–2009. To distinguish freshwater changes and associated uncertainties that may have been driven by the atmospheric climate change and/or the irrigation development occurring over Greece during this period, we compare long-term average conditions in relevant water-related variables between two 20-year sub-periods, 1930–1949 and 1990–2009, for five nested catchments of different scales (Figure 1). The two comparative sub-periods are chosen long enough to represent long-term average climate (and not just temporary weather) conditions and with as long time between them as possible for capturing freshwater changes from an early time with relatively small human influences on climate and irrigation to the recent time with expected much greater such influences.
With regard to the five catchments, the largest one is the total regional catchment (coloured in Figure 1; 178,984 km2) that includes the whole of Greece and drains into the eastern part of the Mediterranean Sea through different coastline stretches. In addition to Greece (without its numerous islands, which are not considered in this study), this total catchment also includes some parts in the north that extend into the territories of the former Yugoslav Republic of Macedonia, Bulgaria, Turkey and a minor part of Serbia. This regional catchment is further divided into: the catchment of Mainland Greece (red outline in Figure 1; 157,550 km2) and that of Peloponnese (black outline in Figure 1; 21,434 km2); and the catchment draining into the Ionian Sea (green area in Figure 1; 31,958 km2) and that draining into the Aegean Sea (light blue area in Figure 1; 147,026 km2). These catchments are identified from reported watershed boundaries and associated vectorized river networks at 15 arc second by 15 arc second resolution [25].
Data-wise, the Mainland catchment includes three local catchments (blue outlines within the Mainland catchment in Figure 1) with reasonable openly reported data series of runoff (explaining further what is considered reasonable in the data section below). Moreover, the Peloponnese catchment includes three water management districts and associated local catchments (blue outlines within that catchment in Figure 1) of Northern Peloponnese (NP), Western Peloponnese (WP) and Eastern Peloponnese (EP), for which relevant temporal average runoff and other freshwater data are available (as described further below).
2.2. Hydro-Climatic Data
In general, open access data for the study region is limited in space and time. Long-term observations of the atmospheric variables surface temperature (T) and P are readily available from global gridded databases like the CRU TS2.1 data set [26] and the more recently updated CRU TS3.10/CRU TS3.10.01 data sets at 0.5° grid-cell resolution [27]. However, for the water variables R and ET in the landscape, the spatio-temporal coverage of available regional data is much more limited.
Openly reported data in the Global Runoff Data Centre (GRDC) [28] show only three stream discharge stations in Greece with reasonable long-term annual average values for R. The reasonableness is judged by the long-term average R being smaller than the long-term average P, since equal or greater long-term average R (as found for other Greek discharge stations) implies unrealistic zero or negative long-term average ET = P − R. The reasons for the physically unreasonable discharge values reported for many stations in Greece are not known to us. For most of these discharge stations and the associated catchments, the annual aggregation of the R values (discharge divided by catchment area) implied by the reported discharge data in GRDC equals more or less the annual aggregation of the corresponding catchment-average P values in the CRU data; this indicates that the reported discharge data may not be independently measured but derived from catchment-average P data without accounting for the partitioning of the P water input between ET and R. At any rate, the three discharge stations with physically reasonable data and their local catchments are located in mainland Greece with the associated rivers being: Mesta-Nestos, Almopaios and Aliakmon (Figure 1). Data from these stations in GRDC [28] have a maximum temporal extent of 24 successive years in the second half of the 20th century (Table 1).
For the Peloponnese, estimates representative of current long-term average R conditions are available from reports by the Greek Water Management Authority [29] for the three water management districts and associated local catchments NP, WP and EP (Figure 1). For these, average values of P, R and ET are reported for different subcatchments, leading to the average ET/P ratios listed in Table 1.
2.3. Land- and Water-Use Data for Irrigation
Openly available information on irrigation rates and areas for Greece is not complete over either the whole investigated geographical space or the whole investigated time period. Two different types of such data are available: national irrigation data sets from statistics reported by the Organisation for Economic Co-operation and Development (OECD) [30,31]; and the global map of irrigated areas version 5.0 (GMIAv5.0) [32]. The national OECD data sets [30,31] contain statistics in terms of area that is actually irrigated (Aai) and total volume of water withdrawal for irrigation (Iwwv) in Greece, especially from 1990 onwards (Figure 2). For earlier times, sporadic data on total irrigated area is provided by [33]. Furthermore, the global map of irrigation areas [32] represents the situation around year 2005 with spatial resolution of 5 arc minute by 5 arc minute (see Figure 3 for Greece).
2.4. Assessing Freshwater Conditions and Changes
Temporal average T and P for the two comparative periods (T1, P1 for the early period 1930–1949 and T2, P2 for the recent period 1990–2009) are calculated from data on monthly P and T, as provided by the CRU TS 3.10/3.10.1 worldwide database extending over the period 1901–2009 [27]. Catchment-average values of these temporal averages are further quantified over all CRU grid cells with at least 34% of their area intersecting each considered catchment; Supplementary Figure S1 shows this CRU mask, used to extract catchment-average values of all analysed variables for each study catchment.
While period-average conditions for the atmospheric variables T and P can be calculated directly from available data series for the two comparative study periods, data on the average water fluxes in the landscape, ET and R, are not obtainable in this way for the earlier period 1930–1949. To estimate the early-period long-term average values of ET1 and R1 and the associated ET and R changes to the average values ET2 and R2 in the recent period 1990–2009, we start by evaluating the long-term average ET2 value for 1990–2009 from the available P and R data for this period as ET2 = P2 − R2 = (ET2/P2) × P2, based on the overarching long-term average water balance in each catchment. The data-given range of currently applicable ET/P values in Table 1 is calculated on this water-balance basis, following previous studies that have found [9,34] and assumed [5,7,8] long-term catchment-average changes in water storage to be near-zero over such long time periods.
To further estimate the change in average ET between the two 20-year periods, we follow the approach of previous studies [5,7,8] in estimating this total change as:
ΔET = ET2 − ET1 ≈ ΔETclim + ΔETirr.
The second equality is approximate in assuming that total ΔET involves two main change components: ΔETclim driven by climate change and ΔETirr driven by irrigation changes. By evaluating these components, ET1 can be estimated from Equation (1) as ET1 = ET2 − ΔETclim − ΔETirr.
Furthermore, from this quantification of ET1, the corresponding average R1 can be consistently estimated as:
with ΔP = P2 − P1 being the P change, and
being the total R change between the two periods. The climate-driven component of total ΔR is thus quantified as ΔRclim = ΔP − ΔETclim and the corresponding irrigation-driven component is quantified as ΔRirr = −ΔETirr.
R1 ≈ P1 − ET1 = P1 − (ET2 − ΔETclim − ΔETirr) = P1 − ((P2 − R2) − ΔETclim − ΔETirr)
= R2 − ((ΔP − ΔETclim) − ΔETirr),
= R2 − ((ΔP − ΔETclim) − ΔETirr),
ΔR = R2 − R1 ≈ (ΔP − ΔETclim) − ΔETirr = ΔRclim + ΔRirr
To estimate the climate-driven change component ΔETclim, we further relate the period-average temperature (T1, T2) and precipitation (P1, P2) to the corresponding average potential evapotranspiration (PET1, PET2) based on the Langbein functional relationship [35] and further to corresponding ET conditions in each period (ETclim2, ETclim1) based on the Turc functional relationship [36]. From these quantifications, the climate-driven ET change can be estimated as ΔETclim = ETclim2 − ETclim1 = f(PET2,P2) − f(PET1,P1). Alternative functional relationships for ETclim = f(PET,P) may be used for this estimation but previous work has shown small differences in resulting changes of long-term catchment-average ET by use of alternative such functions [34].
Furthermore, to estimate the irrigation-driven change component ΔETirr = ETirr2 − ETirr1, we quantify the average irrigation water withdrawal per irrigated area in each period (Iww1, Iww2) based on: the data and associated best-fit function for the temporal Iww evolution (Figure 2c); the area actually irrigated in absolute terms (Aai2 from Figure 3a for recent period 1990–2009) and relative to total cell area (Aai_rat2 from the map in Figure 3b for the recent period); and the assumption that more or less all water used for irrigation feeds back into the average ET over each period. The latter assumption is supported by previous studies of different irrigated areas of the world [17,22,23], as well as by recent findings of ET variations correlating well with concurrent, independently determined transpiration variations [16]. As irrigation is applied precisely for feeding into transpiration, it is reasonable to assume that it largely does so, or otherwise feeds into increased evaporation, either directly from soil water, or from potentially added surface water runoff; in any case, the applied irrigation water may be expected to largely feed into the total ET of each catchment. Moreover, a wide range of different possible Iww and Aai_rat evaluation scenarios are investigated (as described further in the following uncertainty analysis section) and may be expected to also cover uncertainty effects associated with varying parts of the irrigation water use (Iww) and / or the relative irrigated catchment area (Aai_rat) feeding into ET in each catchment. In general, based on these considerations and assumptions, an irrigation-driven part of total ET in each period is estimated as ETirr ≈ Iww × Aai_rat. The difference between the resulting values of ETirr for each of the two periods then provides the irrigation-driven change ΔETirr = ETirr2 − ETirr1.
In the absence of available data on the spatial distribution of irrigated area in the earlier period 1930–1949, we assume that the relative grid-cell irrigated area in that period (Aai_rat1) is some fraction (αirr) of the corresponding relative irrigation area in the recent period (i.e., that Aai_rat1 = Aai_rat2 × αirr). The fraction αirr is further assumed to be more or less the same for all grid cells and is estimated as such from the total irrigated area over Greece (Figure 3a) in the early period (total Greek Aai1) relative to that in the recent period (total Greek Aai2), that is, as αirr ≈ (total Greek Aai1)/(total Greek Aai2).
Table 2 summarizes a set of estimated input variables values, needed in the above-described calculations for each study catchment. Footnotes to Table 2 explain how these values are estimated and this evaluation is in the following referred to as the base case scenario for each catchment. This scenario is obtained using mean (or other relevant characteristic) values of the main input variables for each catchment and time period. In general, values that to some degree differ from those in the base case scenario may also be estimated for uncertain variables, depending on choices of data and assumptions made for the variable evaluation. To account for such evaluation uncertainty, we also consider possible alternative values of main uncertain variables, as explained further in the following section.
2.5. Uncertainty Analysis
For comparison with and uncertainty analysis of other possible variable values than those considered in the base case scenario (Table 2), we also evaluate alternative scenarios of uncertain variable values. Table 3 compares the base and the alternative scenarios and lists their variable value differences for the total regional catchment; Supplementary Table S1 does the same for the other four study catchments.
With regard to P data, the alternative scenarios outlined in Table 3 (named in the first and explained in the second column, in direct comparison with the base case) consider possible corrections for P undercatch bias [37], or for both undercatch and orographic biases [38]. Moreover, the ET/P ratio used for estimating average ET in the recent period 1990–2009 ranges from 0.55 to 0.72 among the local catchments with available data across Greece (Table 1). The base case scenario considers the mean value of ET/P, whereas two alternative ET/P scenarios consider corresponding minimum and maximum values (Table 3); the ET/P values are multiplied with P in each data grid cell to obtain grid-cell values of ET over each catchment.
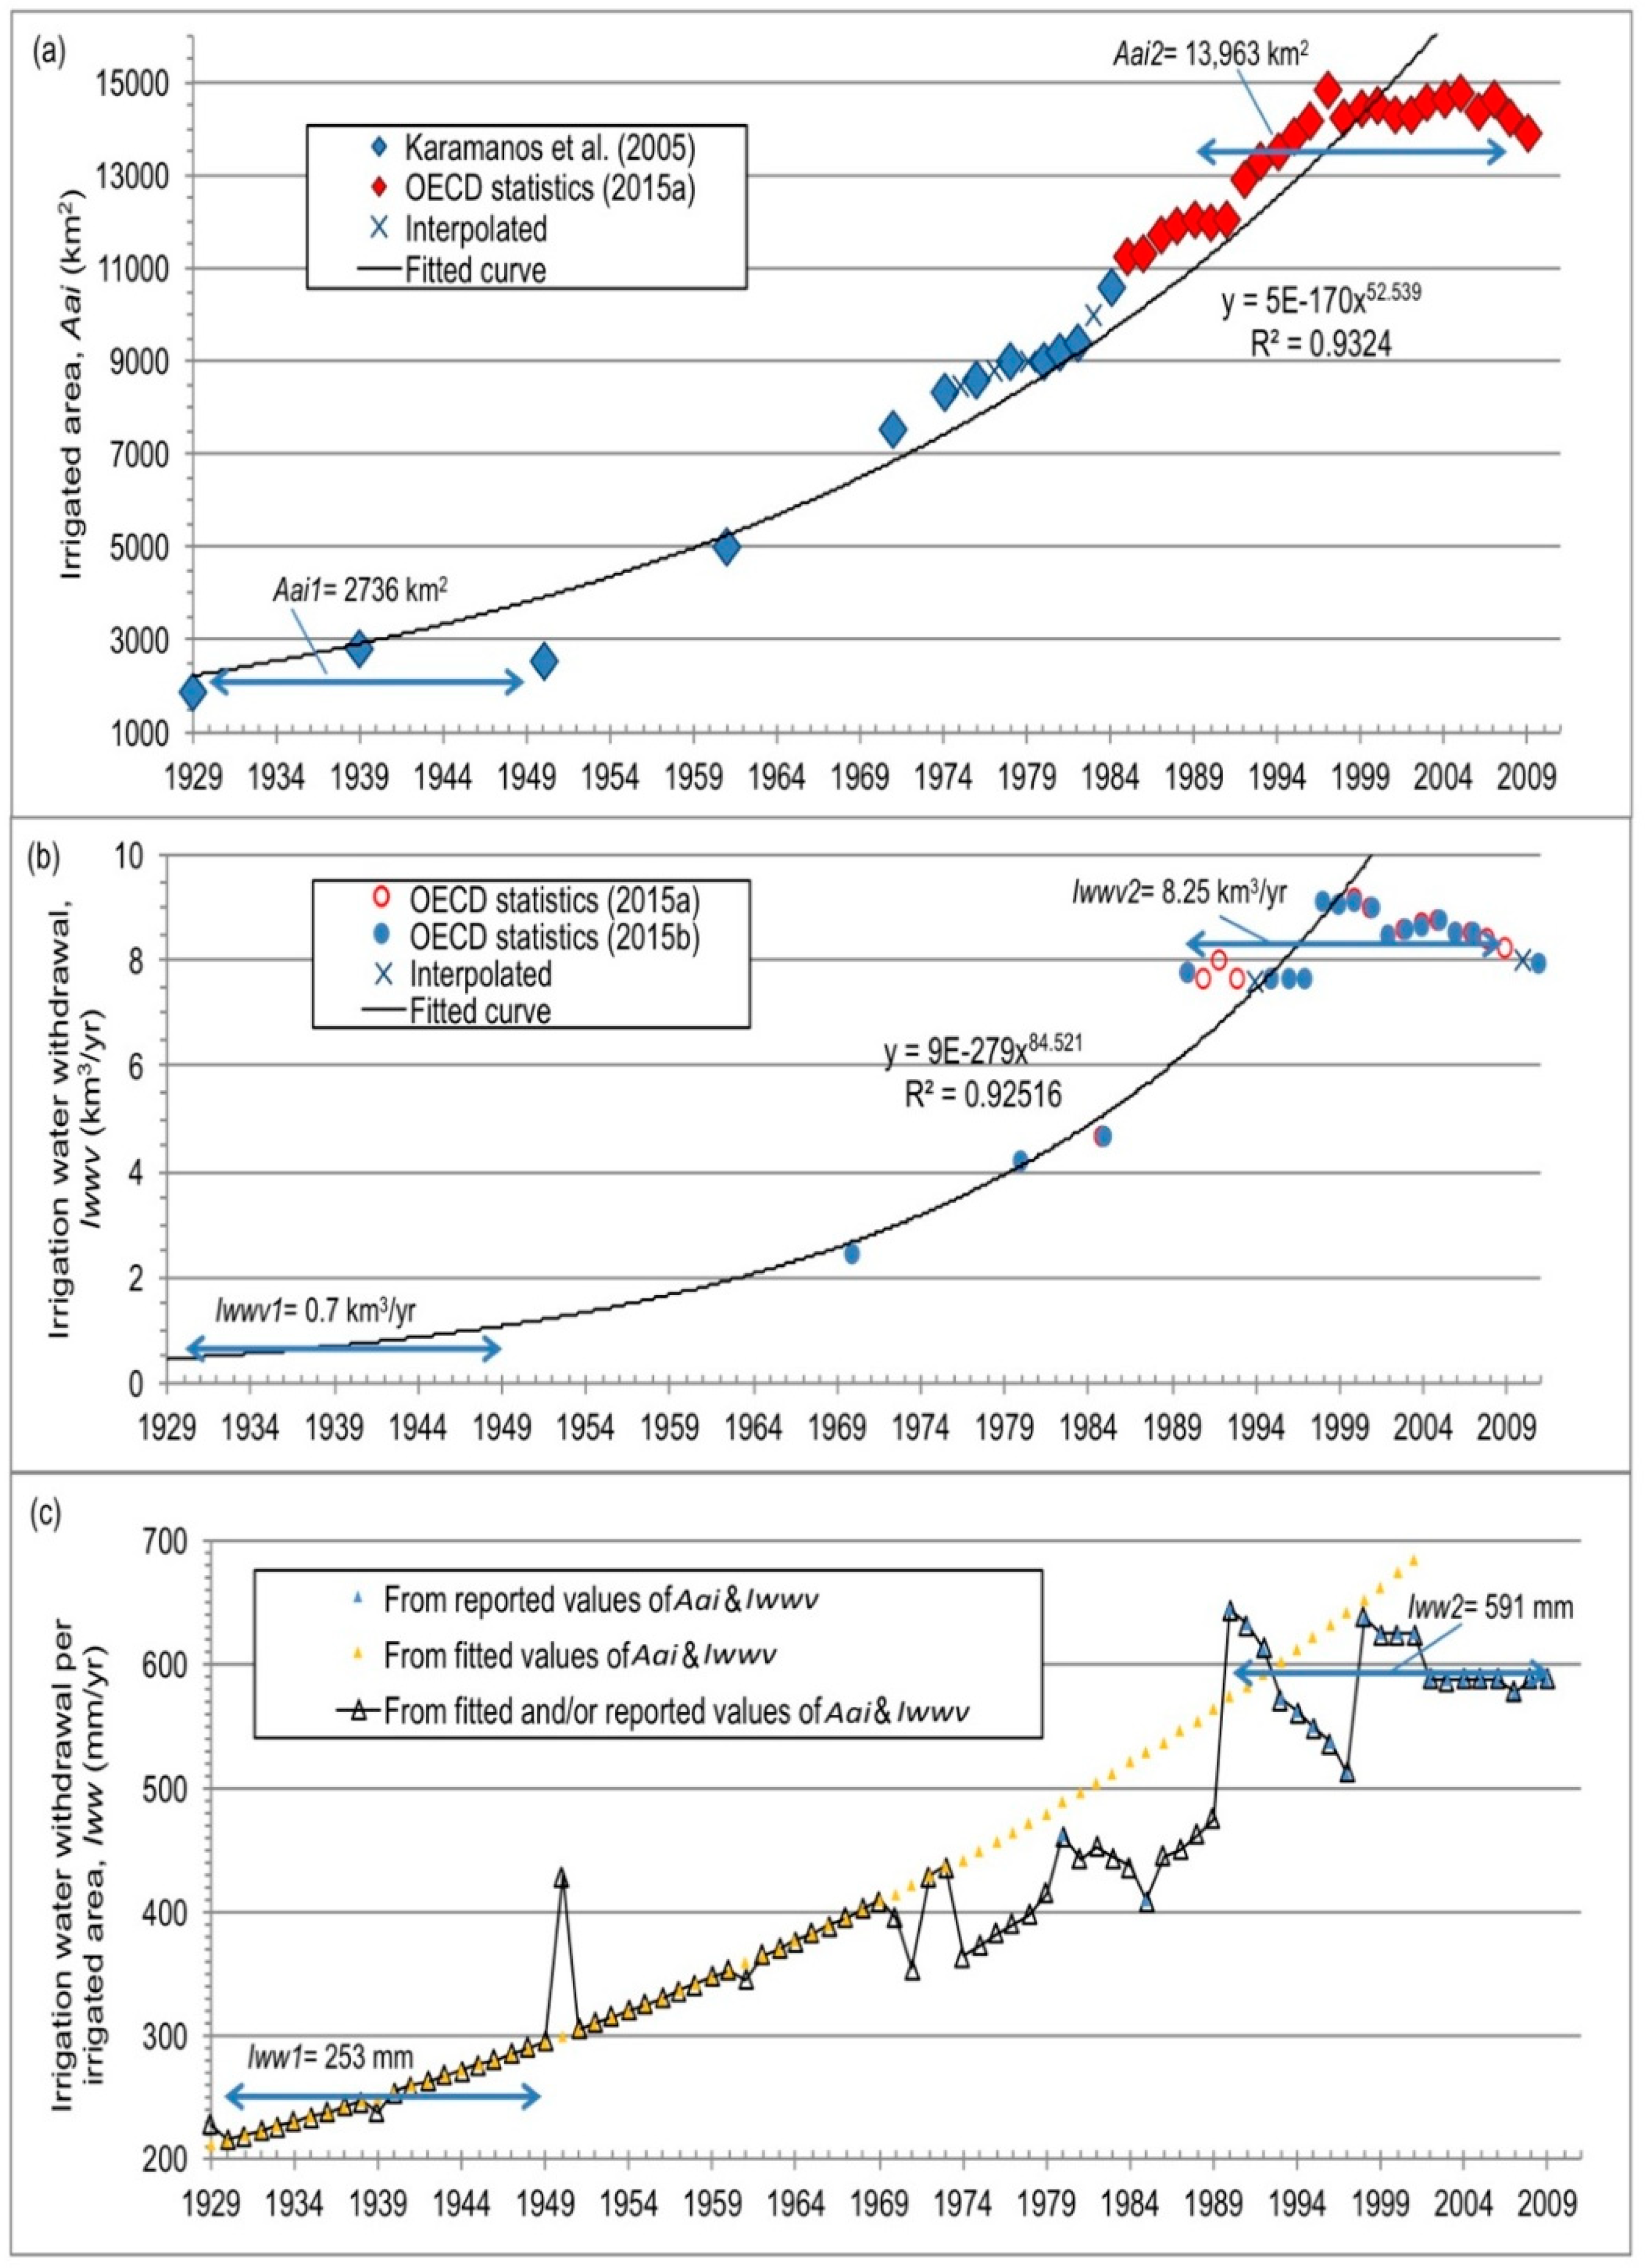
Furthermore, considerable uncertainty about irrigation variables may stem from the estimation of water use (withdrawal) per irrigated area in the 1990–2009 period (Iww2). For example, for the total regional catchment (Table 3), Iww2 may be as large as 747 mm/year if the recent irrigated area in its calculation is estimated from the national reported irrigated area [30] (Aai2 = 13,963 km2) instead of 591 mm/year in the base case scenario that estimates Iww2 from GMIAv5.0 [32] (Aai2 = 11,046 km2). The resulting uncertainty range of Iww2 is then ±78 mm/year.
With this uncertainty range given for Iww2, a corresponding uncertainty range of ±78 mm/year may also be expected for Iww1, yielding an even wider uncertainty range for the temporal change in Iww by considering different possible combinations of Iww2 and Iww1 values in the base and alternative scenarios (as outlined in Table 3). Finally, also the value of the irrigation fraction αirr = Aai1/Aai2 differs if the recent total irrigated area (Aai2) is estimated from the GMIAv5.0 data [32] (11,046 km2 for the regional catchment; base case scenario), or from the national reported data [30] (13,963 km2 for the regional catchment; alternative scenario).
3. Results and Discussion
3.1. General Approach
A main result of this study is the general approach developed, used and tested for robustly assessing freshwater changes in terms of catchment-scale long-term average ET and R, driven by climate and landscape (here irrigation) developments from an earlier period (here 1930–1949) to recent conditions (here 1990–2009). Figure 4 illustrates schematically this principal approach, which is based on fundamental catchment water balance, aiming to constrain the result and uncertainty ranges of different possible variable evaluations. This approach provides a consistent flow-chart basis for corresponding quantitative assessments of freshwater changes in various comparative scenarios and catchment cases. Different scenarios may represent various possible variable evaluations from limited available observation data and the catchments may be of different scales and in different parts of the world.
3.2. Freshwater Changes
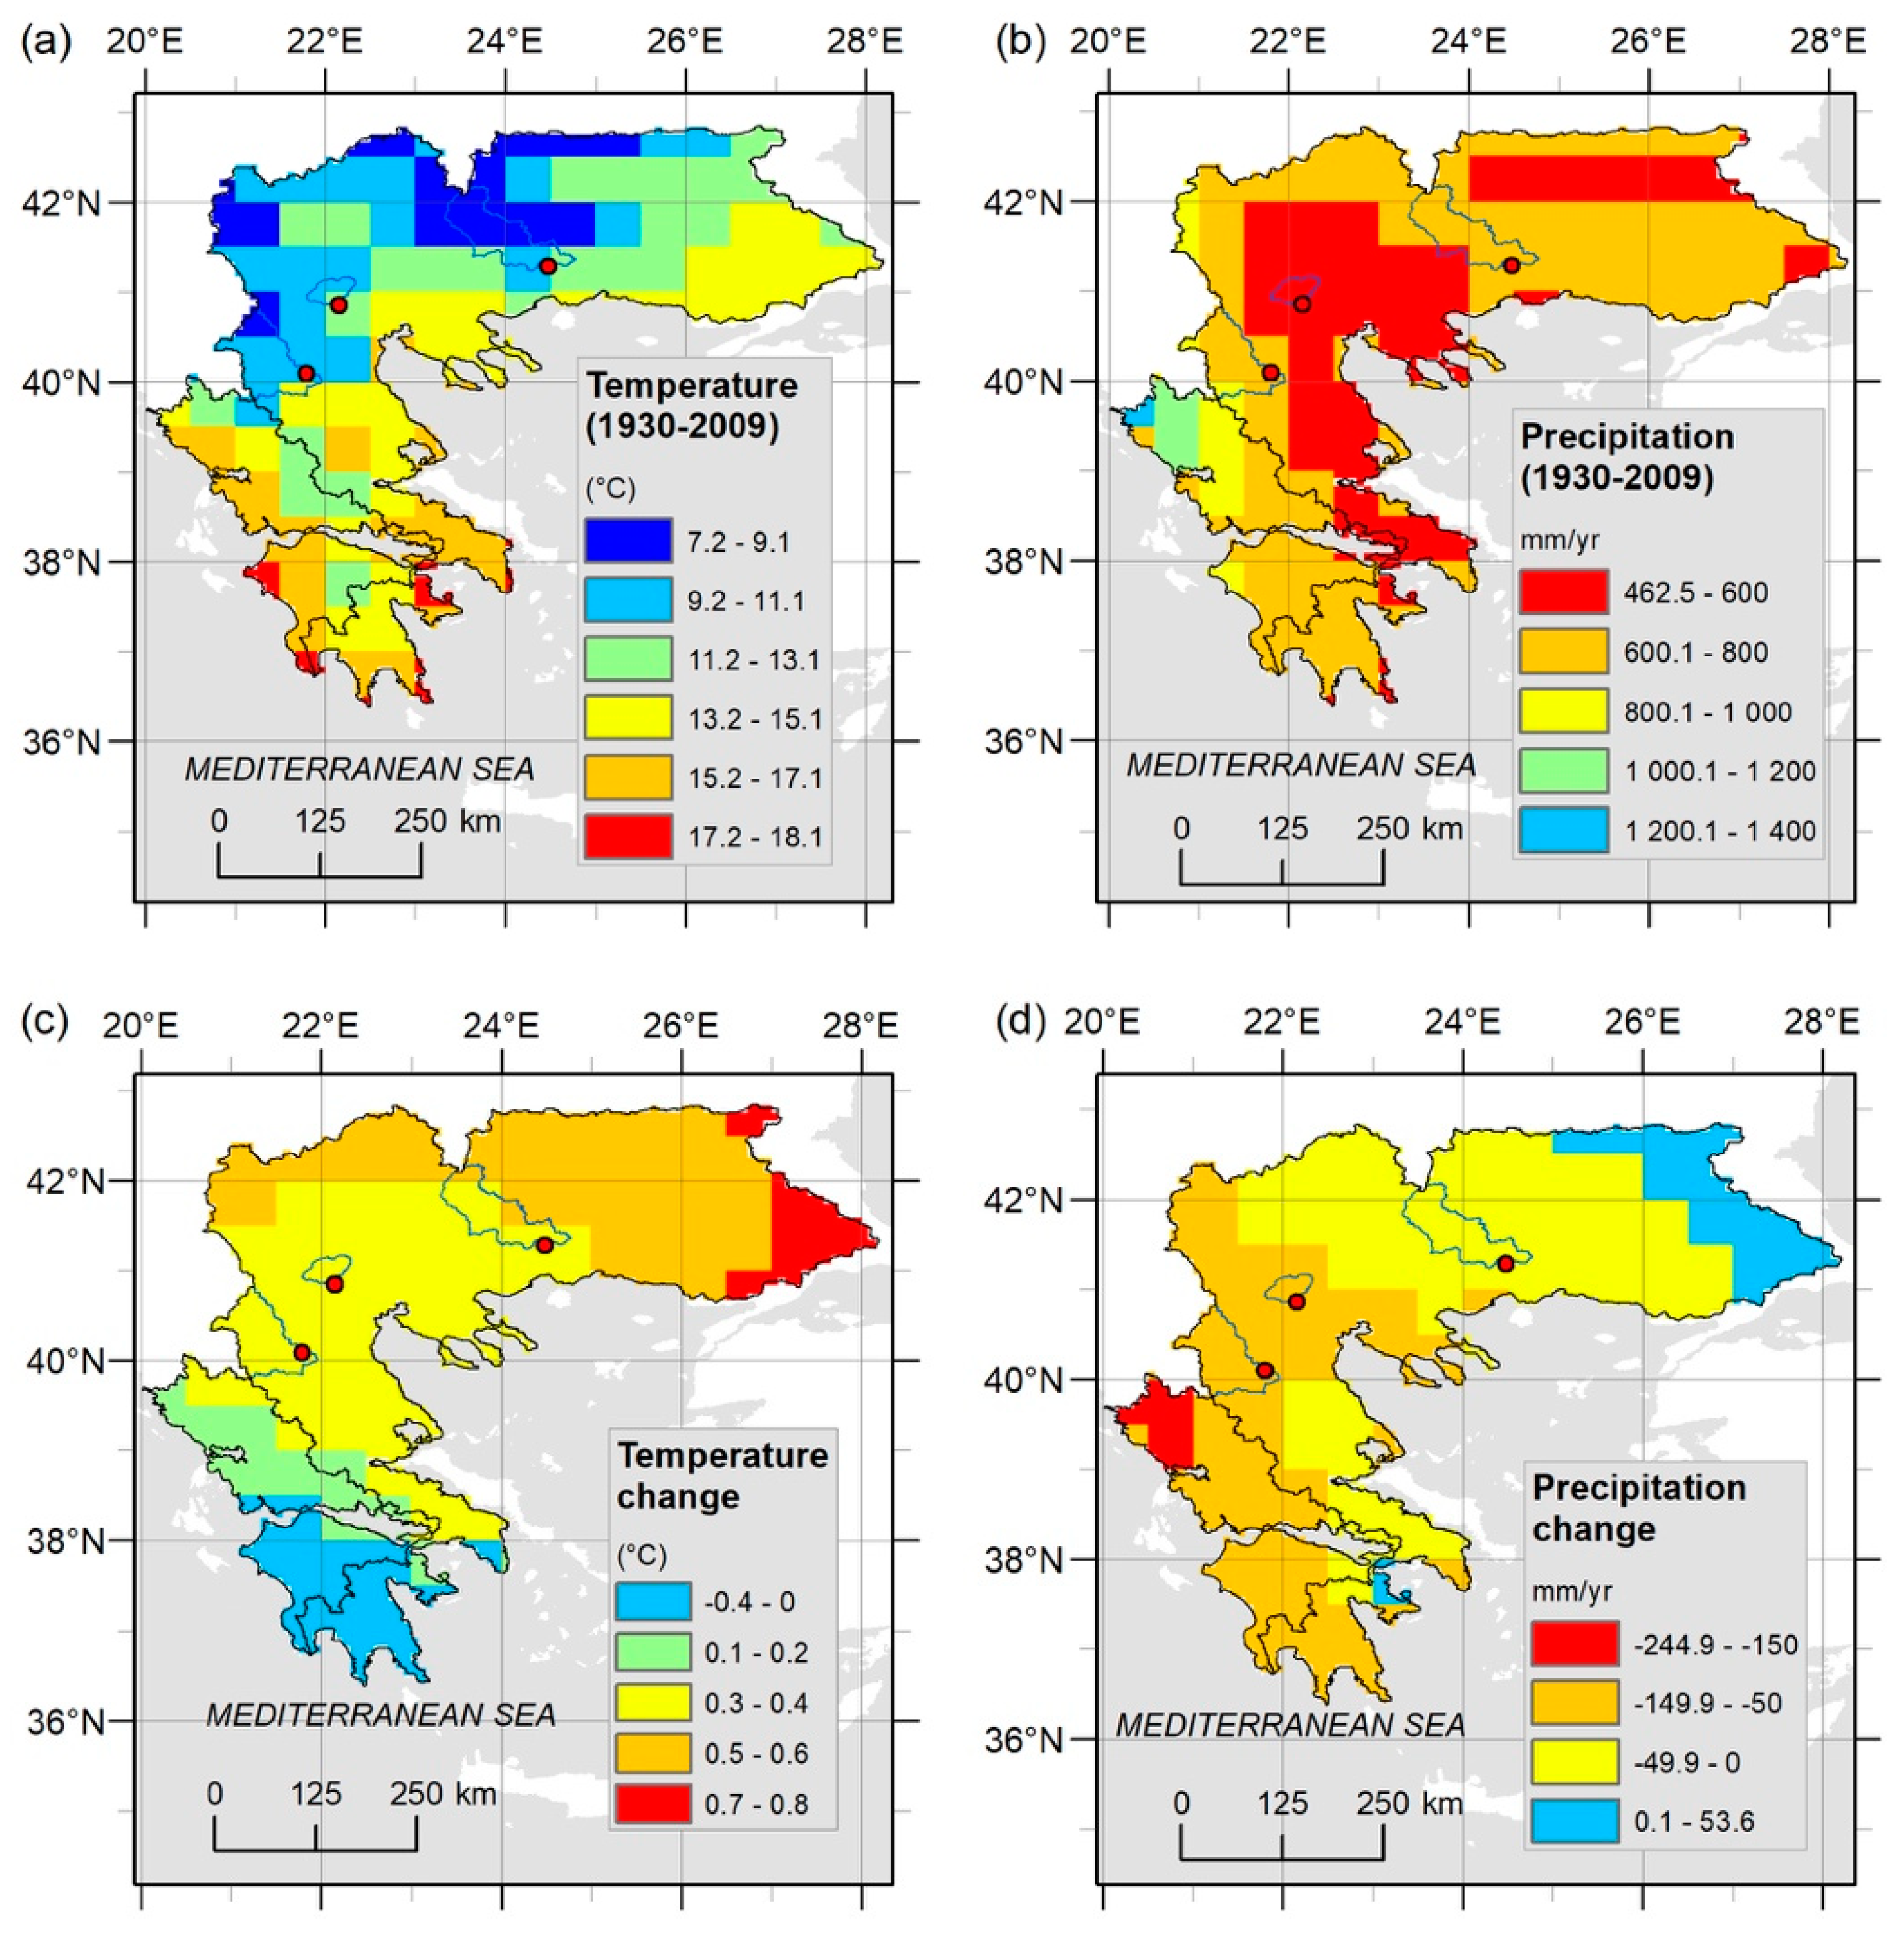
Figure 5 shows the regional conditions and changes in the atmospheric variables T and P (top left in the general approach illustration, Figure 4), in terms of the spatial distribution of their temporal averages over the whole study period 1930–2009 (Figure 5a,b) and the changes in period-average T and P from 1930–1949 to 1990–2009 (Figure 5c,d). Spatially, long-term average T increases from a local range of around 7–11 °C in the north to around 15–18 °C in the south, while average P increases from a local range of around 460–800 mm/year in the east to around 800–1400 mm/year in the west. The corresponding changes also follow a north-south gradient for T and an east-west gradient for P. The temperature T increases in the cooler north and decreases in the warmer south (i.e., cool gets warmer and warm gets cooler), while P increases (or decreases the least) in the dry east and decreases (the most) in the wet west (i.e., dry gets wetter—or dries the least and wet gets drier—or dries the most).
Catchment-average results for T and P (Table 2, for the base case scenario) are consistent with the mapped grid-cell results (Figure 5) in showing that the most north-extending and coolest catchment (Aegean) has warmed the most (increase in average T of 0.4 °C) while the most southern and warmest catchment (Peloponnese) has cooled (decrease in average T of −0.2 °C). Moreover, while average P has decreased in all catchments, the most east-extending and driest catchment (Aegean) exhibits the smallest P decrease (−35 mm/year) and the most western and wettest catchment (Ionian) exhibits the largest P decrease (−94 mm/year).
Overall, the atmospheric hydro-climatic changes in T and P from 1930–1949 to 1990–2009 have driven most catchments (except the Peloponnese and Ionian) toward somewhat warmer conditions and all catchments toward drier conditions. Furthermore, these changes have decreased the variability range of average T and P among the nested catchments, from earlier ranges of 3.4 °C (from minimum 11.5 to maximum 15 °C) and 224 mm/year (from 637 to 861 mm/year) to recent ranges of 2.8 °C (from 12 to 14.8 °C) and 145 mm/year (from 622 to 767 mm/year), respectively.
With regard to irrigation, this has increased greatly in Greece in terms of all associated variables: irrigated area (Figure 2a) and amount of water used for irrigation in terms of absolute volume (Figure 2b) and per irrigated area (Figure 2c). These changes imply corresponding irrigation increases also in the different study catchments (Table 2). As a consequence of these human-driven irrigation developments, combined with the atmospheric hydro-climatic changes (Figure 5b), the long-term average values of the landscape hydro-climatic variables ET and R have also changed over Greece and in the different study catchments. Figure 6 and Figure 7 illustrate the changes in ET and R, respectively, for all catchments. Further result details are listed in Table 4 for the total regional catchment; corresponding results for the other catchments are listed in Supplementary Table S2 for Mainland, Table S3 for Peloponnese, Table S4 for Ionian and Table S5 for Aegean.
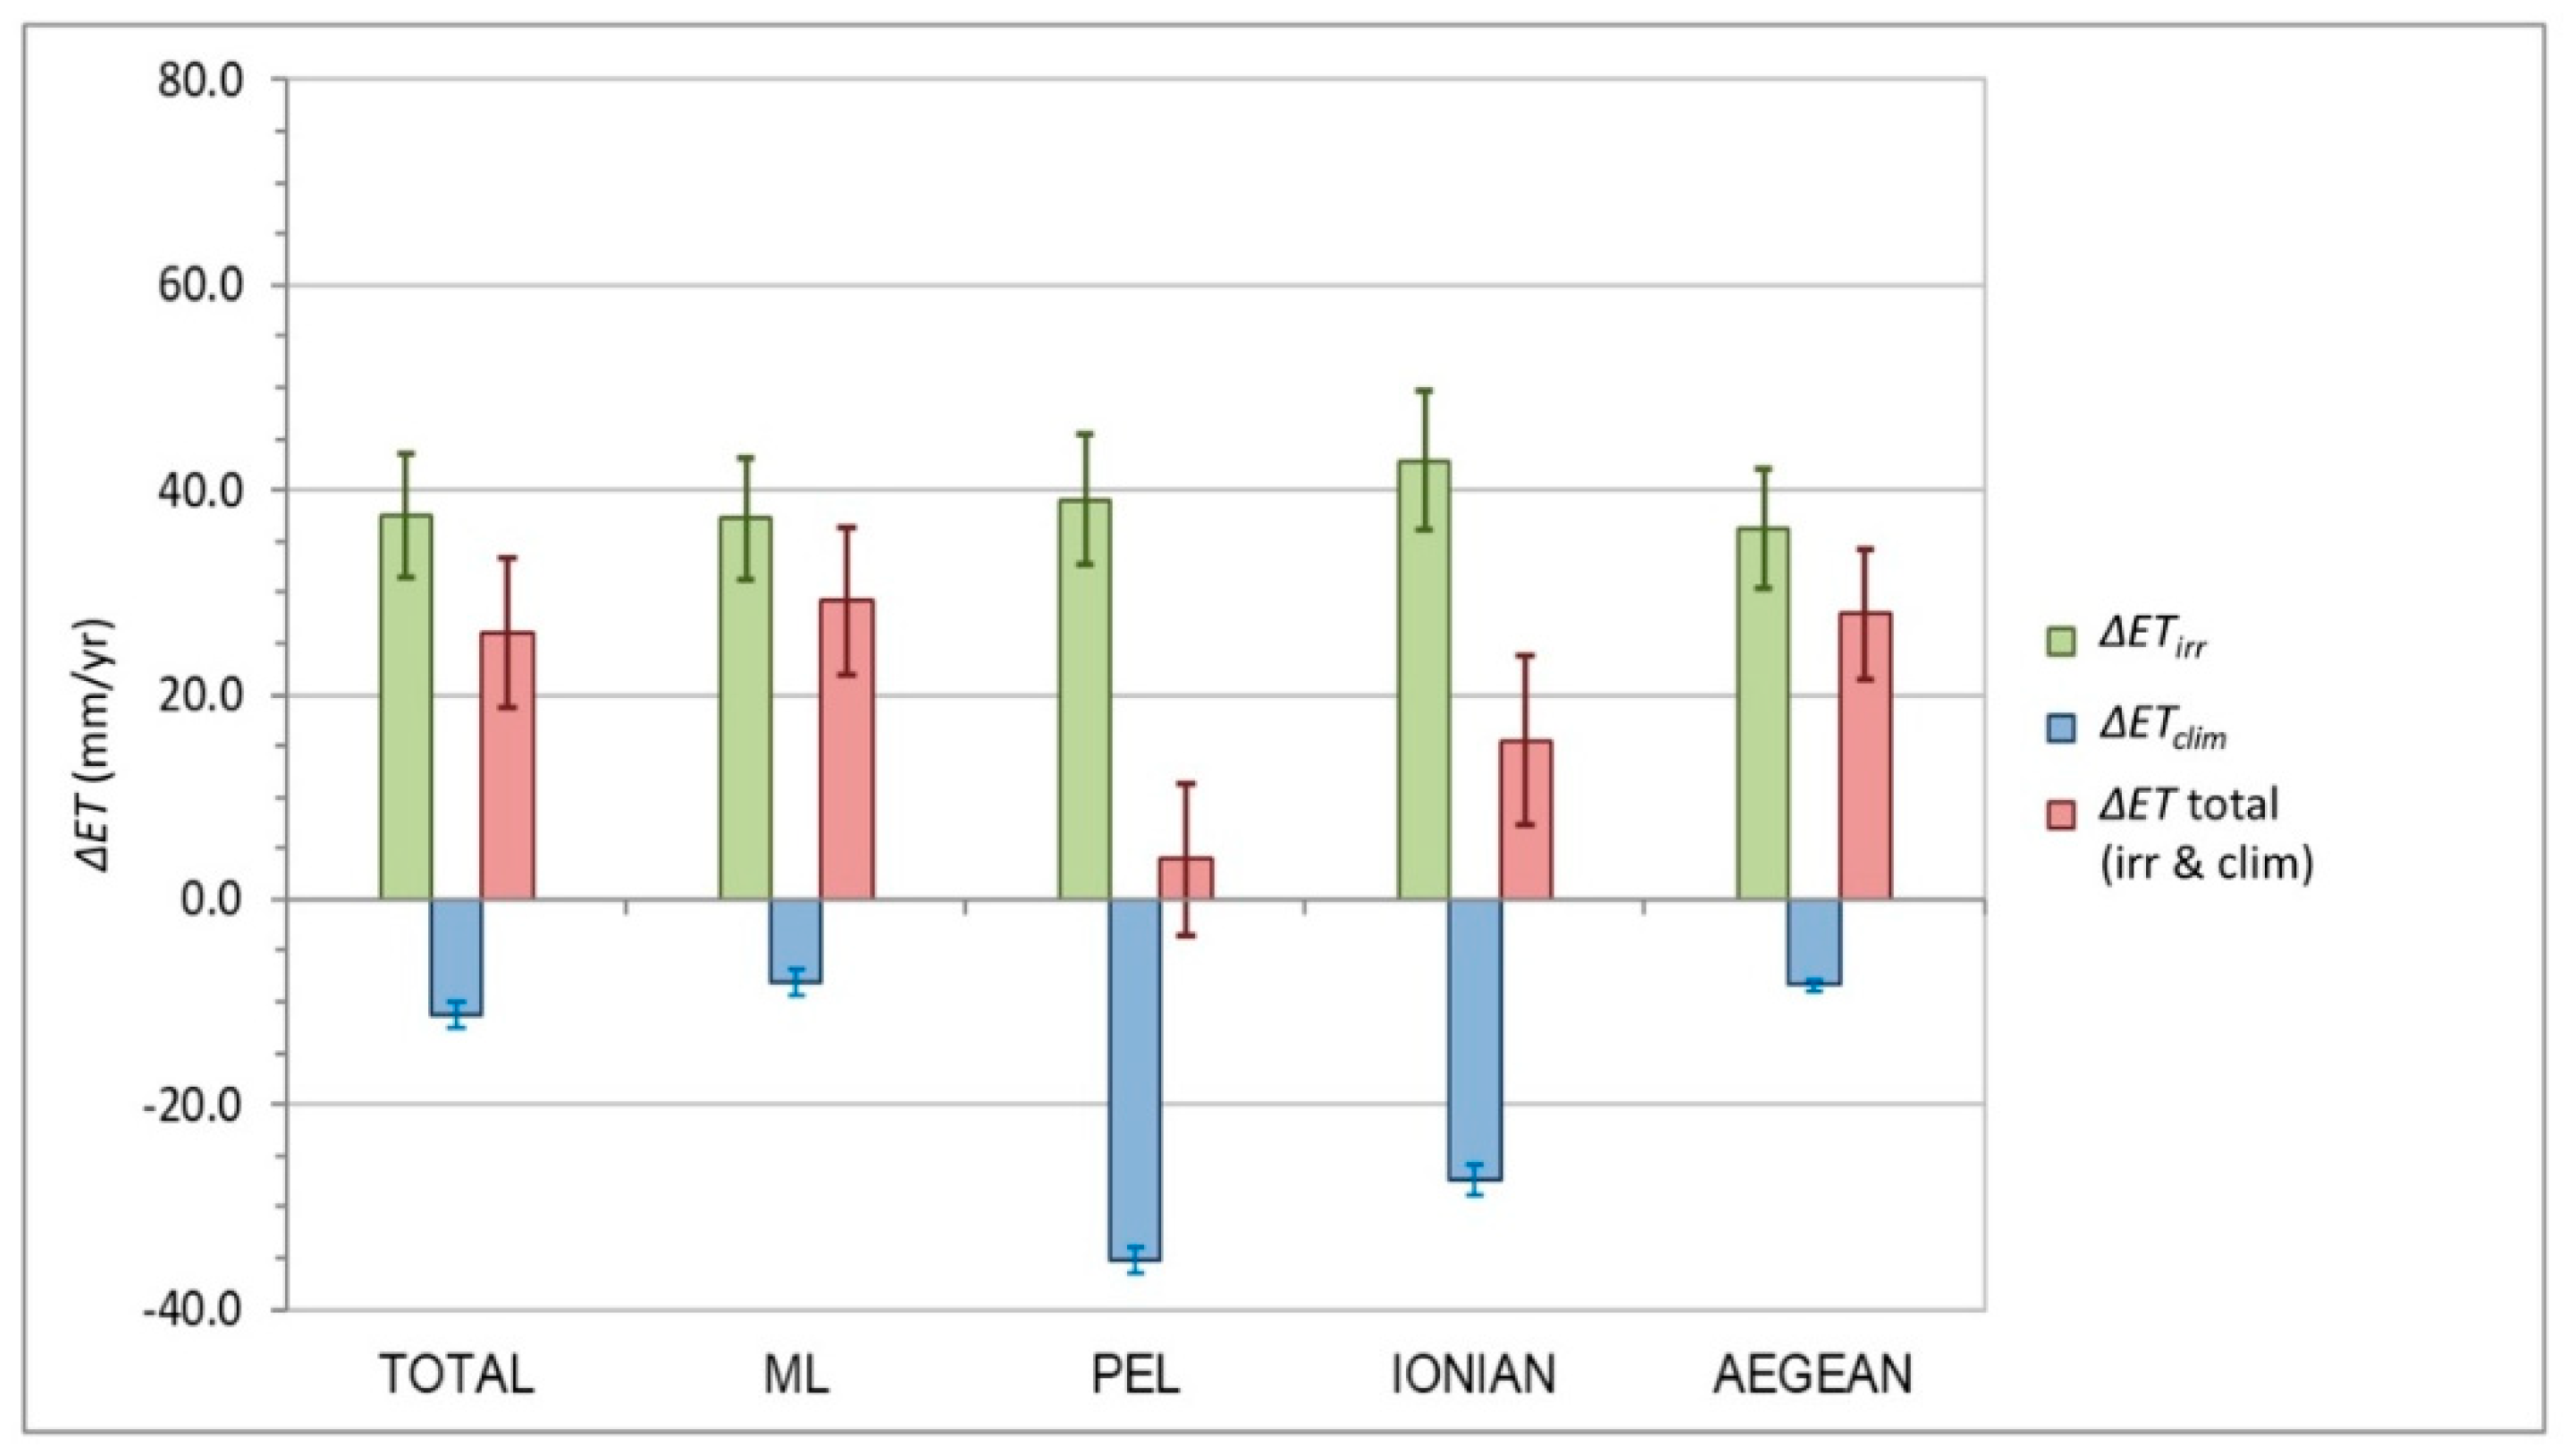
Overall, ET has increased to some greater or lesser degree, while R has decreased considerably over all catchments. For ET, the irrigation developments have driven the largest change component ΔETirr (overall increase of around 40 mm/year), while the climate-driven change ΔETclim is in the opposite direction (decrease) and mostly of smaller absolute magnitude (around or less than 10 mm/year for the total, Mainland and Aegean catchments). For the Ionian and Peloponnese catchments, the absolute magnitude of the decrease ΔETclim is relatively close to that of the increase ΔETirr. As a consequence, the total net increase ΔET is relatively small in these two catchments (around 15 mm/year in the Ionian and 4 mm/year in the Peloponnese) and larger in the other catchments (around 25–30 mm/year).
The main reason for the relatively large decreases ΔETclim of around −27 mm/year and −35 mm/year in the Ionian and the Peloponnese catchment, respectively, is that they are subject to the largest precipitation decreases ΔP (of −94 mm/year and −80 mm/year). These are also combined with ΔT conditions of zero warming (Ionian) or even cooling (of −0.2 °C in Peloponnese), which do not drive ET increase. A question to investigate in further climate-change research for this region is whether the generally large irrigation-driven ET increase (ΔETirr component) and the additional latent heat flux that this implies from the land surface to the atmosphere have contributed to significant local cooling of the land surface, thereby counteracting local warming effects of global climate change. This has been found in other irrigated regions of the world [17,23] and such irrigation-driven surface cooling would be consistent with the relatively small increases of local surface T over Greece, including the cooling and zero warming in the Peloponnese and Ionian catchments with the largest and second largest increase components ΔETirr, respectively.
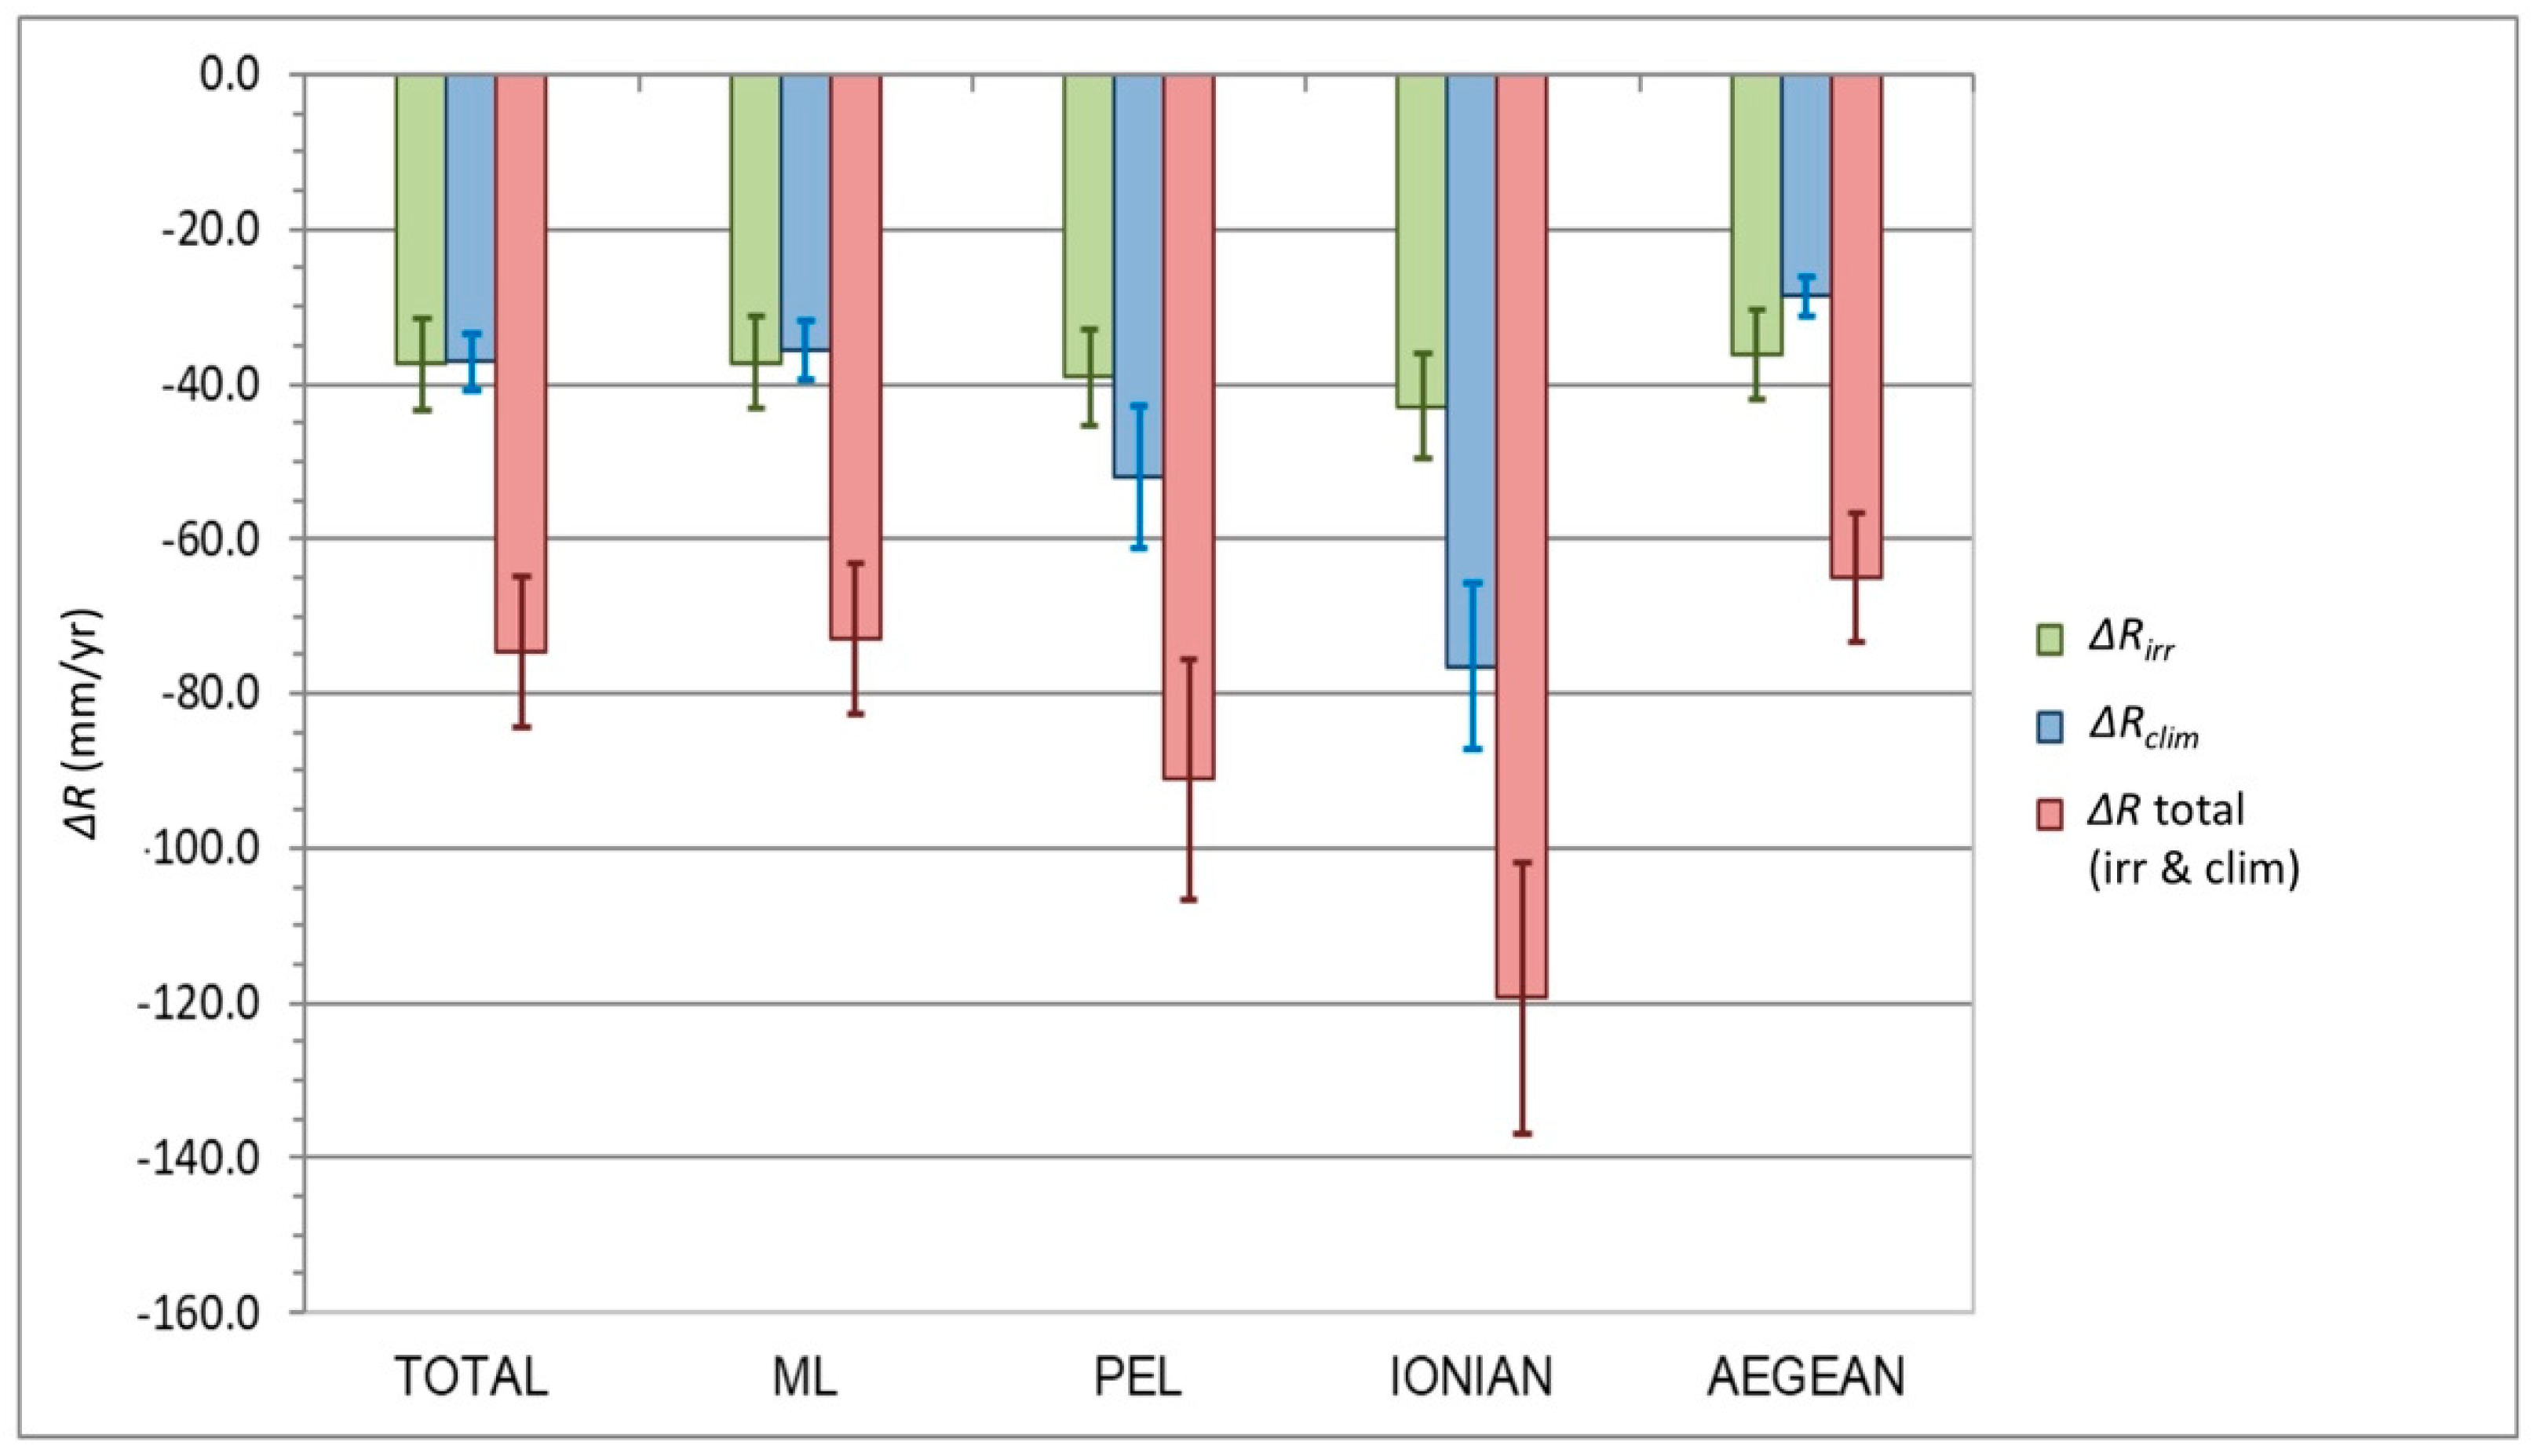
In contrast to ET, the climate and irrigation change components of ΔR are both in the same direction, thus reinforcing each other and leading to considerable decrease in R across all catchments (Figure 7). In total, ΔR is around: −75 mm/year, −73 mm/year and −65 mm/year in the three largest catchments, total regional, Mainland and Aegean, respectively; and −91.1 mm/year and −119 mm/year in the two smallest catchments, Peloponnese and Ionian, respectively. The irrigation driven change component ΔRirr = −ΔETirr (Equation (3)) has similar magnitude (decrease of around −40 mm/year) across all catchments. In most catchments (total, Mainland, Aegean), the climate-driven change component ΔRclim = ΔP − ΔETclim (Equation (3)) is also a decrease of somewhat smaller magnitude (around −35 to −30 mm/year) than ΔRirr. However, in the Ionian and Peloponnese catchments, the decrease ΔRclim is larger (around −75 mm/year and −50 mm/year, respectively) than ΔRirr. Overall, the decrease ΔRclim is mainly due to the precipitation decrease ΔP across all catchments.
The results of net total increase in average ET and decrease in average R, which for ET masks and for R exacerbates the decrease expected from only the observed atmospheric climate change (in T and P), are consistent with corresponding results for other irrigated areas of the world. For example, in the Indian Mahanadi River catchment, draining into the Bay of Bengal, with decreased long-term average P by −60 mm/year and increased irrigation water use by 81 mm/year (from 1901–1955 to 1956–2000), the average ET increased by around 55–70 mm/year while the average R decreased by around −130–−115 mm/year [39]. Furthermore, in the case of the Aral Sea catchment (ASC), P increased by 11 mm/year and irrigation water use increased by 23 mm/year (from 1901–1950 to 1983–2002), while the average ET increased by 15 mm/year and the average R decreased by −28 mm/year [39]. In both of these irrigation cases, as also found here for Greece, the irrigation development has led to ET increase in spite of P decreasing (or to greater ET increase than the increase in P for ASC) and consequently to much greater decrease in R than the decrease in P (or to R decrease in spite of P increasing for ASC); in both cases, as in Greece, the large ET increase is also not explainable by just the observed warming (increase in average T) over each catchment. A global study of ET changes around the world’s land areas has also shown statistically that irrigated areas (and areas with dam and reservoir developments for meeting the irrigation and other increased water demands) have experienced significantly greater ET increases than other, more undisturbed land areas with regard to such human developments [8].
The irrigation-driven increases in ET imply greater losses of freshwater from the irrigated catchments. For most such catchments, these water losses are not compensated by corresponding increases in observed P, since the observed P changes (even combined with the observed T changes) cannot explain the total ET increases [8,39]. From its use for helping crops to survive dry season and drought conditions [16], the irrigation water adding to increased ET in an irrigated catchment is thus lost from that catchment and goes to feed other catchments or maybe even the sea. This leaves less freshwater for other uses in the irrigated catchment, such as for households, industry, energy generation and/or ecosystems. Water managers and decision makers need to understand the involved trade-offs and make conscious, informed choices for sustainably balancing freshwater uses among societal sectors and ecosystems. Further research is also needed to support such choices by investigating and revealing the implications of different development scenarios.
3.3. Uncertainty in Freshwater Changes
The error bars in Figure 6 and Figure 7 show the uncertainty ranges of the estimated freshwater changes ΔET and ΔR, as obtained in total from all considered uncertainty scenarios (Table 3, Supplementary Table S1). Table 4 lists further result details for the total regional catchment; corresponding results for the other catchments are listed in Supplementary Table S2 for Mainland, Table S3 for Peloponnese, Table S4 for Ionian and Table S5 for Aegean. In general, the total uncertainty range of ΔET (±6–8 mm/year across all catchments) is smaller than that of ΔR, which is also more variable among the catchments (from ±8 for the Aegean up to ±18 mm/year for the Peloponnese). Overall, these uncertainty ranges do not change the main results and implications discussed above based on the mean freshwater changes.
With regard to the investigated underlying uncertainties, the largest range is associated with the different scenarios of irrigation water use per irrigated area (Iww; Table 3). For the total regional catchment (Table 3), the estimated change in Iww is on average 416 mm/year and the associated uncertainty range is ±156 mm/year. In comparison, the resulting uncertainty ranges for this catchment are much smaller for both ΔET and ΔR, at ±7 and ±10 mm/year, respectively. Similar results are obtained for this uncertainty propagation in all catchments, implying a major decrease in absolute range magnitude from that of underlying uncertainties (Table 3, Supplementary Table S1) to that of the total resulting ΔET and ΔR uncertainties (Table 4, Supplementary Tables S2–S5).
Also in relative terms, the largest underlying uncertainty range is that for the Iww change at ±38%. For the decrease in R (Figure 7), the resulting relative uncertainty range is overall smaller: 13% for the total regional, Mainland and Aegean catchments (with mean ΔR of −75 mm/year, −73 mm/year and −65 mm/year, respectively); 15% for the Ionian catchment (with mean ΔR of −119 mm/year); and 17% for the Peloponnese catchment (with mean ΔR of −91 mm/year). For the increase in ET (Figure 6), the relative uncertainty range is larger and varies more among the catchments than that of ΔR. Specifically, the relative ΔET range is: ±28% for the total regional, ±25% for the Mainland and ±23% for the Aegean catchment (with mean ΔET of 26 mm/year, 29 mm/year and 28 mm/year, respectively); ±54% for the Ionian catchment (with mean ΔET of 16 mm/year); and ±194% for the Peloponnese catchment (with mean ΔET of just 4 mm/year).
In general, the largest contribution to the total ΔET range (of ±6–8 mm/year) stems from irrigation uncertainty (±5–6 mm/year contribution; with additional ±1 mm/year stemming from climate uncertainty). For the total ΔR range (of ±8–18 mm/year), the largest uncertainty contribution varies among catchments. For the Aegean, Mainland and total regional catchment, the largest contribution stems from irrigation uncertainty (±6–8 mm/year contribution to their total ΔR range of ±8–10 mm/year; with additional ±2–4 mm/year stemming from climate uncertainty, in which the main part is due to the ΔP uncertainty of around ±2 mm/year). In contrast, for the Ionian and Peloponnese catchments, the largest contribution stems from climate uncertainty (±9–11 mm/year, in which the main part is due to the ΔP uncertainty of ±7–8 mm/year, contributing to the total ΔR range of ±16–18 mm/year; with ±6–7 mm/year stemming from irrigation uncertainty).
Across all catchments, the scenario combination with maximum Iww1 and minimum Iww2 (i.e., Alt. 2 Iww from Table 3) yields the lower ΔET and the upper ΔR limit, while the opposite scenario combination with minimum Iww1 and maximum Iww2 (Alt. 3 Iww, Table 3) yields the upper ΔET and the lower ΔR limit. The actual values of these limits depend also on the considered ΔP scenario, with the undercatch correction (Alt 1 P, Table 3) and even more so the undercatch and orographic correction (Alt 2 P, Table 3) increasing the ΔET values and decreasing the ΔR values compared to the base case scenario. The alternative scenarios for ET/P (Supplementary Table S6) and αirr (not shown) do not significantly change the results compared to the Base case scenario.
4. Conclusions
This paper has developed a general approach for synthesizing and jointly interpreting various types of data, related to different interacting and co-evolving drivers and aspects of freshwater change, subject to various degrees of uncertainty, over hydrological catchments of different scales. The application of this approach to the high-uncertainty case of Greece and its freshwater changes from 1930–1949 to 1990–2009, based on catchment water balance, provides support for an overall decrease in the combined uncertainties of resulting catchment-scale ET and R changes from the magnitude of the various underlying uncertainties.
For Greece, the study results are robust in showing that climate-driven P decrease and concurrent human-driven irrigation development from the first half of the 20th century to recent time have combined in driving considerable total decrease in R over the country. In the three largest study catchments (total regional, Mainland and Aegean), the total R decrease ranges from −65 to −75 mm/year ±13%. This total R decrease is driven by the local irrigation development to more or less the same degree (possibly somewhat more but within the uncertainty range) as by climate change (predominantly decrease in P, with relatively small T increase over Greece and even decrease in Peloponnese). For the relatively small Ionian and Peloponnese catchments, the R decrease is up to −119 mm/year ±15% and −91 mm/year ±17%, respectively, due to the particularly large P decrease experienced in these catchments, combined with similar irrigation-driven R decrease as in the other catchments.
In each catchment, the irrigation-driven component of the total R decrease has largely fed a corresponding irrigation-driven component of ET increase. Recent results for water deficit propagation and partitioning over different parts of Europe [16] indicate that this ET increase likely represents increased transpiration, thereby contributing to support vegetation and crop status against the decreased P water input and the likely more frequent and/or more anomalous drought events that may be expected under such P decrease in Greece. Under these conditions of decreased P combined with relatively small T increase (or even T decrease), the atmospheric climate change drives ET decrease, that is, opposite change direction to the ET increase driven by irrigation. In net total, the irrigation-driven component dominates, such that total ET has increased (but less than R has decreased) over Greece, except in Peloponnese where the climate—and irrigation-driven components are more or less equal and total ET remains essentially unchanged.
Supplementary Materials
The following are available online at https://www.mdpi.com/2073-4441/10/11/1645/s1, Figure S1: Location and extent of CRU cells considered for each study catchment, Table S1: Base case and alternative (Alt.) quantification scenarios and their variations for different catchments, Table S2: Freshwater changes and main uncertainty estimates for the Mainland catchment, Table S3: Freshwater changes and main uncertainty estimates for the Peloponnese catchment, Table S4: Freshwater changes and main uncertainty estimates for the Ionian catchment, Table S5: Freshwater changes and main uncertainty estimates for the Aegean catchment, Table S6: Evapotranspiration conditions and changes showing insignificant influence of choice of ET/P scenario (defined in main Table 3) for the example of the total regional catchment.
Author Contributions
G.D. conceived the study and analysis approach and wrote the paper. C.P. performed most analyses for the Figures and Tables and contributed to the writing.
Funding
This research was funded by The Swedish Research Council Formas, grant number 2016-02045.
Conflicts of Interest
The authors declare no conflict of interest.
References
- Pettersson, L.G.M.; Henchman, R.H.; Nilsson, A. Water—The most anomalous liquid. Chem. Rev. 2016, 116, 7459–7462. [Google Scholar] [CrossRef] [PubMed]
- Nature Editorial. Get water governance on the global agenda. Nature 2016, 540, 169–170. [Google Scholar] [CrossRef] [Green Version]
- World Economic Forum. The Global Risks Report 2018. Available online: http://www3.weforum.org/docs/WEF_GRR18_Report.pdf (accessed on 30 September 2018).
- Bosson, E.; Sabel, U.; Gustafsson, L.G.; Sassner, M.; Destouni, G. Influences of shifts in climate, landscape and permafrost on terrestrial hydrology. J. Geophys. Res. Atmos. 2012, 117, D05120. [Google Scholar] [CrossRef]
- Jaramillo, F.; Destouni, G. Developing water change spectra and distinguishing change drivers worldwide. Geophys. Res. Lett. 2014, 41, 8377–8386. [Google Scholar] [CrossRef] [Green Version]
- Elmhagen, B.; Destouni, G.; Angerbjörn, A.; Borgström, S.; Boyd, E.; Cousins, S.A.O.; Dalén, L.; Ehrlén, J.; Ermold, M.; Hambäck, P.A.; et al. Interacting effects of change in climate, human population, land use and water use on biodiversity and ecosystem services. Ecol. Soc. 2015, 20, 23. [Google Scholar] [CrossRef]
- Destouni, G.; Jaramillo, F.; Prieto, C. Hydroclimatic shifts driven by human water use for food and energy production. Nat. Clim. Chang. 2013, 3, 213–217. [Google Scholar] [CrossRef]
- Jaramillo, F.; Destouni, G. Local flow regulation and irrigation raise global human water consumption and footprint. Science 2015, 350, 1248–1251. [Google Scholar] [CrossRef] [PubMed]
- Kalantari, Z.; Ferreira, C.S.S.; Walsh, R.P.D.; Ferreira, A.J.D.; Destouni, G. Urbanization development under climate change: Hydrological responses in a peri-urban Mediterranean catchment. Land Degrad. Dev. 2017, 28, 2207–2221. [Google Scholar] [CrossRef]
- Montanari, A.; Young, G.; Savenije, H.H.G.; Hughes, D.; Wagener, T.; Ren, L.L.; Koutsoyiannis, D.; Cudennec, C.; Toth, E.; Grimaldi, S.; et al. “Panta Rhei—Everything Flows”: Change in hydrology and society—The IAHS Scientific Decade 2013–2022. Hydrol. Sci. J. 2013, 58, 1256–1275. [Google Scholar] [CrossRef] [Green Version]
- Smettem, K.R.J. Welcome address for the new ’Ecohydrology’ Journal. Ecohydrology 2008, 1, 1–2. [Google Scholar] [CrossRef]
- Sivapalan, M.; Savenije, H.H.G.; Blöschl, G. Socio-hydrology: A new science of people and water. Hydrol. Process 2012, 26, 1270–1276. [Google Scholar] [CrossRef]
- Karlsson, J.M.; Lyon, S.W.; Destouni, G. Thermokarst lake, hydrological flow and water balance indicators of permafrost change in Western Siberia. J. Hydrol. 2012, 464–465, 459–466. [Google Scholar] [CrossRef]
- Berghuijs, W.R.; Woods, R.A.; Hrachowitz, M. A precipitation shift from snow towards rain leads to a decrease in streamflow. Nat. Clim. Chang. 2014, 4, 583–586. [Google Scholar] [CrossRef] [Green Version]
- Karlsson, M.J.; Jaramillo, F.; Destouni, G. Hydro-climatic and lake change patterns in Arctic permafrost and non-permafrost areas. J. Hydrol. 2015, 529, 134–145. [Google Scholar] [CrossRef]
- Orth, R.; Destouni, G. Drought reduces blue-water fluxes more strongly than green-water fluxes in Europe. Nat. Commun. 2018, 9, 3602. [Google Scholar] [CrossRef] [PubMed]
- Destouni, G.; Asokan, S.M.; Jarsjö, J. Inland hydro-climatic interaction: Effects of human water use on regional climate. Geophys. Res. Lett. 2010, 37, L18402. [Google Scholar] [CrossRef]
- De Haan, J. How emergence arises. Ecol. Complex. 2006, 3, 293–301. [Google Scholar] [CrossRef]
- Baresel, C.; Destouni, G. Novel quantification of coupled natural and cross-sectoral water and nutrient/pollutant flows for environmental management. Environ. Sci. Technol. 2005, 39, 6182–6190. [Google Scholar] [CrossRef] [PubMed]
- Thorslund, J.; Jarsjo, J.; Jaramillo, F.; Jawitz, J.W.; Manzoni, S.; Basu, N.B.; Chalov, S.R.; Cohen, M.J.; Creed, I.F.; Goldenberg, R.; et al. Wetlands as large-scale nature-based solutions: Status and challenges for research, engineering and management. Ecol. Eng. 2017, 108 Pt B, 489–497. [Google Scholar] [CrossRef]
- Bring, A.; Asokan, S.M.; Jaramillo, F.; Jarsjö, J.; Levi, L.; Pietroń, J.; Prieto, C.; Rogberg, P.; Destouni, G. Implications of freshwater flux data from the CMIP5 multi-model output across a set of Northern Hemisphere drainage basins. Earth’s Future 2015, 3, 206–217. [Google Scholar] [CrossRef]
- Jarsjö, J.; Asokan, S.M.; Prieto, C.; Bring, A.; Destouni, G. Hydrological responses to climate change conditioned by historic alterations of land-use and water-use. Hydrol. Earth Syst. Sci. 2012, 16, 1335–1347. [Google Scholar] [CrossRef] [Green Version]
- Asokan, S.M.; Rogberg, P.; Bring, A.; Jarsjö, J.; Destouni, G. Climate model performance and change projection for freshwater fluxes: Comparison for irrigated areas in Central and South Asia. J. Hydrol. Reg. Stud. 2016, 5, 48–65. [Google Scholar] [CrossRef]
- Jaramillo, F.; Destouni, G. Comment on “Planetary boundaries: Guiding human development on a changing planet”. Science 2017, 348, 1217. [Google Scholar] [CrossRef] [PubMed]
- Lehner, B.; Verdin, K.; Jarvis, A. HydroSHEDS Technical Documentation. World Wildlife Fund US, Washington, D.C. Available online: http://hydrosheds.cr.usgs.gov (accessed on 24 April 2013).
- Mitchell, T.D.; Jones, P.D. An improved method of constructing a database of monthly climate observations and associated high-resolution grids. Int. J. Clim. 2005, 25, 693–712. [Google Scholar] [CrossRef] [Green Version]
- Harris, I.; Jones, P.D.; Osborn, T.J.; Lister, D.H. Updated high-resolution grids of monthly climatic observations—the CRU TS3.10 Dataset. Int. J. Clim. 2014, 34, 623–642. [Google Scholar] [CrossRef] [Green Version]
- GRDC. Global Runoff Data Centre, Koblenz, Germany. Available online: http://www.bafg.de (accessed on 3 June 2013).
- Greek Water Management Authority. Water Management Plan for the Greek River Basin Districts (GR06); Greek Water Management Authority: Athens, Greece, 2013; Volume 2. [Google Scholar]
- Organisation for Economic Co-operation and Development, Statistics. Extracted by Selecting Environmental Indicators for Agriculture, Environmental Performance of Agriculture 2013, Water Resources, Enviromental Indicator: Irrigation, Irrigated Areas (ha) and Irrigation Freshwater Withdrawals (million m3). Available online: http://stats.oecd.org/Index.aspx# (accessed on 4 May 2015).
- Organisation for Economic Co-Operation and Development, Statistics. Extracted by Selecting Environment\Water\Freshwater Abstractions (million m3). Variable: Irrigation\Total freshwater for Greece. Available online: http://stats.oecd.org/Index.aspx# (accessed on 4 May 2015).
- Siebert, S.; Henrich, V.; Frenken, K.; Burke, J. Global Map of Irrigation Areas Version 5; Rheinische Friedrich-Wilhelms-University: Bonn, Germany; Food and Agriculture Organization of the United Nations: Rome, Italy, 2013. [Google Scholar]
- Karamanos, A.; Aggelides, S.; Londra, P. Irrigation Systems Performance in Greece; Options Méditerranéennes, Series B, No. 52; CIHEAM: Bari, Italy, 2005. [Google Scholar]
- Jaramillo, F.; Prieto, C.; Lyon, S.W.; Destouni, G. Multimethod assessment of evapotranspiration shifts due to non-irrigated agricultural development in Sweden. J. Hydrol. 2013, 484, 55–62. [Google Scholar] [CrossRef]
- Langbein, W.B. Annual runoff in the United States. Geol. Surv. Circ. 1949, 52. [Google Scholar] [CrossRef]
- Turc, L. “The water balance of soils”, relation between precipitation, evaporation and flow. Ann. Agron. 1954, 5, 491–569. [Google Scholar]
- Adam, J.C.; Lettenmaier, D.P. Adjustment of global gridded precipitation for systematic bias. J. Geophys. Res. 2003, 108, 1–14. [Google Scholar] [CrossRef]
- Adam, J.C.; Clark, E.A.; Lettenmaier, D.P.; Wood, E.F. Correction of global precipitation products for orographic effects. J. Clim. 2006, 19, 15–38. [Google Scholar] [CrossRef]
- Asokan, S.M.; Destouni, G. Irrigation effects on hydro-climatic change: Basin-wise water balance-constrained quantification and cross-regional comparison. Surv. Geophys. 2014, 35, 879–895. [Google Scholar] [CrossRef]
Figure 1.
Location and extent of the nested study catchments. These include: the total regional catchment (coloured) and within it the catchments of: Mainland Greece (red outline) and Peloponnese (black outline); and of the Ionian Sea (green area) and the Aegean Sea (light blue area). Data-wise, the Mainland catchment includes three local catchments (blue outlines) with reasonable openly reported runoff data series. The Peloponnese catchment includes three water management districts and associated local catchments (blue outlines) of Northern Peloponnese (NP), Western Peloponnese (WP) and Eastern Peloponnese (EP) with available temporal average runoff and other freshwater data.

Figure 2.
(a) Reported irrigated area, Aai, in Greece, shown with the best power-law fit to the reported data. (b) Reported annual water withdrawal for irrigation, Iwwv, in Greece, shown with the best power-law fit to the reported data until year 2001, after which Iwwv conditions stabilize. (c) Irrigation water withdrawal per irrigated area, Iww = Iwwv/Aai, estimated from the reported and fitted data on Aai and Iwwv in panels (a,b), respectively. The panels also show average variable values over the two 20-year sub-periods 1930–1949 and 1990–2009.

Figure 3.
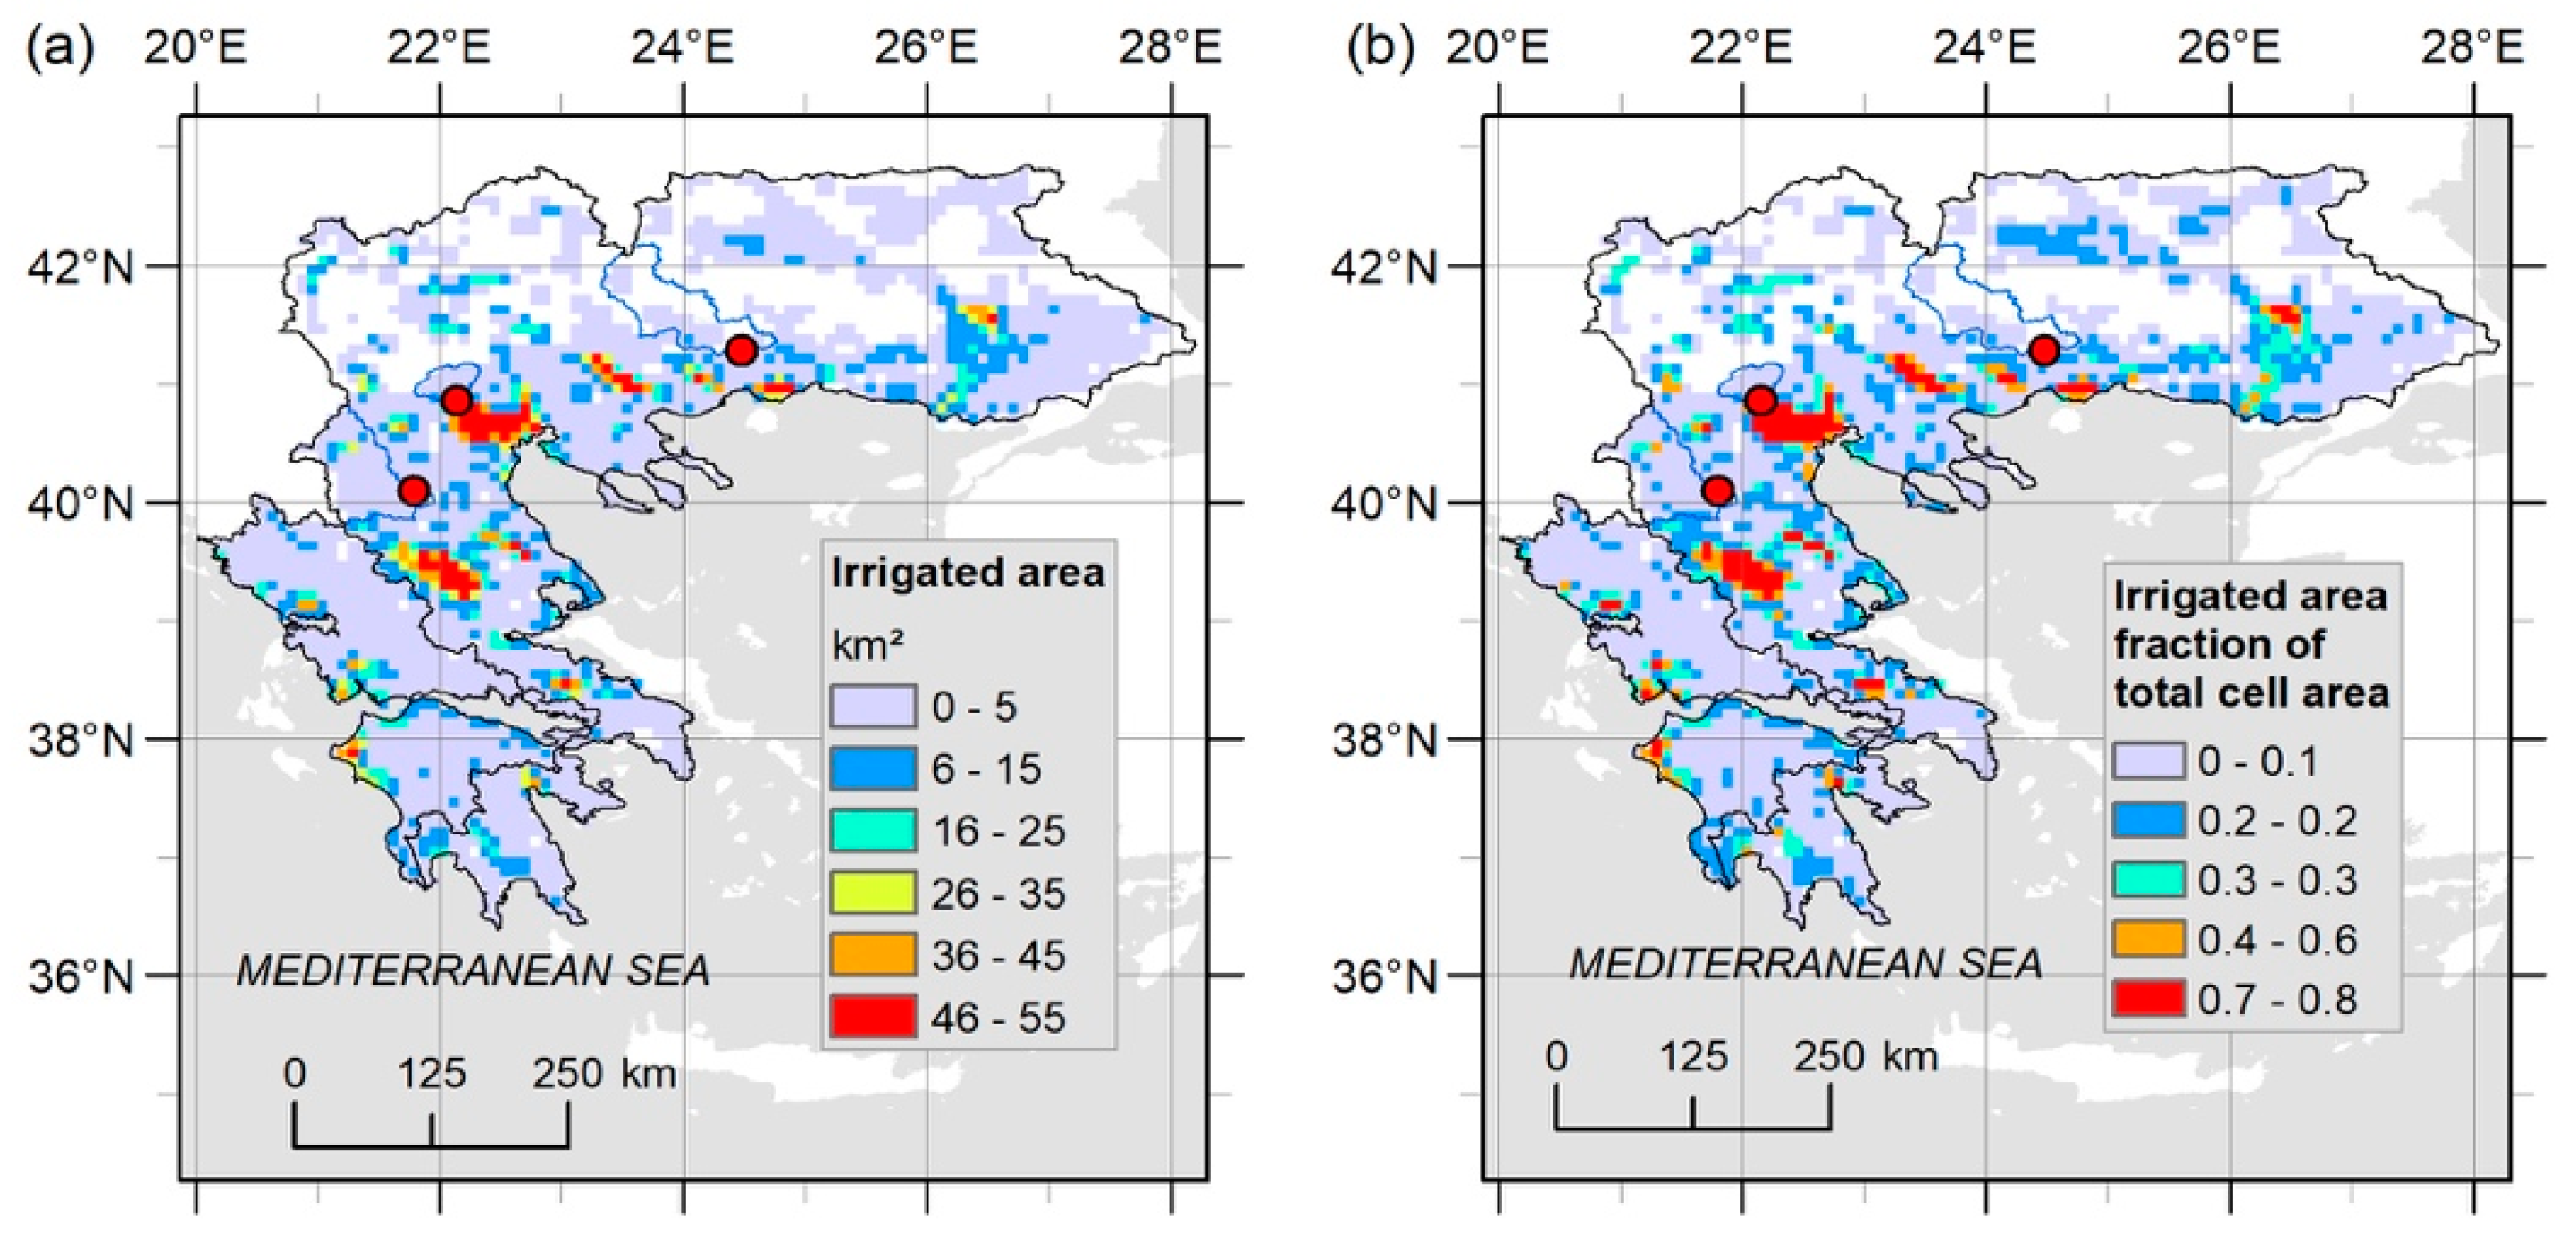
(a) Area actually irrigated within each grid cell in km2. (b) Irrigated area relative to total cell area. These maps are created from the global map of irrigation areas [32] and represent conditions in the recent period 1990–2009. In these maps, the Ionian and Aegean catchments are indicated by black outlines and the three local catchments in mainland Greece with reasonable runoff data time series are indicated by blue outlines.
Figure 3.
(a) Area actually irrigated within each grid cell in km2. (b) Irrigated area relative to total cell area. These maps are created from the global map of irrigation areas [32] and represent conditions in the recent period 1990–2009. In these maps, the Ionian and Aegean catchments are indicated by black outlines and the three local catchments in mainland Greece with reasonable runoff data time series are indicated by blue outlines.

Figure 4.
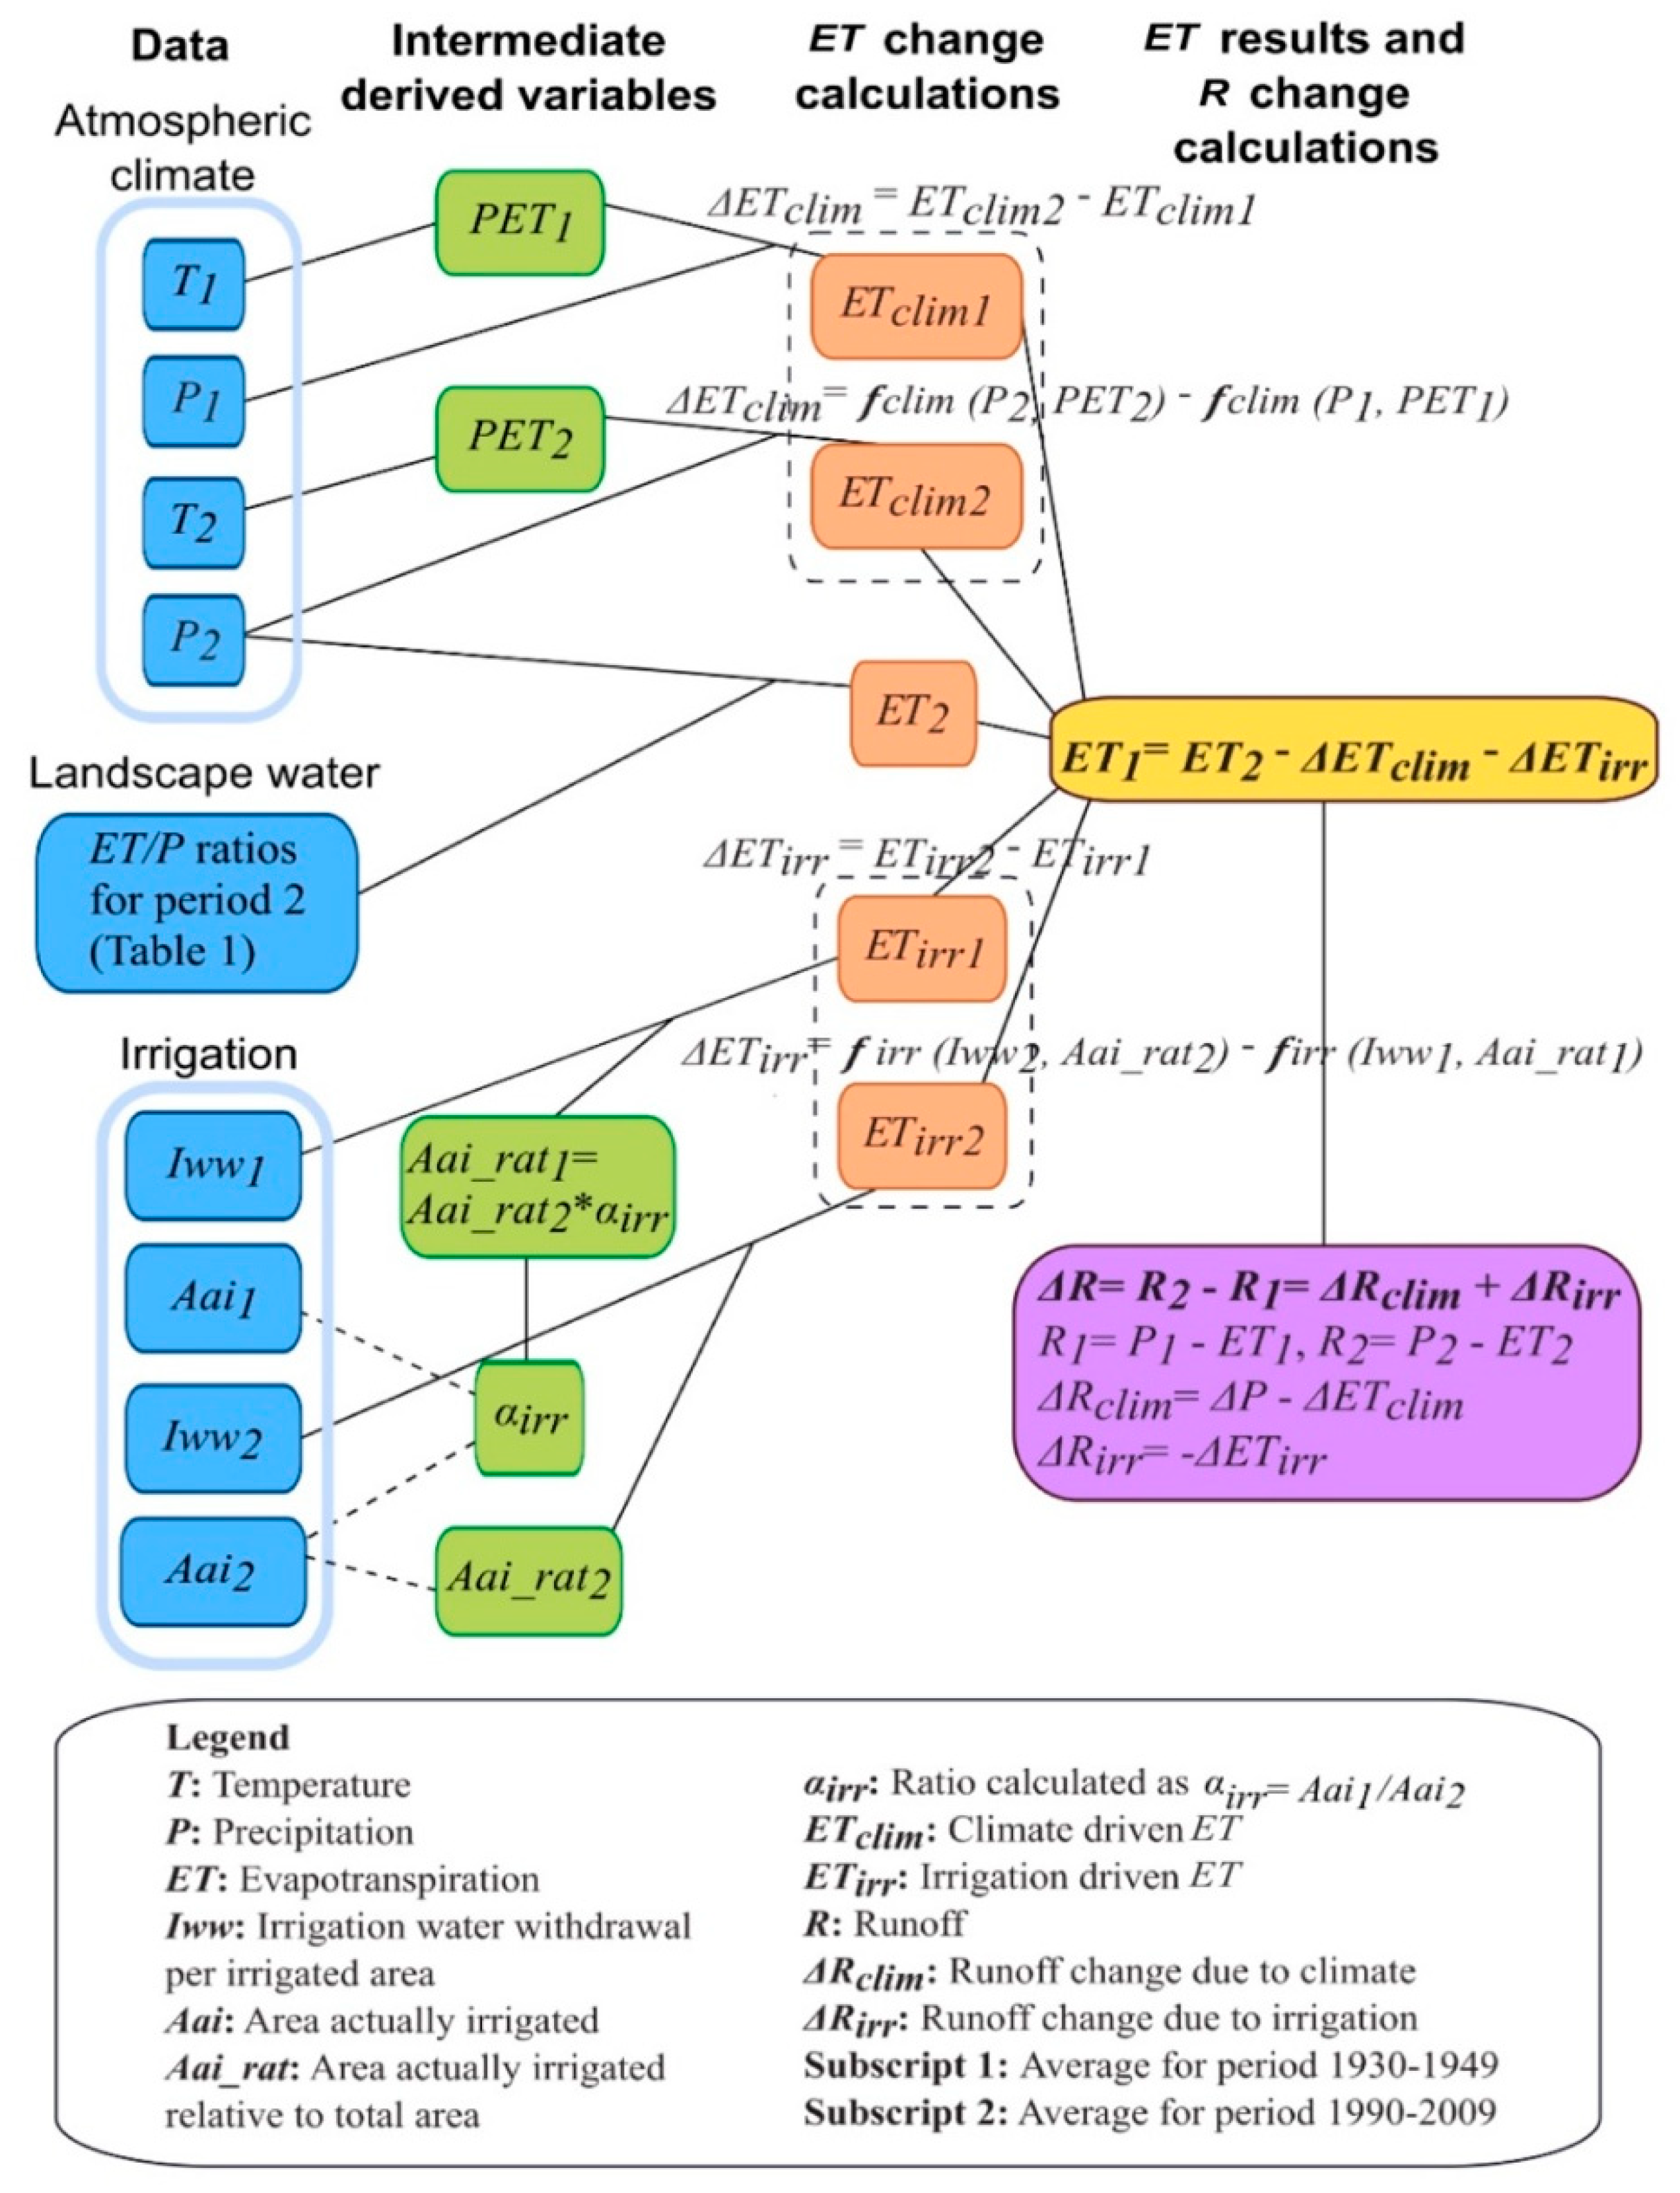
Schematic illustration of the approach developed and used to assess long-term average evapotranspiration (ET1) and runoff (R1) in an early 20-year period and associated changes (Δ) from this to a recent 20-year period. The sources and types of data used for the assessment in this study are exemplified for the base case scenario in the light blue boxes to the left, grouped as: atmospheric climate, landscape water and irrigation data. The variables extracted from the data are shown in the dark blue boxes. The green boxes show intermediate derived variables for estimating the different components of total ET change, as outlined in the red boxes and synthesized in the yellow box. The lilac box shows the final synthesis for estimating corresponding components and total change for R.
Figure 4.
Schematic illustration of the approach developed and used to assess long-term average evapotranspiration (ET1) and runoff (R1) in an early 20-year period and associated changes (Δ) from this to a recent 20-year period. The sources and types of data used for the assessment in this study are exemplified for the base case scenario in the light blue boxes to the left, grouped as: atmospheric climate, landscape water and irrigation data. The variables extracted from the data are shown in the dark blue boxes. The green boxes show intermediate derived variables for estimating the different components of total ET change, as outlined in the red boxes and synthesized in the yellow box. The lilac box shows the final synthesis for estimating corresponding components and total change for R.

Figure 5.
The spatial distribution of temporal average temperature (a) and precipitation (b) over the period 1930–2009 and corresponding period-average changes ((c,d), respectively) from the period 1930–1949 to the period 1990–2009. In these maps, the Ionian and Aegean catchments are indicated by black outlines and the three local catchments in mainland Greece with reasonable runoff data time series are indicated by blue outlines.

Figure 6.
Evapotranspiration changes from 1930–1949 to 1990–2009 in total (ΔET) and their climate (ΔETclim) and irrigation (ΔETirr) components. Main bars show mid-range results and error bars show the range of change estimates for different evaluation scenarios (Table 3 and Supplementary Table S1). Results are shown for the total regional catchment (TOTAL) and the nested Mainland (ML), Peloponnese (PEL), Ionian (IONIAN) and Aegean (AEGEAN) catchments.

Figure 7.
Runoff changes from 1930–1949 to 1990–2009 in total (ΔR) and their climate (ΔRclim) and irrigation (ΔRirr) components. Main bars show mid-range results and error bars show the range of change estimates for different evaluation scenarios (Table 3 and Supplementary Table S1). Results are shown for the total regional catchment (TOTAL) and the nested Mainland (ML), Peloponnese (PEL), Ionian (IONIAN) and Aegean (AEGEAN) catchments.


Table 1.
Data-based estimates of the ratio between long-term average evapotranspiration (ET) and long-term average precipitation (P) for the local catchments in mainland Greece and the river basin districts of Western, Northern and Eastern Peloponnese with relevant data availability. The term R represents long-term average runoff.
| Data in Mainland Greece | Data in Peloponnese | ||||||||||
|---|---|---|---|---|---|---|---|---|---|---|---|
| Catch-ment (Sta-tion) | Area a (km2) | Pb (mm/year) | Rc (mm/year) | ETg (mm/year) | ET/P | District | Area h (km2) | Ri (mm/year) | ETi (mm/year) | Peffm (mm/year) | ET/Peff |
| Mesta-Nestos (Teme-nos) | 4948 | 666 | 283 d | 383 | 0.57 | Northern Peloponnese (NP) | 6108 | 312 j | 472 j | 784 | 0.60 |
| Almo-paios (Prof Ilias) | 993 | 487 | 189 e | 298 | 0.61 | Western Peloponnese (WP) | 7235 | 456 k | 559 k | 1015 | 0.55 |
| Aliak-mon (Ila-rion) | 5002 | 763 | 315 f | 448 | 0.59 | Eastern Peloponnese (EP) | 8442 | 172 l | 452 l | 624 | 0.72 |
a Area calculated in ArcGIS. b Area-average P data over the years with runoff data from the gridded CRU TS2.1 data set [26]. c Temporal average over all years with available data from the GRDC [28]. d Monthly runoff data available for the period 1966–1989. e Monthly runoff data available for the period 1989–1994. f Monthly runoff data available for the period 1963–1987. g ET = P − R. h Greek Water Management Authority [29]. i Area-average of reported values from different subunits in management districts (as reported from the Greek Water Management Authority [29]). j Considered subunits: GR27 and GR28 (without the island subunit GR45) [29]. k Considered subunits: GR29 and GR32 [29]. l Considered subunits: GR30, GR31 and GR33 [29]. m Effective precipitation partitioning into the reported R and ET in the district: Peff = R + ET.
Table 2.
Average variable values used in the base case scenario for each catchment and time period, 1930–1949 (Per1) and 1990–2009 (Per2). The terms T, P, ET, Iww, Aai and Aai_rat represent temperature, precipitation, evapotranspiration, irrigation water withdrawal per irrigated area, irrigated area and ratio between Aai and total catchment area, respectively.
| Catchments | Total | Mainland | Peloponnese | Ionian | Aegean | |||||
|---|---|---|---|---|---|---|---|---|---|---|
| Total area a (km2) | 178,984 | 157,550 | 21,434 | 31,958 | 147,026 | |||||
| Time Period | Per1b | Per2b | Per1 | Per2 | Per1 | Per2 | Per1 | Per2 | Per1 | Per2 |
| Tc (°C) | 12.1 | 12.4 | 11.7 | 12.1 | 15 | 14.8 | 14.4 | 14.4 | 11.6 | 12 |
| Pc (mm/year) | 676 | 630 | 663 | 622 | 773 | 693 | 861 | 767 | 637 | 602 |
| ET/Pd | 0.59 | 0.59 | 0.62 | 0.59 | 0.59 | |||||
| Iwwe (mm/year) | 0.692/2736 = 253 | 8.25/13,963 = 591 | 253 | 591 | 253 | 591 | 253 | 591 | 253 | 591 |
| Aai (km2) | 2736 e | 11,046 f | 2394 g | 9665 f | 342 g | 1381 f | 547 g | 2255 f | 2189 g | 8791 f |
| Aai_rat | 0.015 h | 11,046/178,984 = 0.062 | 0.015 h | 9665/157,550 = 0.061 | 0.016 h | 1381/21,434 = 0.064 | 0.017 h | 2255/31,958 = 0.071 | 0.015 h | 8791/147,026 = 0.06 |
a Spatial extent of each catchment. b Per1: 1930–1949, Per2: 1990–2009. c Spatio-temporal averages from the monthly CRU TS3.10.01 data set [27]. d Using the mean ET/P value from the three local catchments with data over mainland Greece and that from the Peloponnese local catchments over the Peloponnese. e From the national reported data on irrigated areas and irrigation water withdrawals [30,31] (Figure 2). f Spatial average values for each catchment with the area actually irrigated obtained from the GMIAv5.0 map dataset [32] (Figure 3). g Assuming that the ratio of areas actually irrigated in this catchment relative to that in the mainland Greece and the Peloponnese is more or less the same in 1930–1949 as in 1990–2009. h With Aai_rat1 estimated from: Aai_rat1 = Aai_rat2 × αirr and αirr ≈ Aai1/Aai2 = 0.25 in the base case scenario.
Table 3.
The base case and alternative (Alt.) evaluation scenarios and their variations. Results are listed for the total regional catchment, with the terms P, ET, Iww, αirr and Per representing precipitation, evapotranspiration, irrigation water withdrawal per irrigated area, ratio Aai1/Aai2 between irrigated area (Aai) and time period. The latter is period 1 (1930–1949) or period 2 (1990–2009).
| Total Regional Catchment | |||
|---|---|---|---|
| Scenario | Variation | Per1 | Per2 |
| Base P | No correction of P observation data (mm/year) | 676 | 630 |
| −46 | |||
| Alt.1 P | Undercatch correction of P observation data (mm/year) | 734 | 686 |
| −48 | |||
| Alt.2 P | Undercatch and orographic correction of P observation data (mm/year) | 769 | 718 |
| −51 | |||
| Base ET/P | Mean ET/P | 0.59 | |
| Alt.1 ET/P | Min ET/P | 0.55 | |
| Alt.2 ET/P | Max ET/P | 0.72 | |
| Base Iww | Mean Iww1, Min Iww2 (mm/year) | 253 | 591 |
| 338 | |||
| Alt.1 Iww | Min Iww1, Min Iww2 (mm/year) | 175 | 591 |
| 416 | |||
| Alt.2 Iww | Max Iww1, Min Iww2 (mm/year) | 331 | 591 |
| 260 | |||
| Alt.3 Iww | Min Iww1, Max Iww2 (mm/year) | 175 | 747 |
| 572 | |||
| Alt.4 Iww | Mean Iww1, Max Iww2 (mm/year) | 253 | 747 |
| 494 | |||
| Alt.5 Iww | Max Iww1, Max Iww2 (mm/year) | 331 | 747 |
| 416 | |||
| Base αirr | Max αirr | 0.25 | |
| Alt.1 αirr | Min αirr | 0.20 | |
Table 4.
Freshwater changes and main uncertainty estimates for the total regional catchment. The terms P, ET and R represent precipitation, evapotranspiration and runoff, respectively, while Δ stands for change and subscript clim and irr indicate climate driven and irrigation driven change, respectively. Scenario definitions (Base, Alt.) are as given and explained in Table 3.
| Type of Scenario and Uncertainty | ΔP (mm/year) | ΔETclim (mm/year) | ΔETirr (mm/year) | ΔET (mm/year) | ΔRclim (mm/year) | ΔRirr (mm/year) | ΔR (mm/year) |
|---|---|---|---|---|---|---|---|
| P scenarios ± Irrigation uncertainty | −46 (Base) | −12.5 | 24.9 ± 6 | −33.5 | −70.9 ± 6 | ||
| −48.4 (Alt. 1) | −11.5 | 25.9 ± 6 | −36.9 | −74.3 ± 6 | |||
| −51 (Alt. 2) | −10 | 27.4 ± 6 | −41 | −78.4 ± 6 | |||
| Irrigation (Iww) scenarios ± P uncertainty | 32.6 (Base) | 21.3 ± 1.3 | −32.6 | −69.7 ± 3.8 | |||
| 33.8 (Alt. 1) | 22.5 ± 1.3 | −33.8 | −70.9 ± 3.8 | ||||
| 31.4 (Alt. 2) | 20.1 ± 1.3 | −31.4 | −68.5 ± 3.8 | ||||
| 43.4 (Alt. 3) | 32.1 ± 1.3 | −43.4 | −80.6 ± 3.8 | ||||
| 42.2 (Alt. 4) | 30.9 ± 1.3 | −42.2 | −79.4 ± 3.8 | ||||
| 41 (Alt. 5) | 29.7 ± 1.3 | −41 | −78.2 ± 3.8 | ||||
| All scenarios ± Total uncertainty | −48.5 ± 2.5 | −11.3 ± 1.3 | 37.4 ± 6 | 26.1 ± 7.3 | −37.1 ± 3.8 | −37.4 ± 6 | −74.6 ± 9.8 |
© 2018 by the authors. Licensee MDPI, Basel, Switzerland. This article is an open access article distributed under the terms and conditions of the Creative Commons Attribution (CC BY) license (http://creativecommons.org/licenses/by/4.0/).
Share and Cite
MDPI and ACS Style
Destouni, G.; Prieto, C. Robust Assessment of Uncertain Freshwater Changes: The Case of Greece with Large Irrigation—and Climate-Driven Runoff Decrease. Water 2018, 10, 1645. https://doi.org/10.3390/w10111645
AMA Style
Destouni G, Prieto C. Robust Assessment of Uncertain Freshwater Changes: The Case of Greece with Large Irrigation—and Climate-Driven Runoff Decrease. Water. 2018; 10(11):1645. https://doi.org/10.3390/w10111645
Chicago/Turabian StyleDestouni, Georgia, and Carmen Prieto. 2018. "Robust Assessment of Uncertain Freshwater Changes: The Case of Greece with Large Irrigation—and Climate-Driven Runoff Decrease" Water 10, no. 11: 1645. https://doi.org/10.3390/w10111645
Note that from the first issue of 2016, this journal uses article numbers instead of page numbers. See further details here.