A Review of Cost Estimates for Flood Adaptation

Institute for Environmental Studies (IVM), VU University Amsterdam, De Boelelaan 1087, 1081HV Amsterdam, The Netherlands
Water 2018, 10(11), 1646; https://doi.org/10.3390/w10111646
Submission received: 29 September 2018
/
Revised: 27 October 2018
/
Accepted: 8 November 2018
/
Published: 13 November 2018
(This article belongs to the Special Issue 10th Anniversary of Water)
Abstract
:Floods are the most devastating of global natural disasters, and flood adaptation measures are needed to reduce future risk. Researchers have started to evaluate the costs and benefits of flood adaptation, but information regarding the cost of different flood adaptation measures is often not available or is hidden in non-peer-reviewed literature. Recent review studies have explored cost estimates for different aspects of flood adaptation, such as nature-based solutions. This study aims to contribute empirical data regarding the cost of flood adaptation by compiling peer-reviewed literature and research reports. The focus is on construction costs and expenses for operation and maintenance. This paper integrates the unit cost information of six main flood adaptation measure categories: (1) the flood-proofing of buildings, (2) flood protection, (3) beach nourishment and dunes, (4) nature-based solutions for coastal ecosystems, (5) channel management and nature-based solutions for riverine systems, and (6) urban drainage. Cost estimates are corrected for inflation and converted to U.S. dollars (2016). Measures are described, and cost figures for both developed and developing countries are provided. The results of this study can be used as input for economic-assessment studies on flood adaptation measures.
1. Introduction
Floods are the most devastating of global natural disasters; they caused billions of dollars in damage and the loss of life of thousands of people in 2017 [1]. Flood hazards can be categorized into different types: e.g., coastal storm surges, river floods, river- and flash floods, and local inundations caused by extreme precipitation. Climate change and sea-level rise further increase the frequency and severity of flood hazards, while population and economic growth further exacerbate flood exposure in low-lying coastal areas [2]. Urgent action is needed to anticipate future losses, but designing and evaluating long-term adaptation strategies is a complex and challenging process for decision makers [3].
In recent decades, a vast array of studies have been conducted to assess and evaluate options for flood adaption so as to reduce current and future flood risk [4,5,6,7,8,9]. Such studies provide insights into the effects of sea level and climate change on flood hazard (e.g., depth, extent, and duration) [10] and related socio-economic effects on, for example, exposed populations and economic assets [2]. More recently, researchers have started to evaluate the costs and benefits of flood adaptation by using various future projections. In such analyses, benefits are expressed as reduced flood risk (or “expected annual damage,” EAD) achieved by implementing proposed adaptation measures [9,11,12]. For example, a recent study show the future benefits of investing in flood protection are much higher than the cost, assuming different future scenarios [9].
Estimating flood adaptation cost is no sinecure, and detailed cost estimates are usually made on the local level—for example, during the engineering design of individual measures [13]. In most cases, however, only aggregate maintenance and investment costs are available from case studies after implementation of the adaptation measure. Furthermore, cost information is often “hidden” in non-peer-reviewed reports, and efforts to collect such information and check its quality are time-consuming. Despite these challenges, enhanced cost estimates of flood adaptation are urgently required to support the economic analysis of flood adaptation research and decision making [14].
With regard to estimating the unit cost of flood adaptation, progress has been made at various scales over the past 10 years regarding flood management measures. In terms of flood protection measures, Linham et al. [15] estimate flood adaptation costs for global cities, while Jonkman et al. [14] provide an overview of coastal flood protection for three case studies in The Netherlands, Vietnam, and the United States. Aerts et al. [16,17] and Lasage et al. [18] provide detailed cost estimates for flood protection in New York City, Los Angeles, and Ho Chi Minh City, respectively; they also provide cost estimates for the flood-proofing of individual buildings. Recently, novel literature has emerged regarding the role of nature-based solutions and how these could be developed to reduce flood risk. Such measures include mangrove restoration, rehabilitation of coral reefs, and the development of coastal ecosystems in general. Cost estimates for such activities have been reported in extended reviews by, for example, Bayraktarov et al. [19], Lamond et al. [20], and Narayan et al. [21].
While researchers have made significant progress in providing cost estimates for different categories of flood adaptation, no study has yet combined these estimates into one overview. The main goal of this paper is therefore to increase our empirical database on the cost of flood adaptation by compiling existing peer-reviewed literature and additional reports. The purpose is to provide regional to global flood risk assessment studies with an overview of different flood adaptation measures and their unit costs so they can be included in, for example, cost–benefit analyses or other evaluation studies [12].
2. Data and Approach
This study reviews the unit cost information of measures divided over six main flood adaptation categories (flood-proofing buildings, protection, beach nourishment, coastal nature-based solutions, riverine adaptation, and urban drainage) and adds new information. Flood protection measures are provided for both urban and rural areas.
The most relevant and recent overview studies that pertain to these different categories of flood adaptation form the basis of the analysis. In addition to these existing review studies, the following new research aspects are provided: (1) cost estimates for adaptation measures related to urban drainage (e.g., green roofs and pumping capacity), and (2) coastal-defense measures (sluices, groins, breakwaters, and rip-rap). Sources of uncertainty in cost estimates are discussed, as are the major gaps in our knowledge of adaptation costs. Recommendations for future research are also offered.
Research shows that, for the following reasons, it is hard to estimate the unit cost of flood-management measures in terms of finding reliable data:
- (1)
- Cost estimations are mostly made during the design phase of a flood adaptation measure [14]. However, while the aggregate cost of such projects after construction can be found, the underlying cost details and the different cost components, are rarely available online.
- (2)
- The unit costs differ greatly across the literature in terms of what cost components (labor, land purchase, and materials, etc.) are included. This makes the comparison of unit cost prices difficult [13].
- (3)
- Unit cost estimates for the same flood management measures vary across countries and regions depending on local geographic and socio-economic conditions [22]. For example, in many countries, constructing a levee in a rural area is much cheaper than developing a similar structure in an urban area, as labor rates and land prices are often higher in cities. Furthermore, the design requirements (e.g., protection levels) are higher in urban environments due to the larger exposed population and greater economic assets [17].
- (4)
In view of these challenges, and considering the very diverse set of flood-management measures, the focus in this study is on just two types of unit cost estimates, which are often appraised in detailed engineering studies: (1) construction costs and (2) operation and maintenance costs (O&M). Construction costs are fixed, one-time expenses that include costs for planning, purchasing materials and machinery, land acquisition, construction labor, permits, etc. Operation and maintenance costs include yearly costs needed to operate (e.g., storm surge barriers and sluices), maintain (e.g., cleaning sewer systems), monitor (e.g., restored mangroves), and replace equipment [23].
The approach followed in this paper to select unit cost prices comprises several steps:
- (1)
- (2)
- Peer-reviewed literature was accessed using the Web of Science search engine and different combinations of general key words (#flood, #cost, #management, #adaptation, #cost-benefit). Key words representing the different adaptation categories and measures (protection, nature-based solutions, levee, mangrove, beach nourishment, coral reefs, urban drainage, etc.) were also used. This resulted in a few hundred papers, of which the unit cost information was manually ordered into project and/or construction- and/or maintenance-related activities. In many papers, though economic aspects of flood management investment were discussed, specific cost estimates were either not provided or cost information was incomplete. Only the papers which contained unit cost prices were selected
- (3)
- Following [19], the unit cost estimates provided in this study—provided that information is available—are distributed over developed and developing countries. In this way, differences in socio-economic conditions that exist across countries and that may affect unit cost prices are addressed, albeit in a simplified manner.
- (4)
- All numbers are converted into comparable units, and cost estimations were converted to U.S. dollars at 2016 price levels, unless otherwise specified. This was done using inflation rates for each country based on the consumer price index (CPI) (https://data.worldbank.org/indicator/fp.cpi.totl). For global average numbers, a flat inflation rate of 4% per year was applied, as in [14]. Local currencies for a particular country were first converted to U.S. dollars by using the XE currency converter (www.xe.com/currencyconverter). At the time of submission of this paper, EUR1 was equal to US$1.202. Unit cost prices were not converted into a “purchasing power parity” unit [24], but future studies can use the estimates in this study to further process the data if required.
- (5)
- Cost estimates are presented in six sub-sections: flood-proofing buildings, flood protection, beach nourishment and dunes, nature-based solutions (coast, channel management, and nature-based solutions for riverine systems), and urban drainage. In a few instances, this classification is somewhat arbitrary, and some measures could have been placed in another category. Each section starts with a short description of the measures followed by a discussion of cost estimates.
- (6)
- In some studies, operation and maintenance costs are specified, whereas other sources use fixed percentages of the total construction costs. If available, both types are addressed, and it is assumed that these are valid for the lifetime of a measure.
A peer-reviewed paper is a first step in a quality check of data, and some studies have conducted quite advanced quality checks and statistical analyses to indicate the uncertainty margins of the cost estimates. For example, a review by Bayraktarov et al. [19] on the cost of nature-based solutions considers a number of studies that were used to perform statistical estimates. However, such review papers are rare, and most reviewed papers describe single case studies, for which cost estimates are based on reports from engineering companies, expert knowledge provided during workshops, or estimates that were communicated via personal communication.
Another issue that pertains to quality and comparability is that it is not always clear what is included in the cost estimates and what sub-categories have been neglected [14]. This problem has been addressed by providing upper and lower limits of cost estimations. However, due to the above-mentioned limitations, the cost estimates that are listed in this paper have high uncertainty parameters; they are probably conservative estimates, as not all cost categories are included in the estimation.
3. Results
3.1. Flood-Proofing and Elevating Buildings
Three types of measures are commonly used to flood-proof individual buildings: (1) elevation of (new or existing) buildings, (2) dry flood-proofing, and (3) wet flood-proofing [25] (Appendix A Table A1). The lifespan of both wet and dry flood-proofing is estimated at 20–30 years [26], though Kreibich et al. [27] mention a lifespan of 75 years. In some countries, such as the United States, these measures are linked to building code guidelines provided by the state or municipalities. Building-code requirements apply for buildings in designated flood zones (e.g., the 1/100 flood zone), which are mapped by the government. Furthermore, building codes are often linked to an insurance system in which policy holders get a discount on their flood insurance premiums, when they implement flood-proofing measures. In the United States, the National Flood Insurance Program (NFIP) requires homeowners who have a state-backed mortgage to purchase flood insurance, and the base floor of new structures must be raised above the expected 1/100 flood levels [28].
3.1.1. Elevation and Re-Location
Houses can be elevated to prevent floodwater from entering them. This method is mostly applied to new buildings in flood zones, but it can also be applied to existing buildings, though at higher cost than new buildings. The cost estimates for elevating existing buildings (Table 1) is in the range of ~$19,000–194,000 for buildings in the United States—depending on the type of building and how much it must be elevated [16,29,30]. Factors that determine elevation costs include the following: Condition of the house, electrical and plumbing adjustments, grading, excavation, permits, labor and insurance [31]. Elevating buildings in larger cities such as New York are more expensive due to higher labor costs. The U.S. Army Corps of Engineers (USACE) [29], for example, estimates elevation cost at $194,496/building, which is much higher than the estimate made by Jones et al. [30] (maximum $102,888). Furthermore, Jones et al. [30] estimate the costs of adding “freeboard” (elevating the base floor of a building above the required 1/100 flood levels) for new buildings and for different foundations types. In developing countries such as Bangladesh and Vietnam, the cost for elevating houses in rural areas is estimated at $1287–2574 per house, depending on whether the stilts are made from bamboo or reinforced concrete. This is similar to the results found by Lasage et al. [18] for elevating houses (+2 m) in Ho Chi Minh City, Vietnam ($1544–3088 per house). The USACE [29] estimates the re-location of buildings at $353,537, which includes labor cost, building a new foundation, distance to transport, special permits, house dimensions, and road obstacles. Maintenance costs for elevation were not considered in this study and are probably low (<1%).
3.1.2. Dry Flood-Proofing
Dry flood-proofing techniques are designed to prevent floodwater from entering a building. Measures include the protection of doors and other openings with permanent or removable flood shields [16] by sealing walls with waterproof coatings, impermeable membranes or supplemental layers of masonry or concrete. Dry flood-proofing has disadvantages: When a house is surrounded by water, the pressure on the walls may cause them to cave in—especially in frame constructions. Both the Federal Emergency Management Agency (FEMA) [25] and Keating et al. [26], therefore, advise to not build dry flood-proof houses when floodwater heights exceed +1 m. Construction costs (Table 2) vary between ~$9000 and $23,000/building in developed countries, and between ~$500 and $10,000 per building in developing countries [18]. Costs depend on the type of measure and the flood depth they are designed to withstand. Wright and Pierce [33] calculate the cost for flood-proofing seven waste-water pumping stations that lie below the expected flood elevation. The average cost for each station is ~$45,000, of which 59% is for “miscellaneous items” (e.g., overhead costs and 20% contingencies). Maintenance costs per year are estimated at 1–3% of the investment cost [26].
3.1.3. Wet Flood-Proofing
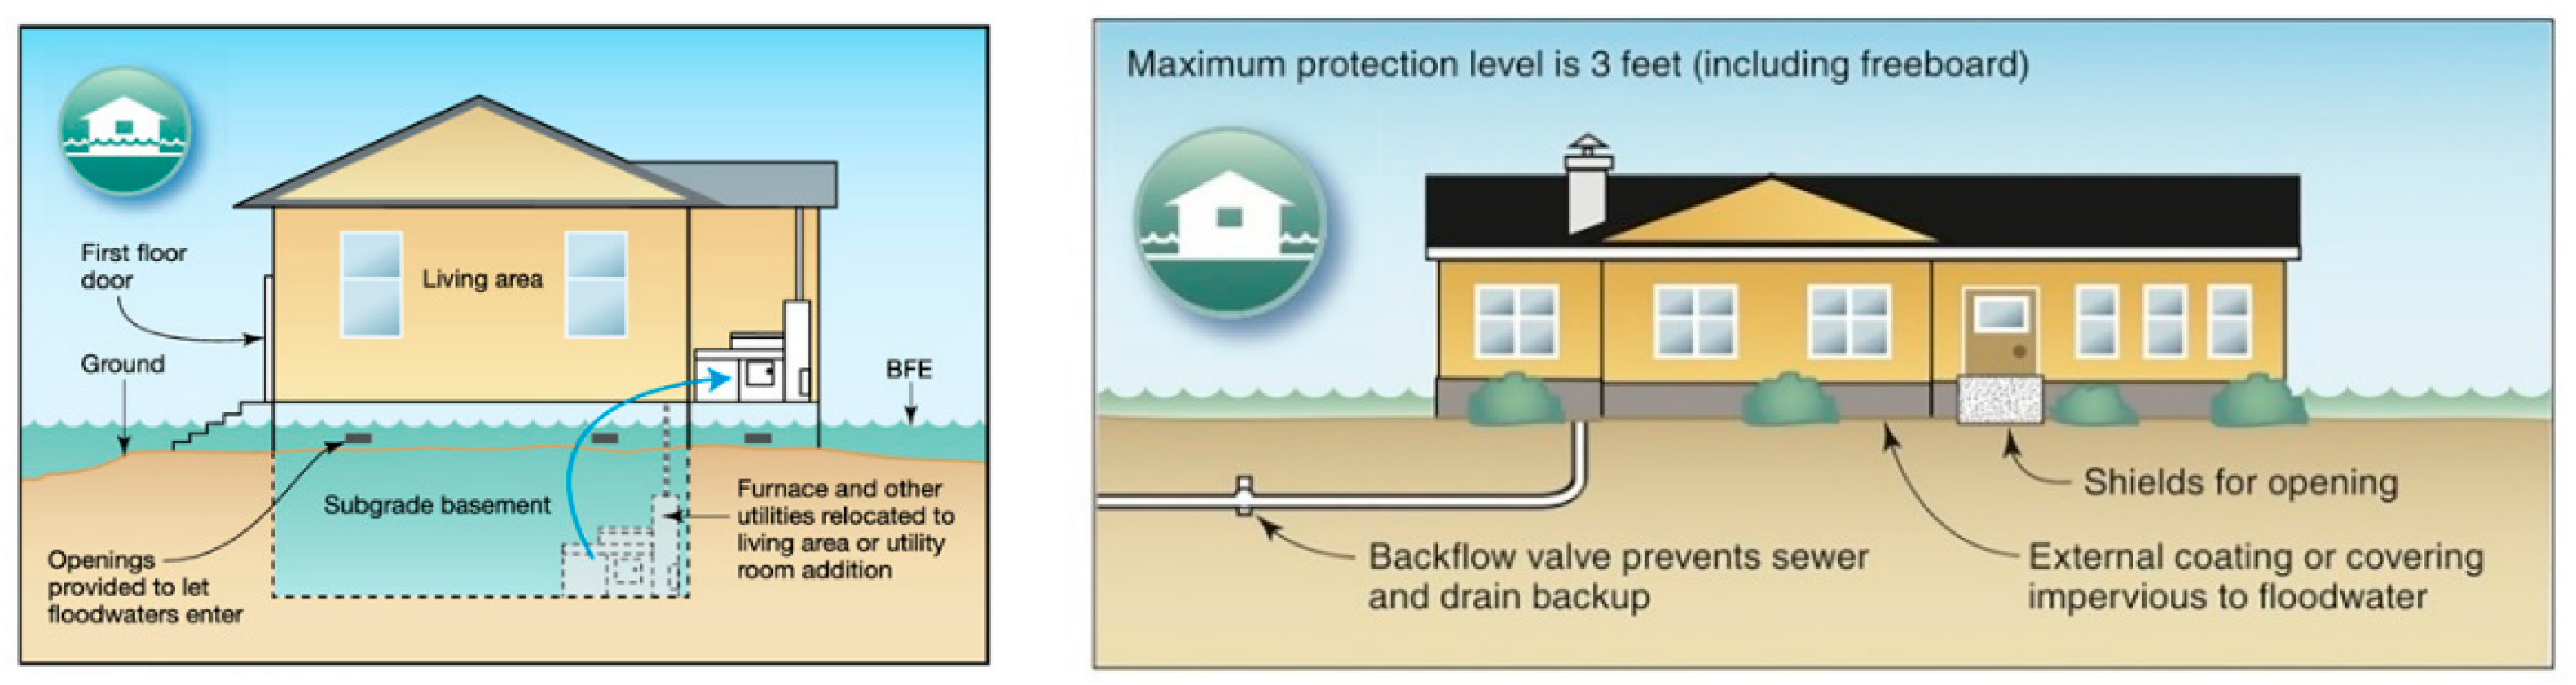
Wet flood-proofing measures allow floodwater to enter a building but limit the damage to the structure and its contents (Figure 1). This minimizes the risk that the walls of the house will collapse due to hydrostatic pressure from rising floodwaters on the outside. Measures include, for example, building utility installations and high-value areas above flood levels, raising electrical sockets, fitting tiled floors so that the building can quickly be returned to use after the flood, and sealing walls with water-resistant building materials [16]. For an extended table of individual flood-proofing measures, see Appendix B Table A2 and Table A3. Construction cost for wet flood-proofing are presented in Table 3 and range between $2412 for residential structures and $34,070 for office buildings. The cost for flood-proofing office buildings is usually higher, as office buildings are relatively large, and the value of building contents is higher than that of residential buildings. Wet flood-proofing the basement of a residential building costs around $35–206/m2. Maintenance costs are low—estimated at <1% of the total investment cost [26]. The cost of flood-proofing a 1500-L oil tank against buoyancy, buried in the garden, is estimated at $1550 [27].
3.2. Flood Protection
Different types of engineered flood-protection measures exist, from simple earth-filled dikes to concrete sea walls and sophisticated storm surge barriers. Table 4 shows different flood-protection methods with their unit costs. Costs are provided both for developing a new structure and for strengthening existing structures.
Storm surge barriers: Storm surge barriers are engineering structures in rivers or estuaries which are designed to protect the high value of economic assets and urban areas from coastal flooding. Storm surge barriers can have movable gates to allow shipping and tidal flows, which are closed during an extreme flooding event. Non-navigable barriers allow only the inflow and outflow of water. Costs vary greatly and are largely determined by the share of the movable parts of the design: Extra gates or a shipping lock can sharply increase costs. Furthermore, geographical and hydrodynamic requirements, such as “span” or “hydraulic head,” determine, respectively, the size and the required strength of the design; they may also increase costs [14]. Aerts et al. [16] estimate the cost of movable parts to be between $0.45 billion/km and $3.6 billion/km, depending on the type of gates and head of the barrier (Appendix C Table A4). General costs, including both closure dams and movable parts vary between $0.27 and $3.6 billion/km, where the lower cost range includes barriers with relatively long closure-dam parts. Operation and maintenance costs vary between $0.6 and $22 million/year, depending on the length and number of moveable parts of the barrier system [16].
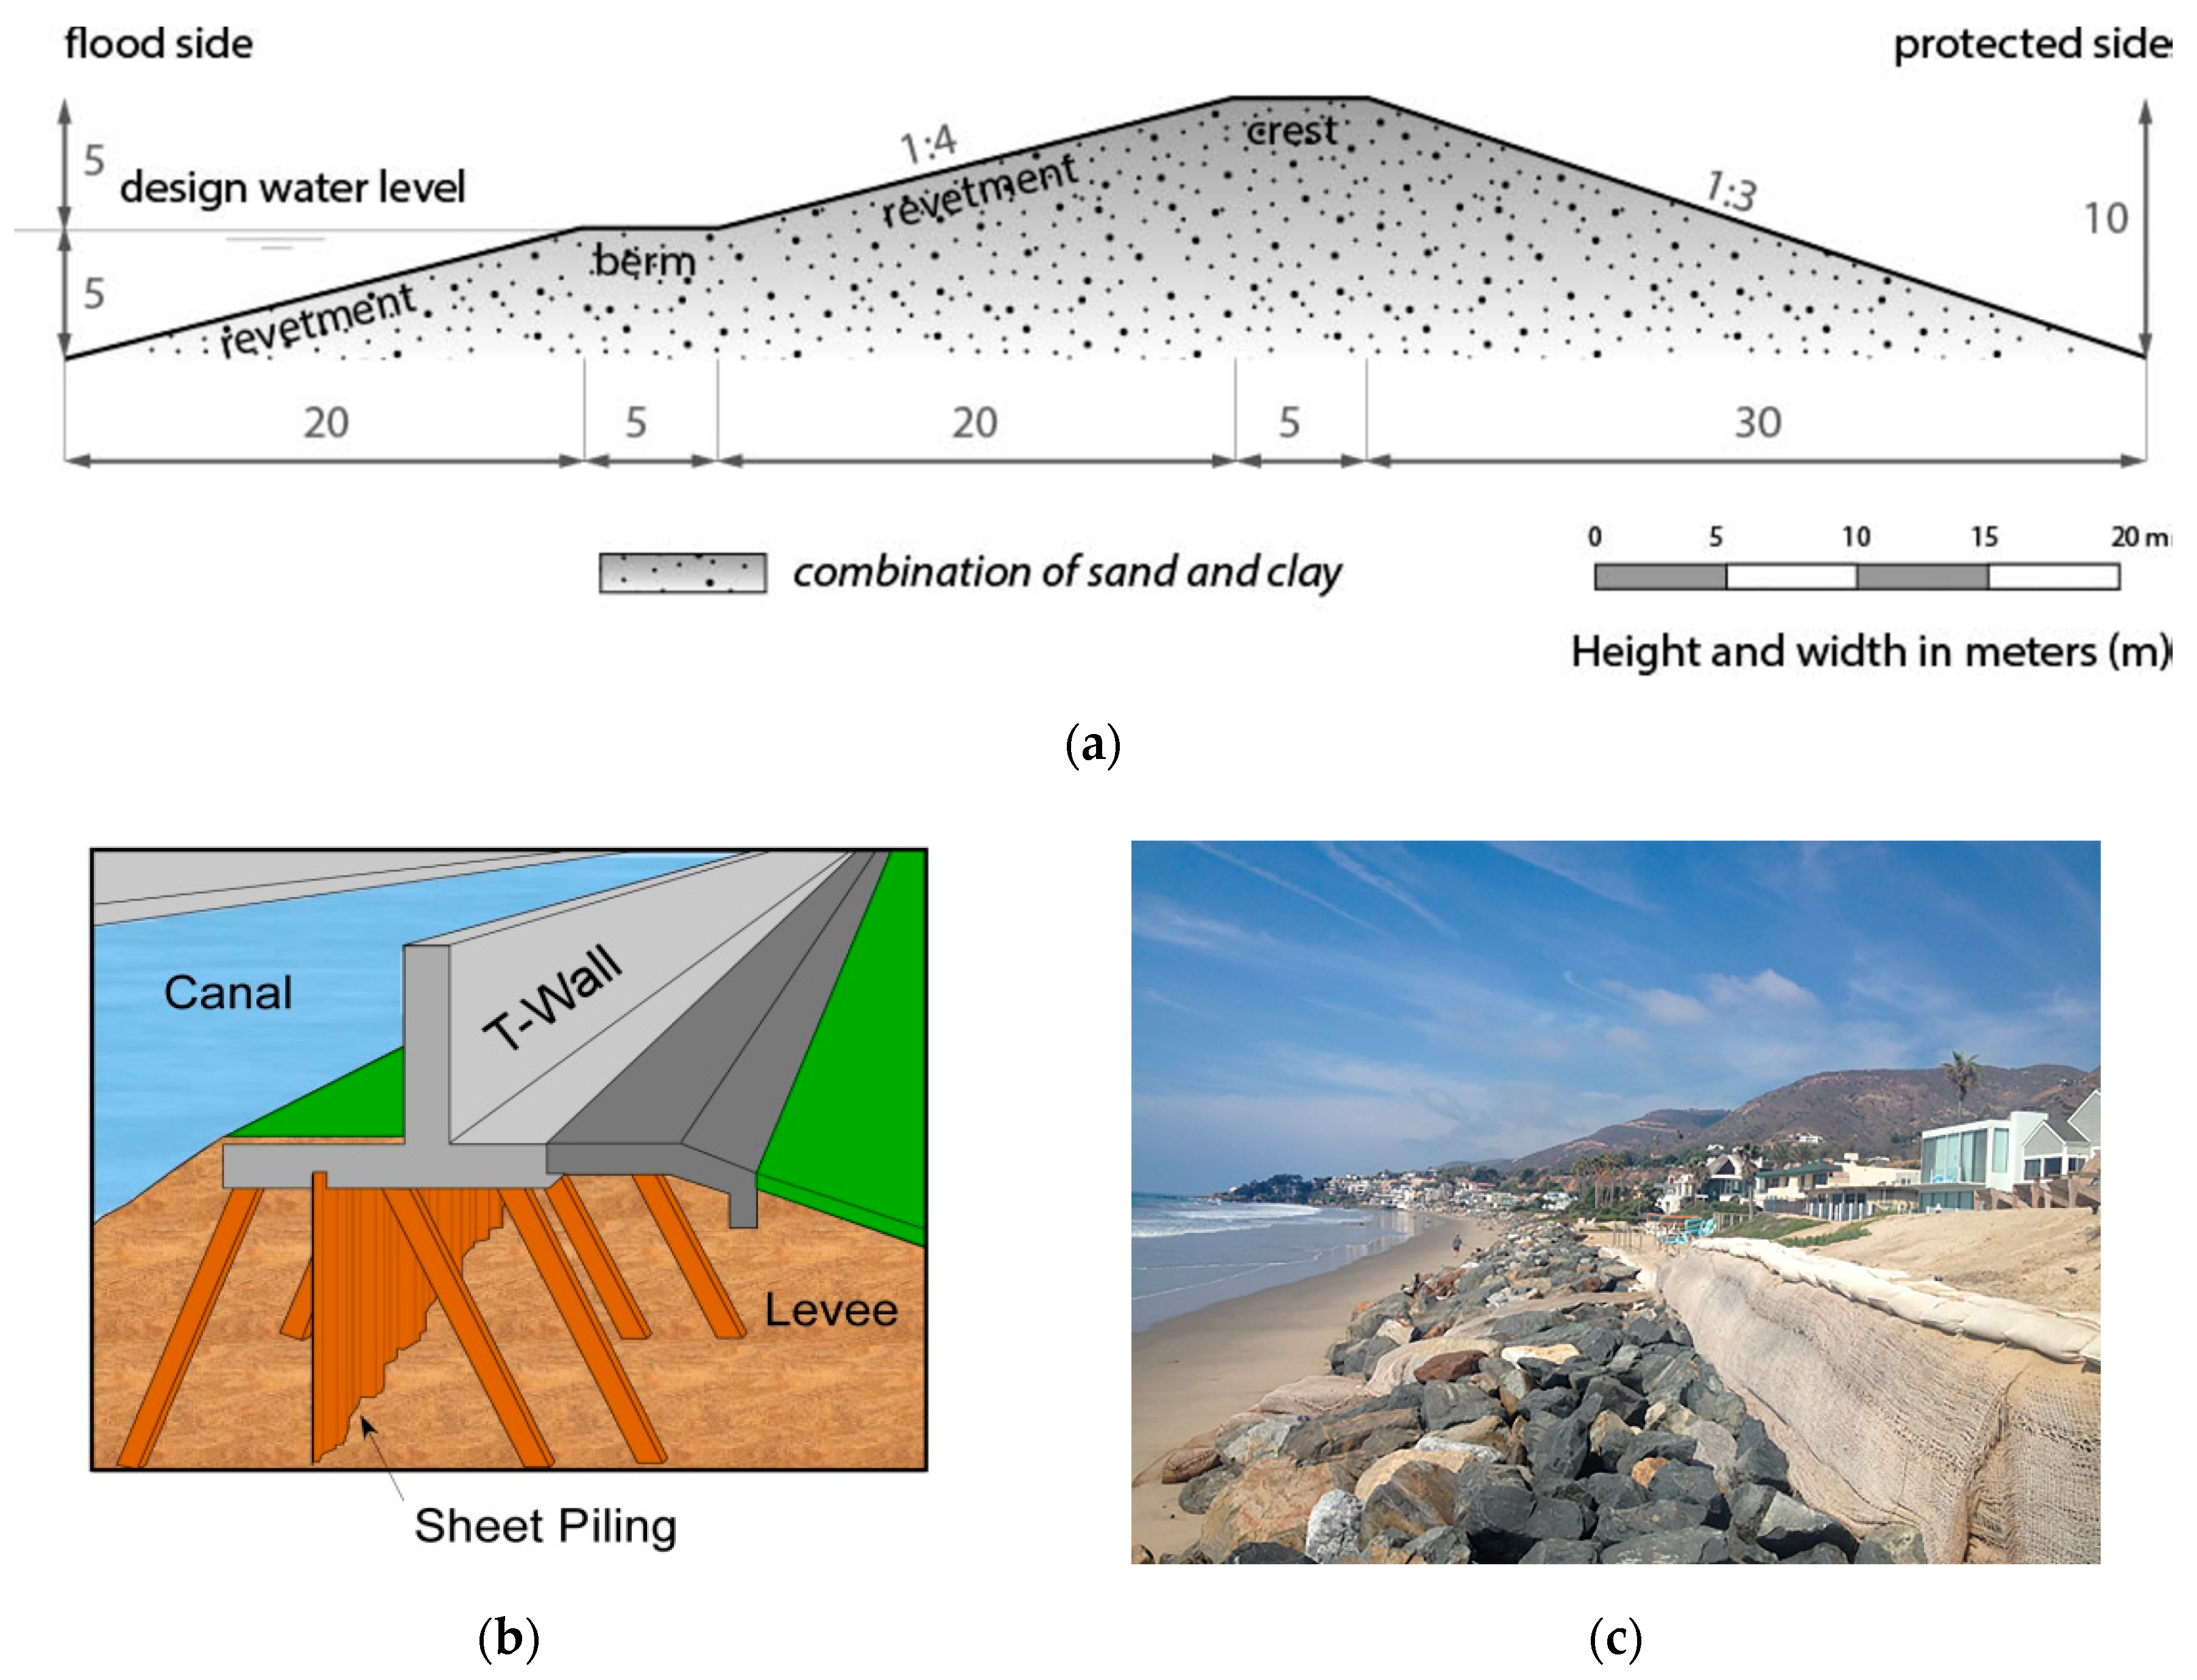
Sea and river dikes are designed to resist the forces of large coastal storm surges in areas with urban populations and valuable economic assets. Dikes are made of various fill materials such as concrete, clay, and sand, and they are covered with a layer of resistant vegetation or armoring material such as asphalt or boulders (Figure 2). Armoring for sea dikes is more robust than river dikes because of wave impacts, and costs are consequently higher. The cost of a new sea dike in the United States is estimated by Aerts et al. [16] at $28.8 million/km, and for Vietnam at $2.3 million/ [36]. For The Netherlands, Jonkman et al. [14] estimate costs at $19.3–27.2 million/km per meter of dike raised, and for Vietnam at $0.9–1.6 million/km per meter of dike raised. These case-study results are in the same range as those determined by a large study by Prahl et al. [22], who estimate the cost of raising sea dikes in European cities at $21.8–31.2 million/km per meter of dike raised. River dikes are generally cheaper than sea dikes at $12.1–18.2 million/km for a new dike in the United States [37,38] and $5 million/km per meter of dike raised in Canada [13]. Maintenance is estimated at $0.15 million/km and $0.03 million/m for sea dikes in The Netherlands and Vietnam, respectively [14], or between 0.01% and 1% of the initial investment cost [17].
Rural earthen dikes: Rural earthen dikes are peat- or clay-filled dikes applied in rural areas, with design standards <1/100. Jonkman et al. [14] estimate the cost of a rural dike in The Netherlands at $5.1–14 million/km per meter of dike raised, while for Canada this is $2.1 million/km per meter of dike raised [13]. According to studies in developing countries, for new earthen dikes (1–3 m in height), costs range from $0.1–0.2 million/km (Mozambique) [39] to $0.9–1.5 million/km (Vietnam) [14].
Floodwalls: Other types of levees can be made from steel piles or concrete and are often designed as T-walls [40] (Figure 2). The foundations of these structures are also made from concrete or steel to provide stability and prevent seepage and piping [14]. Costs for a new 7-m T-wall are estimated at $31 million/km [40]. The cost of a deployable floodwall is $6.6 million/km [29]. Operation and maintenance costs of dikes and floodwalls vary between 0.01% and 1% [17]. Another study provides numbers detailed estimates for the operation and maintenance of two flood-protection alternatives in Texas at 0.5% of the total investment costs [41].
Other protection measures:
Breakwater: Offshore breakwaters are above-water structures parallel to the shore which reduce wave heights, provide shelter to a harbor and prevent sediment deposition in the entrance channel of a port. There are three main types of breakwaters: (1) rubble-mound breakwaters, which consist of a core of small rocks covered with large rocks or concrete elements; (2) vertical-wall breakwaters, which are filled with concrete blocks or sand; and (3) vertical-composite breakwaters, which are concrete structures founded on rubble substructures where the caissons (or concrete blocks) are placed on a high rubble foundation [42]. Costs range from $1.4–6 million/km in developed countries to $63 million/km for complex structures (e.g., the breakwater of the ports of Los Angeles and Long Beach [17]. For developing countries, costs vary between $0.13 and $0.5 million/km [21]
Rip-rap: Rip-rap, also known “rock armor” or “rubble,” is rock or other material used to armor shorelines, streambeds, bridge abutments, pilings, and other shoreline structures against erosion (Figure 2). The unit cost for riprap used for protecting coastal zones is estimated at $292–780/m [43,44] or $80/ton [41], with maintenance costs at 2–4% [45].
A bulkhead is a retaining wall that is generally made of steel or wood which stretches ~3–10 m below the water surface and at least 1–3 m above. They are often used to protect pier walls in ports and harbors and are built to prevent soil erosion, flooding, and maintain sufficient navigation width. Recent bulkheads are made of vinyl or concrete, and wooden bulkhead pilings are usually the least expensive. Aerts et al. [16] apply a unit cost range between $12.7 and $51.9 million/km.
A sandbag wall is composed of individual bag that are filled with sand, often during the flood event. Though the method is considered effective, it is time- and labor-consuming. Sandbag walls have trapezoidal or triangular cross-sections, which means that, the higher wall, the more bags are needed. Estimates for a wall of +1 m in the United States are between ~$200,000 and $400,000 per km. One sandbag costs $3–6, and to protect a door opening with a sandbag wall of +1.2 m requires 72 bags at ~$210–420 (Appendix F Table A7).
Note that some flood protection related to river-bank maintenance has a link with “nature-based solutions” (see Section 3.4).
3.3. Coastal Protection by Beaches and Dunes
3.3.1. Beach Nourishment
Sub-tidal sandflats and bars, beaches, and sand dunes are natural barriers that reduce the impact of storm surges and waves along the coast [50]. Therefore, beach nourishment is widely used to combat coastal erosion [51]. Other advantages of beach nourishment are to increase and maintain coastal ecosystems, to enhance the potential for recreation, and to preserve the protective values of a coastline against storm surges. Sand-mining for beach-nourishing can be achieved by offshore dredging up to 20–30 km from the coastline, depending on the morphology of the coastal shelf. Furthermore, nourishment sand often comes from the periodic dredging of ports and harbors and is transported to nearby beaches.
The cost of material can vary greatly depending on its origin and associated transportation costs [52]. According to several cases in the United States, costs vary from ~$5 to $18/m3 [17] (Table 5). Nourishment in The Netherlands is estimated at ~$4–8/m3 [14] and average numbers for the EU vary from $5 to $11/m3 [15]. Studies in Australia, South Africa, and Vietnam show cost estimates of $7.7/m3, $20.8/m3, and $5.8/m3, respectively [15,53].
3.3.2. Dune Restoration
Dunes are usually located right at the front of the beach and are created by sand deposition due to winds, often on wider beaches of >35 m [55]. Dunes protect mainland against flooding and can provide habitat for plants, birds, and other terrestrial and beach organisms [56]. Dune restoration mostly involves re-planting native dune vegetation and the installation of sand fencing. Fences can be used on the seaward side to trap sand and help stabilize any bare sand surfaces [57]. Native vegetation may be planted to stabilize natural or artificial dunes and to promote the accumulation of sand from wind-blown sources [58]. Invasive non-native vegetation is often removed.
Costs vary from $7636 to $13,888/ha for studies in Australia and the United States (Appendix C Table A4). If dunes have been subject to erosion, dune reconstruction involves the placement of sand against the remaining dunes using bulldozers. Construction costs are for labor, new vegetation, and the sand needed to reconstruct the dune area. Some studies involve cleaning activities—for example, after a dune area has been hit by an oil spill. Such projects are more expensive through additional cleaning measures, with costs estimated at $52,000–76,000/ha (Appendix C). Maintenance costs of restored dunes are estimated at $333–2526/ha per year [54].
A groin is a structure which is oriented perpendicular to a shore and which reduces the flow of sediment along that shore. Retention structures (e.g., groins) can help to capture sand and sustain the lifetime of beach nourishment. Sand collects on the up-drift side of a groin until it is filled and the amount of sand on the beach stays the same [17]. Aerts et al. [16] estimate that the re-conditioning or new development of existing groins for New York City beach-nourishment projects at approximately $1.6 million per groin, including 15% contingencies. The USACE [29] provides cost estimates for nourishment including groins at $0.55 million/km.
3.4. Nature-Based Solutions for Coastal Ecosystems
Reducing flood risk by restoring or creating new coastal ecosystems is increasingly seen as an alternative to hard-engineered protection measures. (For an extensive overview of co-benefits of nature-based solutions see Morris et al. [59]) Coastal ecosystems already have a value in flood protection, and research shows that, without mangroves, 18 million people would be flooded every year [60]. However, global mangrove forests decreased by 19% over the period 1981–2005 [21], while over 60% of the world’s coral reefs are declining through overfishing, coastal development, and climate change [61]. In a comparative study for the U.S. Gulf coast, nature-based adaptation options could avert up to $50 billion of the expected flood losses in 2030, with an average benefit–cost ratio >3.5 [62].
Nature-based solutions (Table 6)—including the restoration of degraded coral reefs, or coastal wetlands (e.g., seagrasses, saltmarshes and mangroves)—can reduce flood-water flow and wave height [63]. Wetlands also function like sponges, temporarily storing tidal or flood waters and slowly releasing them, thus reducing flood heights [64]. Furthermore, restoring coastal vegetation and reefs can stabilize shorelines, promote sediment deposition and biodiversity, and reduce erosion [65].
3.4.1. General Restoration Estimates
Based on a database comprised of 954 observations, Bayraktarov et al. [19] estimate median and average restoration costs of marine coastal habitats at $80,000/ha and $1,600,000/ha, respectively (U.S. dollars, 2010). However, the same study states that the real costs are probably a factor 2–4 higher when both capital and operating costs are included. The cost of restoring marine coastal ecosystems depends on three main factors: (1) the area and type of ecosystem (e.g., the type of material or vegetation used in the restoration project); (2) the economy of the country (e.g., developing/developing), which determines labor cost; and (3) the restoration technique applied.
3.4.2. Seagrass and Saltmarches
Marine seagrass ecosystems are mainly found in shallow bays, estuaries, and coastal waters from the mid-intertidal (shallow) region down to depths of 50–60 m. The most extensive seagrass systems grow on sand and muddy ocean-beds. Ondiviela et al. [69] report that seagrass ecosystems can reduce current velocity, dissipate wave energy, and stabilize sediment—especially in shallow waters with low wave-energy environments. Restoration costs are estimated at $106,782/ha for areas in developing countries [19].
Coastal saltmarshes occur in the intertidal zone near estuaries or lagoons and also reduce wave heights, even under extreme conditions. Creating a salt-marsh zone in front of dikes may result in a reduced dike-reinforcement task [70]. Restoration costs of coastal wetlands in general are estimated at $67,128/ha [19].
3.4.3. Mangrove Restoration
Coastal mangroves are salt-adapted trees and shrubs that grow in tropical or subtropical areas [71]. Mangrove restoration usually entails reforestation of species, and restoration success depends on local circumstances such as hydrology, length of the planting period (“time for survival”), and seedling quality. Mangrove survival also depends on the degree of salinity, which depends much on the amount of available sediment and freshwater inflow to compensate for salinity [72].
Most mangrove-restoration projects analyzed in the scientific literature have an area of 10–120,000 ha. Construction costs (material, labor) and water depth are important factors that determine mangrove restoration costs. A meta-analysis by Narayan et al. [21] shows that the average restoration costs vary from $1081 to $3244/ha. Bayraktarov et al. [19] report lower and upper limits of $1506–49,324/ha, respectively. The lower value for developing countries is confirmed by an older study by Lewis [73] and more recently by Hakim [66] for a case study in Indonesia ($858/ha). Land-purchase costs are not included in these estimates. Furthermore, in a flood-management case study in Vietnam, a comparison was made between mangrove restoration and technical solutions such as breakwaters [74]. For this study, the cost for planting mangroves at water depths of 1–1.8 m varies between $25–200/m of coastline, which is cheaper than the cost for developing breakwaters ($125–475/m coastline [21]). Maintenance costs can be high for some species, as small seedlings are vulnerable to wave impacts, which require protection measures (e.g., breakwaters) and thinning and pruning activities. For Indonesia, maintenance costs have been estimated at 10% of initial investment, or around $85/ha [66]. For Vietnam, this has been estimated at $7.1/ha [67]. Such maintenance costs need to be considered for at least four years after planting seedlings.
3.4.4. Coral, Oyster and Artificial Reef Restoration
Artificial coral reefs reduce wave energy and coastal erosion and protect shorelines against flooding (Beck et al. [60]). Their effectiveness for reducing flooding is determined by reef width (relative to the average wave length) and reef depth (relative to the average wave height) [19]. Existing natural coral reefs can be restored by planting coral on degraded areas [75]. As for transplanting new coral on degraded areas, only 65% transplanted species survive. Bayraktarov et al. [19] use an average of 54,200 coral transplants to populate one hectare. Restoration cost varies from $2,311,296/ha in developed to $112,953/ha in developing countries [19]. For the restoration of oyster reefs, used oyster and clam shells from farmers and restaurants are placed in the water, with a cost of $72,273/ha [19]. Mangroves and other coastal vegetation is often planted in conjunction with oyster restoration to provide surface area to inhabit.
An artificial reef is a man-made structure that mimics some of the characteristics of a natural reef, such as promoting marine life and biodiversity [76]. Artificial reefs can be constructed from rocks, wood, old tires, or submerged shipwrecks sunk to the sea floor. For the 2598 artificial reef projects in Florida, concrete secondary-use materials are used most (43%) followed by concrete modules (24%), steel materials (such as steel towers and military equipment) (17%), steel vessels and barges (11%), and natural rock (primarily limestone boulders) (3%) [77]. One option is to deploy fabricated modules of concrete or natural materials such as limestone boulders. For such solutions, a study in the United Kingdom estimates costs at $30,263–90,789/100 m of new reef. The cost to prepare, tow, and deploy a steel vessel is around $10,000–80,000 [68].
3.5. Channel Management and Nature-Based Solutions for Riverine Systems
Maintaining the conveyance of discharge is an important aspect of managing flood levels, as channels that have filled up via natural sedimentation processes lower discharge capacity and hence increase flood risk. Channel management refers to activities that aim at retaining flow capacity and water levels in river systems for different users (e.g., shipping, ecosystems, and agriculture). Measures to maintain discharge capacity include periodic dredging, river widening, and creating new side channels (Table 7).
3.5.1. Dredging and River Widening
Dredging is the removal of sediment from the rivers and harbors. It can be done by hydraulic (e.g., by a “suction hedger”) and mechanical methods (e.g., a “bucket dredger”). Environmental regulations increasingly require the cleaning of contaminated dredged material and the safe disposal of dredged material in controlled deposit areas. Therefore, dredging costs are increasingly associated with both the excavation, treatment, and disposal of dredged material. Costs for mechanical dredging in the United Kingdom vary between $44 and $59/m3, whereas suction dredging is cheaper at $13/m3—both including the cost of disposal [78]. Costs for mechanical dredging and transport only in The Netherlands are estimated at $15–19/m3 [79], which indicates that the storage of frequently contaminated material is relatively expensive. Costs for dredging in Bangladesh are estimated at ~$2/m3 [80].
In addition to the dredging of existing channels, river widening is increasingly seen as a “nature-based solution”. River widening in lower stretches of a river basin decreases peak water levels, as the river is provided with “more room” to discharge its flood waters [86]. In addition, such measures restore both ecological values and biodiversity [87]. A U.K. cost estimate for widening a small rural river system by excavating river floodplains varies between $4.5 and $18/m3 [81], mainly for excavation.
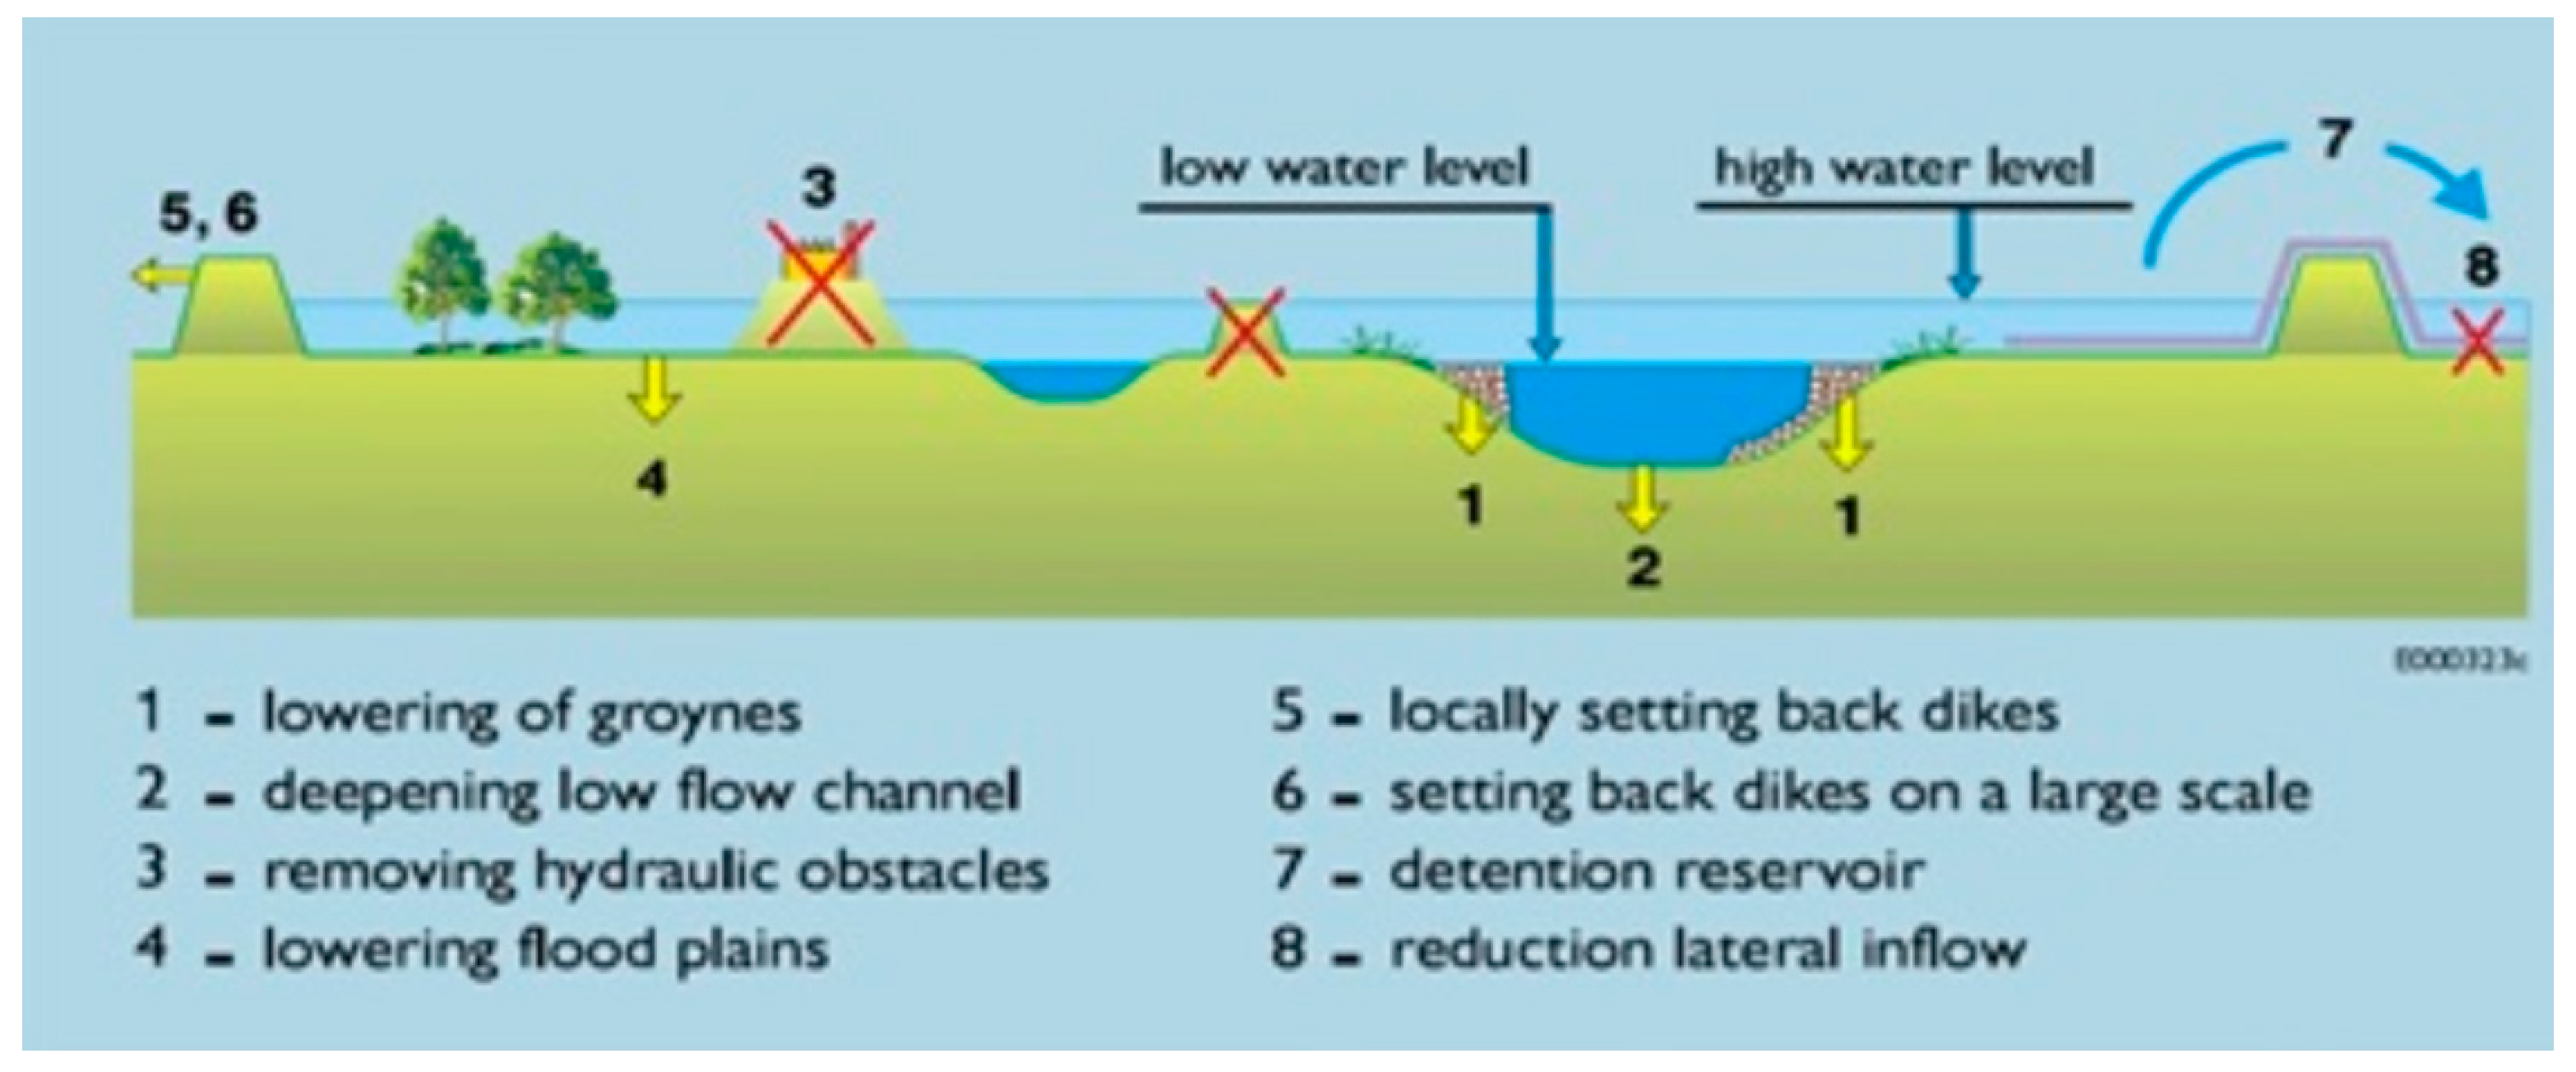
An example of a large-scale river widening program is “Room for the River” in The Netherlands [86]. This program entails 35 projects along the lower branches of the river Rhine, and the main goal is to enhance the maximum discharge capacity from approximately 15,000 to 16,000 m3/s. Each of the individual projects address one or more measures that lower the river bed through excavation, setback of dikes, or widen the (side-) channel (s) (Figure 3). The total investment cost of this project is around $2.64 billion [82]. Some projects within the program, such as those near the city of Nijmegen, are relatively expensive, as they involve costly engineered protection measures, which were implemented in a densely populated urban environment [82].
3.5.2. Operation and Maintenance
Operational activities include inspections and periodic evaluation studies, and they are estimated at $4049/km [78]. Maintenance measures include weed control (vegetation clearance), obstruction/dirt removal, de-silting, and small bank repairs. Apart from the generic factors that determine costs (e.g., labor rates), the maintenance costs depend on the “target condition” of the channels and whether channel-clearance measures are implemented manually or mechanically. For well-maintained channels (“Grade 2”; [78]), costs for manual maintenance are higher than for mechanical methods; they vary between $5730–51,311 km/year and $1680–17,096 km/year for manual and mechanical maintenance, respectively [78].
3.5.3. Nature-Based “Soft Bank” Protection and Water Buffering
In Section 3.2, a number of hard-engineered bank-protection measures (e.g., Riprap) were described. However, in more rural areas and in areas with lower protection standards, nature-based methods may often both reduce flood risk and improve environmental values such as biodiversity. Methods include implementing brush mattresses, revegetation, using biodegradable geotextiles to stabilize grade, and the application of logs or other natural materials resistant to erosive flows. Costs vary between $54,000 and $978,000/km for smaller rural river branches [49,78]. Most of these measures only have a design life of 3–15 years [89].
Other channel-related measures:
River detention areas: River detention areas are larger bath-tub-like systems (>3 million m3) surrounded by a dike and designed to temporarily retain peak river discharges. Detention areas are located along river channels and capture floodwater above a pre-defined water-level. At this point, a control device (a pipe or a spillway) is overtopped with flood-water into the detention/retention area. Spillways are also applied to activating side channels in case of extreme water levels [90]. Along the river Rhine in Germany, multiple detention areas between 3.6–32 million m3 are being developed to reduce flood peaks [91]. The cost of the largest “detention polder Hordt” (870 ha, volume: 32 million m3) is estimated at $98 million [83]. A similar flood-detention project has been proposed in the Rio Piura in Peru, including a detention area of 2600 ha, a 20-km new dike with construction costs estimated at $429 million, and operation and maintenance estimated at $5 million/year [84]. With a dike 3 m in height, the volume would be +/−373 million m3 with unit construction costs of $1.9/m3.
Inland wetland and water buffering: Creating wetlands in upstream areas enhances the buffer-capacity of ecosystems to absorb—at least temporarily—peak rainwater before it drains into the main river channels. Wetlands also have the ability to reduce nitrogen, phosphorous, pesticides, and sediment loading in open-water systems. Restoration of inland wetlands is less expensive than restoration of coastal wetlands. The cost for the former is estimated at $45,752/ha [19]. Tyndall and Bowman [85] estimate restoration costs for inland wetlands in Iowa (United States). For this case study, costs vary depending on site planning and design, excavation activities, installation of control structures (e.g., levees), and the opportunity cost of land made unsuitable for agricultural production. Design and construction costs are $10,022/ha, and yearly maintenance costs over a time span of 40 years are $785/ha [85].
3.6. Measures Against Local Inundations
Traditionally, measures against local inundations in urban environments consist of engineered drainage systems with concrete channels, pipes, and culverts to quickly drain water under gravity towards larger water bodies such as lakes, rivers, or seas (Table 8). In locations that lie below sea level or in low-lying areas where drainage under gravity is difficult, pumping systems may assist in draining the water towards larger water bodies. The capital costs of engineered urban-drainage systems are very high, so nature-based “sustainable urban drainage solutions” (SUDS) have recently been developed to retain rainwater (see also Appendix E Table A6). Examples of SUDS are green roofs and wetlands (For an extended review of SUDS see [23,92]). Most cost estimates are made for individual measures such as pipelines or ditches. For such measures, unit costs are based on the diameter of length of the proposed storm-water drainage infrastructure [93]. The U.K. Environment Agency (EA) [94] suggest that maintenance costs for SUDS in the United Kingdom range from 0.5% to 10% of the construction cost, with the exception of an infiltration trench (20%).
Sewer pipes: Construction costs in the United Kingdom and United States for implementing sewer pipes vary between $215–453/m and $61–861/m for concrete and metal pipes, respectively. The diameter varies between ~0.15–0.45 m and 0.25–2 m for concrete and metal pipes, respectively. Maintenance (cleaning and inspection) of sewer pipes in South Africa is estimated at ~$10/m [23].
Pumping stations: Appendix DTable A5 shows cost figures for pumping systems in several countries. Factors that determine costs (length of pipes, distance to source area, type of motor, drainage area, etc.) are described by Marzouk and Ahmed [95]. Costs vary between $0.4– and $1.7 million/m3/s. The numbers show that cost are not largely linked to local labor costs, as costs are sometimes higher in developing countries than in developed countries. This may indicate that these systems are highly sophisticated and require labor from external, specialized businesses.
Retention and retention ponds are designed only for flood control and are also known as dry ponds. In a city environment, a pond is intended to retain storm water for a period of time, releasing the water after the storm. An outlet pipe (or control device) is mostly placed at the bottom elevation of the detention volume to allow the pond to drain dry. Unlike dry retention ponds, wet retention ponds hold a permanent pool of water. The bottom of a wet retention pond is often excavated below the water table, thereby allowing fauna and vegetation in the water to consume nutrients and suspended pollutants to settle. Costs vary between $15 and $50/m3 for cases in the United Kingdom and United States [94,96]; the higher cost is for wet retention ponds [96]. The costs of legal fees, land costs, and other unexpected or additional costs are not included in these estimates. Further reading and detailed cost estimates can be found in a report by the Environmental Protection Agency (EPA) [97].
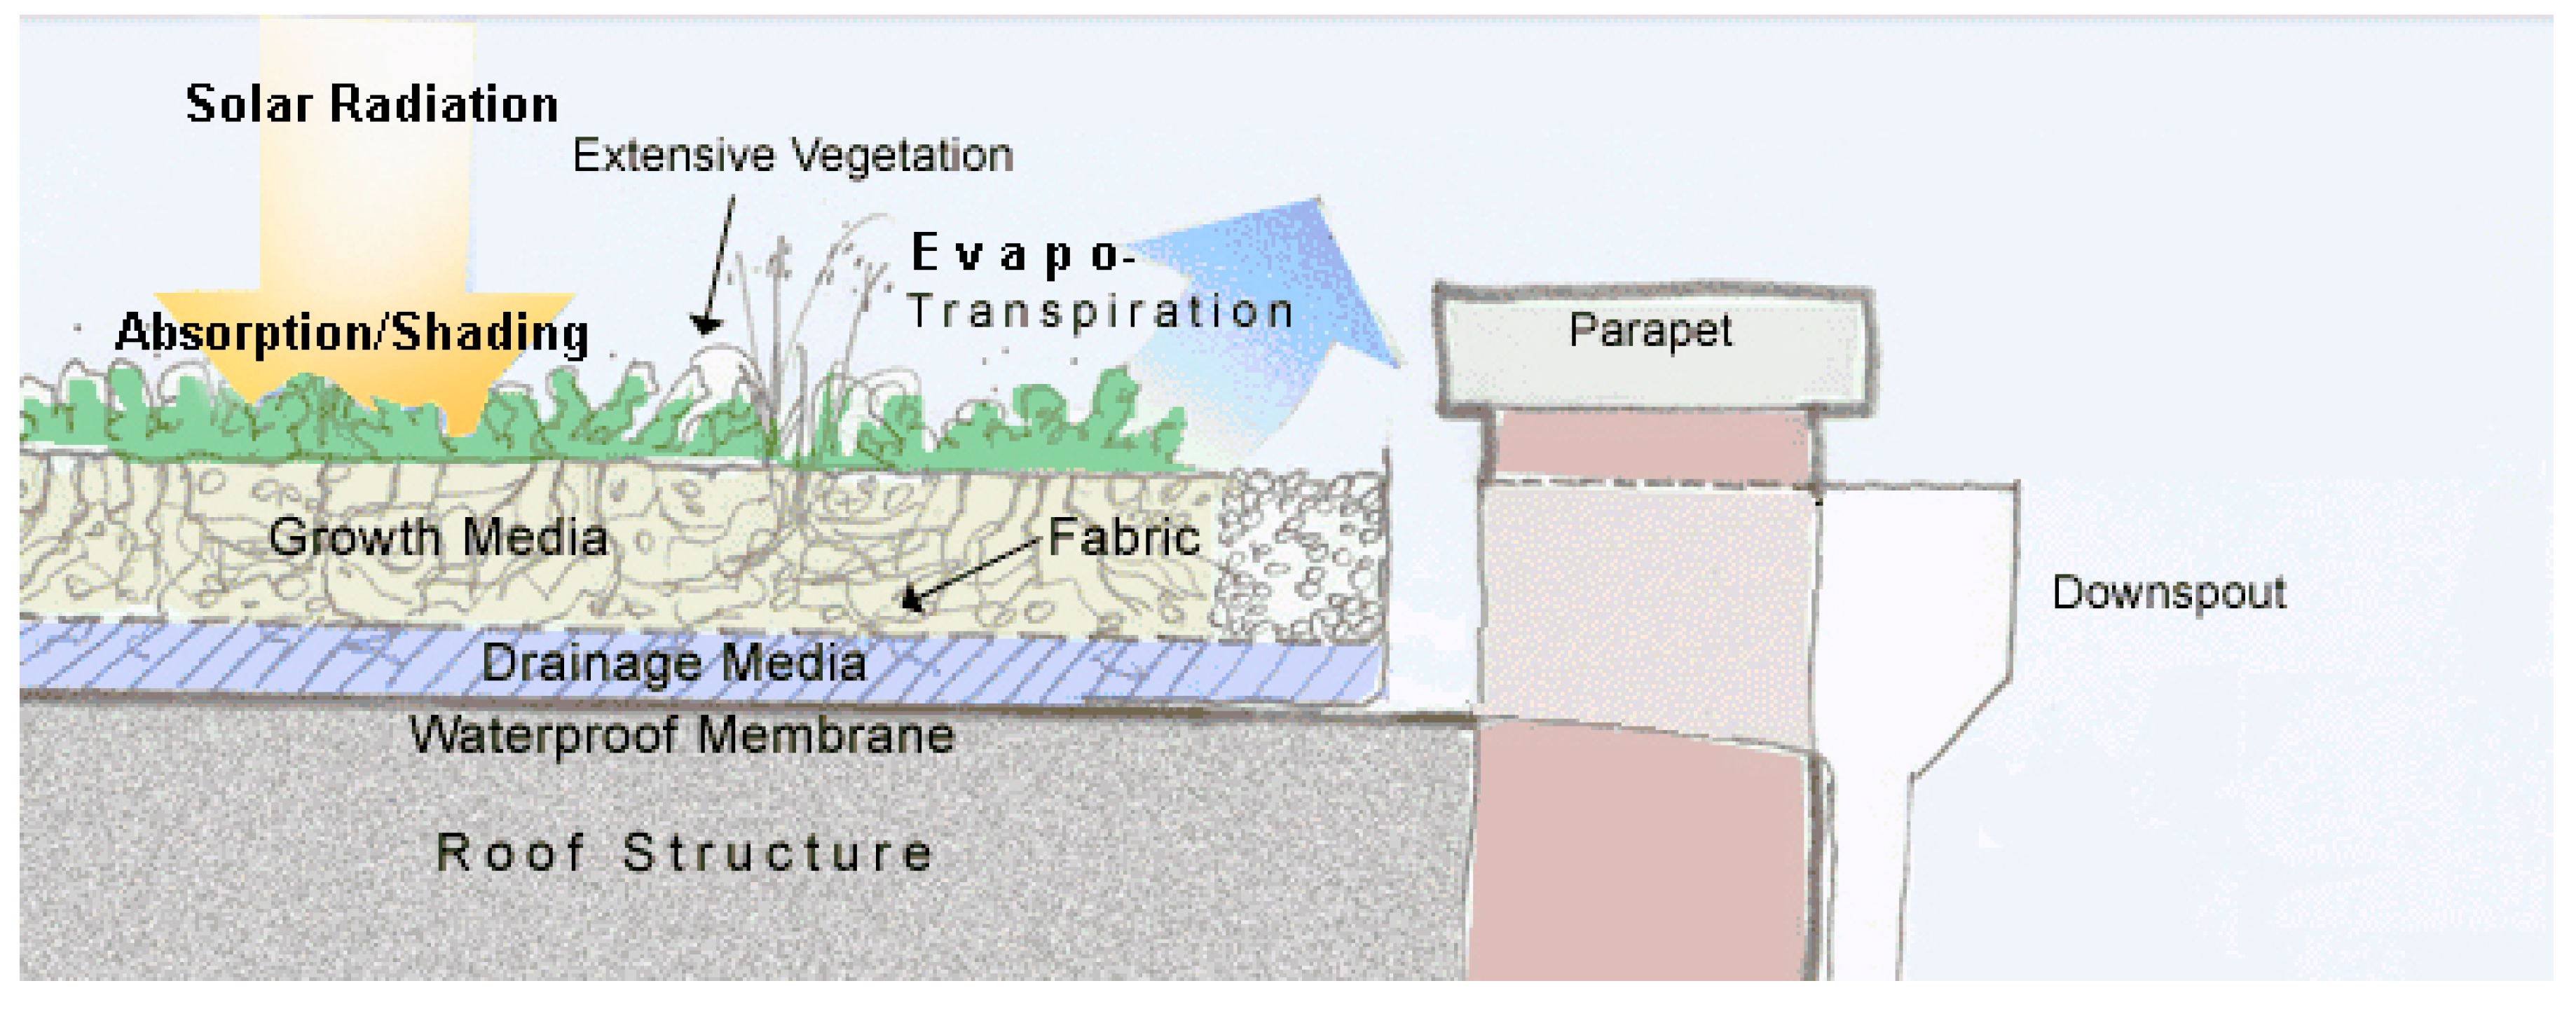
Green roofs are mostly developed upon the flat roofs of new or existing buildings (Figure 4). They are designed to store and evaporate rainwater to reduce the run-off peak to the sewer system [98]. A green-roof consists of a vegetation layer, a substrate layer (which retains water and anchors the vegetation), and a drainage layer (to discharge water). The construction cost of a green roof is dependent on the thickness (typically 0.15 m or more) and variety of vegetation (grasses, herbs, and shrubs). Costs vary from $32–39/m2 in South Africa to $114–225/m2 in the United States.
Parks and green zones are designed to meet the recreational needs of urban populations, but also have an important role in the hydrological regulation of cities, thereby mitigating local inundations [99]. Development costs of a park in the United States are $1521/m2 [100]. Maintenance costs of parks in the United Kingdom vary between $0.4 and $2/m2 [99].
4. Discussion and Conclusions
This study has collected empirical data on the cost of flood adaptation measures, using case studies and project-based information from various sources in the literature. The focus is on construction and maintenance costs for six categories of flood adaptation measures. The amount and quality of the data varies considerably, though recent research on specific flood-management issues has advanced the empirical basis of cost data. Data quality and uncertainty have been addressed by using cost intervals with upper and lower limits and an indication of the data quality of non-peer reviewed reports.
One of the issues with finding reliable costs is what cost categories are included in the aggregate cost estimate [13]. The studies used in this report are often unclear as to what cost components have been addressed in the final estimate, or have different components. This shows that cost estimates should be handled with care and with certain error margins; however, in most cases the estimates are probably on the conservative side, as some cost components have not been valued [14].
The issue of uncertainty in cost estimates also plays a role in the stage of the project at which the cost estimate was made: The error margins of cost estimates in the design and planning phases are obviously much higher than those of cost figures derived after project implementation. Wright and Pierce [33], for example, estimate 20% contingencies in a design for the dry flood-proofing of pumping stations. Addressing unexpected costs in the design phase holds especially for complex engineering projects such as the development of storm surge barriers, where the contingencies in the design phase are about 50% [106]. These projects suffer from rapid cost increases during the design phase, as requirements may change (e.g., a request for a higher protection standard), unforeseen complications in geographical conditions may arise (e.g., geological stability of the underground), or weather conditions which cause delays may occur.
Uncertainties also pertain to estimating the cost of operation and maintenance [13]. Such costs depend, for example, on the frequency of inspections and maintenance requirements that change over time due to the aging of the structure [26]. In the extensive review by Bayraktarov et al. [19], only a few of the underlying studies differentiate between cost components (e.g., between capital and operating costs) or provide information on other cost factors, such as planning, land acquisition, financing, monitoring, and repair/replacement. Some of the studies in this review estimate the annual operation and maintenance costs as a percentage of the construction costs but do not provide the data that underpins these estimates. Though yearly maintenance costs are low at first sight compared to construction costs, they add up quickly in an economic analysis, as they are valued over the lifetime of the measure.
Additional temporal aspects play a role in the interpretation and use of cost estimates [107]. While in existing studies, cost estimates are addressed as one-time investment numbers, such investments are often phased out over time. Examples are cost-benefit analyses for the planning of levee-reinforcement programs [106,108]. Furthermore, the lifetime of the proposed measures plays an important role in economic analysis. The expected lifetime of the larger investments (levees, storm surge barriers, sewer systems) are usually >50 years, whereas the lifetime is usually shorter (20–30 years) for cheaper measures such as flood-proofing buildings [26]. However, the required lifetime of an investment differs per country and even per project: The assumed lifetime for measures in a flood-management study in New York City is 50 years [29], whereas it is 100 years for measures in a comparable study in The Netherlands [109].
In addition to empirical data, studies exist that use modeling techniques to fit empirical cost data against explanatory variables. For example, a study by Mauer et al. [110] applies a model that calculates the length and size distribution of the sewer pipes in an urban area on the basis of rainfall intensity, housing densities, and area. Future research could expand such approaches. This also addresses the concerns of some researchers [13] that applying unit cost estimates assumes a fixed linear relationship between, for example, dike cost and some variable such as “meter height raised”. Such costs may increase non-linearly with increasing dike heights, and non-linear models are needed to describe such relations—especially in the face of future climate change. Research by Lenk et al. [13], however, shows, on the basis of empirical data in The Netherlands and Canada, that a unit cost expression is adequate to express the cost of flood protection per height raised or per unit length.
Research on the economic evaluation of the cost and benefits for nature-based solutions (for example, in urban drainage) compared to hard-engineered drainage measures is at an early stage. This is due to a few factors: (1) Nature-based solutions, for example, in urban drainage, require irrigation and possible replanting until the vegetation is fully established, and these costs are still difficult to accurately determine [23]; (2) developers and city planners may be concerned that natural drainage options may decrease the area suitable for economic production; and (3) it is difficult to find data on the hydrologic benefits of the measures as reflected, for example, in a design standard. This is more straightforward in flood protection projects, where the design standard refers to a return period of maximum water level that should be incorporated in the design of an embankment. Though nature-based solutions are basically designed to do the same (i.e., lowering water levels, absorb wave energy, store water, etc.), more research and modeling is needed on the “hydrologic and hydraulic return” of a dollar investment in nature-based solutions.
Future research may address these issues, and expand the research with estimating both the cost and benefits of flood adaptation measures, and assess the benefit cost ratios (BCRs) of such measures. With such numbers, a comparative study can be conducted.
Funding
This work was conducted under VICI Grant nr. 453-13-006, from the Dutch Science Foundation.
Acknowledgments
I thank Sanne van Amsterdam for the detailed preparatory work and Lars de Ruig and Max Tesselaar for reading earlier versions of this manuscript.
Conflicts of Interest
The author declares no conflict of interest.
Appendix A

Table A1.
Flood-proofing buildings.
| Country | Building Type | Measure | Unit | year | Source |
|---|---|---|---|---|---|
| Bangladesh/Vietnam | Wooden frame | Elevation: Stilts Bamboo/Reinforced concrete | $1250/2500 | 2015 | [32]/http://de.phaidon.com/agenda/architecture/articles/2013/april/17/vietnams-flood-proof-bamboo-houses/ |
| United Kingdom | Residential | Dry flood-proofing | $1950–5759 | 2008 | [26] |
| United Kingdom | Shop | Dry flood-proofing | $1989–8632 | 2008 | [26] |
| United Kingdom | Office | Dry flood-proofing | $2990–9399 | 2008 | [26] |
| United Kingdom | Residential | Wet flood-proofing | $8073–18369 | 2008 | [26] |
| United Kingdom | Shop | Wet flood-proofing | $11,063–17,706 | 2008 | [26] |
| United Kingdom | Office | Wet flood-proofing | $14,937–24,895 | 2008 | [26] |
Appendix B
Table A2.
Flood-proofing-specific measures.
| Country | Type of Flood-Proofing Measure | Costs Expressed Per | Costs | Reference |
|---|---|---|---|---|
| United States | Sprayed-on cement | Linear foot of wall covered | U.S.$16.80 (2009) | [25] |
| United States | Waterproof membrane | Linear foot of wall covered | U.S.$5.70 (2009) | [25] |
| United States | Asphalt | Linear foot of wall covered | U.S.$12.00 (2009) | [25] |
| United States | Drainage line around house | Linear foot | U.S.$31 (2009) | [25] |
| United States | Plumbing check valve | Each | U.S.$1060 (2009) | [25] |
| United States | Sump and sump pump (with back-up battery) | Lump sum | U.S.$1710 (2009) | [25] |
| United States | Metal flood shield | Linear foot of shield surface | U.S.$375 (2009) | [25] |
| United States | Wooden flood shield | Linear foot of shield surface | U.S.$117 (2009) | [25] |
Table A3.
Individual flood-proofing measures (Env. Agency [111]).
Table A3.
Individual flood-proofing measures (Env. Agency [111]).
| Country | Type of Flood Proofing Measure | Cost | Comment |
|---|---|---|---|
| United Kingdom | Periphery wall (based on a 40-m length) | £3500–4500 | May require ancillary pumps (maintenance costs required) Depends on size of curtilage |
| United Kingdom | Periphery wall residential gate (1.2 m) | £2500–4500 | |
| United Kingdom | Raise threshold | £1200–1500 | |
| United Kingdom | Storm porch (per door) | £5800–8800 | Includes additional cost of locking mechanism |
| United Kingdom | Flood resistant door (per door) | £875–2500 | |
| United Kingdom | Periscope airbricks (assumes 12 per property) | £2500–3000 | Includes installation costs |
| United Kingdom | Flood resistant door | £750–2500+ | |
| United Kingdom | Automatic door guards (domestic 2 m opening) | £8000 | Costs exclusive of ground work and construction |
| United Kingdom | Free-standing barriers (for detached house) | £5000–12,000 | Ancillary pumps may also be required |
| United Kingdom | Flood skirt (per house) | £10,000–35,000 | Costs include construction, fitting, and training |
| United Kingdom | Sump and pump | £50–2500 | Costs depend on pump capacity and sump size |
| United Kingdom | Anti-flood valves | £50–500 | Costs excluding labor to fit and construct an inspection chamber |
Appendix C
Table A4.
Cost nature-based solution, coast.
Appendix D
Table A5.
Cost, pumping stations.
| Pump Station | Capacity | Capacity | Project | Cost | Cost | Year | Cost 2016 | Note |
|---|---|---|---|---|---|---|---|---|
| Cubfeet/s | m3/s | ($ million) | ($million/m3/s) | ($million/m3/s) | ||||
| Henderson Bayou P. station | 1000 | 28.3 | East Ascension | 15.8 | 0.6 | 2011 | 0.7 | 1 |
| Bayou Trepagnier p. station | 800 | 22.7 | Pontchartrain | 11.5 | 0.5 | 2004 | 0.8 | 1 |
| Levee District | ||||||||
| Dwyer Road Pump station | 875 | 24.8 | New Orleans S&WB | 13.6 | 0.5 | 2010 | 0.7 | 1 |
| Ijmuiden | 260 | Noordzeekanaal | 68 | 0.3 | 2003 | 0.4 | 2, 3 | |
| Katwijk | 40 | Boezemkanaal | 46.8 | 1.2 | 2014 | 1.3 | 4 | |
| Egypt-1 | 0.55 | Urban drainage | 0.58 | 1.06 | 2011 | 1.3 | 5 | |
| Egypt-2 | 1.1 | Urban drainage | 0.75 | 0.7 | 2011 | 0.9 | 5 | |
| Uzbekistan | 91.5 | Bhukara 1 | 139 | 1.5 | 2013 | 1.7 | 6 |
1. (The Gulf Coast Community Protection and Recovery District), Storm Surge Surpression Study. 2. https://www.technischweekblad.nl/nieuws/supergemaal-in-ijmuiden/item5913. 3. https://www.trouw.nl/home/capaciteit-van-gemalen-vergroot~a820c6a5/. 4. https://www.kivi.nl/uploads/media/5652f45f281f5/Oppervlaktewaterbeheer_Hoogheemraadschap_Leiden_18_september_2014.pdf. 5. Marzuk and Ahmed (2011). 6. ADB https://www.adb.org/sites/default/files/project-document/81008/44458–012-tacr-01e.pdf.
Appendix E
Table A6.
Operation and maintenance costs for sustainable urban drainage solutions (SUDS) (Env, Agency [94]).
Table A6.
Operation and maintenance costs for sustainable urban drainage solutions (SUDS) (Env, Agency [94]).
| SUDS Option | Maintenance Cost | Source |
|---|---|---|
| Green roofs | £2500 per year for first 2 years for covered roof with sedum mat, £600 per year after. £1250 per year for first 2 years for covered roof with biodiverse roof, £150 per year after | Bamfield (2005) |
| Simple rainwater harvesting (water butts) | Negligible | |
| Advanced rainwater harvesting | £250 per year per property for external maintenance contract | RainCycle 2005 |
| Permeable paving | £0.5–1/m3 of storage volume | HR Wallingford, 2004 |
| Filter drain/perforated pipes | £0.2–1/m2 of filter surface area | HR Wallingford, 2004 |
| Swales | £0.1/m2 of swale surface area, £350 per year | HR Wallingford, 2004 |
| Infiltration basin | £0.1–0.3/m2 of detention basin area £0.25–1/m3 of detention volume | HR Wallingford, 2004 |
| Soakaways | £0.1/m2 of treated area | HR Wallingford, 2004 |
| Infiltration trench | £0.2–1/m2 of filter surface area | HR Wallingford, 2004 |
| Filter strip | £0.1/m2 of filter surface area | HR Wallingford, 2004 |
| Constructed wetland | £0.1/m2 of wetland surface area. Annual maintenance of £200–250/year for first five years (declining to £80–100/year after three years). | HR Wallingford, 2004 |
| Retention (wet) pond | £0.5–1.5/m2 of retention pond surface area, £0.1–£2/m3 of pond volume | HR Wallingford, 2004 |
| Detention basin | £0.1–0.3/m2 of detention basin area, £0.25–1/m3 of detention volume, £250–1000 per basin | HR Wallingford, 2004 |
| HR Wallingford, 2004 |
Bamfield (2005). Whole Life Costs & Living Roofs. The Springboard Centre, Bridgewater. A Report By The Solution Organisation for Sarnafil. Available from http://livingroofs.org/; HR Wallingford (2004). Whole Life Costing for Sustainable Drainage. Report SR 627; Raincycle (2005). Rainwater Harvesting Hydraulic Simulation and Whole Life Costing Tool v2.0. User Manual. SUDS Solutions.
Appendix F
Table A7.
Unit cost for sand bags and the sand bag flood barrier.
| Country | Measures | Unit | $2016 | Source |
|---|---|---|---|---|
| United States | Sandbag | $3–6/bag | http://www.aquadam.net/Flood_Control/fldcntrl.html | |
| United States | Sandbag wall +1 m high | ~300,000/km | http://www.aquadam.net/Flood_Control/fldcntrl.html | |
| United States | Sandbag wall +1.2 m high | $760,000/km | http://geocellsystems.com/brochures/pdfs/True_Cost_of_Sandbags.pdf | |
| United States | Sandbag wall +1.2 m high | #bags | #72,000/km | https://www.sandbaggy.com/blogs/articles/sandbags-calculator |
References
- Munich, R.E. Natural Catastrophe Review: Series of Hurricanes Makes 2017 Year of Highest Insured Losses Ever. Available online: https://www.munichre.com/en/media-relations/publications/press-releases/2018/2018-01-04-press-release/index.html (accessed on 2 July 2018).
- Jongman, B.; Ward, P.J.; Aerts, J.C. Global exposure to river and coastal flooding: Long term trends and changes. Glob. Environ. Chang. 2012, 22, 823–835. [Google Scholar] [CrossRef]
- Hall, J.W.; Grey, D.; Garrick, D.; Fung, F.; Brown, C.; Dadson, S.J.; Sadoff, C.W. Water Security: Coping with the curse of freshwater variability. Science 2014, 346, 429–430. [Google Scholar] [CrossRef] [PubMed]
- Dawson, R.J.; Dickson, M.E.; Nicholls, R.J.; Hall, J.W.; Walkden, M.J.; Stansby, P.K.; Mokrech, M.; Richards, J.; Zhou, J.; Milligan, J.; et al. Integrated analysis of risks of coastal flooding and cliff erosion under scenarios of long term change. Clim. Chang. 2009, 95, 249–288. [Google Scholar] [CrossRef] [Green Version]
- Nicholls, R.J.; Cazenave, A. Sea-Level Rise and Its Impact on Coastal Zones. Science 2010, 328, 1517–1520. [Google Scholar] [CrossRef] [PubMed]
- Hall, J.W.; Watts, G.; Keil, M.; De Vial, L.; Street, R.; Conlan, K.; O’Connell, P.E.; Beven, K.J.; Kilsby, C.G. Towards risk-based water resources planning in England and Wales under a changing climate. Water Environ. J. 2012, 26, 118–129. [Google Scholar] [CrossRef]
- Kreibich, H.; Van Den Bergh, J.C.; Bouwer, L.M.; Bubeck, P.; Ciavola, P.; Green, C.; Hallegatte, S.; Logar, I.; Meyer, V.; Schwarze, R.; et al. Costing Natural Hazards. Nat. Clim. Chang. 2014, 4, 303–306. [Google Scholar] [CrossRef]
- Thieken, A.; Cammerer, H.; Dobler, C.; Lammel, J.; Schöberl, F. Estimating changes in flood risks and benefits of non-structural adaptation strategies—A case study from Tyrol, Austria. Mitig. Adapt. Strateg. Glob. Chang. 2016, 21, 343–356. [Google Scholar] [CrossRef] [PubMed]
- Ward, P.; Aerts, J.C.J.H.; Botzen, W.J.; Bates, P.; Kwadijk, J.; Hallegatte, S.; Scussolini, P.; Winsemius, H. Future costs and benefits of river flood protection in urban areas: A global framework. Nat. Clim. Chang. 2017, 6, 381–385. [Google Scholar] [CrossRef]
- Merz, B.; Aerts, J.C.; Arnbjerg-Nielsen, K.; Baldi, M.; Becker, A.; Bichet, A.; Blöschl, G.; Bouwer, L.M.; Brauer, A.; Cioffi, F.; et al. Floods and climate: Emerging perspectives for flood risk assessment and management. Nat. Hazards Earth Syst. Sci. 2014, 14, 1921–1942. [Google Scholar] [CrossRef] [Green Version]
- Aerts, J.C.; Botzen, W.W.; Emanuel, K.; Lin, N.; de Moel, H.; Michel-Kerjan, E.O. Evaluating flood resilience strategies for coastal megacities. Science 2014, 344, 473–475. [Google Scholar] [CrossRef] [PubMed]
- Kind, J.M. Economically efficient flood protection standards for The Netherlands. J. Flood Risk Manag. 2014, 7, 103–117. [Google Scholar] [CrossRef]
- Lenk, S.; Rybski, D.; Heidrich, O.; Dawson, R.J.; Kropp, J.P. Costs of sea dikes—Regressions and uncertainty estimates. Nat. Hazards Earth Syst. Sci. 2016, 17, 765–779. [Google Scholar] [CrossRef]
- Jonkman, S.N.; Hillen, M.M.; Nicholls, R.J.; Kanning, W.; van Ledden, M. Costs of adapting coastal defences to sea-level rise—New estimates and their implications. J. Coast. Res. 2013, 29, 1212–1226. [Google Scholar] [CrossRef]
- Linham, M.M.; Green, C.H.; Nicholls, R.J. Costs of Adaptation to the Effects of Climate in the World’s Largest Port Cities; AVOID: London, UK, 2010; p. 225. [Google Scholar]
- Aerts, J.C.; Botzen, W.W.; de Moel, H.; Bowman, M. Cost estimates for flood resilience and protection strategies in New York City. Ann. N. Y. Acad. Sci. 2013, 1294, 1–104. [Google Scholar] [CrossRef] [PubMed] [Green Version]
- Aerts, J.C.; Barnard, P.L.; Botzen, W.J.; Grifman, P.; Finzi Hart, J.; De Moel, H.; Newton Mann, A.; de Ruig, L.; Sadrpour, N. Sea Level Rise, Flood Risk, and Adaptation Options in Los Angeles. Ann. N. Y. Acad. Sci. 2018. [Google Scholar] [CrossRef] [PubMed]
- Lasage, R.; Veldkamp, T.I.E.; de Moel, H.; Van, T.C.; Phi, H.L.; Vellinga, P.; Aerts, J.C.J.H. Assessment of the effectiveness of flood adaption strategies for HCMC. Nat. Hazards Earth Syst. Sci. 2014, 14, 1441–1457. [Google Scholar] [CrossRef] [Green Version]
- Bayraktarov, E.; Saunders, M.; Abdullah, S.; Mills, M.; Beher, J.; Possingham, H.P.; Mumby, P.J.; Lovelock, C.E. The cost and feasibility of marine coastal restoration. Ecol. Appl. 2016, 26, 1055–1074. [Google Scholar] [CrossRef] [PubMed] [Green Version]
- Lamond, J.; Rose, C.; Bhattacharya-Mis, N.; Joseph, R. Evidence Review for Property Flood Reliance Phase 2 Report. 2017. Available online: https://www.floodre.co.uk/wp-content/uploads/UWE-report_Evidence-review-for-PFR_Phase-2-report.pdf (accessed on 10 November 2018).
- Narayan, S.; Beck, M.; Reguero, B.; Losada, I.; Van Wesenbeeck, B.; Pontee, N.; Sanchirico, J.; Ingram, J.; Lange, G.; Burks-Copes, K. The Effectiveness, Costs and Coastal Protection Benefits of Natural and Nature-Based Defences. PLoS ONE 2016, 11, e0154735. [Google Scholar] [CrossRef] [PubMed]
- Prahl, B.F.; Rybski, D.; Kropp, J.P.; Burghoff, O.; Held, H. Applying stochastic small-scale damage functions to German winter storms. Geophys. Res. Lett. 2012, 39, L06806. [Google Scholar] [CrossRef]
- Armitage, N.; Vice, M.; Fisher-Jeffes, L.; Winter, K.; Spiegel, A.; Dunstan, J. Alternative Technology for Stormwater Management. The South African Guidelines for Sustainable Drainage Systems; No. TT 558/13; Water Research Commission: Gezina, South Africa, 2013. [Google Scholar]
- Jongman, B.; Winsemius, H.; Aerts, J.C.J.H.; Ward, P.J. Declining vulnerability to river floods and the global benefits of adaptation. Proc. Nat. Acad. Sci. USA 2015, E2271–E2280. [Google Scholar] [CrossRef] [PubMed]
- FEMA. Homeowner’s Guide to Retrofitting, 2nd ed.; US Department of Homeland Security, Federal Insurance and Mitigation Administration (FEMA): Washington, DC, USA. Available online: https://www.fema.gov/homeowners-guide-retrofitting (accessed on 17 August 2018).
- Keating, K.; May, P.; Pettit, A.; Pickering, R. Cost Estimation for Household Flood Resistance and Resilience Measures—Summary of Evidence. Environment Agency, 2015. Available online: http://evidence.environment-agency.gov.uk/FCERM/Libraries/FCERM_Project_Documents/SC080039_cost_house_resist_and_resilience.sflb.ashx (accessed on 4 April 2018).
- Kreibich, H.; Christenberger, S.; Schwarze, R. Economic motivation of households to undertake private precautionary measures against floods. Nat. Hazards Earth Syst. Sci. 2011, 11, 309–321. [Google Scholar] [CrossRef] [Green Version]
- Kousky, C. Financing Flood Losses: A Discussion of the National Flood Insurance Program. 2017. Available online: http://www.rff.org/files/document/file/RFF-DP-17-03.pdf (accessed on 10 November 2018).
- USACE. North Atlantic Coast Comprehensive Study: Resilient Adaptation to Increasing Risk, Final Report. January 2015, p. 144. Available online: http://www.nad.usace.army.mil/Portals/40/docs/NACCS/NACCS_main_report.pdf (accessed on 10 November 2018).
- Jones, C.P.; Coulbourne, W.L.; Marshall, J.; Rogers, S.M. Evaluation of the National Flood Insurance Program’s Building Standards. American Institutes for Research and the NFIP Evaluation Working Group, 2006. Available online: http://www.fema.gov/library/viewRecord.do?id=2592 (accessed on 10 November 2018).
- Home Advisor. How Much Does It Cost to Raise a House? 2016. Available online: https://www.homeadvisor.com/cost/foundations/raise-a-foundation/#cost (accessed on 14 September 2018).
- Biswas, S.; Hasan, M.A.; Islam, M.S. Stilt Housing Technology for Flood Disaster Reduction in the Rural Areas of Bangladesh. Int. J. Res. Civ. Eng. 2015, 3, 1–6. [Google Scholar]
- Wright and Pierce. Waste Water Pump Station Flooding Vulnerability Evaluation. 2016. Available online: http://www.waterfordct.org/sites/waterfordct/files/final_waterfordpsfloodreport_0.pdf (accessed on 1 May 2018).
- Noble, N.; Roy, D.C. Flood Resistant Housing. Low-Cost Disaster-Resistant Housing in Bangladesh; Practical Action Technical Brief: Warwickshire, UK, 2010. [Google Scholar]
- Swiss RE. Flood Risk in Brazil: Prevention, Adaptation and Insurance. Available online: https://www.researchgate.net/profile/David_Bresch/publication/253327670_Flood_risk_Brazil_full_study/links/00b4951f7f5db0793d000000/Flood-risk-Brazil-full-study.pdf (accessed on 10 November 2018).
- Thanh Danh, V.; Viet Khai, H. Using a Risk Cost-Benefit Analysis for a Sea Dike to Adapt to the Sea Level in the Vietnamese Mekong River Delta. Climate 2014, 2, 78–102. [Google Scholar] [CrossRef]
- Dijkman, J. A Dutch Perspective on Coastal Louisiana Flood Risk Reduction and Landscape Stabilization; United States Army—European Research Office of the US Army: London, UK, 2007; p. 226. [Google Scholar]
- Smith, D.L.; Miner, S.P.; Theiling, C.H.; Behm, R.; Nestler, J.M. Levee Setbacks: An Innovative, Cost-Effective, and Sustainable Solution for Improved Flood Risk Management. 2017. Available online: https://pdfs.semanticscholar.org/ed2f/6d8f9db6fb7af40ce1ad17999bdb3fdd2eea.pdf (accessed on 10 November 2018).
- van Ogtrop, F.F.; Hoekstra, A.Y.; van der Meulen, F. Flood management in the lower Incomati river basin, Mozambique: Two Alternatives. J. Am. Water Resour. Assoc. 2005, 41, 607–619. [Google Scholar] [CrossRef]
- Bos, A.J. Optimal Safety Level for the New Orleans East Polder, A Preliminary Risk Analysis. Master’s Thesis, University of Amsterdam, Amsterdam, The Netherlands, 2008. [Google Scholar]
- GCCPRD. Storm Surge Surpression Study, Phase 3. 2016. Available online: http://www.gccprd.com/pdfs/GCCPRD%20Phase%203%20Report%20-%20Recommended%20Actions.pdf (accessed on 10 November 2018).
- Tutuarima, W.H.; d’Angremond, W.H. Cost Comparison of Breakwater Types. Coast. Eng. 1998, 1934–1944. [Google Scholar] [CrossRef]
- PPIC. California Coastal Management with a Changing Climate. Available online: http://www.ppic.org/content/pubs/report/R_1108GMR.pdf (accessed on 1 May 2018).
- ERG Economic and Social Impacts of a Changing Coastline in California. Available online: ftp://reef.csc.noaa.gov/pub/socioeconomic/NSMS/California/Economic%20and%20Social%20Impacts%20CA_3_30_12_final.docx (accessed on 1 May 2018).
- Heberger, M.; Cooley, H.; Herrera, P.; Gleick, P.; Moore, E. The Impacts of Sea-Level Rise on the California Coast. Report nr. CEC-500-2009-024-D. California Climate Change Center of the Pacific Institute, 2009. Available online: http://www.pacinst.org/reports/sea_level_rise/report.pdf (accessed on 10 November 2018).
- Nelson, S.A. Hurricane Katrina—What Happened? Available online: http://www.tulane.edu/~sanelson/Katrina/katrina_images.htm (accessed on 14 September 2018).
- JCS. US$65-Million Riverside Project Set to Begin Construction: Pakse. Available online: http://jclao.com/us65-million-riverside-project-set-begin-construction-pakse/ (accessed on 10 November 2018).
- Ardhiansyah-Arifin, M.F. Cost analysis for heavy equipment in earthfill work—An optimization of heavy equipment fleet (Case study: Jabung ring dike project). AIP Conf. Proc. 2017, 1818, 020005. [Google Scholar] [CrossRef]
- SEPA. Bank Protection, Rivers and Lochs. Engineering in the Water Environment, Good Practice Guide WAT-SG-23; Scottish Environment Protection Agency: Stirling, Scotland, 2008; Available online: https://www.sepa.org.uk/media/150971/wat_sg_23.pdf (accessed on 10 November 2018).
- Hanley, M.E.; Hoggart, S.P.G.; Simmonds, D.J. Shifting sands? Coastal protection by sand banks, beaches, and dunes. Coast. Eng. 2014, 87, 136–146. [Google Scholar] [CrossRef]
- Dean, R.G.; Houston, J.R. Determining shoreline response to sea level rise. Coast. Eng. 2016, 114, 1–8. [Google Scholar] [CrossRef]
- Zhu, X.; Linham, M.M.; Nicholls, R.J. Technologies for Climate Change Adapatation—Coastal Erosion and Flooding; TNA Guidebook Series; Danmarks Tekniske Universitet, Risø Nationallaboratoriet for Bæredygtig Energi: Roskilde, Denmark, 2010. [Google Scholar]
- Boos, S.; Dahlstrom, A. Coastal Evolution at Nha Trang Bay, Vietnam. Water Resources Engineering TVVR-15/5006. Lund University, 2015. Available online: http://lup.lub.lu.se/luur/download?func=downloadFile&recordOId=7448002&fileOId=7448014 (accessed on 10 November 2018).
- Verburg, R.W.; Hennen, W.H.G.J.; Puister, L.F.; Michels, R.; van Duijvendijk, K. Estimating Costs of Nature Management in the European Union; Exploration Modelling for PBL’s Nature Outlook; Wageningen University, Natuur & Milieu: Wageningen, The Netherlands, 2017. [Google Scholar]
- Garcia-Lozano, C.; Pinto, J. Current status and future restoration of coastal dune systems on the Catalan shoreline (Spain, NW Mediterranean Sea). J. Coast. Conserv. 2018, 22, 519–532. [Google Scholar] [CrossRef]
- Martinez, M.L.; Gallego-Fernández, J.B.; Hesp, P. Restoration of Coastal Dunes; Springer: Berlin, Germany; New York, NY, USA, 2013. [Google Scholar]
- Nordstrom, K.F.; Arens, S.M. The role of human actions in evolution and management of foredunes in The Netherlands and New Jersey, USA. J. Coast. Conserv. 1998, 4, 169–180. [Google Scholar] [CrossRef]
- Rozé, F.; Lemauviel, S. Sand dune restoration in North Brittany, France: A 10-year monitoring program. Restor. Ecol. 2004, 12, 29–35. [Google Scholar] [CrossRef]
- Morris, R.; Konlecher, T.; Ghisalberti, M.; Swearer, S. From grey to green: Efficacy of eco-engineering solutions for nature-based coastal defence. Glob. Chang. Biol. 2017, 24, 1827–1842. [Google Scholar] [CrossRef] [PubMed]
- Beck, M.W.; Losada, I.J.; Menéndez, P.; Reguero, B.G.; Díaz-Simal, P.; Fernández, F. The global flood protection savings provided by coral reefs. Nat. Commun. 2018, 9, 2186. [Google Scholar] [CrossRef] [PubMed]
- Burke, L.; Reytar, K.; Spalding, M.; Perry, A. Reefs at Risk Revisited; World Resources Institute: Washington, DC, USA, 2011; 130p, Available online: http://www.wri.org/publication/reefs-risk-revisited (accessed on 10 November 2018).
- Reguero, B.; Beck, M.; Bresch, D.; Calil, J.; Meliane, I. Comparing the cost effectiveness of nature-based and coastal adaptation: A case study from the Gulf Coast of the United States. PLoS ONE 2018. [Google Scholar] [CrossRef] [PubMed]
- United States Geological Survey (USGS). Wetland Restoration and Creation. Available online: https://water.usgs.gov/nwsum/WSP2425/restoration.html (accessed on 4 April 2018).
- United States Environmental Protection Agency (EPA). Wetlands Protection and Restoration. Available online: https://www.epa.gov/wetlands (accessed on 4 April 2018).
- Spalding, M.D.; Ruffo, S.; Lacambra, C.; Meliane, I.; Hale, L.Z.; Shepard, C.C.; Beck, M.W. The role of ecosystems in coastal protection: Adapting to climate change and coastal hazards. Ocean Coast. Manag. 2014, 90, 50–57. [Google Scholar] [CrossRef]
- Hakim, L.L. Cost and Benefit Analysis for Coastal Management. A Case Study of Improving Aquaculture and Mangrove Restoration Management in Tambakbulusan Village Demak Indonesia. 2016. Available online: http://edepot.wur.nl/421310 (accessed on 10 November 2018).
- Marchand, M. Mangrove Restoration in Vietnam: Key Considerations and a Practical Guide. TU Delft Report T2666. 2008, p. 36. Available online: https://repository.tudelft.nl/islandora/object/uuid:98b5ba43-1452-4631-81dc-ad043ef3992c?collection=research (accessed on 10 November 2018).
- Climate-ADAPT (European Climate Adaptation Network). Groynes, Breakwaters and Artificial Reefs. Available online: http://climate-adapt.eea.europa.eu/metadata/adaptation-options/groynes-breakwaters-and-artificial-reefs (accessed on 14 September 2018).
- Ondiviela, B.; Losada, I.J.; Lara, J.L.; Maza, M.; Galván, C.; Bouma, T.; van Belzen, J. The role of seagrasses in coastal protection in a changing climate. Coast. Eng. 2014, 87, 158–168. [Google Scholar] [CrossRef]
- Van Loon-Steensma, J.M. Salt marshes to adapt the flood defences along the Dutch Wadden Sea coast. Mitigat. Adapt. Strateg. Glob. Chang. 2015, 20, 929–948. [Google Scholar] [CrossRef] [PubMed]
- Beck, M.W.; Narayan, S.; Trespalacios, D.; Pfliegner, K.; Losada, I.J.; Menéndez, P.; Espejo, A.; Torres, S.; Díaz-Simal, P.; Fernandez, F.; et al. The Global Value of Mangroves for Risk Reduction; Summary Report; The Nature Conservancy: Berlin, Geramny, 2018. [Google Scholar]
- United Nations Environment Program (UNEP). Mangrove Conservation and Restoration. Available online: http://web.unep.org/coastal-eba/content/mangrove-conservation-and-restoration (accessed on 4 April 2018).
- Lewis, R.R. Mangrove Restoration—Costs and Benefits of Successful Ecological Restoration. In Proceedings of the Mangrove Valuation Workshop, Universiti Sains Malaysia, Penang, Malaysia, 4–8 April 2001; Beijer International Institute of Ecological Economics: Stockholm, Sweden, 2001. Available online: http://www.fao.org/forestry/10560-0fe87b898806287615fceb95a76f613cf.pdf (accessed on 10 November 2018).
- Losada, I.J.; Menéndez, P.; Espejo, A.; Torres, S.; Díaz-Simal, P.; Abad, S.; Beck, M.W.; Narayan, S.; Trespalacios, D.; Pfliegner, K.; et al. The Global Value of Mangroves for Risk Reduction; Technical Report; The Nature Conservancy: Berlin, Germany, 2018; p. 176. [Google Scholar]
- Reef Resilience Network (RRN). Restoration. Retrieved. Available online: http://www.reefresilience.org/restoration/ (accessed on 4 April 2018).
- National Oceanic and Atmospheric Administration (NOAA). What Is an Artificial Reef? Available online: https://oceanservice.noaa.gov/facts/artificial-reef.html (accessed on 4 April 2018).
- EPA. Guidelines and Management Practices for Artificial Reef Siting, Use, Construction, and Anchoring in Southeast Florida. Southeast Florida Coral Reef Initiative. TP-176. 2011, p. 162. Available online: http://nsgl.gso.uri.edu/flsgp/flsgph11003.pdf (accessed on 10 November 2018).
- EA, Environment Agency. Cost Estimation for Channel Management—Summary of Evidence. Report—SC080039/R3. 2015, p. 67. Available online: http://evidence.environment-agency.gov.uk/FCERM/Libraries/FCERM_Project_Documents/SC080039_cost_channel_mgmt.sflb.ashx (accessed on 10 November 2018).
- Timmermans, M. Beheerplan Baggerwerken Waterschap Hollandse Delta. 2014, p. 32. Available online: https://www.wshd.nl/binaries/content/assets/wshd---website/common/agendapunt_12_beheerplan_baggerwerken_2014-2018.pdf (accessed on 10 November 2018). (In Dutch).
- World Bank. People’s Republic of Bangladesh Revival of Inland Water Transport: Options and Strategies Bangladesh; Development Series Paper No. 20; World Bank: Washington, DC, USA, 2007; Available online: http://siteresources.worldbank.org/INTBANGLADESH/Resources/BDS20.pdf (accessed on 10 November 2018).
- City of Bath. Bath and North East Somerset Flood Risk Management Strategy Report. Appendix J. Available online: http://www.bathnes.gov.uk/sites/default/files/sitedocuments/Planning-and-Building-Control/Planning-Policy/Evidence-Base/Flood-Risk/FRMSAppendixJ.pdf (accessed on 17 August 2018).
- CPB. Kosteneffectiviteit van maatregelen en pakketten Kosten-batenanalyse voor Ruimte voor de Rivier. J. Ebregt (In Dutch). C.J.J. Eijgenraam en H.J.J. Stolwijk. CPB Document 83. 2005. Available online: https://www.cpb.nl/sites/default/files/publicaties/download/kosteneffectiviteit-van-maatregelen-en-pakketten-kosten-batenanalyse-voor-ruimte-voor-de.pdf (accessed on 10 November 2018).
- Die Rheinpfalz, Mehr Geld vom Bund für Hochwasserschutz. Available online: https://www.rheinpfalz.de/lokal/artikel/mehr-geld-vom-bund-fuer-hochwasserschutz/ (accessed on 4 April 2018). (In German).
- Mechler, R. Cost-Benefit Analysis of Natural Disaster Risk Management in Developing Countries; Disaster Risk Management in Development Cooperation; GTZ: Bonn, Germany, 2005; p. 126. [Google Scholar]
- Tyndall, J.; Bowman, T. Iowa Nutrient Reduction Strategy Best Management Practice Cost Overview Series: Constructed Wetlands; Department of Ecology & Natural Resource Management, Iowa State University: Ames, IA, USA, 2016. [Google Scholar]
- Klijn, F.; Asselman, N.; Wagenaar, D. Room for Rivers: Risk Reduction by Enhancing the Flood Conveyance Capacity of The Netherlands’ Large Rivers. Geosciences 2018, 8, 224. [Google Scholar] [CrossRef]
- Palmer, M.A.; Hondula, K.L.; Koch, B.J. Ecological Restoration of Streams and Rivers: Shifting Strategies and Shifting Goals. Annu. Rev. Ecol. Evol. Syst. 2014, 45, 247–269. [Google Scholar] [CrossRef]
- STOWA, Stichting Toegepast Onderzoek Waterbeheer. Deltaproof. Room for the River. Available online: http://deltaproof.stowa.nl/Publicaties/deltafact/Room_for_the_river?subject=9 (accessed on 14 September 2018).
- Roca, M. Green Approaches in River Engineering, HR Wallingford. Available online: http://www.hrwallingford.com/ (accessed on 14 September 2018).
- Schielen, R.M.; Jesse, P.; Botwidt, L.J. On the use of flexible spillways to control the discharge ratio of the Rhine in The Netherlands: Hydraulic and morphological. Neth. J. Geosci. 2007, 86, 77–88. [Google Scholar]
- Wierig, H.P.; Kretschmer, W. Reserve Area for Flood Retention Hördt. Alfa Project Presentation. Available online: http://alfa-project.eu/_userdata/files/2%20SGD%20S%C3%BCd%20-%20Wierig%20-%20ALFA%20conference%20%5BCompatibiliteitsmodus%5D.pdf (accessed on 14 September 2018).
- Woods Ballard, W.; Wilson, S.; Udale-Clarke, H.; Illman, S.; Scott, T.; Ashley, R.; Kellagher, R. The SUDS Manual. CIRIA C697, London. 2015. Available online: www.scotsnet.org.uk/documents/NRDG/CIRIA-report-C753-the-SuDS-manual-v6.pdf (accessed on 10 November 2018).
- Narayanan, A.; Pitt, R. Costs of Urban Stormwater Control Practices. University of Alabama, 2006. Available online: http://rpitt.eng.ua.edu/class/International%20urban%20water%20systems/Arvind%20Costs%20of%20Urban%20Stormwater%20Control%20Feb%2005%202006%20clean%20copy.htm (accessed on 10 November 2018).
- Environment Agency. Cost Estimation for SUDS—Summary of Evidence. Report–SC080039/R9; 2015. Available online: http://evidence.environment-agency.gov.uk/FCERM/Libraries/FCERM_Project_Documents/SC080039_cost_SUDS.sflb.ashx (accessed on 10 November 2018).
- Marzouk, M.M.; Ahmed, R.M. A case-based reasoning approach for estimating the costs of pump station projects. J. Adv. Res. 2011, 2, 289–295. [Google Scholar] [CrossRef]
- Environmental Protection Agency. EPA Preliminary Data Summary of Urban Storm Water Best Management Practices; EPA-821-R-99-012; Environmental Protection Agency: Washington, DC, USA, 1999; p. 214.
- Environmental Protection Agency (EPA). Storm-Water Wet Pond and Wetland Management Handbook. EPA 833-B-09-11; 2009; p. 80. Available online: https://www3.epa.gov/npdes/pubs/pondmgmtguide.pdf (accessed on 10 November 2018).
- Mentens, J.; Raes, D.; Hermy, M. Green roofs as a tool for solving the rainwater runoff problem in the urbanized 21st century? Landsc. Urban Plan. 2006, 77, 217–226. [Google Scholar] [CrossRef]
- Tempesta, T. Benefits and costs of urban parks: A review. Aestimum 2015, 67, 127–143. [Google Scholar]
- DuMoulin, A.; Welle, B.; Harnik, P.; Pierson, C.; DeCoster, K.; McGillivray, B.; Evers, T. Downtown Parks: Funding Methods, Management Structures, and Costs; City of Minneapolis: Minneapolis, MN, USA, 2008; p. 123. [Google Scholar]
- Dvorak, B.; Volder, A. A Green Roof Pilot Study at the Texas A&M Architecture Center Langford Building a Final Report, January 29 2010. Available online: https://faculty-legacy.arch.tamu.edu/bdvorak/research.htm (accessed on 10 November 2018).
- GSA. The Benefits and Challenges of Green Roofs on Public and Commercial Buildings. United States General Services Administration, 2011; p. 129. Available online: https://www.gsa.gov/cdnstatic/The_Benefits_and_Challenges_of_Green_Roofs_on_Public_and_Commercial_Buildings.pdf (accessed on 10 November 2018).
- Niu, H.; Clark, C.; Zhou, J.; Adriaens, P. Scaling of economic benefits from green roof implementation in Washington, DC. Environ. Sci. Technol. 2010, 44, 4302–4308. [Google Scholar] [CrossRef] [PubMed]
- Wong, N.H.; Tay, S.F.; Wong, R.; Leng Ong, C.; Sia, A. Life cycle cost analysis of rooftop gardens in Singapore. Build. Environ. 2003, 38, 499–509. [Google Scholar] [CrossRef]
- BI. The Difficult Beginnings of Green Roofs, Walls in PH. Available online: https://business.inquirer.net/2649/the-difficult-beginnings-of-green-roofs-walls-in-ph#ixzz5V0xOfZSj (accessed on 10 November 2018).
- Kind, J.; Gauderis, J.; van Velzen, E.; Silva, W. Kengetallen Kosten-batenanalyse Waterveiligheid 21e eeuw. Report 2008.044. Dutch Ministry of Water and Transport, 2008. Available online: https://repository.tudelft.nl/islandora/object/uuid%3A8834660b-e573-4c0b-a2c2-ab771223094f (accessed on 10 November 2018). (In Dutch).
- Maharjan, M.; Pathirana, A.; Gersonius, B.; Vairavamoorthy, K. Staged cost optimization of urban storm drainage systems based on hydraulic performance in a changing environment. Hydrol. Earth Syst. Sci. 2009, 13, 481–489. [Google Scholar] [CrossRef] [Green Version]
- Eijgenraam, C.; Brekelmans, R.; den Hertog, D.; Roos, K. Optimal Strategies for Flood Prevention. Manag. Sci. 2017, 63, 1644–1656. [Google Scholar] [CrossRef]
- Aerts, J.C.J.H.; Sprong, T.; Bannink, B. Aandacht voor Veiligheid; VU University Press: Amsterdam, The Netherlands, 2008; p. 213. Available online: https://research.vu.nl/en/publications/aandacht-voor-veiligheid-leven-met-water-klimaat-voor-ruimte-dg-w (accessed on 10 November 2018). (In Dutch)
- Maurer, M.; Scheidegger, A.; Herlyn, A. Quantifying costs and lengths of urban drainage systems with a simple static sewer infrastructure model. Urban Water J. 2013, 10, 234–254. [Google Scholar] [CrossRef]
- (EA) Environment Agency. Available online: http://evidence.environment-agency.gov.uk/FCERM/Libraries/FCERM_Project_Documents/SC080039_cost_house_resist_and_resilience.sflb.ashx (accessed on 10 October 2018).
Figure 1.
Example of a wet flood-proofed building (Left) and a dry flood-proofed building (Right) (Source: Federal Emergency Management Agency, FEMA [25]).
Figure 1.
Example of a wet flood-proofed building (Left) and a dry flood-proofed building (Right) (Source: Federal Emergency Management Agency, FEMA [25]).

Figure 2.
Types of flood protection: (a) a cross-section of a typical Dutch sea-dike, filled with sand and clay [14] (b) Two types of steel and concrete floodwalls applied [46] (c) Rip-rap [17].

Figure 3.
Measures applied in the “Room for the River” project in The Netherlands [88].
Figure 3.
Measures applied in the “Room for the River” project in The Netherlands [88].

Figure 4.
Example of a green roof and its main components (source: [101]).
Figure 4.
Example of a green roof and its main components (source: [101]).

Table 1.
Cost for elevation (U.S.$) and re-location of buildings.
| Country | Building Type | Measure | Cost | Year | $2016/CPI 1 | Reference 2 |
|---|---|---|---|---|---|---|
| United States | Average residential building | Elevation existing building +2ft | $33,239–82,498/building | 2009 | $37,281–92,531/building | [30] [16] P |
| United States | Average residential building | Elevation existing building +4ft | $35,464–87,535/building | 2009 | $39,777–98,180/building | [30] [16] P |
| United States | Average residential building | Elevation existing +6ft | $37,319–91,732/building | 2009 | $41,857–102,888/building | [30] [16] P |
| United States | Average building | Elevation | $19,231–192,000/building | 2015 | $19,481–194,496/building | [29] [31] |
| Bangladesh/Vietnam | Rural house, wooden frame | Stilts bamboo, reinforced concrete | $1250–2500/house | 2015 | $1287–2574/house | [32] P |
| Vietnam | Residential house | Fill sand +2 m | $1500–3000/building | 2014 | $1544–3088/building | [18] P |
| United States | Average building | Re-location | $349,000 | 2015 | $353,537 | [29] |
1 Values calculated using the consumer price index (CPI); 2 P = peer-reviewed.
Table 2.
Cost of dry flood-proofing buildings. The column “measure” shows for which water level measures are designed.
Table 2.
Cost of dry flood-proofing buildings. The column “measure” shows for which water level measures are designed.
| Country | Building Type | Measure | Cost | Year | $2016/CPI 1 | O&M/year $2016 | Reference 2 |
|---|---|---|---|---|---|---|---|
| United States | Residential building | +0.6 m | $8290–13,690 | 2009 | $9298–15,354 | n.a. | [16] P |
| United States | Residential building | +2 m | $12,576–21,126 | 2009 | $14,105–3695 | n.a. | [16] P |
| United Kingdom | Residential building | +0.9 m | $13,000–18,200 | 2008 | $15,299–21,418 | 1–3% | [26] |
| Germany | Average building | +1 m | $732/m length | 2011 | $771/m length | n.a. | [27] P |
| United States | Waste water pump station | +1 m | $45,571 | 2016 | $45,571 | n.a. | [33] |
| Vietnam | Residential building | +1 m | $500–9361 | 2013 | $569–10,667 | n.a. | [18] P |
| Vietnam | Residential building | +1 m | $516/m2 | 2014 | $588/m2 | n.a. | [18] P |
| Bangladesh | Residential building (23 m2) | n.a. | $679–1300 | 2010 | $773–1481 | n.a. | [34] |
1 Values calculated using the 2016 consumer price index (CPI); 2 P = peer-reviewed; n.a. = not available; O&M: operation and maintenance costs.
Table 3.
Cost of wet flood-proofing buildings. The column “measure” shows for which water level measures are designed.
Table 3.
Cost of wet flood-proofing buildings. The column “measure” shows for which water level measures are designed.
| Country | Building Type | Design Requirement | Costs | Year | $2016/CPI 1 | O&M/year $2016 | Reference 2 |
|---|---|---|---|---|---|---|---|
| United States | Basement waterproof | +0.6–2.7 m | $31–184/m2 | 2009 | $35–206/m2 | n.a. | [16] P |
| Germany | Basement waterproof | n.a. | $606/m2 | 2011 | $638/m2 | n.a. | [27] P |
| United States | Residential building | +0.6 m | $2151–4869 | 2009 | $2412–5461 | n.a. | [16] P |
| United States | Residential building | +2.7 m | $8531–19,307 | 2009 | $9561–21,655 | n.a. | [16] P |
| United Kingdom | Residential building | +0.9 m | $8073–18,369 | 2008 | $9054–20,602 | <1% | [26] P |
| United Kingdom | Office | +0.9 m | $14,937–24,895 | 2008 | $20,442–34,070 | <1% | [26] P |
| Germany | Residential (65 m2) | n.a. | $22,237 | 2011 | $23,424 | n.a. | [27] P |
| Brazil | Residential | n.a. | $962 | 2010 | $1024 | n.a. | [35] |
| Vietnam | Residential (60 m2) | +1 m | $248 | 2014 | $273 | n.a. | [18] P |
| Germany | Oil tank | Proofing against buoyancy | $1210/tank | 2011 | $1550 | n.a. | [27] P |
1 Values calculated using the 2016 consumer price index (CPI); 2 P = peer-reviewed; n.a. = not available.
Table 4.
Types of flood-protection measures, investment costs, and maintenance costs.
| Country | Flood Protection | Design Water Level (m) | Unit Cost | Year | $2016/CPI 1 | O&M/year $2016 | Reference 2 |
|---|---|---|---|---|---|---|---|
| Global | Storm surge barrier | <7 m | $0.27–3.6 billion/km | 2012 | $0.32–4.2 billion/km | $0.6–22 million/year | [14] P [16] P |
| The Netherlands | Sea dike | 4–6 m | $18.7–22.4 million/km per m dike raised | 2009 | $20.8–25 million/km per m dike raised | $0.15 million/km per year | [14] P |
| United States | Sea dike | 7 m | $25.6 million/km | 2013 | $26.4 million/km | 0.01–1% | [16] P |
| European cities | Sea dike | varying | $18.6–26.7 million/km per m dike raised | 2012 | $21.8–31.2 million/km per m dike raised | 0.01–1% | [22] P |
| Vietnam | Sea dike | n.a. | $2 million/km | 2013 | $2.3 million/km | n.a. | [36] P |
| Vietnam | Sea dike | 3–5 m | $0.7–1.2 million/km per m dike raised | 2009 | $0.9–1.7 million/km per m dike raised | $0.03 million/km per year | [14] P |
| United States | River dike | 3–6 m | $10.5–16.2 million/km | 2013 | $10.9–16.8 million/km | 0.01–1% | [37] P [38] P |
| Laos | River dike | n.a. | n.a. | n.a | $4.1 million/km | n.a. | [47] |
| Canada | River dike | n.a. | $5 million/km per m dike raised | 2012 | $5.3 million/km per m dike raised | 0.01–1% | [13] P |
| The Netherlands | Rural dike | 4–6 m | $4.5–12.4 million/km per m dike raised | 2009 | $5–14 million/km per m dike raised | $0.15 million/km per year | [14] P |
| Canada | Rural dike | n.a. | $1.8 million/km per m dike raised | 2012 | $1.9 million/km per m dike raised | n.a. | [13] P |
| Philippines/Mozambique | Small earthen dike | 1 m | $0.1–0.2 million/km | 2009 | $0.1–0.2 million/km | n.a. | [36] [37] [39] P |
| Vietnam | Rural dike | n.a. | $0.7–1.2 million/km per m dike raised | 2013 | $1–1.7 million/km per m dike raised | $0.03 million/km per year | [14] P |
| Indonesia | Rural dike | n.a. | n.a | n.a | $3.4–3.9/m3 | n.a. | [48] |
| United States | Deployable floodwall | n.a. | $5.5 million/km | 2015 | $5.6 million/km | $0.26 million/km | [29] P |
| United States | T-Wall | 4 m | $12.5 million/km | 2008 | $13.8 million/km | 0.01–1% | [40]; [16] P [17]P [29] |
| United States | T-Wall | 7.2 m | $26.5 million/km | 2008 | $29.3 million/km | 0.01–1% | [40]; [16] P [17] P |
| Vietnam | Breakwater | (<2 m waterdepth) | $0.13–0.5 million/km | 2015 | $0.14–0.5 million/km | n.a. | [21] P |
| Developed countries | Breakwater | (<2 m waterdepth) | $1.3–4.8 million/km | 2015 | $1.4–6 million/km | n.a. | [21] P |
| United States | Breakwater (Ruble mound) | (17 m deep, 3 m high) | $60 million/km | 2015 | $60.8 million/km | 0.01–1% | [17] P |
| United States | Rip-rap | 2–3 m | $250–666/m | 2012 | $262–699/m | 2–4% | [43] [44] [17] P |
| United States | Rip-rap | n.a. | $80/ton | 2016 | $80/ton | n.a. | [41] |
| United Kingdom | Rip-rap | n.a. | $130–330/m2 | 2016 | $130–330/m2 | n.a. | [49] |
| United States | Sandbag wall | +1 m | - | - | ~$200.000–400.000/km | n.a. | Appendix F |
| United States | (Retrofit-) Bulkhead | n.a. | $10–41 million/km | 2010 | $12.7–51.9 million/km | 0.01–1% | [16] P |
1 Values calculated using the 2016 consumer price index (CPI); 2 P = peer-reviewed; n.a. = not available.
Table 5.
Cost of coastal protection by beaches and dunes.
| Country | Type | Cost | Year | $2016/CPI 1 | O&M/year $2016 | Reference 2 |
|---|---|---|---|---|---|---|
| The Netherlands | Beach nourishment | $3–7.5/m3 | 2009 | $4.3–8.4/m3 | n.a. | [14] P |
| European Union | Beach nourishment | $4.2–8.4/m3 | 2009 | $5.5–11/m3 | n.a. | [15] P |
| United States | Beach nourishment | $4.7–17.6/m3 | 2015 | $4.8–17.8/m3 | n.a. | [17] P |
| South Africa | Beach nourishment | $14.3/m3 | 2009 | $20.6/m3 | n.a. | [15] P |
| Australia | Beach nourishment | $6.4/m3 | 2009 | $7.7/m3 | n.a. | [15] P |
| Vietnam | Beach nourishment | $5.6/m3 | 2015 | $5.8/m3 | n.a. | [53] |
| Australia/United States | Dune Restoration | n.a. | n.a. | $7.636–13.888/ha | $333–2.526/ha | Appendix C; [54] P |
| United States | Dune recovery from oil spill | n.a. | n.a. | $52.000–76.000/ha | $333–2.526/ha | Appendix C; [54] P |
| United States | Beach restoration | $10.5 million/km | 2015 | $10.8 million/km | $0.5 million/km | [29] |
| United States | Beach restoration and groins | $22.1 million/km | 2015 | $22.4 million/ha | $0.55 million/km | [29] |
| United States | Groin | $1.6 million/groin | 2010 | $1.8 million/groin | 0.01–1% | [16] P |
1 Values calculated using the 2016 consumer price index (CPI); 2 P = peer-reviewed; n.a. = not available.
Table 6.
Cost for nature-based solutions for coastal ecosystems.
| Country | Type | Costs | Year | $2016/CPI 1 | O&M/year $2016 | Reference 2 |
|---|---|---|---|---|---|---|
| Developed countries | Wetland restoration | $67,128/ha | 2010 | $84,938/ha | n.a. | [19] P |
| United States | Wetland restoration | $228,647/ha | 2015 | $231,619/ha | $11.027/ha | [29] |
| United States | Marshland creation | $3/m3 | 2007 | $3.5/m3 | n.a. | [37] |
| Global | Salt marshes | $11,100/ha | 2014 | $12,005/ha | n.a. | [21] P |
| Developed | Salt marshes | - | - | $1191/ha | n.a. | [19] P |
| Developing | Salt marshes | - | - | $67,128/ha | n.a. | [19] P |
| Developed | Seagrass | - | - | $106,782/ha | n.a. | [19] P |
| Developed countries | Mangrove restoration | $38,982/ha | 2010 | $49,324/ha | n.a. | [19] P |
| Developing countries | Mangrove restoration | $1191/ha | 2010 | $1506/ha | $7–85/ha | [66] [67] [19] P |
| Global | Mangrove restoration | $1000–3000/ha | 2014 | $1081–3244/ha | n.a. | [21] P |
| Vietnam | Mangrove restoration | $25–200/m | 2014 | $25–200/m | $7–85/ha | [22] P [66] [67] |
| Developed countries | Coral reef restoration | $1,826,651/ha | 2010 | $2,311,296/ha | n.a. | [19] P |
| Global | Coral reef restoration | $1,156,200/ha | 2014 | $1,250,546/ha | n.a. | [21] P |
| Developing countries | Coral reef restoration | $89,269/ha | 2010 | $112,953/ha | n.a. | [19] P |
| Developed | Oyster Reef | $66,821/ha | 2014 | $72,273/ha | n.a. | [19] P |
| United Kingdom | Artificial reef Construction | $30,000–90,000/100 m | 2015 | $30,263–90,789/100 m | n.a. | [68] |
1 CPI = $2016 numbers calculated using the Consumer price index (CPI); 2 P = peer-reviewed; n.a. = not available.
Table 7.
Costs for channel management, and nature-based solutions for riverine systems.
| Country | Type | Cost | Year | $2016/CPI 1 | O&M/year $2016 | Reference 2 |
|---|---|---|---|---|---|---|
| United Kingdom | Mechanical dredging + storage | $36–48/m3 | 2007 | $44–59/m3 | $1.680–51.311/km | [78] |
| United Kingdom | Suction dredging | $10.6/m3 | 2007 | $13/m3 | $1.680–51.311/km | [78] |
| United Kingdom | Bank dredging | $48,400/km | 2007 | $59,805/km | n.a. | [78] |
| The Netherlands | Dredging and transport | $15–18.9/m3 | 2013 | $15.1–19.4/m3 | n.a. | [79] |
| Bangladesh | Dredging | $1.16/m3 | 2007 | $2/m3 | n.a. | [80] |
| United Kingdom | Channel widening | $4–16/m3 | 2010 | $4.5–18/m3 | n.a. | [81] |
| The Netherlands | River widening | $2.64 billion | 2005 | $3.11 billion | n.a. | [82] |
| United Kingdom | Eco engineered bank protection | $44,000–792,000/km | 2007 | $54,000–978,000/km | n.a. | [78] |
| Germany | Detention area (32 million m3) | $3/m3 | 2015 | $3/m3 | n.a. | [83] O |
| Peru | Detention area (373 million m3) | 1/m3 | 2005 | $1.9/m3 | $5 million | [84] |
| Global | Inland wetlands | - | - | $45,752/ha | n.a. | [19] P |
| United States | Inland wetland | - | - | $10,022/ha | $785/ha | [85] |
1 Values calculated using the 2016 consumer price index (CPI); 2 P = peer-reviewed; O = online media; n.a. = not available.
Table 8.
Cost of measures against local inundations.
| Country | Type | Costs | Year | $2016/CPI 1 | O&M/year $2016 | Reference 2 |
|---|---|---|---|---|---|---|
| United Kingdom | Sewer pipe, urban (concrete) | $183–385/m | 2008 | $215–453/m | 0.5–10% | [94] |
| United States | Sewer pipe, urban (metal) | $51–723/m | 2006 | $61–861/m | n.a. | [93] |
| South Africa | Lined channel | $59/m | 2013 | $67/m | ~$10/m | [23] |
| Global | Pumping station | - | - | $0.4–1.7 million/m3/s | n.a. | Appendix D |
| United Kingdom | Retention pond | $13–22/m3 | 2015 | $15–26/m3 | 0.5–10% | [94] |
| United States | Retention area | $17.5–35/m3 | 1999 | $24.8–50.6/m3 | <1% (dry); 3–6% (wet) | [96] [93] |
| United Kingdom | Wetland | $22–26/m3 | 2008 | $26–30/m3 | 0.5–10% | [94] |
| United Kingdom | Green roof | $70–79/m2 | 2008 | $82–93/m2 | 0.5–10% | [94] |
| South Africa | Green roof | $27–33/m2 | 2013 | $32–39/m2 | n.a. | [23] |
| United States | Green roofs | $107–211/m2 | 2010 | $114–225/m2 | $2.3–3.5/m2 | [102] [103] P |
| Singapore | Green roof | $54–120/m2 | 2003 | $74–164/m2 | n.a. | [104] P |
| Phillipines | Green roof | $59–64/m2 | 2001 | $67–73/m2 | n.a. | [105] |
| United States/United Kingdom | Park construction | $1110/m2 | 2008 | $1227/m2 | $0.4–2/m2 | [100] [99] p |
| United Kingdom | Infiltration trench | $65–87/m | 2015 | $77–102/m | 20% | [94] |
| United Kingdom | Concrete storage tank | $395–455/m3 | 2015 | $465–535/m3 | 0.5–10% | [94] |
1 Values calculated using the 2016 consumer price index (CPI); 2 P = peer-reviewed; n.a. = not available.
© 2018 by the author. Licensee MDPI, Basel, Switzerland. This article is an open access article distributed under the terms and conditions of the Creative Commons Attribution (CC BY) license (http://creativecommons.org/licenses/by/4.0/).
Share and Cite
MDPI and ACS Style
Aerts, J.C.J.H. A Review of Cost Estimates for Flood Adaptation. Water 2018, 10, 1646. https://doi.org/10.3390/w10111646
AMA Style
Aerts JCJH. A Review of Cost Estimates for Flood Adaptation. Water. 2018; 10(11):1646. https://doi.org/10.3390/w10111646
Chicago/Turabian StyleAerts, Jeroen C. J. H. 2018. "A Review of Cost Estimates for Flood Adaptation" Water 10, no. 11: 1646. https://doi.org/10.3390/w10111646
Note that from the first issue of 2016, this journal uses article numbers instead of page numbers. See further details here.