Article

Microbiological and Physicochemical Water Quality Assessments of River Water in an Industrial Region of the Northwest Coast of Borneo

1
Department of Animal Sciences and Fishery, Universiti Putra Malaysia Bintulu Campus, Bintulu 97008, Sarawak, Malaysia
2
Department of Crop Sciences, Universiti Putra Malaysia Bintulu Campus, Bintulu 97008, Sarawak, Malaysia
*
Author to whom correspondence should be addressed.
Water 2018, 10(11), 1648; https://doi.org/10.3390/w10111648
Submission received: 23 July 2018 / Revised: 3 October 2018 / Accepted: 6 October 2018 / Published: 14 November 2018
(This article belongs to the Section Water Quality and Contamination)

Abstract

:
Urbanization and ever increasing socioeconomic activities have degraded natural resources globally. This study monitored water quality (WQI) based on physicochemical and microbial qualities of river water in an industrial region northwest coast of Borneo. Microbiological parameters tested included total viable count (TVC), coliform count (TC), faecal coliform count (FC), and Escherichia coli confirmation. Physicochemical constituents evaluated included water temperatures (T), pH, total dissolved solids (TDS), salinity, electrical conductivity (EC), dissolved oxygen (DO), biochemical oxygen demand (BOD), ammoniacal nitrogen (NH3-N), chemical oxygen demand (COD) and total suspended solids (TSS). The mean microbial counts of samples were: TVC (3.9 × 10²–3.0 × 10⁴ cfu mL−1), TC and FC (23–>1600 MPN 100 mL−1) (MPN: the most probable number) and Escherichia coli growth was confirmed. The mean values of pH, TDS, salinity, EC and BOD are significantly different (p < 0.05) between the rivers ranged: pH (5.05 ± 0.03–6.10 ± 0.10), TDS (0.0 ± 0.0–38,600 ± 50 mg L−1), salinity (0.01 ± 0.0–3.07 ± 0.07%), EC (650 ± 25–19,566.67 ± 251.66 µS cm−1), and BOD (0.23 ± 0.10–3.12 ± 0.02 mgO2 L−1). The tested parameters of samples exceeded international limits with the exception of COD and TSS. The WQI of river water tested ranged from 65–73 under class III. Most of the river water was slightly polluted and a potential threat to public health.

1. Introduction

Water is the most crucial natural resource for life and is used virtually for all the human needs on Earth. Human population growth, pollution, expanding industrializing economies, the need for increased agricultural production, water-related disasters, and climate change are some of the key reasons for the shortage of clean water resources across Asia. Many rivers in Asia are highly polluted with domestic waste. Many of the region’s rivers contain up to three times the world average of human waste derived bacteria (measured in faecal coliform, or FC) [1]. Agricultural pollution has resulted in high nutrient levels that cause eutrophication, algal blooms that severely damage freshwater ecosystems and hinder their provision of vital environmental services to humans. Industrial pollution levels as indicated by BOD (biochemical oxygen demand) emissions are highest in some Central and Northeast Asian countries, followed by Southeast Asian countries. Major sources of pollution are industries producing metals, paper and pulp, textiles, and food and beverages. More than 60% of humans in Asia do not have a secure water supply piped to their houses. The Asia-Pacific region is facing acute water shortages and many countries, particularly developing countries, lack reliably clean water. Malaysia, South Korea, Japan, and Singapore, which still have the building capacities to secure water for human use, are listed under level 3 of the National Water Security Index. The region faces ongoing serious water quality problems that contribute to freshwater scarcity, ill-health, and even deaths. Water quality is continuing to decline and insufficient efforts are being made to monitor and remedy pollution.
Prakash [2] estimated that about 71% of the Earth is covered by oceans with 1386 million cubic kilometres volume of water where only about 2% of the earth water supply to human and other activities. The majority of the potable water is obtained from rain-fed rivers [3]. Rivers are vulnerable freshwater systems that support life. They are conduits of vital significance over the world, giving principle water resources to local, industrial, and agricultural purposes [4]. They also function to maintain soil fertility, wildlife conservation, and development of forest resources [5]. They are important transportation routes in some rural parts of Borneo.
Industrialization, urbanization, and ever-increasing economic activity have continued to degrade and pollute natural resources worldwide [6]. The Malaysian Environmental Quality Act (EQA) defines pollution as indirect or direct changes to physical, chemical, or biological components of environments due to release or production of waste harmful to health and safety of citizens, to any living things in water, or against the rules of the act. River pollution seems to be the largest threat to the various living organism. River pollution indirectly influences the tourism, but not as severely as contaminated water being consumed by humans, especially in rural Borneo. Thus, declining river water quality threatens the sustainability of human activities and the environment, and is a major factor contributing to human concerns about the environment. In Borneo, deforestation, lodgings, and plantations have worsened the situation since the early 1970s (See Figure 1). Most pollutants originated from the wastewater drained from factories, livestock farming, plantations, and dwellings. Rapid population growth, land development, urbanization, industrialization, agricultural production, and numerous other socioeconomic activities that occur in and around river basins [7] further threaten the health of river ecosystems. The World Wide Fund (WWF) Malaysia reported urbanization as the main contributor to the increase in water pollution problems in the form of sedimentation, solid waste, rubbish, and organic pollution.
Healthy aquatic ecosystems are supported by physiochemical properties and biological diversity [9]. River quality needs regular monitoring and assessment to prevent any disease outbreak and further deterioration. Bacteriology studies indicate the occurrence of contamination by microorganism overgrowth that may have the potential for dissemination of animal and plant pathogens in water. Enteric pathogens are primarily responsible for the waterborne illnesses [10]. Pollution of water is a serious environmental problem that adversely affects human health and aquatic biodiversity in rivers. Provision of good quality household drinking water is frequently viewed as imperative for enhancing wellbeing [11]. The World Health Organization [12] reported 1.7 billion diarrhoea cases causing 525,000 human deaths in childhood annually. Water quality monitoring is crucial for preventing waterborne illness through implementing proper water treatment and control the practices, and monitoring of their effectiveness [9].
Numerous pollution cases have been reported in Malaysia. The Klang River in Kuala Lumpurand Selangor in Peninsular Malaysia is polluted by the vast industrialization, uncontrolled urbanization and rapid economic development [13]. The Perlis River in Perlis in Northwestern Peninsular Malaysia experiences heavy erosion near its river banks caused by solid rubbish that has been thrown into the river [14]. The Bertam River catchment in Cameron Highlands of peninsular Pahang also gets polluted by the input of organic matter into the river system due to development expansion [15] which may cause severe bio-contamination with bacteria and viruses. Turbulent and slightly muddy waters are becoming more visible in these rivers as a result of uncontrolled release of effluent runoff from the industrial (oil and gas) and agricultural plantation (oil palm) in industrial areas in the Bintulu Division on the northwest coast of Borneo in Sarawak, West Malaysia, together with the excessive upstream activities, such as deforestation and timber logging, along these rivers. This poses a threat to the environment and affect the living creatures in aquatic bioeco-systems. There is very limited, or no published information, on river water quality assessment in the region River-ecology disturbances from urban and agricultural development contribute to an overall decrease the biological integrity of river (road building and construction activities, stream canalization, alteration of the stream’s riparian zone and water pollution) due to any of these factors. Recently, social media reported that the Miri River in the Miri Division to the northeast of Bintulu, continues to be polluted with floating rubbish and industrial discharge, prompting worried residents to appeal to Department of Environment, Sarawak Rivers Board and Miri City Council to act promptly. There is an imperative need to assess the river water quality, and to investigate current and potential river water pollution. The objectives of our research were to provide baseline data of the river water quality status in the Bintulu Division based on physicochemical characteristics and assessments of microbial contamination.

2. Materials and Methods
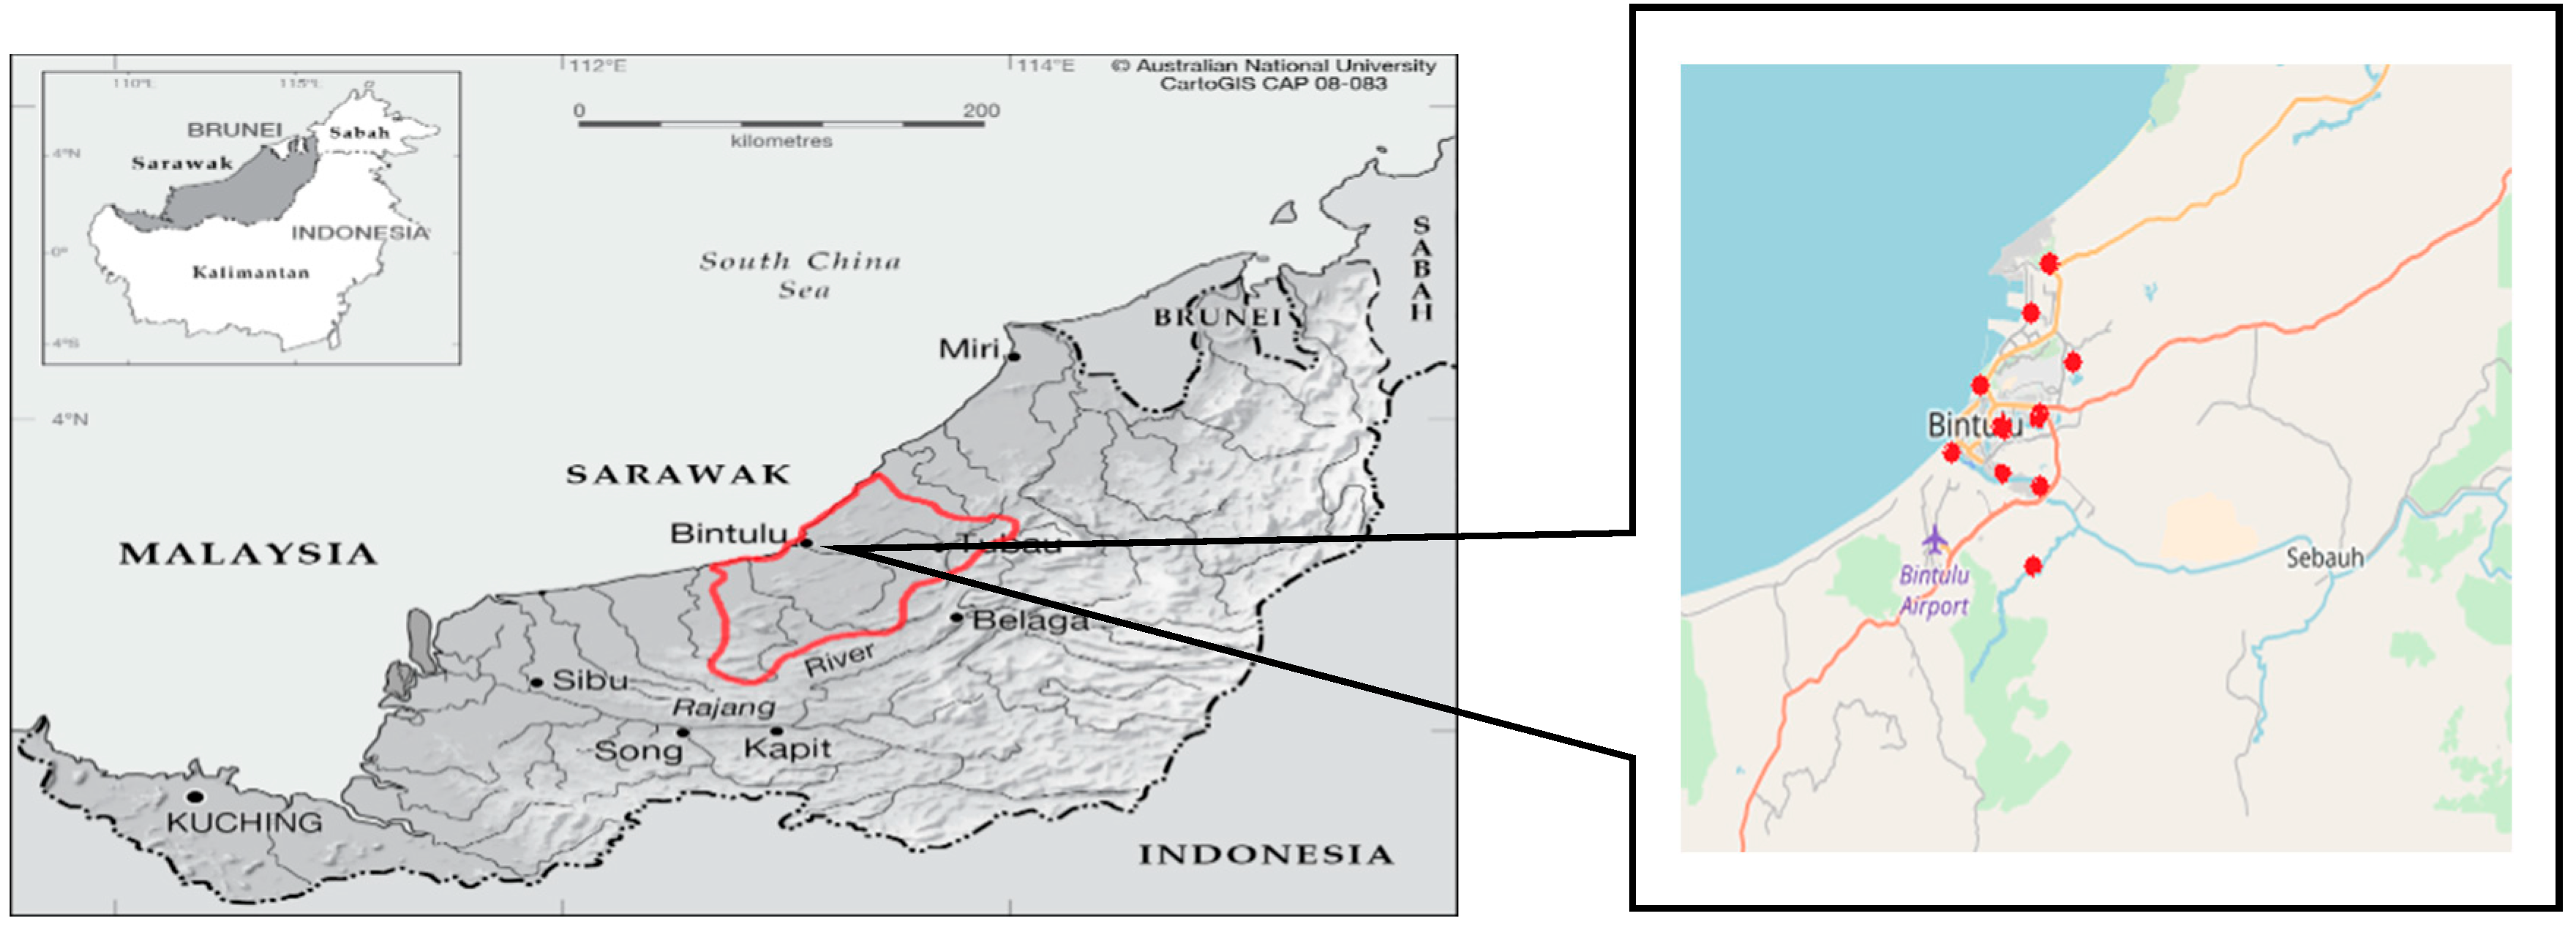
2.1. Study Area

The study was conducted in 10 rivers in the Bintulu Division. These were S1: Kirana (03°25′12 N, 113°08′21 E), S2: Pelan (03°26′86 N, 113°09′46 E), S3: Kemunting (03°17′01 N, 113°05’38 E), S4: Kemena midstream (03°15′18 N, 113°08′87 E), S5: Teknik (03°24′18 N, 113°09′73 E), S6: Sibiu (03°19′27 N, 113°07′03 E), S7: river at Tanjung Batu station (03°20′01 N, 113°04′85 E), S8: Kemena upstream (03°17′89 N, 113°03′41 E), S9: river at Jeti Penambang station (03°16′89 N, 113°04′30 E), and S10: river at UPM station (03°20′22 N, 113°08′01 E). Bintulu is a 7220 square kilometre coastal town (See Figure 2) with a population of about 114,058. It is one of the major oil and gas and agriculture plantation towns in Malaysia. The climate in the region is tropical with alternating rainy (October to March) and dry seasons (April to September). Monthly rainfall ranges from 374–458 mm between October and March. The water bodies receive residential domestic waste together with the drainage from plantations throughout the year. The major proportion of the watersheds are agricultural (e.g., oil palm plantation), industrial (oil and gas) and timber processing factories.

2.2. Water Sampling and Preservation

Water samples were collected at three monthly intervals during the dry season months in June and September, the rainy months in December and March from June 2017 until May 2018. A total of 160 water samples were collected during the study. Samples were collected 10 cm below the water surface by using plastic bottles (500 mL) and BOD bottles in duplicate. The samples were kept on ice for one to two hours for further physicochemical and bacteriological analysis.

2.3. Physicochemical Analysis

The water samples were analysed for 10 physicochemical parameters according to establish procedures [16,17]. In situ data measurements were recorded with a water quality meter (DKK-TOA Corporation, Tokyo, Japan). Parameters assessed included temperature (T), pH, total dissolved solids (TDS), dissolved oxygen (DO), electrical conductivity (EC), and salinity. The biological oxygen demand (BOD), chemical oxygen demand (COD), total suspended solids (TSS) and ammoniacal nitrogen (NH3-N) were further analysed by the laboratory staff at the water quality analysis laboratory, Universiti Putra Malaysia Bintulu Campus.
Water quality status and classification are presented by using the Water Quality Index (WQI). The water quality index was calculated following standards recommended by the National Water Quality Standards for Malaysia. Calculations were done by entering the 10 water quality parameter mean values into the WQI formula. The Sub-Index (SIs) was calculated using the standard expression. The overall WQI of the water was calculated using the following formula:
WQI = [0.22 × SIDO] + [0.19 × SIBOD] + [0.16 × SICOD] + [0.15 × SIAN] + [0.16 × SISR] + [0.12 × SIpH],

2.4. Bacteriological Analysis

2.4.1. Total Viable Count (TVC)

Aliquots of the water samples were used to estimate the TVC based on standard microbiological procedures as described by Ugbaja and Otokunefor [18] with minor modification. The samples were diluted in sterile 0.85% normal saline in 1:9 ratio and plated duplicate on nutrient agar (NA) (Oxoid Ltd., Basingstoke, UK) agar plates and incubated at 25 °C for 24 h. The number of bacterial colonies unit (cfu mL−1) was calculated as the number of colonies per plate multiplied by the dilution factor.

2.4.2. Determination of Total Coliform

Presumptive coliform test: multiple tube fermentation was performed in the university laboratory as described by Shariq et al. [19], with minor modification. Differential medium for the isolation of coliform was Lauryl tryptose broth. Five broth tube series—the first series containing five double-strength broth tubes and the remaining two series comprising 10 single strength broth tubes were inoculated with 10 mL, 1 mL, and 0.1 mL of water (ratio 5:5:5), respectively. Tubes were incubated at 37 °C and observed at 24 and 48 h. Presumptive tests are positive for coliform if acid and gas are produced in Durham tubes.
Confirmed test: Confirmed test was done by transferring a loopful of culture from a positive tube from the presumptive test into a tube of brilliant green lactose bile broth (Oxoid Ltd., Basingstoke, UK) with Durham tubes. The tubes were incubated at 37 °C for 24 to 48 h for total coliform and 44.5 °C for 24 to 48 h for faecal coliform and observed for gas production.
Completed test: A loopful of broth from a positive tube was streaked on eosin methylene blue (EMB) agar plate for pure colonies and incubated at 37 °C for 24 to 48 h. Colonies with a green metallic sheen were observed. The most probable number (MPN) per 100 mL water was tabulated.

2.5. Statistical Analysis

Statistical analysis of the data was conducted using SPSS statistic version 23. All data was subjected to analysis of variance (ANOVA). All differences between the means were compared using Tukey’s multiple range test after a significant F-test at p < 0.05.

3. Results

3.1. Total Viable Count

Mean total bacteria viable counts (cfu mL−1) detected in water samples collected from the 10 river stations are presented (see Table 1). The microbial counts were high and varied with location. The values ranged from the lowest, 3.9 × 10² cfu mL−1 (S7), to the highest, 3.0 × 10⁴ cfu mL−1 (S5), from June 2017 to May 2018. Mean total bacteria counts (log10 cfu mL−1) for sites 6–9 were significantly (p < 0.05) higher than counts from the other sites. The total bacteria counts recorded from all rivers exceeded the WHO standard of 1.0 × 10² cfu mL−1. The WHO standard is the standard acceptable limit of total bacterial counts for drinking water.

3.2. Coliform Count

Total coliform counts from the 10 sampling sites are presented (see Table 2). The lowest coliform count of 23 MPN 100 mL−1 was observed in S9 while the counts exceeded >1600 MPN100 mL−1 in S2, S6, and S8. The results of the total coliform counts for seven river samples (S1–S3, S6–S8, S10) were exceeded the DOE standard for coliform bacteria in water (100 coliform 100 mL−1) of water. All the water samples exceed the WHO standard limit of 3 coliform/100 mL).
Faecal coliform counts for the various sampling sites were presented (See Table 3). Faecal coliform counts ranged from 23 MPN/100 mL obtained from site S5 to >1600 MPN/100 mL in site S2. None of the water samples met the WHO (0 coliform/100 mL) and DOE (10 coliform/100 mL) standard limit. The presence of Escherichia coli growth was further confirmed using EMB agar with green metallic sheen (See Table 4).

3.3. Physicochemical Analysis of Water Samples

Mean values for the physicochemical parameters of river water samples are shown in Table 5. There were significant differences (p < 0.05) for pH, TDS, salinity, electrical conductivity, and BOD. Water from S8 had the highest temperature, pH, TDS, salinity, electrical conductivity, and DO. Water from S10 had the highest BOD. Water from S7, S9, and S5 had the highest ammoniacal nitrogen content, COD, and TSS, respectively. There were no significant differences for mean temperature among rivers, but temperatures of water from S1, S2, and S7–S9 exceeded the WHO standard. Mean pH values ranged from 5.05 ± 0.03 to 6.10 ± 0.10 and were within the acceptable standard. Mean TDS varied significantly, from 100 ± 5 to 38,600 ± 50 mg L−1. Highly significant differences occurred for mean electrical conductivity, with means ranging from 125 ± 1 to 48,250 ± 6 µS cm−1. Samples from sites S2 and S10 were within the standard limit. Variation in salinity among sites was highly significant and means ranged from 0.01 ± 0.0 to 3.07 ± 0.07%. However, samples from site S2, S5, S6, and S10 were within the standard limit. With the exception of S8, none of the DO means were within the standard limit. There were significant differences among BOD means, which ranged from 0.23 ± 0.10 to 3.12 ± 0.02 MgO2 L−1. Samples from S1, S6, S9, and S10 exceeded the standard limit. The mean TDS, salinity of samples collected from S2, S5, and S10 were within the standard limit. Means for ammoniacal nitrogen were within the limit, with the exception S4. The WQI of river water for the 10 rivers ranged from 65 to 73 and are classified under class III (See Table 6 and Table 7), suggesting all the rivers are slightly polluted.

4. Discussion

The water samples collected from site S1–S3 and S5 had higher mean bacterial population counts ranging from 1.6 × 10⁴ to 3.0 × 10⁴ cfu mL−1 than the other six sites (See Table 1). These sites are situated near the schools and housing exposed to various human activities and receive direct waste drainage from housing. Moreover, Bintulu is an industrial town actively producing effluent runoff discharges from oil, gas, and plantation crops, such as palm oil. According to Garcia-Armisen and Servais [22], rivers may be contaminated by human activity such as the release of heavy metals, organic pollutants, pharmaceuticals, faecal, or even pathogenic micro-organisms. Meanwhile, samples collected from sites S6–S9 showed the least mean bacterial population counts ranging from 3.9 × 10² to 6.5 × 10³ cfu mL−1, significantly less than the other river sites, probably due to the geographical location away from any human or animal activities. Evans et al. [23] reported that rivers near coastal areas have generally better-than-average health and increasing population densities place extra pressure on rivers. However, river health has a negative correlation with the intensity of agriculture. Total bacterial counts indicated high organic matter in the river water. Various human, agriculture and industrial activities highly influence the bacteria present in water. Rivers near populated areas receive surface runoff from agricultural and pasture land, animal wastes and effluent runoff discharges from the industrial and plantation will result in bacterial contamination. The health of rivers is worsening, as in the result of waste from mills and factories, housing, and sewage pouring into the rivers almost every day, rendering water unfit for human consumption. The Malaysian Government has taken action to comply with the Environmental Quality (Sewage) Regulations (2009) [24] in order to minimize the discharge or release of sewage into any soil, inland waters or rivers in Malaysia. Thus, the routine total bacteria counts are commonly done to indicate the microbiological quality in rivers. The results of this study showed that the bacterial count of all the rivers were exceeded than the WHO standard [20], indicating that most of the rivers are becoming increasingly polluted as untreated sewage and agricultural runoff discharges into the water which is not safe for consumption before treatments.
The high coliform counts recorded from the river samples indicated the occurrence of faecal contamination [25]. Three of the sampling sites of the water sources complied with DOE standard [21] while none of the sites comply with WHO standards [20] for coliform in water (see Table 2). Most of the samples collected showed ≥1600 MPN 100 mL−1. The result is in agreement with Shittu et al. [26] and Sanders et al. [25] who reported high coliform counts of 800 to 1600 MPN 100 mL−1 in their studies in Nigeria and California, respectively. The water samples that contain coliform were confirmed for the presence of faecal coliforms and E. coli confirmation test (See Table 2 and Table 3). The faecal counts were generally high, especially for sites S2, S7, and S9 (≥1600 MPN 100 mL−1), which indicated the possibility of contamination with human or animal waste, and also pathogenic bacteria. This was confirmed as faecal contamination as the E. coli was present as the major indicator of water pollution in the area (See Table 3). Water from the S9 site had a 23 MPN 100 mL−1 coliform count but 1600 MPN 100 mL−1 faecal count (See Table 2 and Table 3). Martin et al. [27] stated that the presence of total coliforms may or may not indicate faecal contamination. A study by Ekhaise and Omoigberale [9] indicated that 19% of the bacteria associated with the faecal pollution was E. coli, which are the predominant transport for the dissemination of resistance genes and vectors due to its abundance in water ecosystems [28]. Urban and rural areas are nonpoint sources of faecal coliform bacteria mainly due to avian faeces, rodents, wild animals and even domestic animals [29]. According to Cabral [30], the coliform bacteria may contaminate the surface and recreational waters in most developing countries. All of the water sources tested in this study are exceeded the DOE [21] and WHO [20] standard for either total or faecal coliform. Sites S4 and S5 had better water quality because of lower coliform and faecal count. Most rivers beside industrial factories are highly exposed to sewage and effluent released from industrial activities and the rivers are used for transportation. Prakash [2] found that an industrial waste seems to be the main source of pollutant, especially in developing countries like Malaysia. Urbanization leads to overpopulated growth which is the main contributor to water pollution cases globally as reported by Evans et al. [23]. The organic waste discharged from factories may contain a variety of chemical substances, as in raw sewage, interrupting the ecosystem food chain of the river and expected to be the reason for high MPN indices. Thus, special care is required for water-based recreational activities as pollutants may lead to gastrointestinal infections, diarrhoea, dysentery, typhoid fever, and other forms of infections [9]. Thus, chemical and organic waste from factories must be treated before being discharged to the rivers.
Growth of microorganisms in water is highly influenced by environmental factors [31]. Thus, the physicochemical properties and bacterial count are related. Analytical analysis showed significant differences in mean pH, TDS, salinity, EC, and BOD among the 10 rivers tested (See Table 5). Small fluctuations in river water temperature usually depend on the sampling season, time, and temperature of effluents drained from industries entering the river [32]. Samples from site S8 exceeded the international limit for the highest pH which attributed to the accumulation of resident flora particles and dissolved substances during the dry season [33]. All of these dissolved substances may change the water pH by affecting the biochemical cycle process. The mean TDS values of seven sites exceeded the standard limit of 500 mg L−1 (see Table 5) may reduce the water clarity, shelter pathogenic microorganisms [34], and lead to pollution. The conductivity of water is an important parameter because it measures the ability of an aqueous medium to carry an electric current. High conductivity tested in water may result from increased of decomposition of organic materials [35], and inorganic dissolved solids [36]. None of the samples collected, aside from samples from S8, fell within the stipulated international limit. DO measurement is an important indicator of biological health and purity state of the river. The decrease in the DO content (<5) could be the result of high microbial load. Thus, more oxygen is utilized in the bacterial decomposition process of organic matter. BOD is the measure of the amount of oxygen in the water that is required by aerobic organisms. Low BOD values for rivers S2, S4, S5, S7, and S8 indicated that these rivers, with low nutrient levels and high oxygen content, are not polluted. All samples collected from these rivers were within the standard limit for COD and TSS. This indicated that no organic pollution of the surface water. Ammonia acts as the pollution indicator for excessive usage of ammonia, especially fertilizers [36]. NH3-N content in most water samples were over 0.1 mg L−1, indicating that most rivers were very dangerous and harmful to aquatic life in the river water. Most of the variation in the physicochemical results are in agreement with the previous undertaken by Ekhaise et al. in Nigeria [9] and Sanders et al. in California [25]. All of the tested rivers were classified under class III, indicating slight levels of pollution. The rivers require extensive treatment for human consumption and aquaculture activities but are safe for livestock drinking [21].

5. Conclusions

Water quality of 10 rivers in the Bintulu Division of Sarawak, Borneo was classified as Class III within the Malaysian Water Quality Index, indicating of slightly polluted water quality. There were significant differences in the physicochemical parameters pH, TDS, salinity, EC, and BOD among the rivers. Many factors influence fluctuations in river water quality. The present study provided a baseline water quality status of the rivers in Borneo and future water quality assessments. Uncontrolled increases in industrial and plantation development near the water bodies may worsen the physicochemical and microbiological status of rivers. If these scenarios continue, pollution may worsen and pose potential health risks in the future.

Author Contributions

Conceptualization: S.S.L. and J.I.; data curation: W.W. and A.D.; formal analysis: S.S.L., J.I.; methodology: S.S.L. and J.I.; supervision: S.S.L. and J.I.; writing—original draft preparation: S.S.L.; writing—review and editing: S.S.L., N.A.D., and S.R.S.

Funding

This research was funded by Grant Putra IPM, grant number GP-IPM/2017/9533000, and the APC was funded by research management centre of Univerisiti Putra Malaysia.

Acknowledgments

We are grateful to the supporting laboratory staff of water quality analysis laboratory and microbiology laboratory, Universiti Putra Malaysia Bintulu Campus where laboratory analyses were conducted. G. Andrew C. Beattie (University of Western Sydney, Australia) and Abu Hena (Universiti Putra Malaysia Bintulu Campus, Malaysia) are thanked for proofreading of the draft of the manuscript.

Conflicts of Interest

The authors declare that they have no conflict of interests on this work.

References

  1. Economic and Social Commission for Asia and the Pacific; State of the Environment in Asia and Pacific 2000. Available online: https://www.unescap.org/resources/state-environment-asia-and-pacific-2000 (accessed on 15 September 2018).
  2. Prakash, A.V. Water Quality Study on Rivers in Sarawak. Bachelor’s Thesis, University Malaysia Sarawak, Samarahan, Malaysia, 2005. [Google Scholar]
  3. Mamun, A.; Zainudin, Z. Sustainable river water quality management in Malaysia. IIUM Eng. J. 2013, 14, 29–42. [Google Scholar]
  4. Farah, N.; Zia, M.A.; Rehman, K.; Sheikh, M. Quality characteristics and treatment of drinking water of Faisalabad city. Int. J. Agric. Biol. 2002, 3, 347–349. [Google Scholar]
  5. Suthar, S.; Nema, A.K.; Chabukdhara, M.; Gupta, S.K. Assessment of metals in water and sediments of Hindon River, India: Impact of industrial and urban discharges. J. Hazard. Mater. 2009, 171, 1088–1095. [Google Scholar] [CrossRef] [PubMed]
  6. Nallathiga, R. Institutional Intervention in River Water Management: The Study of Yamuna River Sub-Basin in India. SSRN Electron. J. 2011. Available online: https://doi.org/10.2139/ssrn.2037734 (accessed on 15 September 2018). [CrossRef]
  7. Naithani, R.; Pandel, I.P. Comparative analysis of the trends in river water quality parameters: A case study of the Yamuna River. Int. J. Sci. 2015, 4, 1212–1221. [Google Scholar]
  8. Meijaard, E.; Sheil, D. Oil-Palm Plantations in the Context of Biodiversity Conservation. In Encyclopedia of Biodiversity; Levin, S.A., Ed.; Academic Press: Waltham, MA, USA, 2016; pp. 600–612. [Google Scholar]
  9. Ekhaise, F.O.; Omoigberale, M.O. Bacteriological and physicochemical qualities of Ebutte River in Ebutte Community, Uhunmwonde local government area, Edo State, Nigeria. J. Appl. Sci. Environ. Manag. 2011, 15, 663–673. [Google Scholar]
  10. Schlosser, D.G. Bitton, Wastewater Microbiology. X + 478 S., 227 Abb., 81 Tab. New York—Chichester- Brisbane—Toronto—Singapore 1994. Wiley-Liss. ISBN: 0-471-30985-0. J. Basic Microbiol. 1995, 35, 216. Available online: https://doi.org/10.1002/jobm.3620350403 (accessed on 15 September 2018). [CrossRef]
  11. Moyo, S.; Wright, J.; Ndamba, J.; Gundry, S. Realising the maximum health benefits from water quality improvements in the home: A case from Zaka district, Zimbabwe. Phys. Chem. Earth 2004, 29, 1295–1299. [Google Scholar] [CrossRef]
  12. World Health Organization (WHO). Diarrhoeal Disease. 2018. Available online: http://www.who.int/news-room/fact-sheets/detail/diarrhoeal-disease (accessed on 22 July 2018).
  13. Fahmi, M.; Nasir, M.; Samsudin, M.S.; Mohamad, I.; Roshide, M.; Awaluddin, A.; Ramli, N. River water quality modeling using combined principle component analysis (PCA) and multiple linear regressions (MLR): A case study at Klang River, Malaysia. World Appl. Sci. J. 2011, 14, 73–82. [Google Scholar]
  14. Samsudin, M.S.; Juahir, H.; Zain, S.M.; Adnan, N.H. Surface river water quality interpretation using environmetric techniques: Case study at Perlis River Basin, Malaysia. J. Environ. Prot. 2011, 1, 1–8. [Google Scholar]
  15. Eisakhani, M.; Pauzi, A.; Karim, O.; Malakahmad, A. Investigation and management of water pollution sources in Cameron Highlands, Malaysia. In Management of Natural Resources, Sustainable Development and Ecological Hazards III; Brebbia, C.A., Zubir, S.S., Eds.; WIT Press: Ashurst, UK, 2011; Volume 148, pp. 231–241. [Google Scholar]
  16. The American Public Health Association (APHA); The American Water Works Association (AWWA); The Water Environment Federation (WEF). Standard Methods for the Examination of Water and Wastewater; APHA: Washington, DC, USA, 2005. [Google Scholar]
  17. Department of Environment (DOE). Malaysia Environmental Quality Report 2017; Department of Environment, Ministry of Natural Resources and Environment Malaysia: Kuala Lumpur, Malaysia, 2017; p. 65.
  18. Ugbaja, V.C.; Otokunefor, T.V. Bacteriological and physicochemical analysis of groundwater in selected communities in Obio Akpor, Rivers State, Nigeria. Br. Microbiol. Res. J. 2015, 7, 235–242. [Google Scholar] [CrossRef]
  19. Shariq, M.; Singh, S.; Farooq, U.; Dhariyal, K.K.; Singh, K.; Kaur, N. Presumptive coliform count in water sample collected from different sites of a university, Moradabad, Uttar Pradesh, India. IJSS 2016, 3, 91–96. [Google Scholar]
  20. World Health Organization (WHO). Guidelines for Drinking—Water Quality, 2nd ed.; World Health Organization (WHO): Geneva, Switzerland, 1998; Volume 2, Available online: http://www.who.int/water_sanitation_health/dwq/2edaddvol2a.pdf (accessed on 1 June 2017).
  21. Department of Environment (DOE). National Water Quality Standards for Malaysia. Available online: http://www.wepa-db.net/policies/law/malaysia/eq_surface.htm (accessed on 1 May 2017).
  22. Garcia-Armisen, T.; Servais, P. Enumeration of viable E. coli in rivers and wastewaters by fluorescent in situ hybridization. J. Microbiol. Methods 2004, 58, 269–279. [Google Scholar] [CrossRef] [PubMed]
  23. Evans, A.E.V.; Hanjra, M.A.; Jiang, Y.; Qadir, M.; Drechsel, P. Water Quality: Assessment of the Current Situation in Asia. Int. J. Water Resour. Dev. 2012, 28, 195–216. [Google Scholar] [CrossRef]
  24. Environmental Quality (Sewage) Regulations. 2009. Available online: https://www.doe.gov.my/portalv1/wpcontent/uploads/2015/01/Environmental_Quality_Sewage_Regulations_2009_-_P.U.A_432-2009.pdf (accessed on 15 September 2017).
  25. Sanders, E.; Yuan, Y.; Pitchford, A. Fecal coliform and E. coli concentrations in effluent-dominated streams of the upper Santa Cruz Watershed. Water 2013, 5, 243–261. [Google Scholar] [CrossRef]
  26. Shittu, O.B.; Olaitan, J.O.; Amusa, T.S. Physico-chemical and bacteriological analysis of water used for drinking and swimming purpose. Afr. J. Biol. Res. 2008, 11, 285–290. [Google Scholar]
  27. Martin, N.H.; Trmčić, A.; Hsieh, T.-H.; Boor, K.J.; Wiedmann, M. The evolving role of coliforms as indicators of unhygienic processing conditions in dairy foods. Front. Microbiol. 2016, 7, 1549. [Google Scholar] [CrossRef] [PubMed]
  28. Alpay-Karaoglu, S.; Ozgumus, O.B.; Sevim, E.; Kolayli, F.; Sevim, A.; Yesilgil, P. Investigation of antibiotic resistance profile and TEM-type β-lactamase gene carriage of ampicillin-resistant Escherichia coli strains isolated from drinking water. Ann. Microbiol. 2007, 57, 281–288. [Google Scholar] [CrossRef]
  29. Whitlock, J.E.; Jones, D.T.; Harwood, V.J. Identification of the sources of fecal coliforms in an urban watershed using antibiotic resistance analysis. Water Res. 2002, 36, 4273–4282. [Google Scholar] [CrossRef]
  30. Cabral, J.P.S. Water Microbiology. Bacterial Pathogens and Water. Int. J. Environ. Res. Public Health 2010, 7, 3657–3703. [Google Scholar] [CrossRef] [PubMed] [Green Version]
  31. Fister, S.; Robben, C.; Witte, A.K.; Schoder, D.; Wagner, M.; Rossmanith, P. Influence of environmental factors on phage–bacteria interaction and on the efficacy and infectivity of phage P100. Front. Microbiol. 2016, 7, 1152. [Google Scholar] [CrossRef] [PubMed]
  32. Ahipathy, M.V.; Puttaiah, E.T. Ecological characteristics of Vrishabhavathy River in Bangalore (India). Environ. Geol. 2006, 49, 1217–1222. [Google Scholar] [CrossRef]
  33. Bisi-Johnson, M.A.; Adediran, K.A.; Akinola, S.A.; Popoola, E.O.; Okoh, A.I. Comparative physicochemical and microbiological qualities of source and stored household waters in some selected communities in Southwestern Nigeria. Sustainability 2017, 9, 454. [Google Scholar] [CrossRef]
  34. U.S. Environmental Protection Agency (EPA). Volunteer Lake Monitoring: A Methods Manual; EPA440/4-91-002; Office of Water US Environ-Mental Protection Agency: Washington, DC, USA, 1999; p. 65.
  35. Abida, B.; Harikrishna. Study on the quality of water in some streams of Cauvery River. Eur. J. Chem. 2008, 5, 377–384. [Google Scholar] [CrossRef]
  36. Gandaseca, S.; Rosli, N.; Ngayop, J.; Arianto, C.I. Status of water quality based on the physico-chemical assessment on river water at wildlife sanctuary Sibuti mangrove forest, Miri Sarawak. Am. J. Environ. Sci. 2011, 7, 269–275. [Google Scholar] [CrossRef]
Figure 1. (A) Total deforestation (18.7 Mha) and remaining old-growth and selectively-logged forest in December 2015; (B) The expansion of industrial oil-palm plantations (7.8 Mha); (C) The expansion of industrial pulpwood plantations (1.3 Mha) in Borneo [8].
Water 10 01648 g001
Figure 2. Location of study area: Bintulu Division, Sarawak, West Malaysia Borneo (shown in red dots).
Water 10 01648 g002
Table 1. Mean values of total bacteria count (cfu mL−1) of 10 river stations in Bintulu, Sarawak, Borneo.
Study SitesMean TVC
(cfu mL−1)
Mean TVC
(log10 cfu mL−1)
WHO Standard
(cfu mL−1) [20]
S12.6 × 1044.42 ± 0.01 b1.0 × 102
S21.6 × 1044.20 ± 0.09 b1.0 × 102
S31.94 × 1044.29 ± 0.02 b1.0 × 102
S41.75 × 1034.24 ± 0.07 b1.0 × 102
S53.0 × 1044.48 ± 0.00 b1.0 × 102
S65.25 × 1023.68 ± 0.20 a1.0 × 102
S73.9 × 1023.59 ± 0.06 a1.0 × 102
S86.5 × 1033.74 ± 0.26 a1.0 × 102
S96.2 × 1033.80 ± 0.01 a1.0 × 102
S101.94 × 1034.25 ± 0.18 b1.0 × 102
Legends: S1–S10—River sampling sites; WHO—World Health Organization; ab Means in the same column with the same letter superscript are not significantly different at the 5% level.
Table 2. The most probable number (MPN 100 mL−1) table for (5 tubes methods) presumptive test analysis of the total coliform bacteria in 10 rivers in Bintulu, Sarawak, Borneo.
Study SitesPositive Tubes in Sample Concentration
(10 mL, 1 mL and 0.1 mL) *
MPN Index 100 mL−195% Confidence LimitDOE Standard
(Count 100 mL−1) [20]
WHO Standard
(Count 100 mL−1) [20]
LowHigh
S15-5-4160040046001003
S25-5-5>1600700-1003
S35-5-4160040046001003
S45-2-170221701003
S55-1-146141201003
S65-5-5>1600700-1003
S75-5-4160040046001003
S85-5-5>1600700-1003
S95-0-0236.8701003
S105-5-4160040046001003
Legends: S1–S10—River sampling sites; WHO—World Health Organization; DOE—Department of Environment, Malaysia; * the data represents number of positive growth.
Table 3. The most probable number (MPN 100 mL−1) table for (five-tubes methods) confirmed the test analysis of the faecal coliform bacteria in ten rivers in Bintulu, Sarawak, Borneo.
Study SitesPositive Tubes in Sample Concentration
(10 mL, 1 mL and 0.1 mL) *
MPN Index 100 mL−195% Confidence LimitDOE Standard
(Count 100 mL−1) [21]
WHO Standard
(Count 100 mL−1) [20]
LowHigh
S15-3-318070400100
S25-5-5>1600700-100
S35-5-39202202600100
S45-2-17022170100
S55-0-0236.870100
S65-5-024070710100
S75-5-416004004600100
S85-3-318070400100
S95-5-416004004600100
S105-0-0236.870100
Legends: S1–S10—River sampling sites; WHO—World Health Organization; DOE—Department of Environment, Malaysia; * the data represents number of positive growth.
Table 4. Completed test for measuring the growth of Escherichia coli on EMB agar medium.
Study SitesSample Concentration
10 mL1 mL0.1 mL
S1+++++++++++
S2+++++++++++++++
S3+++++++++++++
S4++++++++
S5+++++--
S6++++++++++-
S7++++++++++++++
S8+++++++++++
S9++++++++++++++
S10+++++--
Legends: S1–S10—River sampling sites; + number tubes shows positive growth of Escherichia coli isolated from confirmed test.
Table 5. Descriptive analysis for the physicochemical parameters of rivers in Bintulu, Sarawak, Borneo.
ParametersDOE Standard [20]WHO Standard [19]Study Sites
S1S2S3S4S5S6S7S8S9S10Fp
T, °C-25-3031.30 ± 0.20 e31.10 ± 0.10 de29.40 ± 0.10 b29.40 ± 0.23 b28.90 ± 0.10 ab29.10 ± 0.06 ab30.30 ± 0.30 c31.40 ± 0.20 e30.6 ± 0.30 cd28.60 ± 0.26 a81.40.42
pH6.5–8.56.5-8.55.90 ± 0.56 cd5.85 ± 0.10 bcd5.94 ± 0.04 d5.80 ± 0.20 bcd5.05 ± 0.03 a5.82 ± 0.02 bcd5.96 ± 0.03 d6.10 ± 0.10 d5.33 ± 0.03 ab5.35 ± 0.05 abc9.330.00
TDS, mg L−15005008100 ± 600 c100 ± 5 a14,700 ± 100 e12,800 ± 200 d2960 ± 300 a5500 ± 500 b15,500 ± 50 f38,600 ± 50 h31,100 ± 100 g100.67 ± 3.06 a5766.450.03
Salinity, %0.50.50.64 ± 0.02 e0.01 ± 0.0 b1.17 ± 0.02 g1.02 ± 0.02 f0.24 ± 0.0 c0.44 ± 0.01 d1.23 ± 0.03 g3.07 ± 0.07 i2.47 ± 0.03 h0.01 ± 0.0 a3699.880.00
EC, µS cm−11000100010,125 ± 25 d125 ± 1 a18,375 ± 30.14 f16,000 ± 10 e3700 ± 10 b6875 ± 4 c19,375 ± 5 g48,250 ± 6 i38,875 ± 10 h125.83 ± 0.03 a4103.7430.00
DO, mg L−1≥5≥54.04 ± 0.60 bc4.48 ± 0.10 c4.48 ± 0.08 c4.10 ± 0.08 bc3.59 ± 0.48 b4.67 ± 0.07 c4.22 ± 0.15 bc6.04 ± 0.04 d2.18 ± 0.10 a4.53 ± 0.50 c50.980.07
BOD, mgO2 L−1≤1-1.88 ± 0.11 ef0.99 ± 0.17 cd2.32 ± 0.02 f0.29 ± 0.09 ab0.23 ± 0.10 a1.29 ± 0.09 de0.41 ± 0.10 abc0.94 ± 0.01 bcd1.76 ± 0.71 ef3.12 ± 0.02 g46.830.02
NH3-N, mg L−10.10.10.30 ± 0.20 ab0.20 ± 0.05 ab0.25 ± 0.05 ab0.10 ± 0.02 a0.30 ± 0.10 ab0.30 ± 0.10 ab0.40 ± 0.09 b0.30 ± 0.02 ab0.28 ± 0.08 ab0.35 ± 0.05 ab2.460.23
COD, mg L−1≤10≤106.05 ± 0.29 ab5.47 ± 2.59 ab6.62 ± 1.44 ab4.32 ± 1.44 a4.32 ± 1.15 a3.03 ± 0.15 a5.47 ± 0.29 ab3.03 ± 0.15 a9.36 ± 2.74 b8.93 ± 0.29 b7.170.10
TSS, mg L−1≤25≤250.007 ± 0.002 ab0.004 ± 0.001 ab0.008 ± 0.004 ab0.003 ± 0.001 a0.017 ± 0.015 ab0.013 ± 0.008 ab0.020 ± 0.002 b0.015 ± 0.006 ab0.007 ± 0.004 ab0.006 ± 0.002 ab3.010.05
Legends: S1–S10—river sampling sites; T—temperature; TDS—total dissolved solid; EC—electrical conductivity; DO—dissolved oxygen; BOD—biochemical oxygen demand; NH3-N—ammoniacal nitrogen; COD—chemical oxygen demand; TSS—total suspended solid; WHO—World Health Organization; DOE—Department of Environment, Malaysia; ab Means in the same column with the same letter superscript are not significantly different at 5% level; F—F statistic; pp value.
Table 6. WQI and class water of Bintulu, Sarawak rivers in Borneo.
ParametersStudy SitesDOE Standard [21]
S1S2S3S4S5S6S7S8S9S10
WQI6971697367707071666581–100
ClassIIIIIIIIIIIIIIIIIIIIIIIIIIIIIII
StatusSlightly pollutedClean
Legends: S1–S10—river sampling sites; WQI—Water Quality Index; DOE—Department of Environment, Malaysia.
Table 7. DOE water quality classification based on WQI.
Water Quality Index (WQI)Class StatusStatusUses
81–100I and IIClean
  • Conservation of natural environment.
  • Water Supply I—Practically no treatment necessary.
  • Fishery I and II—Very sensitive aquatic species.
60–80IIISlightly polluted
  • Water Supply III—Extensive treatment required.
  • Fishery III—Common of economic value and tolerant species; livestock drinking.
0–59IVPolluted
  • Irrigation

