Changes in Magnitude and Timing of High Flows in Large Rain-Dominated Watersheds in the Cold Region of North-Eastern China


Department of Forestry, School of Forestry, Northeast Forestry University, Harbin 150040, China
*
Author to whom correspondence should be addressed.
Water 2018, 10(11), 1658; https://doi.org/10.3390/w10111658
Submission received: 8 October 2018
/
Revised: 10 November 2018
/
Accepted: 11 November 2018
/
Published: 14 November 2018
(This article belongs to the Section Hydrology)
Abstract
:Global warming-induced earlier streamflow timing and changes in flood risk have been widely reported in snow-dominated regions where the land surface hydrology is dominated by winter snow accumulation and spring melt. However, impacts of climate warming on flow regime in the cold regions dominated by monsoonal rain during the warm season have received little attention in the literature. In this study, the responses of magnitude and timing of high flows to climate warming were analyzed by using a paired-year approach based on the hydrometeorological data of two large rain-dominated watersheds in the cold region of north-eastern China in the past approximately four decades (1975–2013). The results indicated that high flow timings of two watersheds both exhibited significant negative trends associated with the significant increasing trends in air temperature and spring rain over the study period. The results from paired-year approach indicated average timings of high flows in the warming years were significantly advanced by 21 and 25 days in Upper Huma River (UHR) and Ganhe River (GR) watersheds, respectively, which was at least partly attributed to the more frequent occurrence of spring snowmelt/rain generated high flows because of climate warming-induced earlier snowmelt and increased spring rain. The average magnitude of high flows decreased by 13.7% and 14.0% in the warming years compared with those in the reference years in the UHR and GR watersheds, respectively. These findings have implications for water resource management in the study region and similar rain-dominated cold regions across the globe.

1. Introduction
Nature flow regimes pertaining to the characteristic pattern of a river’s flow quantity, timing, and variability create and maintain the dynamics of in-channel and floodplain habitats that play a critical role in sustaining native biodiversity and ecosystem integrity in rivers [1,2]. However, there are a large number of studies showing that climate warming has the potential to modify nature flow regimes [3,4], especially in the snow-dominated regions where the water supply mainly depends on the seasonal snowpack that was likely to be materially affected by global warming in the past half century [5,6]. There is evidence of reductions in snow cover extent and earlier snowmelt in spring in many part of the northern hemisphere [7], and the changing snowfall pattern has in turn affected the spatial and temporal distribution of streamflow over much of the global land area poleward of about 40 latitudes [4,8,9].
It is believed that climate warming results in less snow accumulation in winter and earlier snowmelt in spring [5], which will in turn lead to an advance in the timing of peak spring runoff and the increased fractions of annual flow occurring earlier in the water year [10,11]. For instance, changes towards earlier streamflow timing due to climate warming were found in snowmelt-dominated regions in the western North America [12], in eastern North America [13], in Spain [14] and in Chile [15]. Also, changes in flood risk caused by climate warming have been reported around the globe [16,17,18,19]. However, to our knowledge, only a few studies consider how flow regime responds to climate warming in rain-dominated regions. For example, Ryberg, et al. [20] divided the annual peaks into two populations including snowmelt/spring rain generated peaks and summer/fall rain generated peaks; they found that the timing of snowmelt/spring peaks in three regions in the northern part of the study area is earlier by 8.7–14.3 days, while the timing of summer/fall peaks in only one region showed a statistically significant positive trend and later. Cortés, Vargas and Mcphee [15] identified a negative trend in the water year hydrograph center of timing for rivers with all types of regime including snowmelt dominated, mixed and rainfall-dominated south of 33 °S in Chile while the detected trends were consistent only with trends in precipitation, as rivers that showed a high correlation to temperature do not show any trend. Although a few studies conducted in rain-dominated regions, investigations on the impacts of climate warming on flow regimes in the rain-dominated cold regions, especially for the region that is dominated by the monsoonal rain during warm season, are rare.
This paper seeks to detect high flow regime change signals in historical streamflow records and their links with climatic variables in the cold region of north-eastern China, which is dominated by the south-east Monsoon from the Pacific Ocean in summer. The annual streamflow hydrograph in the study region is characterized by low flows during winters when precipitation is temporarily stored in the seasonal snowpack and the rivers are covered by ice [21], and high flows during spring, when snow melts, and summer, when rainfall peaks [22]. Usually, annual peak runoff (the greatest flow in a stream recorded in a given year) occurs associated with peak rainfall in summer. However, annual peak runoff may also happen in spring associated with the occurrence of heavy rainfall-on-snow event (ROS), because snowmelt provides additional inputs of water for runoff and the snowmelt process is accelerated during ROS [23]. The pronounced warming trend in north-eastern China over the last few decades [24,25] was hypothesized to result in not only earlier snowmelt but also more precipitation falling as rainfall in spring, and consequently leads to the more frequent occurrence of earlier ROS, which would definitely affect high flow timing and magnitude in the study region. Understanding responses of high flow regimes to climate warming in the study of a rain-dominated cold region have important implications for water resource management, especially for flood forecasting.
In this study, the long-term daily hydrological and climatic data from two large rain-dominated watersheds including the Upper Huma River (UHR) watershed and Ganhe River (GR) watershed in the Da Hinggan Mountains of north-eastern China were analyzed, and the main objectives were to: (1) detect any significant trends in magnitude and timing of high flows, and climatic variables over the past four decades; (2) determine any correlations between the long-term high flow variables and climatic metrics; and (3) to quantify the responses of magnitude and timing of high flows to climate warming. These analyses will provide a better understanding of how high flow regimes respond to climate warming and help identify if flow regime shifts observed in snow-dominated regions also happened in rain-dominant cold regions.
2. Materials and Methods
2.1. Watersheds Description
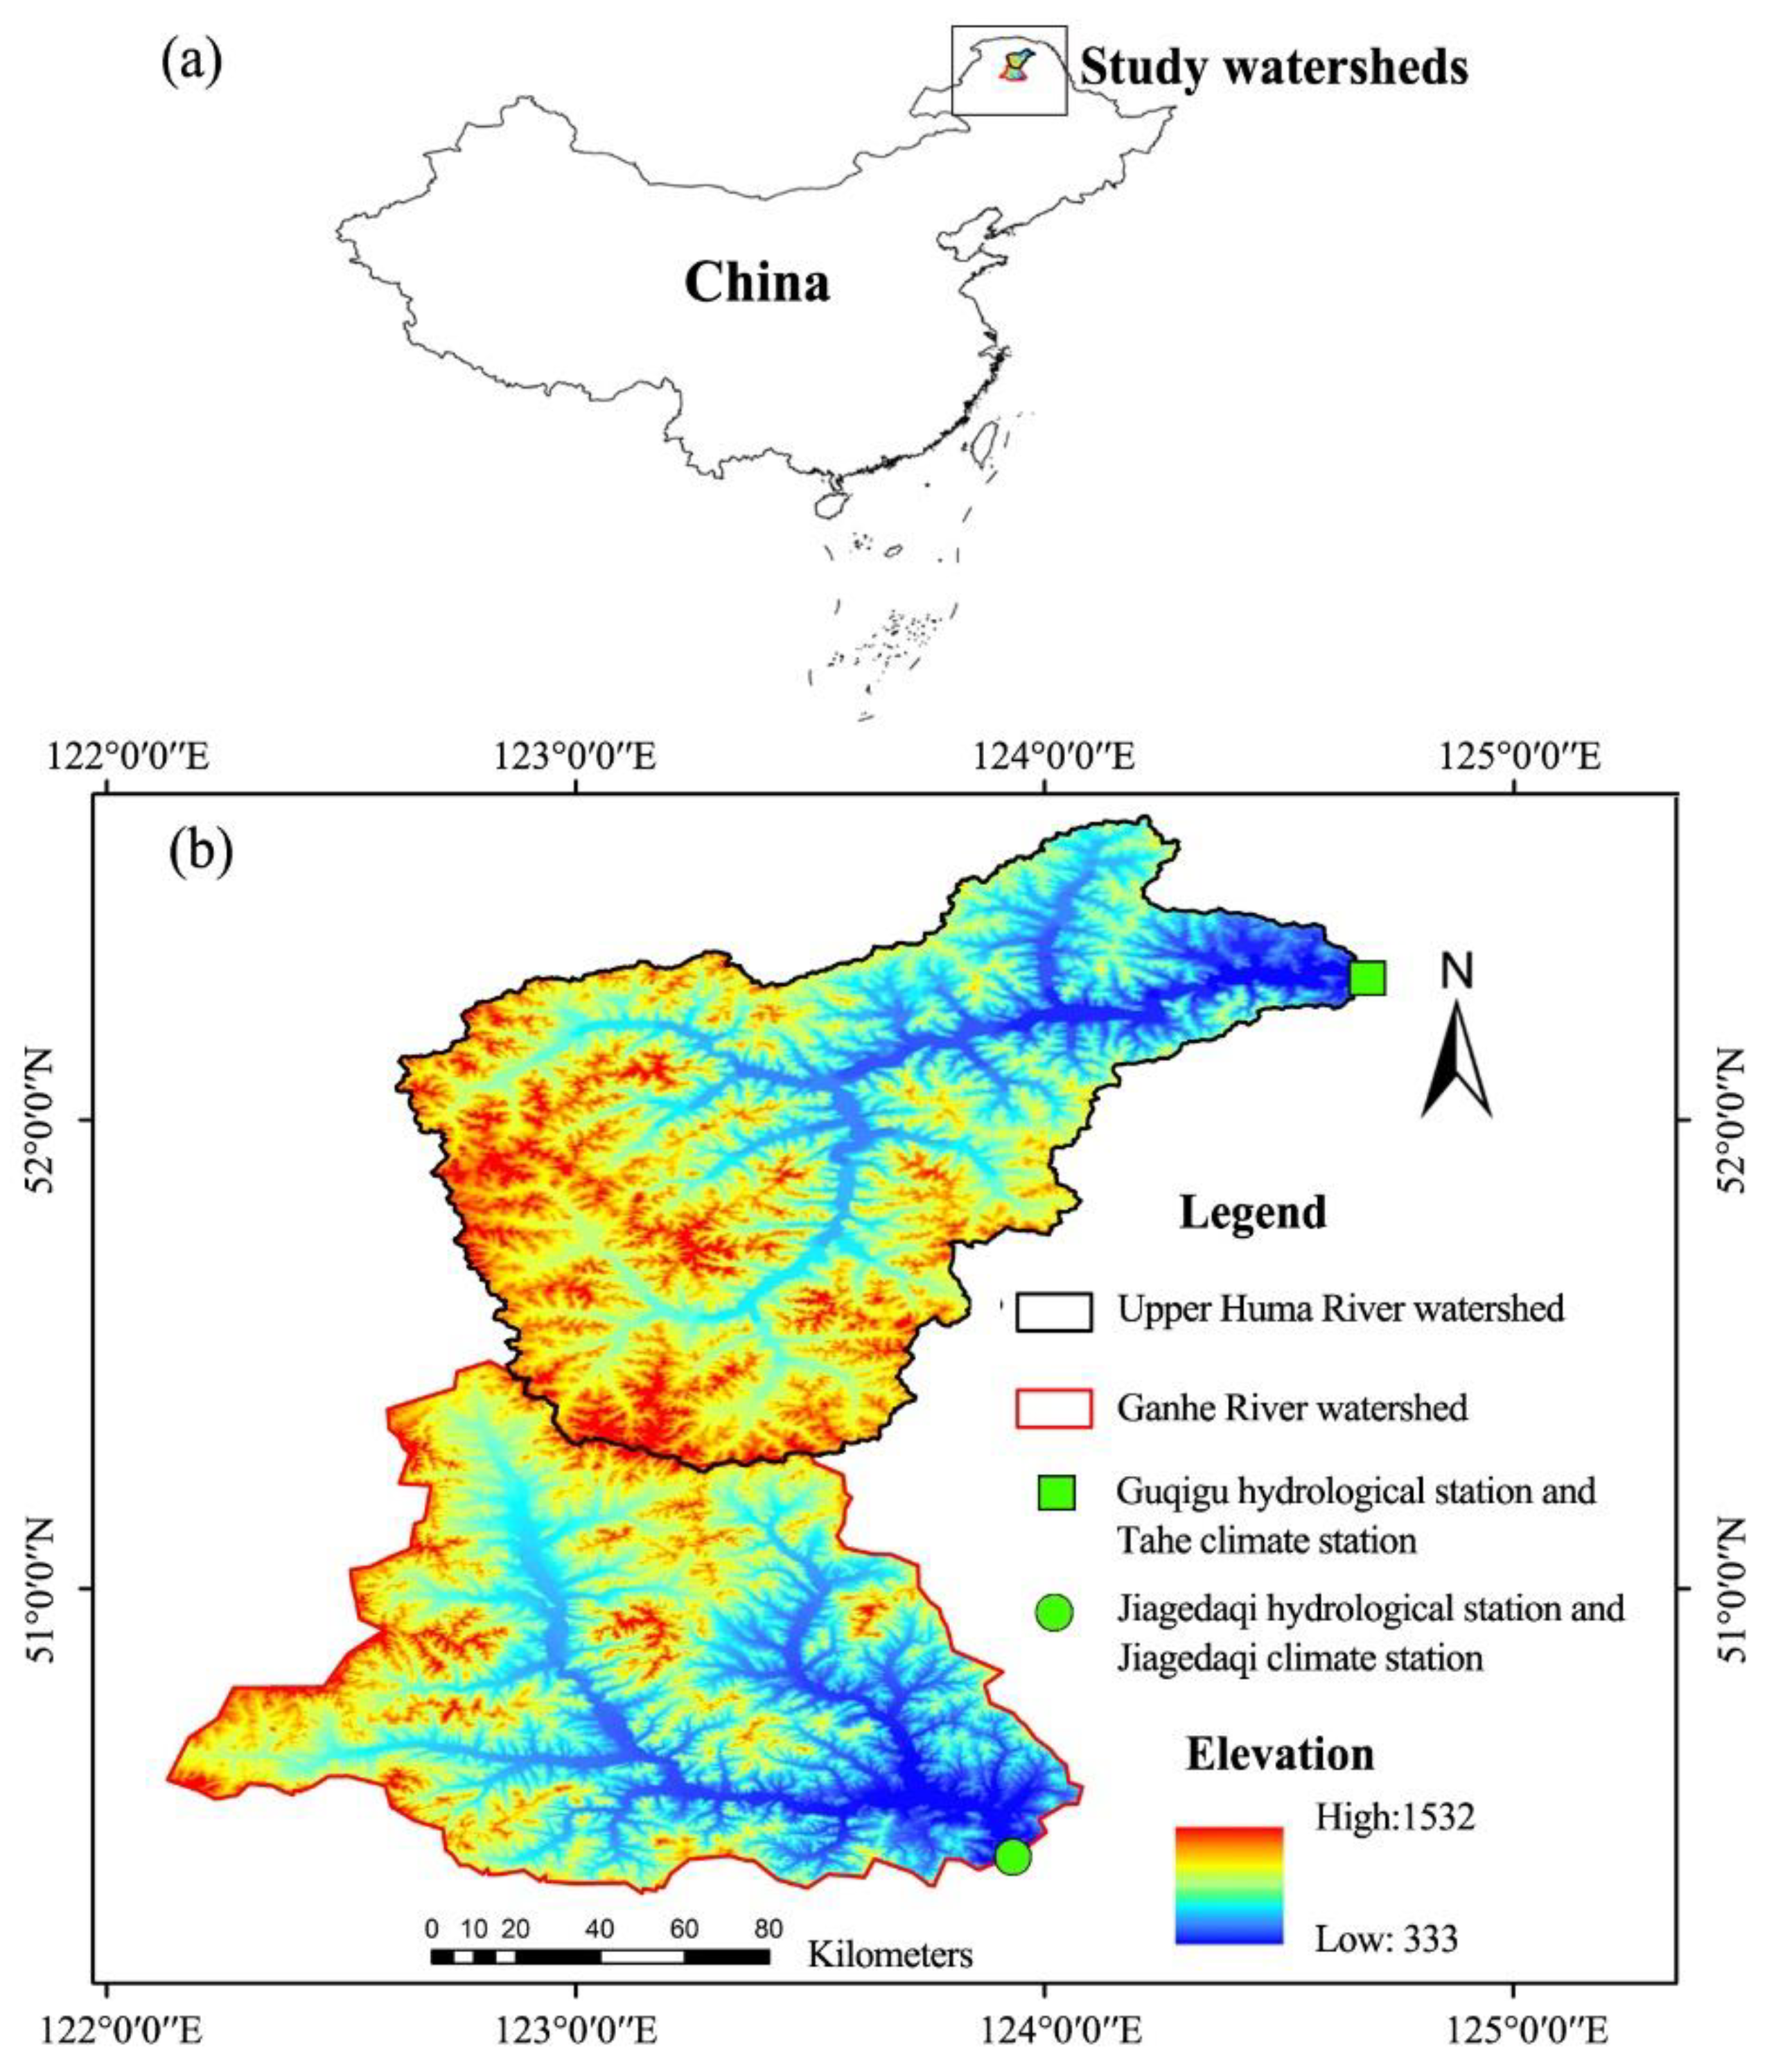
The UHR and GR watersheds have drainage areas of 10,882 and 9575 km2, respectively and are located in the Da Hinggan Mountains of the high latitude cold region of north-east China (Figure 1a). The topography of both watersheds are both characterized by gentle hills with the average elevations being 808 and 745 m above sea level in the UHR and GR watersheds, respectively (Figure 1b and Table 1). Both watersheds are dominated by brown coniferous forest soils [26]. According to the land-use classification generated from remote-sensing images from 2000 provided by the Data Center for Resources and Environmental Sciences, Chinese Academy of Sciences (http://www.resdc.cn), the land cover of both watersheds is dominated by forest. Native vegetation in this region consists of forest communities dominated by larch (Larix gmelinii), along with broadleaf species, such as birch (Betula platyphylla) and Mongolian oak (Quercus mongolica).
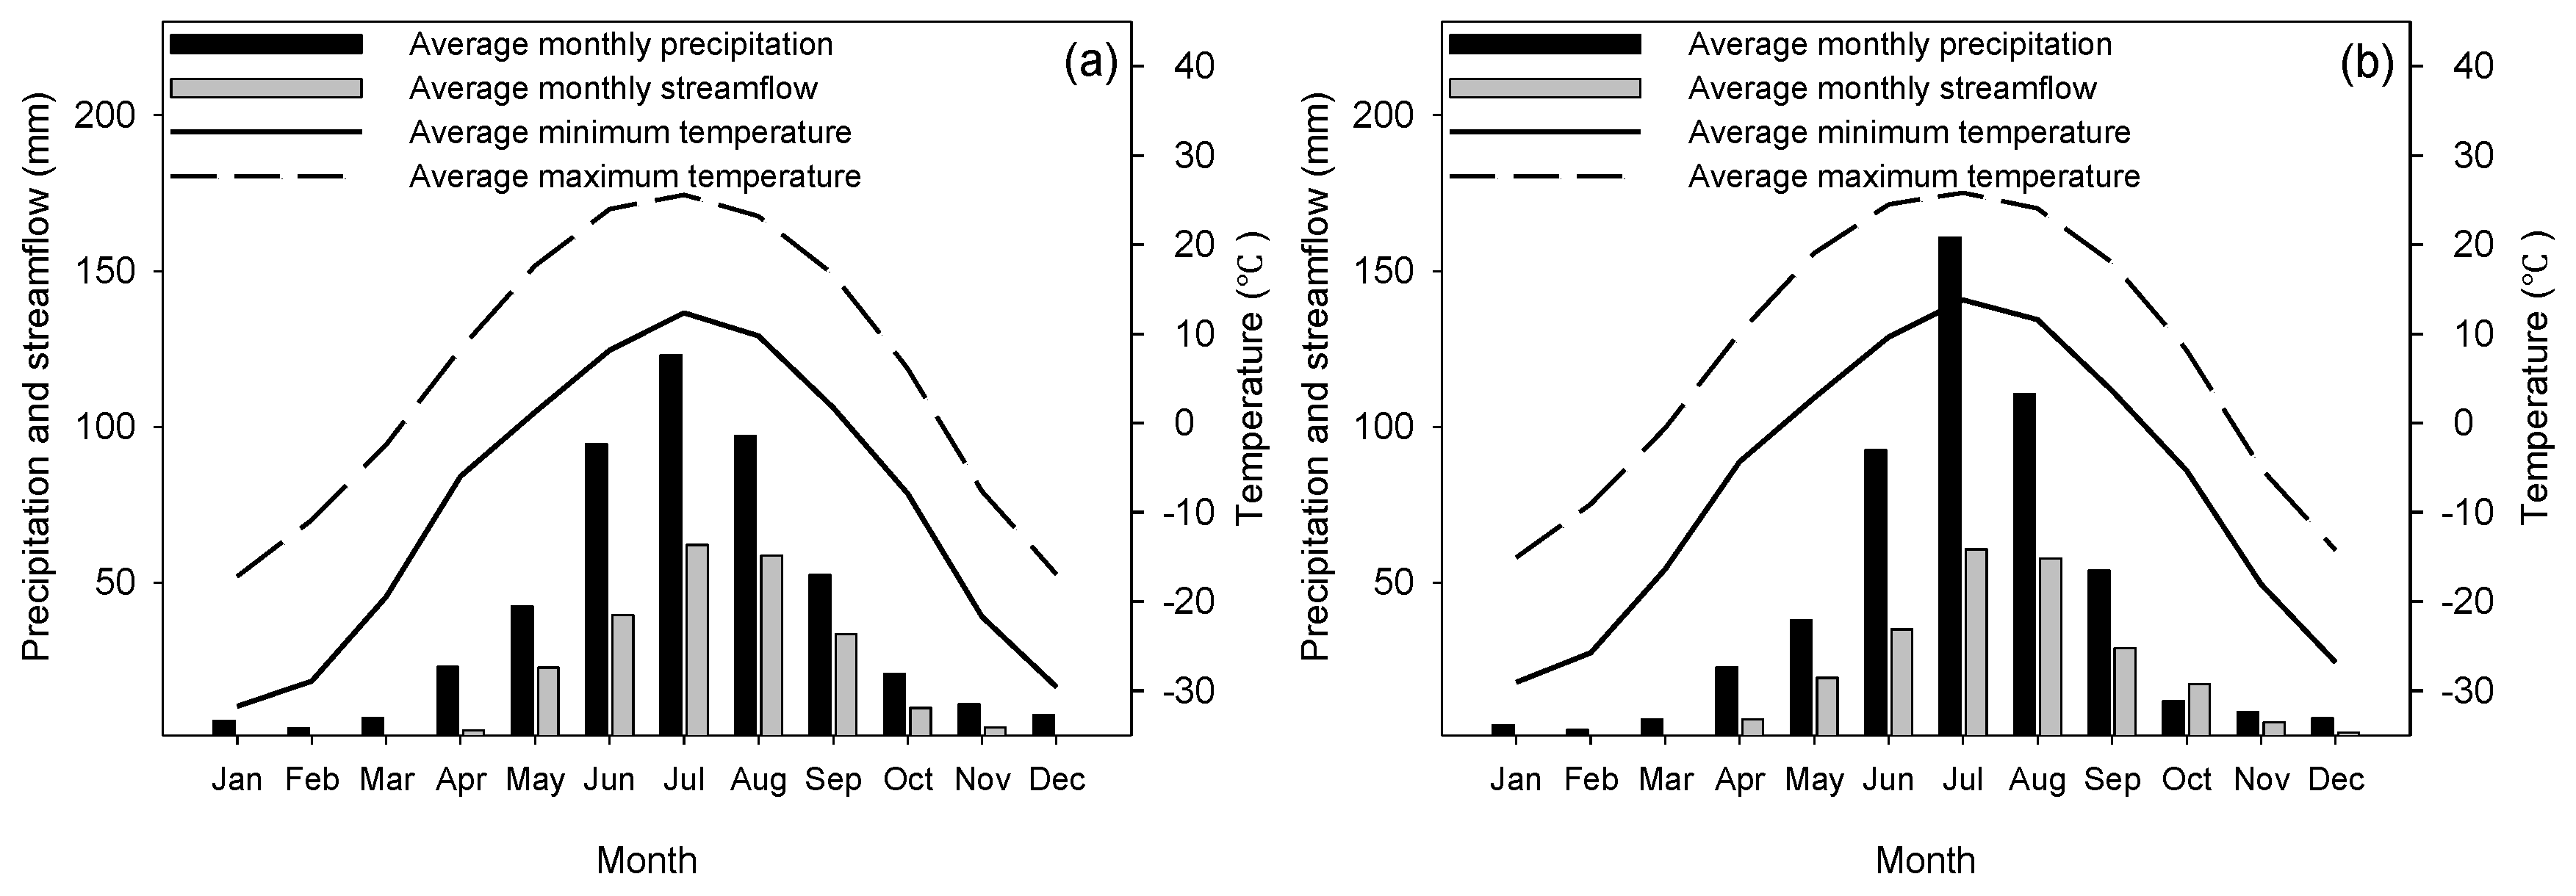
The two study watersheds are located in the region characterized by a typical continental monsoon climate with a wet, hot summer and a cold, dry winter. According to the climate data from 1975 to 2013, the mean annual air temperature of the UHR and GR watersheds are −2.3 and −0.4 °C, respectively. The average maximum air temperatures are 25.6 and 25.8 °C, respectively, in July, while the average minimum is −31.7 and −29.0 °C, respectively, in January (Table 1 and Figure 2). Such climatic regimes are quite different from previous studies in snow-dominated regions, for example in the Pacific north-west of North America [12,27]. The average annual precipitation is 487.2 and 518.5 mm for the UHR and GR watersheds, respectively, of which approximately 75% occurs as rainfall from June to September because of the heavy influence of the south-east monsoon from the Pacific Ocean. During the winter from November to March, precipitation occurs in the form of snow. The fraction of snowfall accounting for annual precipitation is 11.9% and 10.6% in the UHR and GR watersheds, respectively. However, there is no permanent snow cover in either watershed. The seasonal snowpack melts in spring from April to May, and contributes to spring high flows.
2.2. Data
Daily discharge data for the UHR and GR watersheds are available from 1975 to 2013. Following the protocol of “Observation Methodology for Long-term Forest Ecosystem Research” of the National Standards of the People’s Republic of China (GB/T 33027-2016), daily discharge data of UHR and GR watersheds were calculated based on the relationship between streamflow and discharge stage height collected at the Guqigu and Jiagedaqi hydrometric stations, respectively (Figure 1b). The data in 1983 of the UHR watershed is unavailable because the data in the wet season were missed. No dams or hydropower stations regulate flow in either study watersheds. The annual streamflow hydrography of the study watersheds is characterized by high flow during the snowmelt season in May and the peak in summer from June to August coinciding with peak rainfall [28], respectively.
Daily climatic data of the UHR and GR watersheds from 1975 to 2013 are obtained from Tahe (Climate ID: 50246) and Jiagedaqi (Climate ID: 50442) climate stations (Figure 1b), respectively. The annual precipitation, annual snowfall, seasonal precipitation were calculated from the daily precipitation data including daily rainfall and daily snowfall. The seasonal precipitation includes spring (April and May)/summer (June to August)/autumn (September and October) precipitation and spring rain. The spring rain ratio equals to the percentage ratio of spring rain to spring precipitation. Daily mean air temperature was used to calculate annual mean/maximum/minimum air temperature (Tave, Tmax, Tmin) and April/May/June accumulated snowmelt temperature (Ta4, Ta5, Ta6). The accumulated snowmelt air temperature refers to the sum of the temperature over 0 °C during the snowmelt period. We acknowledge that there may be some spatial heterogeneity in precipitation across both watersheds but we believe this heterogeneity to be minimal because the study region is mainly characterized by low hills with gentle undulations [29]. In order to test such inference, the annual gridded precipitation data in both watersheds from a separate database, “0.5° × 0.5° gridded database of annual surface precipitation in China” [30], have been used to test the accuracy of the precipitation data obtained from both climate stations. Also, we acknowledge that although the temperature would not be uniform across the site, we expect that the trends in temperature obtained at both climate stations would be reasonably representative of the trends of the watershed-averaged values for the sites.
2.3. Methods
2.3.1. Definition of High Flow Regime Components
The magnitude, timing, frequency, duration, and rate of change of hydrologic conditions are five critical components of the flow regime regulating ecological processes in river ecosystems [31]. These components can be used to characterize the entire range of flows and specific hydrologic phenomena, such as floods or low flows [1,32]. In this study, we focus on the magnitude and timing of high flows, which are critical to the management of flood risk [33] and the aquatic ecosystem [2].
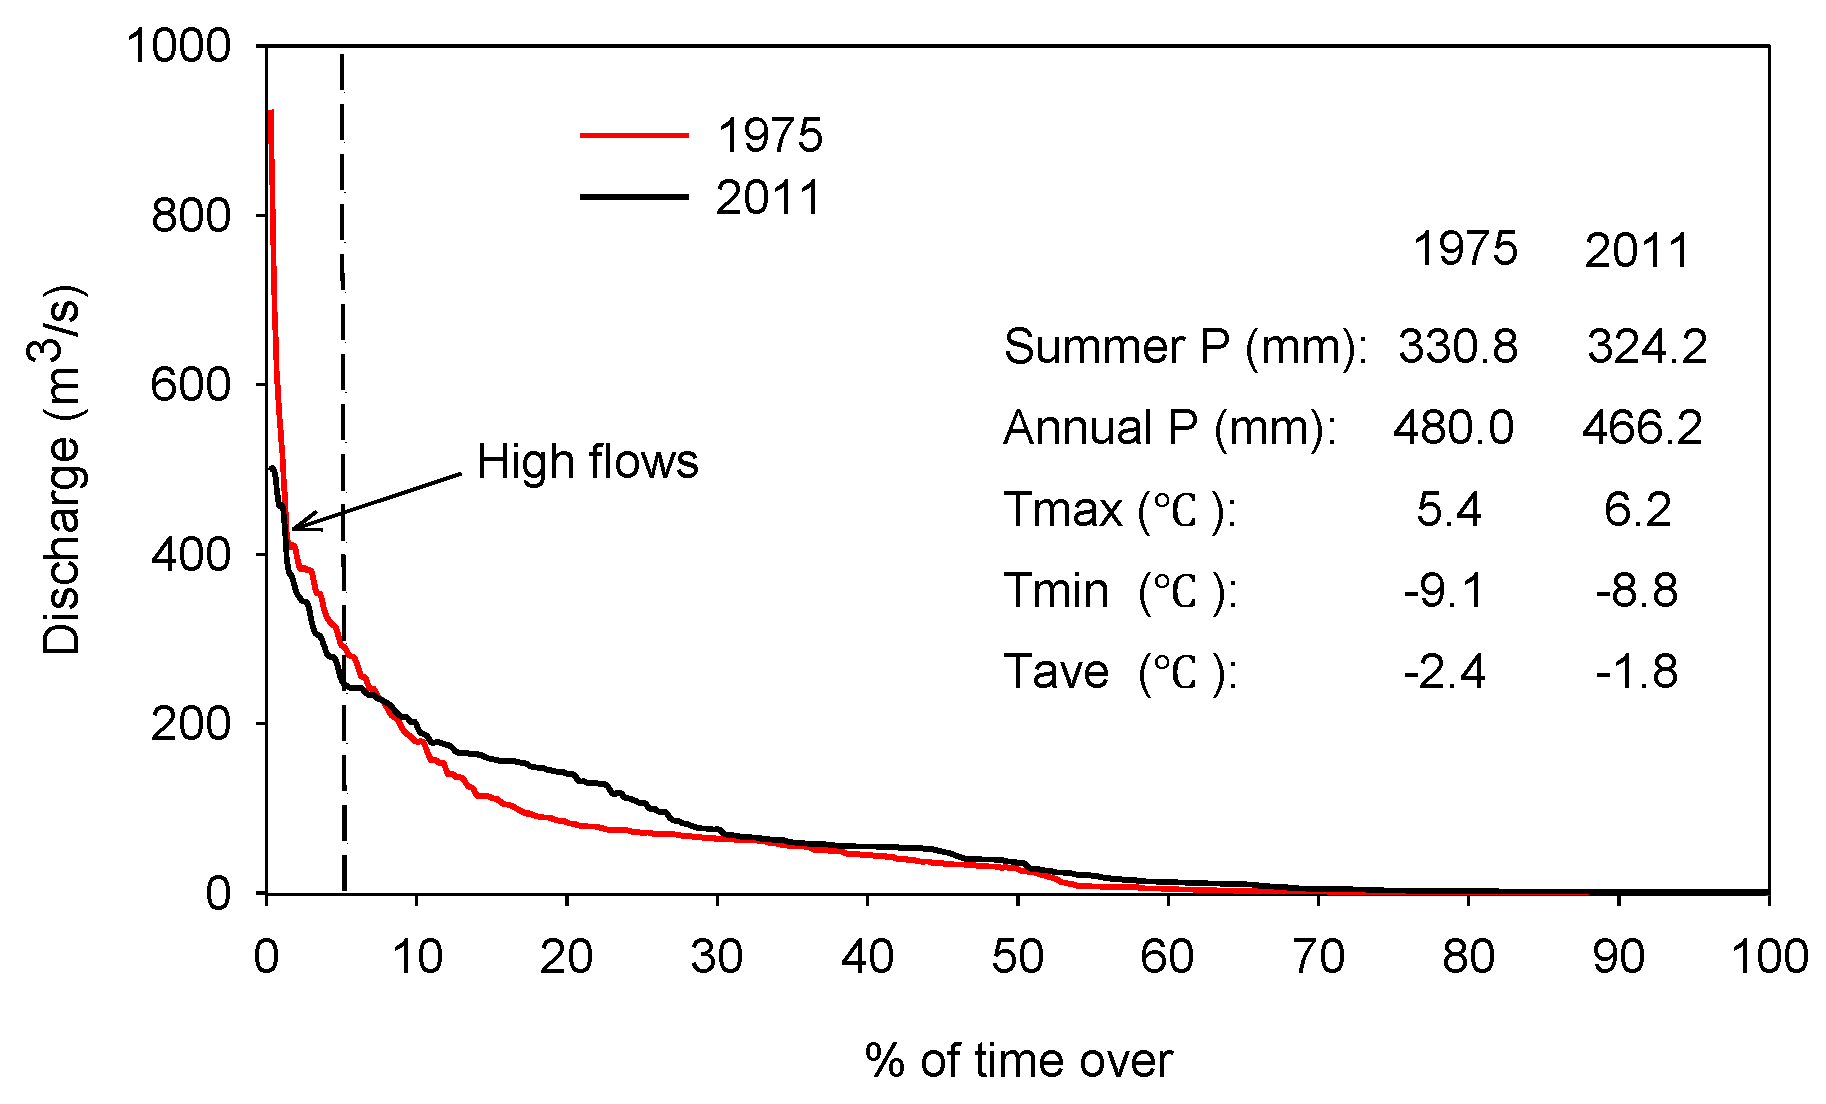
Flow duration curves (FDCs) were applied to define high flows. FDC is a cumulative frequency curve that shows the percent of time during which specified discharges were equaled or exceeded in a given period [34]. High flows were defined as flows equal to or greater than Q5% (flows exceeded at 5% of the time in the flow duration curve in a given water year) [32,35]. The flow duration curves for each year were generated by use of daily discharge data. The magnitude refers to the daily mean discharge (m3/s). The timing for high flows refers to the Julian date (number of days since the beginning) for high flows in a water year from November to October. According to the definition of high flow, each water year has 18 days defined as high flow days. The average values of high flow magnitude and timings in each water year were applied to time series analysis.
2.3.2. Trend Analysis
The non-parametric trend test, the Mann–Kendall test [36,37], was used to determine if significant trends exist in the long-term high flow regime components and climatic data. The rate of change in the trend, or the slope was estimated using the Sen’s slope method [38,39]. The details of the Mann–Kendall test and calculation of the slope of trend can be found in Zhang, et al. [40].
2.3.3. Quantifying the Responses of Magnitude and Timing of High Flows to Climate Warming Using the Paired-Year Approach
In order to quantify the responses of the magnitude and timing of high flows to climate warming, the effects of other possible relevant climatic variables must be eliminated. Liu, et al. [41] and Zhang, et al. [42] developed the paired-year approach to address this issue. In the paired-year approach, Kendall’s tau and Spearman’s rho correlation analyses, which are widely used to detect correlations between long-term hydrological and climatic variables [41,43], are firstly applied to test the correlations between each high flow regime component and possible relevant climatic variables including annual precipitation, annual snowfall, spring/summer/autumn precipitation, spring rain, annual mean/maximum/minimum air temperature (Tave, Tmax, Tmin) and April/May/June accumulated snowmelt air temperature (Ta4, Ta5, Ta6). The significances were identified when the results from two methods both showed significant correlations. The climatic variables having significant correlations with high flow magnitude and timing were then further applied to canonical correlation analysis, which is able to test the correlation between two sets of variables. The set of climatic variables that were most correlated (having the highest canonical R) with high flow magnitude and timing was finally identified, respectively. Each pair of years including a reference year and a warming year was then selected according to the most relevant climatic variables.
The study region has experienced a pronounced warming trend over the past half a century [21,22], which was expected to affect high flow regimes. In order to apply the paired-year approach to detect the impacts of climate warming on high flow regimes, the reference period and the warming period should be identified firstly. Pettitt’s test was used to detect significant change points in temperature metrics, which were applied to divide the entire study period into two sub-periods including a reference period and a warming year. Pettitt’s test is a non-parametric change-point test method developed by Pettitt [44], it is widely used for detecting the timing of a significant change in the distribution of a time series when the exact time of the change is unknown, especially for the long-term hydrometeorological data series [45,46]. The details can be found in Zhang, et al. [40].
In this study, the temperature metrics including annual mean/maximum/minimum air temperature (Tave, Tmax, Tmin), April/May/June accumulated snowmelt temperature (Ta4, Ta5, Ta6) were considered the indicators of climate warming. The spring rain and spring rain ratio were also considered climate warming-induced metrics because climate warming results in more precipitation falling as rain in spring and consequently affects spring high flow regimes. Each pair of years must have similar precipitation variables, where 15% biases are allowed, and the higher temperature metrics or spring rain, so that the quantitative effects of climate warming on high flow timing and magnitude can be determined.
3. Results
3.1. Trends of High Flow Regime Components and Climatic Variables
As shown in Table 2, the high flow timings for each watershed exhibited significantly (p < 0.05) negative trends over the study period (1975–2013), with the decreasing rates of 0.53 and 0.73 day/year for UHR and GR watersheds, respectively. This means that the high flow timing moved to earlier in the water year in the study region in the past several decades. The high flow magnitude showed no significant (p > 0.05) trend for either watershed. For the climatic variables, the GR watershed exhibited a pronounced warming trend with significantly (p < 0.05) positive trends in Tave, Tmin, Ta5, and Ta6. Only Tmax exhibited significantly (p < 0.05) positive trends for the UHR watershed. For seasonal precipitation, spring rain and spring rain ratio exhibited significantly (p < 0.05) positive trends for both watersheds, with the increasing rates of 0.76 and 0.95 mm/year for spring rain, and 0.88 and 1.06 %/year for spring rain ratio for UHR and GR watersheds, respectively, over the entire study period.
3.2. Relationships between High Flow Regime Components and Climatic Variables
According to the results of Kendall tau and Spearman’s rho correlation analyses (Table 3), Tmax, summer precipitation and annual precipitation were significantly (p < 0.05) correlated with high flow magnitude in the UHR watershed, while, Ta6, summer precipitation, and annual precipitation showed significant (p < 0.05) correlation with high flow magnitude in the GR watershed. Climatic variables with significant (p < 0.05) correlation with the high flow timings include Tmax, spring precipitation, spring rain, and autumn precipitation in the UHR watershed. In GR watershed, Tave, Tmin, spring rain, spring rain ratio and autumn precipitation exhibited significant (p < 0.05) correlations with high flow timing.
These climatic variables with significant correlations with high flow magnitude and timing formed 3 and 7 sets of relevant climatic variables for canonical correlation analysis for the UHR and GR watersheds, respectively. As suggested by the canonical correlation analysis (Table 4, Table 5, Table A1 and Table A2), Tmax and Ta6 were the climatic variables as the climate warming indicators controlling high flow magnitude for the UHR and GR watersheds, respectively, while summer and annual precipitation were two precipitation regime variables for selecting paired years of high flow magnitude in both watersheds. Tmax and spring rain were the most relevant climate warming indictors controlling high flow timing in the UHR watershed, while they are Tave and spring rain for the GR watershed. Autumn precipitation was the precipitation variable for selecting paired years of high flow timing in both watersheds.
3.3. Change Point Analysis and the Dividing of Sub-Periods
The change point analyses revealed that only Tmax exhibited a significant (p < 0.01) change point in 1989 in the UHR watershed, while Tave, Tmin and Tmax all exhibited significant (p < 0.01) change points in 1989 in the GR watershed (Table 6). Besides, Ta6 and spring rain showed significant (p < 0.01) change points in 2000 and 1996, respectively, in the GR watershed.
According to the results of change point analysis and the correlations between air temperature metrics and high flow magnitude and timing, the change point (1989) of Tmax, Tave and Tmin was selected to divide the entire study period into a reference period from 1975 to 1988 and a warming period from 1989 to 2013 for both watersheds. The paired years having similar summer and annual precipitation, but higher Tmax and Ta6 in the warming period, were selected to quantify the effects of climate warming on high flow magnitude in the UHR (22 pairs in Table A2) and GR (24 pairs in Table A3) watersheds, respectively. The paired years with similar autumn precipitation but higher spring rain and Tmax in the warming period were selected to quantify the effects of climate warming on high flow timing in UHR (21 pairs in Table A4). For the GR watershed, the paired years having similar autumn precipitation but higher spring rain and Tave were selected (25 pairs in Table A5).
3.4. Quantifying the Impacts of Climate Warming on the Magnitude and Timing of High Flows
3.4.1. Magnitude
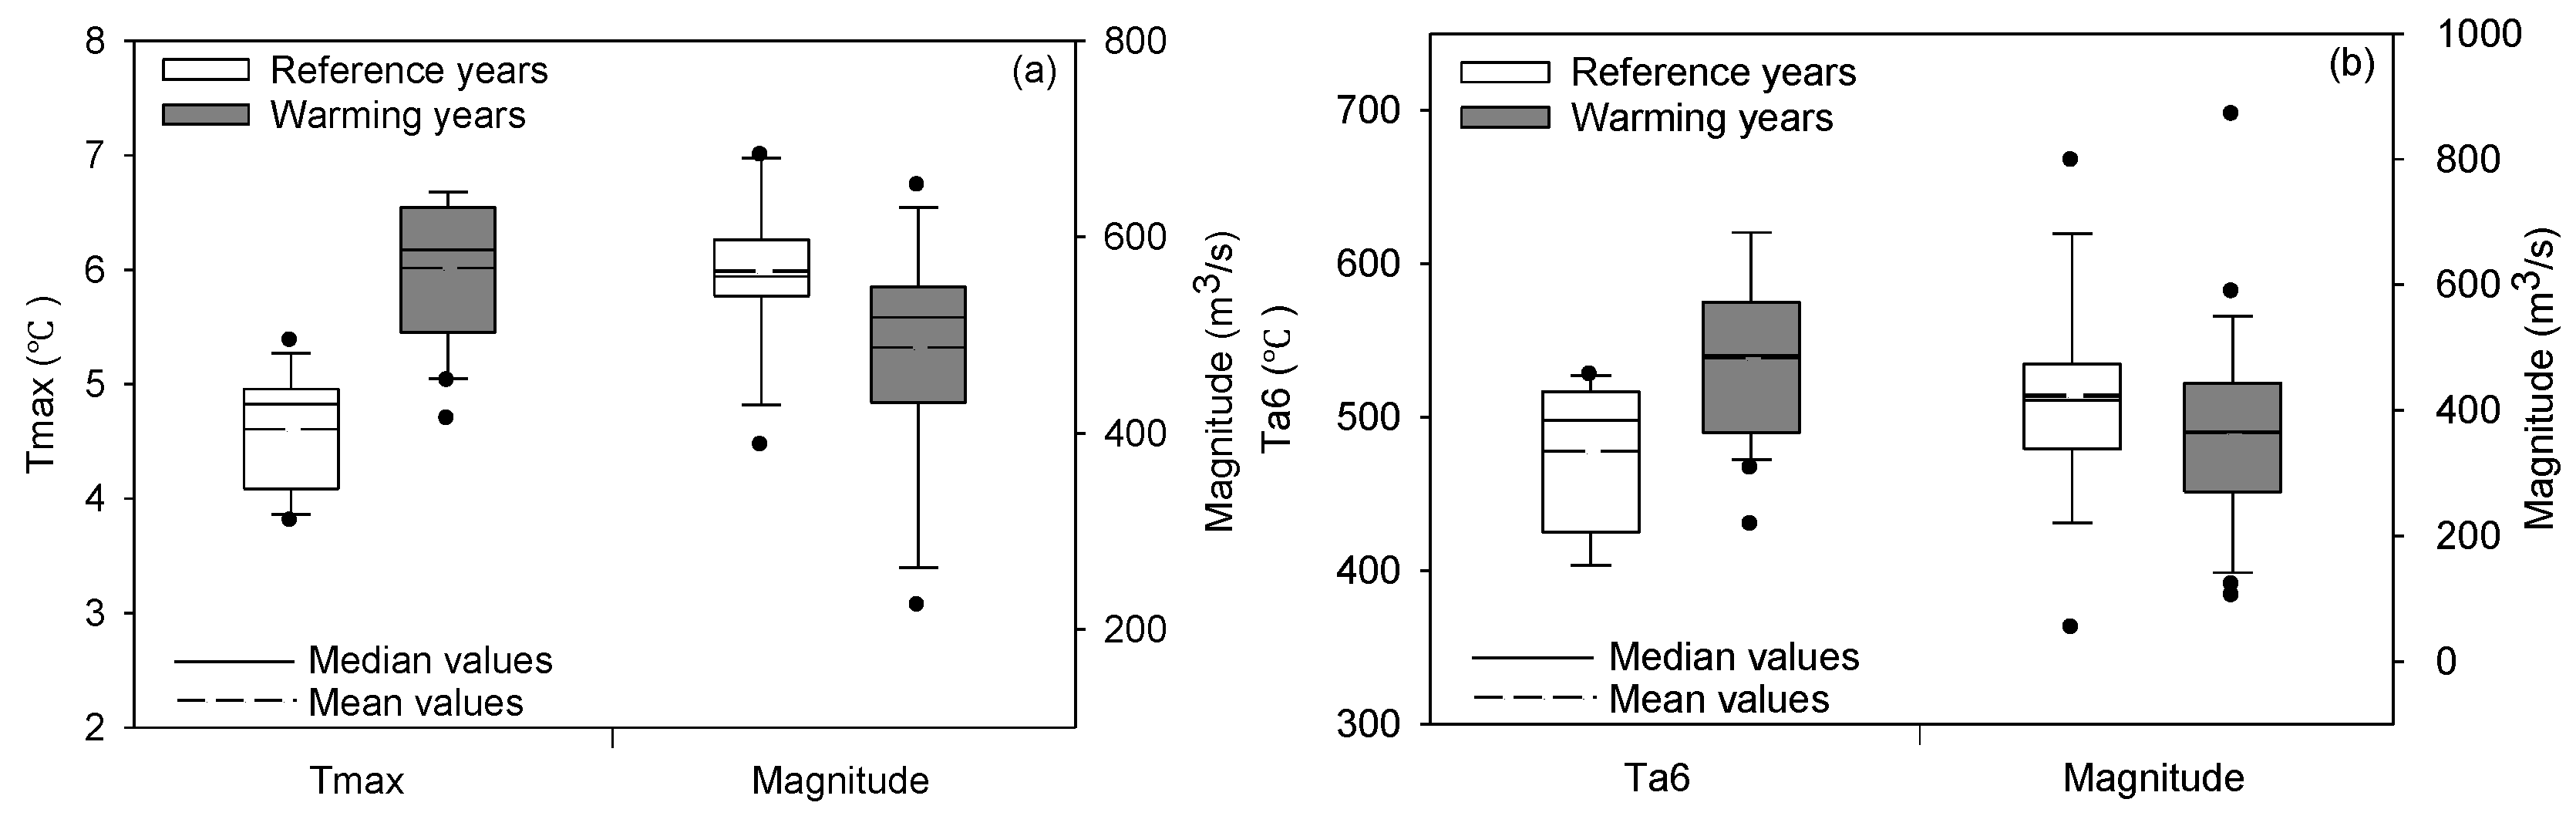
As illustrated in the box plots (Figure 3a) and the results of Mann–Whitney and Kolmogorov–Smirnov tests (Table 7), the average magnitude of high flows in warming years were significantly (p < 0.05) lower than those in reference years in the UHR watershed, with the reduction being 13.7% associated with the increase of 30.6% in Tmax. For instance, the high flow magnitude (428.9 m3/s) in the reference year of 1975 was 17.5% higher than that (353.7 m3/s) in the paired warming year of 2011 (Figure 4). In the GR watershed, although the average magnitude of high flows decreased by 14.0% in warming years compared with that in reference years (Figure 3b), the difference between those was not significant (p > 0.05) (Table 7).
3.4.2. Timing
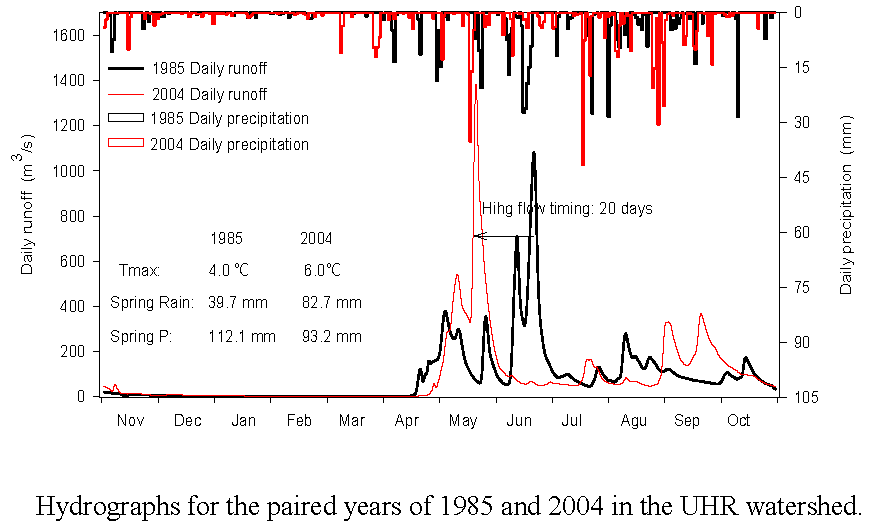
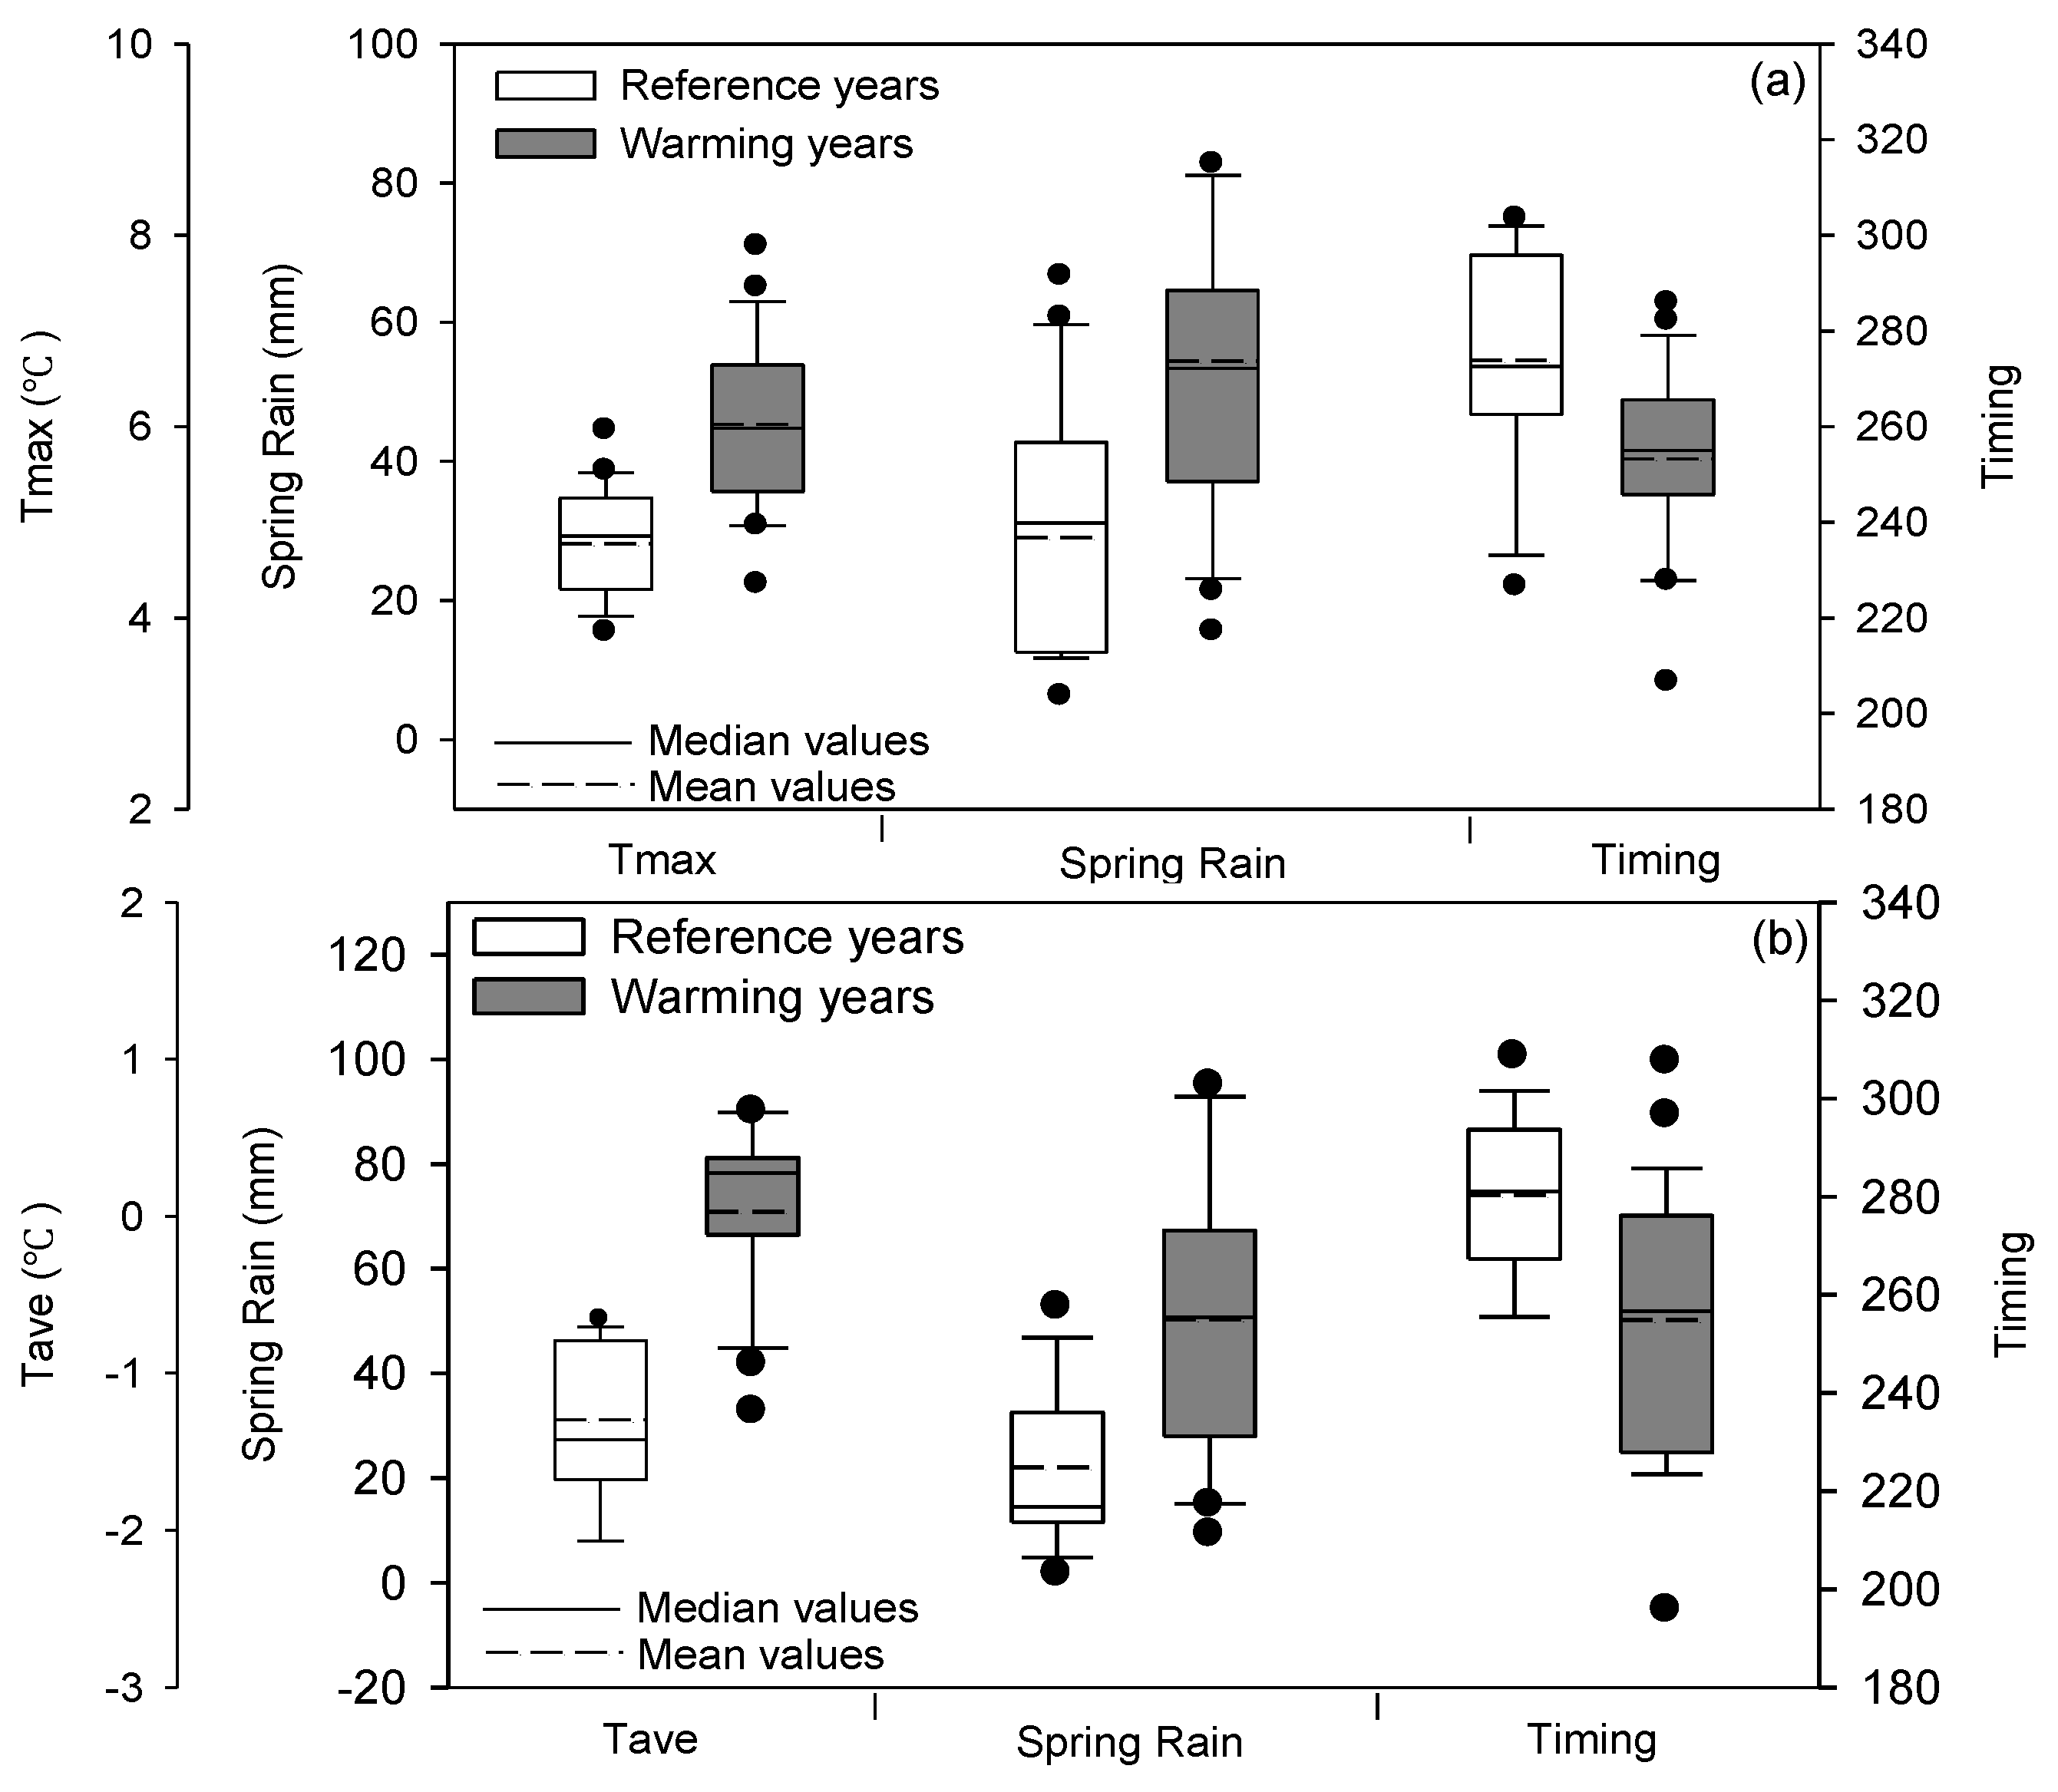
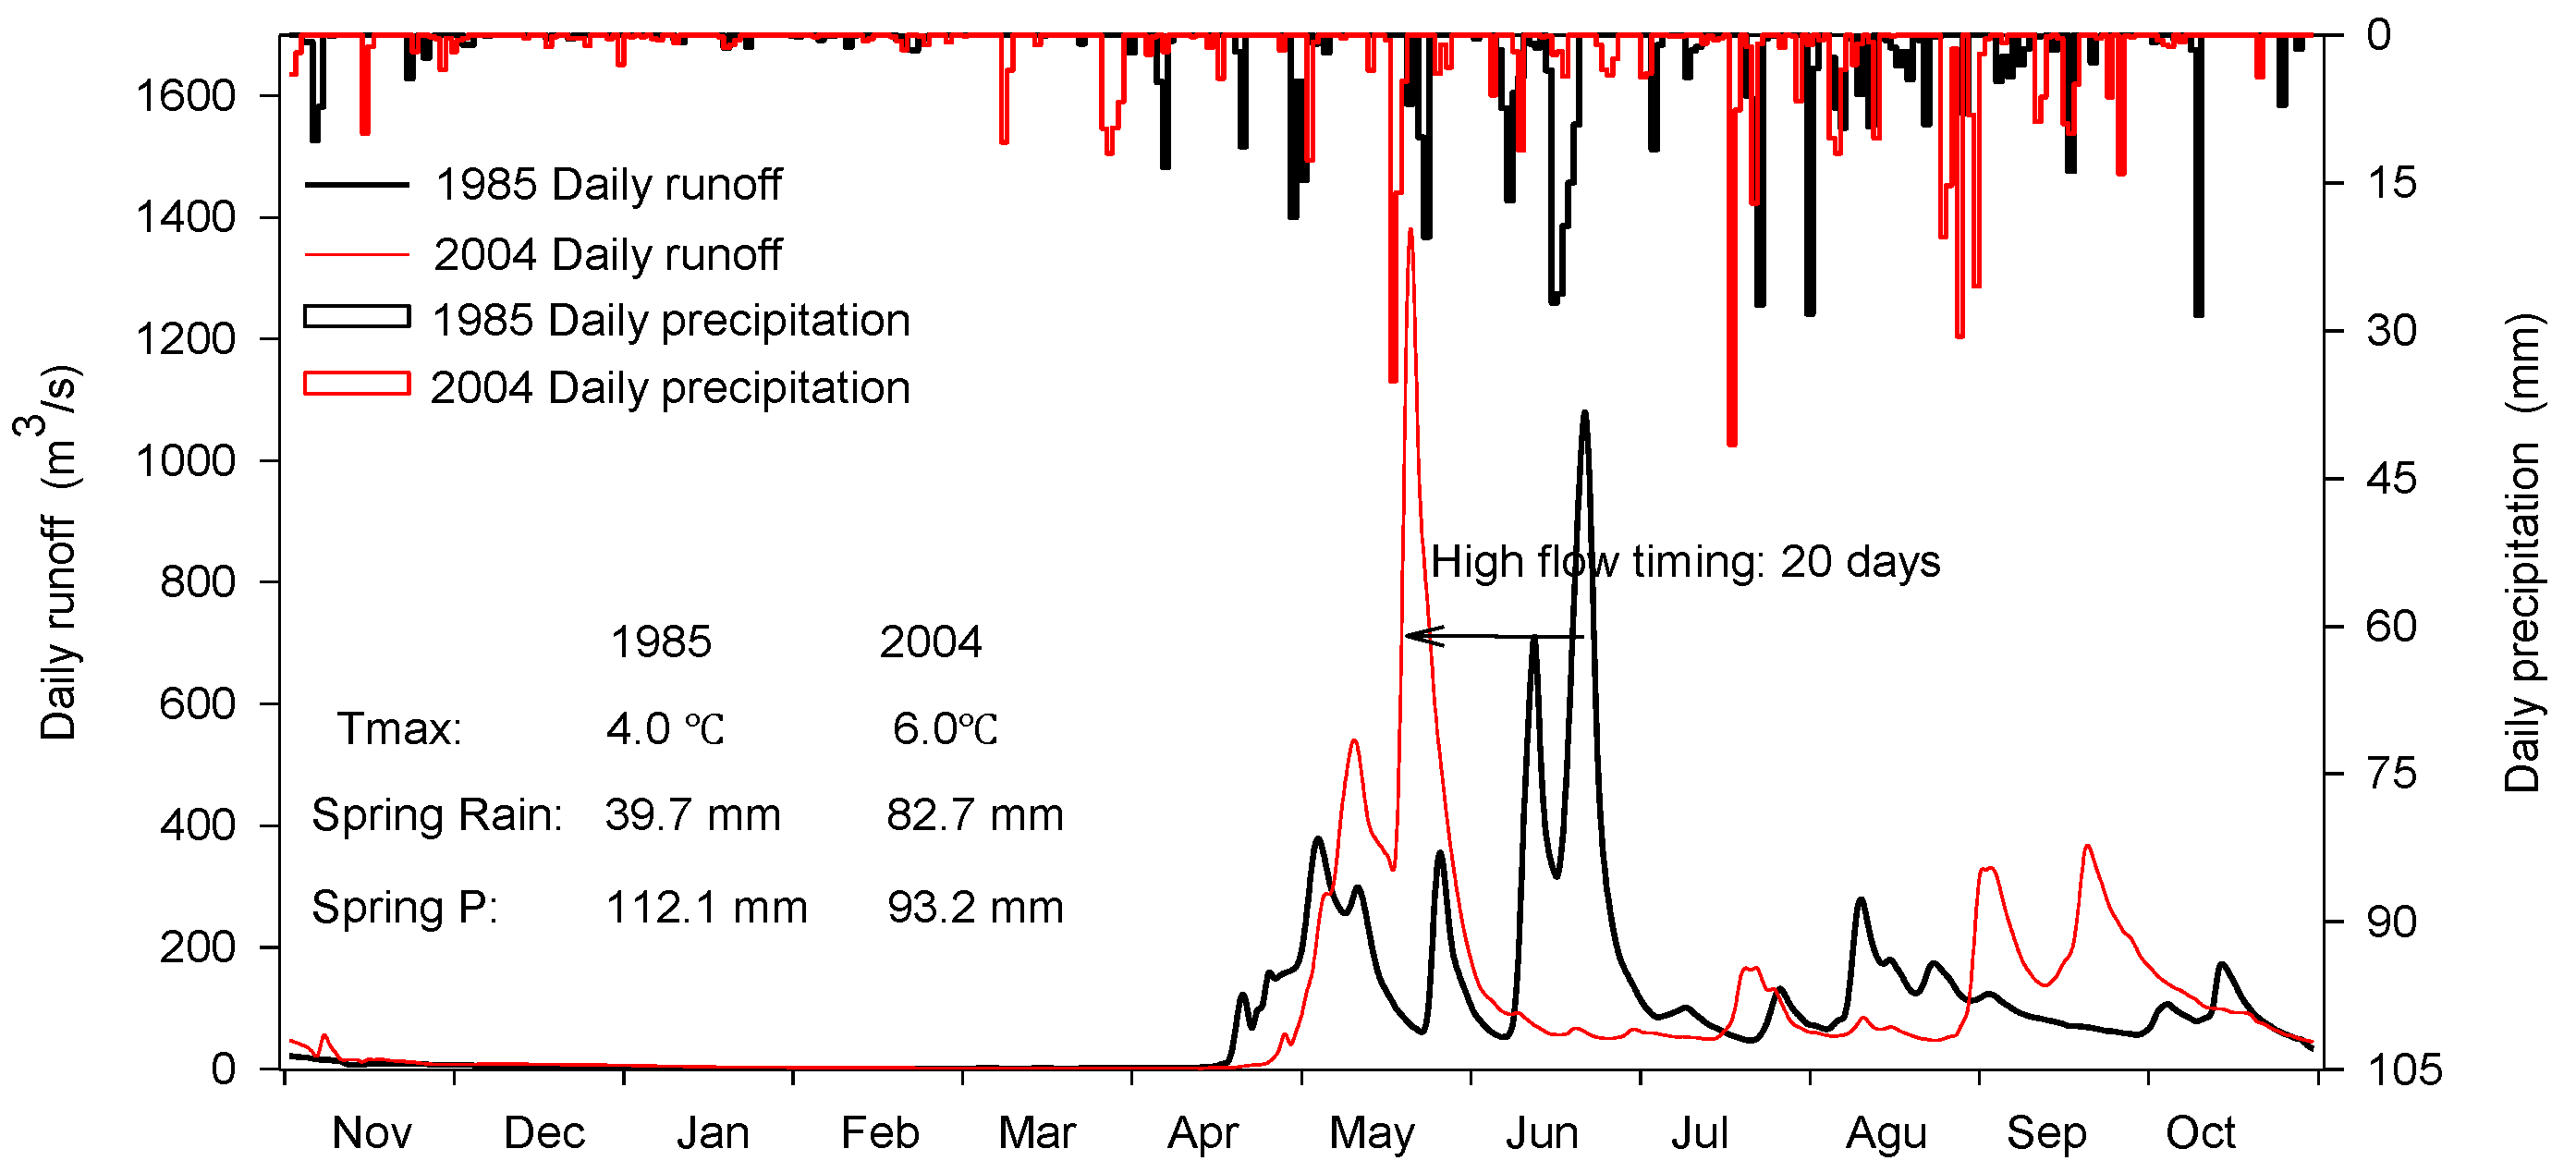
The timings of high flows in two watersheds were both significantly (p < 0.01) lower in the warming years than those in the reference years (Figure 5a,b, Table 7). For the UHR watershed, the average timing of high flows in warming years was significantly advanced by 21 days associated with the increases of 1.2 °C and 25.3 mm in Tmax and spring rain, respectively. This means every 0.1 °C increase in Tmax and 2.0 mm increase in spring rain can cause the average high flow timing to be advanced by 1.7 days in the UHR watershed. For example, the average timing of high flows was advanced by 20 days for the paired years of 1985 and 2004 when the Tmax and spring rain increased by 2.0 °C and 43.0 mm (Figure 6), respectively. The average high flow timing of GR watershed in the warming years was significantly (p < 0.05) advanced by 25 days because of the increases of 1.3 °C and 28.3 mm in Tave and spring rain, respectively, which indicates that every 0.1 °C increase in Tave and 2.1 mm increase in spring rain can lead to 1.9 days earlier average high flow timing.
4. Discussion
4.1. Impacts of Climate Warming on High Flow Timings
Our results from the paired-year approach indicated that both study watersheds exhibited earlier timings of high flows in the warming years compared with those in the reference years. The average timings of high flows in the warming years were significantly (p < 0.05) advanced by 21 and 25 days in the UHR and GR watersheds, respectively. The observed earlier high flow timings were consistent with many findings in other high-latitude and -altitude cold regions. For instance, Morán-Tejeda, et al. [14] found that spring peaks due to snowmelt had been shifting earlier within the hydrological year in 27 mountain rivers in Spain from 1976 to 2008, and the significant increasing trend of spring temperature was the main co-variable responsible for the observed changes in the streamflow timing. Using a temperature-based snow module coupling with a grid-based distributed hydrological model, Bell et al. [11] found that annual maxima tend to occur earlier in the water year associated with the large reductions in the ensemble mean of the number of lying snow days in the northerly regions of Britain in future. The similar results were also found in the north-central USA [20], in New England [47], in western North America [12,48] and in north-east Scotland [49].
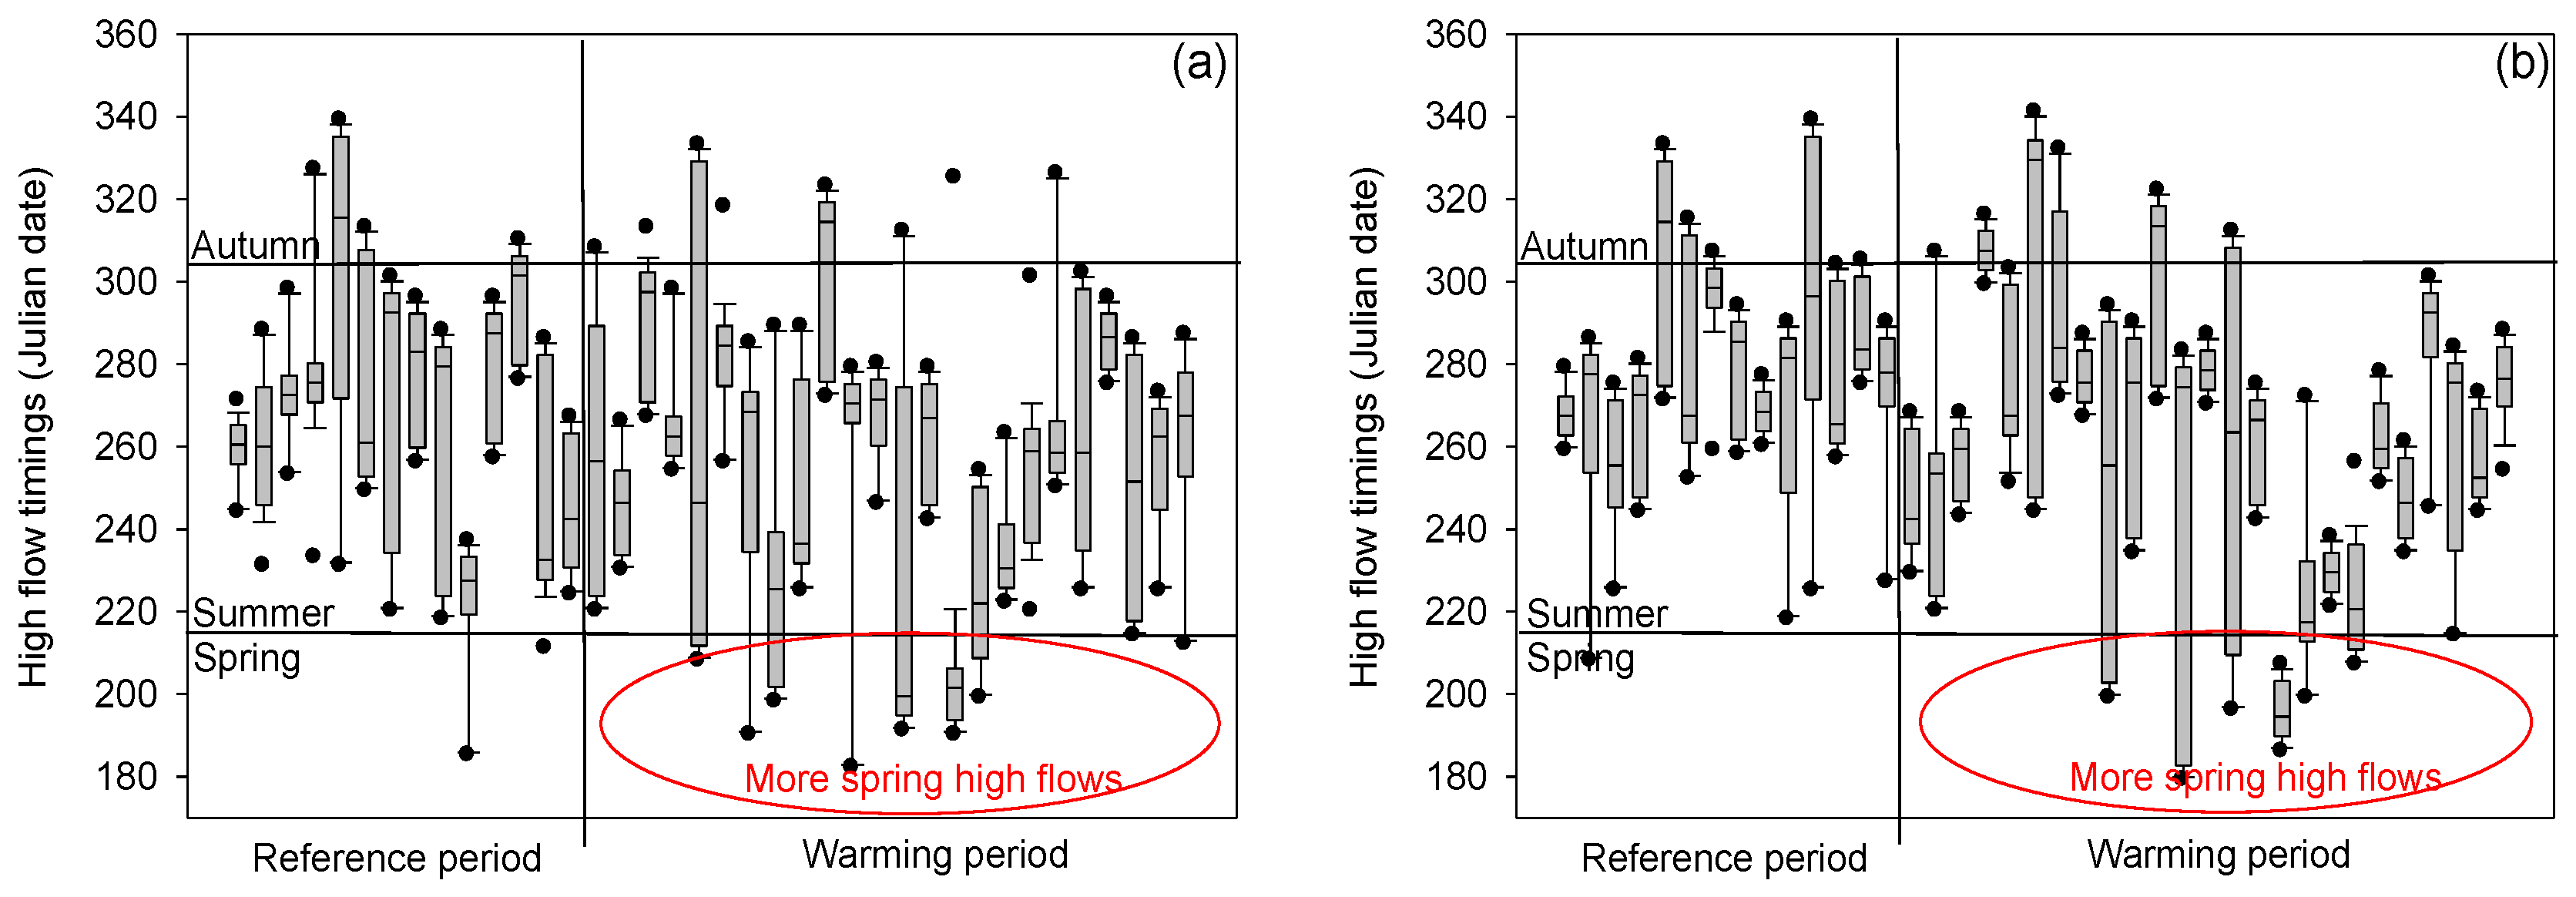
Although earlier streamflow timing has been found across the world in the context of climate warming, the mechanisms vary in snow and rain dominant regions. In snow-dominant regions, river flow is dominated by snowmelt water, and climate warming leads to earlier snowmelt that in turn results in an advance in the timing of peak spring runoff and the increased fractions of annual flow occurring earlier in the water year [10,12]. In order to detect the changes in snowmelt timing, the Julian date, on which 7-day moving average daily mean air temperature starts to rise above zero, was considered as snowmelt timing in two study watersheds. The average snowmelt timing in warming period was 4.1 and 5.4 days earlier than those in the reference period in the UHR and GR watersheds, respectively. In the study watersheds, annual peak runoff generally occurs in summer and coincides with peak rainfall [22]. Also, annual peak runoff and high flows may occur in spring associated with the occurrence of ROS events. As shown in Figure 7, spring snowmelt/rain high flow occurred more frequently in the warming period with nine and seven water years in the UHR and GR watersheds, while in only two and one water years in the reference period. According to the earlier snowmelt timing, the significant increasing trends in spring rain, spring rain ratio and air temperature (Table 2), and their significant correlations with high flow timings (Table 3 and Table 4), it is safe to conclude that the observed earlier high flow timings were at least partly because the occurrence of earlier spring snowmelt/rain-generated high flows became more frequent, which was attributed to more precipitation falling as rain and earlier snowmelt timing in spring in the warming years, and consequently resulting in more and earlier ROS events. The snowmelt in a ROS event provides an additional input of water for runoff beyond rain precipitation alone [23,50], which can result in earlier spring high flows.
Despite more spring snowmelt/rain generated high flows occurring in the warming period, summer/fall rain-generated high flows were still dominant in each water year over the entire study period (Figure 7). After removing the high flows occurring in spring, the average summer/fall rain generated high flow timings in selected warming years were 9 and 8 days earlier than those in the reference period in the UHR and GR watersheds, respectively. Such advances in average summer/fall rain-generated high flow timings were much smaller than those (21 and 25 days in the UHR and GR watersheds) including spring high flow, which indicated that the more frequent spring high flows played a critical role in advancing average high flow timing in warming years. Although summer/fall rain-generated high flow is mainly controlled by heavy rain regimes [51], antecedent soil moisture condition is the other important factor influencing high flow timings [52,53]. Wet soil moisture condition can lead to a short lagged time between peak rainfall and peak discharge [54]. Thus, climate warming-induced earlier snowmelt may result in the advanced wet soil moisture condition, which consequently lead to the earlier saturation excess overland flow and earlier high flows in wet season within the water year in study watersheds. This suggests it is essential to consider the direct effects of climate warming on high flow regimes including earlier snowmelt and more spring rain, and the indirect effects of climate warming including changes in antecedent soil moisture conditions for understanding the mechanism of climate warming-induced earlier high flow timings in the rain-dominated cold region.
4.2. Impacts of Climate Warming on High Flow Magnitude
The impacts of climate change on flood risk have attracted great attention in the context of climate warming [18,55]. Our results indicated that both study watersheds showed the lower magnitude of high flows in the selected warming years than those in the reference years with the significant (p < 0.05) reduction in the warmer GR watershed. This means that the flood risk was reduced by the observed warming in study watersheds, which is consistent with many findings in other high latitude and altitude cold regions. For example, Molini, Katul and Porporato [16] found that peak discharge is limited by snow melting dynamics in a warm regime, and is reduced by decreased winter snow accumulation. Hamlet and Lettenmaier [56] found that the relative cold river basins where snow processes dominate the annual hydrologic cycle showed reductions in flood risk due to climate warming induced reductions in spring snowpack in the western U.S. in the 20th century. The reductions in the 100-year return period flood were also found in parts of far north-east Europe, which was closely related to reduced snow accumulation-induced decreasing spring runoff peak [57].
By contrast, there were also studies concluding that global warming increases flood risk globally [18,58], especially in the high-altitude regions [55]. For instance, Allamano et al. [17] analyzed peak discharge time-series recorded in 27 gauging stations in the Swiss Alps and found a significant increase of flood peaks during the last century, which was attributed to the effects of recorded increases of temperature and precipitation intensity. Also, a global modeling study demonstrated a large increase in flood frequency in south-east Asia, peninsular India, eastern Africa and the northern half of the Andes, with small uncertainty in the direction of change for the end of this century with a warmer climate [18]. Such increased flood peaks and flood frequency were closely related to the frequent extreme precipitation events in the context of global warming [18,33,59].
In rain-dominant basins, floods are mostly associated with storms in the wet season [56]. In study watersheds, although high flow magnitude was significantly (p < 0.05) related to the rainfall regime including summer and annual precipitation (Table 3), they were also significantly (p < 0.05) related to Tmax and Ta6, which exhibited significantly (p < 0.05) positive trends in the UHR and GR watersheds, respectively, over the study period. This indicated that the reduction of high flow magnitude may be attributed to the combined effects of changes in precipitation characteristics and climate warming. Although the summer and annual precipitation amount were similar in the selected paired years, the precipitation characteristics including intensity, frequency and duration may significantly affect the high flow magnitude [60,61]. However, there was an opposite trend between high flow magnitude and extreme precipitation (heavy precipitation) in the study watersheds. For example, in UHR watershed, the average magnitude of heavy precipitation (maximum 5% of daily precipitation in the water year) and extreme precipitation (annual maximum daily precipitation) increased by 4.7% and 28.3%, respectively, in warming years. We also found that the average magnitude of spring high flows was much lower than that of summer/fall high flows, with the reductions being 21.6% and 31.3% in the UHR and GR watersheds, respectively, in the warming period. This suggested that climate warming-induced more frequent spring high flow also contributed to the reduction of average high flow magnitude. The impacts of other precipitation characteristics, such as frequency and duration, on high flow magnitude need more process-based researches to investigate.
In addition to precipitation characteristics, antecedent soil moisture also influences high flow magnitude [52,53]. For instant, Ryberg, et al. [20] found that the odds of summer/fall peaks occurring have increased across the north-central USA, when controlling for antecedent wet and dry conditions and geographical differences by using different models. In study watersheds, higher air temperature resulted in earlier snowmelt and more spring high flows in selected warming years, which consequently resulted in a longer low flow period between snowmelt spring high flow and summer peak as spring high flows occurred earlier. Thus, the magnitude of summer/fall rain-generated high flow was expected to be lower in the warming years than that in the reference years because of the lower antecedent soil moisture [54]. Such changing hydrography can also be seen in the hydrography of the UHR watershed in the warming year 2004 (Figure 6), in which the annual maximum discharge occurred in early spring, while there was no peak runoff generated in summer after a long low flow period, despite the rainfall peaks in July.
4.3. Implications of High Flow Regime Change for Future Watershed Management
Climate warming-induced earlier snowmelt and consequently advanced streamflow timing have attracted extensive attention in the snow-dominated regions, where water supply is dominated by melting snow packs, and increased fractions of annual flow occurring earlier in spring will lead to an issue of water shortages later in the highest water demand seasons of summer and autumn [5]. Our results indicated that earlier high flow timings also happened in the warming years in the study rain-dominated watersheds in the cold regions of north-eastern China. Such high flow regime shift was attributed to more frequent high flow events in spring because of the increased spring rain and earlier snowmelt in the warming years. This finding provided useful information for water resource management, especially for flood forecasting. High flows are expected to happen earlier when there was a higher spring rain in the water year. Also, wet season peak flows will be at a relatively low level when more high flow events happen in spring in a warming climate, even though the magnitude of peak rainfall maintains the same level. Such high flow regime shifting has positive effects on flood risk management [62]. However, it is a challenge for water resource management, because of the earlier high flows lead to a shift in annual flow spring, away from summer and autumn when demand is highest. This may cause a shortage of water for irrigation and domestic water supply, especially for the more southerly region (GR watershed), as the downstream of this region is Nenjiang Plain that is one of the major crop-producing areas in north-eastern China. Thus, it is necessary to consider the construction of large reservoirs or hydropower stations to store early water yield and release at other times of the year for an effective water resource management in the context of future global warming [63].
4.4. Limitations and Future Research Direction
Although this study successfully detected the response of magnitude and timing of high flows to climate warming in two large rain-dominated watersheds in the cold region of north-eastern China by using a paired-year approach in the last four decades, several limitations may still exist. Firstly, although the spatial heterogeneity in climate was expected to be minimal because the study region is mainly characterized by gentle undulations [22], the sparse monitoring of precipitation may cause measurement errors given the large size of the study watersheds [64]. The climate stations are both located at the outlet of the watersheds with lower elevation; and the precipitation at high elevation may be more than that measured at the climate stations, especially for the part of precipitation falling as snowfall [65]. Second, the study watersheds are located in the southernmost distribution of permafrost that extends from the Arctic region of Eurasia [66], which experienced rapid warming and thawing due to the significant warming in north-eastern China in the past half a century [67,68]. The permafrost thaw can alter the conditions of soil moisture [69] and the surface hydrologic connectivity [70], and consequently affect the high flow regimes. The impacts of permafrost thaw on high flow regimes can be considered as the indirect impacts of climate warming in this study. Thirdly, it should be noted that the results could be different due to the different maximum allowable bias of controlling precipitation variables for pairing. According to the current bias (15%), 71% and 85% of all study water years were selected for the magnitude analysis, while the percentages were 87% and 79% for the timing analysis for the UHR and GR watersheds, respectively. If the bias is set to be 10%, the percentages of paired years for both magnitude and timing analysis will be reduced to approximately 50%, and the changes in timing will increase from 21 and 25 days to 22 and 27 days, while the changes in the magnitude will increase from 13.7% and 14.0% to 17.6% and 24.9% for the UHR and GR watersheds, respectively. Although the changing trends of high flow regimes are consistent when the bias changed, the magnitude of changes in high flow regimes increase is associated with the decreasing bias. This means the relatively small allowable bias helps increase the representatives of selected paired years. However, it also reduces the sample size, which may consequently lead to the uncertainty of statistical analysis. This highlights the importance of consideration of the selected maximum allowable bias used in the paired-year approach in future studies. Nevertheless, in this study, we believe the data from selected paired years based on the current maximum allowable bias (15%) were reasonably representative of the trends of the entire study water years because the results were consistent with calculated based on the relative small bias (10%) discussed above as well as those from the Mann–Kendall trend test over the entire study period in the current study. Finally, this study mainly focuses on the impacts of climate warming-induced changes in precipitation regimes on high flow, and still lacks the responses of high flow regime to the changes in precipitation characteristics in the wet season, which need more process-based and modeling studies to investigate.
5. Conclusions
This present study has detected the high flow regime shifts and their connections with climate warming in two large rain-dominated watersheds in the cold region of north-eastern China. We found that the high flow timings of both watersheds exhibited significant negative trends shift to earlier in the water year associated with the significant increasing trends in air temperature over the study period (1975–2013). The results from a paired-year approach indicated that the magnitude of high flows was much lower in the warming years than those in the reference years, which means that the flood risk was reduced in the warming years in the study watersheds. The average timings of high flows in the warming years were significantly advanced by 21 and 25 days in the UHR and GR watersheds, respectively. Such a shift toward earlier timings of high flows was at least partly related to the more frequent occurrence of spring high flows because of climate warming-induced earlier snowmelt and an increased spring rain ratio, even though the average high flow timing was still dominated by summer peak rainfall regimes. These findings have implications for water resource management, especially for flood forecasting and the construction of reservoirs.
Author Contributions
L.D. and T.C. conceived and designed the research themes; L.D. wrote the paper. T.C. contributed to data preparation.
Funding
This research was funded by the National Key R&D Program of China (2018YFC0507302) and the National Natural Science Foundation of China (Grant No. 31770488).
Acknowledgments
This work is also supported by CFERN & BEIJING TECHNO SOLUTIONS Award Funds on excellent academic achievements. We also thank the three anonymous reviewers for their thoughtful comments that significantly improved the paper.
Conflicts of Interest
The authors declare no conflict of interest.
Appendix A

Table A1.
Canonical factor structure coefficients of climate variables in the UHR watershed.
| Sets of Climatic Variables | Factor Structure Coefficients | ||||||
|---|---|---|---|---|---|---|---|
| Magnitude | Timing | ||||||
| Tmax | Summer P | Annual P | Tmax | Spring P | Spring Rain | Autumn P | |
| Tmax, Summer P, Annual P | 0.43 | −0.97 | −0.95 | ||||
| Tmax, Summer P | 0.43 | −0.98 | |||||
| Tmax, Annual P | 0.45 | −0.99 | |||||
| Tmax, Spring P, Spring Rain, Autumn P | 0.49 | 0.66 | 0.54 | −0.67 | |||
| Tmax, Spring P, Autumn P | 0.49 | 0.66 | −0.67 | ||||
| Tmax, Spring Rain, Autumn P | 0.52 | 0.57 | −0.72 | ||||
| Tmax, Spring P, Spring Rain | 0.59 | 0.78 | 0.64 | ||||
| Spring Rain, Spring P, Autumn P | 0.73 | 0.60 | −0.75 | ||||
| Spring Rain, Spring P | 1.00 | 0.82 | |||||
| Spring Rain, Autumn P | 0.64 | −0.80 | |||||
Table A2.
Canonical factor structure coefficients of climate variables in the GR watershed.
| Sets of Climatic Variables | Factor Structure Coefficients | ||||||
|---|---|---|---|---|---|---|---|
| Magnitude | Timing | ||||||
| Ta6 | Summer P | Annual P | Tave | Tmin | Spring Rain | Autumn P | |
| Ta6, Summer P, Annual P | 0.40 | −0.99 | −0.96 | ||||
| Ta6, Summer P | 0.40 | −1.00 | |||||
| Ta6, Annual P | 0.41 | −1.00 | |||||
| Tave, Tmin, Spring Rain, Autumn P | 0.54 | 0.49 | 0.75 | −0.59 | |||
| Tave, Tmin, Autumn P | 0.66 | 0.60 | −0.72 | ||||
| Tave, Spring Rain, Autumn P | 0.54 | 0.75 | −0.59 | ||||
| Tave, Autumn P | 0.66 | −0.72 | |||||
| Tmin, Spring Rain, Autumn P | 0.50 | 0.77 | −0.60 | ||||
| Tmin, Autumn P | 0.61 | −0.73 | |||||
| Spring Rain, Autumn P | 0.83 | −0.65 | |||||
Appendix B
Table A3.
Selected pairs for quantifying the effect of climate warming on high flow magnitude in the UHR watershed.
Table A3.
Selected pairs for quantifying the effect of climate warming on high flow magnitude in the UHR watershed.
| Pair No. | Pair Type | Year | Summer P | Annual P | Tmax |
|---|---|---|---|---|---|
| 1 | Reference | 1975 | 330.8 | 480.0 | 5.4 |
| Warming | 2011 | 324.2 | 466.2 | 6.2 | |
| 2 | Reference | 1975 | 330.8 | 480.0 | 5.4 |
| Warming | 2012 | 322.6 | 438.2 | 6.1 | |
| 3 | Reference | 1977 | 372.6 | 492.0 | 4.1 |
| Warming | 1990 | 371.3 | 517.5 | 6.5 | |
| 4 | Reference | 1977 | 372.6 | 492.0 | 4.1 |
| Warming | 1992 | 374.6 | 519.3 | 5.4 | |
| 5 | Reference | 1977 | 372.6 | 492.0 | 4.1 |
| Warming | 2006 | 353.2 | 471.4 | 5.5 | |
| 6 | Reference | 1977 | 372.6 | 492.0 | 4.1 |
| Warming | 2010 | 378.4 | 555.9 | 5.1 | |
| 7 | Reference | 1978 | 225.6 | 391.6 | 4.9 |
| Warming | 1994 | 222.0 | 430.8 | 5.0 | |
| 8 | Reference | 1980 | 271.5 | 485.6 | 4.0 |
| Warming | 1995 | 286.9 | 492.4 | 6.1 | |
| 9 | Reference | 1980 | 271.5 | 485.6 | 4.0 |
| Warming | 1996 | 281.6 | 449.7 | 6.2 | |
| 10 | Reference | 1980 | 271.5 | 485.6 | 4.0 |
| Warming | 1999 | 267.8 | 511.2 | 4.7 | |
| 11 | Reference | 1980 | 271.5 | 485.6 | 4.0 |
| Warming | 2004 | 269.6 | 530.6 | 5.7 | |
| 12 | Reference | 1980 | 271.5 | 485.6 | 4.0 |
| Warming | 2008 | 239.2 | 481.3 | 7.6 | |
| 13 | Reference | 1981 | 298.1 | 458.6 | 4.8 |
| Warming | 1989 | 310.3 | 450.6 | 6.7 | |
| 14 | Reference | 1981 | 298.1 | 458.6 | 4.8 |
| Warming | 1995 | 286.9 | 492.4 | 6.1 | |
| 15 | Reference | 1981 | 298.1 | 458.6 | 4.8 |
| Warming | 1996 | 281.6 | 449.7 | 6.2 | |
| 16 | Reference | 1981 | 298.1 | 458.6 | 4.8 |
| Warming | 2007 | 291.8 | 440.2 | 6.7 | |
| 17 | Reference | 1981 | 298.1 | 458.6 | 4.8 |
| Warming | 2011 | 324.2 | 466.2 | 6.2 | |
| 18 | Reference | 1984 | 361.7 | 559.9 | 5.0 |
| Warming | 1993 | 411.0 | 584.4 | 6.1 | |
| 19 | Reference | 1984 | 361.7 | 559.9 | 5.0 |
| Warming | 2000 | 381.6 | 581.0 | 6.6 | |
| 20 | Reference | 1985 | 301.5 | 531.5 | 3.8 |
| Warming | 1997 | 298.7 | 504.7 | 5.1 | |
| 21 | Reference | 1987 | 259.3 | 391.3 | 4.4 |
| Warming | 2007 | 291.8 | 440.2 | 6.7 | |
| 22 | Reference | 1988 | 270.3 | 429.7 | 4.7 |
| Warming | 1996 | 281.6 | 449.7 | 6.2 | |
| Reference | Average | 305.6 | 479.0 | 4.6 | |
| Warming | Average | 314.9 | 487.2 | 6.0 |
Table A4.
Selected pairs for quantifying the effect of climate warming on high flow magnitude in the GR watershed.
Table A4.
Selected pairs for quantifying the effect of climate warming on high flow magnitude in the GR watershed.
| Pair No. | Pair Type | Year | Summer P | Annual P | Ta6 |
|---|---|---|---|---|---|
| 1 | Reference | 1975 | 308.3 | 459.2 | 522.6 |
| Warming | 2008 | 301.0 | 476.9 | 567.0 | |
| 2 | Reference | 1976 | 374.3 | 515.3 | 417.2 |
| Warming | 1990 | 378.4 | 516.1 | 490.0 | |
| 3 | Reference | 1976 | 374.3 | 515.3 | 417.2 |
| Warming | 2009 | 374.8 | 490.8 | 429.7 | |
| 4 | Reference | 1976 | 374.3 | 515.3 | 417.2 |
| Warming | 2010 | 406.0 | 560.4 | 620.4 | |
| 5 | Reference | 1977 | 463.8 | 545.5 | 494.2 |
| Warming | 2010 | 406.0 | 560.4 | 620.4 | |
| 6 | Reference | 1978 | 217.3 | 391.8 | 509.2 |
| Warming | 1995 | 236.4 | 364.3 | 540.9 | |
| 7 | Reference | 1978 | 217.3 | 391.8 | 509.2 |
| Warming | 2005 | 189.9 | 349.4 | 534.2 | |
| 8 | Reference | 1979 | 203.3 | 317.0 | 507.8 |
| Warming | 2007 | 177.2 | 310.6 | 577.5 | |
| 9 | Reference | 1980 | 368.4 | 556.1 | 526.7 |
| Warming | 2000 | 329.2 | 516.4 | 575.8 | |
| 10 | Reference | 1981 | 441.7 | 547.3 | 448.3 |
| Warming | 1992 | 404.5 | 578.5 | 505.3 | |
| 11 | Reference | 1981 | 441.7 | 547.3 | 448.3 |
| Warming | 1999 | 445.7 | 611.9 | 478.6 | |
| 12 | Reference | 1981 | 441.7 | 547.3 | 448.3 |
| Warming | 2006 | 438.8 | 556.8 | 480.0 | |
| 13 | Reference | 1982 | 259.2 | 450.0 | 516.8 |
| Warming | 1994 | 226.5 | 515.6 | 552.2 | |
| 14 | Reference | 1982 | 259.2 | 450.0 | 516.8 |
| Warming | 2001 | 269.4 | 391.8 | 535.1 | |
| 15 | Reference | 1982 | 259.2 | 450.0 | 516.8 |
| Warming | 2002 | 263.1 | 434.5 | 540.0 | |
| 16 | Reference | 1983 | 381.1 | 574.4 | 403.5 |
| Warming | 1990 | 378.4 | 516.1 | 490.0 | |
| 17 | Reference | 1983 | 381.1 | 574.4 | 403.5 |
| Warming | 2010 | 406.0 | 560.4 | 620.4 | |
| 18 | Reference | 1983 | 381.1 | 574.4 | 403.5 |
| Warming | 1993 | 413.4 | 632.7 | 466.2 | |
| 19 | Reference | 1984 | 351.9 | 475.5 | 475.9 |
| Warming | 1990 | 378.4 | 516.1 | 490.0 | |
| 20 | Reference | 1985 | 346.7 | 535.3 | 497.9 |
| Warming | 2000 | 329.2 | 516.4 | 575.8 | |
| 21 | Reference | 1985 | 346.7 | 535.3 | 497.9 |
| Warming | 2004 | 314.5 | 575.5 | 572.9 | |
| 22 | Reference | 1987 | 338.3 | 441.5 | 513.7 |
| Warming | 2008 | 301.0 | 476.9 | 567.0 | |
| 23 | Reference | 1988 | 444.6 | 618.5 | 527.3 |
| Warming | 1997 | 424.2 | 670.8 | 528.3 | |
| 24 | Reference | 1988 | 444.6 | 618.5 | 527.3 |
| Warming | 2013 | 431.2 | 650.2 | 569.2 | |
| Reference | Average | 350.8 | 506.1 | 477.8 | |
| Warming | Average | 342.6 | 514.6 | 538.6 |
Table A5.
Selected pairs for quantifying the effect of climate warming on high flow timing in the UHR watershed.
Table A5.
Selected pairs for quantifying the effect of climate warming on high flow timing in the UHR watershed.
| Pair No. | Pair Type | Year | Autumn P | Tmax | Spring Rain |
|---|---|---|---|---|---|
| 1 | Reference | 1975 | 52.7 | 5.5 | 55.9 |
| Warming | 1989 | 48.6 | 6.6 | 57.1 | |
| 2 | Reference | 1976 | 48.6 | 5.3 | 45.8 |
| Warming | 1989 | 48.6 | 6.6 | 57.1 | |
| 3 | Reference | 1976 | 48.6 | 5.3 | 45.8 |
| Warming | 1998 | 44.2 | 6.1 | 57.4 | |
| 4 | Reference | 1977 | 54.7 | 4.2 | 14.8 |
| Warming | 2002 | 52.2 | 7.9 | 37.2 | |
| 5 | Reference | 1977 | 54.7 | 4.2 | 14.8 |
| Warming | 2013 | 51.9 | 5.1 | 139.6 | |
| 6 | Reference | 1978 | 105.5 | 4.8 | 31.1 |
| Warming | 1994 | 91.4 | 5.2 | 53.4 | |
| 7 | Reference | 1979 | 96.5 | 5.5 | 13.4 |
| Warming | 1995 | 93.1 | 6.2 | 34.9 | |
| 8 | Reference | 1979 | 96.5 | 5.5 | 13.4 |
| Warming | 1996 | 85.0 | 5.9 | 48.3 | |
| 9 | Reference | 1980 | 95.0 | 3.9 | 66.6 |
| Warming | 2001 | 81.9 | 4.4 | 74.6 | |
| 10 | Reference | 1981 | 38.6 | 4.9 | 31.2 |
| Warming | 1991 | 42.6 | 5.7 | 37.0 | |
| 11 | Reference | 1981 | 38.6 | 4.9 | 31.2 |
| Warming | 2007 | 38.5 | 6.7 | 66.4 | |
| 12 | Reference | 1981 | 38.6 | 4.9 | 31.2 |
| Warming | 2011 | 34.7 | 6.6 | 65.6 | |
| 13 | Reference | 1982 | 146.9 | 5.2 | 60.6 |
| Warming | 2008 | 143.9 | 7.5 | 63.5 | |
| 14 | Reference | 1984 | 105.4 | 4.9 | 21.6 |
| Warming | 2000 | 102.1 | 6.7 | 15.5 | |
| 15 | Reference | 1985 | 77.1 | 4.0 | 39.7 |
| Warming | 2004 | 71.4 | 6.0 | 82.7 | |
| 16 | Reference | 1985 | 77.1 | 4.0 | 39.7 |
| Warming | 1993 | 78.4 | 5.9 | 47.0 | |
| 17 | Reference | 1986 | 15.9 | 6.0 | 6.2 |
| Warming | 2006 | 19.9 | 5.4 | 21.3 | |
| 18 | Reference | 1987 | 61.9 | 4.4 | 11.7 |
| Warming | 1990 | 67.7 | 6.7 | 30.5 | |
| 19 | Reference | 1987 | 61.9 | 4.4 | 11.7 |
| Warming | 2010 | 60.4 | 5.0 | 42.5 | |
| 20 | Reference | 1987 | 61.9 | 4.4 | 11.7 |
| Warming | 1997 | 67.0 | 5.0 | 62.7 | |
| 21 | Reference | 1987 | 61.9 | 4.4 | 11.7 |
| Warming | 2012 | 60.4 | 5.6 | 47.6 | |
| Reference | Average | 68.5 | 4.8 | 29.0 | |
| Warming | Average | 65.9 | 6.0 | 54.4 |
Table A6.
Selected pairs for quantifying the effect of climate warming on high flow timing in the GR watershed.
Table A6.
Selected pairs for quantifying the effect of climate warming on high flow timing in the GR watershed.
| Pair No. | Pair Type | Year | Autumn P | Tmax | Spring Rain |
|---|---|---|---|---|---|
| 1 | Reference | 1975 | 46.9 | −0.8 | 35.4 |
| Warming | 1996 | 45.1 | −0.1 | 50.7 | |
| 2 | Reference | 1976 | 32.5 | −1.0 | 42.9 |
| Warming | 2005 | 34.5 | 0.3 | 52.1 | |
| 3 | Reference | 1976 | 32.5 | −1.0 | 42.9 |
| Warming | 2007 | 28.8 | 0.7 | 67.3 | |
| 4 | Reference | 1977 | 36.5 | −2.1 | 14.5 |
| Warming | 2001 | 38.1 | −1.2 | 36.4 | |
| 5 | Reference | 1977 | 36.5 | −2.1 | 14.5 |
| Warming | 2005 | 34.5 | 0.3 | 52.1 | |
| 6 | Reference | 1977 | 36.5 | −2.1 | 14.5 |
| Warming | 2006 | 36.9 | −0.7 | 26.4 | |
| 7 | Reference | 1978 | 69.4 | −1.7 | 38.8 |
| Warming | 2011 | 62.8 | 0.4 | 95.0 | |
| 8 | Reference | 1979 | 70.0 | −0.7 | 1.7 |
| Warming | 1991 | 80.8 | 0.1 | 23.2 | |
| 9 | Reference | 1979 | 70.0 | −0.7 | 1.7 |
| Warming | 2013 | 64.7 | −0.7 | 91.4 | |
| 10 | Reference | 1980 | 106.2 | −1.6 | 14.0 |
| Warming | 1992 | 97.9 | −0.2 | 14.9 | |
| 11 | Reference | 1980 | 106.2 | −1.6 | 14.0 |
| Warming | 1995 | 93.0 | 0.3 | 15.3 | |
| 12 | Reference | 1980 | 106.2 | −1.6 | 14.0 |
| Warming | 1998 | 95.4 | 0.4 | 51.7 | |
| 13 | Reference | 1980 | 106.2 | −1.6 | 14.0 |
| Warming | 2000 | 95.3 | 0.4 | 18.4 | |
| 14 | Reference | 1980 | 106.2 | −1.6 | 14.0 |
| Warming | 2004 | 96.7 | 0.0 | 88.4 | |
| 15 | Reference | 1981 | 31.6 | −0.7 | 29.4 |
| Warming | 1989 | 29.8 | 0.3 | 29.6 | |
| 16 | Reference | 1981 | 31.6 | −0.7 | 29.6 |
| Warming | 2005 | 34.5 | 0.3 | 52.1 | |
| 17 | Reference | 1981 | 31.6 | −0.7 | 29.6 |
| Warming | 2007 | 28.8 | 0.7 | 67.3 | |
| 18 | Reference | 1982 | 95.4 | −0.8 | 52.7 |
| Warming | 1997 | 91.4 | −0.8 | 85.6 | |
| 19 | Reference | 1982 | 95.4 | −0.8 | 52.7 |
| Warming | 1998 | 95.4 | 0.4 | 55.7 | |
| 20 | Reference | 1983 | 68.6 | −1.1 | 27.3 |
| Warming | 2011 | 62.8 | 0.4 | 95.0 | |
| 21 | Reference | 1984 | 50.6 | −0.9 | 20.8 |
| Warming | 1990 | 55.5 | 0.7 | 41.9 | |
| 22 | Reference | 1985 | 134.3 | −1.4 | 6.9 |
| Warming | 1993 | 144.9 | 0.0 | 38.2 | |
| 23 | Reference | 1985 | 134.3 | −1.4 | 6.9 |
| Warming | 2003 | 125.5 | 0.0 | 9.3 | |
| 24 | Reference | 1987 | 44.4 | −1.8 | 9.1 |
| Warming | 1996 | 45.1 | −0.1 | 50.7 | |
| 25 | Reference | 1987 | 44.4 | −1.8 | 9.1 |
| Warming | 2010 | 43.9 | −0.9 | 50.4 | |
| Reference | Average | 69.0 | −1.3 | 22.0 | |
| Warming | Average | 66.5 | 0.0 | 50.4 |
References
- Poff, N.L.; Allan, J.D.; Bain, M.B.; Karr, J.R.; Prestegaard, K.L.; Richter, B.D.; Sparks, R.E.; Stromberg, J.C. The natural flow regime. Bioscience 1997, 47, 769–784. [Google Scholar] [CrossRef]
- Poff, N.L.; Zimmerman, J.K.H. Ecological responses to altered flow regimes: A literature review to inform the science and management of environmental flows. Freshw. Biol. 2010, 55, 194–205. [Google Scholar] [CrossRef]
- Arnell, N.W.; Gosling, S.N. The impacts of climate change on river flow regimes at the global scale. J. Hydrol. 2013, 486, 351–364. [Google Scholar] [CrossRef]
- Adam, J.C.; Hamlet, A.F.; Lettenmaier, D.P.; Jong, C.D.; Essery, R.; Lawler, D. Implications of global climate change for snowmelt hydrology in the twenty-first century. Hydrol. Process. 2009, 23, 962–972. [Google Scholar] [CrossRef]
- Barnett, T.P.; Adam, J.C.; Lettenmaier, D.P. Potential impacts of a warming climate on water availability in snow-dominated regions. Nature 2005, 438, 303–309. [Google Scholar] [CrossRef] [PubMed]
- Stewart, I.T.; Cayan, D.R.; Dettinger, M.D. Changes in snowmelt runoff timing in Western North America under a ‘business as usual’ climate change scenario. Clim. Chang. 2004, 62, 217–232. [Google Scholar] [CrossRef]
- Stewart, I.T. Changes in snowpack and snowmelt runoff for key mountain regions. Hydrol. Process. 2009, 23, 78–94. [Google Scholar] [CrossRef]
- Wilson, D.; Hisdal, H.; Lawrence, D. Has streamflow changed in the Nordic countries?—Recent trends and comparisons to hydrological projections. J. Hydrol. 2010, 394, 334–346. [Google Scholar] [CrossRef]
- Tennant, C.J.; Crosby, B.T.; Godsey, S.E. Elevation-dependent responses of streamflow to climate warming. Hydrol. Process. 2015, 29, 991–1001. [Google Scholar] [CrossRef]
- Hidalgo, H.G.; Das, T.; Dettinger, M.D.; Cayan, D.R.; Pierce, D.W.; Barnett, T.P.; Bala, G.; Mirin, A.; Bonfils, C.; Santer, B.D. Detection and attribution of streamflow timing changes to climate change in the western United States. J. Clim. 2009, 22, 3838–3855. [Google Scholar] [CrossRef]
- Bell, V.A.; Kay, A.L.; Davies, H.N.; Jones, R.G. An assessment of the possible impacts of climate change on snow and peak river flows across Britain. Clim. Chang. 2016, 136, 539–553. [Google Scholar] [CrossRef] [Green Version]
- Stewart, I.T.; Cayan, D.R.; Dettinger, M.D. Changes toward earlier streamflow timing across Western North America. J. Clim. 2010, 18, 1136–1155. [Google Scholar] [CrossRef]
- Hodgkins, G.A.; Dudley, R.W. Changes in the timing of winter–spring streamflows in Eastern North America, 1913–2002. Geophys. Res. Lett. 2006, 33, 429–453. [Google Scholar] [CrossRef]
- Morán-Tejeda, E.; Lorenzo-Lacruz, J.; López-Moreno, J.I.; Rahman, K.; Beniston, M. Streamflow timing of mountain rivers in Spain: Recent changes and future projections. J. Hydrol. 2014, 517, 1114–1127. [Google Scholar] [CrossRef] [Green Version]
- Cortés, G.; Vargas, X.; Mcphee, J. Climatic sensitivity of streamflow timing in the extratropical Western Andes Cordillera. J. Hydrol. 2011, 405, 93–109. [Google Scholar] [CrossRef]
- Molini, A.; Katul, G.G.; Porporato, A. Maximum discharge from snowmelt in a changing climate. Geophys. Res. Lett. 2011, 38, 387–404. [Google Scholar] [CrossRef]
- Allamano, P.; Claps, P.; Laio, F. Global warming increases flood risk in mountainous areas. Geophys. Res. Lett. 2009, 36, 392–395. [Google Scholar] [CrossRef]
- Hirabayashi, Y.; Mahendran, R.; Koirala, S.; Konoshima, L.; Dai, Y.; Watanabe, S.; Kim, H.; Kanae, S. Global flood risk under climate change. Nat. Clim. Chang. 2013, 3, 816–821. [Google Scholar] [CrossRef]
- Mirza, M.M.Q. Global warming and changes in the probability of occurrence of floods in Bangladesh and implications. Glob. Environ. Chang. 2002, 12, 127–138. [Google Scholar] [CrossRef]
- Ryberg, K.R.; Akyüz, F.A.; Wiche, G.J.; Lin, W. Changes in seasonality and timing of peak streamflow in snow and semi-arid climates of the North-Central United States, 1910–2012. Hydrol. Process. 2016, 30, 1208–1218. [Google Scholar] [CrossRef]
- Duan, L.L.; Man, X.L.; Kurylyk, B.L.; Cai, T.J. Increasing winter baseflow in response to permafrost thaw and precipitation regime shifts in Northeastern China. Water 2017, 9, 25. [Google Scholar] [CrossRef]
- Duan, L.L.; Man, X.L.; Kurylyk, B.L.; Cai, T.J.; Li, Q. Distinguishing streamflow trends caused by changes in climate, forest cover, and permafrost in a large watershed in Northeastern China. Hydrol. Process. 2017, 31, 1938–1951. [Google Scholar] [CrossRef]
- Sui, J.; Koehler, G. Rain-on-snow induced flood events in Southern Germany. J. Hydrol. 2001, 252, 205–220. [Google Scholar] [CrossRef]
- Piao, S.L.; Ciais, P.; Huang, Y.; Shen, Z.H.; Peng, S.S.; Li, J.S.; Zhou, L.P.; Liu, H.Y.; Ma, Y.C.; Ding, Y.H.; et al. The impacts of climate change on water resources and agriculture in China. Nature 2010, 467, 43–51. [Google Scholar] [CrossRef] [PubMed]
- Cao, L.; Zhu, Y.; Tang, G.; Yuan, F.; Yan, Z. Climatic warming in china according to a homogenized data set from 2419 stations. Int. J. Climatol. 2016, 36, 4384–4392. [Google Scholar] [CrossRef]
- Yang, X.F.; Bao, X.L.; Hu, G.Q.; Shao, S.; Zhou, F.; Ye, J.S.; Xie, H.T.; Liang, C. C:N:P stoichiometry characteristics of litter and soil of forests in Great Xing’an Mountains with different fire years. Chin. J. Appl. Ecol. 2016, 27, 1359–1367. [Google Scholar]
- Luce, C.H.; Holden, Z.A. Declining annual streamflow distributions in the Pacific Northwest United States, 1948–2006. Geophys. Res. Lett. 2009, 36, L16401. [Google Scholar] [CrossRef]
- Shao, H.; Wang, Y.; Zhou, L. Surface water resources investigation and evaluation of the Da Hinggan Mountains. Heilongjiang Sci. Technol. Water Conserv. 2008, 35, 126–127. [Google Scholar]
- Duan, L.L.; Cai, T.J. Quantifying impacts of forest recovery on water yield in two large watersheds in the cold region of Northeast China. Forests 2018, 9, 392. [Google Scholar] [CrossRef]
- Zhao, Y.; Zhu, J.; Xu, Y. Establishment and assessment of the grid precipitation datasets in China for recent 50 years. J. Meteorol. Sci. 2014, 34, 414–420. [Google Scholar]
- Richter, B.D.; Baumgartner, J.V.; Powell, J.; Braun, D.P. A method for assessing hydrologic alteration within ecosystems. Conserv. Biol. 1996, 10, 1163–1174. [Google Scholar] [CrossRef]
- Zhang, M.F.; Wei, X.H. Alteration of flow regimes caused by large-scale forest disturbance: A case study from a large watershed in the interior of British Columbia, Canada. Ecohydrology 2014, 7, 544–556. [Google Scholar] [CrossRef]
- Apel, H.; Thieken, A.H.; Merz, B.; Blöschl, G. Flood risk assessment and associated uncertainty. Nat. Hazards Earth Syst. Sci. 2004, 4, 295–308. [Google Scholar] [CrossRef] [Green Version]
- Brown, A.E.; Zhang, L.; McMahon, T.A.; Western, A.W.; Vertessy, R.A. A review of paired catchment studies for determining changes in water yield resulting from alterations in vegetation. J. Hydrol. 2005, 310, 28–61. [Google Scholar] [CrossRef]
- Liu, W.; Wei, X.; Liu, S.; Liu, Y.; Fan, H.; Zhang, M.; Yin, J.; Zhan, M. How do climate and forest changes affect long-term streamflow dynamics? A case study in the upper reach of Poyang River basin. Ecohydrology 2015, 8, 46–57. [Google Scholar] [CrossRef]
- Kendall, M.G. Rank Correlation Measures; Charles Griffin: London, UK, 1975; p. 202. [Google Scholar]
- Mann, H.B. Nonparametric tests against trend. Econ. J. Econ. Soc. 1945, 13, 245–259. [Google Scholar] [CrossRef]
- Hirsch, R.M.; Slack, J.R.; Smith, R.A. Techniques of trend analysis for monthly water-quality data. Water Resour. Res. 1982, 18, 107–121. [Google Scholar] [CrossRef]
- Sen, P.K. Estimates of the regression coefficient based on kendall’s tau. J. Am. Stat. Assoc. 1968, 63, 1379–1389. [Google Scholar] [CrossRef]
- Zhang, X.P.; Zhang, L.; Zhao, J.; Rustomji, P.; Hairsine, P. Responses of streamflow to changes in climate and land use/cover in the Loess Plateau, China. Water Resour. Res. 2008, 44. [Google Scholar] [CrossRef] [Green Version]
- Liu, W.; Wei, X.; Fan, H.; Guo, X.; Liu, Y.; Zhang, M.; Li, Q. Response of flow regimes to deforestation and reforestation in a rain-dominated large watershed of subtropical China. Hydrol. Process. 2015, 29, 5003–5015. [Google Scholar] [CrossRef]
- Zhang, M.F.; Wei, X.H.; Li, Q. A quantitative assessment on the response of flow regimes to cumulative forest disturbances in large snow-dominated watersheds in the interior of British Columbia, Canada. Ecohydrology 2016, 9, 843–859. [Google Scholar] [CrossRef]
- Masih, I.; Uhlenbrook, S.; Maskey, S.; Smakhtin, V. Streamflow trends and climate linkages in the Zagros Mountains, Iran. Clim. Chang. 2011, 104, 317–338. [Google Scholar] [CrossRef]
- Pettitt, A. A non-parametric approach to the change-point problem. Appl. Stat. 1979, 28, 126–135. [Google Scholar] [CrossRef]
- Ma, Z.M.; Kang, S.Z.; Zhang, L.; Tong, L.; Su, X.L. Analysis of impacts of climate variability and human activity on streamflow for a river basin in arid region of Northwest China. J. Hydrol. 2008, 352, 239–249. [Google Scholar] [CrossRef]
- Yang, Z.; Zhou, Y.; Wenninger, J.; Uhlenbrook, S. The causes of flow regime shifts in the semi-arid Hailiutu River, Northwest china. Hydrol. Earth Syst. Sci. 2012, 16, 87–103. [Google Scholar] [CrossRef] [Green Version]
- Hodgkins, G.A.; Dudley, R.W.; Huntington, T.G. Changes in the timing of high river flows in New England over the 20th century. J. Hydrol. 2003, 278, 244–252. [Google Scholar] [CrossRef]
- Maurer, E.P.; Stewart, I.T.; Bonfils, C.; Duffy, P.B.; Cayan, D. Detection, attribution, and sensitivity of trends toward earlier streamflow in the Sierra Nevada. J. Geophys. Res. Atmos. 2007, 112, 71–81. [Google Scholar] [CrossRef]
- Kay, A.L.; Crooks, S.M. An investigation of the effect of transient climate change on snowmelt, flood frequency and timing in Northern Britain. Int. J. Climatol. 2014, 34, 3368–3381. [Google Scholar] [CrossRef] [Green Version]
- Garvelmann, J.; Pohl, S.; Weiler, M. Spatio-temporal controls of snowmelt and runoff generation during rain-on-snow events in a mid-latitude mountain catchment. Hydrol. Process. 2015, 29, 3649–3664. [Google Scholar] [CrossRef]
- Groisman, P.Y.; Knight, R.W.; Karl, T.R. Heavy precipitation and high streamflow in the contiguous United States: Trends in the twentieth century. Bull. Am. Meteorol. Soc. 2001, 82, 219–246. [Google Scholar] [CrossRef]
- Michele, C.D.; Salvadori, G. On the derived flood frequency distribution: Analytical formulation and the influence of antecedent soil moisture condition. J. Hydrol. 2002, 262, 245–258. [Google Scholar] [CrossRef]
- Ryberg, K.R.; Lin, W.; Vecchia, A.V. Impact of climate variability on runoff in the north central United States. J. Hydrol. Eng. 2014, 19, 148–158. [Google Scholar] [CrossRef]
- Haga, H.; Matsumoto, Y.; Matsutani, J.; Fujita, M.; Nishida, K.; Sakamoto, Y. Flow paths, rainfall properties, and antecedent soil moisture controlling lags to peak discharge in a granitic unchanneled catchment. Water Resour. Res. 2005, 41, 2179–2187. [Google Scholar] [CrossRef]
- Wilhelm, B.; Arnaud, F.; Enters, D.; Allignol, F.; Legaz, A.; Magand, O.; Revillon, S.; Giguet-Covex, C.; Malet, E. Does global warming favour the occurrence of extreme floods in European Alps? First evidences from a NW Alps proglacial lake sediment record. Clim. Chang. 2012, 113, 563–581. [Google Scholar] [CrossRef]
- Hamlet, A.F.; Lettenmaier, D.P. Effects of 20th century warming and climate variability on flood risk in the Western U.S. Water Resour. Res. 2007, 43. [Google Scholar] [CrossRef]
- Dankers, R.; Feyen, L. Climate change impact on flood hazard in Europe: An assessment based on high-resolution climate simulations. J. Geophys. Res. Atmos. 2008, 113. [Google Scholar] [CrossRef] [Green Version]
- Nicholls, R.J.; Hoozemans, F.M.J.; Marchand, M. Increasing flood risk and wetland losses due to global sea-level rise: Regional and global analyses. Glob. Environ. Chang. 1999, 9, S69–S87. [Google Scholar] [CrossRef]
- Pilgrim, D.H.; Cordey, I.; Maidment, D.R. Flood runoff. In Handbook of Hydrology; McGraw-Hill: New York, NY, USA, 1992; pp. 9–42. [Google Scholar]
- Hewlett, J.D.; Fortson, J.C.; Cunningham, G.B. Additional tests on the effect of rainfall intensity on storm flow and peak flow from wild-land basins. Water Resour. Res. 1984, 20, 985–989. [Google Scholar] [CrossRef]
- Gottschalk, L.; Weingartner, R. Distribution of peak flow derived from a distribution of rainfall volume and runoff coefficient, and a unit hydrograph. J. Hydrol. 1998, 208, 148–162. [Google Scholar] [CrossRef]
- Merz, B.; Hall, J.; Disse, M.; Schumann, A. Fluvial flood risk management in a changing world. Nat. Hazards Earth Syst. Sci. 2010, 10, 509–527. [Google Scholar] [CrossRef] [Green Version]
- Arheimer, B.; Donnelly, C.; Lindström, G. Regulation of snow-fed rivers affects flow regimes more than climate change. Nat. Commun. 2017, 8, 62. [Google Scholar] [CrossRef] [PubMed]
- Wang, S.S.; Huang, J.L.; Yang, D.Q.; Pavlic, G.; Li, J.H. Long-term water budget imbalances and error sources for cold region drainage basins. Hydrol. Process. 2015, 29, 2125–2136. [Google Scholar] [CrossRef]
- Wang, S.S.; McKenney, D.W.; Shang, J.L.; Li, J.H. A national-scale assessment of long-term water budget closures for Canada’s watersheds. J. Geophys. Res.-Atmos. 2014, 119, 8712–8725. [Google Scholar] [CrossRef]
- Brown, J.; Ferrians, O., Jr.; Heginbottom, J.; Melnikov, E. Revised February 2001, Circum-Arctic Map of Permafrost and Ground-Ice Conditions; National Snow and Ice Data Center/World Data Center for Glaciology: Boulder, CO, USA, 1998; Digital Media.
- Ding, Y.H.; Ren, G.Y.; Zhao, Z.C.; Xu, Y.; Luo, Y.; Li, Q.P.; Zhang, J. Detection, causes and projection of climate change over China: An overview of recent progress. Adv. Atmos. Sci. 2007, 24, 954–971. [Google Scholar] [CrossRef]
- Jin, H.J.; Yu, Q.H.; Lii, L.Z.; Guo, D.X.; He, R.X.; Yu, S.P.; Sun, G.Y.; Li, Y.W. Degradation of permafrost in the Xing’anling Mountains, Northeastern China. Permafr. Periglac. Process. 2007, 18, 245–258. [Google Scholar] [CrossRef]
- Walvoord, M.A.; Kurylyk, B.L. Hydrologic impacts of thawing permafrost—A review. Vadose Zone J. 2016, 15. [Google Scholar] [CrossRef]
- Connon, R.F.; Quinton, W.L.; Craig, J.R.; Hayashi, M. Changing hydrologic connectivity due to permafrost thaw in the lower Liard River Valley, NWT, Canada. Hydrol. Process. 2014, 28, 4163–4178. [Google Scholar] [CrossRef]
Figure 1.
Location (a), topography and hydrometeorological stations (b) of the study watersheds.

Figure 2.
Average monthly precipitation, streamflow, minimum and maximum air temperature in the UHR (a) and GR (b) watersheds from 1975 to 2013.
Figure 2.
Average monthly precipitation, streamflow, minimum and maximum air temperature in the UHR (a) and GR (b) watersheds from 1975 to 2013.

Figure 3.
The box plot of Tmax and high flow magnitude in pairing reference and warming years in the UHR (a); and Ta6 and high flow magnitude in the GR (b) watersheds.
Figure 3.
The box plot of Tmax and high flow magnitude in pairing reference and warming years in the UHR (a); and Ta6 and high flow magnitude in the GR (b) watersheds.

Figure 4.
Flow duration curves for the paired years of 1975 and 2011 in the UHR watershed.

Figure 5.
The box plot of Tmax, Tave, spring rain and high flow timing in pairing reference and warming years in the UHR (a) and GR (b) watersheds.
Figure 5.
The box plot of Tmax, Tave, spring rain and high flow timing in pairing reference and warming years in the UHR (a) and GR (b) watersheds.

Figure 6.
Hydrographs for the paired years of 1985 and 2004 in the UHR watershed.

Figure 7.
High flow timings for each year in the UHR (a) and GR (b) watersheds.

Table 1.
watershed characteristics for the Upper Huma River (UHR) and Ganhe River (GR) watersheds.
| Metrics | UHR Watershed | GR Watershed |
|---|---|---|
| Drainage area (km2) | 10,882 | 9575 |
| Mainstream length (km) | 189.5 | 176.3 |
| Average elevation (m) | 382–1516 | 333–1532 |
| Elevation range (m) | 808 | 745 |
| Soil type | Brown coniferous forest soil | Brown coniferous forest soil |
| Annual mean precipitation (mm) | 487.2 | 518.5 |
| Annual mean air temperature (°C) | −2.3 | −0.4 |
| Annual mean flow (mm) | 234.3 | 234.5 |
| Peak flow (m3/s) | 2830 | 2310 |
| Low flow (m3/s) | 0.23 | 0.24 |
| Climatic station | Tahe | Jiagedaqi |
| Hydrological station | Guqigu | Jiagedaqi |
Table 2.
Results of Mann–Kendall trend tests on high flow regime components and climatic variables in the UHR and GR watersheds from 1975 to 2013.
Table 2.
Results of Mann–Kendall trend tests on high flow regime components and climatic variables in the UHR and GR watersheds from 1975 to 2013.
| Variable | UHR Watershed | GR Watershed | ||||
|---|---|---|---|---|---|---|
| Slope | p | Mean | Slope | p | Mean | |
| High flow (m3/s) | −1.40 | 0.55 | 559.0 | 1.25 | 0.74 | 451.9 |
| High flow timing | −0.531 | 0.047 | 260.7 | −0.73 | 0.02 | 267.1 |
| Tave (°C) | 0.01 | 0.39 | −2.3 | 0.042 | 0.003 | −0.4 |
| Tmin (°C) | −0.01 | 0.33 | −9.4 | 0.05 | 0.000 | −7.1 |
| Tmax (°C) | 0.03 | 0.03 | 5.5 | 0.02 | 0.06 | 7.1 |
| Ta4 (°C) | 0.37 | 0.39 | 73.5 | 1.28 | 0.07 | 104.5 |
| Ta5 (°C) | 0.99 | 0.19 | 302.5 | 1.03 | 0.049 | 348.5 |
| Ta6 (°C) | 0.87 | 0.13 | 489.2 | 1.81 | 0.006 | 511.7 |
| Annual Snowfall (mm) | 0.51 | 0.20 | 58.4 | 0.03 | 0.94 | 55.8 |
| Spring P 3 (mm) | 0.28 | 0.42 | 64.2 | 0.79 | 0.12 | 60.6 |
| Spring Rain (mm) | 0.76 | 0.04 | 43.1 | 0.95 | 0.02 | 41.6 |
| Spring rain ratio (%) | 0.88 | 0.02 | 63.6 | 1.06 | 0.002 | 65.7 |
| Summer P (mm) | 1.59 | 0.29 | 315.5 | −0.52 | 0.81 | 363.9 |
| Autumn P (mm) | −0.38 | 0.37 | 72.0 | 0.22 | 0.65 | 72.6 |
| Annual P (mm) | 1.99 | 0.22 | 490.2 | 0.46 | 0.74 | 525.2 |
1 The bolded italic numbers indicate the statistical significance at the level of 0.05; 2 the bolded italic underlined numbers indicate the statistical significance at the level of 0.01. 3 P represents precipitation. Ta4, Ta5, and Ta6 represent April, May and June accumulated snowmelt temperature, respectively.
Table 3.
Correlation analysis between high flow regime components and climatic variables in the UHR and GR watersheds.
Table 3.
Correlation analysis between high flow regime components and climatic variables in the UHR and GR watersheds.
| Variable | UHR Watershed | GR Watershed | |||||||
|---|---|---|---|---|---|---|---|---|---|
| Magnitude | Timing | Magnitude | Timing | ||||||
| Correlation Coefficient | p | Correlation Coefficient | p | Correlation Coefficient | p | Correlation Coefficient | p | ||
| Tave | K 1 | −0.19 | 0.11 | −0.17 | 0.15 | −0.05 | 0.65 | −0.263 | 0.02 |
| S 2 | −0.26 | 0.11 | −0.23 | 0.16 | −0.11 | 0.52 | −0.40 | 0.01 | |
| Tmin | K | −0.08 | 0.50 | −0.05 | 0.67 | 0.04 | 0.73 | −0.24 | 0.03 |
| S | −0.11 | 0.51 | −0.08 | 0.64 | 0.03 | 0.83 | −0.40 | 0.01 | |
| Tmax | K | −0.26 | 0.02 | −0.25 | 0.03 | −0.14 | 0.20 | −0.21 | 0.06 |
| S | −0.34 | 0.04 | −0.36 | 0.03 | −0.24 | 0.15 | −0.32 | 0.05 | |
| Ta4 | K | 0.03 | 0.77 | −0.21 | 0.07 | 0.02 | 0.87 | −0.07 | 0.55 |
| S | 0.03 | 0.85 | −0.29 | 0.08 | 0.03 | 0.86 | −0.11 | 0.51 | |
| Ta5 | K | −0.15 | 0.18 | −0.02 | 0.83 | 0.00 | 0.97 | −0.14 | 0.20 |
| S | −0.23 | 0.17 | −0.06 | 0.73 | 0.00 | 0.98 | −0.21 | 0.20 | |
| Ta6 | K | −0.21 | 0.06 | 0.00 | 0.99 | −0.26 | 0.02 | −0.06 | 0.59 |
| S | −0.29 | 0.07 | 0.03 | 0.85 | −0.37 | 0.02 | −0.10 | 0.55 | |
| Annual Snowfall | K | −0.04 | 0.72 | −0.06 | 0.62 | −0.02 | 0.85 | −0.05 | 0.66 |
| S | −0.07 | 0.69 | −0.10 | 0.56 | −0.02 | 0.91 | −0.06 | 0.71 | |
| Spring P | K | 0.10 | 0.37 | −0.304 | 0.008 | −0.04 | 0.71 | −0.20 | 0.07 |
| S | 0.16 | 0.34 | −0.43 | 0.006 | −0.05 | 0.75 | −0.20 | 0.06 | |
| Spring Rain | K | 0.05 | 0.64 | −0.26 | 0.03 | −0.07 | 0.96 | −0.23 | 0.04 |
| S | 0.10 | 0.55 | −0.38 | 0.02 | −0.08 | 0.97 | −0.34 | 0.03 | |
| Spring Rain Ratio | K | 0.01 | 0.96 | −0.22 | 0.06 | −0.05 | 0.66 | −0.25 | 0.02 |
| S | −0.02 | 0.91 | −0.32 | 0.05 | −0.08 | 0.62 | −0.35 | 0.03 | |
| Summer P | K | 0.42 | 0.000 | 0.00 | 0.97 | 0.58 | 0.000 | −0.01 | 0.95 |
| S | 0.57 | 0.000 | −0.01 | 0.94 | 0.75 | 0.000 | −0.02 | 0.92 | |
| Autumn P | K | 0.10 | 0.39 | 0.36 | 0.002 | 0.01 | 0.53 | 0.22 | 0.05 |
| S | 0.12 | 0.47 | 0.50 | 0.001 | 0.01 | 0.64 | 0.33 | 0.04 | |
| Annual P | K | 0.43 | 0.000 | 0.02 | 0.89 | 0.55 | 0.000 | −0.04 | 0.72 |
| S | 0.59 | 0.000 | 0.05 | 0.77 | 0.71 | 0.000 | −0.02 | 0.89 | |
1 K represents Kendall’s tau correlation analysis; 2 S represents Spearman’s rho correlation analysis. 3 The bolded italic numbers indicate the statistical significance at the level of 0.05; 4 the bolded italic underlined numbers indicate the statistical significance at the level of 0.01.
Table 4.
Canonical correlation analysis between the set of climatic variables and high flow magnitude and timing in the UHR watershed.
Table 4.
Canonical correlation analysis between the set of climatic variables and high flow magnitude and timing in the UHR watershed.
| Sets of Climatic Variables | UHR Watershed | |||
|---|---|---|---|---|
| Magnitude | Timing | |||
| Canonical R | p | Canonical R | p | |
| Tmax, Summer P, Annual P | 0.74 | <0.001 | ||
| Tmax, Summer P | 0.73 | <0.001 | ||
| Tmax, Annual P | 0.71 | <0.001 | ||
| Tmax, Spring P, Spring Rain, Autumn P | 0.65 | <0.001 | ||
| Tmax, Spring Rain, Autumn P | 0.66 | <0.001 | ||
| Tmax, Spring P, Autumn P | 0.61 | 0.001 | ||
| Tmax, Spring P, Spring Rain | 0.55 | 0.007 | ||
| Spring Rain, Spring P, Autumn P | 0.59 | 0.002 | ||
| Spring Rain, Spring P | 0.43 | 0.030 | ||
| Spring Rain, Autumn P | 0.55 | 0.002 | ||
Table 5.
Canonical correlation analysis between the set of climatic variables and high flow magnitude and timing in the RH watershed.
Table 5.
Canonical correlation analysis between the set of climatic variables and high flow magnitude and timing in the RH watershed.
| Sets of Climatic Variables | GR Watershed | |||
|---|---|---|---|---|
| Magnitude | Timing | |||
| Canonical R | p | Canonical R | p | |
| Ta6, Summer P, Annual P | 0.81 | <0.001 | ||
| Ta6, Summer P | 0.80 | <0.001 | ||
| Ta6, Annual P | 0.78 | <0.001 | ||
| Tave, Tmin, Spring Rain, Autumn P | 0.62 | 0.002 | ||
| Tave, Tmin, Autumn P | 0.51 | 0.015 | ||
| Tave, Spring Rain, Autumn P | 0.62 | <0.001 | ||
| Tave, Autumn P | 0.50 | 0.005 | ||
| Tmin, Spring Rain, Autumn P | 0.61 | 0.001 | ||
| Tmin, Autumn P | 0.50 | 0.005 | ||
| Spring Rain, Autumn P | 0.56 | 0.001 | ||
Table 6.
Results of change point analysis on climatic variables from Pettitt’s test.
| Variable | UHR Watershed | GR Watershed | ||
|---|---|---|---|---|
| Change Point | p | Change Point | p | |
| Tave | 1989 | 0.16 | 1989 | <0.001 |
| Tmin | 1995 | 0.06 | 1989 | <0.001 |
| Tmax | 19892 | 0.009 | 1989 | 0.007 |
| Ta4 | 2007 | 0.73 | 1996 | 0.14 |
| Ta5 | 2006 | 0.29 | 1996 | 0.13 |
| Ta6 | 2000 | 0.20 | 2000 | 0.005 |
| Annual Snowfall | 1981 | 0.25 | 1992 | 0.68 |
| Spring P | 2001 | 0.74 | 1996 | 0.13 |
| Spring Rain | 1993 | 0.13 | 19961 | 0.02 |
| Summer P | 2009 | 0.62 | 2000 | 0.37 |
| Autumn P | 2005 | 0.42 | 1991 | 0.38 |
| Annual P | 1990 | 0.32 | 1988 | 0.29 |
1 The bolded italic numbers indicate the statistical significance at the level of 0.05; 2 the bolded italic underlined numbers indicate the statistical significance at the level of 0.01. P represents precipitation.
Table 7.
The Mann–Whitney and Kolmogorov–Smirnov tests on the differences in high flow magnitude and timing between the paired reference and warming years in the UHR and GR watersheds.
Table 7.
The Mann–Whitney and Kolmogorov–Smirnov tests on the differences in high flow magnitude and timing between the paired reference and warming years in the UHR and GR watersheds.
| Test | Parameter | UHR | GR | ||
|---|---|---|---|---|---|
| Magnitude | Timing | Magnitude | Timing | ||
| Mann-Whitney Test | Z values | −2.61 | −3.3 | −1.6 | −3.8 |
| p | 0.008 | <0.001 | 0.117 | <0.001 | |
| Kolmogorov-Smirnov Test | Z values | 1.6 | 2.0 | 1.3 | 2.0 |
| p | 0.008 | <0.001 | 0.068 | <0.001 | |
1 The bolded italic underlined numbers indicate the statistical significance at the level of 0.01.
© 2018 by the authors. Licensee MDPI, Basel, Switzerland. This article is an open access article distributed under the terms and conditions of the Creative Commons Attribution (CC BY) license (http://creativecommons.org/licenses/by/4.0/).
Share and Cite
MDPI and ACS Style
Duan, L.; Cai, T. Changes in Magnitude and Timing of High Flows in Large Rain-Dominated Watersheds in the Cold Region of North-Eastern China. Water 2018, 10, 1658. https://doi.org/10.3390/w10111658
AMA Style
Duan L, Cai T. Changes in Magnitude and Timing of High Flows in Large Rain-Dominated Watersheds in the Cold Region of North-Eastern China. Water. 2018; 10(11):1658. https://doi.org/10.3390/w10111658
Chicago/Turabian StyleDuan, Liangliang, and Tijiu Cai. 2018. "Changes in Magnitude and Timing of High Flows in Large Rain-Dominated Watersheds in the Cold Region of North-Eastern China" Water 10, no. 11: 1658. https://doi.org/10.3390/w10111658
Note that from the first issue of 2016, this journal uses article numbers instead of page numbers. See further details here.