Article

Responses of Water Fluxes and Water-Use Efficiency of Maize to Warming Based on Water Transformation Dynamical Processes Experimental Device (WTDPED) Experiment

1
Key Laboratory of Water Cycle and Related Land Surface Processes, Institute of Geographic Sciences and Natural Resources Research, Chinese Academy of Sciences, Beijing 100101, China
2
College of Resources and Environment, University of Chinese Academy of Sciences, Beijing 100049, China
3
Sino-France Institute of Earth Systems Science, Laboratory for Earth Surface Processes, College of Urban and Environmental Sciences, Peking University, Beijing 100871, China
4
College of Water Sciences, Beijing Normal University, Beijing 100875, China
*
Author to whom correspondence should be addressed.
Y.W. and Y.M. contributed equally to this work
Water 2018, 10(11), 1660; https://doi.org/10.3390/w10111660
Submission received: 11 October 2018 / Revised: 7 November 2018 / Accepted: 13 November 2018 / Published: 14 November 2018
(This article belongs to the Section Hydrology)

Abstract

:
Evaluating the impacts of warming on water balance components in the groundwater–soil–plant–atmosphere continuum (GSPAC) and crop growth are crucial for assessing the risk of water resources and food security under future global warming. A water transformation dynamical processes experimental device (WTDPED) was developed using a chamber coupled with a weighing lysimeter and groundwater supply system, which could simultaneously control both climatic and ground-water level conditions and accurately monitor water fluxes in the GSPAC. Two experiments with maize under increased temperature by 2 °C (T-warm) and ambient temperature (T-control) scenarios were conducted via the WTDPED. The duration of growing season decreased from 125 days under T-control to 117 days under 2 °C warming. There was little difference of total evapotranspiration (ET) (332.6 mm vs. 332.5 mm), soil water storage change (∆W) (−119.0 mm vs. −119.0 mm), drainage (D) (−13.6 mm vs. −13.5 mm) between T-control and T-warm experiments. The average daily ET for maize significantly increased by approximately 6.7% (p < 0.05) in the T-warm experiment, especially during the sixth leaf to tasseling—silking stage with an increase of 0.36 mm with respect to the T-control experiment. There were evident decreases in LAI (leaf area index), whereas non-significant decreases in mean stem diameter, crop height and leaf chlorophyll content under T-warm compared to T-control experiment. However, the chlorophyll content increased by 12% during the sixth leaf to tasseling–silking stage under 2 °C warming, which accelerated the photosynthesis and transpiration rate. The grain yield and water-use efficiency (WUE) for maize increased by 11.0% and 11.1% in the T-warm experiment, respectively, especially due to enhanced growth during the sixth leaf to tasseling–silking stage. This study provided important references for agricultural planting and water management to adapt to a warming environment.

1. Introduction

Climate change, especially warming, has substantial effects on the agricultural water cycle and crop yield [1,2]. Global warming accelerates the hydrological cycle, including changes in the precipitation, evapotranspiration (ET), soil water depletion as well as drainage in the groundwater–soil–plant–atmosphere continuum (GSPAC) of the agricultural ecosystem [3,4,5,6]. Increasing temperature also alters the crop development including the duration of the potential growing season, length of maturation time and crop yield [7,8]. The alternation of ET and yield due to global warming can result in large variability of water-use efficiency (WUE) [9,10]. Global mean surface temperature will rise by about 2 °C for Representative Concentration Pathway (RCP) 8.5 (high confidence) by the mid-21st century relative to the 1986–2005 period [11]. Moreover, the AGGG (Advisory Group on Greenhouse Gases) report claimed that a 2 °C increase was an upper limit beyond which there are risks of grave damage to the ecosystem [12,13]. Determining responses of temporal variations in the water fluxes at different interfaces in GSPAC to warming is of great significance for maintaining food security and optimizing agricultural water management practices [14].
Numerous field experimental studies found increases in transpiration rate and water consumption of crops [15,16,17,18] but reductions in grain yields, plant height and leaf area index [7,19] or little change in crop yield [20] under warming. Model simulations also indicated that warming would reduce crop yield [1,10,21,22,23]. An increase of ET was obtained using the cropping system simulation model CropSyst and global circulation models (GCMs) [21] and a decrease of soil water availability was found under high temperature via the soil and water integrated model (SWIM) [2]. In contrast, there was a decrease in total ET but an increase in WUE calculated using the CERES (crop environment resource synthesis) model under warming conditions [1]. It was found that the annual mean evapotranspiration during 2041–2050 would marginally decrease by 0.3 mm under the RCP4.5 scenario and by 0.4 mm under the RCP8.5 scenario using the Common L and Model (CoLM), respectively [24]. The above results indicated that the responses of water fluxes and crop development to warming varied among different models. Modeling approaches can predict the impacts of possible future climate changing scenarios on crop growth and water cycle in GSPAC; nevertheless, uncertainties arising from different modeling methods may lead to significant variability in results from simulation models [25]. Moreover, regional differences in the micro-meteorological environment had a synergistic or offsetting influence on water balance and crop growth via warming [26]. Some components of the hydrologic cycle (e.g., groundwater recharge) were critical for the evaluation of water balance components, but their potential responses to warming were not considered substantially in previous field experimental and simulation studies [27,28]. Current models still need to be further calibrated and validated using experimental feedbacks under different climate conditions in various regions.
In recent years, some devices with artificial controlled climatic conditions such as the free air carbon dioxide enrichment (FACEs), open-top chamber (OTC) and temperature gradient tunnel (TGT) have been used to study the responses of crop production and soil water dynamics in GSPAC to warming [29,30,31,32,33,34]. Compared to field experiments and modeling practices, the lab/controlled experiments had the advantages of conveniently setting various meteorological conditions and accurately observing the responses of crops and water fluxes to climate change [35]. However, it was difficult to quantify all water fluxes at GSPAC interfaces and investigate the underlying mechanisms of water cycles under complex boundary conditions (precipitation, groundwater conditions, etc.) using the above lab/controlled devices. Water fluxes such as ET, soil moisture and drainage can be accurately monitored on the basis of water mass balance via field weighing lysimeters [34,36]. However, climatic parameters were seldom controlled in field lysimeters for clarifying the impacts of warming on water balance components and crop growth in GSPAC.
In this study, a water transformation dynamical processes experimental device (WTDPED) was developed to simultaneously control both climatic and ground-water level conditions and accurately monitored water fluxes in the GSPAC. Two experiments of maize under increased temperature by 2 °C (T-warm) and ambient temperature (T-control) scenarios were conducted via the WTDPED. The objectives of this study were to (1) quantify the temporal variations in water fluxes at different GSPAC interfaces and crop development under T-warm and T-control conditions; and (2) investigate the impacts of warming on water transformation in GSPAC and crop development.

2. Materials and Methods

2.1. Description of the Water Transformation Dynamical Processes Experimental Device (WTDPED)

The WTDPED consisted of three subsystems including a chamber for controlling environmental elements, weighing lysimeters for measuring soil–water balance components and the groundwater supply subsystem for controlling groundwater condition and observing groundwater recharge (Figure 1). The WTDPED was 7 m in length, 5 m wide and 4.5 m high above the soil surface with a depth of 3 m underground. This device was located at the Key Laboratory of Water Cycle and Related Land Surface Processes, Institute of Geographic Sciences and Natural Resources Research (IGSNRR), Beijing, China.
The environmental elements control subsystem (Figure 1) was to simulate and monitor air temperature (Ta), relative humidity (RH), light and CO2 concentration. Air conditioners were used for heating, cooling and dehumidification with internal circulation. Humidity was controlled by two centrifugal humidifiers. Twenty-four sodium lamps and metal halide lamps were divided into three groups to control the light intensity. The light intensity reached a maximum of 30,000 lux with all the lamps on. A CO2 gas storage cylinder was controlled by a system that consisted of a sensor transmitter, solenoid valve, reducing valve and flow velocity meter. Sensors of Ta, RH, CO2 concentration, light intensity and photosynthetic quantum flux density (PQFD) were installed at 2 m height above the soil surface in the central position of the device. All environmental elements were controlled by the Ta, RH, light and CO2 automatic control systems.
Two weighing lysimeters were used for monitoring changes of soil water storage (Figure 1). Each lysimeter had a volume of 3 × 2 × 3 m3 (length × width × depth). The maximum load and resolution of each weighing lysimeter was 8.1 × 10⁴ kg and 180 g, respectively. The lysimeters were filled with homogeneous and layered silt sandy loam soil from farmland in Beijing, respectively. The measured data in the lysimeter with homogenous soil profile was used in this study for the analysis. The bulk density, saturated water content and saturated hydraulic conductivity of the homogenous soil profile were 1.55 g cm−3, 0.45 cm3 cm−3 and 19.95 cm d−1, respectively. The soil water retention curve was given in Figure S1. The 5TE sensors (Decagon Devices, Pullman, WA, USA) and MPS-2 sensors (Decagon Devices, Pullman, WA, USA) were applied to observe the soil volumetric water content (VWC) and soil water matrix potential (SWP), respectively. The accuracy of the 5TE and MPS-2 sensors was ± (0.01–0.02 cm3 cm−3) and ± (10% + 2 KPa), respectively. Both the 5TE and MPS-2 sensors were installed at depths of 10, 33, 43, 53, 63, 73, 82.5, 100.5, 120.5, 140.5, 170.5, 200.5, 230.5 and 265.5 cm below the soil surface in each lysimeter, respectively.
The groundwater supply subsystem (Figure 1) consisted of a water storage tank, water pipes and a Marriott bottle was connected to each lysimeter. Drainage or ground water recharge was processed by an electric circuit with a fixed storage tube, a needle for measuring the liquid level and the corresponding controlled software. The precision for ground water level measurements was 0.1 cm. Controlling system was transferred to a computer monitoring system in order to check the data at any time.

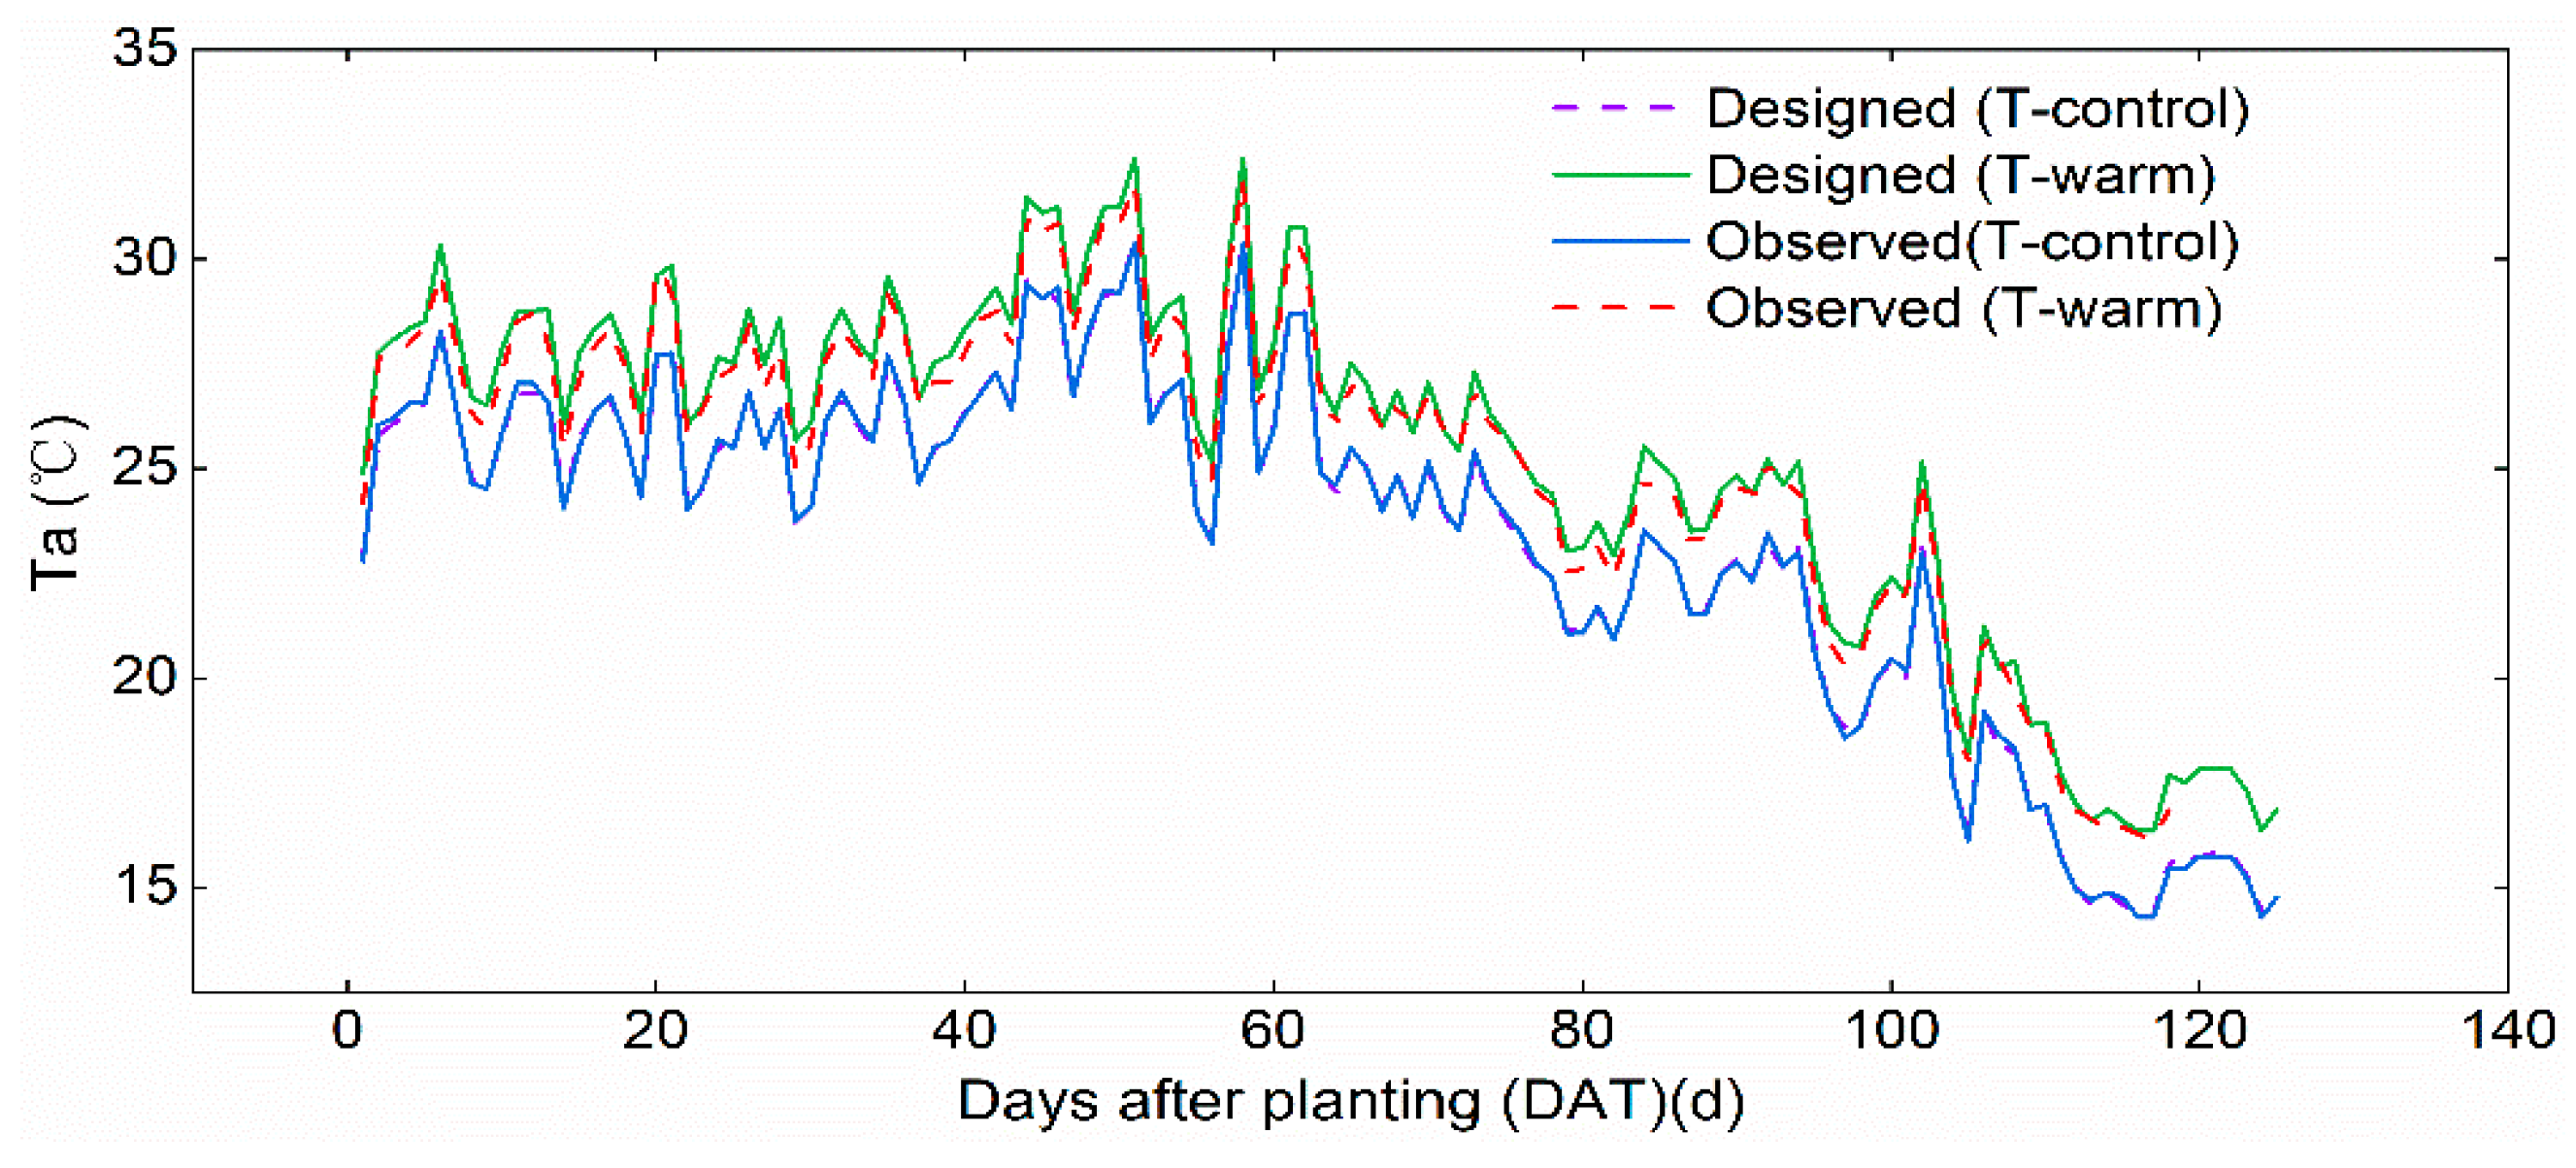
2.2. Experimental Design and Measurements

Experiments under T-control and T-warm scenarios were conducted for maize in this study. The average values of 10-year (2000–2010) meteorological data (Ta, RH, CO2 concentration, photosynthetically active radiation, etc.) during the whole growing season of maize in Beijing were simulated. To fully reflect the normal diurnal variation, the Ta was controlled every three hours based on the average values at 01:00, 04:00, 07:00, 10:00, 13:00, 16:00, 19:00 and 22:00 in the T-control experiment. In the T-warm experiment, the Ta was modified over time with an increase in the average values of 2 °C. In the T-control experiment, the mean annual Ta was approximately 23.5 °C, with a maximum value of 30.4 °C at 58 days after sowing and a minimum value of 13.6 °C on the last day of the season (Figure 2). The average Ta of the whole period for maize was 25.4 °C, ranging from 16.2 °C to 32.1 °C, in the T-warm experiment. In general, the daily Ta in the T-warm experiment increased by 2 °C compared with that in the T-control experiment.
The RH, CO2 concentration and groundwater level were set to be same in the T-control and T-warm experiments. The RH was set as the average value of daily RH during growing season of maize over 2000–2010 in the Beijing area. The photosynthetically active radiation at different heights was measured in the experimental facility and lamps were arranged according to the average value of photosynthetically active radiation over the 10-year period in the Beijing area. Three groups of lamps were turned on from 06:00 to 18:00. The CO2 concentration was set to 376 ppm, which was the average value over the 10-year period in the Beijing area. The water table depth was set at 2.5 m in both experiments.
Summer maize (variety: ZhengDan 958, Beijing, China) was planted on 17 May 2014 in the T-control experiment and 7 January 2015 in the T-warm experiment. The planting density of maize was 6.0 × 10⁴ plants ha−1 (63 cm row spacing and 37 cm plant spacing) referencing to the local agricultural practices. The harvesting dates were 19 September 2014 and 4 May 2015 for the T-control and T-warm experiments, respectively. The length of the growing season (117 days) was evidently shorter under warming condition than that (125 days) in the T-control environment. The whole growing season of maize was divided into six stages. These stages were from planting time to third leaf stage (PT-V3), third leaf to sixth leaf stage (V3-V6), sixth leaf to twelfth leaf stage (V6-V12), twelfth leaf to tasseling–silking stage (V12-VT), tasseling–silking stage to milk stage (VT-R3) and milk stage to physiological maturity (R3-R6).
Irrigation events were applied when the mean soil moisture content in the 100-cm soil profile was equal to 0.75-fold of the field capacity (mean of 0.25 cm3 cm–3). The total irrigation amount was 300 mm in both the T-control and T-warm experiments. A compound fertilizer (N-P2O5-K2O, 15-15-15) was applied at the same growth stage in both experiments. The schedules for irrigation and fertilization applied in the T-control and T-warm experiments were listed in Table 1.
The meteorological parameters, VWC, SWP and drainage of groundwater were all recorded at an interval of 0.5 h. The leaf area index (LAI) was calculated as the product of the measured leaf area per plant and the number of plants per unit area. The diameter of stem and plant height were measured using vernier caliper and steel tape, respectively. The middle of the marked leaf was measured for leaf chlorophyll content (indicated via the Soil and Plant Analyzer Development (SPAD) value) for 3 times at 9:00 with SPAD-502 chlorophyll content equipment (Konica Minolta Sensing Incorporated, Japan). The LAI, stem diameter, plant height and SPAD were measured on one or two days at each growth stage. Dry matter at harvest was obtained by measuring the biomass of stem, leaf and ear dried at 65 °C for 48 h to a constant weight. The grain was air-dried and the crop yield was recorded after harvesting.

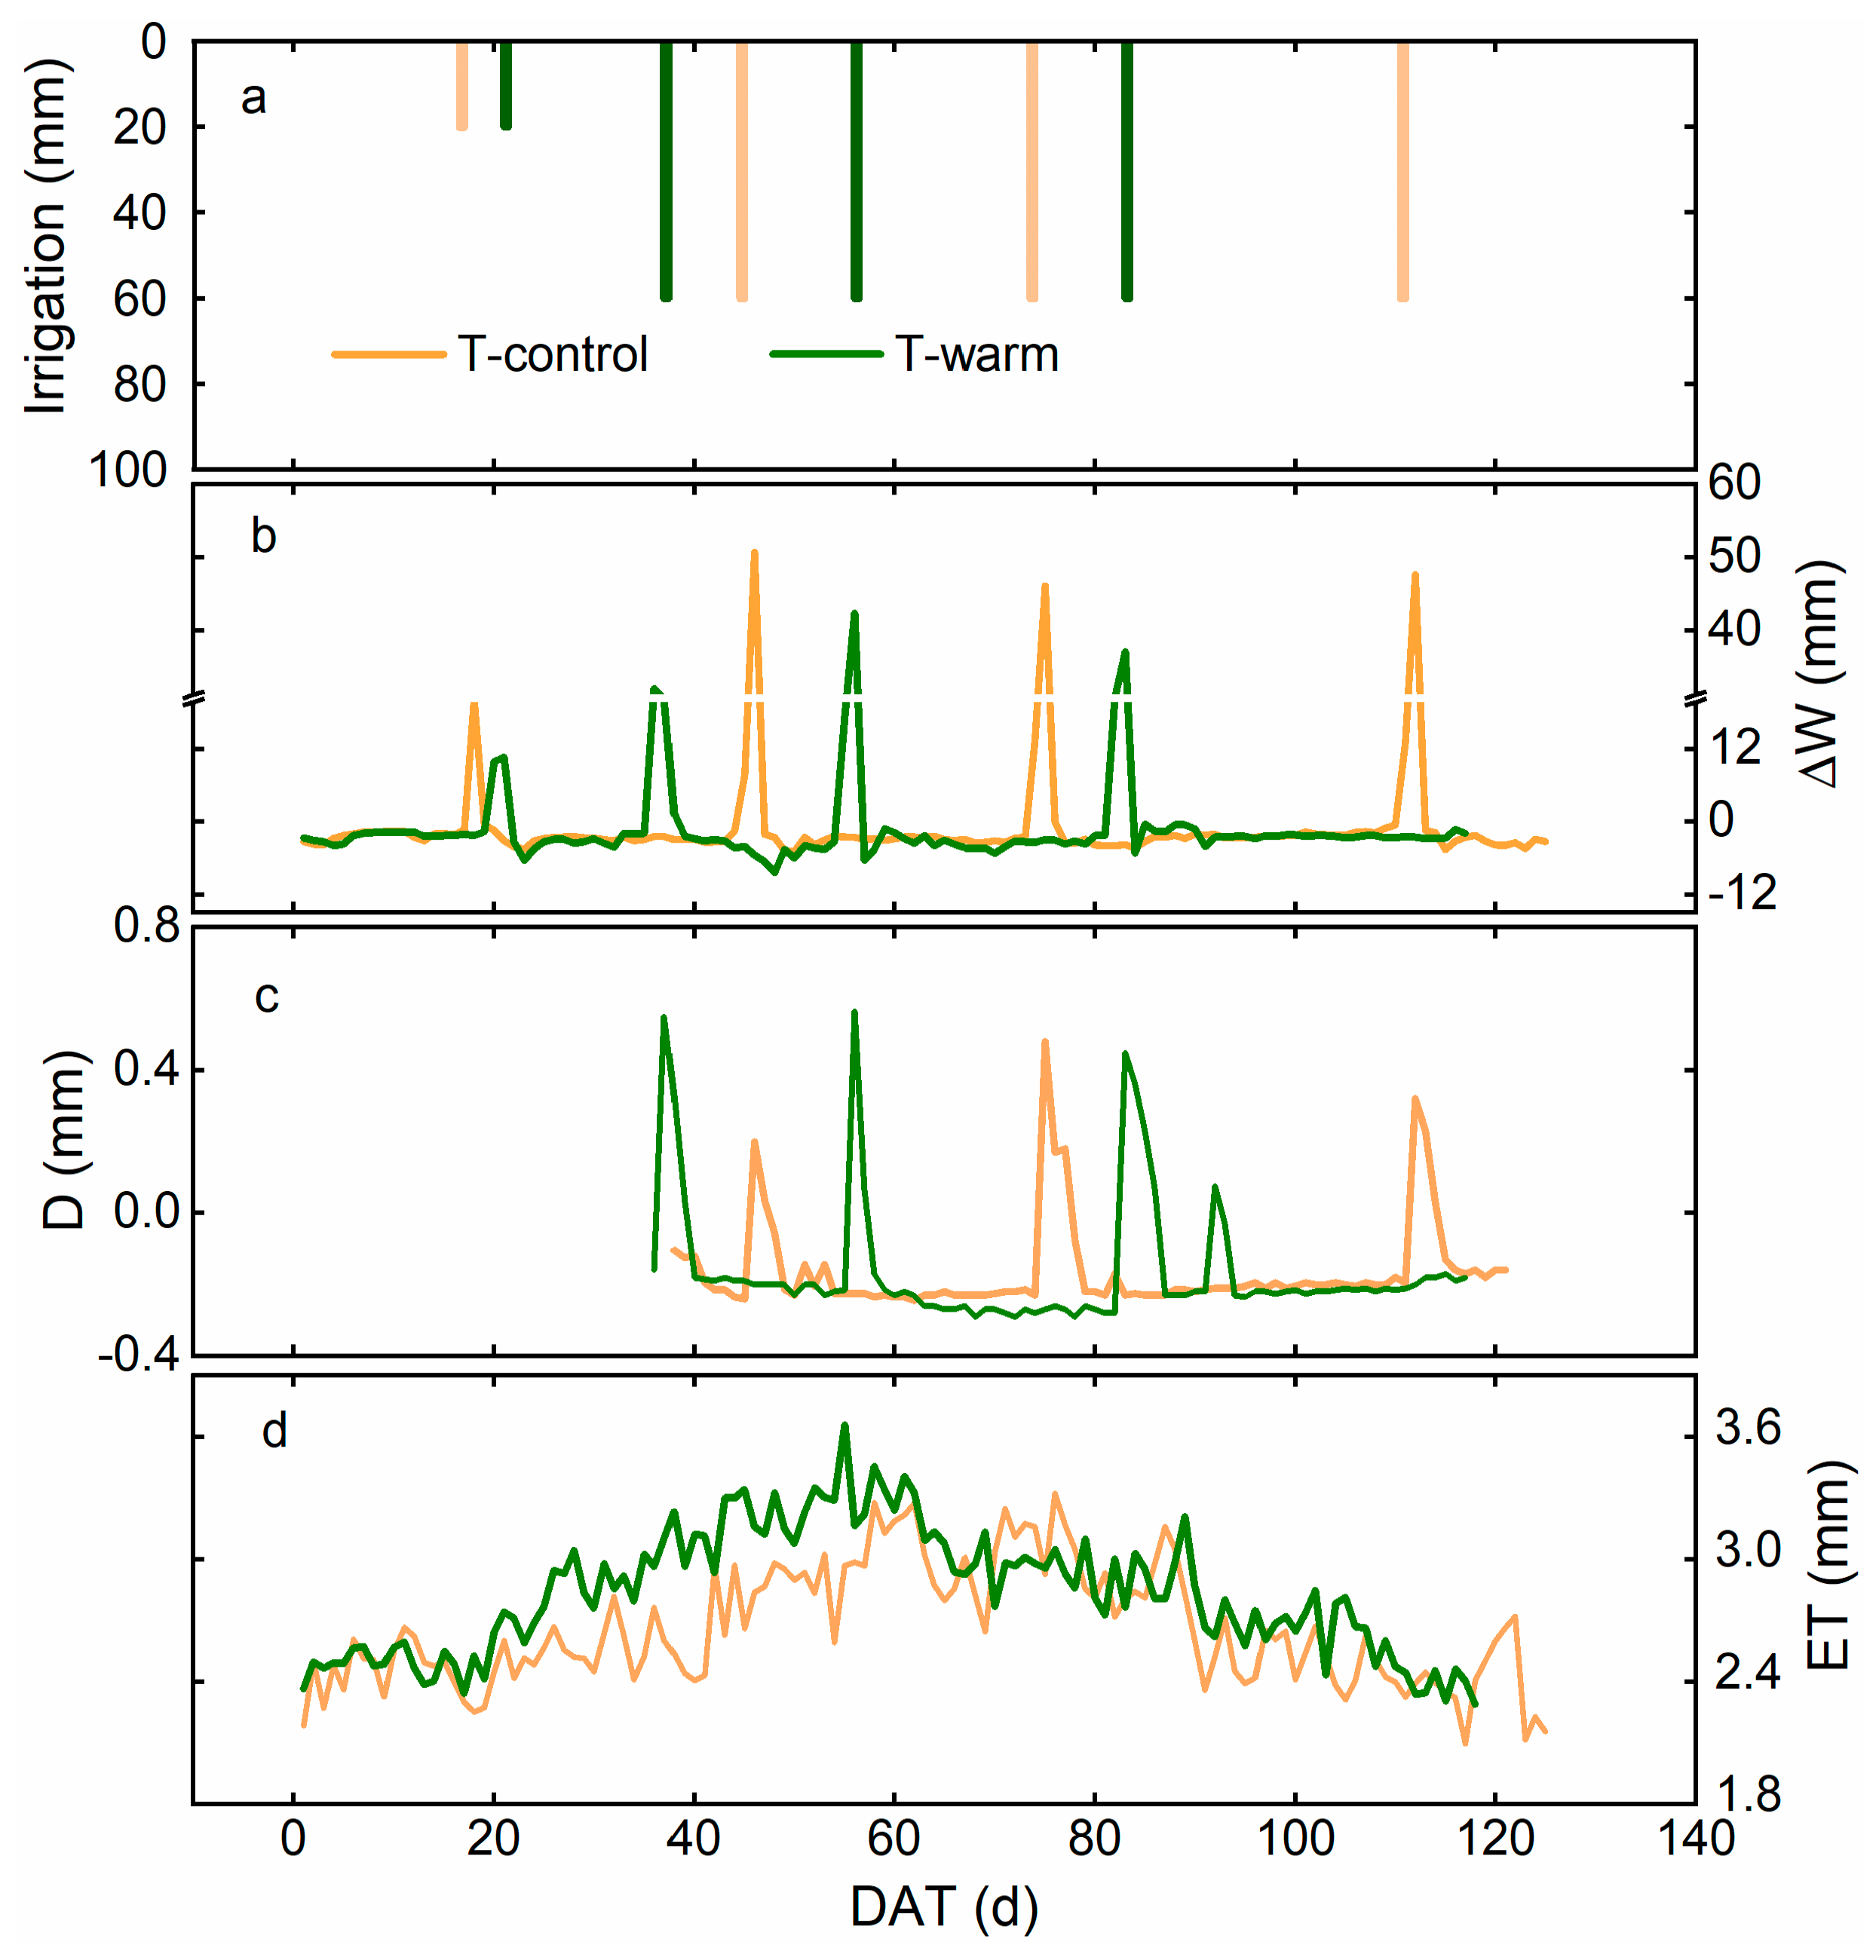
2.3. Water Balance Analysis

The water balance equation was given as follows:
P + I = R + ET + D + Δ W  
where P, I, R, D and ∆W is precipitation, irrigation, runoff, drainage and soil water storage change, respectively. P was zero, since precipitation was not applied during the experiments as the WTDPED device currently did not have the function of rainfall simulation. R was neglected as there was no runoff observed in the experiments. I was measured via a water meter. ∆W was calculated by the final and initial soil water content at each day. D was recorded via the groundwater supply subsystem. A positive value of D indicated downward percolation out of the lysimeter, while a negative value indicated upward capillary rise due to water uptake by maize. The daily soil water balance was analyzed firstly. The daily values were aggregated to calculate each water balance component at every growth stage and the whole season.
The ET at time t (mm) was calculated by the changes of weight of the lysimeter as follows:
ET = M t 1 M t ρ × S × 1000  
where Mt is the weight of the lysimeter at time t (kg), Mt−1 is the weight of the lysimeter at time t − 1 (kg), S is the surface area of the lysimeter (m2) and ρ is the density of water.

2.4. Estimation of Water-Use Efficiency (WUE) and WUEI

Water use efficiency (WUE) was calculated as follows:
WUE = GY/ET
where GY (kg hm−2) was grain yield and ET (mm) was the total crop evapotranspiration during the maize growing season.
WUEI = GY/I
where I (mm) was the total irrigation during the maize growing season.

2.5. Statistical Analysis

Analysis of variance (ANOVA) was used to compare the temporal variations in ET, ∆W and D of maize between the T-control and T-warm experiments at p < 0.05. These analyses were carried out using SPSS 16.0 (IBM Corp., Chicago, Illinois, USA). The amount of dry matter at harvest, grain yield, crop WUE and WUEI values were compared between the two experiments and there was no statistical analysis for the comparison.

3. Results

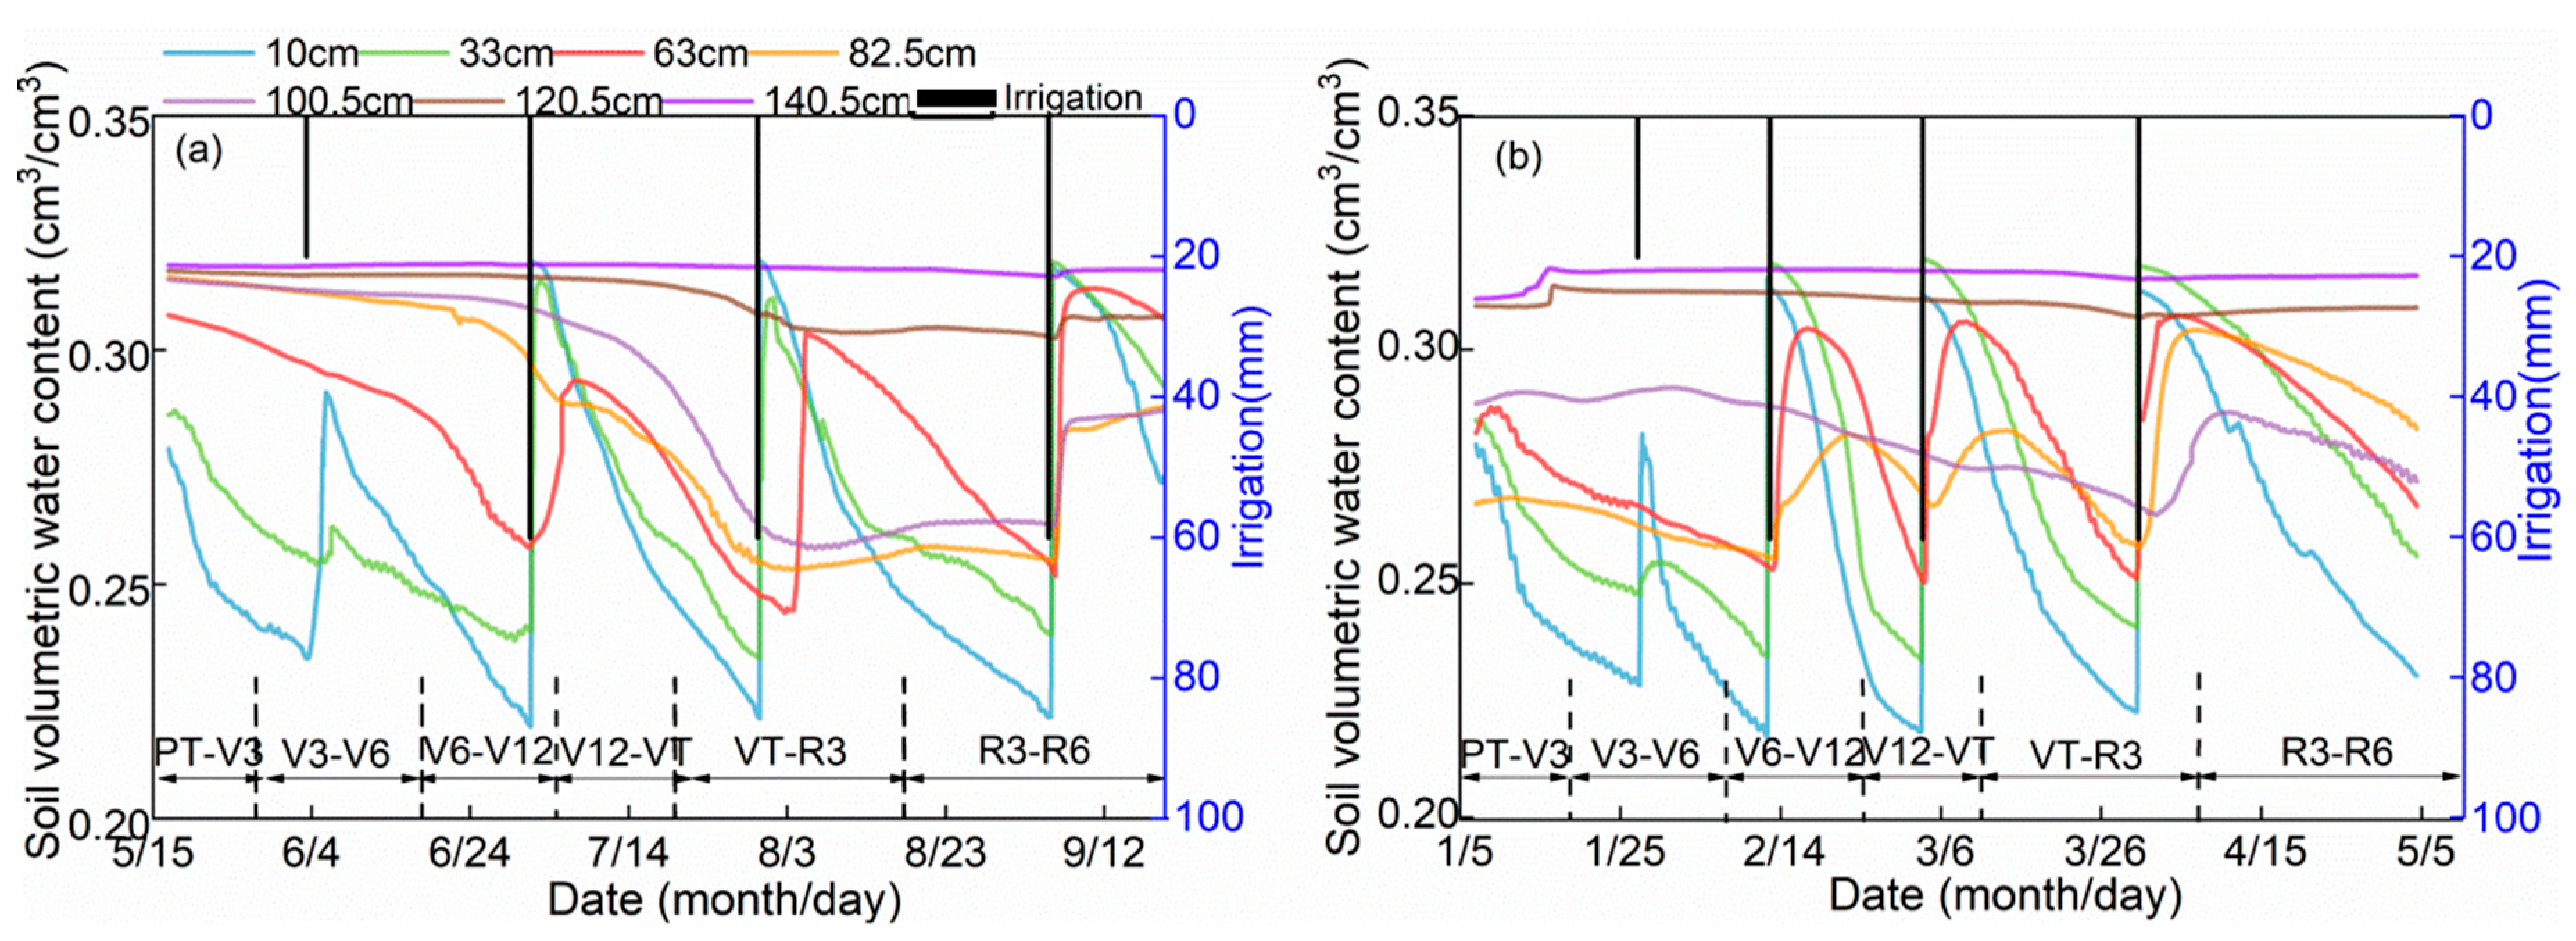
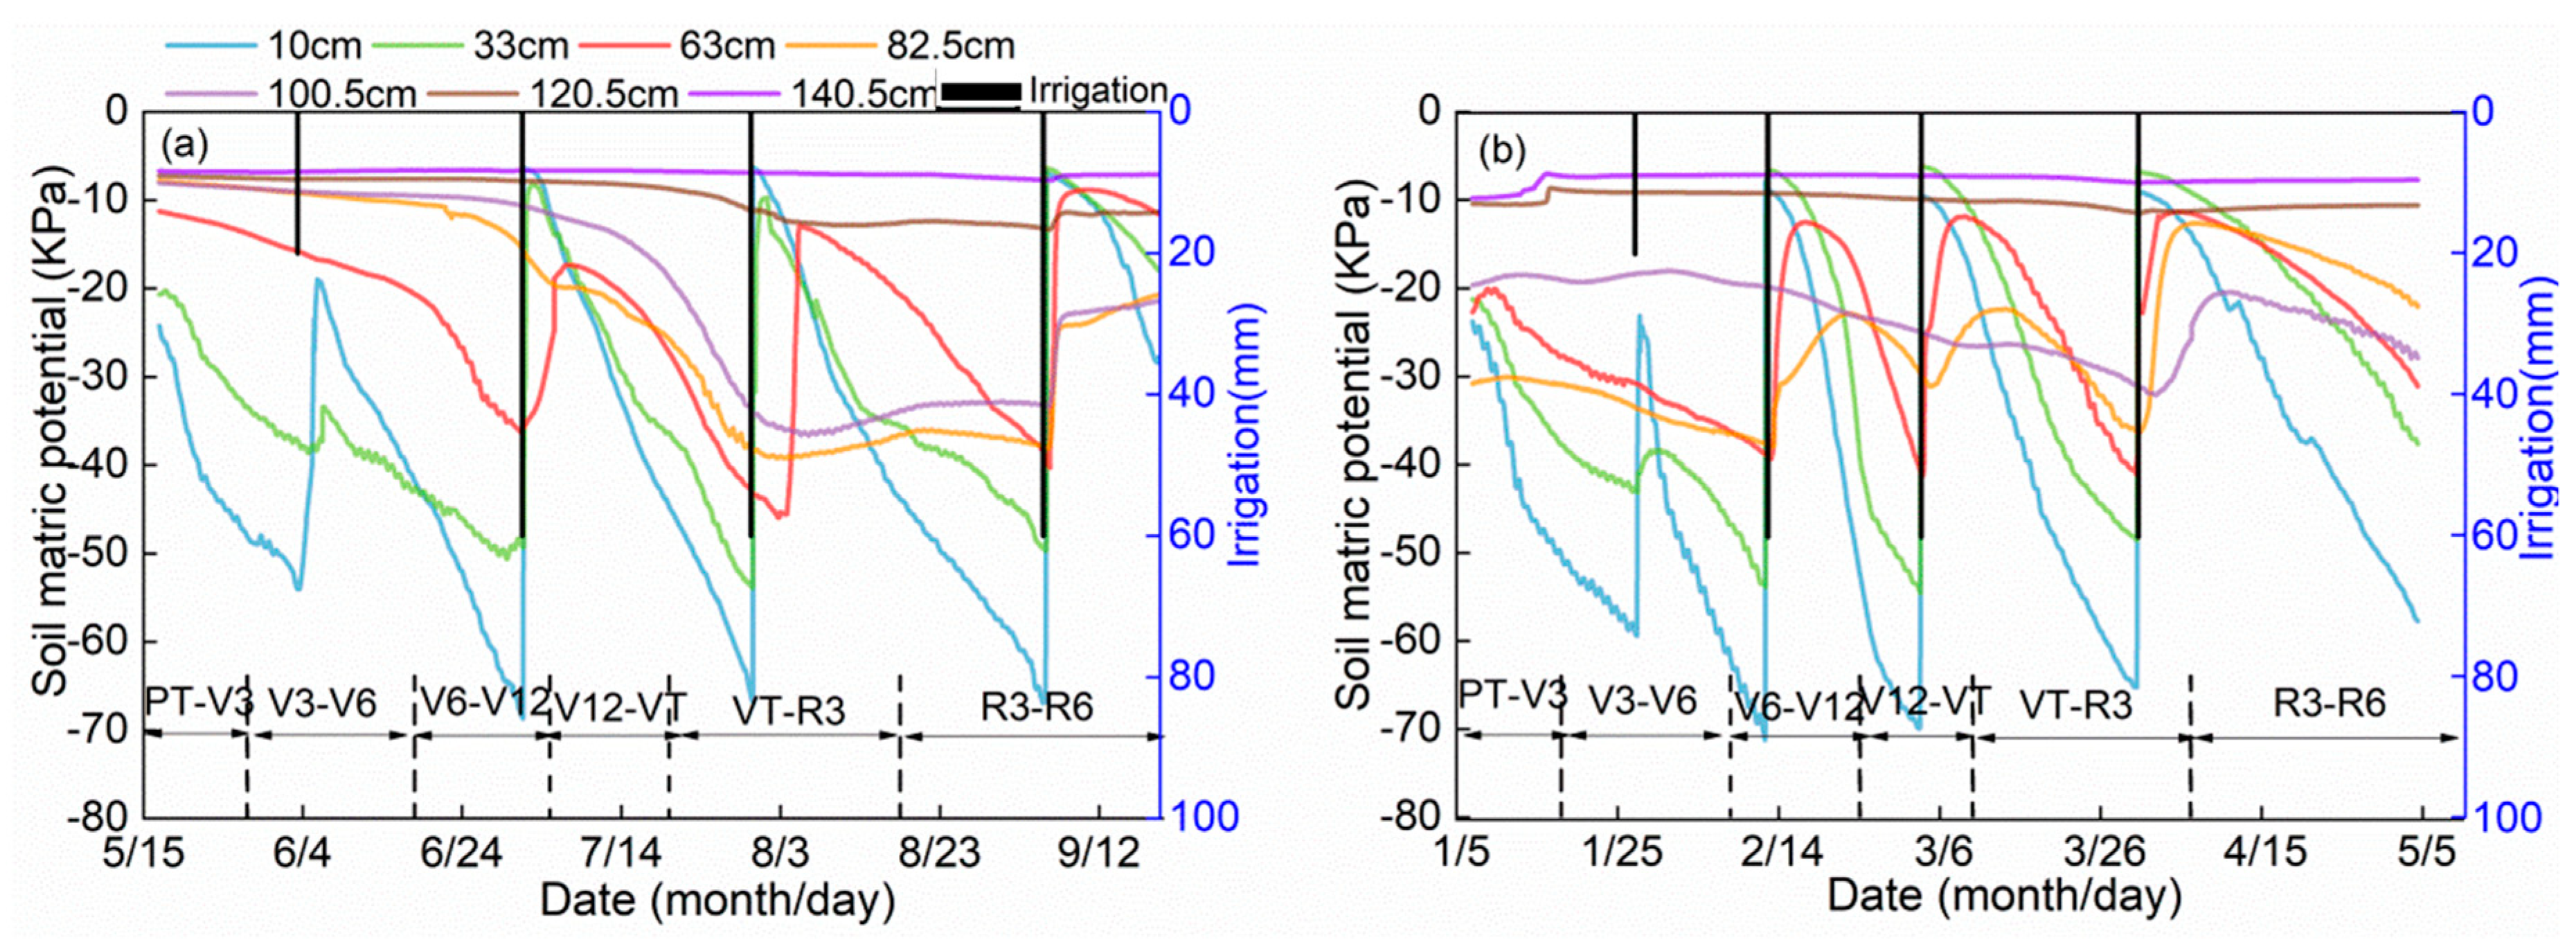
3.1. Temporal Variations in Soil Moisture Distribution

The values of VWC in the whole soil profile ranged from 0.18 to 0.40 cm3 cm−3 during the growing season of summer maize under T-control environment (Figure 3). The temporal variation of VWC mainly occurred in the 0–140.5 cm layer, particularly in the 0–53 cm layer with significant changes. The values of VWC in the 140.5–265.5 cm layer nearly remained stable throughout the growing season. The SWP (from −72.6 to −5.5 KPa) showed a similar changing pattern as the VWC (Figure 4). The VWC and SWP responded rapidly to irrigation events but varied greatly among different growth stages. The predominant evaporation flux led to a gradual decrease of SWP at the early growth stage of PT-V3. Only a small increase of SWP appeared in the 0–43 cm layer with an irrigation of 20 mm applied at V3-V6 stage. The SWP increased dramatically in the 0–63 cm layer at the late stage of V6-V12 with an irrigation of 60 mm. The SWP decreased significantly in the 0–100.5 cm layer at the V12-VT stage when there was no irrigation but large ET rate. The decreasing trend was alleviated until the VT-R3 stage and sharp increase of SWP occurred in the 0–53 cm layer due to an application of irrigation (60 mm). The final irrigation of 60 mm at the R3-R6 stage resulted in significant changes in SWP within the 0–100.5 cm layer.
The VWC (from 0.20 to 0.41 cm3 cm−3) and SWP (from −71.2 to −5.5 KPa) under T-warm varied in similar ranges to those under T-control over the growing season (Figure 3). The main changes of VWC and SWP under T-warm also appeared in the depth of 0–140.5 cm. However, there was a larger decrease of SWP in the 0–63 cm layer during planting time (PT) to the V6 stage under T-warm (21.8 KPa) compared to that under T-control (15.7 KPa), which indicated 2 °C warming resulted in much stronger soil evaporation at the early growth stage of summer maize. The increase of SWP at the V6-V12 stage under T-warm was less (10.8 KPa) than that under T-control (17.0 KPa). The reason might be that irrigation (60 mm) percolated into much deep drier soil layers under T-warm at the V6-V12 stage. Larger increase of SWP at both the V12-VT (14.8 KPa) and VT-R3 (6.7 KPa) stages occurred under warming condition with respect to T-control. The significant decrease of SWP in the 0–100.5 cm layer at the R3-R6 stage showed little differences between the T-control (22.0 KPa) and T-warm (20.3 KPa) experiments. However, there was different pattern of SWP and VWC for the two experiments especially at depths of 82.5 and 100.5 cm. This might be aroused by the differences in the initial VWC and SWP at the above depths under T-control and T-warm.

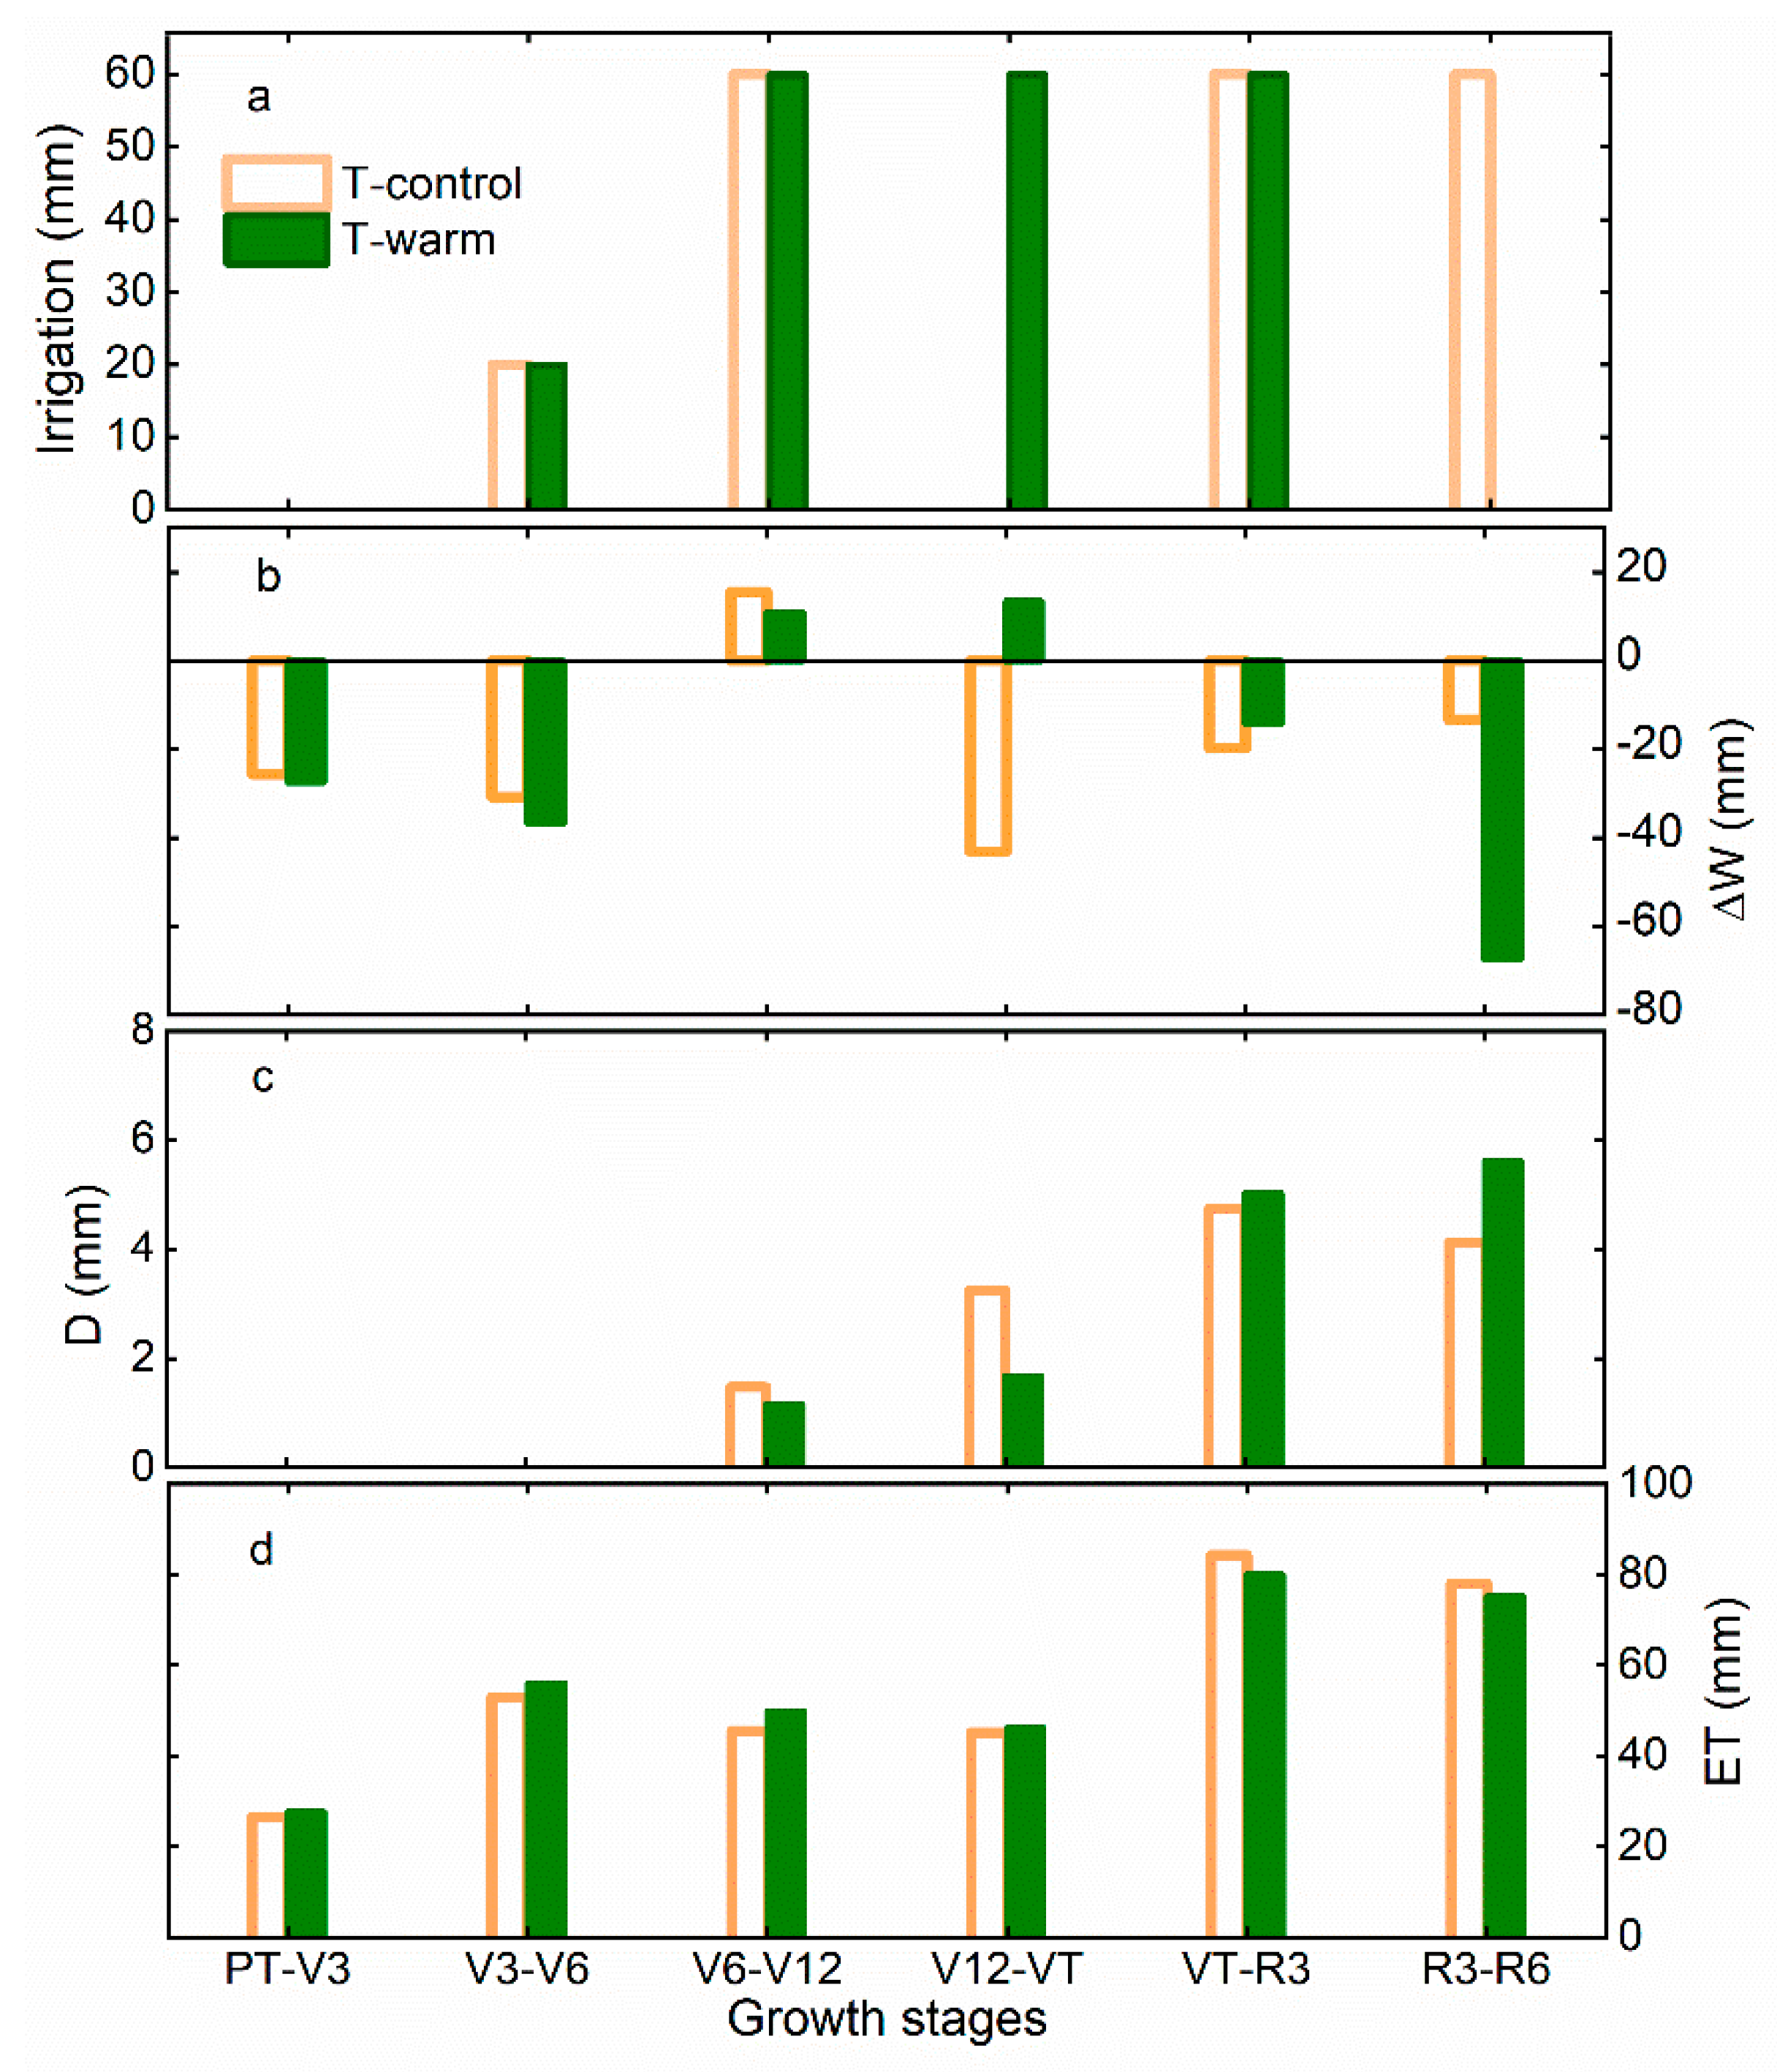
3.2. Temporal Variations in the Water Fluxes at Different Groundwater–Soil–Plant–Atmosphere Continuum (GSPAC) Interfaces

Daily variations in ∆W, D and ET changed significantly after irrigation applications (Figure 5). Daily ∆W reached the peak value of 50.7 mm on the 45 day after transplanting (DAT) in the T-control experiment (Figure 5b), while the mean daily ∆W was mean of −2.8 mm during the period without irrigation. Compared to T-control, the peak value of daily ∆W under T-warm was smaller (42.5 mm on the 55 DAT) and the mean daily ∆W was −3.0 mm in the days without irrigation. Daily groundwater recharge varied in a similar range of 0.2 mm −0.3 mm (with mean of 0.2 mm) under T-control and T-warm (Figure 5c). Warming did not significantly affect the daily D (p > 0.05). Daily D was mainly negative from 40 DAT (T-control) or 35 DAT (T-warm) to harvest stage and groundwater recharged the unsaturated zone except when heavy irrigation applied (Figure 5c). This indicated that maize could uptake groundwater by the fine roots in deep soil layers during the developing growth stage. Daily variation in ET for maize could be described as a unimodal curve (Figure 5d). The daily ET ranged from 2.1 to 3.4 mm with the mean value of 2.7 mm under T-control, while the mean daily ET was 2.8 mm with a peak value of 3.7 mm appearing on the 56 DAT under T-warm. The average daily ET for maize increased by approximately 6.7% under 2 °C warming with respect to that under T-control (Figure 5d). The ET trend showed a similarity among the T-control and T-warm experiments after 60 days whereas there was a clear increase under T-warm prior to that.
Figure 6 showed the seasonal variations in ∆W, D and ET at different growth stages. The maximum soil water consumption occurred at the V12-VT stage under T-control (43.0 mm), while it reached up to 67.4 mm at the R3-R6 stage under T-warm (Figure 6b). There was no significant difference in seasonal D between T-control and T-warm experiments (p > 0.05). Periodical groundwater recharge reached the maximum of 4.8 mm at the VT-R3 stage under T-control (Figure 6c), while the peak value was 5.6 mm occurring at the R3-R6 stage under T-warm. It was evident that there was a considerable increase of the daily ET (mean of 0.36 mm) during the V6 to VT stages (Figure 6d). The largest periodical ET was 84.3 mm at the VT-R3 stage under T-control, while it reduced to 80.0 mm at this stage under T-warm (Figure 6d). It should be noted that there were no evident differences of total ∆W, D and ET during the whole growing season between T-control and T-warm (−119.0 mm vs. −119.0 mm, −13.6 mm vs. −13.5 mm, 332.6 mm vs. 332.5 mm for the total ∆W, D and ET, respectively). However, the reduction of the length of growing season under 2°C warming increased the mean daily ET by approximately 6.8%.

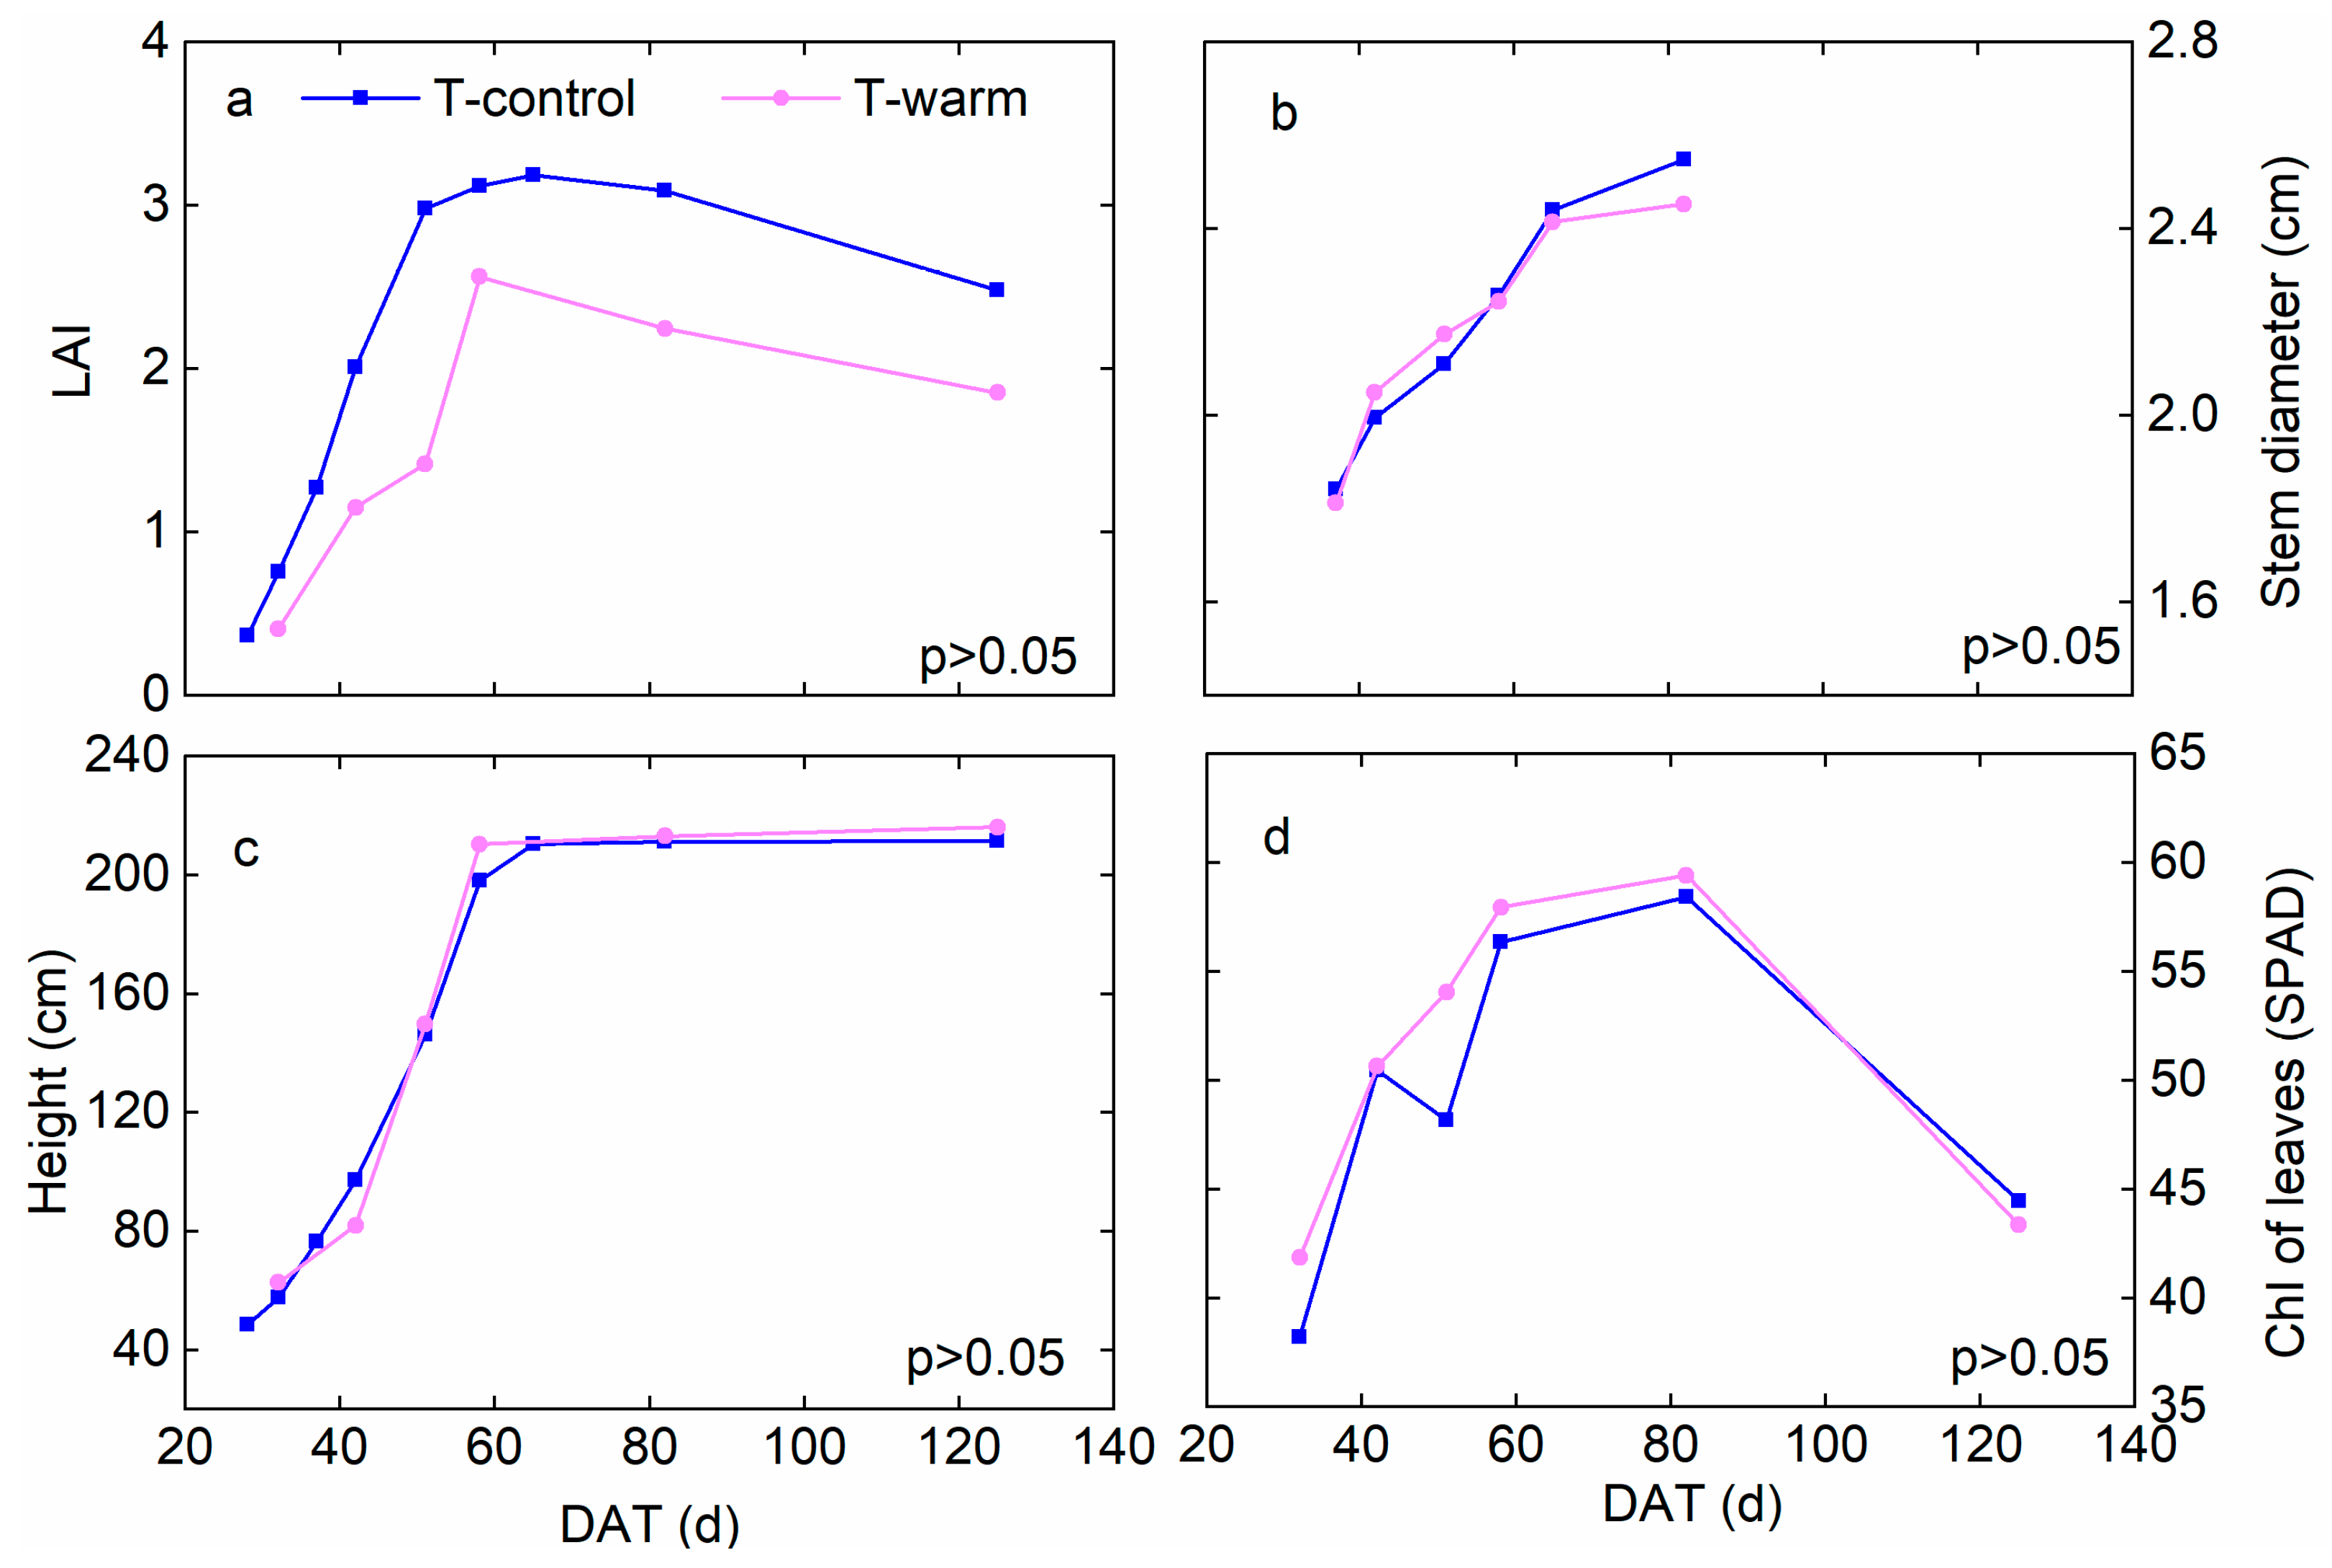
3.3. Temporal Variations in Maize Development and WUE

The 2 °C warming resulted in evident decreases of the LAI and non-significant decreases of stem diameter, height and SPAD (p > 0.05) at most of growth stages of maize (Figure 7). The LAI declined considerably by a mean of 0.89 after the V6 stage. The maximum LAI and stem diameter both reduced by 24.5% and 4.8%. There was a little difference of crop height between T-control and T-warm, but the maximum plant height increased by 2.2% under T-warm. The SPAD values of leaves increased by warming in the maize growing season except at maturity. The increased leaf chlorophyll content indicated that there was higher nitrogen content in maize leaves under T-warming, which was likely to accelerate photosynthesis and transpiration rate as well as enhance the crop yield.
The dry biomass at harvest and grain yield for maize increased by 5.0% (from 18,219.4 kg hm−2 to 19,128.5 kg hm−2) and 11.0% (from 7768.0 kg hm−2 to 8620.4 kg hm−2) under T-warming compared to those under T-control, respectively. The WUE for maize under T-warm (2.6 kg hm2 mm1) improved remarkably compared to that under T-control (2.3 kg hm2 mm1) due to the large increase of grain yield. The 2 °C warming also increased the WUEI significantly by approximately 11.3% (2.6 kg hm2 mm1 and 2.9 kg hm2 mm1 for T-control and T-warm, respectively).

4. Discussion

Warming increased the mean daily ET for maize by approximately 6.7% and hence significantly (p < 0.05). This might be due to the fact that warming increased the soil evaporation rate [15,16,17]. However, the shortened growing season duration under warming caused non-significant change in the total ET between T-warm and T-control, which was also reported in previous studies [1,22]. Larger ET rates could lead to more rapid depletion of soil moisture especially during the developing growth periods [2,18,28]. This clarified the great change in the total ∆W during the V3 to V6 stage. The value of D might be influenced by soil texture and hydraulic properties which were critical to determine the ∆W in response to warming [27,28]. Several researchers noted that the total D decreased due to shortened growing period under warming [1,22], whereas others argued that warming had no great impact on D [27,28]. The soil at depths of 82.5 and 100.5 cm was drier at the beginning of the experiment under T-warm than that under T-control. The smaller soil water availability at these depths increased the capacity for additional irrigation recharge under T-warm [38]. This resulted in the pulse changing trends of the soil moisture at these depths under T-warm with respect to the decreasing trends under T-control.
The LAI of maize decreased by 17.9% at the tasseling stage with elevated temperature of 2 °C in this study and agreed well with the results in [7,39]. Elevated temperature stimulated the speed of crop growth which led to an earlier tasseling stage and shortened vegetative phase. Warming accelerated vegetative development and led to an earlier tasseling stage for maize [40]. It was reported that plant height declined by 0.5–5.6% under elevated temperature of 1.5 °C and 3.0 °C compared to ambient conditions [7]. In this study, the maximum plant height increased by 2.2% under 2 °C warming. These might be influenced by the different light control systems between experiments and maize phototropism. The increase of mean SPAD (3.8%) under the warming condition was in agreement with that of 3.5–6.4% reported in [7]. The reason may be that warming substantially increased chloroplast width and thus significantly enhanced the chloroplast area and mitochondria area [20]. The higher SPAD value before 60 DAT could greatly stimulate the photosynthesis rate under 2 °C warming, which resulted in an evident increase of transpiration with respect to that under the T-control during this period [41]. Moreover, warming could increase more gas molecules diffuse through the stomata for higher net photosynthesis rate and transpiration especially during the rapid developing growth stages [42]. The significant increase of transpiration led to an evident increase of ET under T-warm compared to the T-control prior to 60 DAT in Figure 5d.
Crop yield tended to decrease significantly with the elevation of temperature and keeping global warming within 1.5 °C had greater benefits for reducing future yield loss risk than 2 °C warming [19]. Elevating temperature by 1.5 °C and 3 °C decreased grain yield by 4.9% compared to ambient temperature [7]. However, regional differences in the response of crop productivity to climate change occurred worldwide [21]. Experimental warming did not affect the yield of maize in the North China Plain indicated by [20]. It was found that warming would decrease WUE by 2–36% in different maize regions in China [43]. However, our results presented an increase of 11% for maize yield and WUE under 2 °C warming. This might be due to the fact that the net photosynthesis rate (positively correlated with SPAD) was increased for maize under a warming environment. This was beneficial for improving the leaf water utilization efficiency (the ratio of net photosynthesis to transpiration) and WUE. Another reason for the higher yield obtained in this study for the 2 °C warming compared to other climate change impact studies is possibly due to the constant CO2 considered here, whereas in other studies they might have considered higher CO2 concentration in the future.
Our results indicated that the responses of water balance and crop growth during the whole growing season for maize to warming were complicated. The results have several implications for agricultural water management. Firstly, there was a decrease in the maize leaf area index under warming, which would further increase soil evaporation due to the reduced shadow area of soil. In addition, leaf transpiration would be strong for decreasing the plant temperature to resist the unfavorable environment. Therefore, the daily ET consisting of both plant transpiration and soil evaporation tended to rise with increase of temperature. However, our results also found that the total ET did not increase due to the shortened growth period. Therefore, it is necessary to pay attention to both the amount and frequency of water requirement for designing irrigation schedules to exactly the water consumption for maize growth. Secondly, our study found that the growth period would be shortened by 8 days under a 2 °C warming environment. This indicated that farmers needed to adjust the sowing date and harvest date based on the local water and heat resources to form a new and rational agricultural planting to adapt to warming.
This study quantified the responses of water fluxes at GSPAC interfaces and maize development as well as WUE and WUEI to 2 °C warming applying WTDPED. The WTDPED has advantages in controlling temperature, humidity, light, CO2 concentration accurately and weighting change of water balance in the lysimeter with high precision. However, several issues still need further investigation. First, more experiments should be conducted under different temperature, CO2 and precipitation conditions to systematically analyze the responses of water cycle and crop growth in GSPAC to drought and cold stress as well as elevated CO2. Second, scientists have cracked the DNA sequence code of wheat, which is a major breakthrough that could improve global food security and offer the opportunity to improve the adaptability of the world’s most common corps such as maize to changes in the environment [44]. This will bring hope to farmers who suffer from drought, as the major crop can be genetically modified (bio-genetic-engineering) to be drought proof/resistant, fast-growing, high yield and less water demand. More physiological parameters such as the DNA code can be monitored to clarify the mechanism of crop and water responses to climate change, especially drought [45]. Third, lab/controlled experiments should be combined with simulation models to predict the effects of different climate change scenarios on water cycle and crop development in GSPAC [46,47].

5. Conclusions

The WTDPED device comprising a chamber, weighing lysimeters and groundwater supply system was applied to quantify the responses of water fluxes at different GSPAC interfaces and crop development at 2 °C warming for maize. The daily evapotranspiration rate increased by mean of 0.36 mm during the sixth leaf to tasseling—silking stage under the 2 °C warming condition. The considerable increase of chlorophyll content (12%) accelerated the photosynthesis and transpiration rate during this period. However, 2 °C temperature elevation did not change the total evapotranspiration in the entire growing season, which was mainly due to the shortened growing season (reduced by 8 days). There was no significant difference in the temporal variations in drainage between the warming and temperature controlled experiments (p > 0.05). The 2 °C warming also did not change the total soil water storage in the entire growing season. The grain yield and water-use efficiency were both improved by approximately 11%, which was likely to be enhanced at the sixth leaf to the tasseling–silking stage. Besides the 2 °C warming condition, we have also conducted the experiments under the CO2 concentration of 700 ppm. The comparisons between the results under two different CO2 concentration conditions (376 ppm vs. 700 ppm) and the two different lysimeters (homogeneous vs. layered soils) are the next immediate step in our investigations. The obtianed findings will be of great significance for assessing the impacts of environmental change on the water cycle and maize growth in North China.

Supplementary Materials

The following are available online at https://www.mdpi.com/2073-4441/10/11/1660/s1, Figure S1: Soil water retention curve of the homogenous soil in the WTDPD.

Author Contributions

Y.W. and Y.M. performed the experiments, analyzed data and wrote the manuscript and they contributed equally to this work; X.S. was responsible for the idea of this study and designed the experiments; L.Y. provided important advice on the methodology; S.Y. provided suggestions on the revision of the manuscript.

Funding

This research was funded by the National Natural Science Foundation of China and China Postdoctoral Science Foundation, grant No. 41671027, 41730749 and No. 1610132018031, respectively.

Acknowledgments

We offer sincere thanks to Xingguo Mo and Liping Tan for their substantial support in the experimental design and data collecting.

Conflicts of Interest

The authors declare no conflicts of interest.

References

  1. Eitzinger, J.; Štastná, M.; Žalud, Z.; Dubrovský, M. A simulation study of the effect of soil water balance and water stress on winter wheat production under different climate change scenarios. Agric. Water Manag. 2003, 61, 195–217. [Google Scholar] [CrossRef]
  2. Holsten, A.; Vetter, T.; Vohland, K.; Krysanova, V. Impact of climate change on soil moisture dynamics in Brandenburg with a focus on nature conservation areas. Ecol. Model. 2009, 220, 2076–2087. [Google Scholar] [CrossRef]
  3. Zhang, Y.; Sun, F.; Pan, M.; Niel, T.V.; Wegehenkel, M. Hydrological processes in changing climate, land use and cover change. Adv. Meteorol. 2016, 73, 55–63. [Google Scholar] [CrossRef]
  4. Liu, J.; Luo, M.; Bao, A.; De M, P.; Feng, X.; Chen, X. Local climate change and the impacts on hydrological processes in an arid alpine catchment in Karakoram. Water 2017, 9, 344. [Google Scholar] [CrossRef]
  5. Zhu, D.; Das, S.; Ren, Q. Hydrological appraisal of climate change impacts on the water resources of the Xijiang Basin, South China. Water 2017, 9, 793. [Google Scholar] [CrossRef]
  6. Deb, P.; Kiem, A.S.; Babel, M.S.; Chu, S.T.; Chakma, B. Evaluation of climate change impacts and adaptation strategies for maize cultivation in the Himalayan foothills of India. J. Water Clim. Chang. 2015, 6, 596–614. [Google Scholar] [CrossRef]
  7. Abebe, A.; Pathak, H.; Singh, S.D.; Bhatia, A.; Harit, R.C.; Kumar, V. Growth, yield and quality of maize with elevated atmospheric carbon dioxide and temperature in north-west India. Agric. Ecosyst. Environ. 2016, 218, 66–72. [Google Scholar] [CrossRef]
  8. Babel, M.S.; Deb, P.; Soni, P. Performance evaluation of AquaCrop and DSSAT-CERES for maize under different irrigation and manure application rates in the Himalayan region of India. Agric. Res. 2018, 1–11. [Google Scholar] [CrossRef]
  9. Thomas, A. Agriculture irrigation demand under present and future climate scenarios in China. Glob. Planet. Chang. 2008, 60, 306–326. [Google Scholar] [CrossRef]
  10. Mo, X.; Liu, S.; Lin, Z.; Guo, R. Regional crop yield, water consumption and water use efficiency and their responses to climate change in the North China Plain. Agric. Ecosyst. Environ. 2009, 134, 67–78. [Google Scholar] [CrossRef] [Green Version]
  11. IPCC (Intergovernmental Panel on Climate Change). Climate Change 2014: Synthesis Report. Contribution of Working Groups I, II and III to the Fifth Assessment Report of the Intergovernmental Panel on Climate Change; Pachauri, R.K., Meyer, L.A., Eds.; IPCC: Geneva, Switzerland, 2014; Volume 151, pp. 59–60. [Google Scholar]
  12. Rijsberman, F.; Swart, R. Targets and Indicators of Climate Change; Report of Working Group II of the Advisory Group on Greenhouse Gases; Stockholm Environmental Institute: Stockholm, Sweden, 1990. [Google Scholar]
  13. Jaeger, C.C.; Jaeger, J. Three views of two degrees. Reg. Environ. Chang. 2011, 11, 15–26. [Google Scholar] [CrossRef]
  14. Zhao, L.; Zhao, W. Water balance and migration for maize in an oasis farmland of northwest China. Chin. Sci. Bull. 2014, 59, 4829–4837. [Google Scholar] [CrossRef]
  15. Ben-asher, J.; Hoogenboom, G. Effect of high temperature on photosynthesis and transpiration of sweet corn (Zea mays L. var. rugosa). Photosynthetica 2008, 46, 595–603. [Google Scholar] [CrossRef]
  16. Cheng, H.; Ren, W.; Ding, L.; Liu, Z.; Fang, C. Responses of a rice-wheat rotation agroecosystem to experimental warming. Ecol. Res. 2013, 28, 959–967. [Google Scholar] [CrossRef]
  17. Zheng, Y.; Xu, M.; Shen, R.; Qiu, S. Effects of artificial warming on the structural, physiological and biochemical changes of maize (Zea mays L.) leaves in northern China. Acta Physiol. Plant. 2013, 35, 2891–2904. [Google Scholar] [CrossRef]
  18. Kizildeniz, T.; Mekni, I.; Santesteban, H.; Pascual, I.; Morales, F.; Irigoyen, J.J. Effects of climate change including elevated CO2 concentration, temperature and water deficit on growth, water status and yield quality of grapevine (Vitis vinifera L.) cultivars. Agric. Water Manag. 2015, 159, 155–164. [Google Scholar] [CrossRef]
  19. Leng, G. Keeping global warming within 1.5 °C reduces future risk of yield loss in the United States: A probabilistic modeling approach. Sci. Total Environ. 2018, 644, 52–59. [Google Scholar] [CrossRef] [PubMed]
  20. Zheng, Y.; Guo, L.; Hou, R.; Zhou, H.; Hao, L.; Li, F.; Cheng, D.; Peng, Z.; Xu, M. Experimental warming enhances the carbon gain but does not affect the yield of maize (Zea mays L.) in the North China Plain. Flora 2018, 240, 152–163. [Google Scholar] [CrossRef]
  21. Bocchiola, D.; Nana, E.; Soncini, A. Impact of climate change scenarios on crop yield and water footprint of maize in the Po valley of Italy. Agric. Water Manag. 2013, 116, 50–61. [Google Scholar] [CrossRef]
  22. Jalota, S.K.; Kaur, H.; Kaur, S.; Vashisht, B.B. Impact of climate change scenarios on yield, water and nitrogen-balance and -use efficiency of rice-wheat cropping system. Agric. Water Manag. 2013, 116, 29–38. [Google Scholar] [CrossRef]
  23. Bocchiola, D. Impact of potential climate change on crop yield and water footprint of rice in the Po valley of Italy. Agric. Syst. 2015, 139, 223–237. [Google Scholar] [CrossRef]
  24. Yuan, X.; Bai, J. Future projected changes in local evapotranspiration coupled with temperature and precipitation variation. Sustainability 2018, 10, 3281. [Google Scholar] [CrossRef]
  25. Wolf, J.; Evans, L.G.; Semenov, M.A.; Eckersten, H.; Iglesias, A. Comparison of wheat simulation models under climate change. I. Model calibration and sensitivity analyses. Clim. Res. 1996, 7, 253–270. [Google Scholar] [CrossRef] [Green Version]
  26. Schmidhuber, J.; Tubiello, F.N. Global food security under climate change. Proc. Natl. Acad. Sci. USA 2007, 104, 19703–19708. [Google Scholar] [CrossRef] [PubMed] [Green Version]
  27. Green, T.R.; Taniguchi, M.; Kooi, H.; Gurdak, J.J.; Allen, D.M.; Hiscock, K.M.; Treidel, H.; Aureli, A. Beneath the surface of global change: Impacts of climate change on groundwater. J. Hydrol. 2011, 405, 532–560. [Google Scholar] [CrossRef]
  28. Pangle, L.A.; Gregg, J.W.; McDonnell, J.J. Rainfall seasonality and an ecohydrological feedback offset the potential impact of climate warming on evapotranspiration and groundwater recharge. Water Resour. Res. 2014, 50, 1308–1321. [Google Scholar] [CrossRef] [Green Version]
  29. Schoen, R.; Gaudet, J.P.; Bariac, T. Preferential flow and solute transport in a large lysimeter, under controlled boundary conditions. J. Hydrol. 1999, 215, 70–81. [Google Scholar] [CrossRef]
  30. Abdou, H.M.; Flury, M. Simulation of water flow and solute transport in free-drainage lysimeters and field soils with heterogeneous structures. Eur. J. Soil Sci. 2004, 55, 229–241. [Google Scholar] [CrossRef]
  31. Evett, S.R.; Schwartz, R.C.; Casanova, J.J.; Heng, L.K. Soil water sensing for water balance, ET and WUE. Agric. Water Manag. 2012, 104, 1–9. [Google Scholar] [CrossRef]
  32. Mantovani, D.; Veste, M.; Badorreck, A.; Freese, D. Evaluation of fast growing tree water use under different soil moisture regimes using wick lysimeters. iForest 2013, 6, 190–200. [Google Scholar] [CrossRef] [Green Version]
  33. Klammler, G.; Fank, J. Determining water and nitrogen balances for beneficial management practices using lysimeters at Wagna test site (Austria). Sci. Total Environ. 2014, 499, 448–462. [Google Scholar] [CrossRef] [PubMed]
  34. Wegehenkel, M.; Gerke, H.H. Water table effects on measured and simulated fluxes in weighing lysimeters for differently-textured soils. J. Hydrol. Hydromech. 2015, 63, 82–92. [Google Scholar] [CrossRef] [Green Version]
  35. Ruiz-Vera, U.M.; Siebers, M.H.; Drag, D.W.; Ort, D.R.; Bernacchi, C.J. Canopy warming caused photosynthetic acclimation and reduced seed yield in maize grown at ambient and elevated CO2. Glob. Chang. Biol. 2015, 21, 4237–4249. [Google Scholar] [CrossRef] [PubMed]
  36. Stumpp, C.; Nützmann, G.; Maciejewski, S.; Maloszewski, P. A comparative modeling study of a dual tracer experiment in a large lysimeter under atmospheric conditions. J. Hydrol. 2009, 375, 566–577. [Google Scholar] [CrossRef]
  37. Cai, J.B.; Liu, Y.; Xu, D.; Paredes, P.; Pereira, L.S. Simulation of the soil water balance of wheat using daily weather forecast messages to estimate the reference evapotranspiration. Hydrol. Earth Syst. Sci. 2009, 13, 1045–1059. [Google Scholar] [CrossRef] [Green Version]
  38. Naghedifar, S.M.; Ziaei, A.N.; Ansari, H. Simulation of irrigation return flow from a Triticale farm under sprinkler and furrow irrigation systems using experimental data: A case study in arid region. Agric. Water Manag. 2018, 210, 185–197. [Google Scholar] [CrossRef]
  39. Maroco, J.P.; Edwards, G.E.; Ku, M.S.B. Photosynthetic acclimation of maize to growth under elevated levels of carbon dioxide. Planta 1999, 210, 115–125. [Google Scholar] [CrossRef] [PubMed]
  40. Ruiz-Vera, U.M.; Siebers, M.H.; Jaiswal, D.; Ort, D.R.; Bernacchi, C.J. Canopy warming accelerates development in soybean and maize, offsetting the delay in soybean reproductive development by elevated CO2 concentrations: Climate change impacts on crops development. Plant Cell Environ. 2018. [Google Scholar] [CrossRef] [PubMed]
  41. Jin, B.; Wang, L.; Wang, J.; Jiang, K.Z.; Wang, Y.; Jiang, X.X.; Teng, N.J. The effect of experimental warming on leaf functional traits, leaf structure and leaf biochemistry in Arabidopsis thaliana. BMC Plant Biol. 2011, 11, 1–10. [Google Scholar] [CrossRef] [PubMed]
  42. Zheng, Y.P.; Xu, M.; Hou, R.X.; Shen, R.C.; Qiu, S.; Ouyang, Z. Effects of experimental warming on stomatal traits in leaves of maize (zea may L.). Ecol. Evol. 2013, 3, 3095–3111. [Google Scholar] [CrossRef] [PubMed]
  43. Guo, R.P.; Lin, Z.H.; Mo, X.G.; Yang, C.L. Response of crop yield and water use efficiency to climate change in the North China Plain. Agric. Water Manag. 2010, 97, 1185–1194. [Google Scholar] [CrossRef]
  44. Juhász, A.; Belova, T.; Florides, C.G.; Maulis, C.; Fischer, I.; Gell, G.; Birinyi, Z.; Ong, J.; Keeble-Gagnère, G.; Maharajan, A.; et al. Genome mapping of seed-borne allergens and immunoresponsive proteins in wheat. Sci. Adv. 2018, 4. [Google Scholar] [CrossRef] [PubMed]
  45. Yihdego, Y.; Salem, H.S.; Muhammed, H.H. Agricultural pest management policies during drought: Case studies in Australia and the state of Palestine. Nat. Hazards Rev. 2018, 20, 1–10. [Google Scholar] [CrossRef]
  46. Yihdego, Y.; Khalil, A. Groundwater resources assessment and impact analysis using a conceptual water balance model and time series data analysis: Case of decision making tool. Hydrology 2017, 4, 25. [Google Scholar] [CrossRef]
  47. Yihdego, Y.; Webb, J.A. Comparison of evaporation rate on open water bodies: Energy balance estimate versus measured pan. J. Water Clim. Chang. 2018, 9, 101–111. [Google Scholar] [CrossRef]
Figure 1. Schematic diagram (a) and photographs (b) of the water transformation dynamical processes experimental device (WTDPED). Ta and RH represent air temperature and relative humidity, respectively.
Water 10 01660 g001
Figure 2. Daily variations of designed and actual Ta in maize growing seasons under T-control and T-warm scenarios.
Water 10 01660 g002
Figure 3. Half-hourly variations in soil volumetric water content (VWC) at different depths in (a) T-control and (b) T-warm experiments, respectively.
Water 10 01660 g003
Figure 4. Half-hourly variations in soil matric potential (SWP) at different depths in (a) T-control and (b) T-warm experiments, respectively.
Water 10 01660 g004
Figure 5. Daily variations in (a) irrigation, (b) ΔW, (c) D and (d) ET during the growing season of maize under T-control and T-warm experiments. ΔW represents soil water storage change. D represents drainage at the bottom of the lysimeter. ET indicates crop evapotranspiration.
Water 10 01660 g005
Figure 6. Seasonal variations in (a) irrigation, (b) ΔW, (c) D and (d) ET at different growth stages of maize under T-control and T-warm experiments.
Water 10 01660 g006
Figure 7. Temporal variations in (a) leaf area index (LAI), (b) stem diameter, (c) height and (d) Soil and Plant Analyzer Development (SPAD) value of maize in T-control and T-warm experiments.
Water 10 01660 g007
Table 1. Irrigation and fertilization applications for maize in the T-control and T-warm experiments.
Date in T-Control ExperimentDate in T-Warm ExperimentManagement PracticesAmount
13 May 20143 January 2015Irrigation100 mm
N, P2O5, K2O150, 150, 150 kg ha−1 *
3 June 201427 January 2015Irrigation20 mm
N, P2O5, K2O100, 100, 100 kg ha−1 *
1 July 201412 February 2015Irrigation60 mm
30 July 20143 March 2015Irrigation60 mm
Urea300 kg ha−1 *
5 September 201430 March 2015Irrigation60 mm
Note: * the dosage of fertilizers referred to the practices employed by local farmers [37].

