The Influence of Climate and Land-Cover Scenarios on Dam Management Strategies in a High Water Pressure Catchment in Northeast Spain


 , , and
Abstract
:1. Introduction
2. Materials and Methods
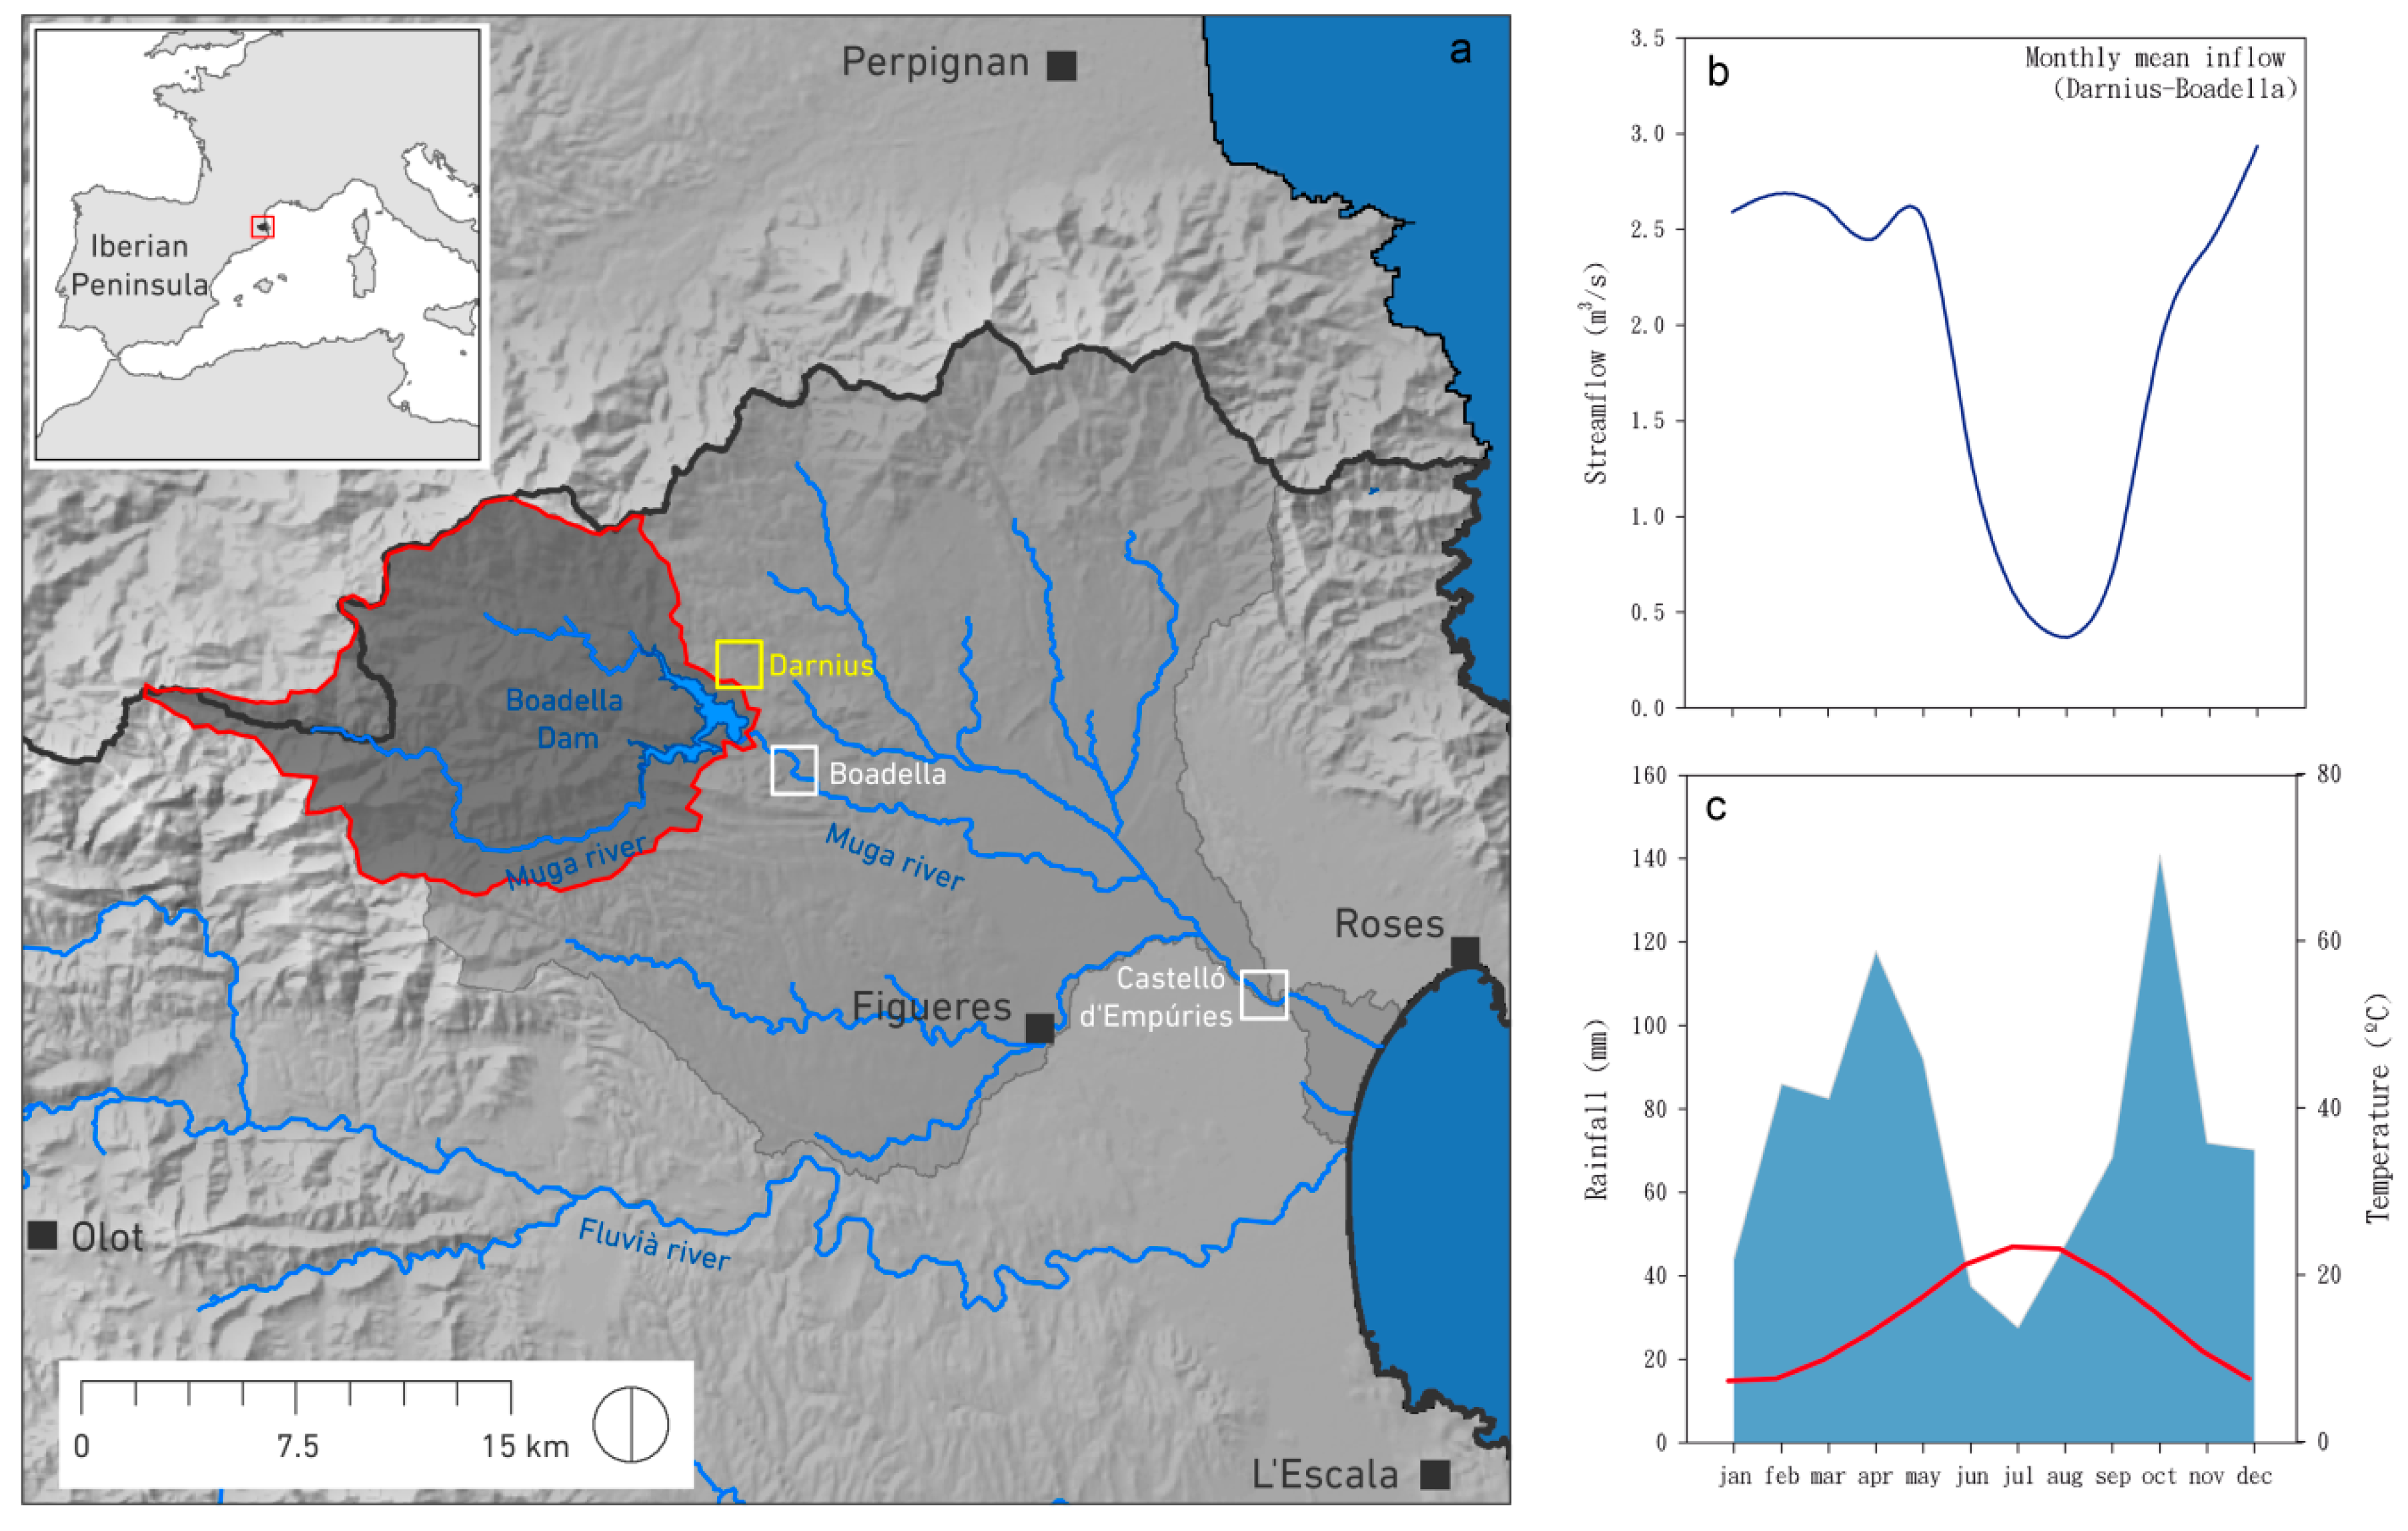
2.1. Study Area
2.2. Climatic and Hydrological Data
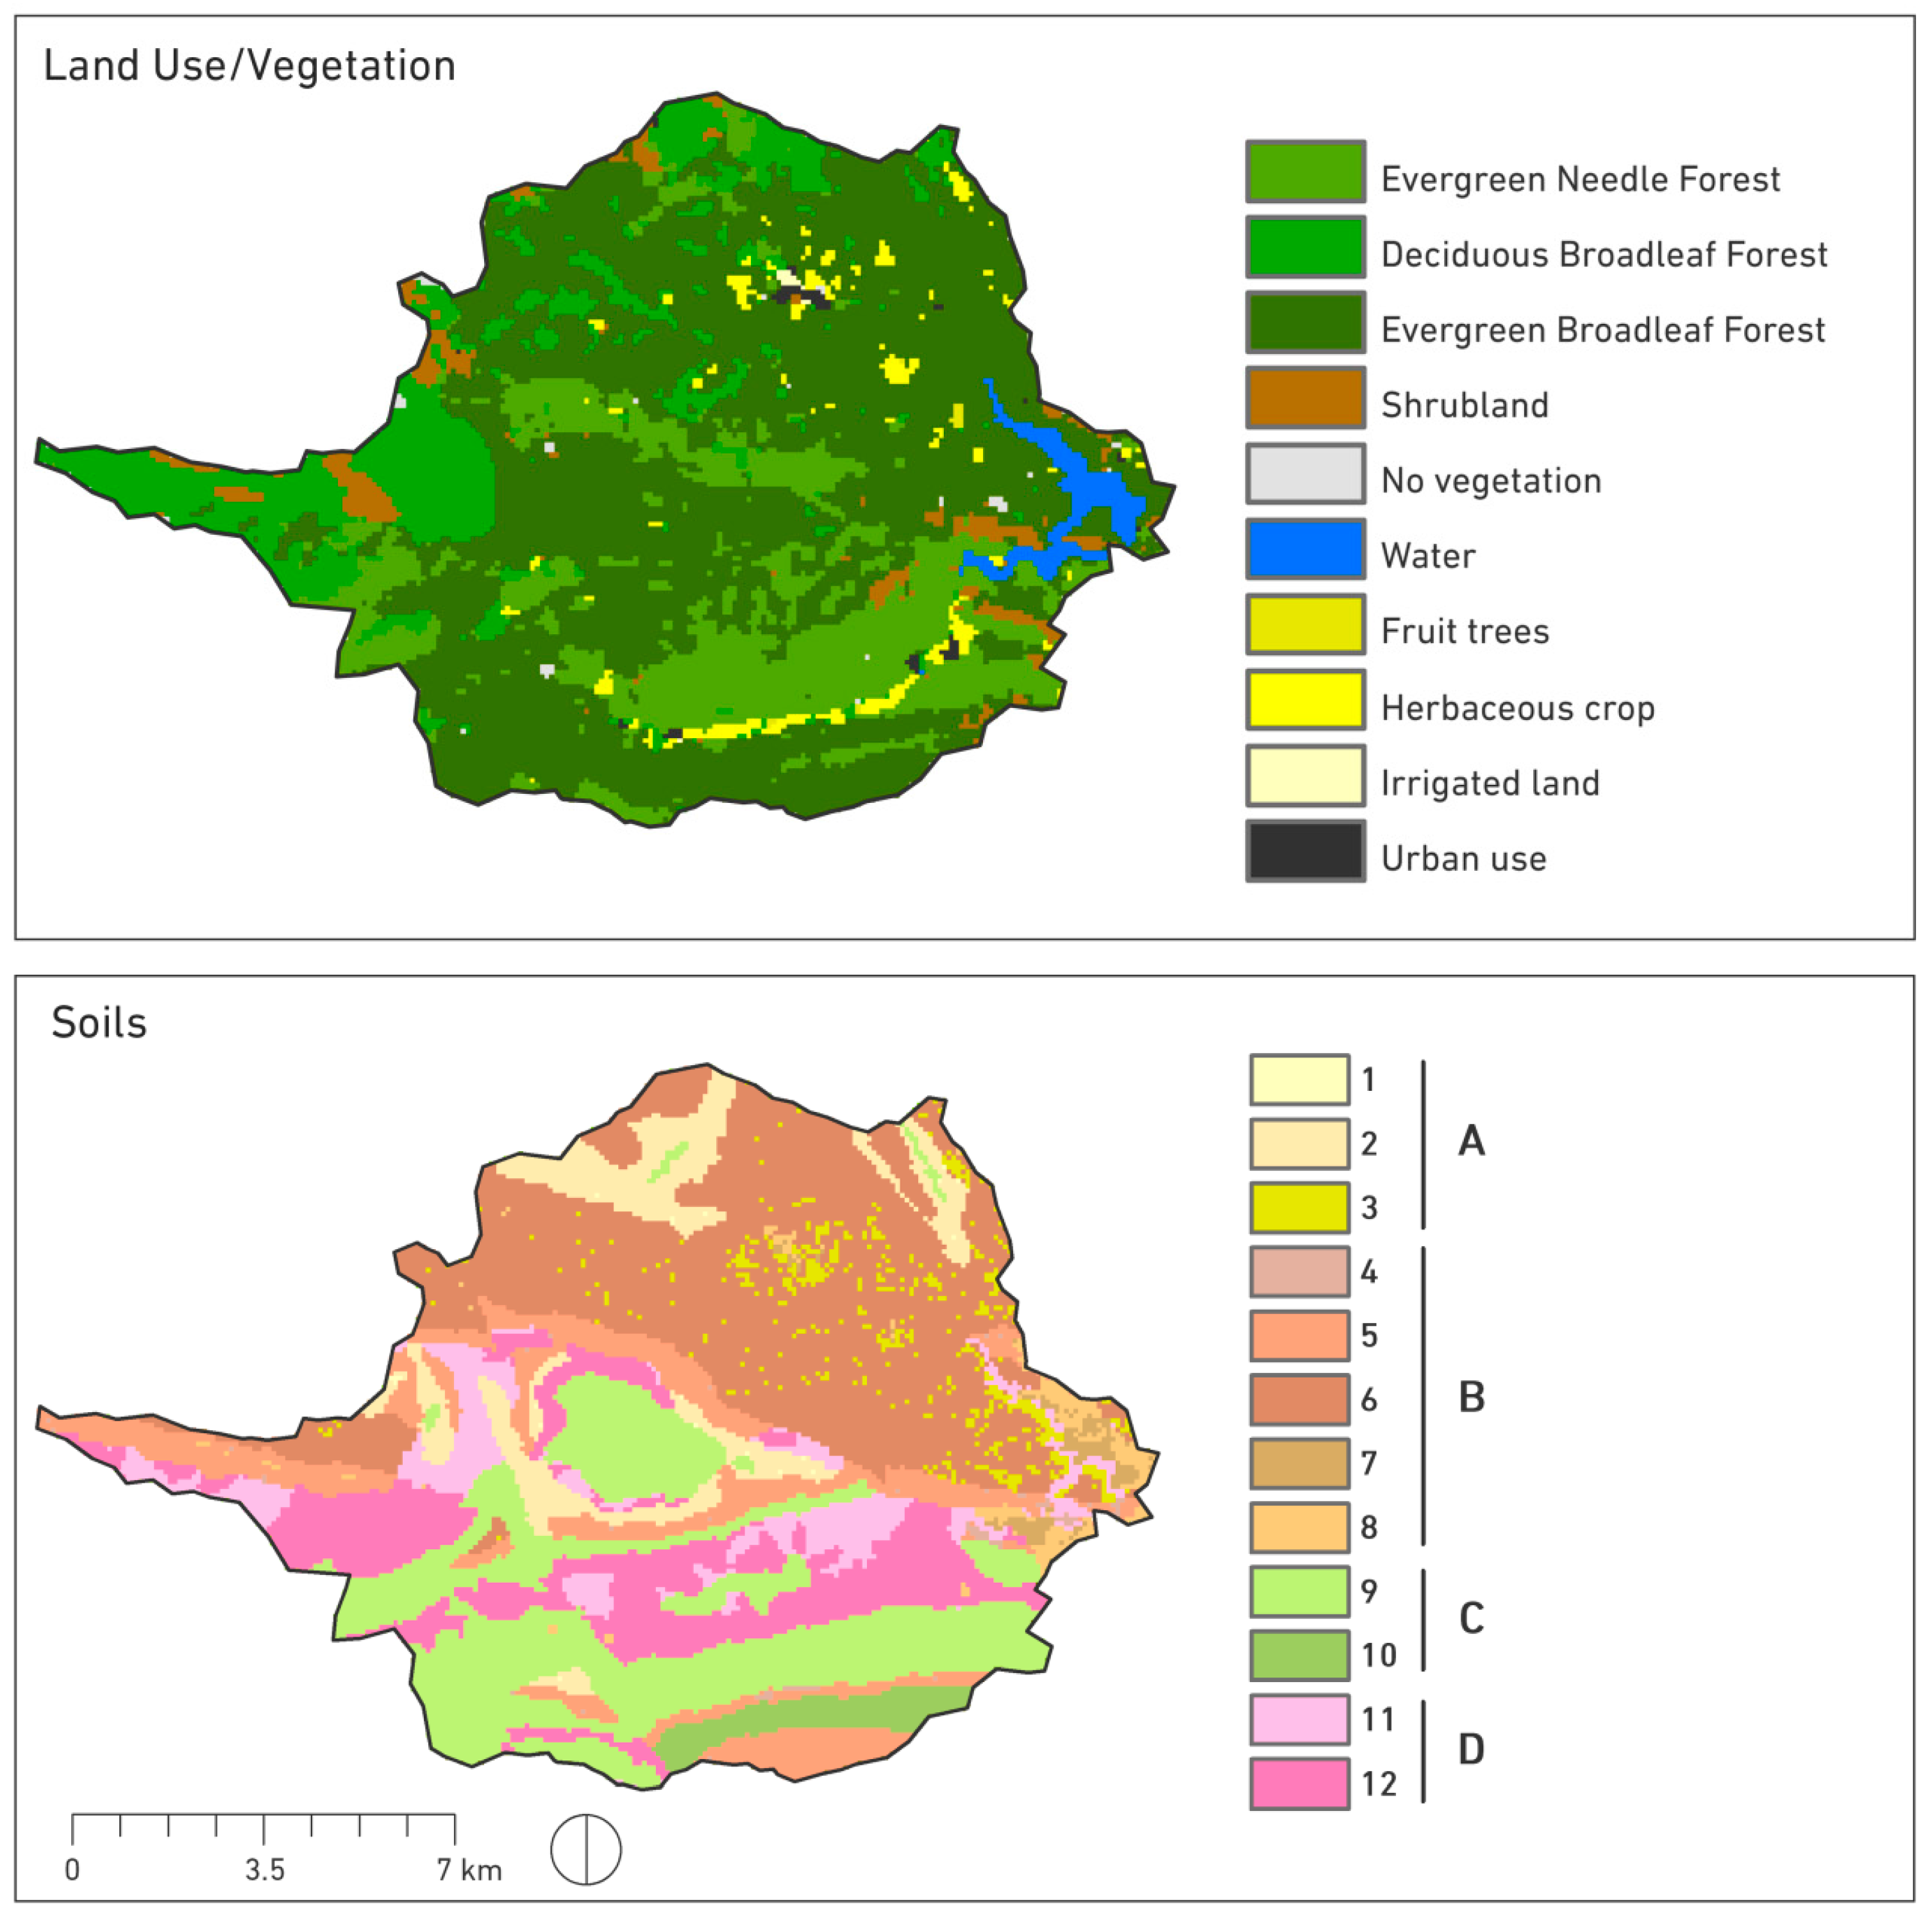
2.3. Spatial Data
2.4. Regional Hydro-Ecological Simulation System (RHESsys)
3. Results
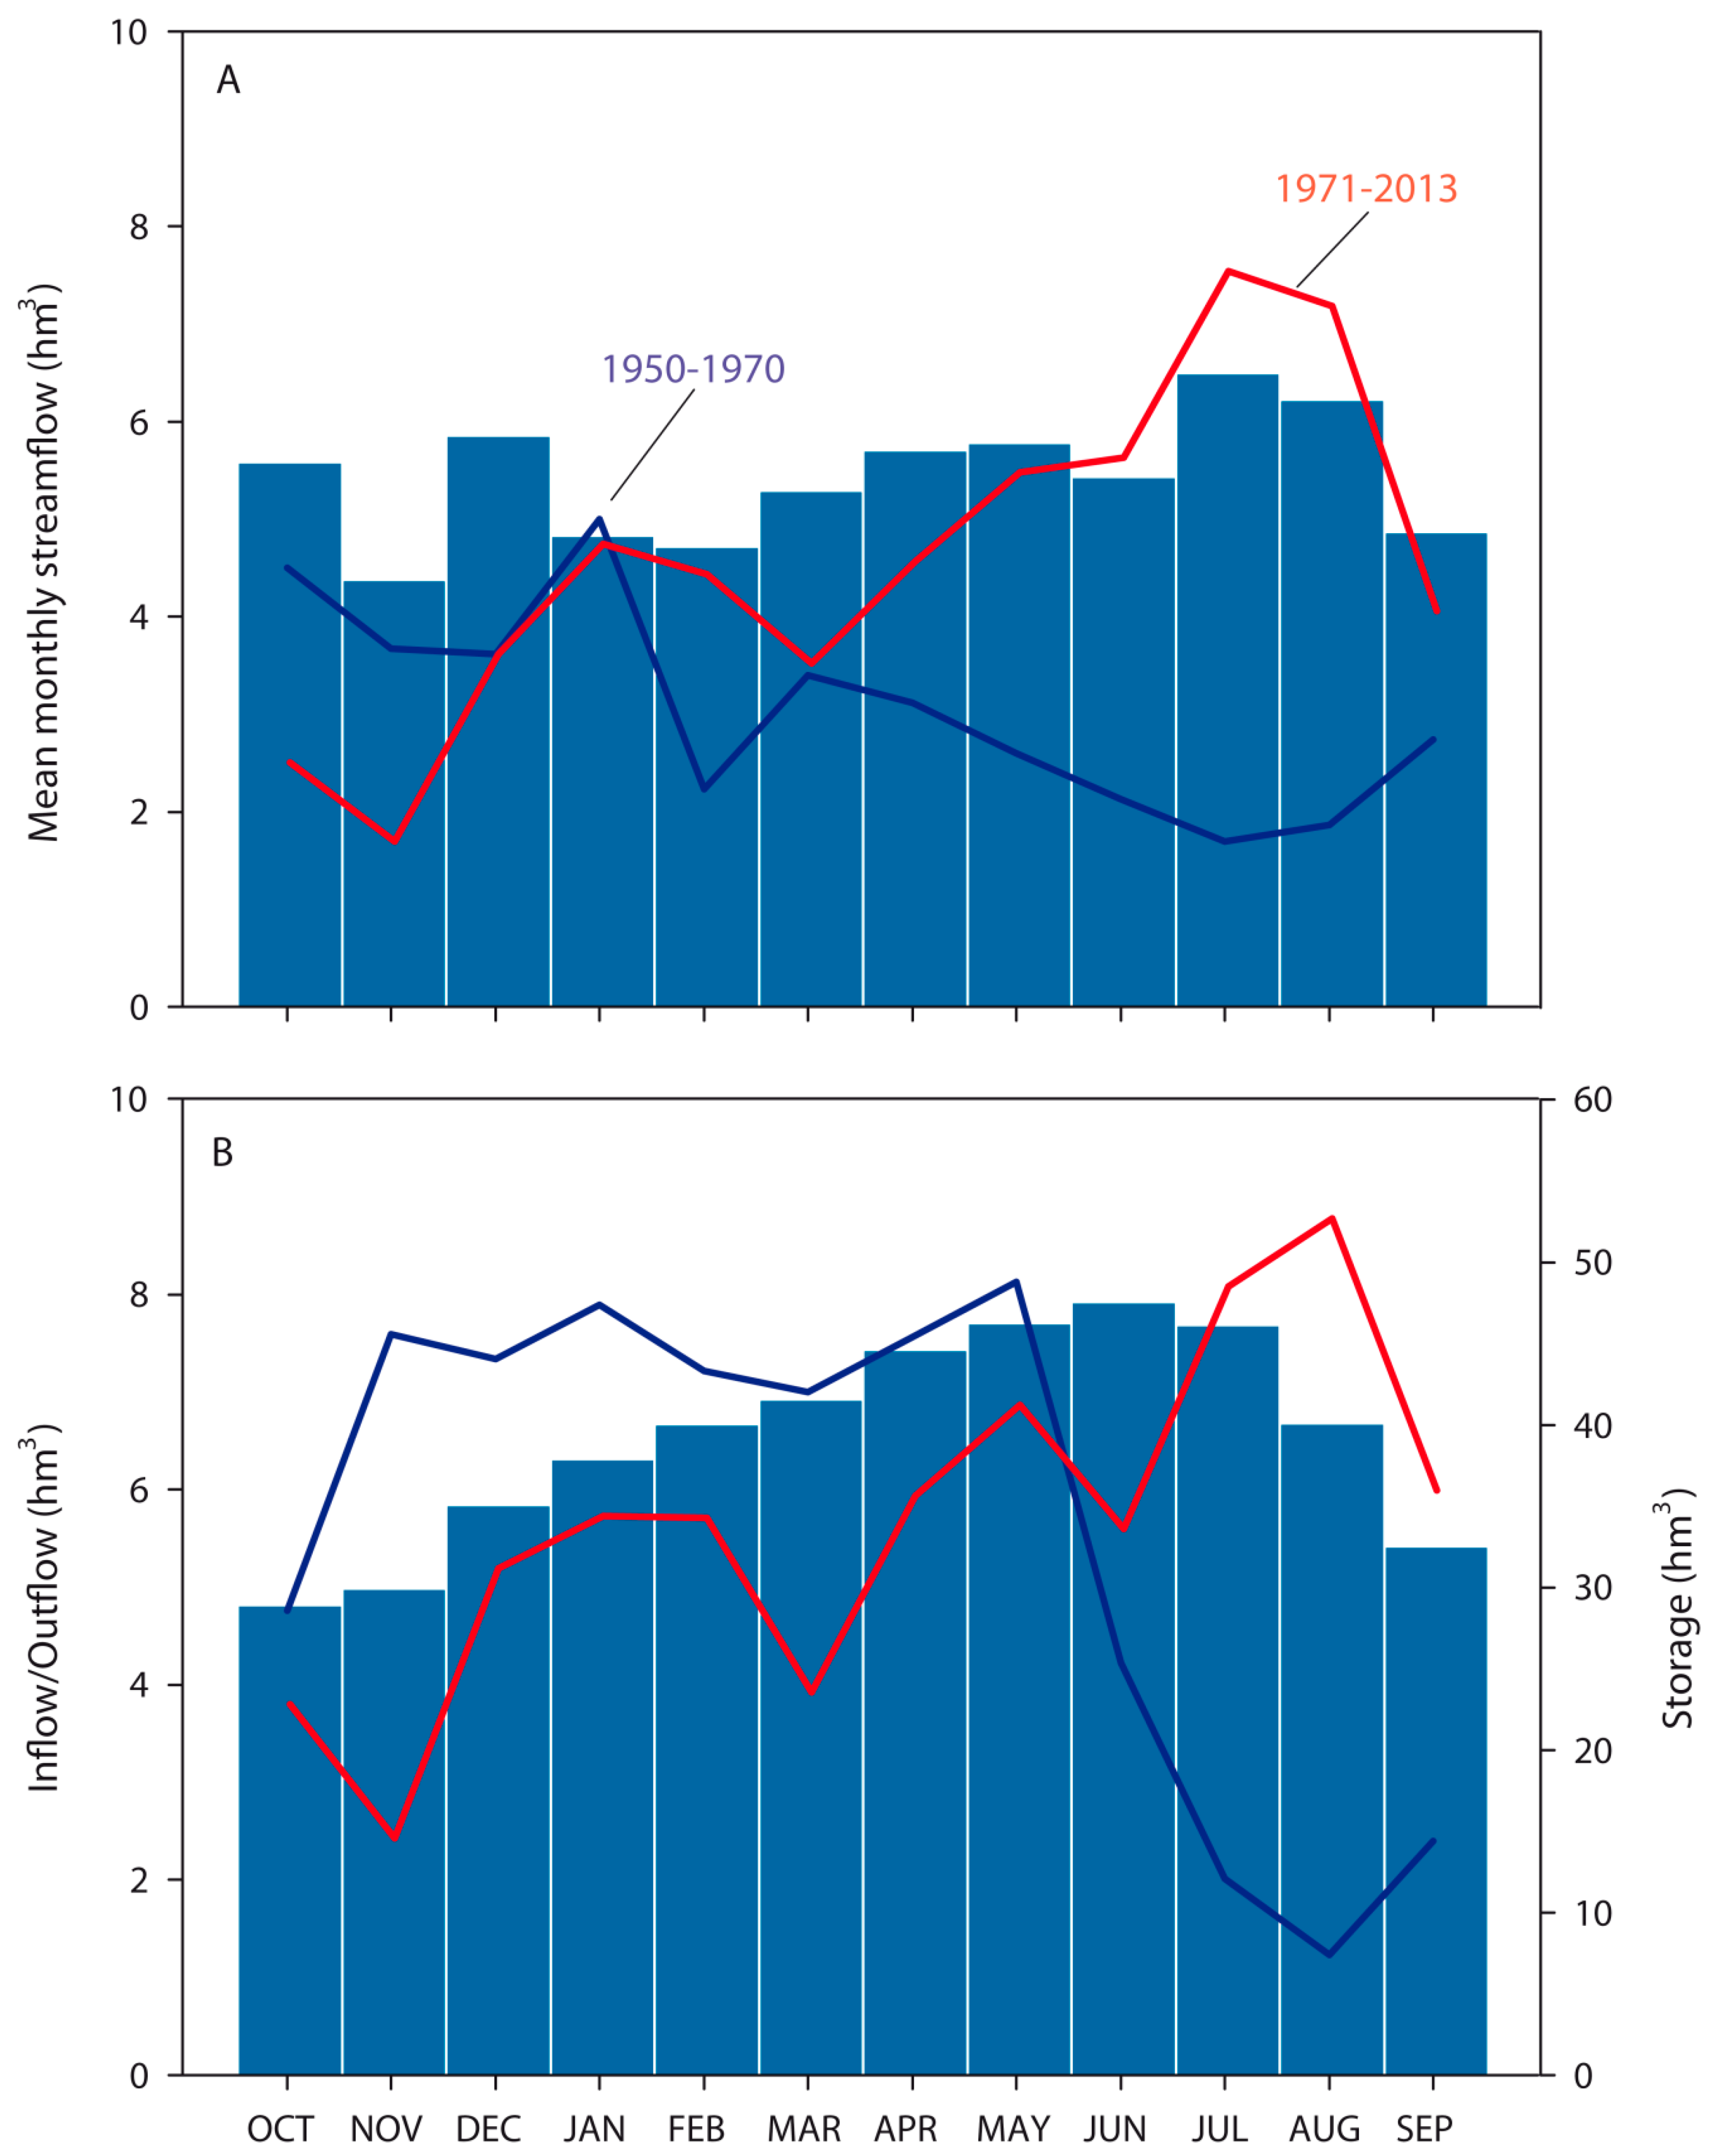
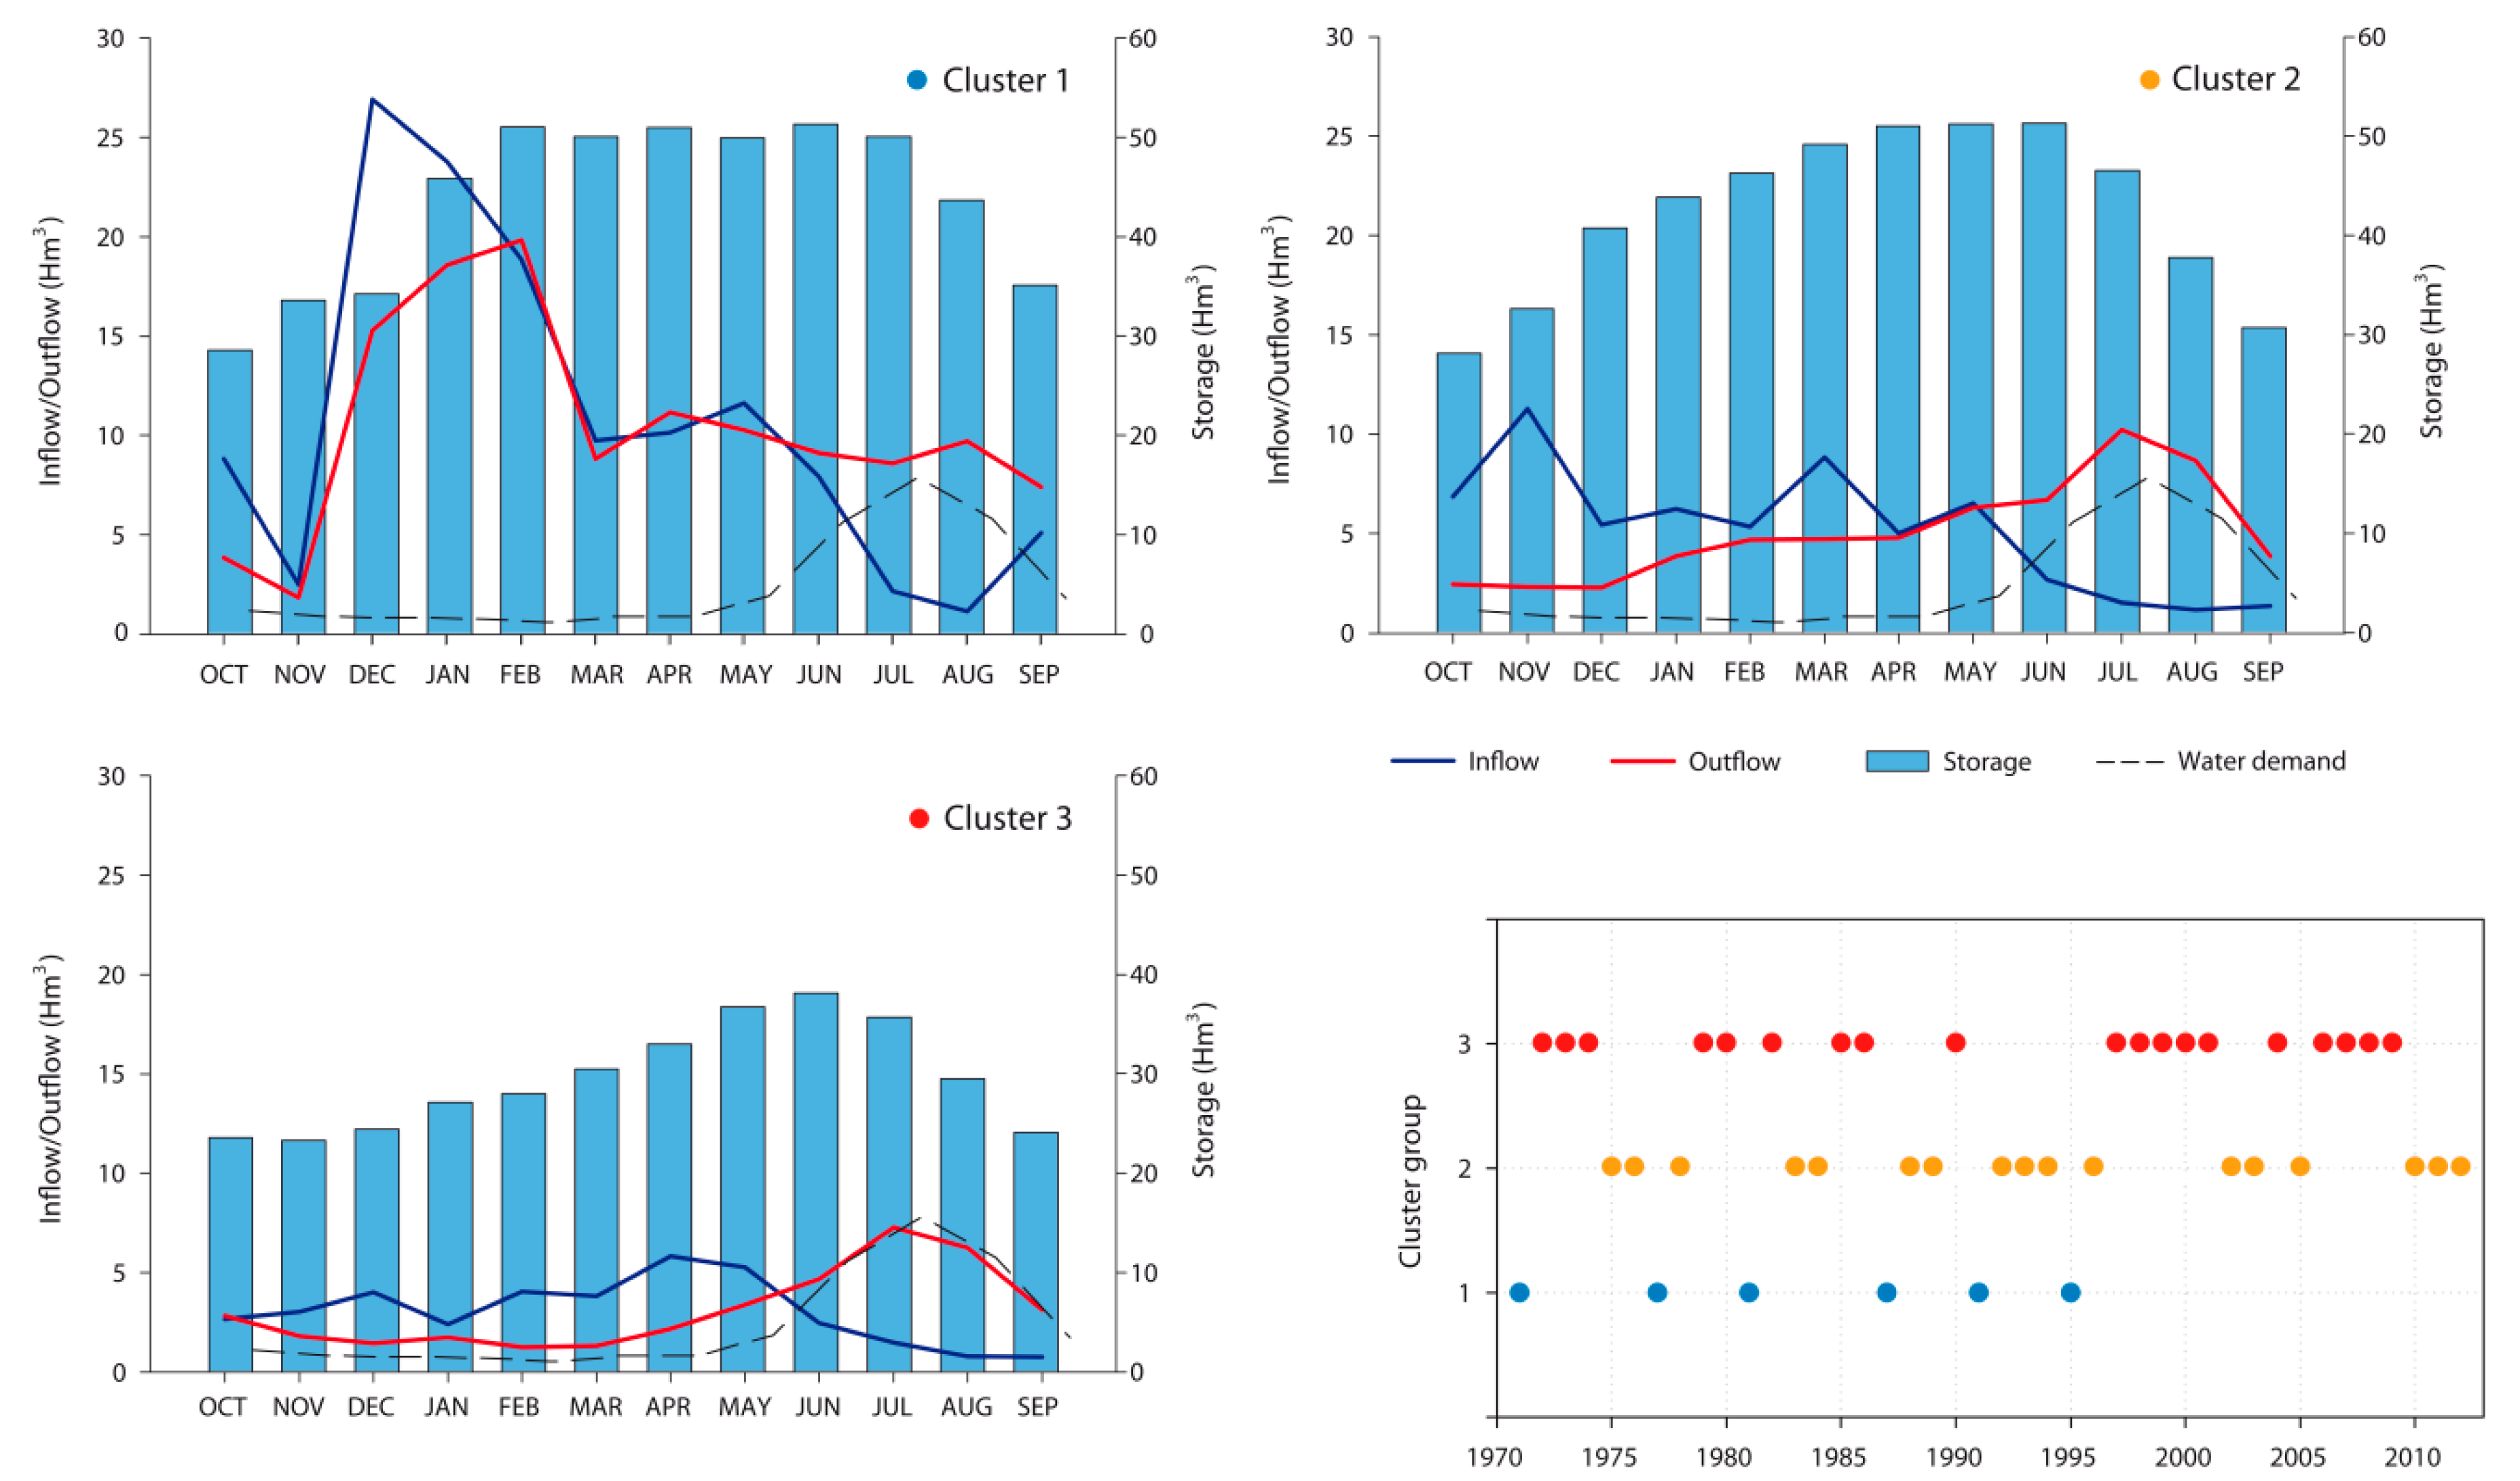
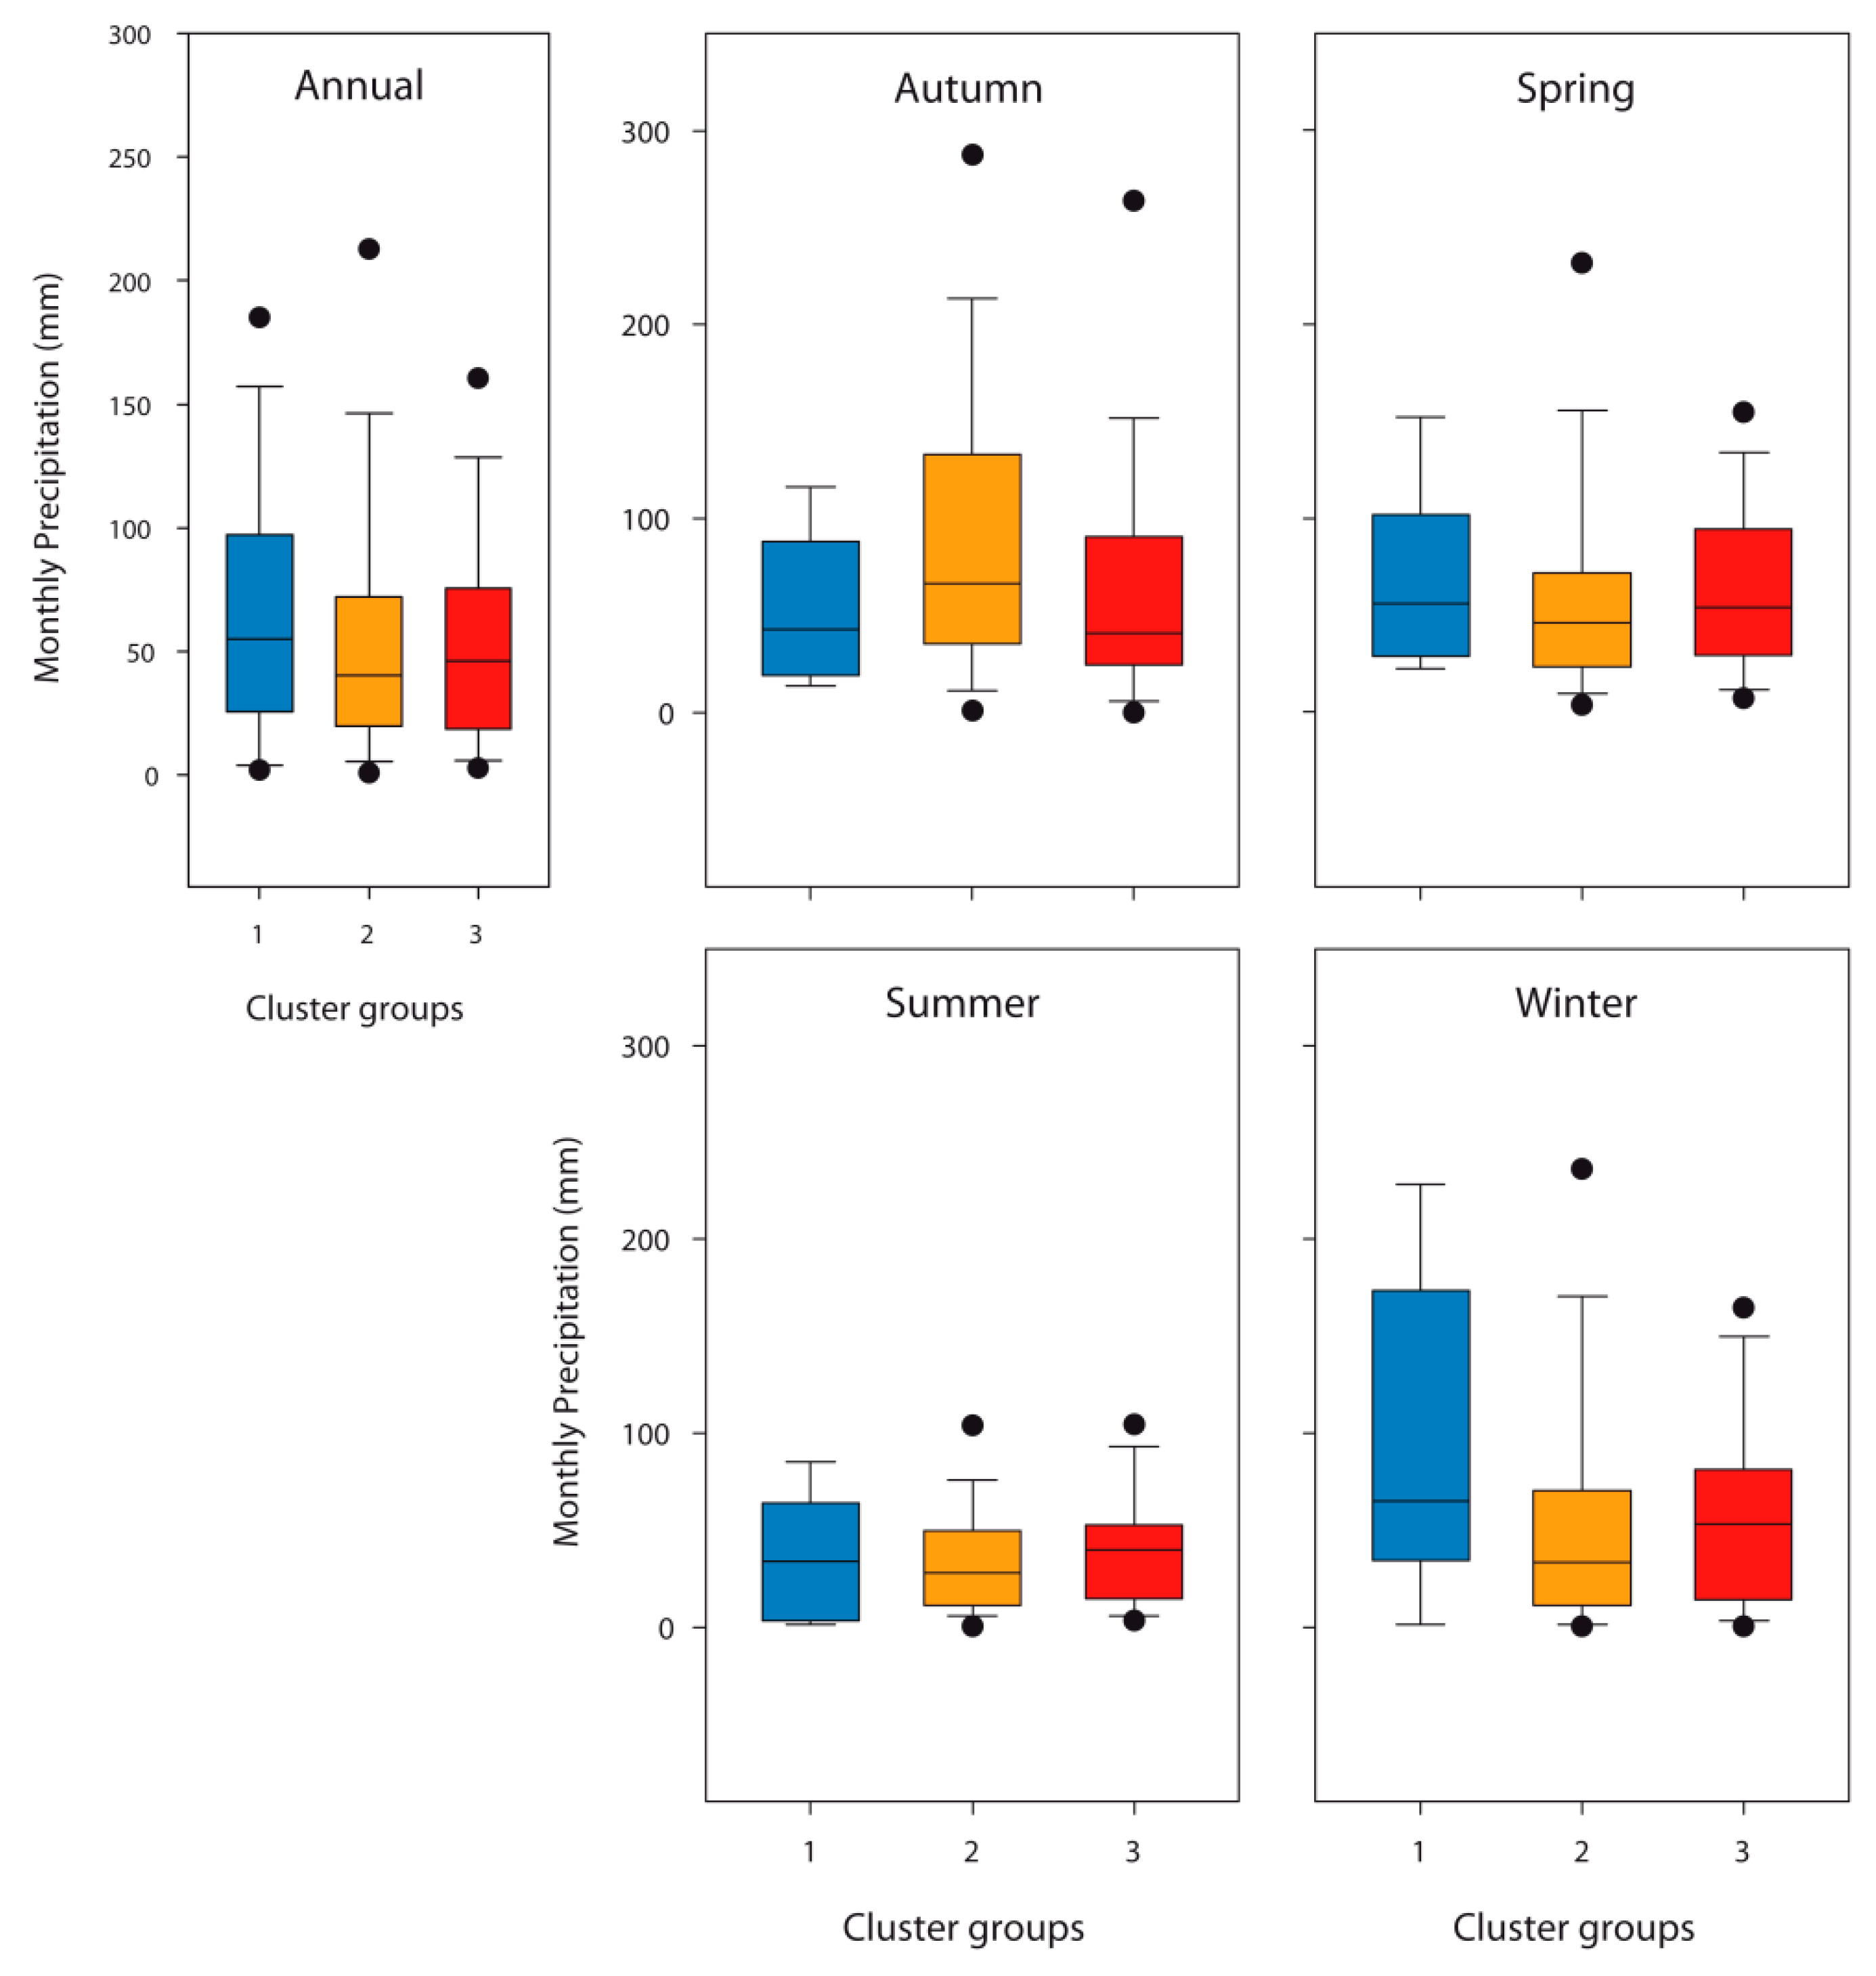
3.1. Observed Hydrological Evolution and Dam Management
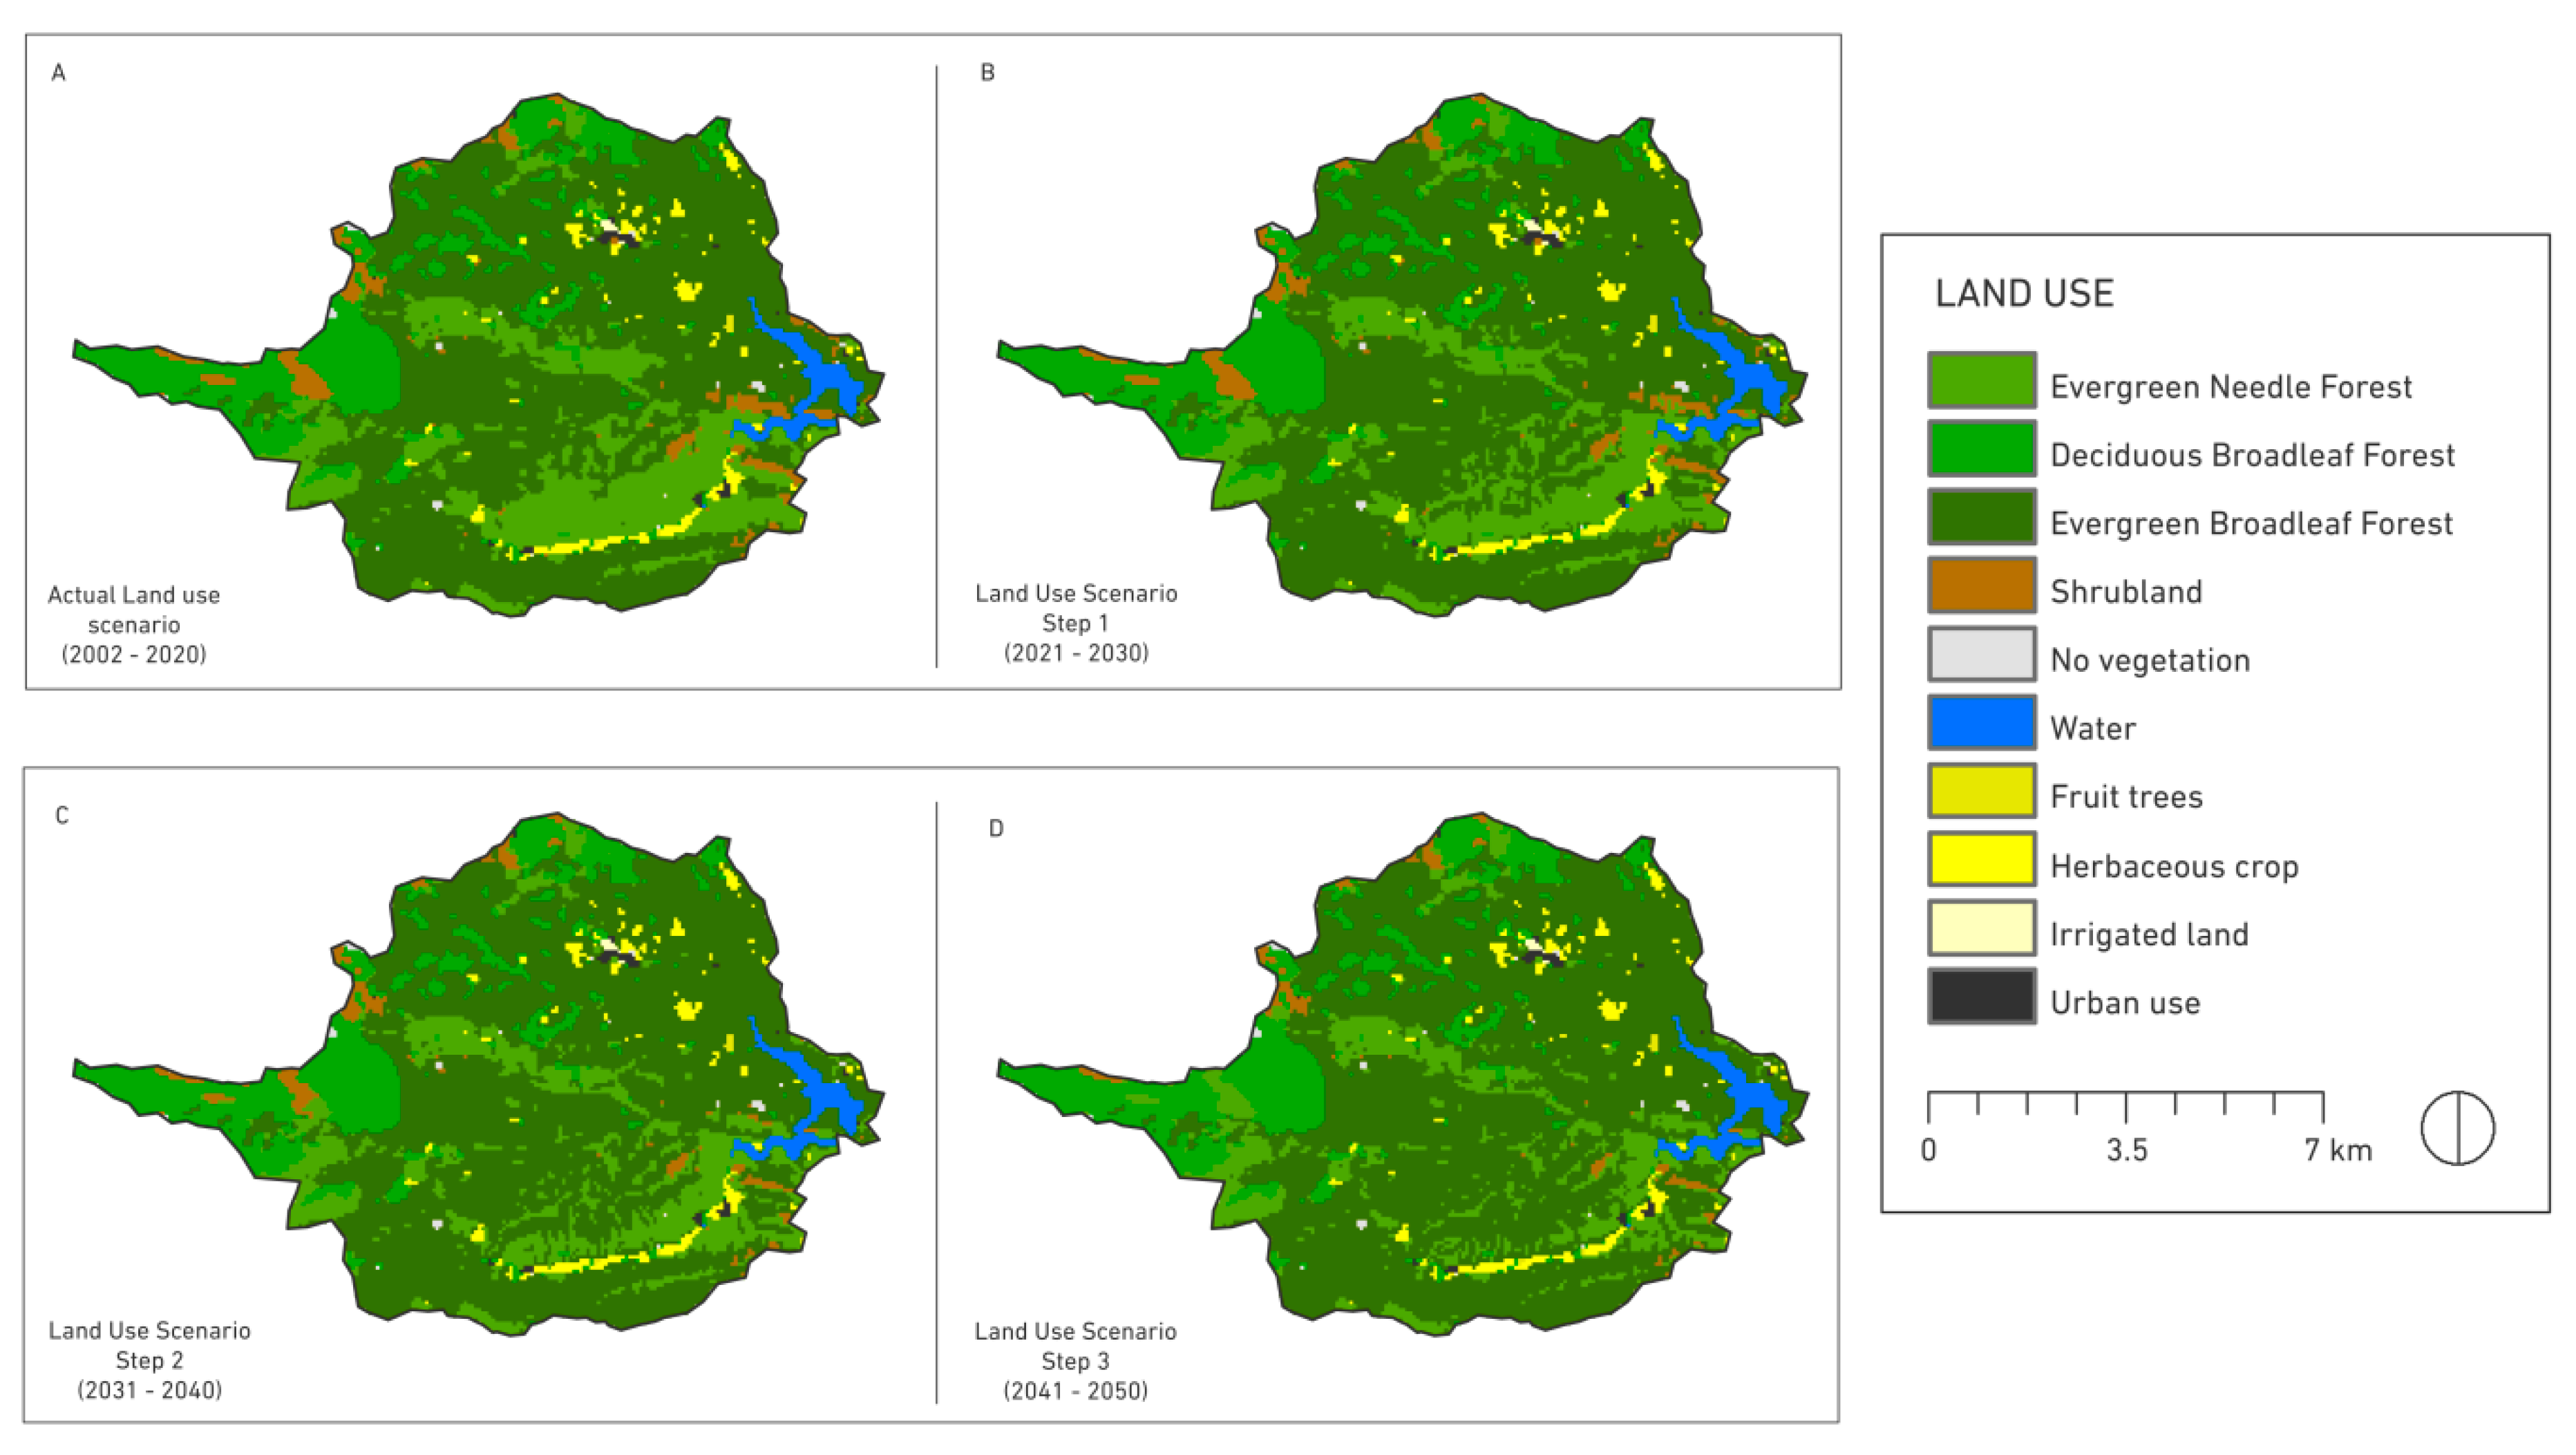
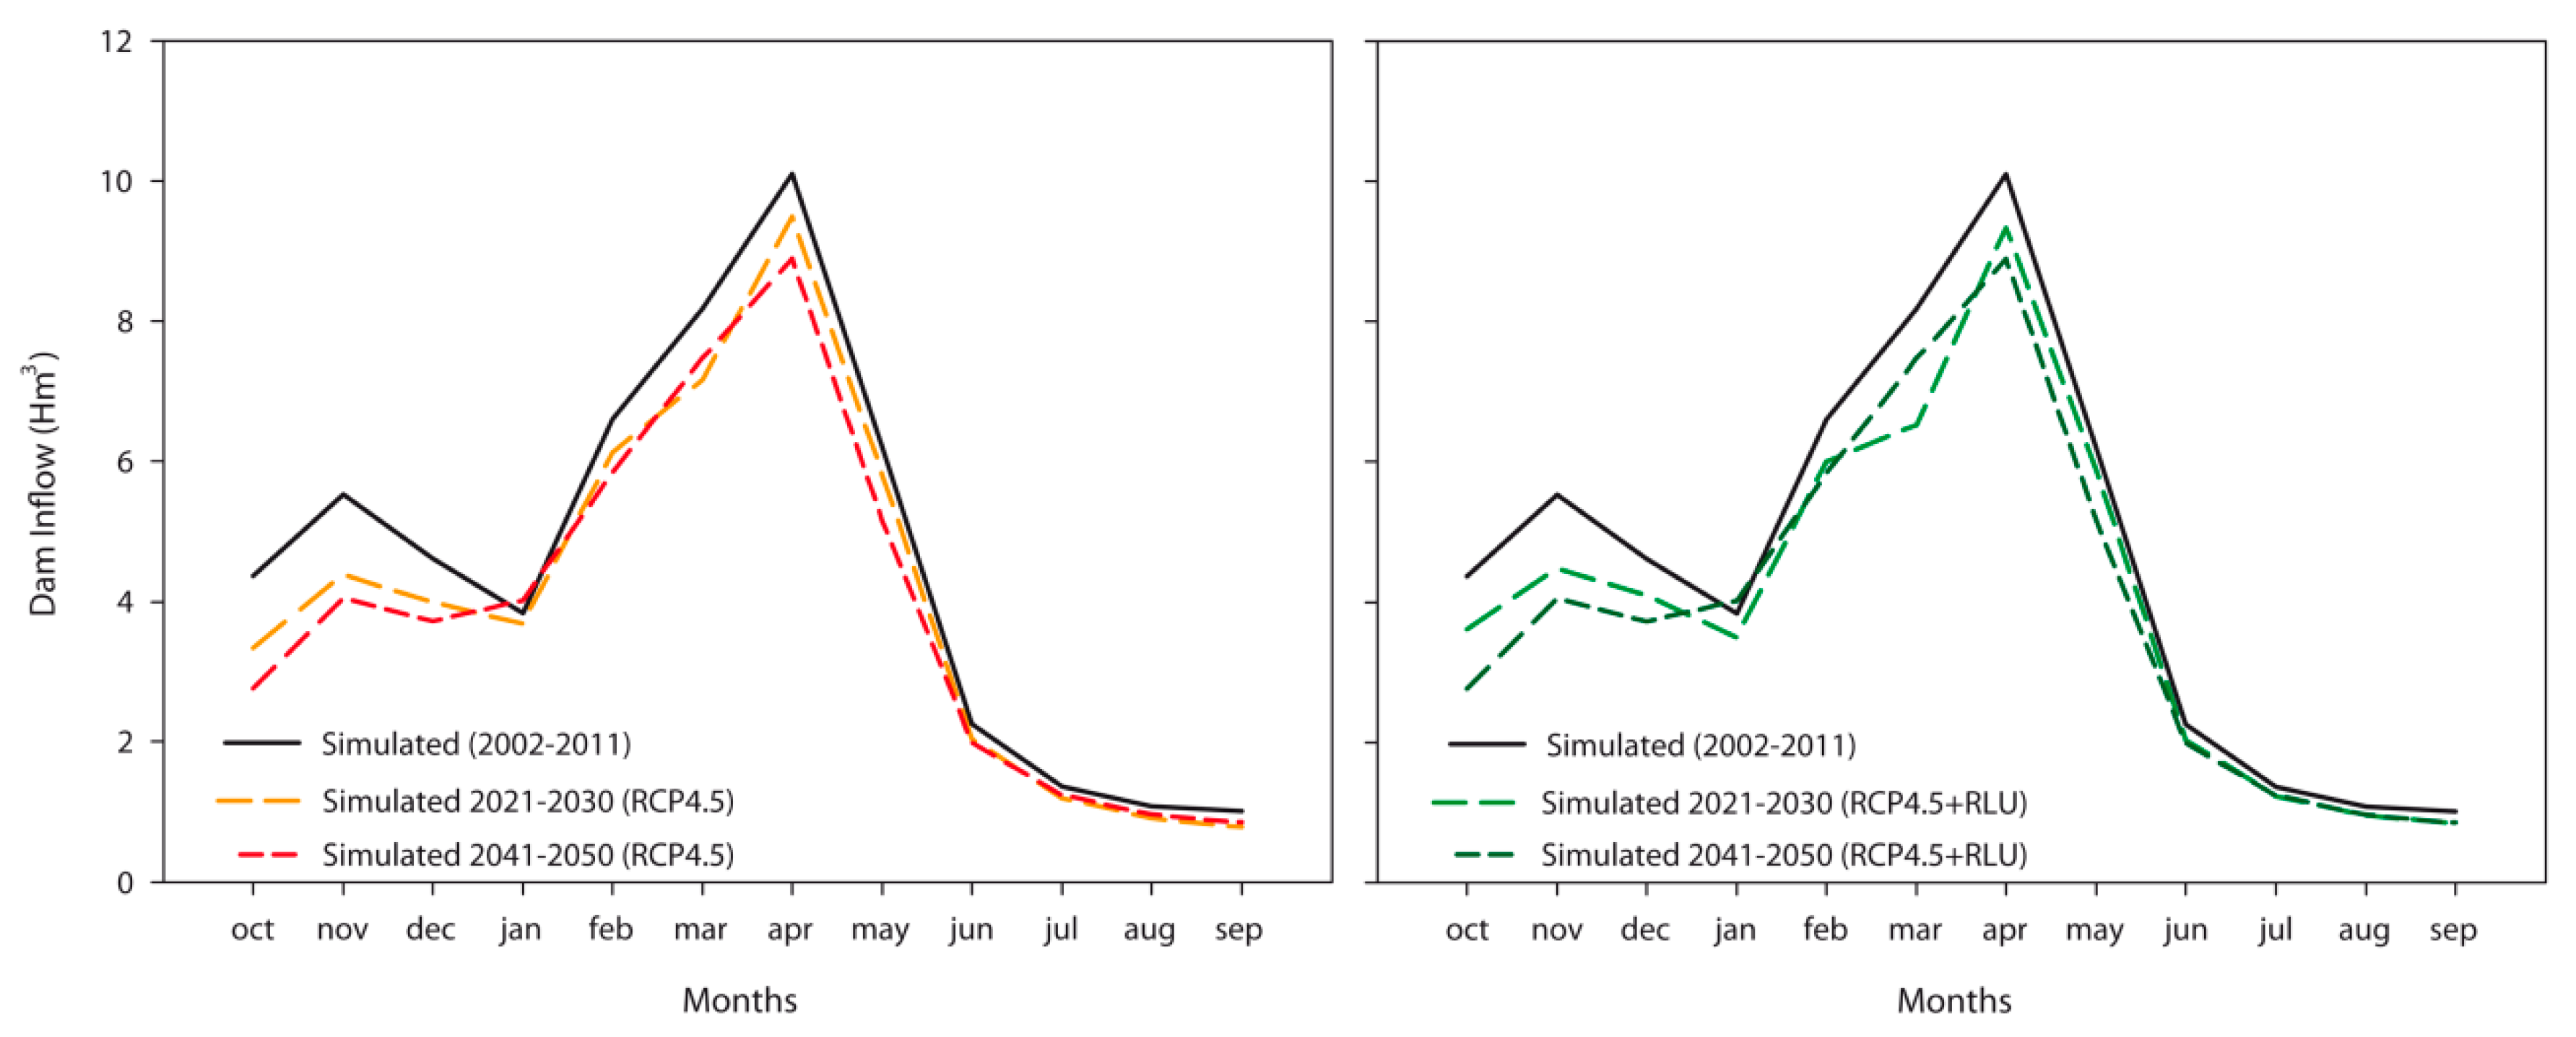
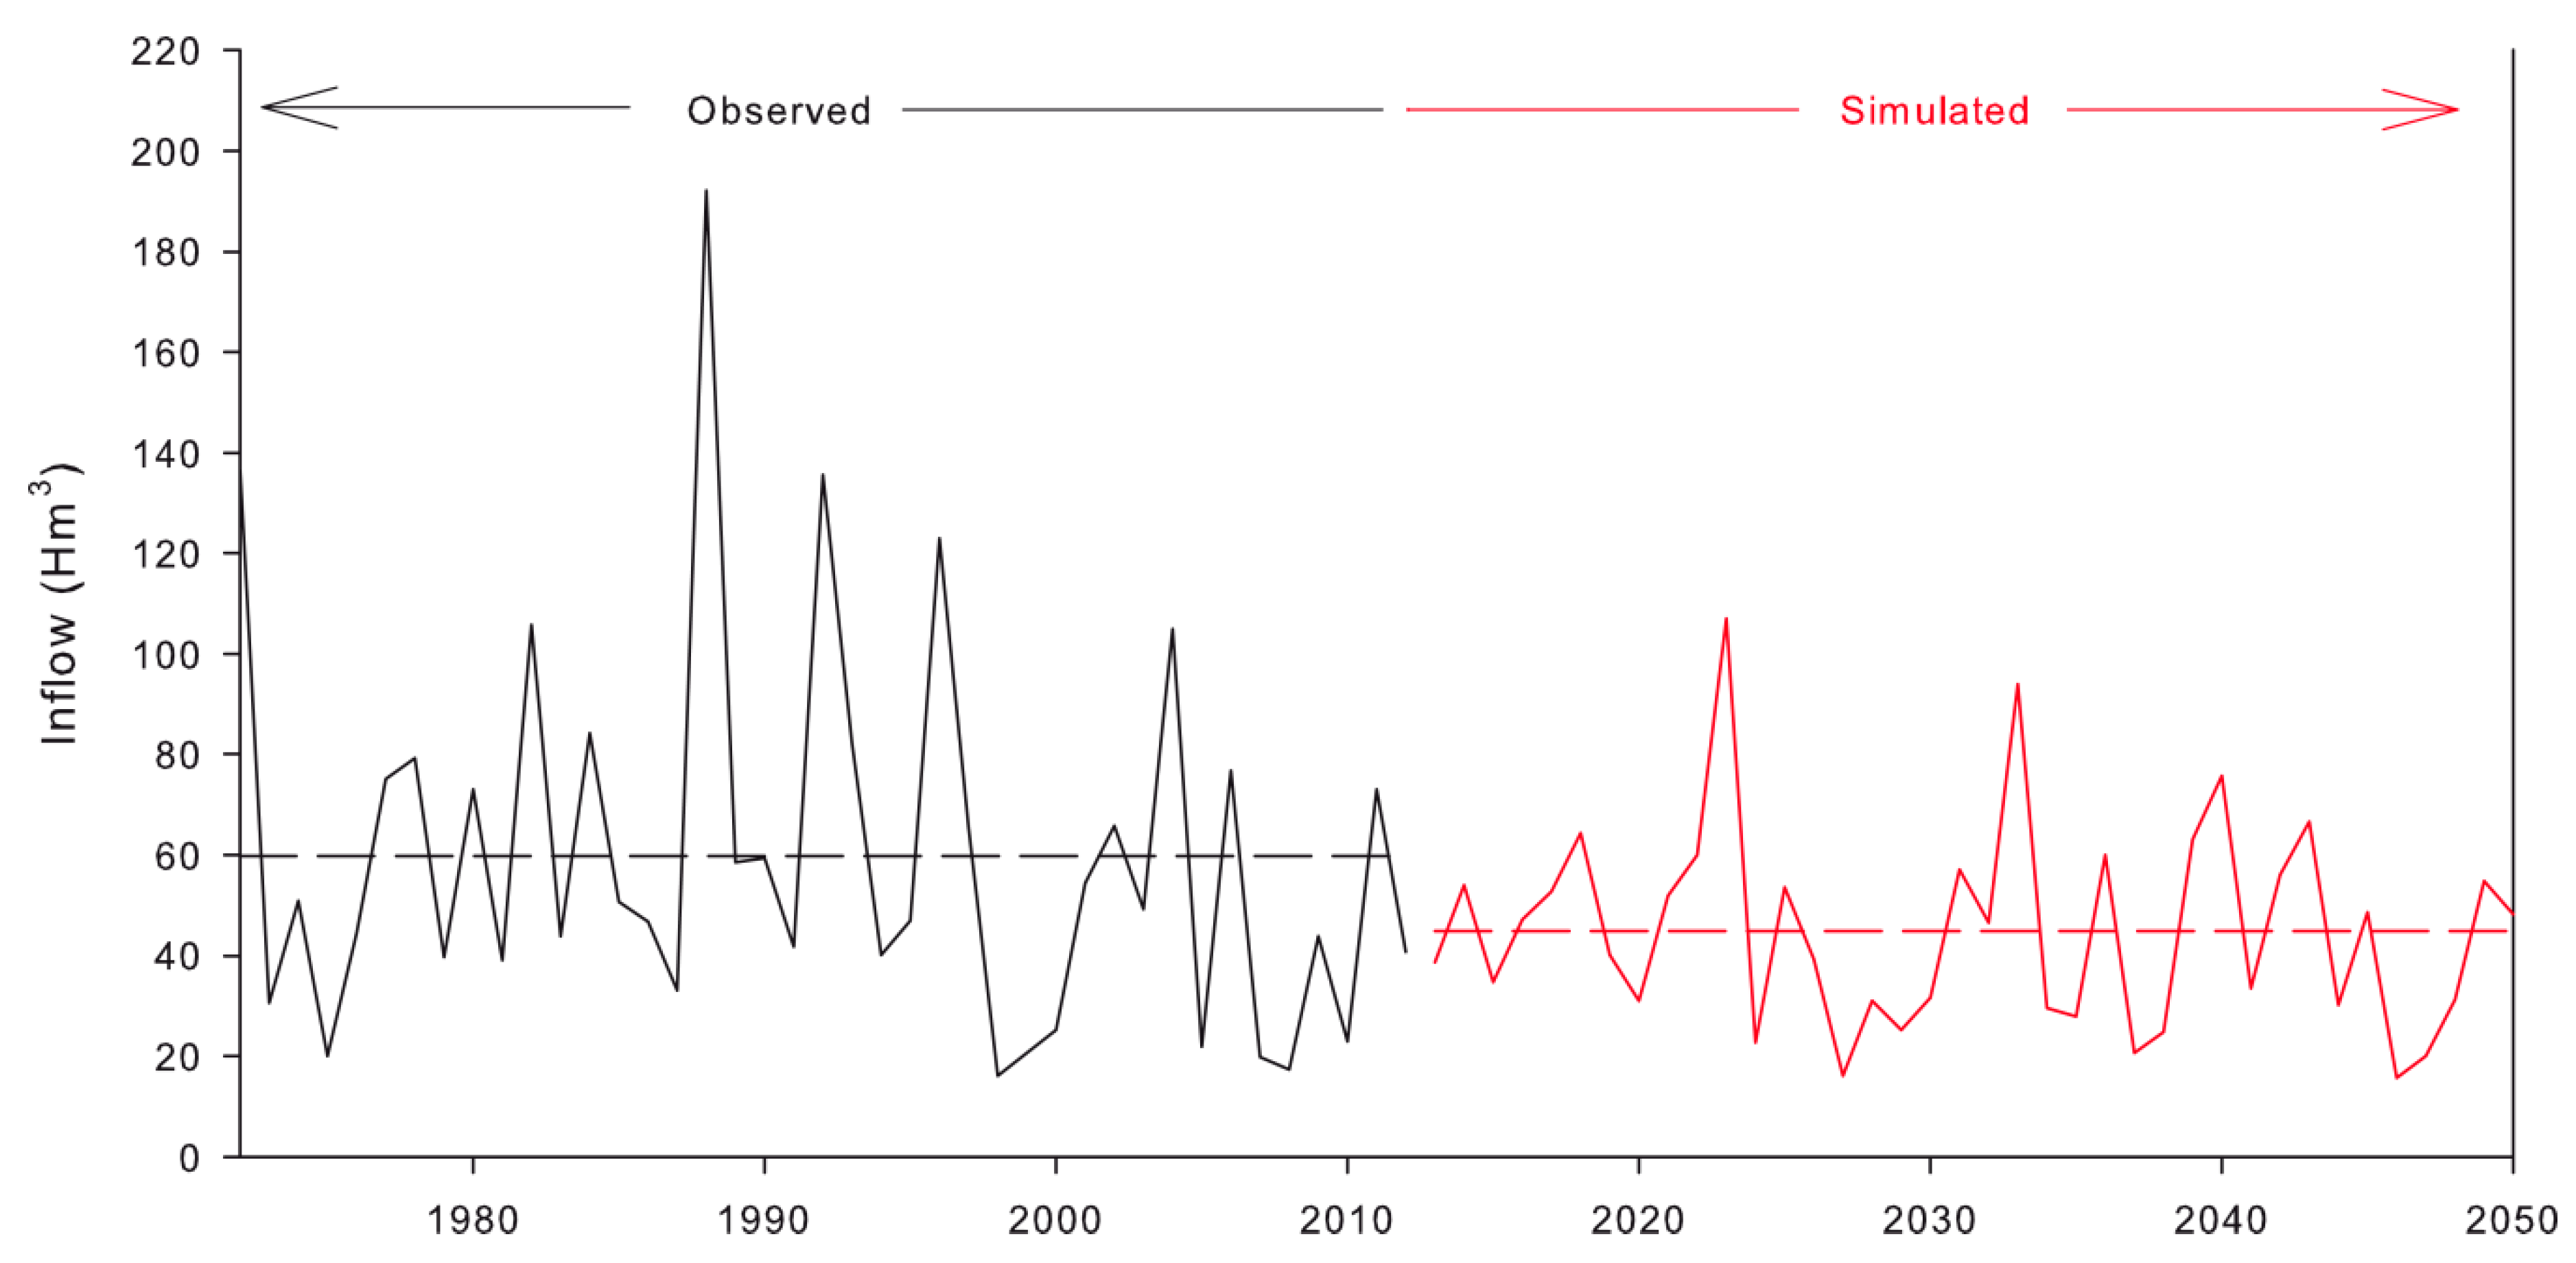
3.2. Simulation of Future Runoff and Implications for Water Management
4. Discussion
5. Conclusions
- The use of a hydro-ecological model can properly reproduce the observed streamflow variability.
- The use of a hydro-ecological model to force simulations according to future climate change and land cover scenarios is a good tool in the decision-making process.
- The results show a decrease in flows when future climate and land-use scenarios are considered.
- Current water demand cannot be predictably guaranteed under climate change and land-use projections. The experiments carried out in relation to the reservoir management show that, if the decrease in runoff continues in the future, it would be necessary to review the policies for water management and use.
Author Contributions
Funding
Acknowledgments
Conflicts of Interest
References
- García-Ruiz, J.M.; López-Moreno, J.I.; Vicente-Serrano, S.M.; Lasanta–Martínez, T.; Beguería, S. Mediterranean water resources in a global change scenario. Earth Sci. Rev. 2011, 105, 121–139. [Google Scholar] [CrossRef] [Green Version]
- Union, P.O. of the E. Water Resources in Europe in the Context of Vulnerability: EEA 2012 State of Water Assessment. Available online: https://publications.europa.eu/en/publication-detail/-/publication/7350bcdf-4c66-4d0e-80e5-b14efe881707/language-en (accessed on 21 August 2018).
- Iglesias, A.; Garrote, L.; Diz, A.; Schlickenrieder, J.; Martin-Carrasco, F. Re-thinking water policy priorities in the Mediterranean region in view of climate change. Environ. Sci. Policy 2011, 14, 744–757. [Google Scholar] [CrossRef] [Green Version]
- Llamas, M.R.; Custodio, E.; de la Hera, A.; Fornés, J.M. Groundwater in Spain: Increasing role, evolution, present and future. Environ. Earth Sci. 2015, 73, 2567–2578. [Google Scholar] [CrossRef]
- Wisser, D.; Frolking, S.; Douglas, E.M.; Fekete, B.M.; Vörösmarty, C.J.; Schumann, A.H. Global irrigation water demand: Variability and uncertainties arising from agricultural and climate data sets. Geophys. Res. Lett. 2008, 35. [Google Scholar] [CrossRef] [Green Version]
- Morote, Á.-F.; Hernández, M.; Rico, A.-M. Causes of domestic water consumption trends in the city of Alicante: Exploring the links between the housing bubble, the types of housing and the socio-economic factors. Water 2016, 8, 374. [Google Scholar] [CrossRef]
- Rico-Amoros, A.M.; Olcina-Cantos, J.; Saurí, D. Tourist land use patterns and water demand: Evidence from the Western Mediterranean. Land Use Policy 2009, 26, 493–501. [Google Scholar] [CrossRef]
- Viviroli, D.; Weingartner, R.; Messerli, B. Assessing the Hydrological Significance of the World’s Mountains. Mt. Res. Dev. 2003, 23, 32–40. [Google Scholar] [CrossRef]
- Viviroli, D.; Archer, D.R.; Buytaert, W.; Fowler, H.J.; Greenwood, G.B.; Hamlet, A.F.; Huang, Y.; Koboltschnig, G.; Litaor, M.I.; López-Moreno, J.I.; et al. Climate change and mountain water resources: Overview and recommendations for research, management and policy. Hydrol. Earth Syst. Sci. 2011, 15, 471–504. [Google Scholar] [CrossRef] [Green Version]
- García-Ruiz, J.M.; López-Moreno, J.I.; Lasanta Martínez, T.; Vicente Serrano, S.M.; González-Sampériz, P.; Valero-Garcés, B.L.; Sanjuán, Y.; Beguería, S.; Nadal-Romero, E.; Lana-Renault, N.; et al. Los efectos geoecológicos del cambio global en el Pirineo Central español: Una revisión a distintas escalas espaciales y temporales. Pirineos 2015, 170. [Google Scholar] [CrossRef]
- García-Ruiz, J.M.; Lana-Renault, N. Hydrological and erosive consequences of farmland abandonment in Europe, with special reference to the Mediterranean region—A review. Agric. Ecosyst. Environ. 2011, 140, 317–338. [Google Scholar] [CrossRef]
- Martínez, T.L. El Paisaje de Campos Abandonados en Cameros Viejo: (Sistema Ibérico, La Rioja); Instituto de Estudios Riojanos: Logroño, España, 2014; ISBN 84-9960-071-9. [Google Scholar]
- Lasanta-Martínez, T.; Vicente-Serrano, S.M.; Cuadrat-Prats, J.M. Mountain Mediterranean landscape evolution caused by the abandonment of traditional primary activities: A study of the Spanish Central Pyrenees. Appl. Geogr. 2005, 25, 47–65. [Google Scholar] [CrossRef]
- Davie, J.C.S.; Falloon, P.D.; Kahana, R.; Dankers, R.; Betts, R.; Portmann, F.T.; Wisser, D.; Clark, D.B.; Ito, A.; Masaki, Y.; et al. Comparing projections of future changes in runoff from hydrological and biome models in ISI-MIP. Earth Syst. Dynam. 2013, 4, 359–374. [Google Scholar] [CrossRef] [Green Version]
- Betts, R.A.; Alfieri, L.; Bradshaw, C.; Caesar, J.; Feyen, L.; Friedlingstein, P.; Gohar, L.; Koutroulis, A.; Lewis, K.; Morfopoulos, C.; et al. Changes in climate extremes, fresh water availability and vulnerability to food insecurity projected at 1.5 °C and 2 °C global warming with a higher-resolution global climate model. Phil. Trans. R. Soc. A 2018, 376, 20160452. [Google Scholar] [CrossRef] [PubMed]
- López-Moreno, J.I.; Beniston, M.; García-Ruiz, J.M. Environmental change and water management in the Pyrenees: Facts and future perspectives for Mediterranean mountains. Glob. Planet. Chang. 2008, 61, 300–312. [Google Scholar] [CrossRef] [Green Version]
- Polade, S.D.; Gershunov, A.; Cayan, D.R.; Dettinger, M.D.; Pierce, D.W. Precipitation in a warming world: Assessing projected hydro-climate changes in California and other Mediterranean climate regions. Sci. Rep. 2017, 7, 10783. [Google Scholar] [CrossRef] [PubMed]
- Eliades, M.; Bruggeman, A.; Lubczynski, M.W.; Christou, A.; Camera, C.; Djuma, H. The water balance components of Mediterranean pine trees on a steep mountain slope during two hydrologically contrasting years. J. Hydrol. 2018, 562, 712–724. [Google Scholar] [CrossRef]
- Wang, K.; Liang, S. Global atmospheric downward longwave radiation over land surface under all-sky conditions from 1973 to 2008. J. Geophys. Res. 2009, 114. [Google Scholar] [CrossRef] [Green Version]
- Vicente-Serrano, S.M.; Zabalza-Martínez, J.; Borràs, G.; López-Moreno, J.I.; Pla, E.; Pascual, D.; Savé, R.; Biel, C.; Funes, I.; Azorin-Molina, C.; et al. Extreme hydrological events and the influence of reservoirs in a highly regulated river basin of northeastern Spain. J. Hydrol. Reg. Stud. 2017, 12, 13–32. [Google Scholar] [CrossRef]
- Morán-Tejeda, E.; Lorenzo-Lacruz, J.; López-Moreno, J.I.; Rahman, K.; Beniston, M. Streamflow timing of mountain rivers in Spain: Recent changes and future projections. J. Hydrol. 2014. [Google Scholar] [CrossRef]
- Koutroulis, A.G.; Grillakis, M.G.; Daliakopoulos, I.N.; Tsanis, I.K.; Jacob, D. Cross sectoral impacts on water availability at +2 °C and +3 °C for east Mediterranean island states: The case of Crete. J. Hydrol. 2016, 532, 16–28. [Google Scholar] [CrossRef] [Green Version]
- Harrison, P.A.; Holman, I.P.; Cojocaru, G.; Kok, K.; Kontogianni, A.; Metzger, M.J.; Gramberger, M. Combining qualitative and quantitative understanding for exploring cross-sectoral climate change impacts, adaptation and vulnerability in Europe. Reg. Environ. Chang. 2013, 13, 761–780. [Google Scholar] [CrossRef] [Green Version]
- Hanasaki, N.; Fujimori, S.; Yamamoto, T.; Yoshikawa, S.; Masaki, Y.; Hijioka, Y.; Kainuma, M.; Kanamori, Y.; Masui, T.; Takahashi, K.; et al. A global water scarcity assessment under Shared Socio-economic Pathways & ndash; Part 1: Water use. Hydrol. Earth Syst. Sci. 2013, 17, 2375–2391. [Google Scholar] [CrossRef]
- Villar-Navascués, R.A.; Pérez-Morales, A. Factors Affecting Domestic Water Consumption on the Spanish Mediterranean Coastline. Prof. Geogr. 2018, 70, 513–525. [Google Scholar] [CrossRef]
- Grillakis, M.G.; Koutroulis, A.G.; Seiradakis, K.D.; Tsanis, I.K. Implications of 2 °C global warming in European summer tourism. Clim. Serv. 2016, 1, 30–38. [Google Scholar] [CrossRef]
- Koutroulis, A.G.; Papadimitriou, L.V.; Grillakis, M.G.; Tsanis, I.K.; Wyser, K.; Betts, R.A. Freshwater vulnerability under high end climate change. A pan-European assessment. Sci. Total Environ. 2018, 613–614, 271–286. [Google Scholar] [CrossRef] [PubMed]
- Ministerio de Obras Públicas (MOPU). Inventario de Presas Españolas 1986; Dirección General de Obras Hidráulicas, Centro de Publicaciones, Secretaría General Técnica, Ministerio de Obras Públicas y Urbanismo: Madrid, Spain, 1988; p. 95. [Google Scholar]
- Santos, A.O. De aguas, tierras y políticas hidráulicas en la España contemporánea. Vínculos Historia 2012, 1, 73–94. [Google Scholar]
- Desarrollo, Situación Actual y Perspectivas de Futuro de Las Presas en España. Available online: https://www.miteco.gob.es/gl/agua/temas/seguridad-de-presas-y-embalses/desarrollo/default.aspx (accessed on 1 October 2018).
- Batalla, R.J.; Gómez, C.M.; Kondolf, G.M. Reservoir-induced hydrological changes in the Ebro River basin (NE Spain). J. Hydrol. 2004, 290, 117–136. [Google Scholar] [CrossRef]
- Bayés Bruñol, C.; Ribas Palom, A.; Saurí Pujol, D. Sequías y prensa regional en la cuenca del río Muga (Girona). Geographicalia 2016, 123. [Google Scholar] [CrossRef] [Green Version]
- Williams, G.P.; Wolman, M.G. Downstream Effects of Dams on Alluvial Rivers; United States Government Printing Office: Washington, DC, USA, 1984. [Google Scholar]
- Döll, P.; Fiedler, K.; Zhang, J. Global-scale analysis of river flow alterations due to water withdrawals and reservoirs. Hydrol. Earth Syst. Sci. 2009, 13, 2413–2432. [Google Scholar] [CrossRef] [Green Version]
- Aus der Beek, T.; Flörke, M.; Lapola, D.M.; Schaldach, R.; Voß, F.; Teichert, E. Modelling historical and current irrigation water demand on the continental scale: Europe. Adv. Geosci. 2010, 27, 79–85. [Google Scholar] [CrossRef] [Green Version]
- López-Moreno, J.I.; Zabalza, J.; Vicente-Serrano, S.M.; Revuelto, J.; Gilaberte, M.; Azorin-Molina, C.; Morán-Tejeda, E.; García-Ruiz, J.M.; Tague, C. Impact of climate and land use change on water availability and reservoir management: Scenarios in the Upper Aragón River, Spanish Pyrenees. Sci. Total Environ. 2014, 493, 1222–1231. [Google Scholar] [CrossRef] [PubMed] [Green Version]
- I Pujol, D.S.; Pujolar, M.V.; Palom, A.R. Gestión del agua y conflictividad social en la cuenca del río Muga (Alt Empordá). Geographicalia 2000, 59–76. [Google Scholar]
- Bernils, J.M. Los riegos del Ampurdán. Revista de Gerona 1963, 25, 12–27. [Google Scholar]
- Institut d’Estadística de Catalunya. Available online: https://www.idescat.cat/?lang=es (accessed on 1 July 2018).
- Martín-Vide, J. Tercer Informe Sobre el Canvi Climàtic a Catalunya; Institut d’Estudis Catalans i Generalitat de Catalunya: Barcelona, Spain, 2016; ISBN 978-84-393-9448-8. [Google Scholar]
- Vicente-Serrano, S.M.; Beguería, S.; López-Moreno, J.I.; García-Vera, M.A.; Stepanek, P. A complete daily precipitation database for northeast Spain: Reconstruction, quality control, and homogeneity. Int. J. Clim. 2010, 30, 1146–1163. [Google Scholar] [CrossRef] [Green Version]
- Mestre, O.; Domonkos, P.; Picard, F.; Auer, I.; Robin, S.; Lebarbier, E.; Böhm, R.; Aguilar, E.; Guijarro, J.A.; Vertacnik, G.; et al. HOMER: A homogenization software—Methods and applications. Idöjárás 2013, 117, 47–67. [Google Scholar]
- Caussinus, H.; Mestre, O. Detection and correction of artificial shifts in climate series. J. R. Stat. Soc. Ser. C (Appl. Stat.) 2004, 53, 405–425. [Google Scholar] [CrossRef]
- Vincent, L.A.; Zhang, X.; Bonsal, B.R.; Hogg, W.D. Homogenization of Daily Temperatures over Canada. J. Clim. 2002, 15, 1322–1334. [Google Scholar] [CrossRef]
- IPCC Fifth Assessment Synthesis Report. Available online: http://ar5-syr.ipcc.ch/ (accessed on 21 August 2018).
- López-Moreno, J.I.; Beguería, S.; García-Ruiz, J.M. The Management of a Large Mediterranean Reservoir: Storage Regimens of the Yesa Reservoir, Upper Aragon River Basin, Central Spanish Pyrenees. Environ. Manag. 2004, 34, 508–515. [Google Scholar] [CrossRef] [PubMed]
- Documento Técnico SIOSE 2015. Available online: http://www.siose.es/SIOSEtheme-theme/documentos/pdf/Doc_tec_SIOSE2011_v1.1.pdf (accessed on 1 October 2018).
- Bauló, U.; Miquel, J.; Rius, J.; Poch, R.M. Monitorización de los cambios de uso del suelo en la cabecera de cuenca de la Ribera Salada mediante fotografía aérea y SIG (El Solsonés, Lleida, España). Pirineos 1999, 153–154, 101–122. [Google Scholar]
- Gallart, F.; Llorens, P. Catchment management under environmental change: Impact of land cover change on water resources. Water Intern. 2003, 28, 334–340. [Google Scholar] [CrossRef]
- Poyatos, R.; Latron, J.; Llorens, P. Land use and land cover change after agricultural abandonment: The case of a Mediterranean mountain area (Catalan Pre-Pyrenees). Mt. Res. Dev. 2003, 23, 362–368. [Google Scholar] [CrossRef]
- Vicente-Serrano, S.M.; Lasanta, T.; Romo, A. Analysis of spatial and temporal evolution of vegetation cover in the Spanish Central Pyrenees: Role of human management. Environ. Manag. 2004, 34, 802–818. [Google Scholar] [CrossRef] [PubMed]
- Lasanta, T.; Nadal-Romero, E.; Errea, M.P. The footprint of marginal agriculture in the Mediterranean mountain landscape: An analysis of the Central Spanish Pyrenees. Sci. Total Environ. 2017, 599–600, 1823–1836. [Google Scholar] [CrossRef] [PubMed]
- Gracia, C.; Ibáñez, J.J.; Burriel, J.A.; Mata, T.; Vayreda, J. Inventari Ecològic i Forestal de Catalunya—IEFC. Available online: http://www.creaf.uab.es/iefc/ (accessed on 21 August 2018).
- Panos Paganos The European soil database. GEO Connexion 2006, 5, 32–33.
- Panagos, P.; Van Liedekerke, M.; Jones, A.; Montanarella, L. European Soil Data Centre: Response to European policy support and public data requirements. Land Use Policy 2012, 29, 329–338. [Google Scholar] [CrossRef]
- Soil Map (Muga Basin). Available online: http://medacc-life.eu/sites/medacc-life.eu/files/platform_data/suelos_muga.pdf (accessed on 1 July 2018).
- Tague, C.L.; Band, L.E. RHESSys: Regional Hydro-Ecologic Simulation System—An Object-Oriented Approach to Spatially Distributed Modeling of Carbon, Water, and Nutrient Cycling. Earth Interact. 2004, 8, 1–42. [Google Scholar] [CrossRef] [Green Version]
- Godsey, S.E.; Kirchner, J.W.; Tague, C.L. Effects of changes in winter snowpacks on summer low flows: Case studies in the Sierra Nevada, California, USA. Hydrol. Process. 2014, 28, 5048–5064. [Google Scholar] [CrossRef]
- Morán-Tejeda, E.; Zabalza, J.; Rahman, K.; Gago-Silva, A.; López-Moreno, J.I.; Vicente-Serrano, S.; Lehmann, A.; Tague, C.L.; Beniston, M. Hydrological impacts of climate and land-use changes in a mountain watershed: Uncertainty estimation based on model comparison. Ecohydrology 2015, 8, 1396–1416. [Google Scholar] [CrossRef]
- Vicente-Serrano, S.M.; Camarero, J.J.; Zabalza, J.; Sangüesa-Barreda, G.; López-Moreno, J.I.; Tague, C.L. Evapotranspiration deficit controls net primary production and growth of silver fir: Implications for Circum-Mediterranean forests under forecasted warmer and drier conditions. Agric. For. Meteorol. 2015, 206, 45–54. [Google Scholar] [CrossRef] [Green Version]
- Mohammed, I.N.; Tarboton, D.G. Simulated watershed responses to land cover changes using the Regional Hydro-Ecological Simulation System. Hydrol. Process. 2014, 28, 4511–4528. [Google Scholar] [CrossRef]
- Gupta, H.V.; Sorooshian, S.; Yapo, P.O. Toward improved calibration of hydrologic models: Multiple and noncommensurable measures of information. Water Resour. Res. 1998, 34, 751–763. [Google Scholar] [CrossRef] [Green Version]
- Yapo, P.O.; Gupta, H.V.; Sorooshian, S. Multi-objective global optimization for hydrologic models. J. Hydrol. 1998, 204, 83–97. [Google Scholar] [CrossRef]
- Moriasi, D.N.; Arnold, J.G.; van Liew, M.W.; Bingner, R.L.; Harmel, R.D.; Veith, T.L. Model Evaluation Guidelines for Systematic Quantification of Accuracy in Watershed Simulations. Trans. ASABE 2007, 50, 885–900. [Google Scholar] [CrossRef]
- Nash, J.E.; Sutcliffe, J.V. River flow forecasting through conceptual models part I—A discussion of principles. J. Hydrol. 1970, 10, 282–290. [Google Scholar] [CrossRef]
- Bague, G. La Generalitat Extiende Las Restricciones Por La Sequía a La Muga. El Pais 2005. Available online: https://elpais.com/diario/2005/08/17/catalunya/1124240838_850215.html (accessed on 1 July 2018).
- La Sequía se Ceba en el Alt Empordà. Available online: https://elpais.com/diario/2008/06/05/catalunya/1212628038_850215.html (accessed on 1 July 2018).
- Carles Bayés Bruñol Caracterització geogràfica de les sequeres a la conca del riu Muga (1950–2001). Treballs de la Societat Catalana de Geografìa 2005, 58, 7–33.
- David Pavón Gamero L’embassament de Boadella i els usos de l’aigua a la conca de la Muga: Quaranta anys d’història (1969–2009). Estudis d’Història Agrària 2012, 24, 269–291.
- La Sequía Obliga a 19 Municipios Catalanes a Abastecerse de Agua con Camiones Cisterna. Available online: https://www.abc.es/hemeroteca/historico-18-01-2007/abc/Sociedad/la-sequia-obliga-a-19-municipios-catalanes-a-abastecerse-de-agua-con-camiones-cisterna_163977104111.html (accessed on 1 July 2018).
- Els Pagesos Reclamen Solucions a Les Restriccions de Reg a La Conca de La Muga. Available online: https://www.naciodigital.cat/ecodiari/noticia/6199/pagesos/reclamen/solucions/restriccions/reg/conca/muga/&mobil=1 (accessed on 1 July 2018).
- Los Aiguamolls de l’Empordà Sufren La Peor Sequía del Siglo. Available online: https://elpais.com/ccaa/2018/02/03/catalunya/1517683767_589242.html (accessed on 1 July 2018).
- Vicente-Serrano, S.M.; Azorin-Molina, C.; Sanchez-Lorenzo, A.; Morán-Tejeda, E.; Lorenzo-Lacruz, J.; Revuelto, J.; López-Moreno, J.I.; Espejo, F. Temporal evolution of surface humidity in Spain: Recent trends and possible physical mechanisms. Clim. Dyn. 2014, 42, 2655–2674. [Google Scholar] [CrossRef]
- Marcos, R.; Llasat, M.C.; Quintana-Seguí, P.; Turco, M. Seasonal predictability of water resources in a Mediterranean freshwater reservoir and assessment of its utility for end-users. Sci. Total Environ. 2017, 575, 681–691. [Google Scholar] [CrossRef] [PubMed]
- Lorenzo-Lacruz, J.; Vicente-Serrano, S.M.; López-Moreno, J.I.; Morán-Tejeda, E.; Zabalza, J. Recent trends in Iberian streamflows (1945–2005). J. Hydrol. 2012, 414–415, 463–475. [Google Scholar] [CrossRef]


| October | November | December | January | February | March | April | May | June | July | August | September |
|---|---|---|---|---|---|---|---|---|---|---|---|
| 1.43 | 1.19 | 1.16 | 1.08 | 0.91 | 1.17 | 1.15 | 2.12 | 5.86 | 8.41 | 6.30 | 2.06 |
| R.L.U. 2021–2030 | R.L.U. 2031–2040 | R.L.U. 2041–2050 | |||||
|---|---|---|---|---|---|---|---|
| Land-Use | A.L.U. (km2) | Area (km2) | Change (%) | Area (km2) | Change (%) | Area (km2) | Change (%) |
| Urban use | 0.8 | 0.8 | 0 | 0.8 | 0 | 0.8 | 0 |
| Cropland | 4.2 | 4.2 | 0 | 4.2 | 0 | 4.2 | 0 |
| ENF | 36.2 | 32 | −2.3 | 29.3 | −3.8 | 25.5 | −5.8 |
| BDF | 25.5 | 25.5 | 0 | 25.5 | 0 | 25.5 | 0 |
| EDF | 107.2 | 111.8 | 2.5 | 116.2 | 4.9 | 121.3 | 7.6 |
| Shrubland | 5.8 | 5.5 | −0.2 | 3.8 | −1.1 | 2.5 | −1.8 |
| Water | 3.4 | 3.4 | 0 | 3.4 | 0 | 3.4 | 0 |
| No vegetation | 0.5 | 0.5 | 0 | 0.5 | 0 | 0.5 | 0 |
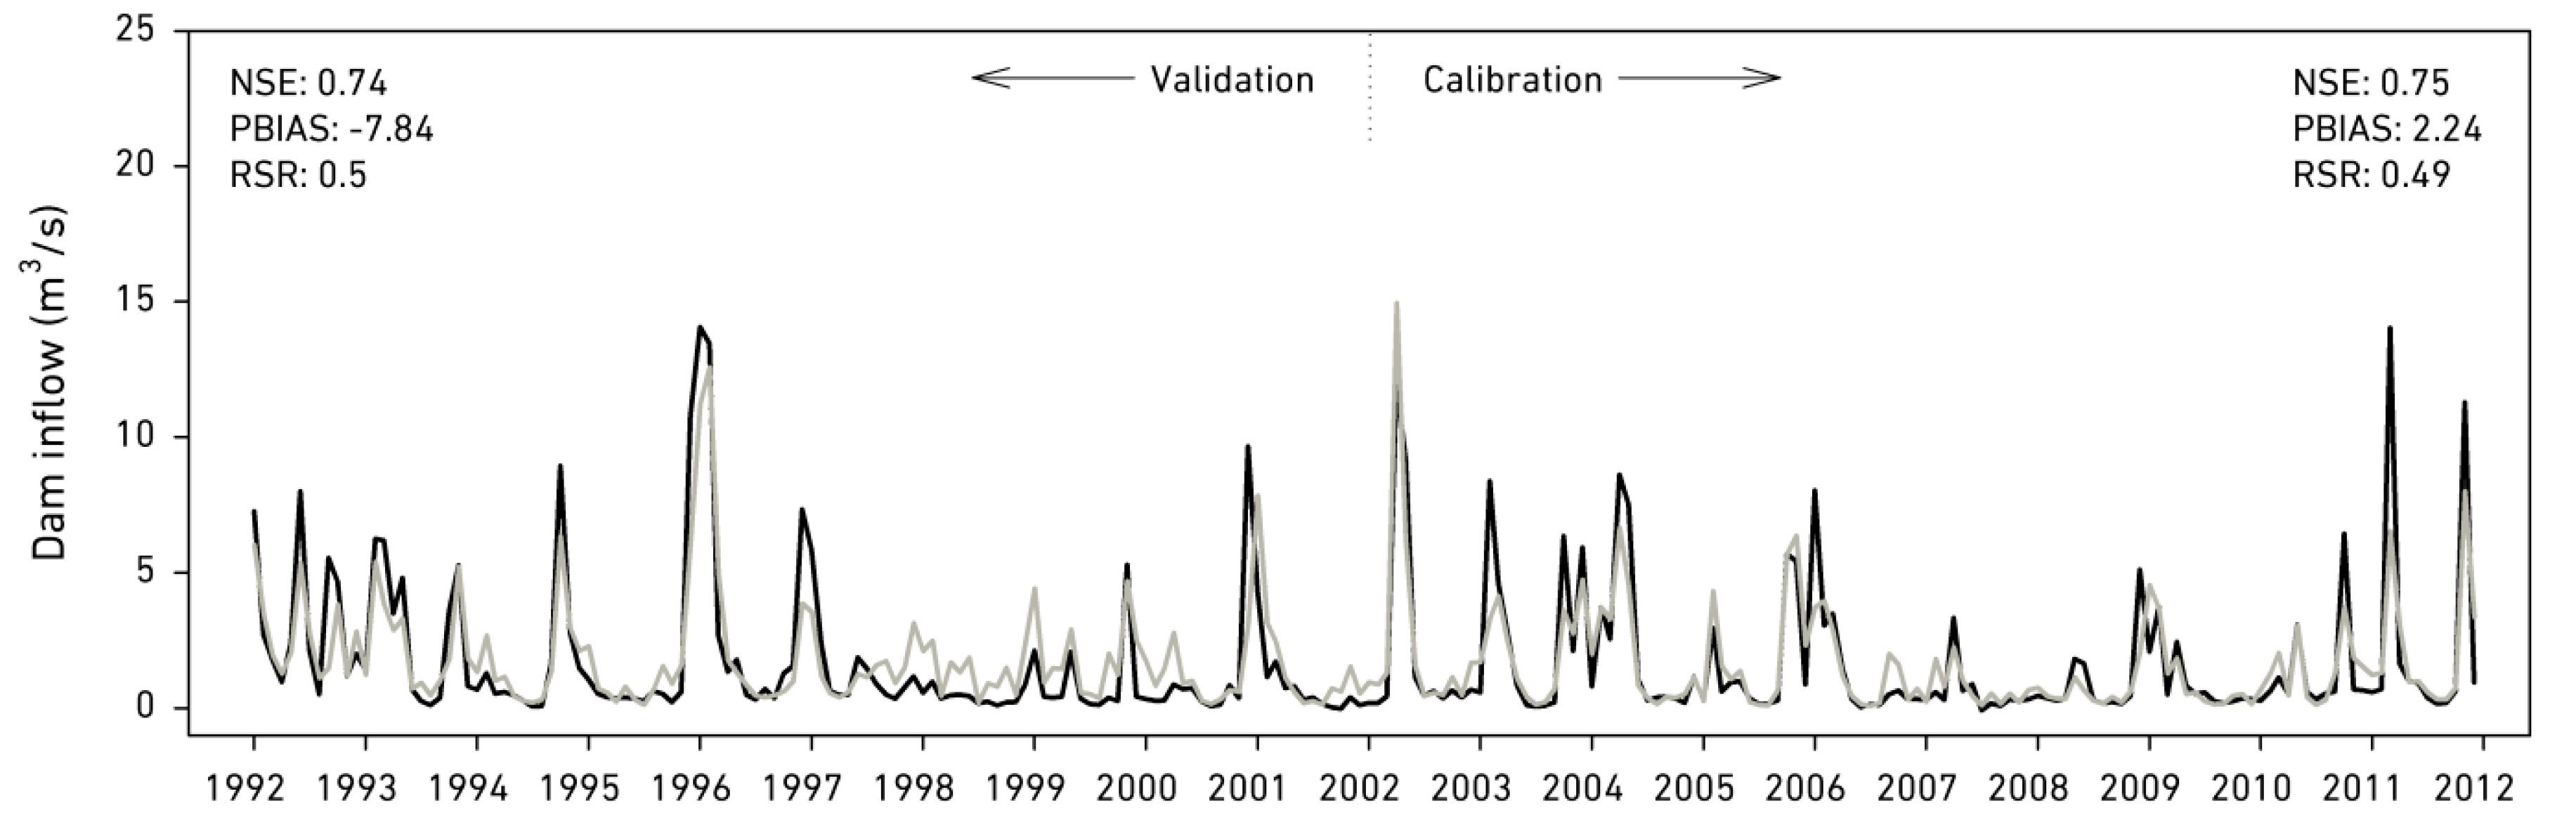
| NSE | PBIAS | RSR | |
|---|---|---|---|
| Simulation period (2002–2011) | 0.75 | 2.25 | 0.49 |
| Validation period (1992–2001) | 0.74 | −7.84 | 0.5 |
| Time Period | Winter | Spring | Summer | Autumn | Annual |
|---|---|---|---|---|---|
| 1943–2011 * | −50% | −60% | +50% | −96.7% | −46.7% |
| 1971–2011 ** | −30.8% | −33.3% | −66.7% | −13.8% | −34.7% |
| 2021–2050 (RCP4.5) | −41.1% | −5.8% | −10.9% | −62.9% | −28% |
| 2021–2050 (RCP4.5 + RLU) | −42.1% | −4.5% | −13.0% | −63.0% | −31.1% |
© 2018 by the authors. Licensee MDPI, Basel, Switzerland. This article is an open access article distributed under the terms and conditions of the Creative Commons Attribution (CC BY) license (http://creativecommons.org/licenses/by/4.0/).
Share and Cite
Zabalza-Martínez, J.; Vicente-Serrano, S.M.; López-Moreno, J.I.; Borràs Calvo, G.; Savé, R.; Pascual, D.; Pla, E.; Morán-Tejeda, E.; Domínguez-Castro, F.; Tague, C.L. The Influence of Climate and Land-Cover Scenarios on Dam Management Strategies in a High Water Pressure Catchment in Northeast Spain. Water 2018, 10, 1668. https://doi.org/10.3390/w10111668
Zabalza-Martínez J, Vicente-Serrano SM, López-Moreno JI, Borràs Calvo G, Savé R, Pascual D, Pla E, Morán-Tejeda E, Domínguez-Castro F, Tague CL. The Influence of Climate and Land-Cover Scenarios on Dam Management Strategies in a High Water Pressure Catchment in Northeast Spain. Water. 2018; 10(11):1668. https://doi.org/10.3390/w10111668
Chicago/Turabian StyleZabalza-Martínez, J., S. M. Vicente-Serrano, J. I. López-Moreno, G. Borràs Calvo, R. Savé, D. Pascual, E. Pla, E. Morán-Tejeda, F. Domínguez-Castro, and C. L. Tague. 2018. "The Influence of Climate and Land-Cover Scenarios on Dam Management Strategies in a High Water Pressure Catchment in Northeast Spain" Water 10, no. 11: 1668. https://doi.org/10.3390/w10111668