Article

Impoundment Impact of the Three Gorge Reservoir on the Hydrological Regime in the Lower Han River, China

1
College of Resources and Environmental Science, South-Central University for Nationalities, Wuhan 430074, China
2
Department of Civil & Environmental Engineering, University of Alberta, Edmonton, AB T6G 2W2, Canada
3
State Key Laboratory of Hydrology-Water Resources and Hydraulic Engineering, Hohai University, Nanjing 210098, China
4
College of Hydropower & Information Engineering, Huazhong University of Science & Technology, Wuhan 430074, China
5
China Institute of Water Resources and Hydropower Research, Beijing 100038, China
6
Department of Water Resources, Bureau of Hydrology, Changjiang Water Resources Commission, Wuhan 430010, China
*
Author to whom correspondence should be addressed.
Water 2018, 10(11), 1670; https://doi.org/10.3390/w10111670
Submission received: 18 September 2018 / Revised: 12 November 2018 / Accepted: 13 November 2018 / Published: 16 November 2018
(This article belongs to the Section Hydrology)

Abstract

:
Reservoir regulation has been playing an increasingly important role in water resources development and its influence on the hydrological processes of downstream tributaries has attracted much attention. The lower Han River is selected as a case study to examine the hydrological and hydraulic influence of the upstream flow regulation of the Three Gorges Reservoir (TGR) in the middle Yangtze River, China. Based on a hydrodynamic model and the observed data, the hydrological processes in the lower Han River were simulated and their changes were analyzed under the impoundment influences of the TGR. The results indicated that there were obviously hydrological changes in the lower Han River after the TGR operation. The decreased stage downstream the TGR during the impounding periods of the TGR resulted in an increase in the stage difference, current speed, hydraulic gradient and the discharge ratio. In addition, the stage difference between the two rivers was decreased during the periods of water compensation from the TGR, which led to the outflow congestion in the lower Han River. The hydrological changes in the lower Han River were the response to the flow regulation of the TGR and the inflow of the two rivers. The variation in the rating curve in the lower Han River mainly resulted from the stage difference between the two rivers during the dispatching periods of the TGR. These results help to explain the hydrological variability under the impounding influence of the TGR for the lower Han River and they can be extended to other river tributaries downstream to the reservoirs.

1. Introduction

Dam construction around the world has been playing an increasingly important role in water resources development, electricity generation and flood control [1]. However, large-scale and dramatic hydrological changes usually occur from upper to lower river basins, which result in significant changes in hydrological processes and hydraulic regime in the adjoining tributaries [2]. Tributaries widely exist in the natural watershed and the lower tributaries are usually affected by the backwater level changes in the confluent area of rivers [3]. The hydrodynamic balance is disturbed in the lower tributaries, which does a great harm to the flood control and waterway maintenance [4,5]. Therefore, researching on hydrodynamic characteristics in the lower tributaries is of significance for river health [6].
During the past several decades, an increasing number of scholars began to pay attention to the response of water flow to the reservoir impoundment in the tributary sub-basins. Taylor [7] firstly carried out an experimental study on the water movement in a rectangular open confluence channel and he considered that the lateral flow separation in the confluent area played an important role in the fluvial process. Given the impact of the resistance existence, Webber and Greated [8] proposed a two-dimensional generalized model of confluent area by conformal transformation and they determined the stagnation point and separation point in the upstream and downstream respectively. Mosley [9] investigated the water and sediment transport in the Y-shaped river channels by field river model experiments. The results indicated that the conjunction angle and velocity ratio of tributaries and mainstream played a highly important role in the development of flow structure and channel topography. Modi et al. [10] analyzed the flow structure of confluent area and its influence on the tributary channels by the method of losses of frictional force. Best [11,12] had a study on the deposited sediment transport in the confluent area and put forward the avalanche faces, deep central scour and the bar within the separation zone as the three independent factors that changed with the development of discharge ratio (tributary discharge to total discharge) and influence angle.
Moreover, Brion [13] and Bradbrook et al. [14] found that the difference of elevation between tributaries and mainstream has an obvious effect on the flow structure and mixing process in the lower tributaries. In addition, Hsu et al. [15] studied the changes of momentum and energy in the terminal of flow separation area by analyzing the changes of talweg in the upstream and downstream of the confluent area. Furthermore, in order to research the hydrodynamic characteristics of tributary channels, the three-dimensional mathematical model was also widely used to explain some natural phenomena occurred around river junctions [16,17]. Recently, Guillen et al. [18] examined the fluvial process in the river confluence at a low discharge ratio, finding that the variation in sediment transport could lead to some particular hydrodynamic regimes in the tributaries, such as a supercritical flow regime.
It is well known that there are many driving factors influencing the hydrological process in different ways and with different time scales [19]. How to describe the hydrological changes under the different conditions of upstream flow regulation is still in dispute [20]. Therefore, it is necessary to find a proper way to quantitatively show the changes in the hydrological processes and its hysteresis characteristics in the tributary reaches under the influences of flow regulation in the mainstream. In this paper, the hydrological changes and hydraulic regime in the lower Han River, as the study case of tributary river system, were investigated under the mainstream influences of flow regulation of the Three Gorges Reservoir (TGR). Based on a hydrodynamic model of the study area, the hydrological and hydraulic characteristics of water level, streamflow, discharge ratio and hydraulic gradients at the different gauging stations were studied in the lower Han River. The hydrological changes and hydrodynamic variation in the lower Han River were examined by comparing the hydrological processes with and without the TGR. In addition, the significant impoundment impact of TGR on hydrological hysteresis was analyzed and the relationship between the hydraulic gradient and the discharge ratio in the lower Han River was also discussed.

2. Study Area and Datasets

2.1. Study Region

The Han River, with a watershed area of 1.59 × 10⁵ km2, is the longest branch of the middle Yangtze River, which originates from the Shaanxi province and flows across Shaanxi and the Hubei province and converges into the Yangtze River in Wuhan city, as shown in Figure 1. The river basin is located in the area of tropical and subtropical monsoon climate. The mean annual precipitation in this basin varies from 750 mm in the northwestern region to 1100 mm in the southeastern region. The precipitation mostly concentrated in the summer and late autumn seasons (from June to November), accounting for 75–80% of the annual total precipitation amount [21]. The lower Han River extends from Shayang to its estuary, 282 km long, which is a typical meandering river channel (Figure 1).
The Danjiangkou Reservoir (DJKR) is the largest hydraulic engineering in the Han River basin, which has been in service for more than 50 years. The locations of the gauging stations downstream from the DJKR are presented in Figure 1. Xiantao station, below the DJKR, is the most downstream hydrological station in the lower Han River, which monitors water and sediment discharges to the Yangtze River from the Han River. Hankou station, downstream of the confluent area, is the hydrological station monitoring stage and discharge processes in the middle Yangtze River. In addition, the Zekou, Yuekou and Hanchuan are stage gauging stations, which record the variation process of the water level. The detailed information for the gauging stations is shown in Table 1.
The Yangtze River, the third longest river in the world with a length of 6300 km, connects with the Han River at its middle reach. Significant hydrological changes occurred after the construction of cascade reservoirs in the upper Yangtze River, especially the TGR. The TGR was put into operation since 2003, which exerted an enormous influence upon the downstream hydrological processes. Generally, there are four dispatching periods of the TGR: (1) pre-discharging periods from late April to June, the reservoir is emptied to store the inflow during the flooding seasons; (2) flood regulation periods from July to August, the peak discharge is regulated in order to protect the human life and property from flood damage; (3) impounding periods from September to October, part of the inflow is stored in the reservoir for the water consumption during the drying seasons; (4) water compensation periods from November to the next early April, more water than the inflow is discharged to the downstream for agricultural irrigation and waterway maintenance.

2.2. Datasets

In this study, the daily streamflow and stage data that were observed at the gauging stations were collected from the Changjiang Water Resource Commission, China. The inflow and outflow data of the TGR were obtained from China Three Gorges Corporation. The data series are complete and in a good consistency, which cover a period of 2005–2011. The reliability and homogeneity of the hydrological data were carefully checked and firmly controlled before their release [22,23]. The monthly average inflow and outflow volume of the TGR from 2005 to 2011 is shown in Figure 2. There was evident volume difference between the inflow and outflow during the different dispatching periods of the TGR, which changed the outflow boundary conditions of the Han River with different degree. In addition, the topographic map used for model simulation in this paper was observed from 2005 to 2007. Therefore, the datasets observed in 2005 and 2007, e.g., stage, discharge and topographic map along the Han River, were applied for model calibration and validation.

3. Methodology

3.1. 1D Hydrodynamic Model

In order to evaluate the hydrological and hydraulic changes in the lower Han River after the TGR operation, a data-driven modeling approach was applied based on the MIKE11 model package. Several sub-modules, e.g., rainfall-runoff (RR), hydrodynamic (HD), advection-dispersion (AD), composed of the MIKE11 model [24]. The other sub-modules can be used by coupling with the HD sub-module for modeling purposes of water resource management, environmental management and planning and designing applications. Therefore, the MIKE11 model was widely used all over the world after its development by the Danish Hydraulic Institute. In this study, the 1D hydrodynamic module of the MIKE11 was applied to simulate the hydrological regime in the lower Han River. The Saint-Venant equations of the hydrodynamic module are used to describe the unsteady flow in rivers as follows:
  A t + Q x = q  
  Q t + g ( α Q 2 A ) x + g A h x + g n 2 Q | Q | A R 3 / 4 = 0  
in which, x, t are spatial coordinate (m) and temporal coordinate (s) respectively; A is water cross section area (m2); Q is flow discharge (m3/s); h is the stage above datum (m); q is the lateral inflow per unit width (m2/s); n is roughness coefficient; R is the hydraulic radius (m); α is the momentum correction coefficient; g is acceleration of gravity (m/s2). The Saint-Venant equations are solved by a six-point implicit staggered grid finite difference scheme [25].

3.2. Quantitative Description of Hydrological Hysteresis

Hydrological hysteresis occasionally occurred in the lower Han River due to the changes in stage of the Yangtze River, especially after the flow regulation of the TGR. Therefore, the quantitative description of the hydrological hysteresis is highly necessary. In this study, the dimensionless hysteresis degree was applied to define the hydrological hysteresis as follows [26]:
  φ Q h = | Q ( t ) ¯ d h ( t ) ¯ |  
in which, Q ( t ) ¯ and h ( t ) ¯ are normalized flow and stage to eliminate the dimensional differences in this study.
  h ( t ) ¯ = h j ¯ h ¯ m i n h ¯ m a x h ¯ m i n  
  Q ( t ) ¯ = Q j ¯ Q ¯ m i n Q ¯ m a x Q ¯ m i n  
where, the subscripts ‘min’ and ‘max’ denote the minimum and maximum values of the stage and flow data series. For a hydrological data sequence with its sample size of N, Q j ¯ and h j ¯ are the 5-day moving average flow and stage respectively, h j ¯ = 1 5 i = 1 5 h i + j + 1 , Q j ¯ = 1 5 i = 1 5 Q i + j + 1 , (j = 1, 2 ,…, N−4).

3.3. Simulation Scenarios

The hydrological changes occurred downstream of the TGR exerted a profound influence on the hydrological regime in the Yangtze River basin. As a tributary of the Yangtze River, the Han River is experiencing its changed outflow boundary conditions at the river estuary. Two simulation scenarios were carried out to examine the influence of the TGR flow regulation on the hydrological regime in the lower Han River. One was the real hydrological process simulation with the TGR flow regulation and the other was the natural process without the flow regulations of the TGR. The inflow boundary of the Yangtze River for the hydrodynamic model was assigned with the flood routing results from the inflow to the TGR based on the Muskingum method [27]. The inflow boundary for the Han River was applied by the observed discharge at the Shayang station. The downstream condition for the hydrodynamic model was set up with the rating curve at the Hankou station. The lower Han River channels were divided into 300 reaches by 299 cross sections. The separation distance between the sections extended from 180 m to 2000 m. Moreover, the simulation periods for the two scenarios were from January 2008 to December 2012.
In order to quantitatively evaluate the simulation results, the Nash-Sutcliffe efficiency coefficients (NSE), the normalized root mean squared error (RMSE) and relative error (R) were applied to compare the simulated and observed results as follows [28,29,30]:
N S E =   1 i = 1 N ( T i T l ^ ) 2 / i = 1 N ( T i T i ¯ ) 2  
  R M S E   = 1 N i = 1 N ( T i T l ^ ) 2 / T i ¯  
  R = 1 N i = 1 N | T i T ^ i | T i  
where, N denotes the number of data sample; T i is the observed data; T ^ l is the predicted value of the hydrodynamic model; T i ¯ is the mean observed data.

4. Results

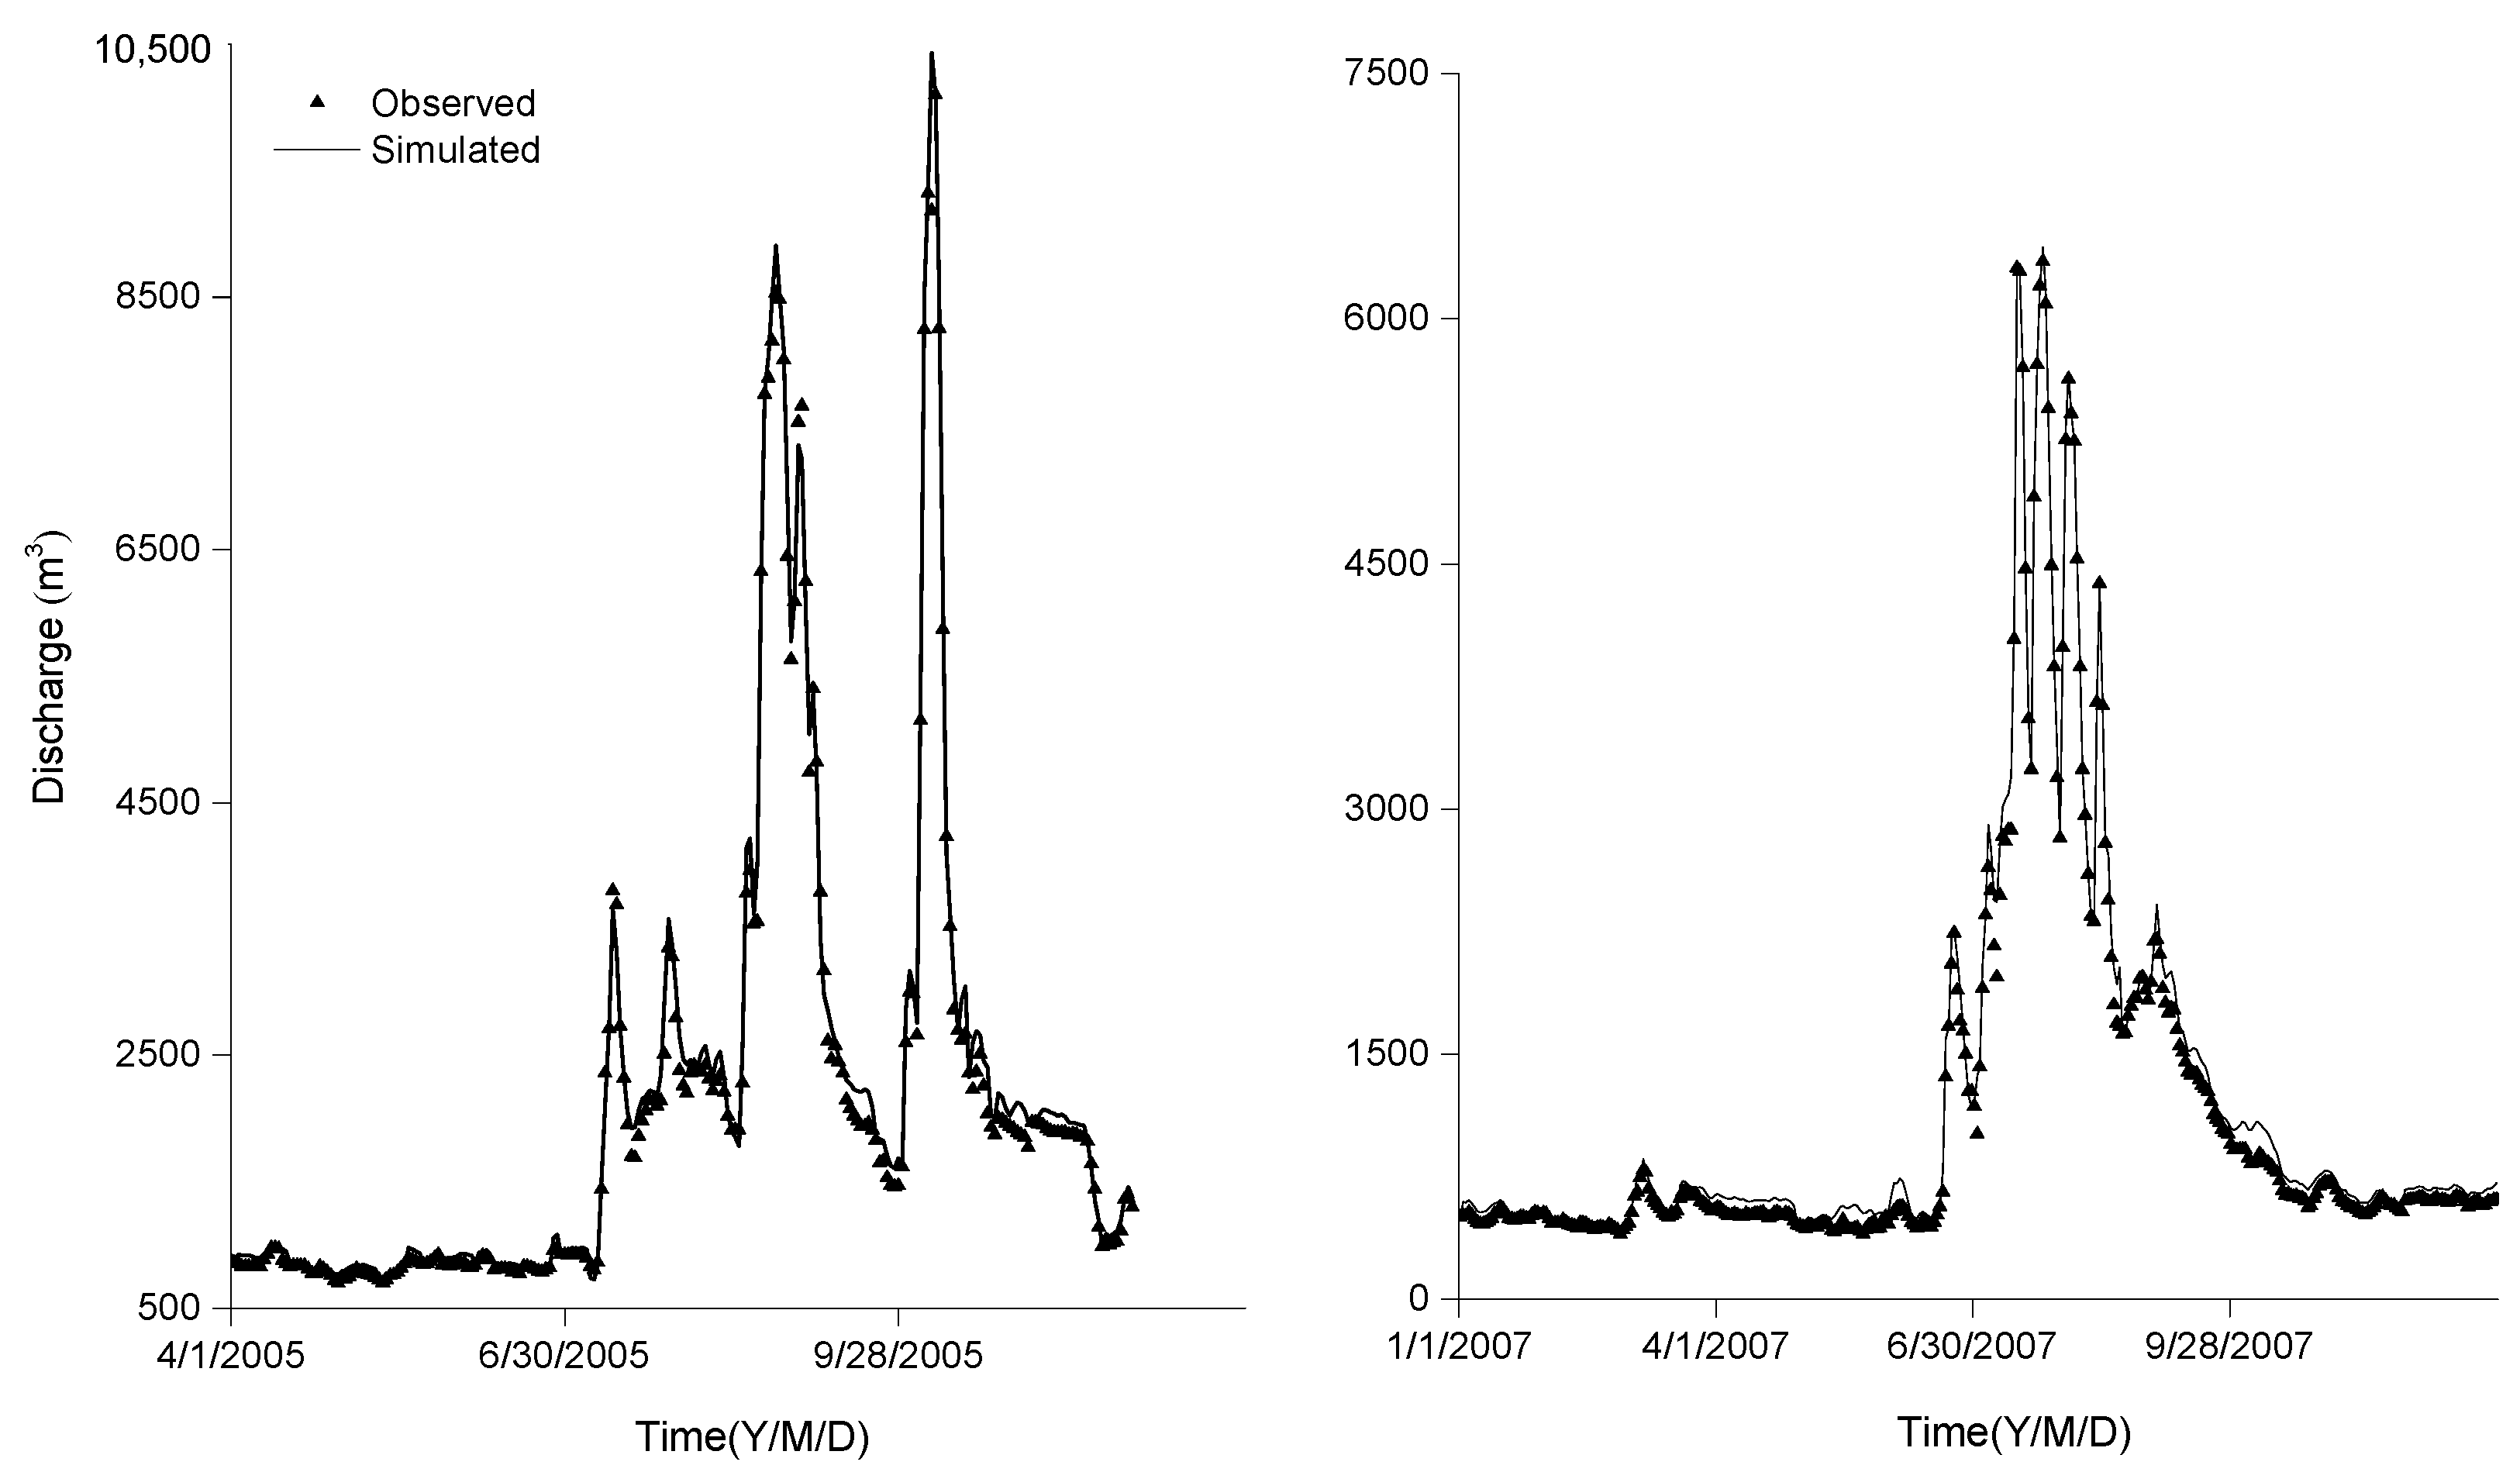
4.1. Model Calibration and Validation

The model calibration and validation are the most significant procedures to obtain an accurate running model. In this study, the hydrological processes in 2007 and 2005 that covered flooding and drying events were selected for model calibration and validation respectively. The Manning’s roughness coefficients (n) in the different reaches are the key parameters to adjust until there is a good agreement between the observed and simulated stage along the river channels. The calibration results show a physically acceptable variation range of the Manning’s roughness coefficients from 0.021 to 0.042. Concerning the distribution of the roughness coefficients, it should be noted that there are obvious differences between different reaches. The roughness coefficients of straight reaches with smooth riverbed are much smaller than the bend reaches with deep pools and large shoals. In addition, the point bars are much coarser than the deep channels in the lower Han River.
The calibration and validation results of the hydrodynamic model are shown in Figure 3 and Figure 4. Comparison between the predicted and observed stage at the gauging stations (Zekou, Yuekou, Xiantao and Hanchuan) indicates a good agreement between the both (Figure 3). In addition, the computed flow processes are quite consonant with the observed one at the Xiantao station. As shown in the Figure 3 and Figure 4, the hydrodynamic model can accurately simulate the flooding and drying events.
Table 2 presents the evaluation results of the model simulation. The NSE for the calibration and validation stage processes is larger than 0.9744 at all the gauging stations along the lower Han River and the RMSE is smaller than 0.011, which indicates that the hydrodynamic model has a high accuracy for stage simulation. Similarly, the NSE for flow discharge of the calibration and validation processes is larger than 0.9908 and the RMSE is smaller than 0.0063 at the Xiantao station. In particular, the relative errors of the simulated stage and discharge are less than 1.02% and 5.98% respectively, which show a good agreement between the simulated hydrological processes and the observed ones. Therefore, the hydrodynamic model can be used to predict and evaluate the hydrological changes accurately in the lower Han River under the influence of the TGR operation.

4.2. Response of Hydrological Regime to the TGR Impoundment

The confluence area between the Yangtze River and the estuary of the Han River is the downstream boundary of the lower Han River. Therefore, the changed water level at the confluence area after the TGR operation inevitably has an impact on the water level in the lower Han River. The stage differences between the natural processes and the processes under the flow regulation of the TGR are shown in Figure 5. The monthly average water level at the gauging stations during the water compensation and flood pre-discharging periods of the TGR increased from 0.023 m to 0.433 m, while it decreased from 0.015 m to 0.713 m during the other periods. In particular, the water level obviously decreased during the impounding periods (from September to October) of the TGR. The flow regulation of the TGR during these periods significantly changed the hydrological processes in the Yangtze River, especially the water level at the confluence area, which resulted in the large stage difference variation from −0.962 m to 0.812 m. Therefore, the closer to the Han River estuary of the gauging station is, the larger changes in water level are. The maximum and minimum values of the monthly average stage differences at the Hanchuan station were 0.604 m and −0.663 m respectively. The variation ranges of the Xiantao station in the upper reaches were less than 0.2 m during the most time periods.
With the changes in the downstream stage at the estuary of the Han River, there were also some variations in the discharging processes along the lower Han River. Flow differences at the gauging stations between the natural processes and the processes under the flow regulation of the TGR from 2008 to 2011 are shown in Figure 6. There was a good agreement of the flow variation between the gauging stations. Large flow differences predominantly occurred during the flooding and impounding periods. The outflow increase from the Han River to the Yangtze River mostly occurred during the impounding periods and part time of the flooding periods. There was an obvious flow increase along the lower Han River during the impounding periods of the TGR in 2011 and the maximum monthly average flow increase at the Zekou, Yuekou, Xiantao and Hanchuan stations was about 9.33 m3/s, 13.75 m3/s, 12.75 m3/s and 7.11 m3/s. It should be noted that the flow regulation of the TGR was not the only factor influencing the outflow processes of the Han River. Other factors such as the upstream inflow from the Yangtze River and the Han River, flood combinations are closely associated with the outflow of the Han River. Therefore, the monthly average flow differences along the lower Han River were different between the research periods.

4.3. Variation in Stage-Flow Relationships and Measurement of Hysteresis

The influences of the flow regulation of the TGR are not only on the hydrological regime but also on the stage-flow relationship. The comparison of the stage-flow relationships at the Zekou and Xiantao stations with and without the TGR is shown in Figure 7. The selected gauging stations are located in the key sites of the upstream and downstream research channels. In addition, the listed research periods in the Figure 7 include two integrated schedule cycles from November 2008 to October 2010, which cover a dry year cycle and a wet year cycle (Figure 2). Therefore, the comparison between the stage-flow relationships at the two gauging stations in the Figure 7 can reveal the response of the rating curves to the flow regulation of the TGR.
As shown in Figure 7, the responses of the stage-flow relationships to the flow regulation of the TGR were obviously different between the scheduling periods. There was a slightly higher water level at the gauging stations under the same flow discharge when the water compensation from the TGR being carried out during November to the following April (Figure 7a,e,i,m). In addition, there was no one-to-one correspondence between the stage and discharge during the water compensation except for the period from November 2009 to April 2010 at the Zekou station. It implied that there was a wide scope of water compensation influence of the TGR along the Han River during the dry seasons. On the contrary, the backwater effects of the Yangtze River on the lower Han River began to weaken during the periods from May to June and the stage under the same flow discharge decreased from 0.003 m to 0.021 m at the Zekou station (Figure 7b,f). When the flood regulation of the TGR was carried out from July to August, the downstream stage of the TGR deceased along the channels. Consequently, there was a lower stage under the same discharge at the Zekou and Xiantao stations (Figure 7c,g,k,o). In particular, the stage-flow relationships were various because of the complicated coupling floods between the two rivers during the flooding periods. However, the rating curves at the gauging stations had an obvious one-to-one correspondence between the stage and discharge at the gauging stations during the periods of TGR impoundment (Figure 7d,h,l,p). Compared to the relationships of the natural processes, the water level at the gauging stations obviously decreased due to the increase in the hydraulic gradient along the lower Han River. In addition, the nearer to the estuary of the Han River, there are larger differences between the natural and regulated flow processes due to the influence of the TGR operation.
The variations in the stage-flow relationships indicated the hydrological changes after the TGR operation and the hysteretic relationships between the river flow and stage at the gauging stations along the lower Han River (Table 3). As shown in Table 3, the degree of stage-flow hysteresis under the flow regulation of the TGR was lower than the one in the natural processes during water compensation and pre-discharging periods, while it was larger during flooding and impounding periods of the TGR. In addition, there was an increasing trend of the degree of stage-flow hysteresis from upstream to downstream stations, which implied the greater influences of the hydrological processes on the downstream Han River.

4.4. Spatiotemporal Variation in Hydrodynamic Characteristics

The hydrodynamic regime in the lower Han River is significantly affected by the runoff process and the stage changes in the Yangtze River [31]. Therefore, the variation in the hydraulic gradient and the flow velocity in the lower Han River inevitably occurred due to the changed hydrological processes at the estuary of the Han River. The hydraulic gradient, as one of the key influencing factors of water movement, is mainly determined by the upstream and downstream boundary conditions of the channels. There are significant influences of the hydrological changes of the two rivers on the boundary conditions. The variation in hydraulic gradient at the gauging stations along the Han River is shown in Figure 8. Although there were no significant changes in hydraulic gradient on the whole, the differences of the hydraulic gradient during the different periods were not kept the same between each other.
The downstream stage of the TGR along the channels of the Yangtze River significantly decreased during the TGR impoundment from September to October, which increased the hydraulic gradient at the gauging stations with different degree in the lower Han River. The maximum differences of the monthly average hydraulic gradient during the TGR impoundment from 2008 to 2011 at the Zekou, Yuekou, Xiantao and Hanchuan stations were 0.44 × 10⁻⁵, 0.42 × 10⁻⁵, 0.66 × 10⁻⁵ and 1.27 × 10⁻⁵. Meanwhile, the hydraulic gradient slightly decreased during the water compensation and the periods of TGR pre-discharging from December to the following June. The maximum decreases of the monthly average hydraulic gradient during December to the following June from 2008 to 2011 at the Zekou, Yuekou, Xiantao and Hanchuan stations were 0.23 × 10⁻⁵, 0.39 × 10⁻⁵, 0.61 × 10− 5 and 1.21× 10⁻⁵.
Figure 9 presents the variations in the current speed that resulted from the flow regulation of the TGR at the different gauging stations. Similarly to the variation in the hydraulic gradient, the velocities at the gauging stations during the TGR impounding periods were larger than the ones without the flow regulation, while they were smaller during the water compensation and pre-discharging periods. The maximum velocity increases during the TGR impounding periods at the Zekou, Yuekou, Xiantao and Hanchuan stations were 0.019 m/s, 0.022 m/s, 0.039 m/s, 0.052 m/s and the maximum velocity decreases were 0.022 m/s, 0.035 m/s, 0.018 m/s, 0.032 m/s respectively. Consequently, the sediment transport capacity of the flood flow at the lower Han River increased during the TGR impounding periods and decreased during the water compensation periods, which further exacerbated river bed armoring [32]. In addition, the velocity changes were also obvious during the flooding periods. However, there was no good agreement of the velocity variation during the flooding periods between the gauging stations, which partly resulted from the variation in the flood processes of the two rivers.

5. Discussion

This study uncovered the hydrological and hydraulic changes along the lower Han River with and without the TGR. The changed hydrological processes in the Yangtze River, as the important outflow boundary conditions to the Han River, had an obvious influence on the water movement in the lower Han River. In particular, the variation in the stage difference between the Yangtze River and the Han River contributed a lot to the hydrological and hydraulic changes along the lower Han River. A stage-discharge relationship at the gauging station of Xiantao under the different water level of the Yangtze River is shown in Figure 10. It indicated that the stage-discharge relationship was greatly affected by the stage variation in the Yangtze River. When the water level of the Yangtze River was higher than 22.0 m, there was no longer a simple one-to-one correspondence between streamflow and water level at the Xiantao station.
Furthermore, the higher water level is in the Yangtze River, the more scattered are the points of the stage-discharge relationship. Water movement in the lower Han River was significantly affected by the backwater of the Yangtze River during the high stage periods in the Yangtze River. Consequently, the water level in the lower Han River continually increased even with low inflow from the upstream Han River. Therefore, the stage-discharge relationship at the Xiantao station cannot keep up the one-to-one correspondence all the time. When the TGR annually began to impound water since September, the water level decreased gradually near the estuary of Han River [33]. As a result, the hydraulic gradient and flow velocity increased along the lower Han River. On the contrary, the stage at the estuary of the Han River increased when the water compensation from the TGR occurred during the dry seasons, which contributed to a certain extent to blocking the outflow from the Han River. Therefore, the natural flow discharge that without the TGR was slightly larger than the one with TGR during the dry seasons.
The stage differences during the different scheduling periods of the TGR not only directly resulted in the variation in the hydraulic gradient in the lower Han River but also changed the flow processes. Figure 11 presents the relationship between the hydraulic gradient and the discharge ratio of the Han River to the Yangtze River. As shown in the Figure 11, there was a good agreement between the hydraulic gradient and the discharge ratio. The discharge ratio decreased when the water compensation was carried out during the dry seasons, while the discharge ratio increased when the water impoundment occurred from September to October. In addition, the flow regulation of the TGR changed the flood processes during the flood seasons downstream of Yangtze River, which significantly changed the relationship between the hydraulic gradient and discharge ratio. Therefore, the discharge ratio of the Han River to the Yangtze River dramatically increased when the outflow from the TGR was greatly decreased during the flood periods (Figure 11c). Consequently, a huge inflow from the upstream Han River made the hydraulic gradient and flow velocity become larger in the lower Han River, which generally lead to intense erosion and lots of bed materials being carried into the Yangtze River [34]. Therefore, the large stage difference between the two rivers in the flooding and impounding periods has an important effect on the flood control and channel maintenance for ship navigation in the lower Han River.

6. Conclusions

Hydrological processes in the lower Han River with and without the flow regulation influences of the TGR were investigated in this study. The hydrological and hydraulic variations were greatly affected by the stage difference between the Yangtze River and the Han River. Based on the data analysis and comparative research, the interesting and important conclusions have been drawn as follows:
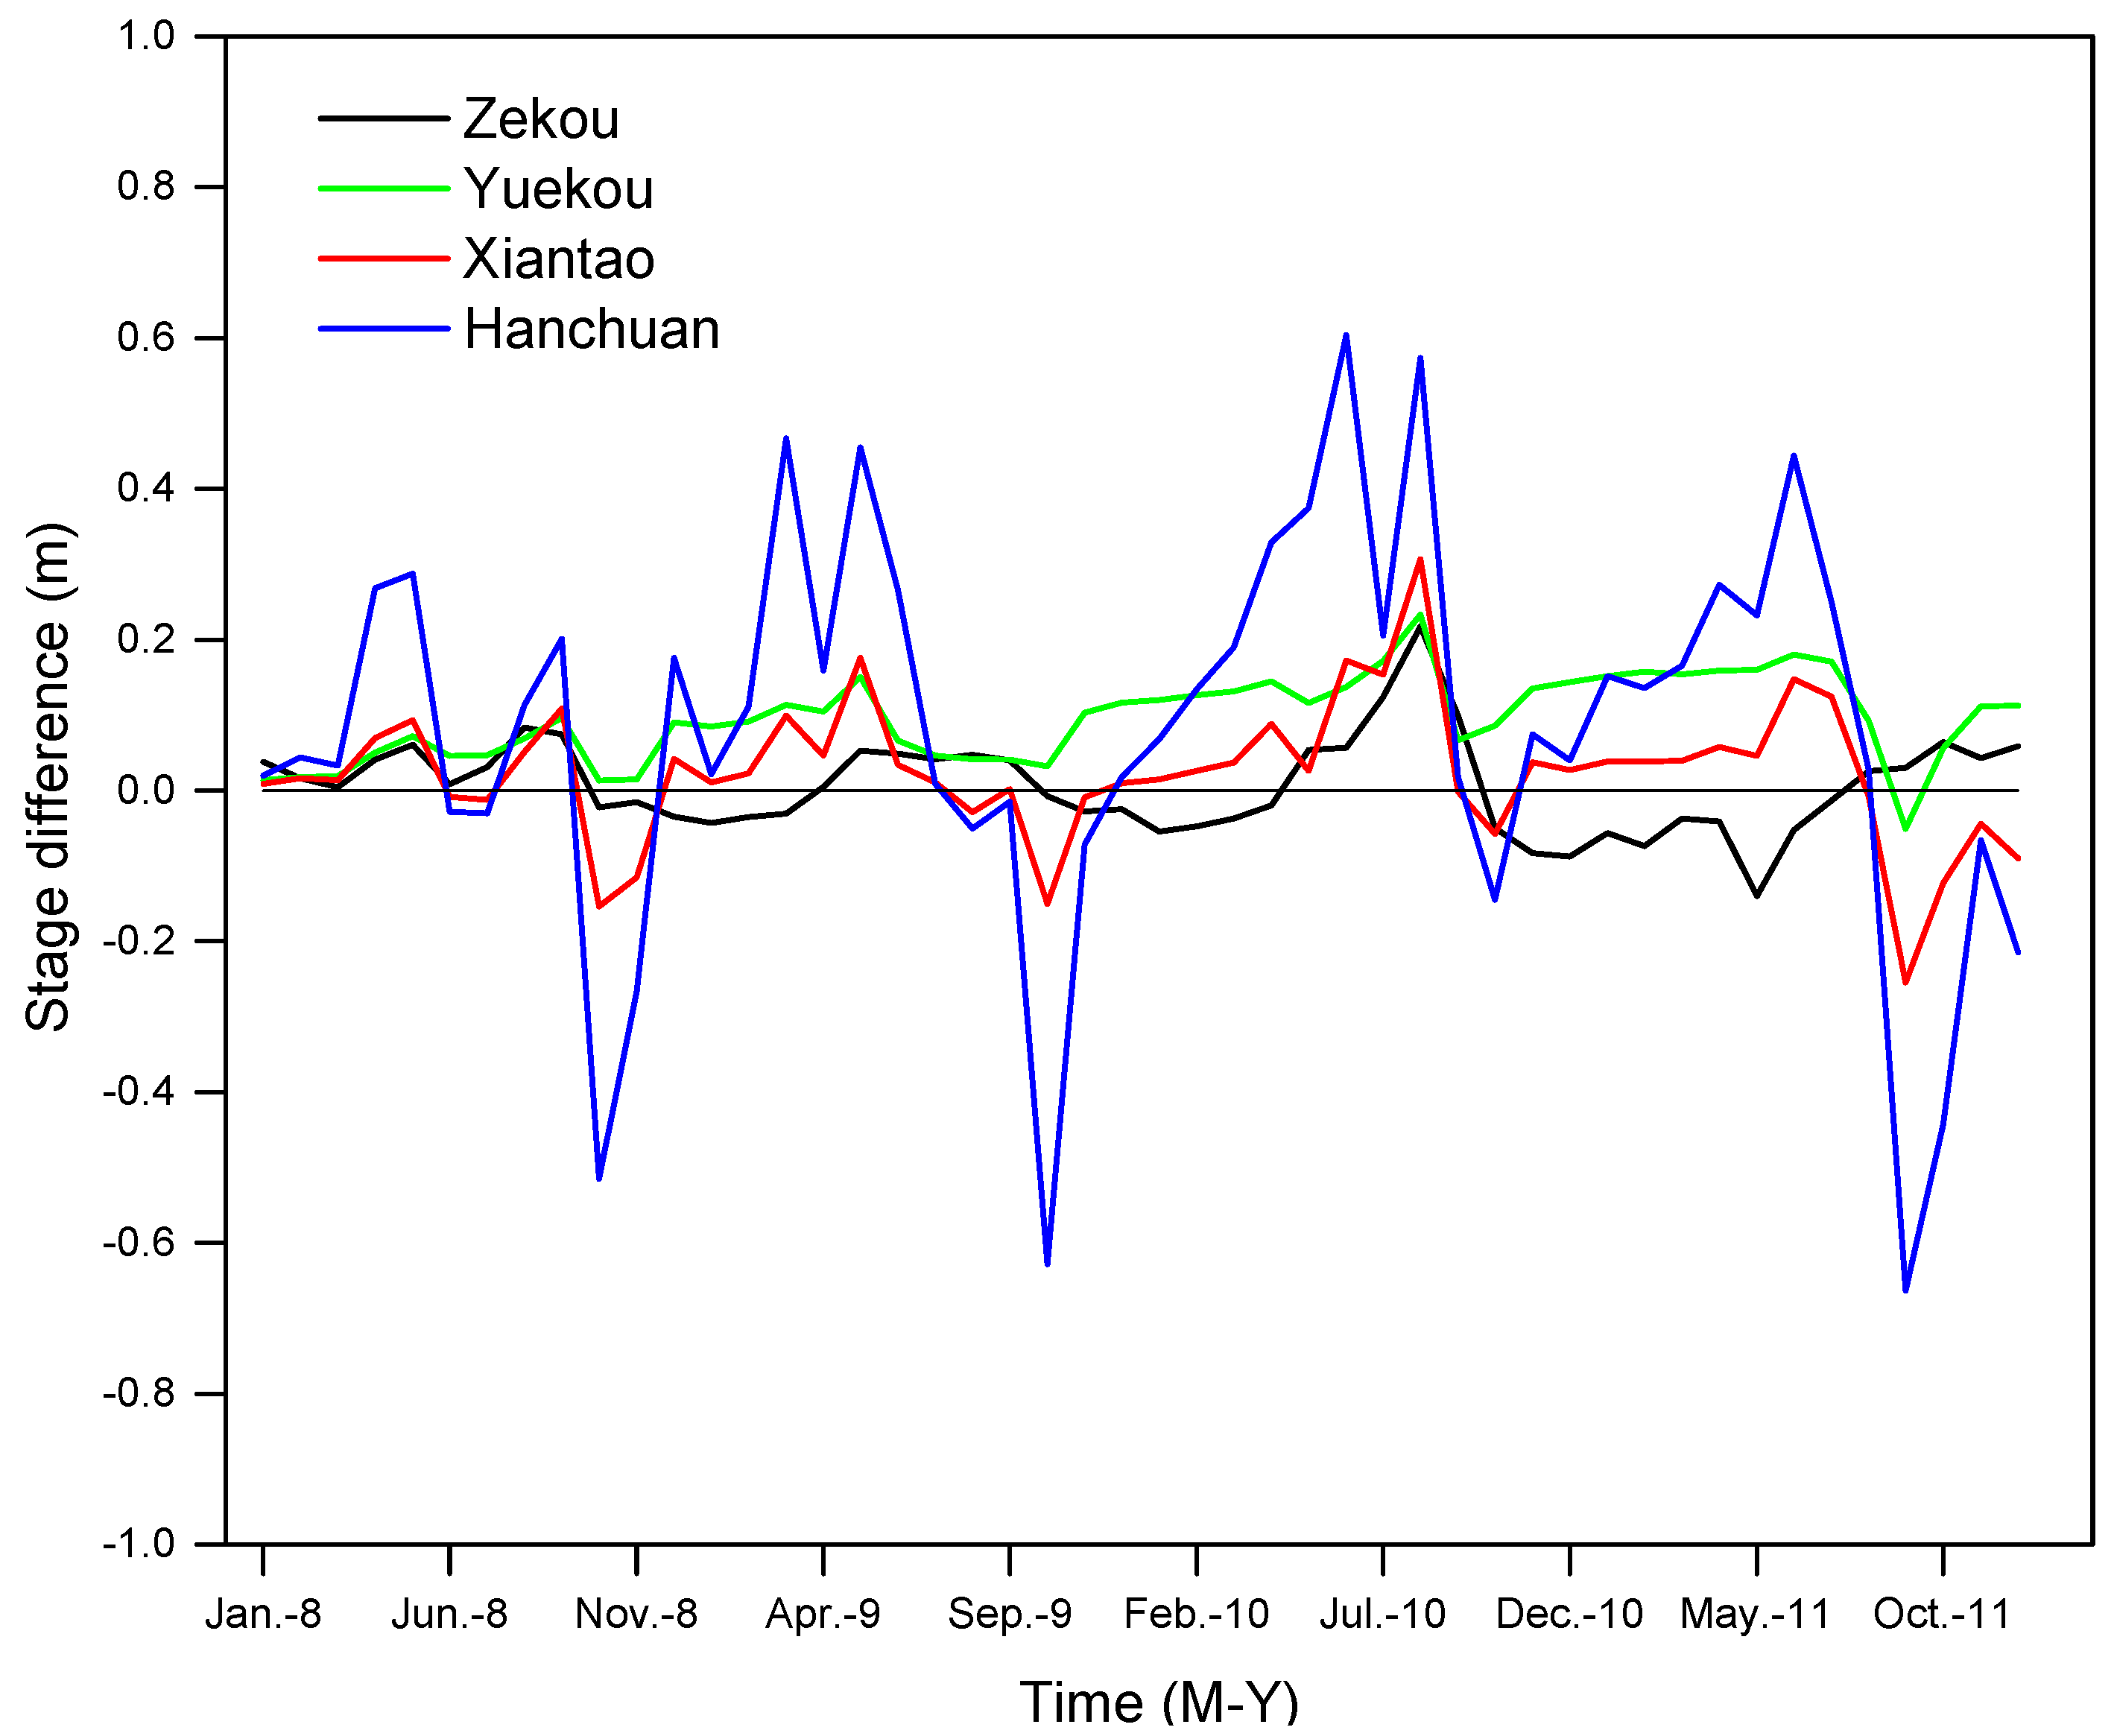
  • There were evident differences in the response of hydrological regime to the flow regulation of the TGR during the different dispatching periods in the lower Han River. The water level increased along the lower Han River and the downstream channels of the TGR during the periods of water compensation, which resulted in the decrease in the stage difference between the two rivers, hydraulic gradient and flow velocity in the lower Han River. On the contrary, the increased stage differences during the water impoundment of the TGR contributed to increasing the flow velocity, hydraulic gradient and the outflow from the Han River to the Yangtze River.
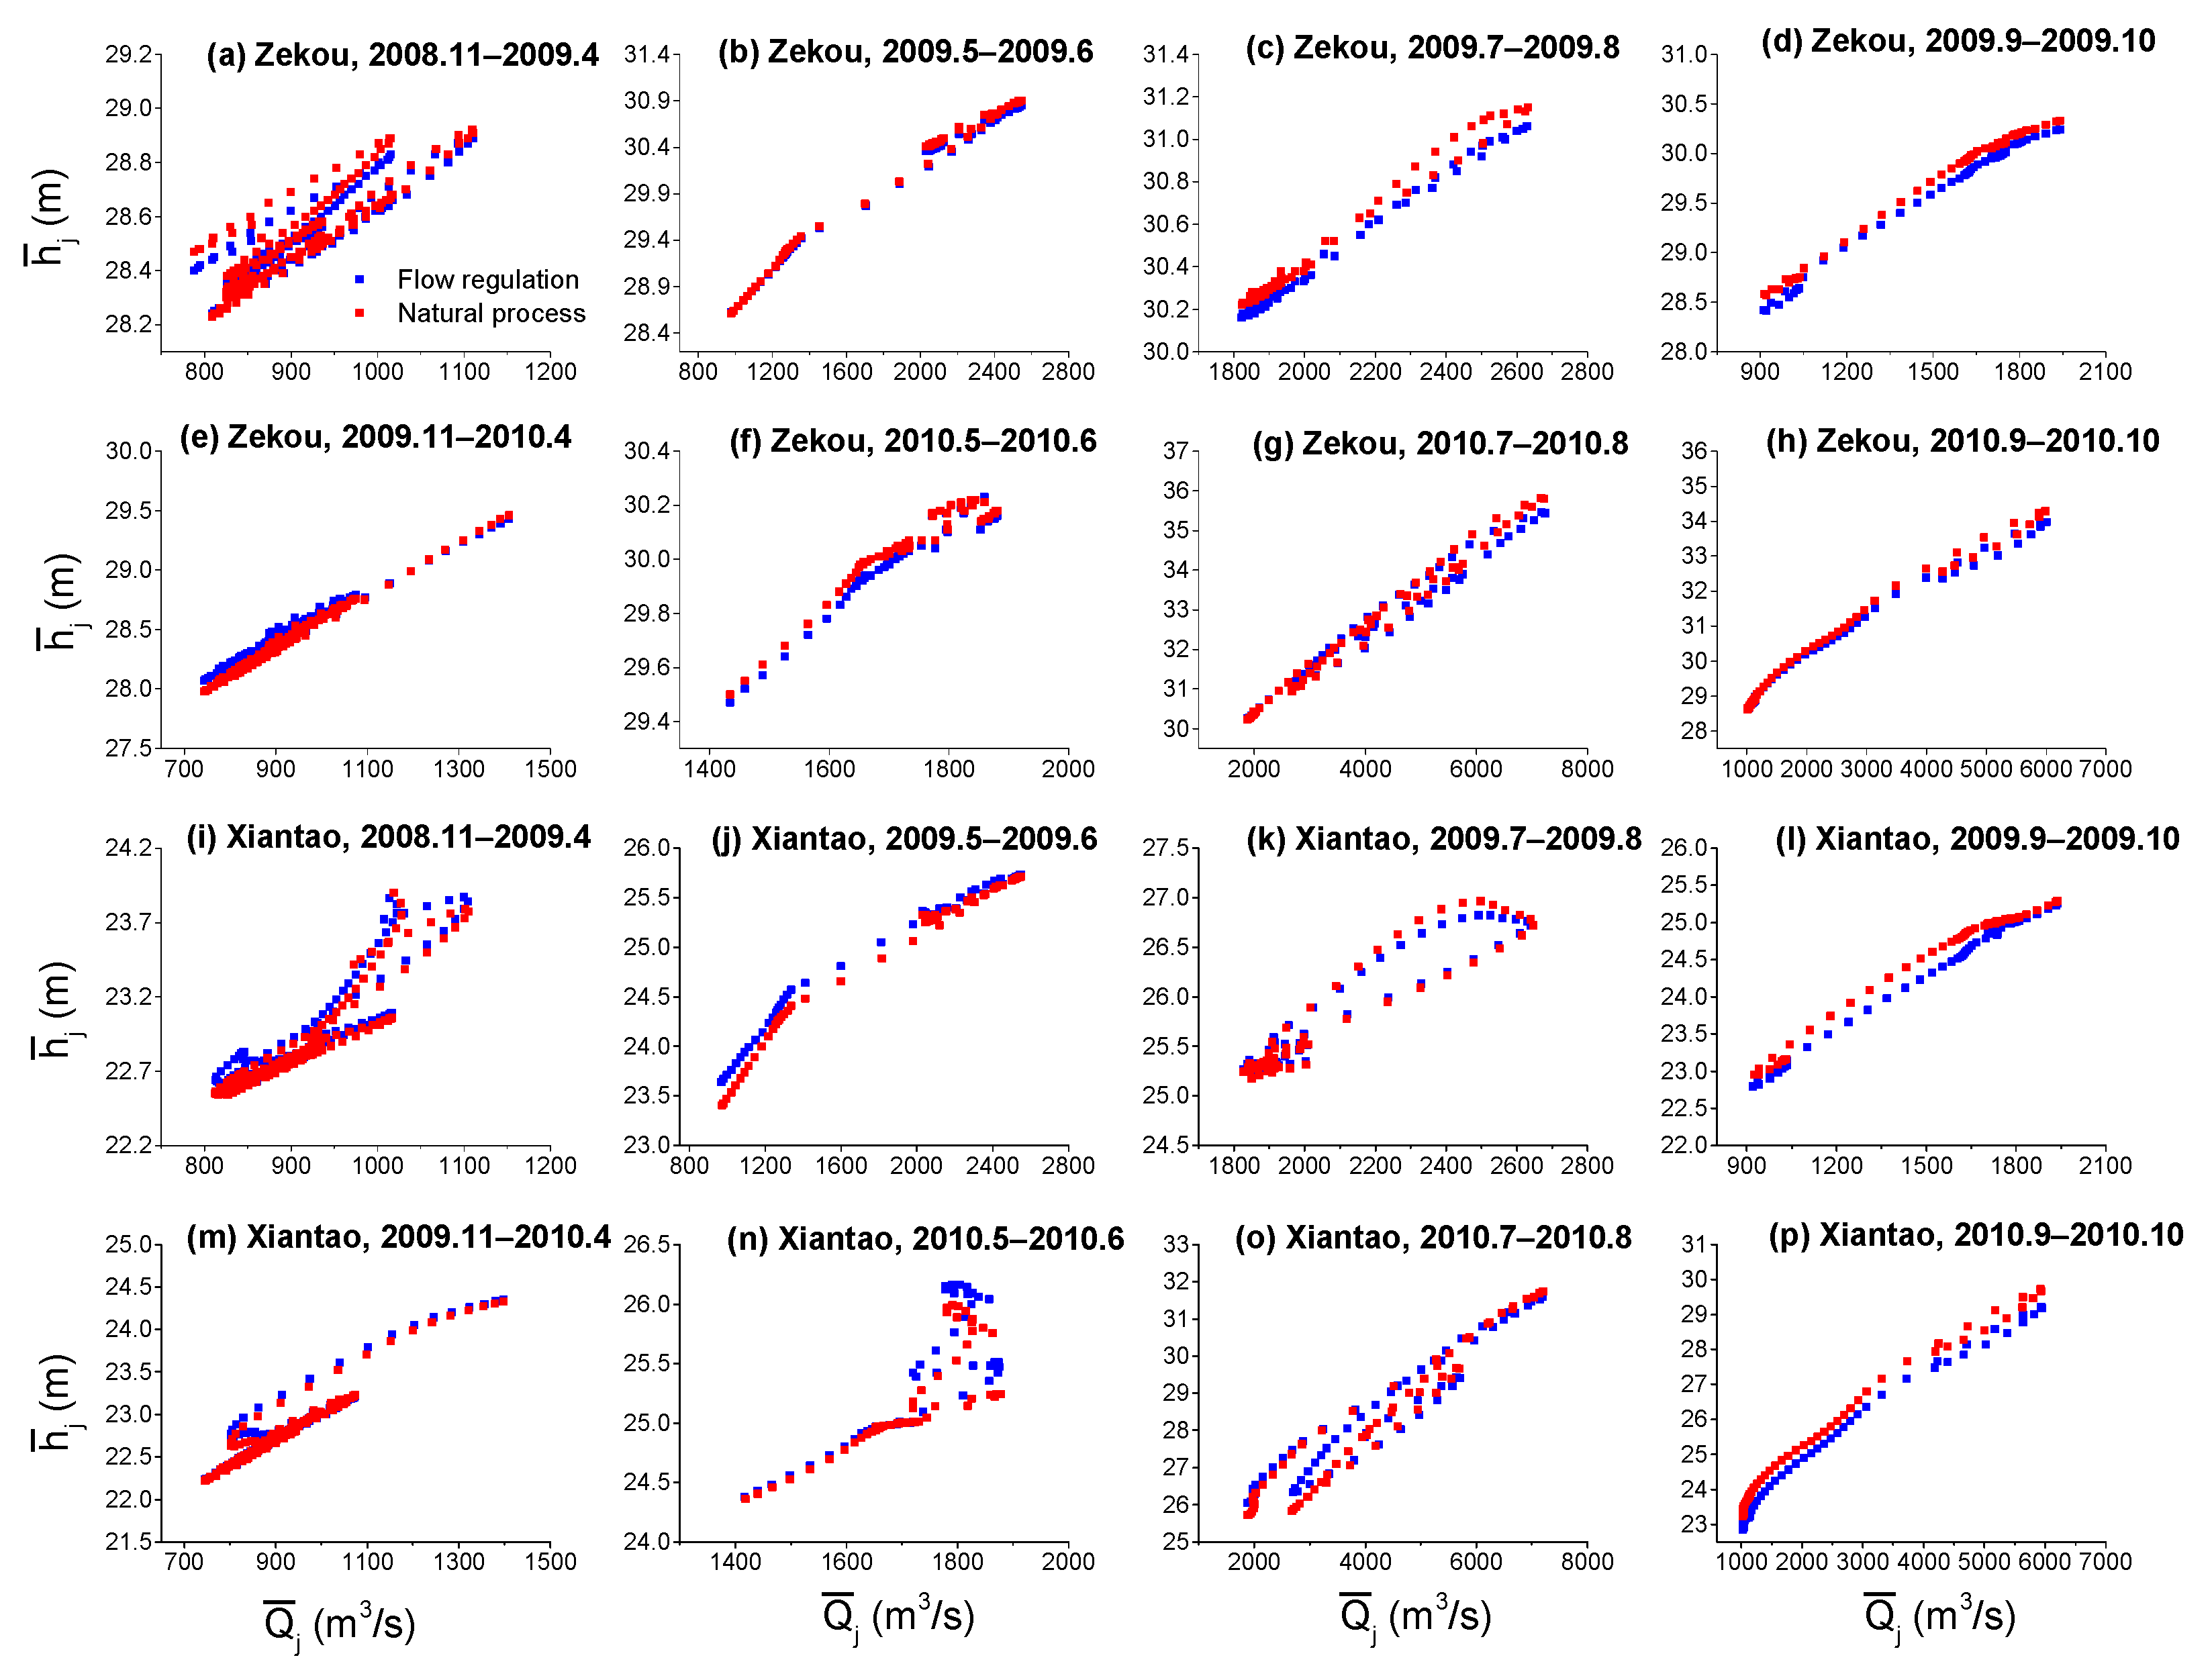
  • The variation in the stage-flow relationships and hydrological hysteresis was another response to the flow regulation of the TGR. There were different changes in the relationships between the stage and the streamflow at the gauging stations during the dispatching periods of the TGR. The water level along the lower Han River increased with different degrees under the same flow during the water compensation of the TGR, while it decreased when the water impoundment was carried out from September to October. In addition, flow regulation of the TGR lowered the degree of stage-flow hysteresis during water compensation and pre-discharging periods. On the contrary, the degree of stage-flow hysteresis increased during the flooding and impounding periods of the TGR.
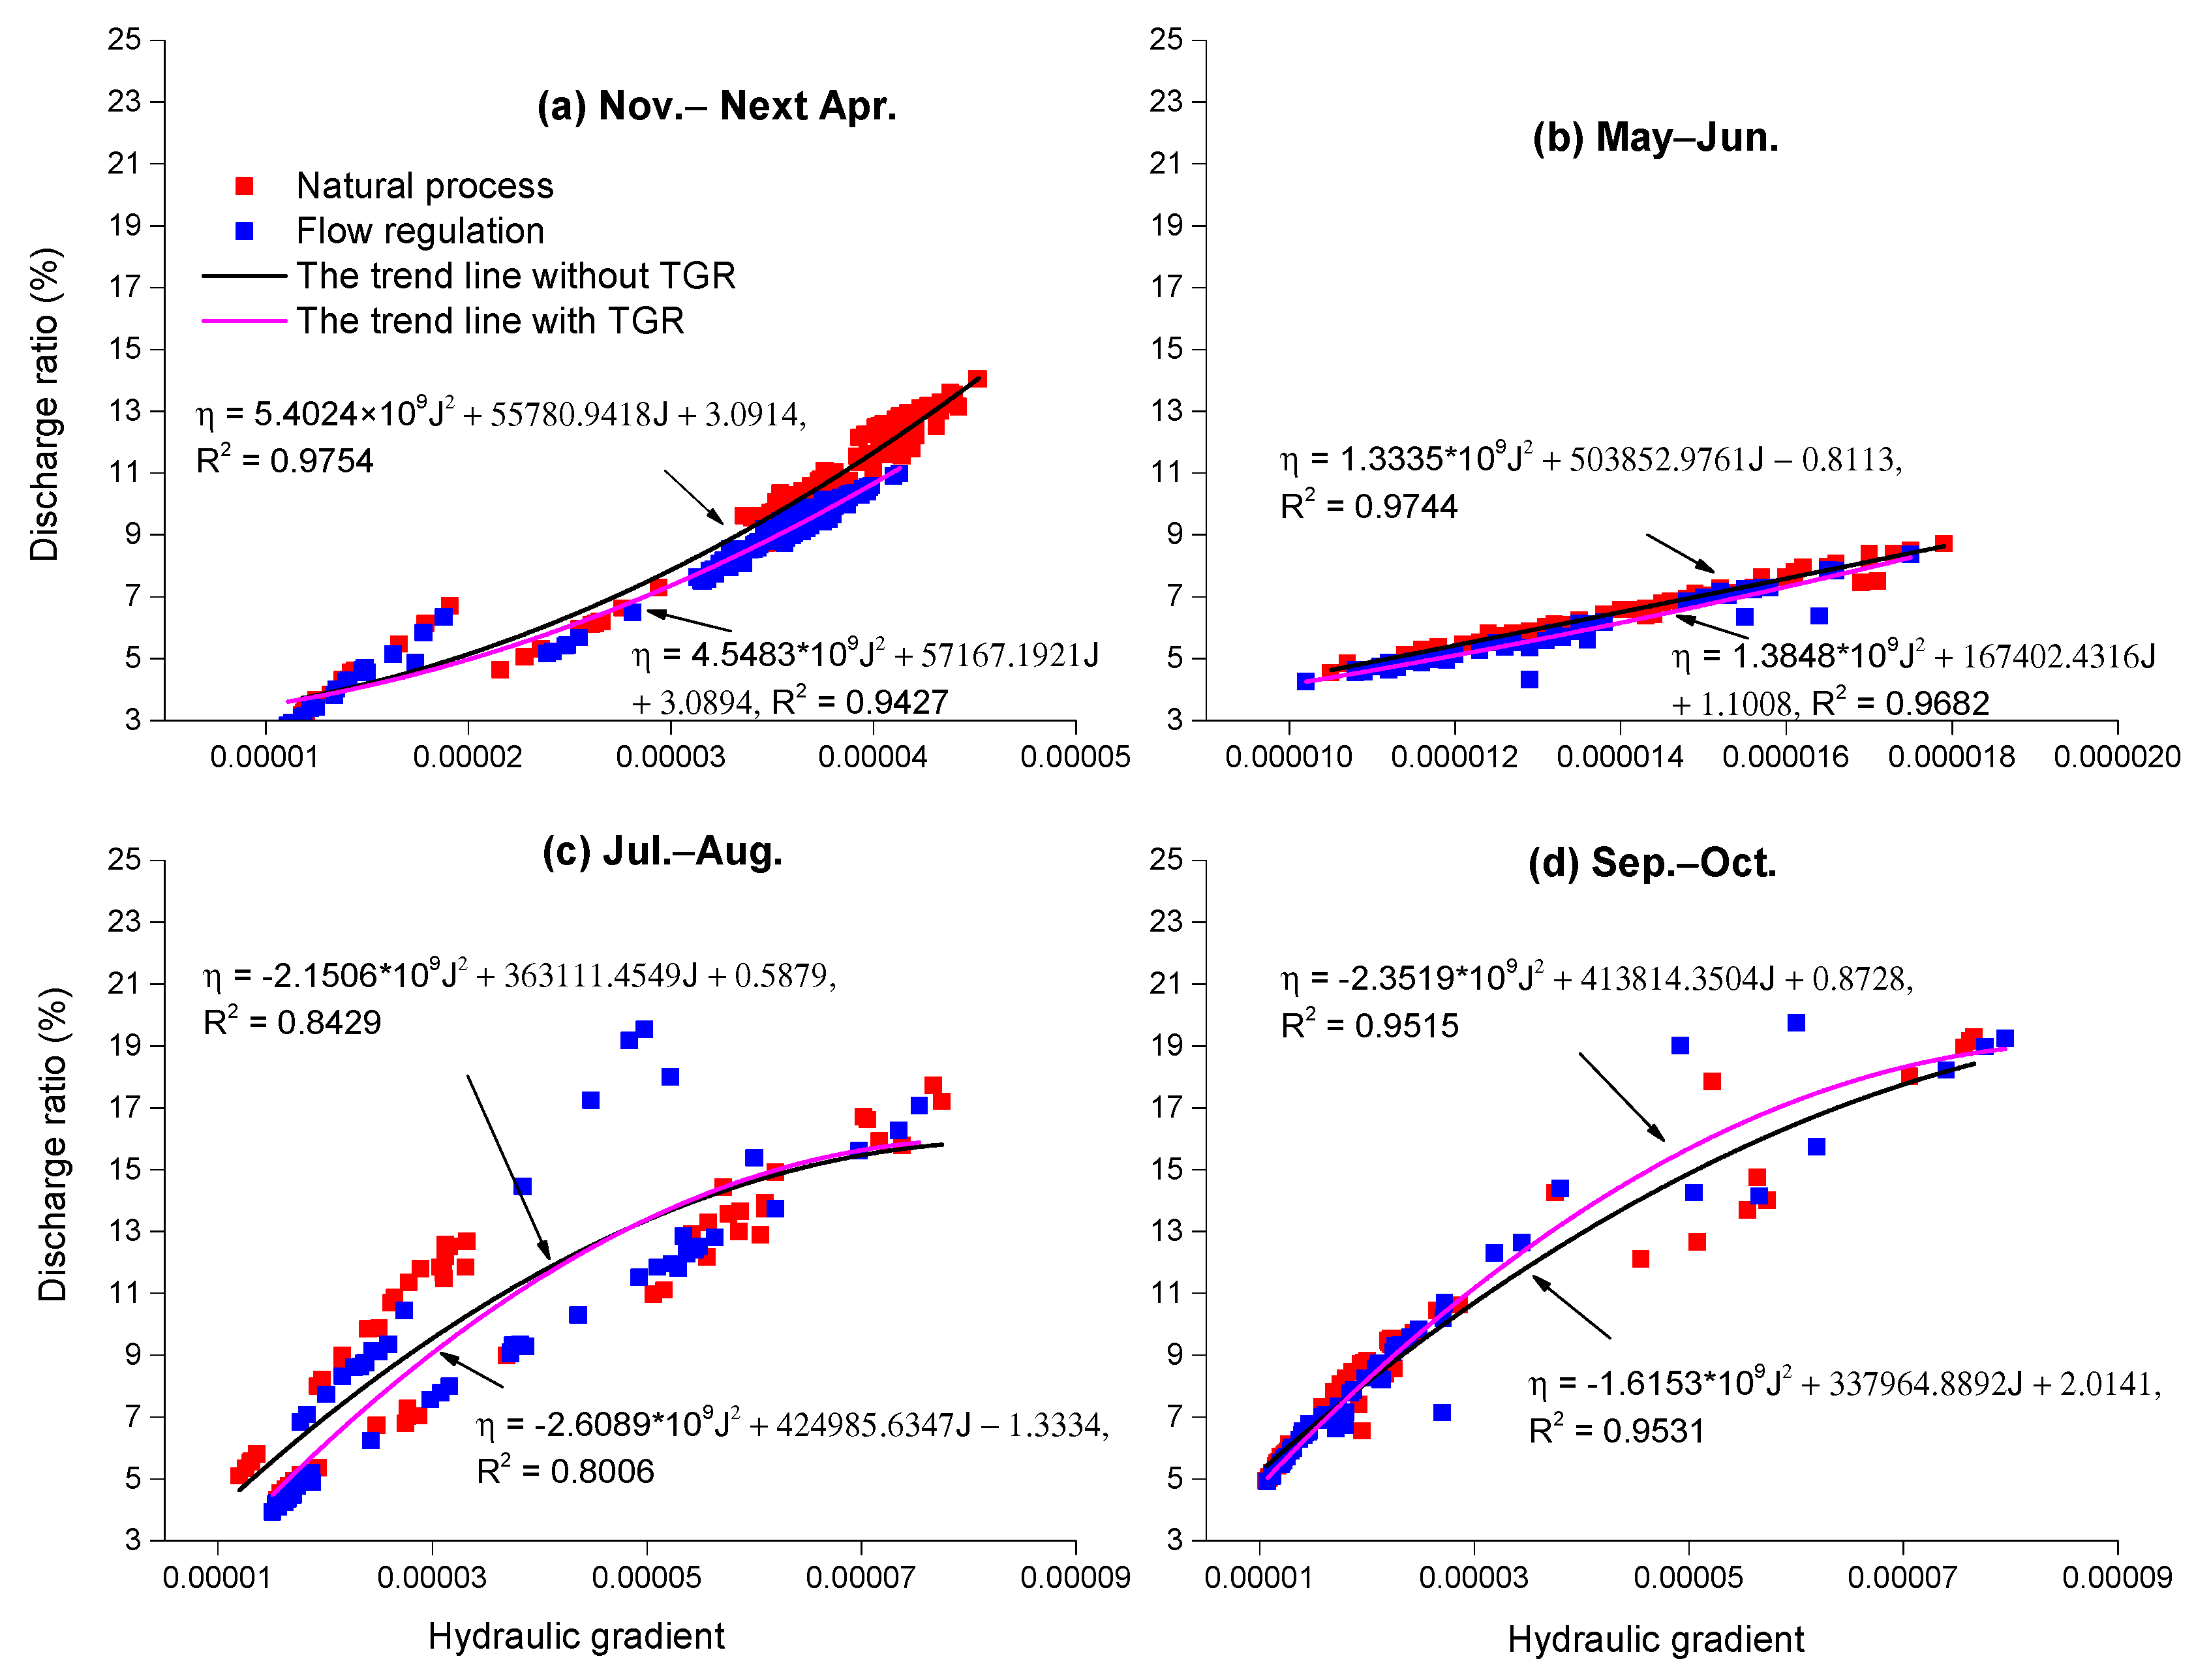
  • The changed hydrological processes downstream of the TGR under the flow regulation obviously contributed to the variation in the hydraulic regime in the lower Han River. The flow velocity and hydraulic gradient increased along the lower Han River, which contributed to the maximum monthly average flow increase around 10 m3/s during the TGR impoundment and flood regulation periods. However, the decreased stage differences between the two rivers during water compensation resulted in the decrease in the hydraulic gradient and flow velocity, which restrained the outflow from the Han River. The changes in the flow velocity and hydraulic gradient not only increased the bed erosion after flood seasons but also significantly contributed to maintaining the channel dimensions for ship navigation during the different dispatching periods of the TGR. In addition, the discharge ratio of the Han River to the Yangtze River varied with the changes in the flow velocity and hydraulic gradient during the different dispatching periods of the TGR. Therefore, much more attention should be paid to the flow regulation of the TGR during different dispatching periods for its obvious influences on the hydrological and hydraulic regime in the downstream river basin.

Author Contributions

J.Z. and M.D. conceived the article structure and collected the data; D.W. and D.Z. analyzed the data; T.H. edited the manuscript. L.F. and S.C. contributed materials/analysis tools; J.Z. and L.C. wrote the paper.

Funding

This research was funded by National Key R&D Program of China (2017YFC0405900); the National Natural Science Foundation of China (51509273, 51679094, 51409085); the National Key Research and Development Plan (2016YFC0400901); Open Foundation of State Key Laboratory of Hydrology-Water Resources and Hydraulic Engineering (2015491111); the Open Research Fund of State Key Laboratory of Simulation and Regulation of Water Cycle in River Basin (China Institute of Water Resources and Hydropower Research), Grant NO: IWHR-SKL-201607, 2016TS07; the Technology Demonstration Projects of Ministry of Water Resources (SF2016-10); the Research and Development Projects on Application Technology of Heilongjiang Province (GZ16B011) and Fundamental Research Funds for the Central Universities (2017KFYXJJ194, 2016YXZD048).

Acknowledgments

The authors gratefully acknowledge the anonymous reviewers and editors for their careful reviews and suggestions, which significantly contributed to the manuscript improvement.

Conflicts of Interest

The authors declare no conflict of interest. The founding sponsors had no role in the design of the study; in the collection, analyses, or interpretation of data; in the writing of the manuscript; nor in the decision to publish the results.

References

  1. Chen, J.; Shi, H.Y.; Sivakumar, B.; Pearte, M.R. Population, water, food, energy and dams. Renew. Sustain. Energy Rev. 2016, 56, 18–28. [Google Scholar] [CrossRef]
  2. Huang, K.; Chen, L.; Zhou, J.; Zhang, J.; Singh, V.P. Flood hydrograph coincidence analysis for mainstream and its tributaries. J. Hydrol. 2018, 565, 341–353. [Google Scholar] [CrossRef]
  3. Lyubimova, T.; Lepikhin, A.; Parshakova, Y.; Tiunov, A.; Konovalov, V.; Shumilova, N. Numerical modelling of admixture transport in a turbulent flow at river confluence. J. Phys. Conf. Ser. 2013, 416, 12–28. [Google Scholar] [CrossRef]
  4. Huang, K.; Ye, L.; Chen, L.; Wang, Q.; Dai, L.; Zhou, J.; Singh, V.P.; Huang, M.; Zhang, J. Risk analysis of flood control reservoir operation considering multiple uncertainties. J. Hydrol. 2018, 565, 672–684. [Google Scholar] [CrossRef]
  5. Zhang, Y.F.; Wang, P.; Wu, B.S.; Hou, S.Z. An experimental study of fluvial processes at asymmetrical river confluences with hyperconcentrated tributary flows. Geomorphology 2015, 230, 26–36. [Google Scholar] [CrossRef]
  6. Gardner, C.J.; Deeming, D.C.; Eady, P.E. Seasonal water level manipulation for flood risk management influences home-range size of common bream Abramis brama L. in a Lowland River. River Res. Appl. 2015, 31, 165–172. [Google Scholar] [CrossRef] [Green Version]
  7. Taylor, E.H. Flow characteristics at rectangular open-channel junctions. Am. Soc. Civ. Eng. Trans. 1944, 109, 893–902. [Google Scholar]
  8. Webber, N.B.; Greated, C.A. An investigation of flow behavior at the junction of rectangular channels. Proc. Inst. Civ. Eng. 1966, 34, 321–334. [Google Scholar] [CrossRef]
  9. Mosley, M.P. An experimental study of channel confluences. J. Geol. 1974, 84, 538–562. [Google Scholar] [CrossRef]
  10. Modi, P.N.; Dandekar, M.M.; Ariel, P.D. Conformal mapping for channel junction flow. J. Hydr. Div. 1981, 107, 1713–1733. [Google Scholar]
  11. Best, J.L.; Reid, L. Separation zone at open-channel junctions. J. Hydraul. Eng. 1984, 110, 1588–1594. [Google Scholar] [CrossRef]
  12. Best, J.L. Sediment transport and bed morphology at river channel confluences. Sediment. Technol. 1988, 35, 481–498. [Google Scholar] [CrossRef]
  13. Brion, P. Effect of bed discordance on flow dynamics at open channel confluence. J. Hydraul. Eng. 1996, 122, 994–1002. [Google Scholar] [CrossRef]
  14. Bradbrook, K.F.; Lane, S.N.; Richards, K.S.; Biron, P.M.; Roy, A.G. Role of bed discordance at asymmetrical river confluences. J. Hydraul. Eng. 2001, 127, 351–368. [Google Scholar] [CrossRef]
  15. Hsu, C.C.; Lee, W.L. Flow at 90° equal-width open-channel junction. J. Hydraul. Eng. 1998, 124, 186–191. [Google Scholar] [CrossRef]
  16. Ettema, R. Laboratory observations of ice jams at channel confluences. J. Cold Reg. Eng. 2001, 15, 34–58. [Google Scholar] [CrossRef]
  17. Huang, J.; Weber, L.J.; Lai, Y.G. Three-dimensional numerical simulation of flow in an open-channel junction. J. Hydraul. Eng. 2002, 3, 25–33. [Google Scholar] [CrossRef]
  18. Guillen, L.S.; Franca, M.J.; Cardoso, A.H.; Schleiss, A.J. Hydro-morphodynamic evolution in a 90 degrees movable bed discordant confluence with low discharge ratio. Earth Surf. Proc. Land. 2015, 40, 1927–1938. [Google Scholar] [CrossRef]
  19. Chen, L.; Singh, V.P. Entropy-based derivation of generalized distributions for hydrometeorological frequency analysis. J. Hydrol. 2018, 557, 699–712. [Google Scholar] [CrossRef]
  20. Pahar, G.; Dhar, A. Coupled incompressible Smoothed Particle Hydrodynamics model for continuum-based modelling sediment transport. Adv. Water Resour. 2017, 102, 84–98. [Google Scholar] [CrossRef]
  21. She, D.X.; Shao, Q.X.; Xia, J.; Taylord, J.A.; Zhang, Y.Y.; Zhang, L.P.; Zhang, X.; Zou, L. Investigating the variation and non-stationarity in precipitation extremes based on the concept of event-based extreme precipitation. J. Hydrol. 2015, 530, 785–798. [Google Scholar] [CrossRef] [Green Version]
  22. Changjiang Hydrology Home Page. Available online: http://www.cjh.com.cn/en/ (accessed on 25 October 2017).
  23. Changjiang Water Resources Commission (CWRC, Ministry of Water Resources, China). Hydrological Records of the Yangtze River; Cyclopedia Press of China: Beijing, China, 2012; pp. 1–19. (In Chinese)
  24. Danish Hydraulic Institute. A Modeling System for Rivers and Channels, MIKE11 Reference Manual; Danish Hydraulic Institute: Hørsholm, Denmark, 2009. [Google Scholar]
  25. Abbott, M.B.; Lonescu, F. On the numerical computation of nearly horizontal flows. J. Hydraul. Res. 1967, 5, 97–117. [Google Scholar] [CrossRef]
  26. Norbiato, D.; Borga, M. Analysis of hysteretic behavior of a hillslope-storage kinematic wave model for subsurface flow. Adv. Water Resour. 2008, 31, 118–131. [Google Scholar] [CrossRef]
  27. Cunge, J.A. On the subject of a flood propagation computation method (Musklngum method). J. Hydraul. Res. 1969, 7, 205–230. [Google Scholar] [CrossRef]
  28. McCuen, R.H.; Knight, Z.; Cutter, A.G. Evaluation of the Nash-Sutcliffe efficiency index. J. Hydrol. Eng. 2006, 11, 597–602. [Google Scholar] [CrossRef]
  29. Chen, L.; Singh, V.P.; Huang, K. Bayesian technique for the selection of probability distributions for frequency analyses of hydrometeorological extremes. Entropy 2018, 20, 117. [Google Scholar] [CrossRef]
  30. Walker, J.P.; Willgoose, G.R. On the effect of digital elevation model accuracy on hydrology and geomorphology. Water Resour. Res. 1999, 35, 2259–2268. [Google Scholar] [CrossRef] [Green Version]
  31. Lu, G.B.; Wang, J.; Li, Q.F.; Zhao, J.H.; Yu, M.X.; Cai, T.; Bai, X.; Xie, W. Impacts of Danjiangkou reservoir on sediment regime of the Hanjiang River. Hydrol. Res. 2012, 43, 64–72. [Google Scholar] [CrossRef]
  32. Zhang, J.H.; Zhang, W.; Yu, M.H.; Chen, L. Study on the mechanism of riverbank collapses in the middle-lower Han River, China. Taiwan Water Conser. 2015, 63, 104–115. [Google Scholar]
  33. Yang, Z.J.; Liu, D.F.; Ji, D.B.; Xiao, S.B. Influence of the impounding process of the Three Gorges Reservoir up to water level 172.5 m on water eutrophication in the Xiangxi Bay. Sci. China Technol. Sci. 2010, 53, 1114–1125. [Google Scholar] [CrossRef]
  34. Wang, L.S.; Huang, C.C.; Pang, J.L.; Zha, X.C.; Zhou, Y.L. Paleofloods recorded by slackwater deposits in the upper reaches of the Hanjiang River valley, middle Yangtze River basin, China. J. Hydrol. 2014, 519, 1249–1256. [Google Scholar] [CrossRef]
Figure 1. Location of the study region and the gauging stations.
Water 10 01670 g001
Figure 2. Monthly average inflow and outflow volumes of the TGR from 2005 to 2011.
Water 10 01670 g002
Figure 3. Calibration and validation results of water level at the different gauging stations along the lower Han River channels. The flow processes in 2007 is used for model calibration and the one in 2005 is for model validation.
Water 10 01670 g003
Figure 4. Calibration and validation results of flow processes at the Xiantao station in 2007 and 2005.
Water 10 01670 g004
Figure 5. Monthly average stage differences at the gauging stations in the lower Han River with and without the TGR operation from January 2008 to December 2011. The positive stage difference at the gauging stations indicates the natural stage without the TGR is lower than the one under the flow regulation of the TGR and vice versa.
Water 10 01670 g005
Figure 6. Monthly average flow differences at the gauging stations along the lower Han River between the natural processes and the processes under the flow regulation of the TGR from 2008 to 2011. The QFR and QNP denote the flow discharge at the gauging stations with and without the influence of TGR operation.
Water 10 01670 g006
Figure 7. Stage-discharge relationships at the Zekou and Xiantao stations with and without the TGR from November 2008 to October 2010. h J ¯ and Q J ¯ are the 5-day moving average stage and flow respectively.
Water 10 01670 g007
Figure 8. The monthly average hydraulic gradient at the different gauging stations with and without the TGR. The shaded area denotes the monthly minimum and maximum hydraulic gradient.
Water 10 01670 g008
Figure 9. Comparison of the monthly average current speed between the natural processes and the processes under the TGR operation at the different gauging stations along the lower Han River. The positive velocity differences indicate the velocities at the gauging stations are smaller than the ones of the natural processes and vice versa.
Water 10 01670 g009
Figure 10. Stage-discharge relationship at the Xiantao Hydrological station under different water level of the Yangtze River.
Water 10 01670 g010
Figure 11. Relationship between the discharge ratio and hydraulic gradient near the Han River estuary during the different scheduling periods of the TGR. η denotes the discharge ratio and J is the hydraulic gradient at the gauging stations.
Water 10 01670 g011
Table 1. The detailed information of gauging stations in the river system.
Series No.Station NameLocationWatershed Area (km2)Parameters Gauged
LongitudeLatitudeAltitude (m)
1Xiangyang112°09′ E32°01′ N66.45103,261water level, discharge
2Huangzhuang112°33′ E31°11′ N45.11142,056
3Shayang112°35′ E30°42′ N41.45144,219
4Xiantao113°26′ E30°22′ N34.14144,683
5Hankou114°19′ E30°37′ N26.521,488,036
6Yicheng112°17′ E31°43′ N53.64103,815water level
7Zekou112°50′ E30°29′ N36.58144,535
8Yuekou113°01′ E30°31′ N36.12144,596
9Hanchuan113°50′ E30°38′ N30.48148,529
Table 2. Model evaluation results in calibration and validation periods.
ItemsGauging StationsCalibration (2007)Validation (2005)
NSERMSERNSERMSER
Water leverZekou0.97440.0110.01020.98680.00420.0019
Yuekou0.99770.0040.0030.99770.00420.0018
Xiantao0.99850.00410.00290.99890.00340.0016
Hanchuan0.99870.0060.00380.99370.01000.0062
DischargeXiantao0.99170.00810.05980.99080.00630.0551
Table 3. Hysteretic relationships between the river flow and the stage at the gauging stations.
Hydrological PeriodsGauging Stations
ZekouYuekouXiantaoHanchuan
November–next April0.1340.1370.1390.144
0.153 *0.161 *0.165 *0.169 *
May–June0.2770.2820.2870.294
0.280 *0.284 *0.292 *0.298 *
July–August0.1540.1590.1850.184
0.143 *0.151 *0.169 *0.173 *
September–October0.1450.1490.1530.155
0.139 *0.142 *0.146 *0.147 *
Note: The data with the asterisks (*) denote the calculated results from the natural processes.

