Assessment of Siltation Processes of the Koronowski Reservoir in the Northern Polish Lowland Based on Bathymetry and Empirical Formulas


Abstract
:1. Introduction
2. Materials and Methods
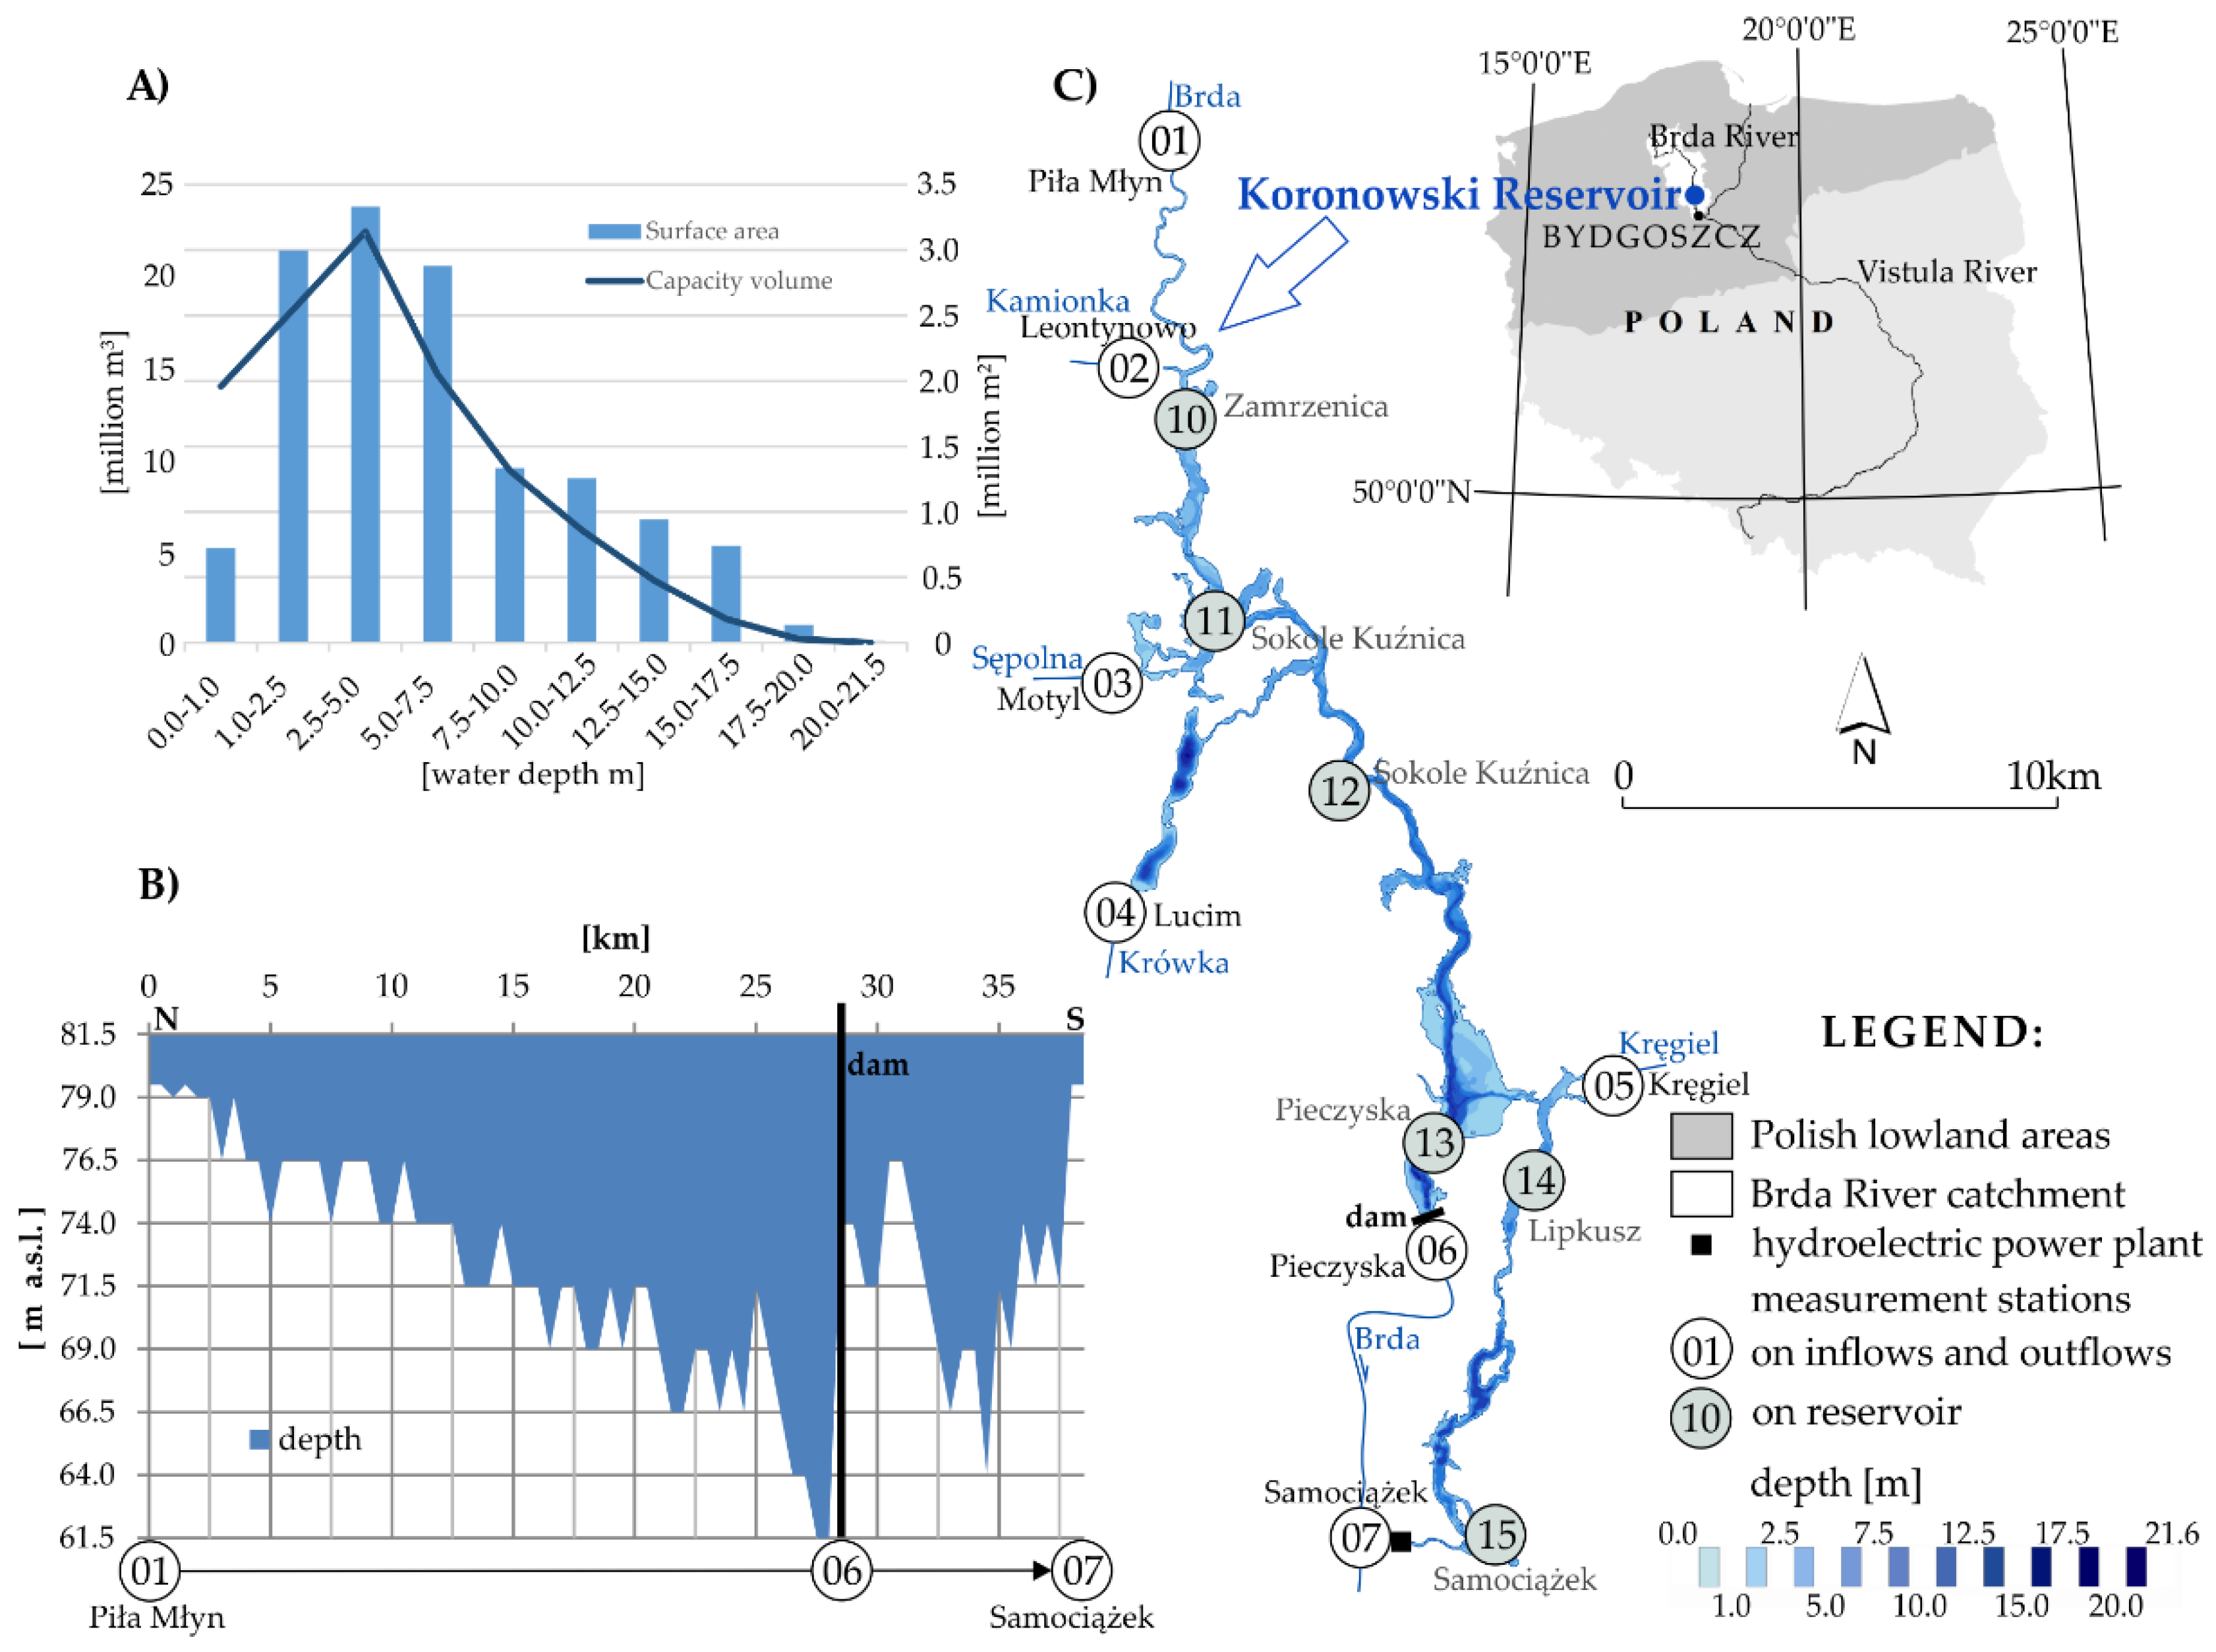
2.1. Study Area
2.2. Hydrological Data
2.3. Suspended Sediment Data
2.4. Batyhymetric Measurements
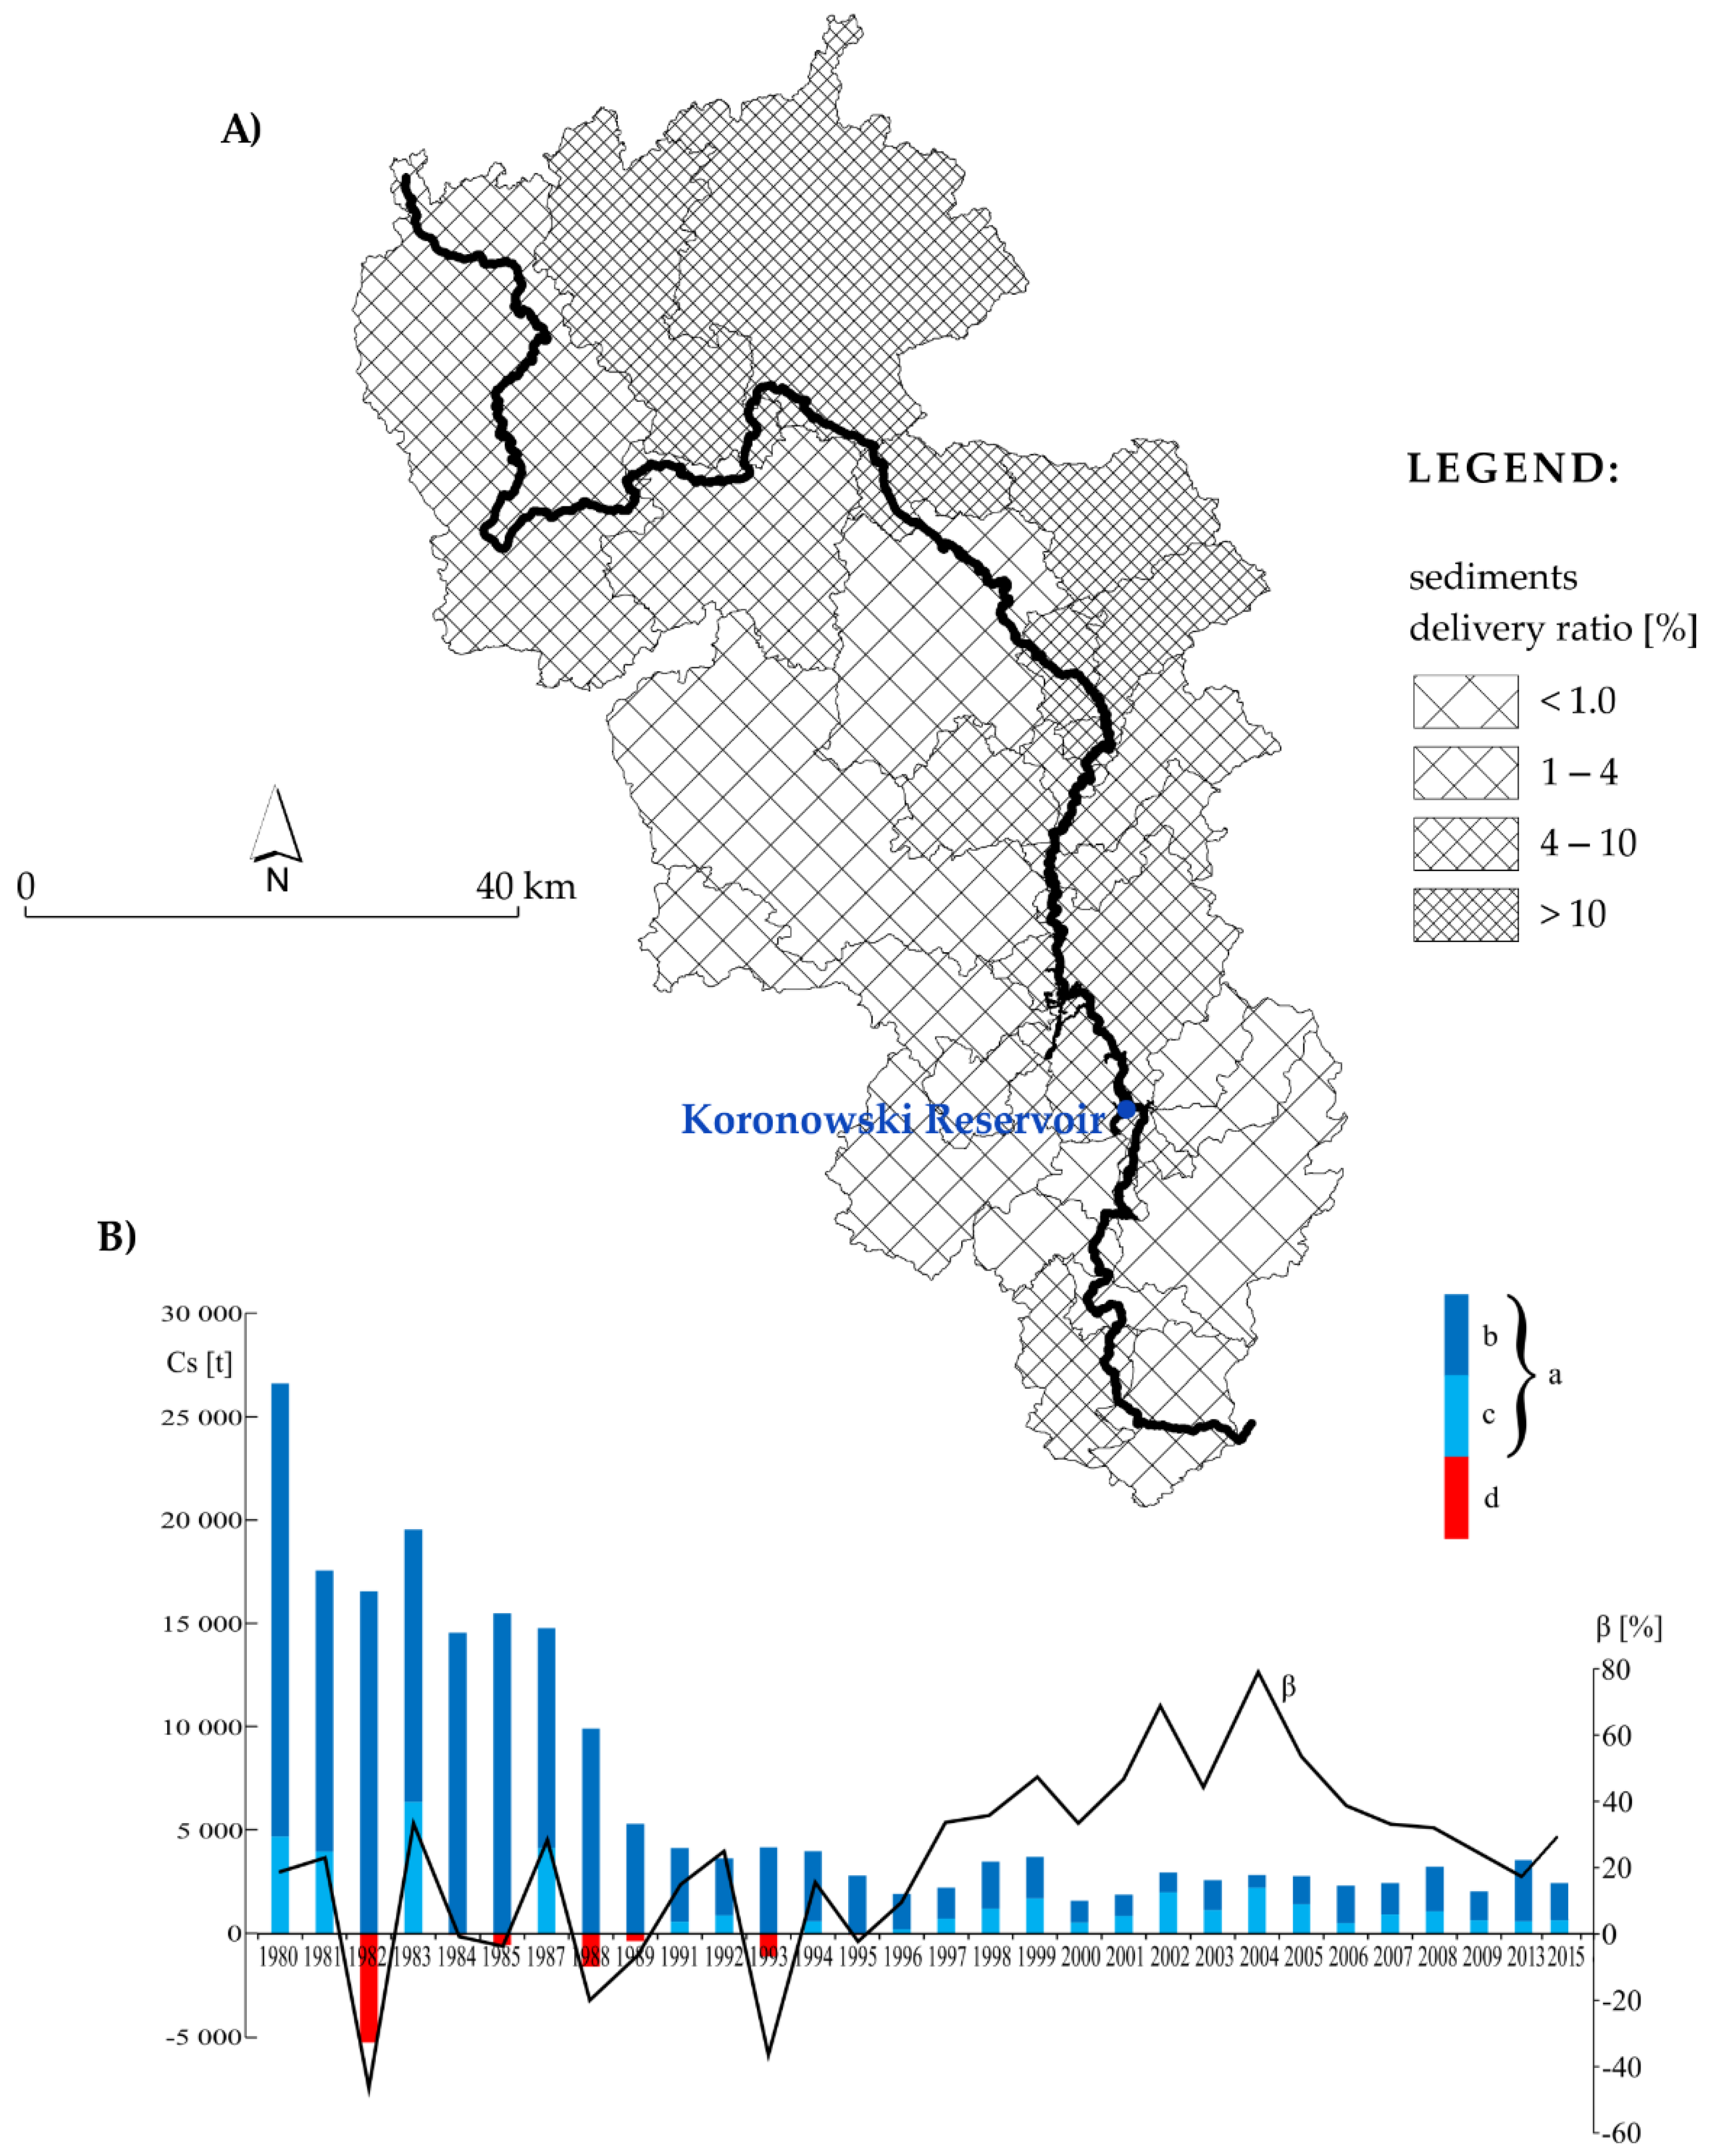
2.5. Soil Erosion and Sediment Delivery
3. Results
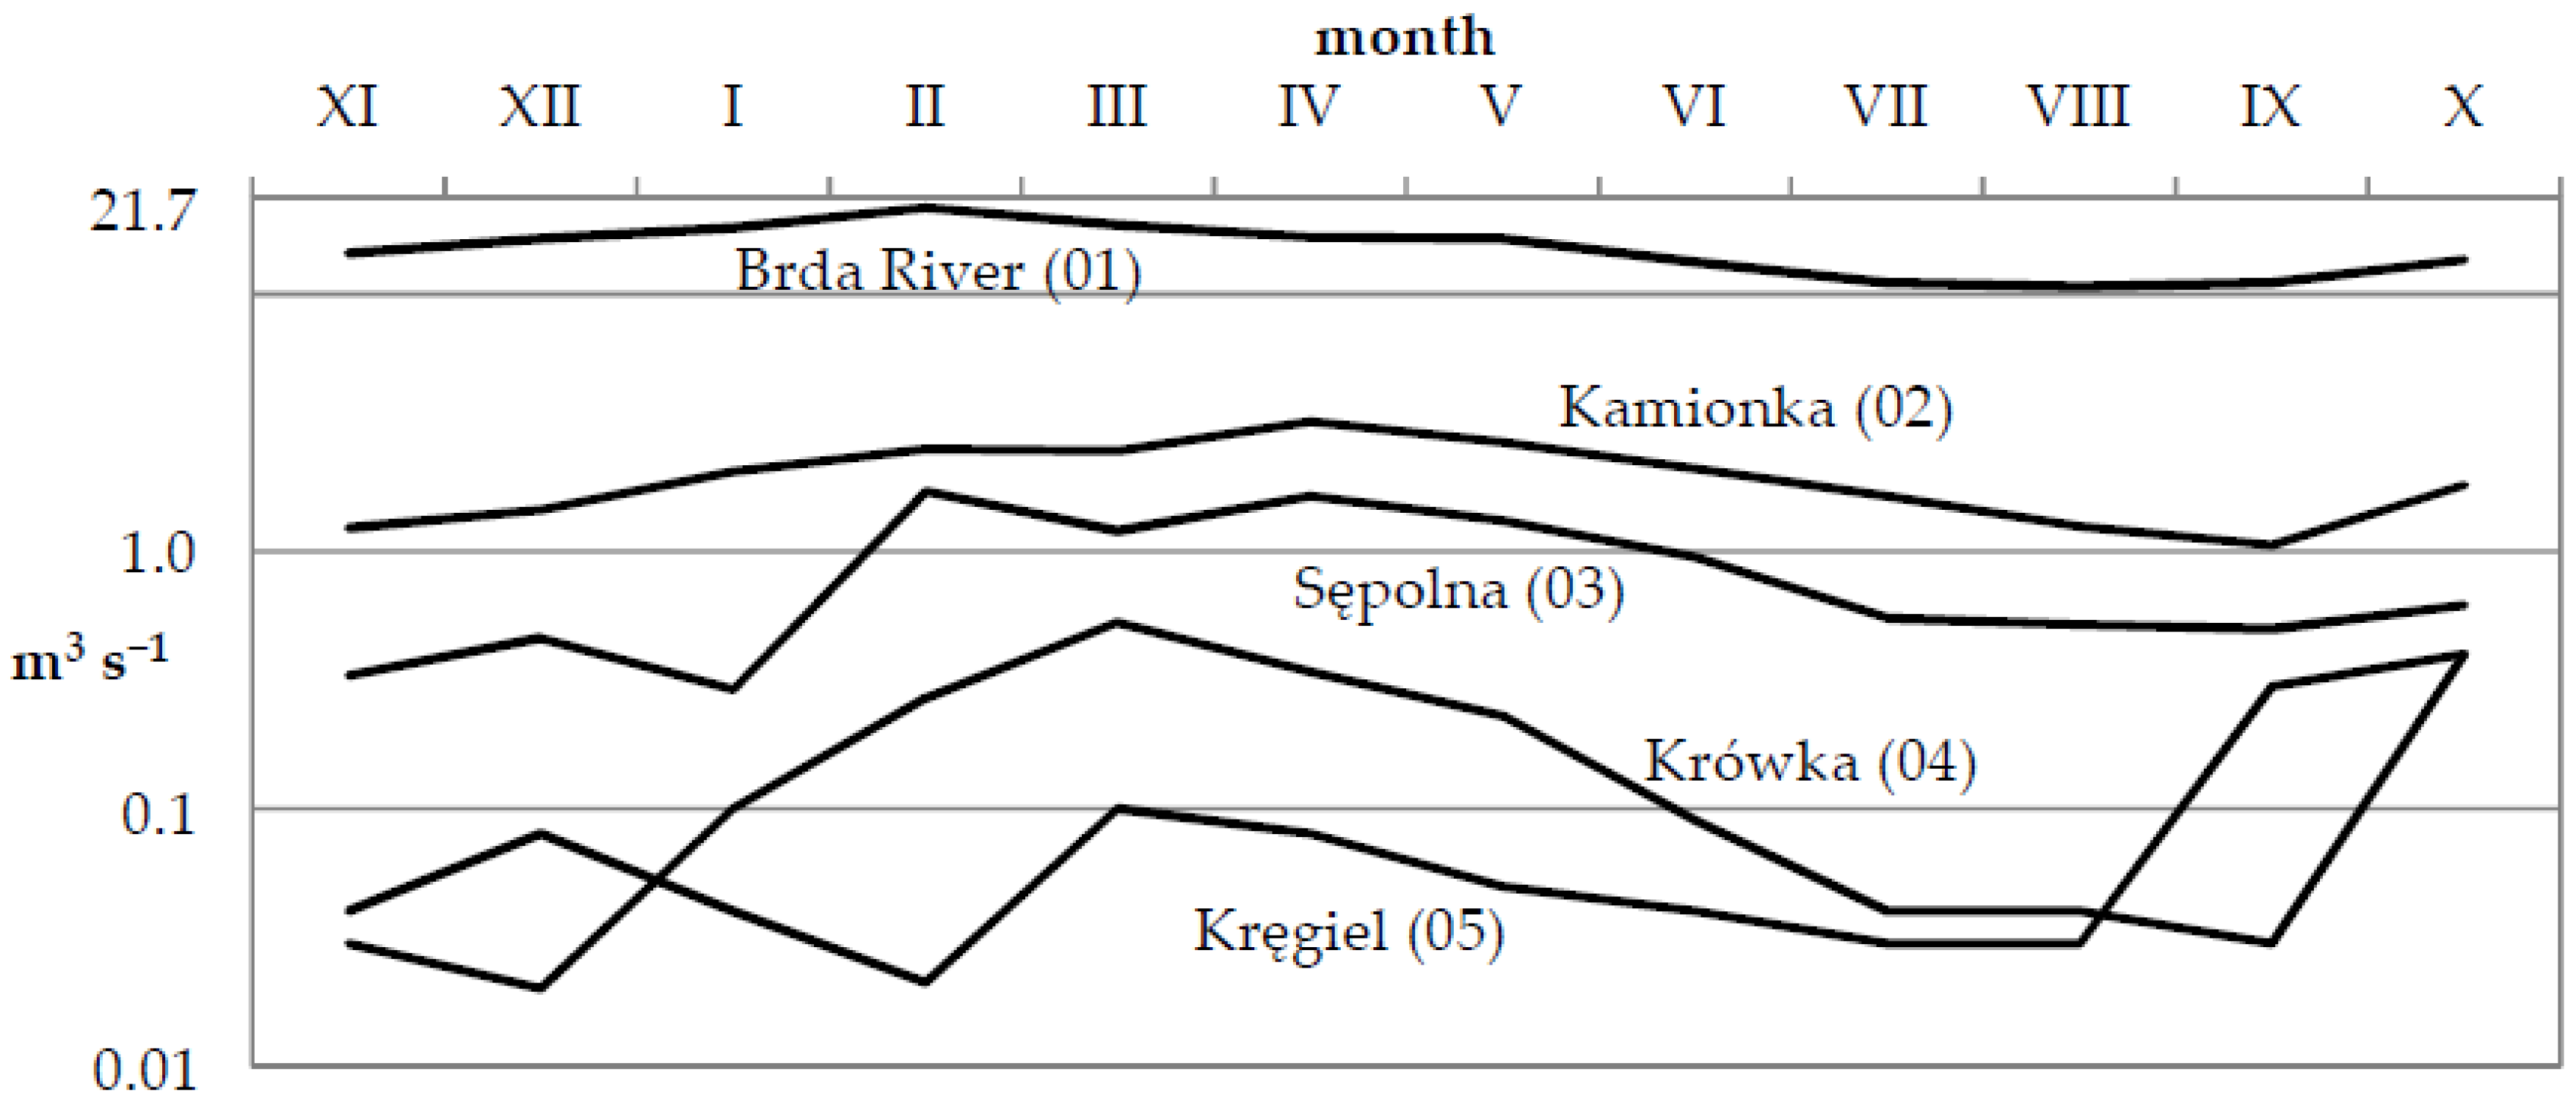
3.1. Discharge
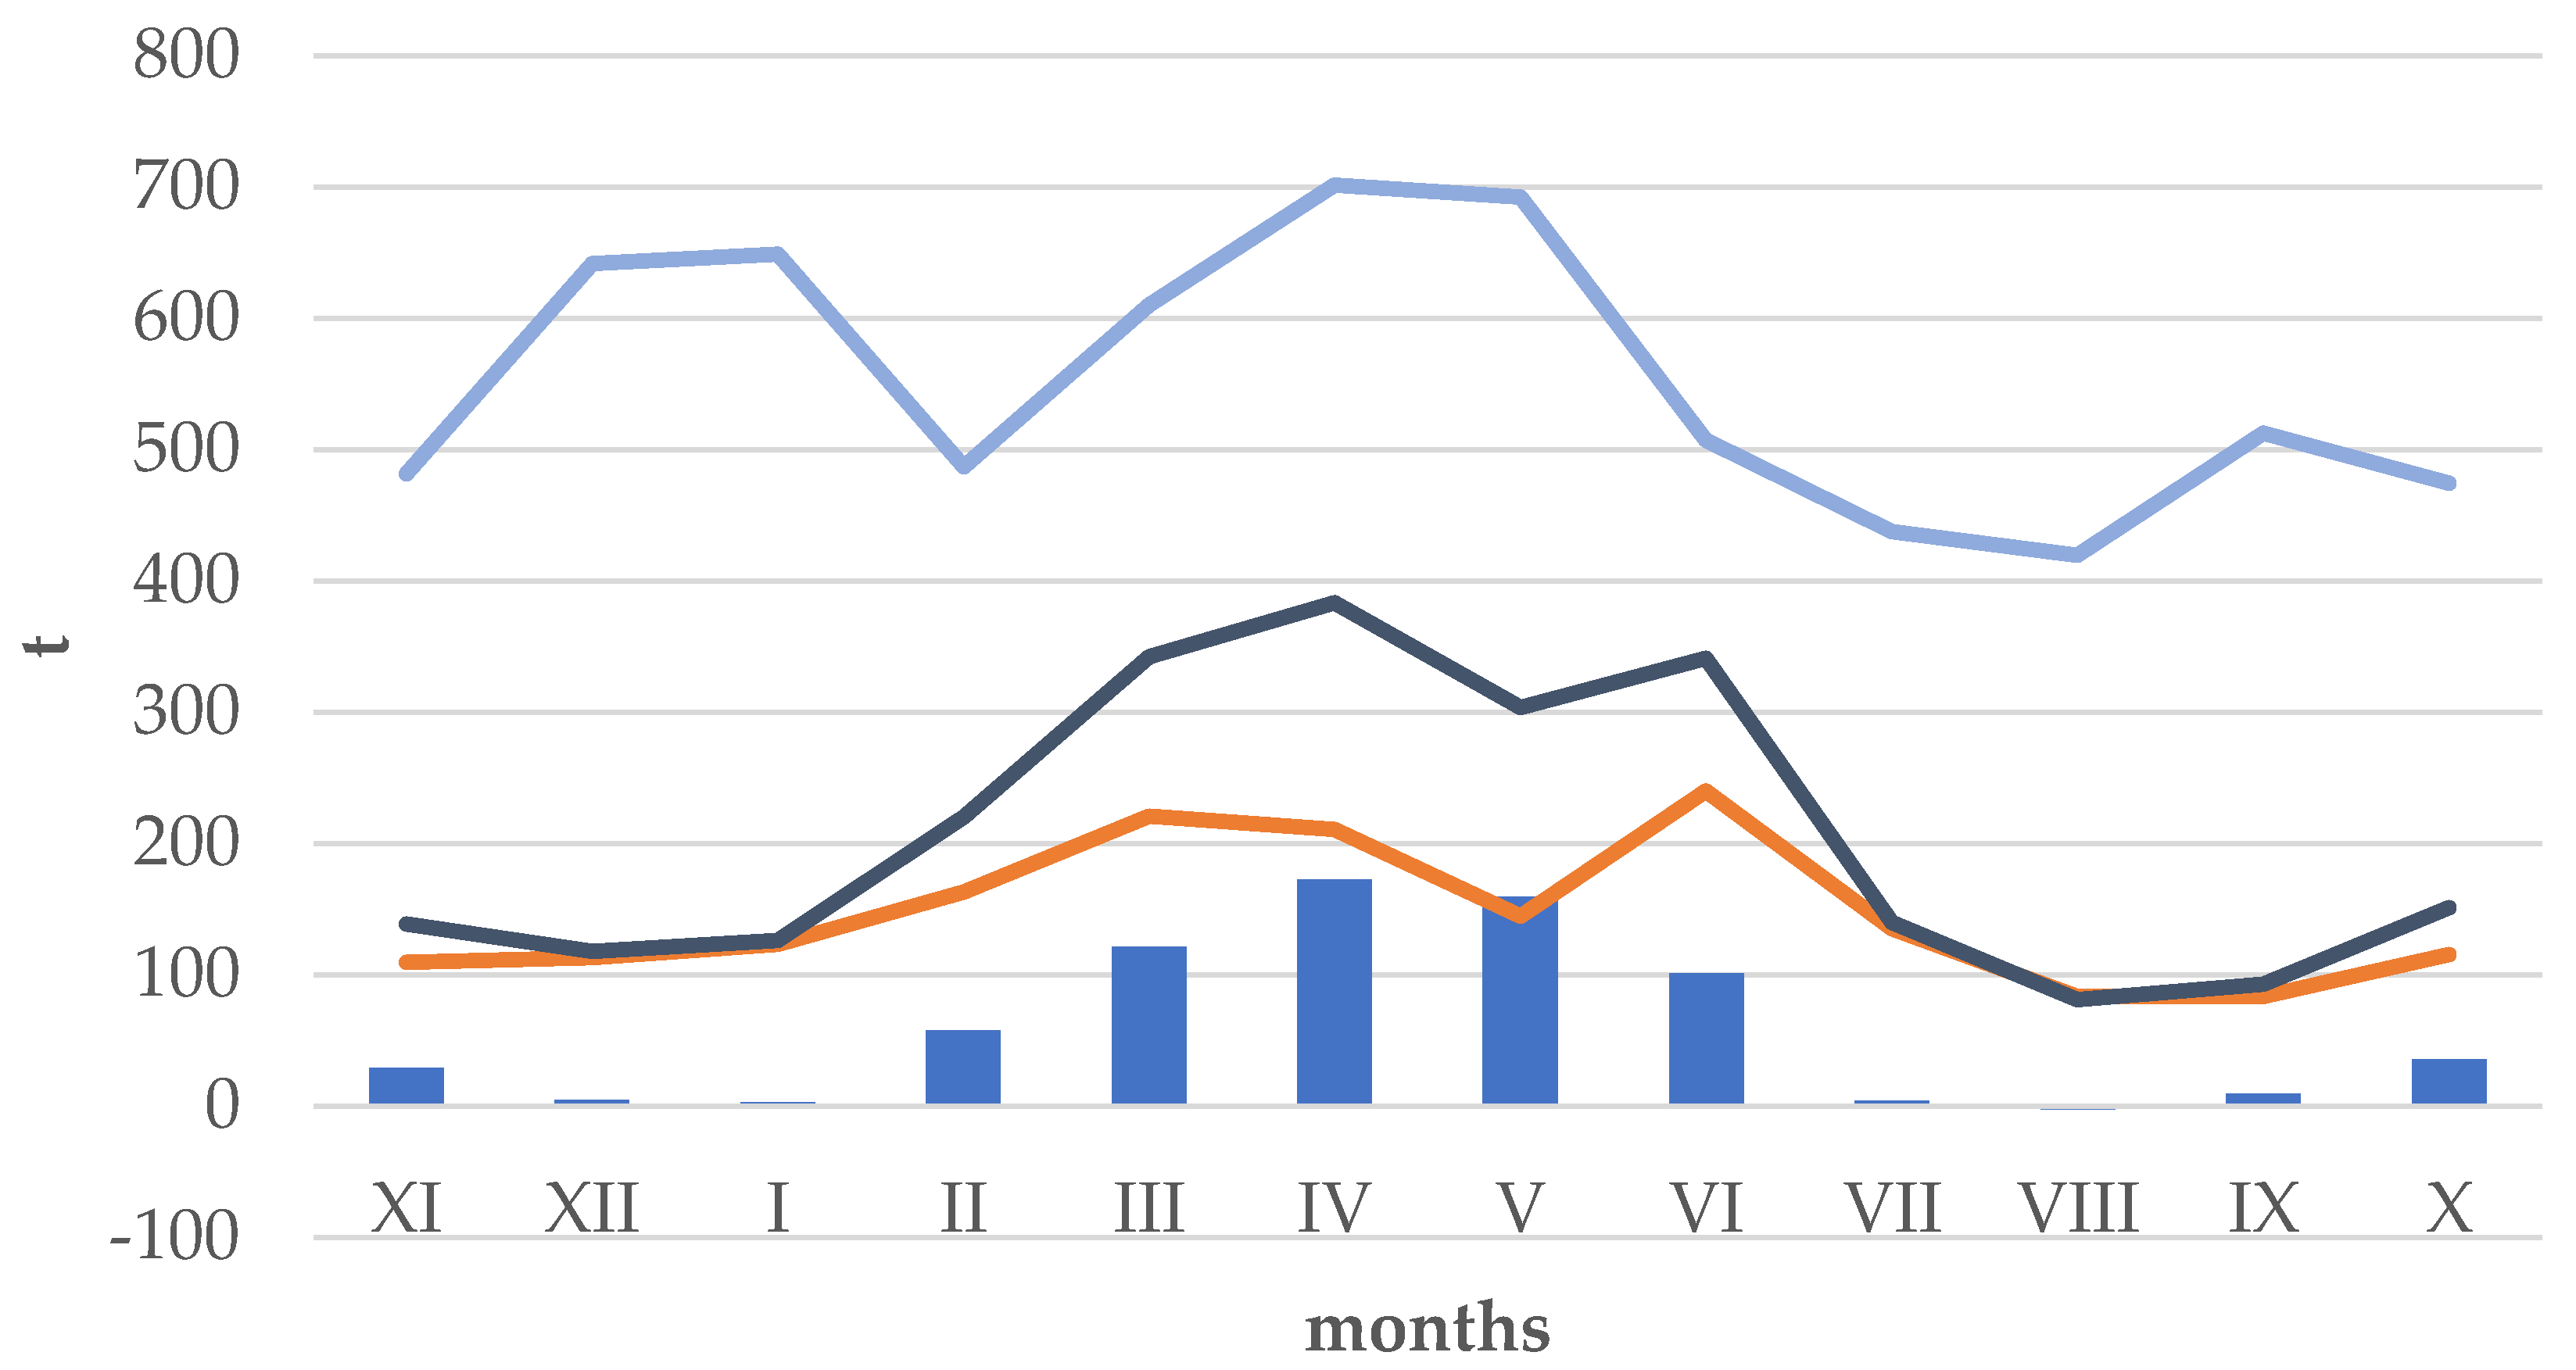
3.2. Sediment Distribution
3.3. Capacity of Koronowski Reservoir
4. Discussion
5. Conclusions
Author Contributions
Funding
Acknowledgments
Conflicts of Interest
References
- Syvitski, J.P.M.; Kettner, A.J. Sediment flux and the Anthropocene. Phil. Trans. R. Soc. 2011, 957–975. [Google Scholar] [CrossRef] [PubMed]
- Kondolf, G.M.; Gao, Y.; Annandale, G.; Morris, G.; Jiang, E.; Zhang, J.; Cao, Y.; Carling, P.; Fu, K.; Guo, Q.; et al. Sustainable sediment management in reservoirs and regulated rivers: Experiences from five continents. Earth’s Future 2014, 2, 1–25. [Google Scholar] [CrossRef]
- Van Rijn, L. Sediment Transport. Part III: Bed forms and alluvial roughness. J. Hydraul. Eng. 1984, 110, 1733–1754. [Google Scholar] [CrossRef]
- Kondolf, G.M. Hungry water: Effects of Dams and Gravel Mining on River Channels. Environ. Manag. 1997, 21, 533–551. [Google Scholar] [CrossRef]
- Łajczak, A. Contemporary Transportation and Sedimentation of Suspended Sediments on the Vistula River and Its Tributaries; Monographs of the Water Management Committee of the Polish Academy of Sciences: Warsaw, Poland, 1999; pp. 3–214. [Google Scholar]
- Vörösmarty, C.J.; Meybeck, M.; Fekete, B.; Sharma, K.; Green, P.; Syvitski, J.P.M. Anthropogenic sediment retention: Major global impact from registered river impoundments. Glob. Planet. Chang. 2003, 39, 169–190. [Google Scholar] [CrossRef]
- Shotbolt, L.A.; Thomas, A.D.; Hutchinson, S.M. The use of reservoir sediments as environmental archives of catchment inputs and atmospheric pollution. Prog. Phys. Geogr. 2005, 29, 337–361. [Google Scholar] [CrossRef]
- Babiński, Z. The Influence of Reservoirs on Fluvial Processes of Alluvial Rivers with Particular Regard to the Włocławek” Reservoir; Bydgoszcz Academy Press: Bydgoszcz, Poland, 2002; p. 185. ISBN 83-7096-423-0. [Google Scholar]
- Gierszewski, P. Conditions of suspended solids transport in the Włocławek Reservoir based on its composition and texture analysis. Nauka Przyroda Technol. 2007, 2, 1–18. Available online: https://www.npt.up-poznan.net/pub/art_1_18.pdf (accessed on 10 June 2016).
- Hu, B.; Yang, Z.; Wang, H.; Sun, X.; Bi, N.; Li, G. Sedimentation in the Three Gorges Dam and the future trend of Changjiang (Yangtze River) sediment flux to the sea. Hydrol. Earth Syst. Sci. 2009, 13, 2253–2264. [Google Scholar] [CrossRef] [Green Version]
- Magnuszewski, A.; Moran, S.; Yu, G. Modelling lowland reservoir sedimentation conditions and the potential environmental consequences of dam removal: Wloclawek Reservoir, Vistula River, Poland. In Proceedings of the Sediment Dynamics for a Changing Future, Warsaw, Poland, 14–18 June 2010; IAHS: Warsaw, Poland, 2010; pp. 345–352. [Google Scholar]
- Habel, M.; Babiński, Z. A comparison of research approaches in estimation of volume changes of a bed load transport along a river course on the example of a large lowland river. In Proceedings of the 13th International Conference of Computational Methods in Sciences and Engineering, Thessaloniki, Greece, 21–25 April 2017; AIP: Melville, NY, USA, 2017; p. 170009. [Google Scholar] [CrossRef]
- Szatten, D. The Influence of Human Activities on the Fluvial Processes of Lower Part of the Brda River. Ph.D. Thesis, Institute of Geography and Spatial Organization Polish Academy of Sciences, Warsaw, Poland, 31 May 2017. [Google Scholar]
- The Polish Energy Strategy. The Announcement of the Minister of Economy of Poland on the State Energy Policy Until 2030. Available online: http://prawo.sejm.gov.pl/isap.nsf/DocDetails.xsp?id=WMP20100020011 (accessed on 8 January 2016).
- Syvitski, J.P.M.; Kettner, A.J.; Overeem, I.; Hutton, E.W.; Hannon, M.T.; Brakenridge, G.R.; Day, J.; Vörösmarty, C.J.; Saito, Y.; Giosan, L.; Nicholls, R.J. Sinking deltas due to human activities. Nat. Geosci. 2009, 2, 681–686. [Google Scholar] [CrossRef] [Green Version]
- Habel, M. Dynamics of the Vistula River Channel Deformations Downstream of Włocławek Reservoir; Kazimierz Wielki University Press: Bydgoszcz, Poland, 2013; p. 142. ISBN 978-83-7096-984-4. [Google Scholar]
- Wischmeier, W.H.; Smith, D.D. Predicting Rainfall Erosion Losses: A Guide to Conservation Planning; Agriculture Handbook No. 537; USDA: Washington, DC, USA, 1978; p. 66. Available online: https://naldc.nal.usda.gov/download/CAT79706928/PDF (accessed on 7 November 2018).
- Friedrich, M. Koronowski Reservoir. Map for Boaters and Tourists; Institute of Meteorology and Water Management: Warsaw, Poland, 1990. [Google Scholar]
- Kondracki, J. Regional Geography of Poland; Polish Scientific Publishers: Warszawa, Poland, 2000; p. 440. ISBN 83-01-13050-4. [Google Scholar]
- Szatten, D. Proposal of new hydromorphometric divisions of Koronowski Reservoir. Geogr. Tourism 2016, 4, 79–84. [Google Scholar] [CrossRef]
- Ambrożewski, Z.J. 50-th Years of Reservoir and Hydropower plant Koronowo. Gospodarka Wodna 2011, 12, 512–519. Available online: http://www.sigma-not.pl/publikacja-64375-50-lat-zbiornika-i-elektrowni-wodnej-koronowo-gospodarka-wodna-2011-12.html (accessed on 17 March 2017).
- Łubiński, M. Technical Project of the Reservoir for the Hydroelectric Power Plant KORONOWO. PN-15; Office of Hydroelectric Stations Projects: Warsaw, Poland, 1957; p. 110. [Google Scholar]
- Map of the Polish Hydrographic Division; Department of Hydrography and Morphology of River Channels Institute of Meteorology and Water Management. Available online: http://mapa.kzgw.gov.pl/ (accessed on 10 December 2016).
- Hydropower Plant Koronowo. Data Set of inflow (Outflow) of Water to (from) Koronowski Reservoir 1962–2015. Unpublished work. 2015. [Google Scholar]
- Szatten, D.; Habel, M.; Pellegrini, L.; Maerker, M. Data Set of Monthly Values of Total Suspension, Turbidity and Flow Rate for Measurement Stations 01–07, 10–15. Unpublished work. 2015. [Google Scholar]
- Jutrowska, E. Anthropogenic Transformation of Water Conditions in the Brda River Basin; Environmental Monitoring Library Press: Bydgoszcz, Poland, 2007; p. 128. ISBN 978-83-7217-286-0. [Google Scholar]
- CORINE Land Cover 2006; Chief Inspectorate for Environmental Protection & Institute of Geodesy and Cartography. Available online: http://clc.gios.gov.pl/ (accessed on 6 April 2017).
- Allan, D.; Erickson, D.; Fay, J. The influence of catchment land use on stream integrity across multiple spatial scales. Freshw. Biol. 1997, 37, 149–161. [Google Scholar] [CrossRef]
- Ciupa, T. The Impact of Land Use on Runoff and Fluvial Transport in Small River Catchments Based on the Sufraganiec and Silnica Rivers; Jan Kochanowski University Press: Kielce, Poland, 2009; p. 251. ISBN 978-83-7133-409-2. [Google Scholar]
- Pasławski, Z. River Hydrometric Methods; Communication and Communications Press: Warsaw, Poland, 1973; p. 338. [Google Scholar]
- Edwards, T.; Glysson, D. Field Methods for Measurement of Fluvial Sediment, Book 3(C2); U.S. Geological Survey: Reston, VA, USA, 1999; pp. 1–87. ISBN 0-607-89738-4.
- Wren, D.; Barkdoll, B.; Kuhnle, R.; Derrow, R. Field Techniques for Suspended-Sediment Measurement. J. Hydraul. Eng. 2000, 126, 97–104. [Google Scholar] [CrossRef]
- Felix, D.; Albayrak, I.; Abgottspon, A.; Boes, R.M. Real-time measurements of suspended sediment concentration and particle size using five techniques. In Proceedings of the 28th IAHR Symposium on Hydraulic Machinery and Systems, Grenoble, France, 4–8 July 2016; IOP Conference Series: Earth and Environmental Science; pp. 1057–1066. [Google Scholar] [CrossRef]
- Goncarov, V.N. The Dynamics of Riverbeds; Gidrometeoizdat: Moscow, Russia, 1962. [Google Scholar]
- Wiśniewski, B.; Kutrowski, M. Special Construction of Water Management. Artificial Reservoirs. Forecasting of Silting; Studies The Office of Studies and Projects of Hydroengineering: Warsaw, Poland, 1973; p. 5. [Google Scholar]
- Bodulski, J.; Górski, J. Evaluation and prediction of silting in reservoir Cedzyna on the Lubrzanka River. J. Water Land Dev. 2006, 10, 133–149. [Google Scholar] [CrossRef]
- Madeyski, M.; Michalec, B.; Tarnawski, M. Silting of small water reservoirs and quality of sediments. Infrastruct. Ecol. Rural Areas 2008, 11, 24–40. Available online: http://agro.icm.edu.pl/agro/element/bwmeta1.element.dl-catalog-3475dbbd-4af4-4d72-b062-94a800c9415f/c/a_15393.pdf (accessed on 10 October 2018).
- Bąk, Ł.; Dąbkowski, S.; Górski, J. Method of predicting siltation of a water reservoir based on measurements of its capacity. Water Environ. Rural Areas 2011, 11, 19–29. Available online: http://www.itp.edu.pl/wydawnictwo/woda/zeszyt_36_2011/artykuly/Bak%20i%20in.pdf (accessed on 10 October 2018).
- Giriat, D.; Gorczyca, E.; Sobucki, M. Beaver ponds’ impact on fluvial processes (Beskid Niski Mts., SE Poland). Sci. Total Environ. 2016, 339–353. [Google Scholar] [CrossRef] [PubMed]
- Łajczak, A. Modelling the long-term course of non-flushed reservoir sedimentation and estimating the life of dams. Earth Surf. Processes Landf. 1996, 21, 1091–1107. [Google Scholar] [CrossRef]
- Kloze, J.; Sieinski, E. Siltation of Polish retention reservoirs. Diagnosis of the conditions and solutions. In Sustainable Management of Water Resources and Hydrotechnical Infrastructure in the Light of the Forecasted Climate Changes; Majewski, W., Walczykiewicz, T., Eds.; Institute of Meteorology and Water Management: Warsaw, Poland, 2012; Volume 4, pp. 161–188. ISBN 978-83-61102-68-7. [Google Scholar]
- Stonawski, J. Hydrological and Physiographic Criteria in the Prognosis of Siltation of Reservoirs in the Upper Vistula Basin. Ph.D. Thesis, Cracow University of Technology, Cracow, Poland, 1993. [Google Scholar]
- Michalec, B.; Tarnawski, M. The influence of small water reservoir operational changes on capacity reduction. Environ. Prot. Eng. 2008, 34, 117–124. Available online: http://bwmeta1.element.baztech-article-BPW8-0007-0014 (accessed on 8 November 2018).
- Institute of Meteorology and Water Management in Warsaw. Data Set of Monthly Rainfalls on Tuchola Station 1990–2000. Available online: https://danepubliczne.imgw.pl/ (accessed on 31 January 2013).
- Musierowicz, A. Soil Map of Poland; 1:300,000; Institute of Soil Science and Plant Cultivation: Puławy, Poland, 1973. [Google Scholar]
- Institute of Geodesy and Cartography. Digital Elevation Model Data. Available online: http://geoportal.gov.pl/ (accessed on 31 January 2013).
- The Voivodship Inspectorate for Environmental Protection in Bydgoszcz. Data Set of Monthly Values of Total Suspension for Measurement Stations of Brda River: Piła Młyn (km 75.0) and Samociążek (km 40.1) 1980–2013. Unpublished work. 2015. [Google Scholar]
- Jutrowska, E.; Goszczyński, J. The Koronowski Reservoir; Environmental Monitoring Library Press: Bydgoszcz, Poland, 1998; p. 140. ISBN 83-7217-043-6. [Google Scholar]
- Florek, W.; Jonczak, J.; Princ, C. The impact of snow-melt-rain flood on runoff denudation from small lowland catchments (on example of left-bank tributaries of the Lower Wieprza River). Baltic Coast. Zone J. Ecol. Prot. Coastline 2009, 13, 67–78. Available online: http://yadda.icm.edu.pl/yadda/element/bwmeta1.element.agro-cc09d93f-6d0e-4d22-baeb-7a99c3aba0e7/c/067_078_Florek.pdf (accessed on 31 October 2018).
- Choiński, A. Diversity and Conditions of Flows Variability of Polish Rivers; Adam Mickiewicz University Press: Poznań, Poland, 1988; p. 99. ISBN 83-23-20116-1. [Google Scholar]
- Zwoliński, Z. Geomorphic Adjustment of the Parsęta Channel to the Present-Day River Regime; Polish Academy of Sciences: Warsaw, Poland, 1989; p. 143. Available online: http://rcin.org.pl/igipz/dlibra/publication/191 (accessed on 7 February 2015).
- Jaworska, M. The Processes of Chemical Erosion and Denudation of Wieprz and Pilica River Basins; Prace Państwowego Instytutu Hydrologiczno-Meteorologicznego: Warsaw, Poland, 1968; pp. 29–47. [Google Scholar]
- Hartung, F. Reasons and preventions of siltation processes of artificial reservoirs. Wasserwirtschaft 1959, 1, 3–13. [Google Scholar]
- Majewski, W.; Walczykiewicz, T. Sustainable Management of Water Resources and Hydrotechnical Infrastructure in the Subject of Expected Climate Changes; Institute of Meteorology and Water Management Press: Warsaw, Poland, 2012; p. 317. ISBN 978-83-61102-68-7. [Google Scholar]
- Walling, D.E.; Fang, D. Recent trends in the suspended sediment loads of the world’s rivers. Glob. Planet. Chang. 2003, 39, 111–126. [Google Scholar] [CrossRef]
- Łajczak, A. Accumulation of Sediments in Reservoirs of Carpathian Parts of Vistula River Basin; Czasopismo Geograficzne: Warsaw, Poland, 1986; Volume 1, pp. 47–77. [Google Scholar]
- Wojtasik, M.; Szatten, D. The balance of sediment supply by water erosion determined by USLE model on the catchment of Brda river. J. Health Sci. 2014, 4, pp. 61–70. Available online: https://repozytorium.ukw.edu.pl/bitstream/handle/item/1176/Bilans%20dostawy%20rumowiska%20w%20wyniku%20erozji%20wodnej%20dla%20zlewni%20rzeki%20Brdy.pdf?sequence=1&isAllowed=y (accessed on 18 August 2015).
- Marszalewski, W.; Piasecki, A. Analysis of the development of wastewater infrastructure in Poland in ecological and economical aspects. Sci. J. SGGW 2014, 11, 127–137. Available online: http://yadda.icm.edu.pl/yadda/element/bwmeta1.element.ekon-element-000171290965 (accessed on 10 August 2018).
- Kiedrzyńska, E.; Jóźwik, A.; Kiedrzyński, M.; Zalewski, M. Hierarchy of factors exerting an impact on nutrient load of the Baltic Sea and sustainable management of its drainage basin. Mar. Pollut. Bull. 2014, 88, 162–173. [Google Scholar] [CrossRef] [PubMed]
- Babiński, Z.; Habel, M. Impact of a single dam on sediment transport continuity in large lowland rivers. In Proceedings of the 13th International Symposium on River Sedimentation, Stuttgart, Germany, 19–22 September 2016; Wieprecht, S., Haun, S., Weber, K., Noack, M., Terheiden, K., Eds.; Taylor & Francis CRP Press: Leiden, The Netherlands, 2016; pp. 975–982. [Google Scholar]
- Urbaniak, M.; Kiedrzyńska, E.; Zalewski, M. The role of a lowland reservoir in the transport of micropollutants, nutrients and the suspended particulate matter along the river continuum. Hydrol. Res. 2012, 43, 400–411. [Google Scholar] [CrossRef]
- Urbaniak, M.; Kiedrzyńska, E.; Zieliński, M.; Tołoczko, W.; Zalewski, M. Spatial distribution of PCDDs/PCDFs and reduction of TEQ concentrations along three large Polish reservoirs. Environ. Sci. Pollut. Res. 2013, 21, 4441–4452. [Google Scholar] [CrossRef] [PubMed]
- Babic-Mladenovic, M.; Kolarov, V.; Damjanovic, V. Sediment regime of the Danube River in Serbia. Int. J. Sediment Res. 2013, 28, 470–485. [Google Scholar] [CrossRef]
- Lewis, J. Turbidity—Controlled sampling for suspended sediment load estimation. In Proceedings of the Workshop: Erosion and Sediment Transport Measurement: Technological and Methodological Advances, Oslo, Norway, 19–20 June 2002; Bogen, J., Tharan, F., Walling, D., Eds.; IAHS-AISH: Oslo, Norway, 2003; pp. 13–20. [Google Scholar]
- Fluvial Sediment Transport: Analytical Techniques for Measuring Sediment Load; No. 1461; IAEA TECDOC: Vienna, Austria, 2005; p. 61. ISBN 92-0-107605-3. Available online: https://www-pub.iaea.org/MTCD/Publications/PDF/te_1461_web.pdf (accessed on 9 March 2018).
- Felix, D.; Albayrak, I.; Boes, R.M. Laboratory investigation on measuring suspended sediment by portable laser diffractometer (LISST) focusing on particle shape. Geo-Mar. Lett. 2013, 33, 485–498. [Google Scholar] [CrossRef]
- Haimann, M.; Liedermann, M.; Lalk, P.; Habersack, H. An integrated suspended sediment transport monitoring and analysis concept. Int. J. Sediment Res. 2014, 29, 135–148. [Google Scholar] [CrossRef]
- Szewrański, S.; Żmuda, R.; Wawer, R. Evaluation of the severity of water erosion and unit denudation using nephelometric measurement of water turbidity. Pamiętnik Puławski 2005, 139, 245–256. Available online: http://www.iung.pulawy.pl/images/wyd/139/Z139_22.pdf (accessed on 9 March 2018).


| Discharge m3 s−1 | River | ||||
|---|---|---|---|---|---|
| Brda River Piła Młyn 01 | Kamionka Leontynowo 02 | Sęplona Motyl 03 | Krówka Lucim 04 | Kręgiel Kregiel 05 | |
| Min | 4.6 | 0.6 | 0.2 | 0.0 | 0.0 |
| Max | 84.4 | 4.4 | 3.0 | 2.5 | 0.4 |
| Av. | 23.7 | 2.3 | 0.9 | 0.5 | 0.1 |
| Value | Stations | |||||
|---|---|---|---|---|---|---|
| Brda River Piła Młyn 01 | Kamionka Leontynowo 02 | Sęplona Motyl 03 | Krówka Lucim 04 | Kręgiel Kregiel 05 | Brda River Samociążek 07 | |
| Min | 2.0/1.29 | 2.4/3.04 | 4.0/3.64 | 1.8/1.36 | 2.0/2.46 | 1.8/1.34 |
| Max | 7.2/5.32 | 10.0/7.47 | 22.0/15.50 | 12.0/14.70 | 10.4/9.96 | 4.0/4.51 |
| Av. | 3.8/2.95 | 5.3/5.05 | 8.0/6.95 | 6.0/5.55 | 5.3/4.70 | 2.6/2.27 |
| Value | Stations | |||||
|---|---|---|---|---|---|---|
| Zamrzenica 10 | Sokole Kuźnica 11 | Sokole Kuźnica 12 | Pieczyska 13 | Lipkusz 14 | Samociążek 15 | |
| Av. | 2.50 | 2.72 | 2.10 | 2.33 | 2.10 | 2.21 |
© 2018 by the authors. Licensee MDPI, Basel, Switzerland. This article is an open access article distributed under the terms and conditions of the Creative Commons Attribution (CC BY) license (http://creativecommons.org/licenses/by/4.0/).
Share and Cite
Szatten, D.; Habel, M.; Pellegrini, L.; Maerker, M. Assessment of Siltation Processes of the Koronowski Reservoir in the Northern Polish Lowland Based on Bathymetry and Empirical Formulas. Water 2018, 10, 1681. https://doi.org/10.3390/w10111681
Szatten D, Habel M, Pellegrini L, Maerker M. Assessment of Siltation Processes of the Koronowski Reservoir in the Northern Polish Lowland Based on Bathymetry and Empirical Formulas. Water. 2018; 10(11):1681. https://doi.org/10.3390/w10111681
Chicago/Turabian StyleSzatten, Dawid, Michał Habel, Luisa Pellegrini, and Michael Maerker. 2018. "Assessment of Siltation Processes of the Koronowski Reservoir in the Northern Polish Lowland Based on Bathymetry and Empirical Formulas" Water 10, no. 11: 1681. https://doi.org/10.3390/w10111681