Does Mussel Farming Promote Cost Savings and Equity in Reaching Nutrient Targets for the Baltic Sea?


Department of Economics, Swedish University of Agricultural Sciences, 750 07 Uppsala, Sweden
*
Author to whom correspondence should be addressed.
Water 2018, 10(11), 1682; https://doi.org/10.3390/w10111682
Submission received: 5 October 2018
/
Revised: 12 November 2018
/
Accepted: 15 November 2018
/
Published: 18 November 2018
(This article belongs to the Section Water Resources Management, Policy and Governance)
Abstract
:Mussel farming has been suggested as a low-cost option for reducing nutrient content in eutrophied waters. This study examines whether mussel farming contributes to reductions in total nutrient abatement cost and increases in equity for achieving nutrient load reduction targets to the Baltic Sea under different international policy regimes (cost-effective, country targets set by the Baltic Sea Action Plan (BSAP), and nutrient-trading markets). A cost-minimizing model is used to calculate the cost savings, and the analytical results show that mussel farming is a cost-effective option only when the marginal abatement cost is lower than for other abatement measures. The numerical cost-minimizing model of the Baltic Sea indicates that the largest abatement cost reductions from introduction mussel farming, approximately 3.5 billion SEK (9.36 SEK = 1 Euro), are obtained under the cost-effective and nutrient-trading systems. Equity, as measured by abatement cost in relation to affordability in terms of gross domestic product, is improved by mussel farming under the cost-effective regime but reduced under the BSAP country targets and nutrient-trading regimes.
1. Introduction
Excess anthropogenic nutrient loads to aquatic ecosystems have caused damage from eutrophication worldwide [1,2]. Eutrophication requires abatement solutions to reduce the proliferation of harmful algal blooms and “dead zones” in coastal marine ecosystems [3]. The Baltic Sea contains the largest share of anthropogenic dead zone in the world [3] and the damage from eutrophication in the Sea has been reported in several studies [4,5]. Mussel farming has been suggested as a low-cost option for mitigating damage from eutrophication in the Baltic Sea [6,7,8,9,10].
Mitigation of the damage from eutrophication has been on the agenda for the countries surrounding the Baltic Sea for decades as manifested in several international agreements on nutrient load reductions in order to reach long term ecological targets [11,12,13]. Despite decades of attempts to combat eutrophication, however, there has so far been insufficient progress in total nutrient reduction. One important reason for the difficulties in reducing nutrient loads to the Baltic Sea is by all likelihood associated costs, which now start to increase at a higher rate than earlier because the low-cost options, such as improved nutrient removal at sewage treatment plants, have already been implemented in several countries.
Another reason can be that the nutrient reduction burdens allocated by international agreements are not regarded as fair by involved stakeholders [14]. The importance of cost-effectiveness is recognized in the latest agreement, the Baltic Sea Action Plant (BSAP), but it contains no notions of equity in allocation of cost burdens among countries [13]. Equity, together with cost-effectiveness, is regarded as essential in reaching international environmental agreements [15,16,17,18] and assuring compliance with implemented national regulation [19]. For policies in general, there is a concern over regressive outcomes where low-income people pay a disproportionally large share of the total cost of the policy. With respect to environmental policies, studies have shown that people put equal weights to cost-effectiveness and equity outcomes [20]. This might be of particular concern for the eutrophication management of the Baltic Sea where several studies have shown that suggested BSAP targets are regressive where relatively low-income countries, such as Poland and Russia pay disproportionally much for nutrient abatement [14,21].
The main question raised in this study is if and how a new abatement technology, mussel farming, reduces cost and promotes equity for the achievement of the nutrient load targets set by BSAP in HELCOM [13]. Both costs and equity in allocation of cost burden among the Baltic Sea countries depend on which international policy regime is in place. The BSAP sets reduction targets for each country, a so-called command and control policy, which is known not to result in cost-effective solutions. We therefore examine the impacts of mussel farming on costs and equity for three different international policy regimes: BSAP country targets, and cost-effective allocation with and without the possibility of nutrient trading among the countries. To this end, we develop a numerical cost minimization model including all nine countries around the Baltic Sea to evaluate the cost-effectiveness of mussel farming as a nutrient abatement measure. The outcome from the model is then used to calculate equity in terms of so-called Gini coefficients, which has a long tradition in economics [22].
Despite the recognized concerns of both cost-effective and equity in abatement cost burdens, there are very few studies evaluating new cleaning technologies with respect to both these criteria. Existing studies are applied to forest carbon sink enhancement in reaching the EU’s 2020 CO2 emission target [23]. Similar to this study Munnich-Vass et al. [23] developed a numerical cost minimization model and used the model outcomes to calculate equity by applying Gini indices. It was shown that forest carbon sink reduces overall abatement cost by 25% but also reduces equity since the largest gains from its introduction is made by high-income EU countries.
There is no similar study evaluating mussel farming or any other new technologies for water management. A few studies have compared the cost of mussel farming as a nutrient cleaning measure with other cleaning measures in agriculture and at sewage treatment plants [6,7,8,9] but did not consider equity. Other studies have calculated cost-effective and equity outcomes from overall water quality management [14,21,24]. Khadam and Kaluarachchi, [24] apply the analysis to a water shed in Washington state, USA, and Gren [14] calculates total and distribution of costs among countries in the Baltic Sea. Gren and Destouni [21] examine cost-effective and equity outcomes of different measurements of nutrient load to the Baltic Sea. They applied the same method as Munnich-Vass (23) when measuring equity, which is much applied in development economics (e.g., [25,26]).
In our view, the main contribution of this study is the evaluation of nutrient removal by mussel farms in the Baltic Sea with respect to both cost-effectiveness and equity performance. Another contribution is the evaluation of mussel farming according to these success criteria under different international policy regimes. A numerical optimization model is used to calculate the impacts of mussel farming on overall costs for reaching nutrient targets for the Baltic Sea. The output from the model in terms of allocation of costs among countries is used to calculate equity performance. A limitation of the study is the assumptions regarding the functioning of the international policy regimes, where we disregard the uncertainty in nutrient load reductions in market-based systems, transaction cost associated with the implementation and enforcement of the policies, and incentives for promoting technological development (e.g., [27]).
The study is organized in three main parts; methods, results, and conclusions. The method part includes Section 2 and Section 3, where Section 2 gives a conceptual approach to the static optimization model used for calculating cost-effectiveness and equity performance of mussel farming. The data used as inputs into the optimization model is described in Section 3. Results from the numerical optimization model are presented in Section 4 and the study ends with a discussion and main conclusions.
2. Conceptual Approach
The role of mussel farming is examined with respect to the technology’s impact on cost-effective solutions to predetermined nutrient load targets and associated equity outcomes. Mussel farming is then of interest only if it is included in a cost-effective solution, which occurs when the cost of the technology is lower than that for other abatement measures. In this study, we calculate such cost-effective solutions under different international policy regimes for reaching targets on overall nutrient load reductions to the Baltic Sea. Unlike Gren et al. [7] we disregard the difference in targets for the marine basins set by BSAP. The simplification is made because of our focus in the performance of mussel farming with respect to cost-effectiveness and equity under different policy regimes. Another argument is that nutrient loads from one drainage basin is partly dispersed into the entire Baltic Sea [28].
2.1. Cost-Effectiveness
Cost-effective solutions with and without the inclusion of mussel farming are obtained from an optimization model where costs are minimized for achieving given nutrient targets. In all policy regimes, it is assumed that a Baltic Sea manager sets targets on maximum emissions of nitrogen, N, and phosphorus, P. Each country, i where i = 1, …, j countries, faces costs of abatement by other measures than mussel farming written as where Ai is the magnitude of the measure, such as areas of wetland construction or number of cattle reductions. The associated reductions of nutrient loads are assumed to be a linear function of Ai where Ai,N = γi,NAi and Ai,P = γi,PAi are the decreases in N and P, respectively.
The cost of mussel farming is determined by expenses for investment, harvest, maintenance minus incomes from sales of mussels for food, feed etc., which we simply denote as , where Fi is the total area of mussel farms in the territorial waters of country i. The harvest of the mussel reduces nitrogen and phosphorus in the sea by a fraction of the biomass obtained from Fi, denoted ϕi,N and ϕi,P for nitrogen and phosphorus, respectively. Total cost, abatement cost plus cost for mussel farms in a country is then written as:
Total N and P load to the Baltic Sea from each country, Li,N and Li,P respectively, are determined by the load under business as usual conditions from each country, Li,N,BAU and Li,P,BAU, respectively minus abatement and cleaning by mussel farms, which is written as:
The formulation of the decision problem shows slight differences depending on which of the three international policy regimes is considered (cost-effective, BSAP command and control, nutrient-trading schemes). Starting with the cost-effective allocation of country load reductions, the decision problem for a Baltic Sea manager is to minimize total costs for all countries given the overall nutrient load targets, which is written as:
where TN and TP are the maximum total load targets of N and P set by BSAP [13].
It is shown in Appendix A, that the conditions for if and when mussel farming is included in the cost-effective solution for nitrogen is given by:
where λN < 0 and λP < 0 are the Lagrange multipliers on the restriction on nitrogen and phosphorus loads, respectively to the Baltic Sea. They show the increase in total abatement cost when reducing TN or TP load by one unit and are often denoted the shadow costs of the emission targets. The condition is similar for phosphorus (Appendix A). The left-hand side of (4) shows the marginal cost of nitrogen abatement by mussel farming and the right-hand side the marginal abatement cost of other measures. Equation (4) states that a condition for cost-effective allocation of mussel farming and other abatement measures is that their marginal abatement costs for nitrogen are equal, which is a well-known conclusion in environmental economics (e.g., [29]). The marginal nitrogen abatement cost for mussel farming consists of the increase in costs for increasing the area of mussel farms by one unit (the first term within brackets at the left-hand side of (4)) minus the value of simultaneous removal of phosphorus (the second term within brackets at the left-hand side of (4) where λP < 0) measured per unit nitrogen removal. Similarly, the marginal cost of other abatement measures at the right-hand side of Equation (4) shows the marginal cost of nitrogen abatement (the first term at the right-hand side of Equation (4)) minus the reduction in abatement costs from the simultaneous abatement of phosphorus (the second term at the right-hand side of Equation (4)). When this condition holds we must have that total cost for achieving the targets with mussel farming is lower than without mussel farming.
Under the command and control regime, the BSAP allocates nutrient load targets to each country, Ti,N and Ti,P for nitrogen and phosphorus, respectively. Each country is then assumed to minimize cost to reach these targets, and the decision problem is formulated as:
The condition for the inclusion of mussel farming in the national strategy is (see Appendix):
The condition in Equation (6) is very similar to that for cost-effective solution in Equation (5). The difference is the replacement of the shadow costs of the targets, which are specific for each country, λi,N < 0 and λi,P < 0 for nitrogen and phosphorus, respectively. Whether mussel farming is included in a country’s choice then depends on the cost of other options only in that country. It can immediately be observed that this cannot give a cost-effective solution for the entire Baltic Sea region since the shadow costs differ among countries.
Markets for trading of nutrients have been suggested and examined in a few studies [30,31]. The basic idea is that each county receives initial nutrient load permits, the sum of which corresponds to the maximum load targets TN and TP. When there are differences in abatement costs at these initial permit levels, trade takes place where countries with relatively low marginal abatement costs sell permit to countries with relatively high marginal abatement cost. Equilibrium prices of permit of nutrient and phosphorous are then established in between the high and low marginal abatement costs. Furthermore, when markets function as they should the trade generate cost-effective solutions. To see this, we consider a country obtaining Qi,N and Qi,P initial permits and minimizes total cost of abatement and sales/purchases of permits in the markets according to:
where gN and gP are the equilibrium prices of nitrogen and phosphorus, respectively. When < , there are sales of permits since total load is lower than the initial distribution, and vice versa. The optimal choices of N removal by mussel farming and abatement by other measures is guided by (Appendix A):
The only change from the cost-effective solution in Equation (4) is that the Lagrange multipliers λ N and λP are replaced with equilibrium market prices gN and gP, respectively. When the markets function as they should we have λN = gN and λP = gP (e.g., [29]), which implies that the allocation of nutrient load and abatement cost is the same as in the cost-effective solution.
2.2. Equity
The three different policy regimes examined in Section 2.1 will result in different allocations of net costs among countries. One difference between the cost-effective allocation and nutrient-trading systems is that the net cost under a trading system can be higher or lower depending on if the country is a buyer or seller of permits. This is seen from Equation (7) which includes a country’s total abatement cost and transaction of permits. The cost for a country under the BSAP country target system can be higher or lower than under the other two systems depending on the abatement costs and targets for the country. These differences imply that the systems will differ with respect to their equity performance.
The equity principle is based on the capability approach suggested by Sen [32] which relates burdens of actions to the agents’ ability to meet them. This equity criterion has proven important for international negotiations on other environmental problems, such as the climate change issue (e.g., [16,17]). Therefore, this principle is adopted in this study, where we focus on allocation of abatement costs in relation to the affordability in different countries, which is measured as the value of total production in the economy, gross domestic product (GDP).
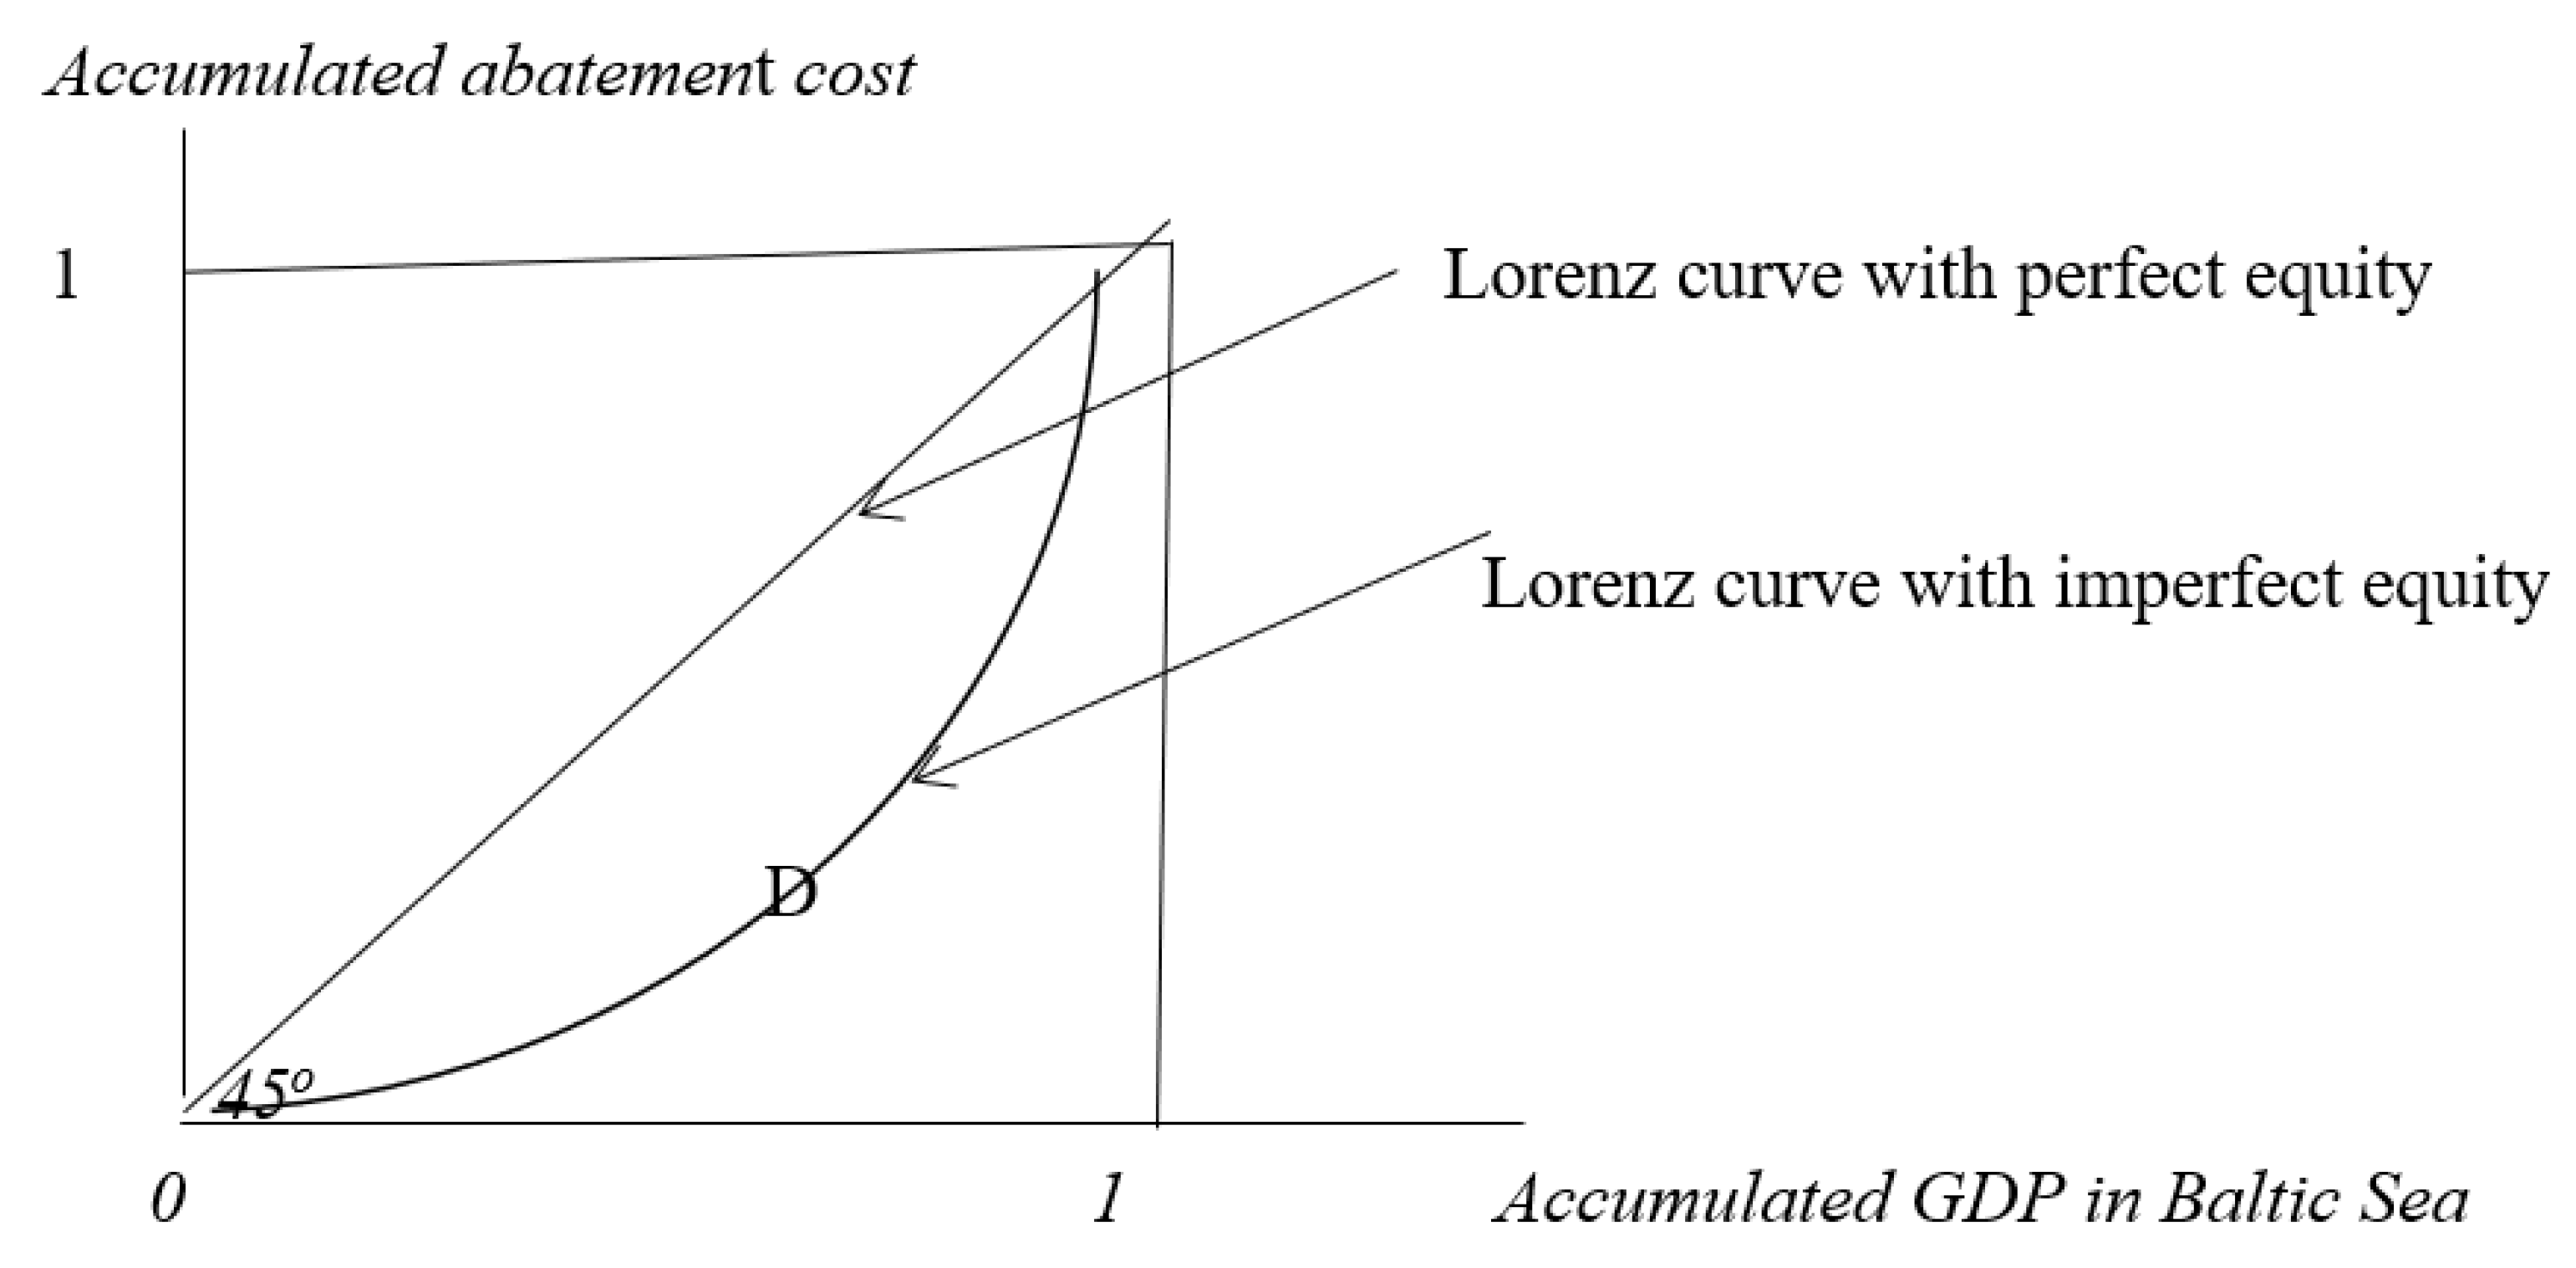
There is a large body of literature on how to measure equity within and between countries. A common approach is to calculate so-called Gini coefficients [22]. The Gini coefficients are derived from the Lorenz curves, which are illustrated in Figure 1.
The Lorenz curve shows the share of a region’s GDP in relation to its share of total abatement cost. For example, the point D on the Lorenz curve in Figure 1 illustrates that countries with an accumulated GDP of 0.5 of the total GDP in the region bears 0.25 of the total abatement cost. In a similar vein we can say that countries with the remaining 0.5 of the total GDP accounts for 0.75 of the total abatement cost, which can be regarded as unfair. On the other hand, along the 45° curve we have perfect equality since, along this curve, the countries with a certain share of total GDP carries the same share of the total abatement cost.
The Gini coefficient (GC) is measured as the area between the 45° curve and the calculated Lorenz curve. This means that 0 < GC < 1. High value of GC implies high inequality, and vice versa. At the 45° curve we have the unlikely case of perfect equality where GC = 0. There is a large literature on the calculation of the GC (e.g., [25]). This paper will use a simple approach where the calculation of the GC is based on accumulative percentages of abatement costs and GDP (e.g., [25]). The GC is relatively high when countries with relatively low GDP faces high abatement cost. If a policy regime, such as nutrient-trading markets, reallocates cost burden from countries with low GDP to countries with high GDP, the equity is higher than under the cost-effective solution as measured by the GC.
3. Description of Data in the Optimization Model
The data used in the numerical optimization model of total and national abatement costs are obtained from three main sources: nutrient load data and reduction requirements from HELCOM [12], costs and effects of mussel farming from Gren et al. [7], and costs and effects of other abatement measures from Gren and Säll [33]. To match data on nutrient loads with estimates of costs, Gren and Säll [33] divided the Baltic Sea catchment into 24 drainage basins (Figure A1). Total nutrient load amounts to 814 kton and 34.81 kton of nitrogen and phosphorus, respectively (Table A1). One country, Poland, accounts for large shares of each nutrient 0.27 and 0.36 of total load of nitrogen and phosphorus, respectively. According to the BSAP HELCOM [13], the total load of nitrogen shall be reduced by 11% and that of phosphorus by 42% (Table A1). The BSAP also assigns reduction requirements among countries, where Poland accounts for 49% and 52% of the total reduction requirement of nitrogen and phosphorus, respectively.
With respect to data on costs, there is a recent and growing literature on the calculation of abatement costs for mussel farming (e.g., [6,7,8,9]). The costs of nutrient removal by mussel farming are determined by; (i) mussel growth conditions in the coastal zones, (ii) prices of labor, capital and equipment used for establishing and managing a farm, and (iii) income of sales of mussels as food, feed, or inputs as fertilizer or energy source. These three factors determine the net cost of mussels for nutrient removal, which differ among countries and regions. Except for Gren et al. [7] all studies calculate cost for farms at the local scale, such as cultivation of Zebra mussels (Dreissena polymorpha) in the Oder lagoon in Germany [8] or blue mussels (Mytilus edulis) at the west coast of Sweden [6]. Gren et al. [7] make a systematic calculation of costs of mussel farming in the Baltic Sea region, which is made for blue mussels with the commonly used long line technology. In this study, we use the estimates by Gren et al. [7] and update them to 2015 prices where we adjust for inflation by using consumer price indices specific for each country. Mussel growth and thereby nutrient removal depends on the salinity level, which differs in the marine basins of the Baltic Sea. Following Gren et al. [7] we therefore include only marine basins in the south and west parts of the sea (Northern and Southern Baltic Proper, Danish Straits, and Kattegat). The productivity per farm and year varies between 70 and 220 ton because of the differences in salinity level (Table A2).
The calculated range in annual costs of a mussel farm is between 0.09 and 0.30 million SEK (9.36 SEK = 1 Euro on average 2015) per farm and year, being lowest in Russia and highest in Denmark (Table A2). The costs per kg live mussel varies between 0.98 SEK/kg and 3.81 SEK/kg. The estimate for Denmark can be compared with similar calculations made by Ngyuen et al. [10] and Petersen et al. [9] who found that the cost of cultivating blue mussels in the Great Belt amounted to 2.24 SEK/kg and in the Skive fjord to 1.25 SEK/kg (in 2015 prices). Our calculated unit cost for Sweden in the Kattegat basin, which amounts to 1.01 SEK/kg, can be compared with estimates made by Lindahl et al. [6] who calculated a cost of 0.95 SEK/kg for blue mussel farming at the west coast of Sweden (in 2015 prices). The unit costs of nitrogen and phosphorus removal are obtained by dividing the unit production costs with 0.01 and 0.001, respectively.
Abatement costs for other measures are obtained from Gren et al. [7] who calculated costs for abatement measures implemented in agriculture (reduction in fertilizers and livestock, increased area of grassland, catch crops and energy crops, construction of wetlands and buffer strips), increased cleaning of nutrients at sewage treatment plants and industry, and reduction in airborne nitrogen deposition from countries around the Baltic Sea (emissions from transports, industry and energy production). The costs of reductions in use of fertilizers, livestock, and cultivation of catch crops are calculated as decreases in profits for the farmers. Catch crops refer to crops sown at the same time as the ordinary crops but start to grow when the ordinary crop is harvested which reduces leakage of nutrient from the land. All costs are updated to 2015 prices.
There is also a need for setting constraints on the maximum potential of mussel farming since it cannot be cultivated everywhere in the coastal zones. There is no study with a systematic analysis of the potential in the coastal zones included in this study, and it is, therefore, simply assumed that a maximum of 1% of the area 1 nm (1.85 km) along the straight coast lines of the countries can be covered by mussel farms (Table A2). Similar constraints are imposed on all other abatement measures, which are described in Gren et al. [7].
4. Results—Cost Savings and Equity Outcomes
Calculations of cost-effective solutions in the numerical optimization model are carried out by using General Algebraic Modeling System (GAMS) program with the Conopt solver [34]. When calculating costs for countries under the nutrient-trading markets, the initial permits correspond to the maximum load target set by BSAP. However, when calculating GCs for allocation of abatement cost per capita there is a need for accounting for differences in purchasing power of a given income among the riparian countries. This is made by using the purchasing power parity (PPP) index, which reflects the purchasing power of a USD in each country. All cost calculations are made in 2015 prices.
4.1. Total and National Cost
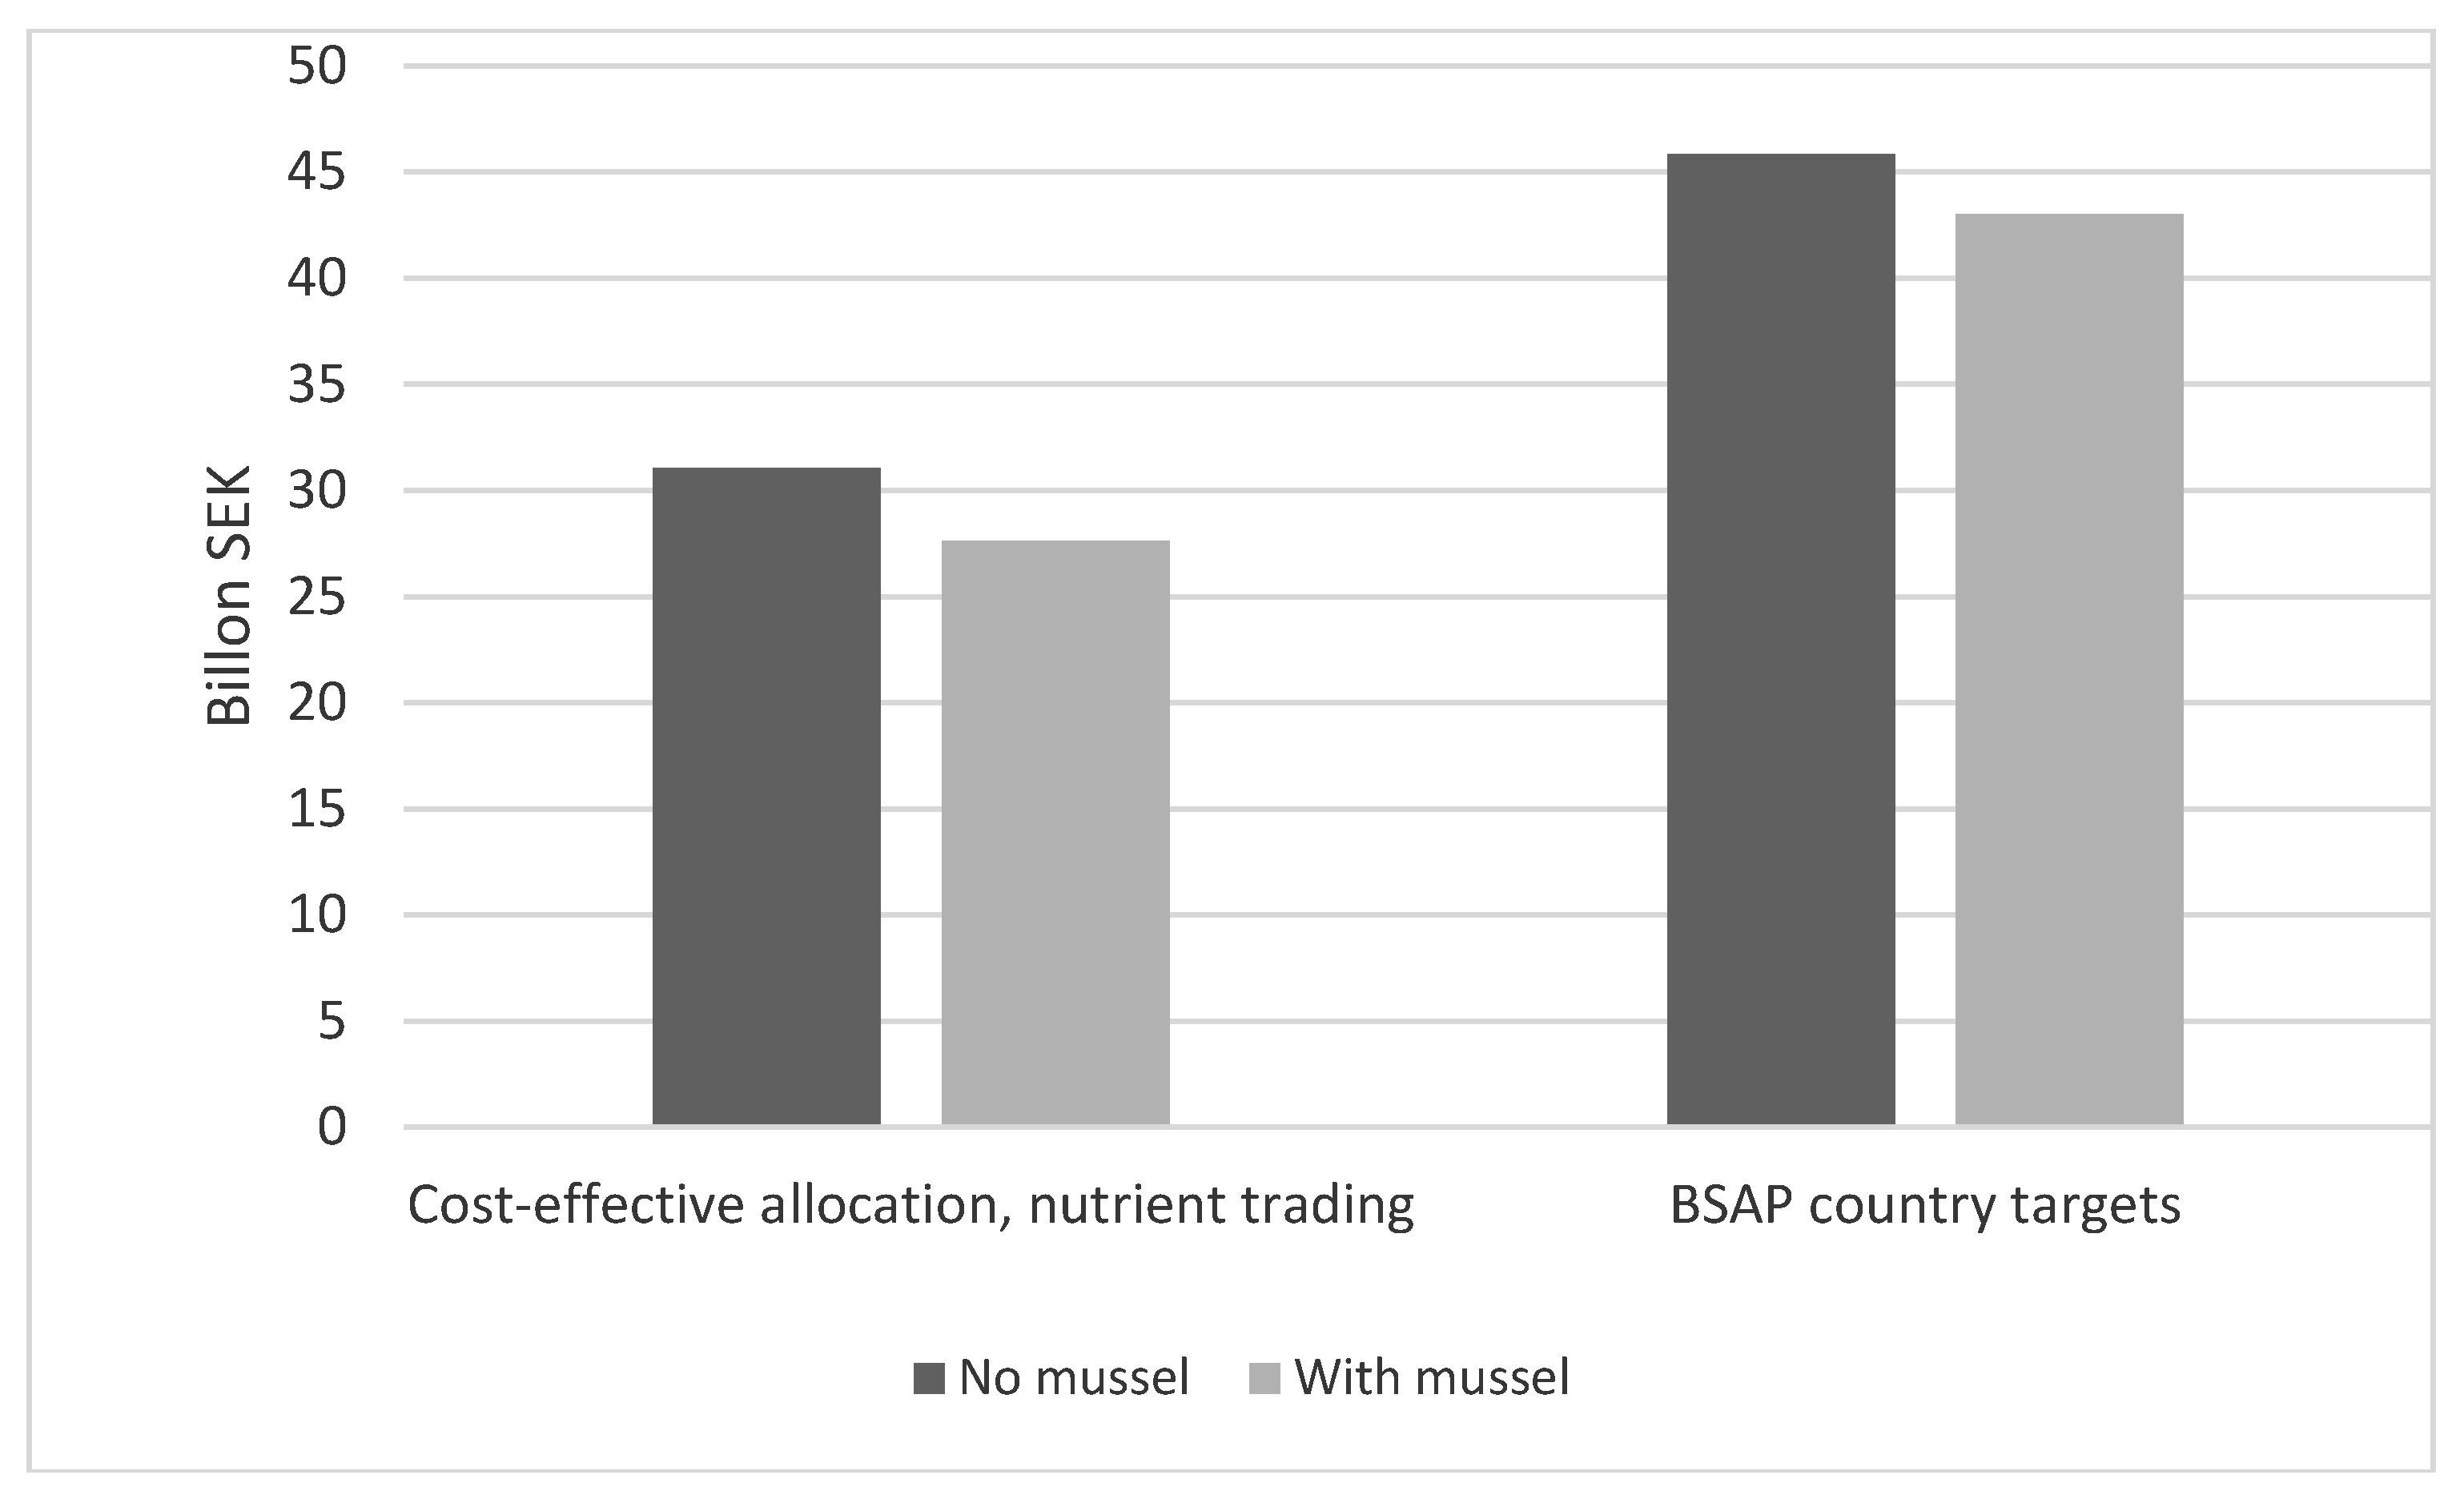
Recall from Section 2 that total abatement costs are the same in the cost-effective solution and nutrient-trading system, which amount to 31.04 billion SEK (9.36 SEK = 1 Euro and 8.44 SEK = 1 USD on average 2015) without and to 27.62 billion SEK with mussel farming (Figure 2).
The results presented in Figure 2 show that inclusion of mussel farming reduces cost by 3.42 billion SEK in the cost-effective solutions and by 2.59 billion SEK in the system with BSAP country targets. Another result is that BSAP country targets is approximately 50% more expensive than the cost-effective solution. This is explained mainly by the higher abatement cost for Poland because of a larger BSAP reduction requirement than the cost-effective solution (Table 1).
Under all policy regimes, Poland faces approximately 60% of total abatement cost, which is explained by its relatively high share of total nutrient load and availability of low-cost options. The last two columns show the cost for each country net after trade with nutrient permits. Countries with higher costs buy permits, and vice versa. Without the mussel farming option, the sellers are Estonia, Latvia, Lithuania, Poland, and Russia. All these countries but Poland are also net sellers with the mussel option.
4.2. Equity
The data presented in Table A1 indicates an uneven distribution of prosperity, nutrient loads, and reduction requirements among the countries. The GDP/capita is approximately three times higher in four countries (Denmark, Finland, Germany, and Sweden) than in the other five countries. It can also be noted that the largest load of both nutrients emerges from the countries with the low GDP/capita; Poland, Russia, Latvia, and Lithuania account for 57% and 72% of the total load of nitrogen and phosphorus, respectively. These countries are also allocated the major reduction requirements by BSAP, which correspond to 74% and 70% of the total reduction requirement of nitrogen and phosphorus, respectively. At a first glance, it thus seems as the BSAP reduction allocation makes the economic conditions for nutrient mitigation quite unequal in the countries.
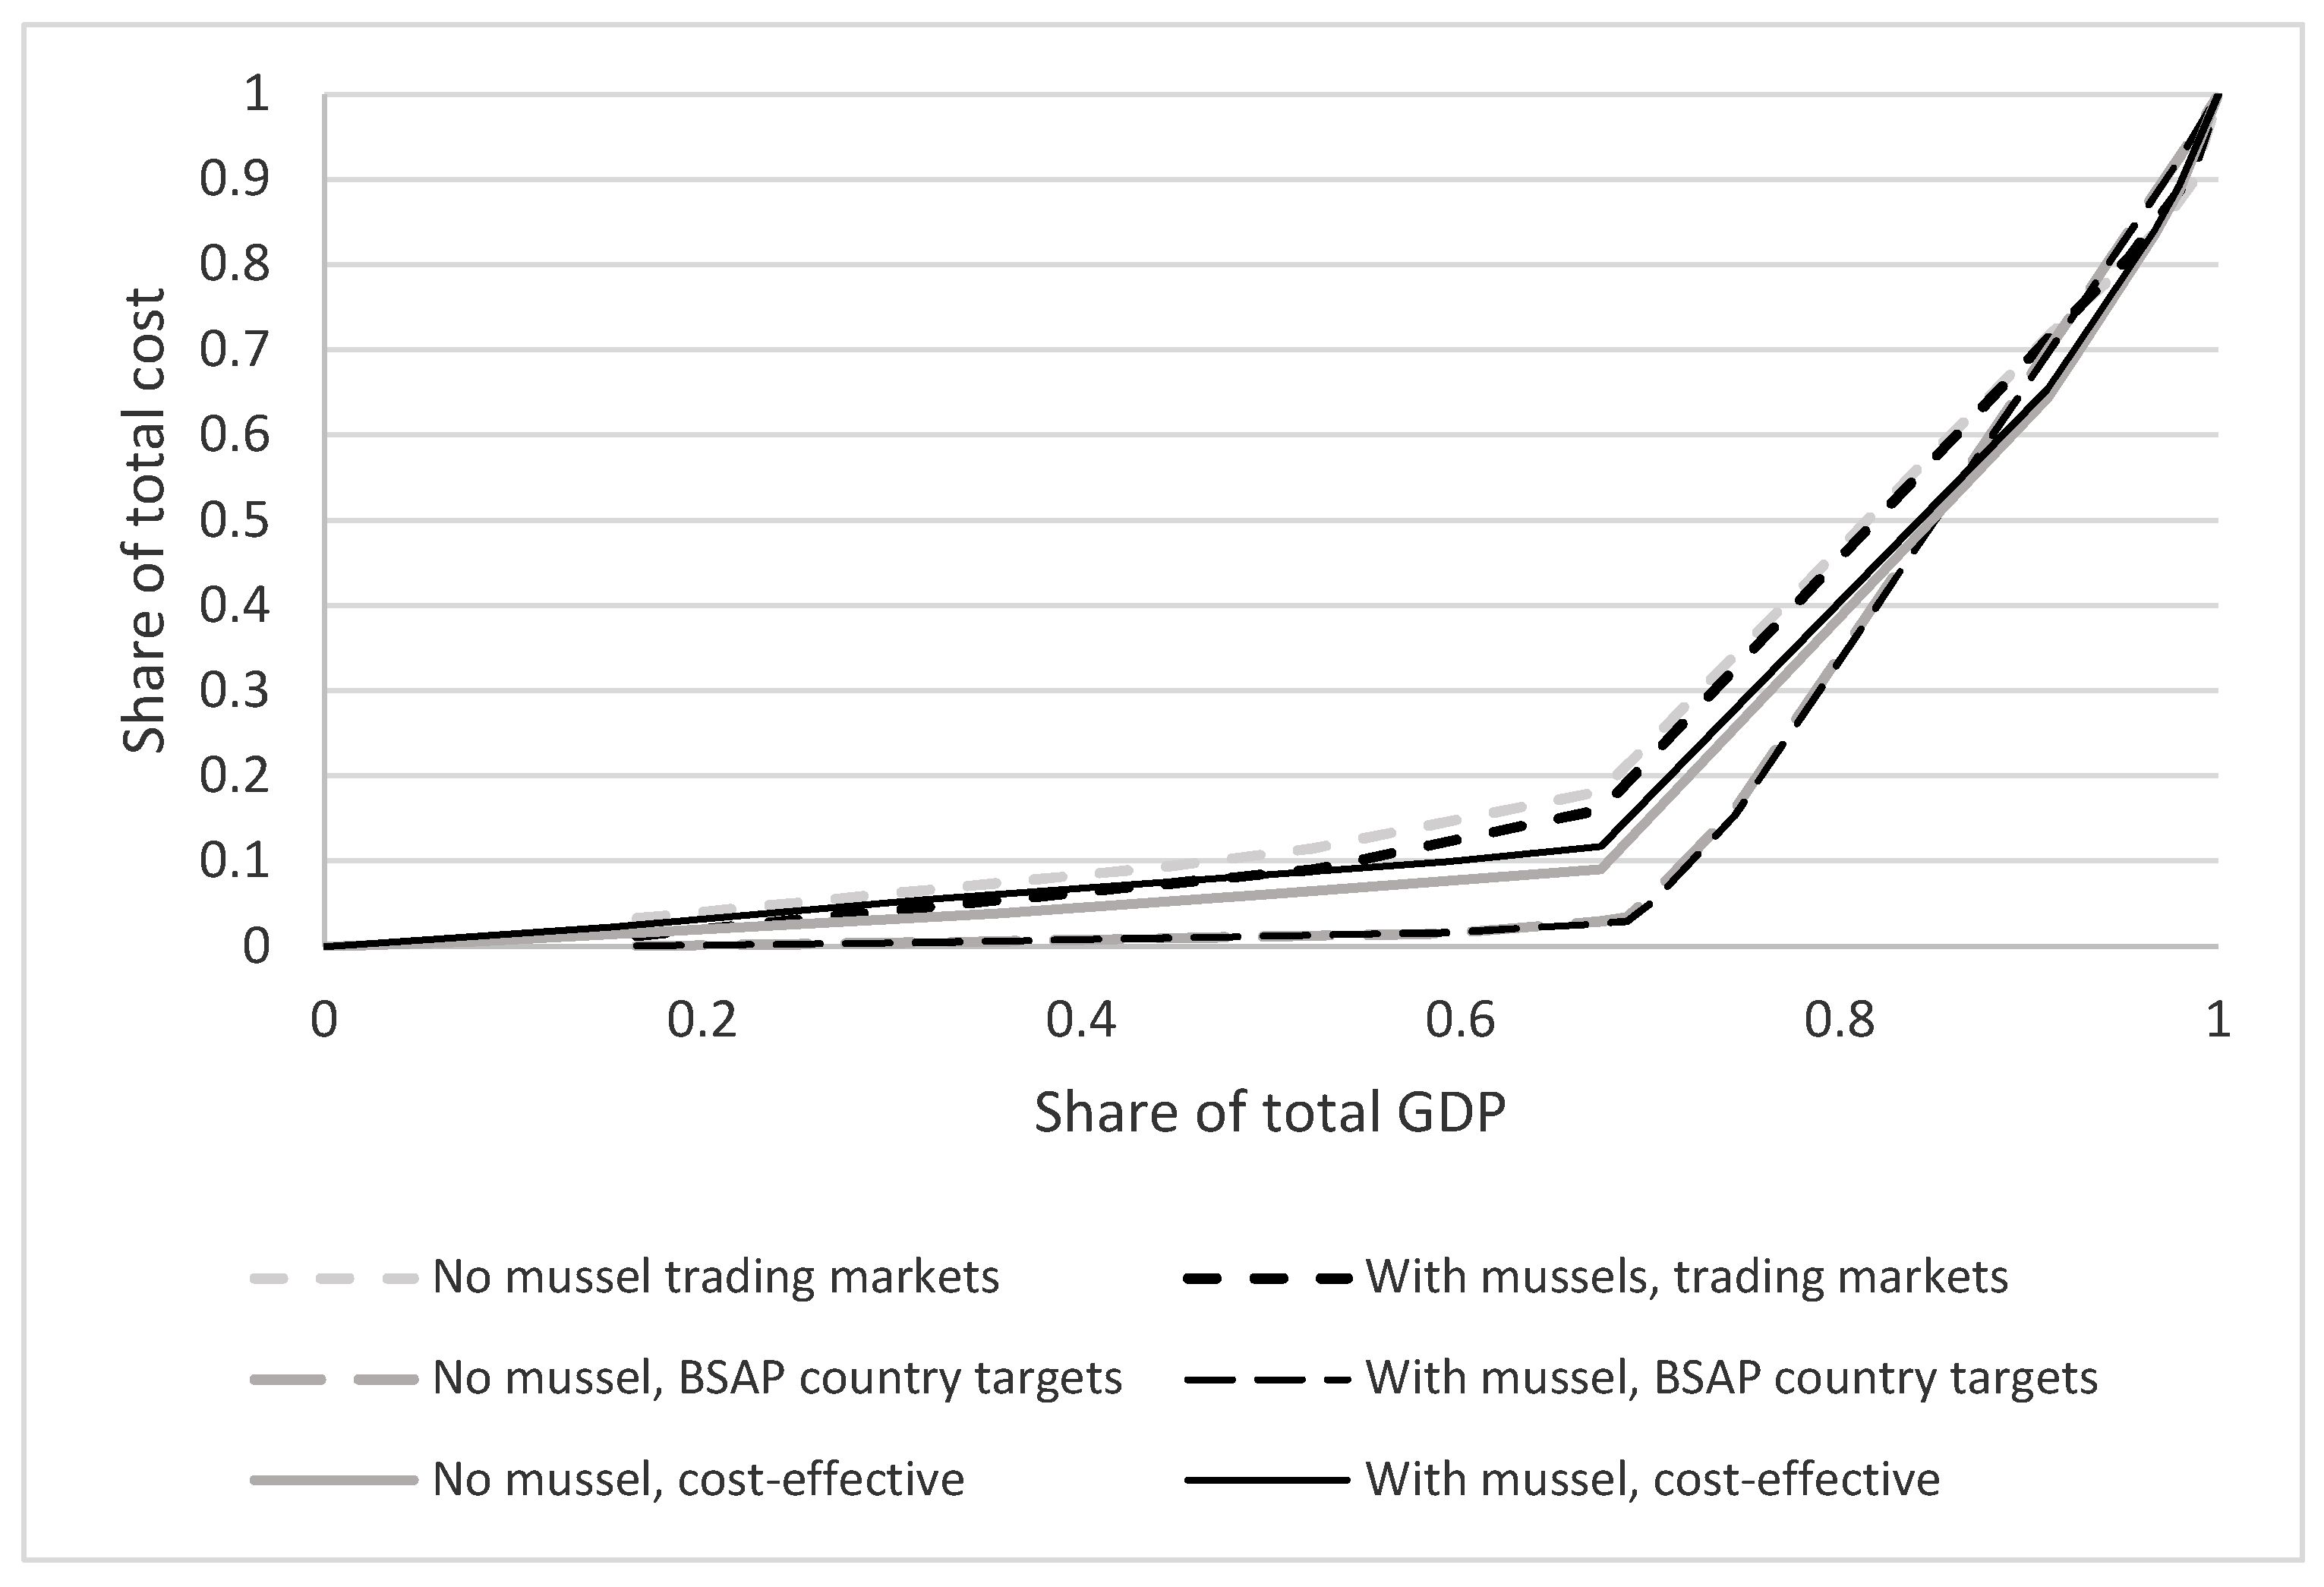
As discussed in Section 2.2, this study employs and calculates GCs for the equity criterion where we relate the relative cost burden among countries to the affordability which is measured as their GDP. The Lorenz curves are calculated based on the results presented in Table 2 and on the GDP data reported in Table A1. The calculated Lorenz curves under the different international policy regimes and mussel inclusion options are displayed in Figure 3.
The Lorenz curves show that the BSAP country target regime creates the highest inequity, and the nutrient-trading policy the lowest. Another result is that the inclusion of mussel farming increases equity in cost-effective solution, but there is a slight decrease in equity for the other two policy regimes. Under all policy regimes and mussel farming options, there is a kink in the curves at the GDP share of approximately 0.7. The reason is that in most cases the countries with the highest GDP share (Sweden, Denmark, Finland, and Germany) face a low share of total abatement cost, which shows a steep increase for the other countries, in particular Poland.
The differences in equity among the policy regimes and mussel farming options are more easily seen from the calculation of the GCs (Table 2).
The calculated GCs in Table 2 show that equity is highest under a system with nutrient trading and lowest under the BSAP country targets. The introduction of mussel farming reduces equity under both these systems. The main reason is that countries with a relatively high GDP share provide low-cost mussel farming because of the higher productivity in the coastal zones of these countries (Germany, Sweden, and Denmark). This implies lower abatement cost and less purchases of permits by these countries from countries with low GDP shares. On the other hand, the introduction of mussel farming under a cost-effective solution reduces abatement costs mainly for Poland since mussel farming in richer countries replaces abatement of phosphorus in this country. Because of the large share of phosphorus loads, relatively much of the abatement is made in Poland without mussel farming.
5. Discussion and Conclusions
With respect to the question raised in this study on the cost-effectiveness, a main empirical finding was that mussel farming reduces total abatement costs by 6% or 11%, depending on the international policy regime. These cost savings are in the same order of magnitude as the relative cost reduction obtained by Gren et al. [7]. The lower percentage is caused by the higher total abatement costs under the BSAP country targets, approximately 46 billion SEK, compared with the total cost-effective solution of approximately 31 billion SEK. The other reason is the slightly lower cost reduction in absolute terms, 2.6 billion SEK compared with 3.5 billion SEK, which is explained by the fact that only countries with mussel farming options make gains, and not other countries, from the overall reduction in abatement cost. Common to all policy regimes is that Poland faces the largest abatement cost burdens, but also makes the largest gains in absolute terms from mussel introductions.
The calculated abatement costs were used to assess equity outcomes under the different policy regimes. Unlike cost savings by mussel farming, its impact on equity is positive only under an international cost-effective policy scheme. However, the differences in equity outcomes between the policy regimes are relatively small since abatement options are abundant and costs are low in countries with low GDP/capita. The different policy regimes therefore mainly switch cost burdens within the two groups of high (Denmark, Sweden, Finland, Germany) and low (Poland, Estonia, Latvia, Lithuania, Russia) income countries, but not much between these two groups. This result is also found in Gren and Destouni [21], but for cost-effective solutions under different methods for measuring nutrient loads to the Baltic Sea.
The analysis and calculations of cost-effectiveness were carried out under several assumptions regarding the numerical optimization model. One was that the nutrient targets should be achieved within a short period, which justifies our choice of a static model. A longer time perspective on the achievement of the nutrient targets would require modelling of the nutrient dynamics of the sea, technological development of mussel farming and other abatement measures, and economic development affecting nutrient loads. In general, mussel farming would have a cost advantage if nutrient abatement in the sea can be obtained within a shorter period than by other measures. Another limitation is the neglect of uncertainty in abatement by mussel farming and other measures, the outcome of which depends on the relative uncertainty in their abatement. The difficulties of implementing the international policy regimes in practice have also been disregarded, such as the uncertain effect of a nutrient load charge and the costs associated with implementing and enforcing compliance with the policies. Whether or not the consideration and relaxation of these assumptions affect equity outcomes is questionable since they are guided by the differences in the business as usual conditions with respect to nutrient loads and costs of abatement measures among countries, which are not much affected by the assumptions and model limitations.
Despite the limitations of the numerical optimization model, the calculated total abatement cost of 31.04 billion SEK without mussel farming was within the range of estimates obtained by other studies calculating minimum costs of the BSAP agreement but with different data and structures of the optimization models [23,35,36]. The cost obtained by Gren and Destouni [23] amounts to approximately 23 billion SEK and those by Elofsson [35] and Wulff et al. [36] to approximately 35 billion SEK. The middle cost estimate in this study can be explained by the consideration of only overall reduction requirement, and not the specification for single marine basin. The target for Baltic Proper is particularly stringent with a requirement of 60% load reductions in phosphorus [13].
The results from the study thus point out the need for considering both cost savings and equity outcomes when evaluating mussel farming as a nutrient removal option in the Baltic Sea. Under current regime with the BSAP country targets, the decision would include a trade-off between cost savings and reduced equity. If mussel farming is considered as an abatement option, it could be included as offsets where sectors subject to regulations, such as agriculture and sewage treatment plants, could fulfil its nutrient reduction requirement by paying for nutrient removal by mussel farming. A perquisite for the materialization of the cost savings by mussel farming is that so-called stacking is allowed, where mussel farming is allowed to obtain credits for abatement of both nutrients (e.g., [31]). When this is not allowed, mussel farming has to choose in which reduction regime to be included, nitrogen or phosphorus, and abatement of the other nutrient is not credited. This implies a cost disadvantage for mussel farming and all other multi-functional abatement measures.
Author Contributions
Ing-Marie Gren has been writing the paper and making the calculations, and Sarah Säll, Abenezer Aklilu and Wondmagegn Tirkaso have provided the data.
Funding
This research received no external funding.
Acknowledgments
We are grateful to financial support from the BONUS-BaltCoast and Optimus projects, funded by BONUS (Art 185) funded jointly from the European Union’s Seventh Program for research, technological development and demonstration, and from the Swedish Environmental Protection Agency and the Swedish Agency for Marine and Water Management. We also appreciate useful comments from three anonymous reviewers.
Conflicts of Interest
The authors declare no conflict of interest.
Appendix A. First-Order Conditions for Optimal Solutions
The first-order conditions in the cost-effective solution are solved by formulating the Lagrange expression of the decision problem in Equation (3) as;
and differentiating the expression with respect to Ai and Fi which gives;
By solving for λN in Equations (A2) and (A3) we obtain the condition for cost-effective achievement of TN;
Similarly, solving for λP in Equations (A2) and (A3) gives:
The Lagrange expression under the BSAP country target specification in Equation (5) is written as:
By following the same steps as for the cost-effective solution, the first-order conditions for the optimal allocation of Ai and Fi are written as;
The first-order conditions for the cost minimization problem with nutrient-trading markets are solved by minimizing Equation (7) with respect to Ai and Fi, which gives;
The optimal relation between N removal by mussel farming and abatement by other measures is found by solving for gN in Equations (A9) and (A10);
Similarly, solving for gP in Equations (A9) and (A10) gives;
Appendix B. Tables A1 and A2, Figure A1

Table A1.
Shares of total GDP, GDP/capita in 2015, nutrient loads and BSAP reduction requirements for the different countries.
Table A1.
Shares of total GDP, GDP/capita in 2015, nutrient loads and BSAP reduction requirements for the different countries.
| Countries | Share of Total GDP a | GDP/Cap., Thousand SEK b,d | Nitrogen, Kton c; Load Reduction | Phosphorus, Kton c; Load Reduction | ||
|---|---|---|---|---|---|---|
| DEN | 0.078 | 447 | 71 | 2.89 | 1.928 | 0.038 |
| EST | 0.254 | 145 | 28 | 1.8 | 0.804 | 0.32 |
| FIN | 0.142 | 358 | 83 | 3.43 | 3.56 | 0.356 |
| GER | 0.127 | 349 | 63 | 7.67 | 0.526 | 0.17 |
| LAT | 0.267 | 115 | 78 | 1.67 | 2.227 | 0.22 |
| LIT | 0.016 | 121 | 46 | 8.97 | 2.635 | 1.47 |
| POL | 0.018 | 107 | 221 | 43.6 | 12.31 | 7.48 |
| RUS | 0.028 | 79 | 94 | 10.38 | 7.178 | 3.79 |
| SWE | 0.070 | 429 | 130 | 9.24 | 3.639 | 0.53 |
| Total | 1 (15,022 billion SEK d) | 173 | 814 | 89.65 | 34.807 | 14.374 |
Table A2.
Costs of mussel farming in 2015 prices, biomass production, and maximal total production in Kattegat, the Danish Straits, and Baltic Proper.
Table A2.
Costs of mussel farming in 2015 prices, biomass production, and maximal total production in Kattegat, the Danish Straits, and Baltic Proper.
| Countries | Cost of Mussel Farm, Mill SEK/Farm a | Live Mussel Production, ton/Farm a | Cost in SEK/kg Live Mussel | Maximum Total Production, kton Biomass b |
|---|---|---|---|---|
| DEN | 0.30 | 225 c, 110 d | 1.31 c, 2.68 d | 1168 |
| EST | 0.13 | 70 | 1.32 | 172 |
| GER | 0.24 | 110 d, 90 e | 2.16 d, 3.00 e | 1074 |
| LAT | 0.11 | 90 | 1.23 | 158 |
| LIT | 0.11 | 90 | 1.23 | 28 |
| POL | 0.12 | 90 | 1.26 | 202 |
| RUS (Kaliningrad) | 0.09 | 90 | 0.97 | 46 |
| SWE | 0.27 | 225 c, 110 d,70 f | 1.01 c, 2.60 d, 3.81 f | 1046 |
a Gren et al. [7] farm of size 0.5 ha; b Based on the assumption of a maximum coverage of 1% of a coastal area corresponding to 1 nm (1.85 km) from the coast along the straight coast lines; c Catchments to Kattegat; d Catchments to the Danish Straits; e Catchment to the Southern Baltic Proper; f Catchments to the Northern Baltic Proper.
Figure A1.
The Baltic Sea drainage basin. Source. GRID Arendal (http://www.grida.no/baltic/htmls/maps.htm).
Figure A1.
The Baltic Sea drainage basin. Source. GRID Arendal (http://www.grida.no/baltic/htmls/maps.htm).

References
- Galloway, J.N.; Townsend, A.R.; Erisman, J.W.; Bekunda, M.; Cai, Z.; Freney, J.R.; Martinelli, L.A.; Seitzinger, S.P.; Sutton, M.A. Transformation of the Nitrogen Cycle: Recent Trends, Questions, and Potential Solutions. Science 2008, 320, 889. [Google Scholar] [CrossRef] [PubMed]
- Conley, D.J.; Björck, S.; Bonsdorff, E.; Carstensen, J.; Destouni, G.; Gustafsson, B.G.; Hietanen, S.; Kortekaas, M.; Kuosa, H.; Meier, M.H.E.; et al. Hypoxia-related processes in the Baltic Sea. Environ. Sci. Technol. 2009, 43, 3412–3420. [Google Scholar] [CrossRef] [PubMed]
- Díaz, R.J.; Rosenberg, R. Spreading dead zones and consequences for marine ecosystems. Science 2008, 321, 926–929. [Google Scholar] [CrossRef] [PubMed]
- Elmgren, R.; Larsson, U. Europhication in the Baltic Sea area. Integrated coastal management issues. In Science and Integrated Coastal Management; Bodugen, B.V., Turner, R.K., Eds.; Dahlem University Press: Berlin, Germany, 2001; pp. 15–35. [Google Scholar]
- Conley, D.J.; Bonsdorff, E.; Carstensen, J.; Destouni, G.; Gustafsson, B.G.; Hansson, L.A.; Rabalais, N.N.; Voss, M.; Zillén, L. Tackling hypoxia in the Baltic Sea: Is engineering a solution? Environ. Sci. Technol. 2009, 43, 3407–3411. [Google Scholar] [CrossRef] [PubMed]
- Lindahl, O.; Herroth, B.; Kollberg, S.; Loo, L.-O.; Olrog, L.; Rehnstam-Holm, A.-S.; Svensson, J.; Svensson, S.; Syversen, U. Improving marine water quality by mussel farming: A profitable solution for Swedish society. Ambio 2005, 34, 131–138. [Google Scholar] [CrossRef] [PubMed]
- Gren, I.-M.; Lindahl, O.; Lindqvist, M. The value of mussel cultivation for combating eutrophication in the Baltic Sea. Ecol. Eng. 2009, 35, 935–945. [Google Scholar] [CrossRef]
- Schernewski, G.; Stybel, N.; Neumann, T. Zebra mussel farming in the Szczecin (Oder) lagoon: Water-quality objectives and cost-effectiveness. Ecol. Soc. 2012, 17, 4. [Google Scholar] [CrossRef]
- Petersen, J.K.; Hasler, B.; Timmermann, K.; Nielsen, P.; Törring, D.; Larsen, M.M.; Holmer, M. Mussels as a tool for mitigation of nutrient in the marine environment. Mar. Pollut. Bull. 2014, 82, 137–143. [Google Scholar] [CrossRef] [PubMed]
- Nguyen, T.; van Deurs, M.; Ravn-Jonsen, L.; Roth, E. Assessment of Financial Feasibility of Farming Blue Mussel in the Great Belt by the Smart Farm System. Department of Environmental and Business Economics, University of Southern Denmark. Available online: http://www.marbio.sdu.dk/uploads/MarBioShell/Thong%20et%20al%202013%20Final%20-%20SDU%20%20Thongrapport.pdf (accessed on 2 October 2018).
- HELCOM (Helsinki Commission). The Baltic Sea Joint Comprehensive Environmental Action Programme; Baltic Sea Environmental Proceedings No. 48; Helsinki Commission: Helsinki, Finland, 1993. [Google Scholar]
- HELCOM (Helsinki Commission). An Approach to Set Country-Wise Nutrient Reduction Allocations to Reach Good Marine Environment of the Baltic Sea; Helcom BSAP Eutro Expo, Helsinki Commission: Helsinki, Finland, 2007. [Google Scholar]
- HELCOM (Helsinki Commission). Helcom Copenhagen Ministerial Declaration; Helsinki Commission: Helsinki, Finland, 2013. [Google Scholar]
- Gren, I.M. Evaluation of cost-effectiveness and equity of the Helcom Baltic Sea Action Plan. Vatten 2008, 4, 271–281. [Google Scholar]
- Carraro, C. (Ed.) Efficiency and Equity in Climate Change Policy; Kluwer Academic Publisher: Amsterdam, The Netherlands, 2000. [Google Scholar]
- Carraro, C.; Buchner, B. Equity, development and climate change policy. In Climate Change Policy Regimes, International Trade and Growth; Carraro, C., Kemfert, C., Buchner, B., Eds.; CEPS-ESRI Collaboration studies: Buxelles, Belgium, 2002. [Google Scholar]
- Lange, A.; Vogt, C.; Ziegler, A. On the importance of equity in international climate policy: An empirical analysis. Energy Econ. 2007, 29, 545–562. [Google Scholar] [CrossRef] [Green Version]
- Bérubé, G.; Cusson, C. The environmental legal and regulatory frameworks. Assessing equity and efficiency. Energy Policy 2002, 30, 291–298. [Google Scholar] [CrossRef]
- UNEP. 2001. Available online: https://wedocs.unep.org/bitstream/handle/20.500.11822/17018/UNEP-guidelines-compliance-MEA.pdf?sequence=1&isAllowed=y (accessed on 25 September 2018).
- Dietz, S.; Atkinson, G. The equity-efficiency trade-off in environmental policy: Evidence from stated preferences. Land Econ. 2010, 86, 423–443. [Google Scholar] [CrossRef]
- Gren, I.-M.; Destouni, G. Do nutrient measurements matter for eutrophication management? Ambio 2012, 41, 151–160. [Google Scholar] [CrossRef] [PubMed]
- Gini, C. Measurement of inequality of incomes. Econ. J. 1921, 31, 124–126. [Google Scholar] [CrossRef]
- Munnich-Vass, M.; Elofsson, K.; Gren, I.-M. An equity assessment of introducing carbon sequestration in EU climate policy. Energy Policy 2013, 61, 1432–1442. [Google Scholar] [CrossRef]
- Khadam, I.; Kaluarachchi, J. Trade off between cost minimization and equity in water quality management for agricultural watersheds. Water Resour. Res. 2006, 42, W10404. [Google Scholar] [CrossRef]
- Sutcliffe, B. World inequality and globalization. Oxf. Rev. Econ. Policy 2005, 20, 15–37. [Google Scholar] [CrossRef]
- Secondi, G. (Ed.) The Development Economics Reader; Routledge: London, UK, 2008. [Google Scholar]
- Organisation for Economic Co-operation and Development (OECD). Incorporating Green Growth and Sustainable Development Policies into Structural Reform Agendas; OECD: Paris, France, 2012. [Google Scholar]
- Gren, I.-M.; Wulff, F. Cost-effective management of polluted coupled heterogeneous marine basins in the Baltic Sea. Reg. Environ. Chang. 2004, 4, 1–24. [Google Scholar] [CrossRef]
- Baumol, W.; Oates, W. The Theory of Environmental Policy, 2nd ed.; Cambridge University Press: Cambridge, UK, 1988. [Google Scholar]
- NEFCO. Framework for a Nutrient Quota and Credits Trading System for the Contracting Parties of the HELCOM in Order to Reduce Eutrophication in the Baltic; Nordic Environment and Finance Cooperation: Helsinki, Finland, 2008; Available online: https://www.nefco.org/news-media/publications-reports/studyassesment/framework-nutrient-quota-and-credits-trading-systemefco (accessed on 20 March 2018).
- Gren, I.-M.; Elofsson, K. Credit stacking in nutrient trading markets for the Baltic Sea. Mar. Policy 2017, 79, 1–7. [Google Scholar] [CrossRef]
- Sen, A. Development as Freedom; Anchor: New York, NY, USA, 1999. [Google Scholar]
- Gren, I.M.; Säll, S. Cost-effective eutrophication and climate change management in the Baltic Sea. Environ. Econ. 2015, 6, 80–90. [Google Scholar]
- Rosenthal, R. GAMS—A User’s Guide; GAMS Development Corporation: Washington, DC, USA, 2008. [Google Scholar]
- Elofsson, K. Cost uncertainty and unilateral abatement. Environ. Resour. Econ. 2010, 36, 143–162. [Google Scholar] [CrossRef]
- Wulff, F.; Humborg, C.; Andersen, H.; Blicher-Mathiesen, G.; Czajkowski, M.; Elofsson, K.; Fonnesbech-Wulff, A.; Hasler, B.; Hong, B.; Jansons, V.; et al. Reduction of Baltic Sea nutrient inputs and allocation of abatement costs within the Baltic Sea catchment. Ambio 2014, 43, 11–25. [Google Scholar] [CrossRef] [PubMed]
- The World Bank. GDP per Capita. Available online: https://data.worldbank.org/indicator/ny.gdp.pcap.cd (accessed on 26 September 2018).
Figure 1.
Illustration of Lorenz curves for perfect and imperfect equity with respect to allocation of abatement cost in relation to gross domestic product (GDP) among countries.
Figure 1.
Illustration of Lorenz curves for perfect and imperfect equity with respect to allocation of abatement cost in relation to gross domestic product (GDP) among countries.

Figure 2.
Minimum total abatement cost for reaching BSAP targets under different policy regimes with and without mussel farming, billion SEK.
Figure 2.
Minimum total abatement cost for reaching BSAP targets under different policy regimes with and without mussel farming, billion SEK.

Figure 3.
Lorenz curves for abatement costs and GDP under different international policy regimes for reaching BSAP nutrient load targets.
Figure 3.
Lorenz curves for abatement costs and GDP under different international policy regimes for reaching BSAP nutrient load targets.

Table 1.
Allocation of costs between countries for reaching BSAP overall nitrogen and phosphorus targets under different international policy regimes, billion SEK.
Table 1.
Allocation of costs between countries for reaching BSAP overall nitrogen and phosphorus targets under different international policy regimes, billion SEK.
| Countries | Cost-Effectiveness; No Mussel with Mussel | BSAP Country Targets; No Mussel with Mussel | Trading Markets after Trade a; No Mussel with Mussel | |||
|---|---|---|---|---|---|---|
| DEN | 0.83 | 0.85 | 0.04 | 0.04 | 1.14 | 0.71 |
| EST | 1.38 | 1.21 | 1.26 | 1.00 | 1.33 | 1.08 |
| FIN | 0.73 | 0.62 | 0.18 | 0.18 | 2.28 | 1.93 |
| GER | 0.19 | 0.50 | 0.94 | 0.47 | 0.91 | 0.48 |
| LAT | 2.23 | 1.98 | 0.19 | 0.11 | 2.20 | 1.93 |
| LIT | 3.42 | 2.90 | 3.31 | 3.25 | 1.54 | 1.61 |
| POL | 16.80 | 14.50 | 34.99 | 33.19 | 16.20 | 14.78 |
| RUS | 4.46 | 3.84 | 4.46 | 4.30 | 3.13 | 3.11 |
| SWE | 1.00 | 1.21 | 0.49 | 0.48 | 2.32 | 1.99 |
| Total | 31.04 | 27.62 | 45.86 | 43.01 | 31.04 | 27.62 |
a Abatement cost minus costs of purchases or incomes from sales of permits gN = 45 SEK/kg N and gP = 3653 SEK/kg P without mussel and gN = 39 SEK/kg N and gP = 3392 SEK/kg P with mussel farming; DEN (Denmark), EST (Estonia), FIN (Finland, GER (Germany), LAT (Latvia), LIT (Lithuania), POL (Poland), RUS (Russia), SWE (Sweden)
Table 2.
Calculated Gini coefficients under different combinations of inclusion of mussel farming and international nutrient policy regimes.
Table 2.
Calculated Gini coefficients under different combinations of inclusion of mussel farming and international nutrient policy regimes.
| Mussel Farming Option | Cost-Effective | BSAP Country Targets | Nutrient-Trading Markets |
|---|---|---|---|
| No mussel farming | 0.63 | 0.68 | 0.54 |
| With mussel farming | 0.60 | 0.69 | 0.57 |
© 2018 by the authors. Licensee MDPI, Basel, Switzerland. This article is an open access article distributed under the terms and conditions of the Creative Commons Attribution (CC BY) license (http://creativecommons.org/licenses/by/4.0/).
Share and Cite
MDPI and ACS Style
Gren, I.-M.; Säll, S.; Aklilu, A.Z.; Tirkaso, W. Does Mussel Farming Promote Cost Savings and Equity in Reaching Nutrient Targets for the Baltic Sea? Water 2018, 10, 1682. https://doi.org/10.3390/w10111682
AMA Style
Gren I-M, Säll S, Aklilu AZ, Tirkaso W. Does Mussel Farming Promote Cost Savings and Equity in Reaching Nutrient Targets for the Baltic Sea? Water. 2018; 10(11):1682. https://doi.org/10.3390/w10111682
Chicago/Turabian StyleGren, Ing-Marie, Sarah Säll, Abenezer Zeleke Aklilu, and Wondmagegn Tirkaso. 2018. "Does Mussel Farming Promote Cost Savings and Equity in Reaching Nutrient Targets for the Baltic Sea?" Water 10, no. 11: 1682. https://doi.org/10.3390/w10111682
Note that from the first issue of 2016, this journal uses article numbers instead of page numbers. See further details here.