Article

Assessing the Use of Satellite-Based Estimates and High-Resolution Precipitation Datasets for the Study of Extreme Precipitation Events over the Iberian Peninsula

by
Riccardo Hénin
1,
Margarida L. R. Liberato
1,2,*,
Alexandre M. Ramos
1 and
Célia M. Gouveia
1,3
1
Instituto Dom Luiz (IDL), Faculdade de Ciências, Universidade de Lisboa, 1749-016 Lisboa, Portugal
2
Departamento de Engenharias, Universidade de Trás-os-Montes e Alto Douro, UTAD, Quinta de Prados, 5000-801 Vila Real, Portugal
3
Instituto Português do Mar e da Atmosfera, 1749-077 Lisboa, Portugal
*
Author to whom correspondence should be addressed.
Water 2018, 10(11), 1688; https://doi.org/10.3390/w10111688
Submission received: 29 September 2018 / Revised: 5 November 2018 / Accepted: 13 November 2018 / Published: 19 November 2018

Abstract

:
An assessment of daily accumulated precipitation during extreme precipitation events (EPEs) occurring over the period 2000–2008 in the Iberian Peninsula (IP) is presented. Different sources for precipitation data, namely ERA-Interim and ERA5 reanalysis by the European Centre for Medium-Range Weather Forecast (ECMWF) and Tropical Rainfall Measuring Mission (TRMM) Multisatellite Precipitation Analysis (TMPA), both in near-real-time and post-real-time releases, are compared with the best ground-based high-resolution (0.2° × 0.2°) gridded precipitation dataset available for the IP (IB02). In this study, accuracy metrics are analysed for different quartiles of daily precipitation amounts, and additional insights are provided for a subset of EPEs extracted from an objective ranking of extreme precipitation during the extended winter period (October to March) over the IP. Results show that both reanalysis and multi-satellite datasets overestimate (underestimate) daily precipitation sums for the least (most) extreme events over the IP. In addition, it is shown that the TRMM TMPA precipitation estimates from the near-real-time product may be considered for EPEs assessment over these latitudes. Finally, it is found that the new ERA5 reanalysis accounts for large improvements over ERA-Interim and it also outperforms the satellite-based datasets.

1. Introduction

A better understanding of both weather and climate extremes has been indicated as one of the World Climate Research Programme (WRCP) Grand Challenges for the coming years [1]. The variability of weather extremes across different temporal and spatial scales is one of the research topics for which this cross-community challenge expects significant advances, in view of the new uncertainties due to ongoing climate change. On the other side, the predictability of these extremes is an issue of concern for operational forecast services which directly provide their products to local authorities and to the general public. Extreme precipitation events (EPEs) are responsible for a relevant number of natural disasters, including landslides, flash-floods, and material destruction. The socio-economic impacts associated to EPEs, namely human casualties and rebuilding costs, have become of great interest for both decision makers and insurance companies [2,3]. As a matter of fact, precipitation extremes affect the water cycle as a whole, with several implications also for hydrology and water reservoir management [4].
Over the Iberian Peninsula (IP) an objective ranking of EPEs has been provided at daily [5] and multi-day scales [6] for the extended wintertime season (October to March), based on the high-resolution (0.2° × 0.2°) ground-based precipitation dataset IB02 (further details are provided in Section 2.2). Some significant EPEs which occurred in the past have been examined both in terms of mechanisms and related impacts [7,8,9,10,11]. Given the high temporal and spatial variability of IP climatology [12,13], some studies also focus on sub-regions of the IP that are affected by specific weather regimes [14,15,16]. The precipitation enhancement over the IP includes different mechanisms, mostly convection to the south [17,18], synoptic forcing and water vapor transport to the west and to the north [19,20,21], and orographic effects [22]. Depending on the season, different precipitation regimes have been observed over the IP: for some regions most of the annual precipitation is observed during the winter months, whereas summer may be totally dry [23,24]. The annual cycle of precipitation captured by the IB02 and other global precipitation datasets (including ERA-Interim) is described in [25]. The spatial and temporal variability of accumulated extreme precipitation typically show local maxima that can be detected only using high-resolution gridded products or data from traditional weather stations. A ground-based network is able to map the precipitation pattern only at a coarse scale, especially over complex topography and over the oceans, where the coverage provided by rain-gauges and weather buoys is inhomogeneous. However, accurate estimates of rainfall are essential for the risk assessment of any water-related natural hazards. In this sense, reanalysis datasets and satellite-based measurements are highly beneficial as they fill the observational gaps and they guarantee continuous spatial and temporal data coverage, even if the extreme precipitation days are not modelled very accurately [26]. Since the early modern satellite era, several missions have been operating, but intrinsic limitations of the specific on-board sensor’s technology as well as propagation and atmospheric attenuation effects still limit the quality of the satellite data [27,28]. Increasing the spatial resolution of a single sensor always implies higher uncertainties for the final product but thanks to new algorithms that combine data from different sources, high resolution and high-quality products are being made available [29,30,31,32]. Latest advances of the most recent multi-satellite missions include coincident measurements from both active and passive on-board sensors with cross-calibration techniques and additional post-processing routines. The Tropical Rainfall Measuring Mission (TRMM) [33], headed by the National Aeronautics and Space Administration (NASA) and the Japanese Aerospace Exploration Agency (JAXA), provides data from November 1997 and releases different precipitation products (both in near-real-time and post-real-time) widely used for monitoring, modelling, and research, also beyond the tropics. The TRMM has been recently incorporated into the wider Global Precipitation Measurement Mission (GPM) and its products serve as a reference for the new generation of GPM precipitation retrievals [34,35]. The main goal is to promote advances in the quality of satellite estimates beyond tropical latitudes, for them to be beneficial for the study of extra-tropical cyclones and related precipitation.
Although EPEs are quite common over the IP, it is not ascertained yet which product, either reanalysis or satellite estimates, is the most appropriate for studying extreme precipitation days. An inter-comparison of different reanalysis datasets to a ground truth is pursued in [25], showing that there is a seasonal cycle of the ERA-Interim performance over the IP, with best scores attained in winter. On the contrary, satellite products such as the ones provided by the TRMM have been barely studied at the extratropical latitudes, and their potentiality has not yet been fully assessed over the IP. In a study by Liu and Zipser [36] the need for such an analysis, to be conducted for in-depth case studies and under different precipitation regimes, is stressed. The present work is intended as a follow-up to [37] where a preliminary assessment of four EPEs that occurred over IP has been carried out using both ERA-Interim and TRMM data. It aims at assessing which high resolution precipitation datasets provides for the most reliable estimates during heavy rain episodes over the IP, thus being beneficial for any future investigation of EPEs over the region. Additional data sources with respect to [37] are considered, namely ERA5 and the near-real-time product of TRMM mission. Given the increasing interest on multi-satellite products, this analysis will also serve as an extensive test for TRMM precipitation estimates over the midlatitudes, which are beyond the optimal operational band of the on-board instruments used for retrieval. Finally, new insights are provided through the intra-products comparison, at the regional scale, between the near-real-time and the post-real-time TRMM products during EPEs over the IP.
The paper is organized in four sections. After the Introduction, the different datasets used are described in Section 2, namely the dataset for extreme precipitation events over the IP (Section 2.1) and the gridded and satellite datasets for precipitation (Section 2.2). Section 2.3 explains how data from different sources are manipulated to be effectively combined in time and space and how the assessment is conducted. Results are presented and discussed in Section 3, firstly focusing on the assessment of precipitation all over the common period (Section 3.1 and Section 3.2), and secondly focusing only on a specific subset of EPEs which occurred during the extended wintertime season (Section 3.3). Finally, conclusions are drawn in Section 4.

2. Materials and Methods

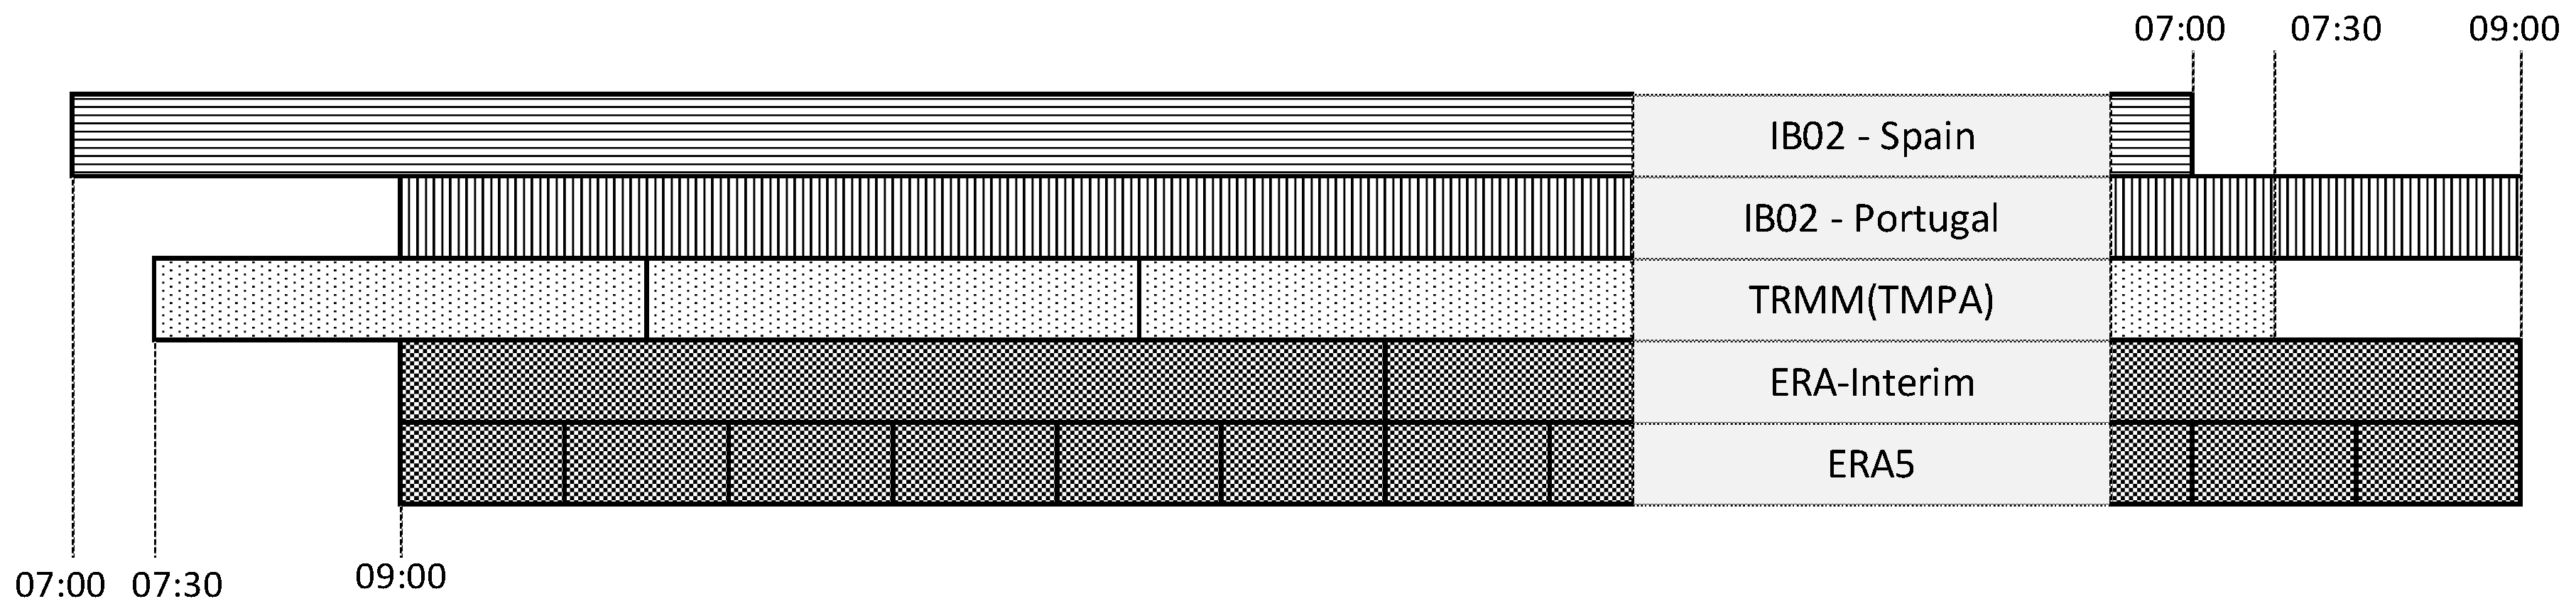
2.1. Precipitation Datasets

2.1.1. Ground-Based Precipitation Dataset IB02

In the present study, different data sources are considered for precipitation estimates. At first, the most comprehensive gridded, high-resolution (0.2° × 0.2°) available database of daily precipitation for the IP is used as ground truth (IB02 hereafter). It is produced by joining two individual national datasets from Portugal (PT02) and Spain (SP02), respectively [25,38]. Both datasets refer to the same 0.2° × 0.2° latitude/longitude grid, obtained by interpolation of rain gauge data through an ordinary kriging method and an additional inverse distance weighting method (IDW) for the Portuguese dataset only. Albeit with some inevitable temporal variations in the rain gauges density, both the Spanish and Portuguese networks cover the period from 1950 to 2008. Totally, more than 2400 weather stations provided data for IB02. Several quality control procedures have been applied to the data, such as a plausible value check, internal consistency checks, and a standard normal homogeneity check (the authors refer to [25] for more details and references on these procedures as well as for network coverage).
In IB02 precipitation records are summed to provide for daily values, but the accumulation period is slightly different for Spain and Portugal. Given a day n, daily precipitation over Portugal is accumulated between 09:00 UTC of day n − 1 and 09:00 UTC of day n. On the contrary, daily precipitation over Spain ranges from 07:00 UTC of day n to 07:00 UTC of day n + 1. For consistency, the Portuguese dataset is shifted one day forward in IB02. It is believed that, unless an event strictly peaks during the time lag, the defined accumulation period is robust and no artificial features are found at the border between the two countries. Other studies made use of precipitation data from IB02 for real case study analysis [10,37] and for more extensive assessments [39,40,41].

2.1.2. Reanalysis Datasets

Precipitation estimates from the widely used ERA-Interim reanalysis product of the European Centre for Medium-Range Weather Forecast (ECMWF) are considered for comparison with the ground-based IB02 dataset. ERA-Interim global reanalysis [42] is available from 1979 onwards, but only the period 2000–2008, the common period of the satellite-based dataset and the EPEs ranking, is considered in this study. The ERA-Interim 6-hourly values of accumulated precipitation are extracted and aggregated into daily sums. Precipitation data originally come at 0.75° of horizontal resolution and they are projected through bilinear interpolation onto the same 0.2° × 0.2° grid of IB02 (see Section 2.3 for further details). Recently, a new generation of reanalysis product—ERA5—has been released, with hourly data from 2000 to within three months of real time (but expected to be extended back in time until 1950). ERA5 will eventually replace the ERA-Interim [43]. Hence, it is beneficial at this stage to assess both products over the IP. Both the horizontal (from 0.75° to 0.25°) and the vertical (from 60 to 137 levels) resolutions are improved in ERA5. In the following analysis, the same interpolation method as for ERA-Interim is used to match with the IB02 grid.

2.1.3. TRMM TMPA Datasets

In addition, two precipitation products from the Tropical Rainfall Measurement Mission (TRMM) are used [33]. The main purpose of the mission is to provide a new understanding of the distribution and variability of precipitation and energy exchanges in the tropical and subtropical regions of the world, especially during storms [44]. Onboard instruments [45,46] include a visible and infrared scanner (VIRS), a microwave imager (TMI), a precipitation radar (PR), and a lightning imaging sensor (LIS). The TRMM Multisatellite Precipitation Analysis (TMPA) products are the most popular in the TRMM mission: they account for precipitation retrievals algorithms that incorporate multiple-sensor and multi-satellite data in addition to in-situ observations, yielding to an unprecedented accuracy of precipitation estimates [33]. The products belong to Version 7 of the 3B42 algorithm, both in the near-real-time (6–9 h after present time) and post-real-time releases [47]. Latest improvements of Version 7 mainly come from additional satellites and a uniform ground-based adjustment [48,49]. The near-Real-Time product (for simplicity hereafter referred as TRMM RT) only depends on microwave and infra-red data, and it is computed few hours after real time; the research-grade product (hereafter referred as TRMM) is differently calibrated and it is adjusted to monthly values [47]. According to the author of [50], the former provides quick and less accurate estimates on a global scale, suitable for monitoring activities, whereas the latter is designed to provide estimates more appropriate for research purposes. Data are made available from 1997 and 2000, respectively. For both TRMM and TRMM RT (together referred as TRMM TMPA products), data are provided onto a 0.25° × 0.25° grid and they cover the latitudinal band 50° N to 50° S even though many efforts are being made, in the framework of the GPM mission which is going to include the TRMM mission, to further extend the coverage beyond the extra-tropics.
Several studies already focused on areas beyond the inclined latitude band of the TRMM satellites [51,52] and explore the differences between the two products [4,53]. The research-grade product is more widely used for regional studies worldwide as in America [54,55], in the Mediterranean domain [56,57], and over Iberia [14,37,58]. In [57,59], high (light) precipitation events tend to be under (over) estimated. The authors of [52,59] addressed the suitability of both TRMM TMPA products over river basins in China for predicting river streamflows and water resources in the context of hydrological extremes. Besides the good results obtained in [53] for a TMPA-driven hydrological model for river streamflow, large differences were found over latitude by the authors of [60] with over (under) estimation of precipitation affecting high (low) latitudes. The accuracy of the TRMM TMPA estimates was also shown to vary among seasons: [53] found the worst performances over three different regions in northern China during winter, also because of the ice and snow cover affecting the retrieval algorithms. On the contrary, winter (and summer) accounted for the best results over Iberia in [58]. However, the accuracy of a single product can change from one region to another [60], mainly because of different rainfall regimes (the more convective the precipitation, the more accurate satellite estimates are), because of the surface conditions and also because of the reliability of the ground-based dataset used for validation. Given this variety of results, further investigations are surely needed.

2.2. Extreme Precipitation Events (EPEs) Dataset for IP

In this work the ranking of high-resolution winter daily precipitation extreme events developed by [5] is used. It is the most comprehensive database available for EPEs over the IP. It accounts for daily accumulated precipitation, from 1950 to 2008, for the extended wintertime (October to March), as summer precipitation is not significant over most of the IP domain [23,24]. Given the high spatial variability of precipitation regimes over IP, the events are ranked according to an index that takes into account both the anomaly of precipitation and the extension of the area affected by the anomaly. In more detail, the normalized precipitation departure from seasonal climatology is evaluated for each grid point and for all days and it reads:
  N =   P μ σ  
where P is the daily precipitation sum, μ is the 7-day running mean for that day, and σ is the standard deviation from that mean. Then, the area affected is defined by the number of grid points which have precipitation anomalies exceeding two standard deviations (2 σ ). A mean value for this anomaly is defined over the selected area and the ranking index is defined by multiplying the two quantities. It is worth saying that the 2 σ threshold does not substantially differ from the 95th percentile of the daily precipitation distribution, which is typically considered as a reference for attributing extremes. For further details, the authors suggest directly referring to [5].

2.3. Temporal-Spatial and Intensity Assessment

The four precipitation datasets described in Section 2.1 are matched in time and space for direct comparison and EPEs assessment. That is, precipitation values from ERA-Interim (6 h) and ERA5 (1 h) reanalysis as well as from TRMM TMPA products (3 h) are aggregated into daily (24 h) sums over the common period 2000–2008 and over the same 0.2° × 0.2° latitude/longitude grid of the IB02, through bilinear interpolation. However, the accumulated periods do not exactly overlap, because of the different timing each when product is made available (Figure 1). The IB02 accounts for daily values from 07:00 (09:00) UTC of day n to 07:00 (09:00) UTC of day n + 1 for Spain (Portugal) respectively. ERA-Interim is then accumulated by summing four timesteps (12:00 UTC and 18:00 UTC of day n, 00:00 UTC and 06:00 UTC of day n + 1) so that daily values cover the interval from 09:00 UTC (day n) to 09:00 UTC (day n + 1). The accumulation period for ERA5 is one hour before each timestep. Therefore, ERA5 daily precipitation is computed by summing 24 hourly timesteps (10:00 UTC of day n to 10:00 UTC of day n + 1) so that daily values cover the same interval as for ERA-Interim. On the contrary, TRMM TMPA products are available at 3-h timesteps, making possible to define a backward (from 07:30 UTC of day n to 07:30 UTC of day n + 1) and a forward (from 10:30 UTC of day n to 10:30 UTC of day n + 1) accumulation period with respect to the reanalysis accumulation period. In order to achieve the best possible match among the four datasets considered, the backward period is used. A mask is applied to all the datasets so that only grid points of continental Iberia with daily precipitation exceeding 2 mm·day−1 are considered for this analysis.
For the assessment of precipitation among data pairs a set of four accuracy metrics is considered [61] namely the Pearson linear correlation coefficient (r, Equation (2)), the percentage bias (%BIAS, Equation (3)), the root mean square error (RMSE, Equation (4)) and the mean absolute error, (MAE, Equation (5)). The corresponding formulae read (taking ERA5 as an example):
  r = c o v ( E R A 5 , I B 02 ) σ E R A ×   σ I B 02  
  % B I A S =   ( E R A 5 I B 02 ) I B 02   × 100  
  R M S E =   1 N ×   ( E R A 5 I B 02 ) 2  
  M A E =     ( E R A 5 I B 02 ) n  
where n in the number of data pairs considered, and cov is the covariance and σ is the standard deviation. The equations hold similarly for ERA-Interim, TRMM, and TRMM RT.
Each index is evaluated through a grid-to-grid procedure based on the 0.2° × 0.2° IB02 grid. With such an approach, it is worth noting that both the intrinsic interpolation scheme of IB02 and the interpolation required for the other datasets to match with IB02 constitute a source of uncertainty. In those cases, precipitation extremes may be misrepresented, especially over regions of complex topography [62]. However, the IB02 already accounts for several quality control procedures and internal consistency checks and its robustness has been already assessed [25]. On the other hand, an area average approach would clearly smooth any local extremes [58] and it would not be suited for the current analysis.
Finally, in order to have insights on the weaknesses and strengths of each of the dataset considered, the total bias is split into three components [54]. This procedure allows to distinguish three different bias sources with respect to IB02, namely the bias due to successful detection (hit bias, HB), the bias due to misses (missed rain bias, MB) and the bias due to false alarms (false rain bias, FB). They are defined as follows (taking ERA5 as an example):
  H B = P E R A 5   ( P E R A 5 > 2   &   P I B 02 > 2 ) P I B 02 ( P E R A 5 > 2   &   P I B 02 > 2 )  
  M B = P I B 02   ( P E R A 5 2   &   P I B 02 > 2 )  
  F B = P d a t N   ( P E R A 5 > 2   &   P I B 02 2 )  
where PERA5 is the precipitation at the specific grid point from ERA5 (but it holds similarly for the other datasets) and PIB02 is the precipitation at the corresponding grid point from IB02. The sums run all over the grid points of the continental IP and the sum of the three components gives the total bias. Given the values described in Equations (6)–(8), it is possible either to obtain the fraction of total bias explained by each bias source or the average of each bias source per grid point.

3. Results

3.1. IB02 Precipitation Dataset

IB02 dataset covers the period from 1950 to 2008, although the spatial coverage of the station network may vary through, as described in [25]. However, reanalysis data and satellite retrievals from the TRMM mission are made available only later, since 1979 and 2000, respectively. Thus, a preliminary control on how the common 2000–2008 period is representative of the entire dataset is necessary. The mean daily precipitation is evaluated, for the all year and for the wintertime period, from three different time-windows, namely the entire 59-year IB02 dataset, the standard 30-year climatological mean, and the 9-year common period used in this study. As shown by the results summarized in Table 1, no relevant changes occur in the climatology between the three considered periods. The mean of daily precipitation, averaged over the whole IP, remained substantially similar between the 50-year and 30-year periods (10.28 mm·day−1 and 10.24 mm·day−1, respectively). Over the last decade available, the daily mean slightly decreases below the 10 mm·day−1 threshold. Considering only the extended winter months (October to March), the values of mean daily precipitation are slightly larger than for all-year (Table 1), but they show the same behaviour over the time on the IP. The two standard percentiles thresholds for extremes are also considered. In this case, the mean precipitation daily values over IP are slightly lower during 1979–2008 (29.03 mm·day−1 and 48.37 mm·day−1 for the 95th and 99th percentile, respectively) than during 1950–2008 (29.12 mm·day−1 and 48.77 mm·day−1), and they decrease again over the last 9 years (28.42 mm·day−1 and 47.47 mm·day−1, respectively). However, all these values are in agreement (28–29 mm·day−1 and 47–48 mm·day−1, for the 95th and 99th percentiles, respectively) and thus it may be considered that the three periods are comparable. Still, the difference between extended winter and all-year percentiles values, serves as a proof of the seasonal variability of precipitation over IP.
It should be noted that this control over different time periods is not aiming at dragging conclusions over the climatology of Iberia. The purpose indeed is to show that the last 9 years available are quite well representative of the entire IB02 dataset and this justifies the use of the common period of 2000–2008, even though it is not particularly long, throughout this analysis.

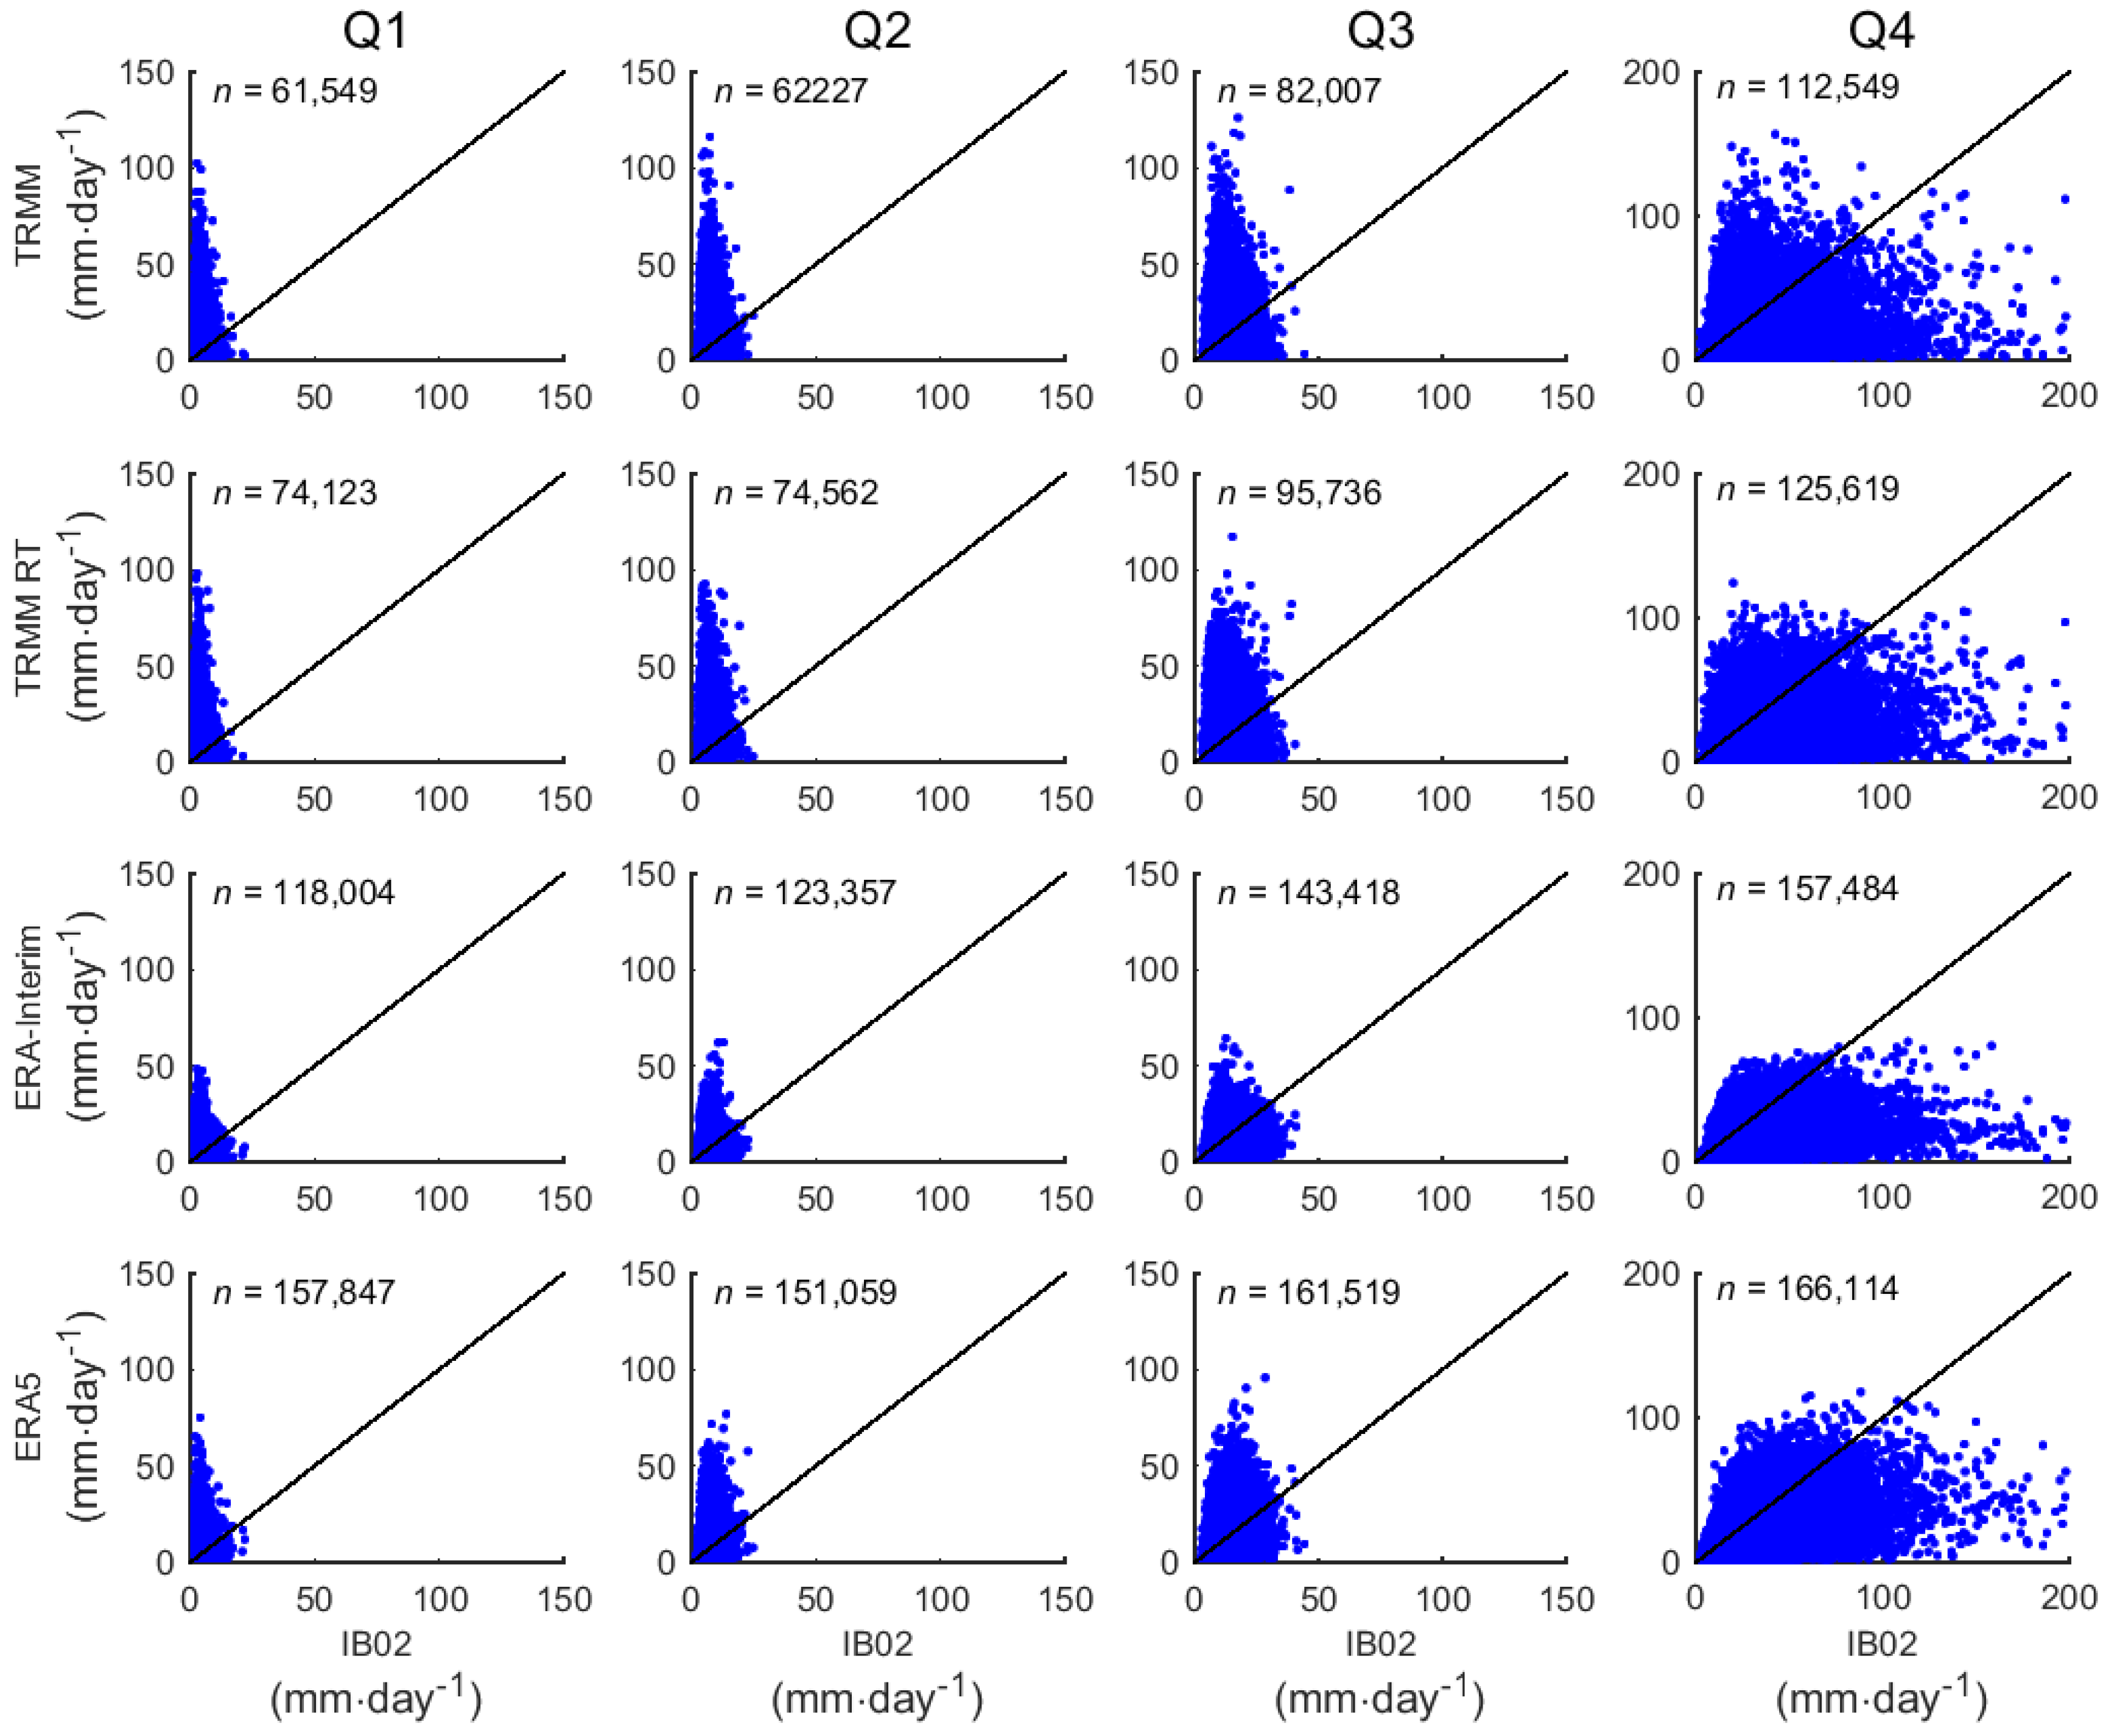
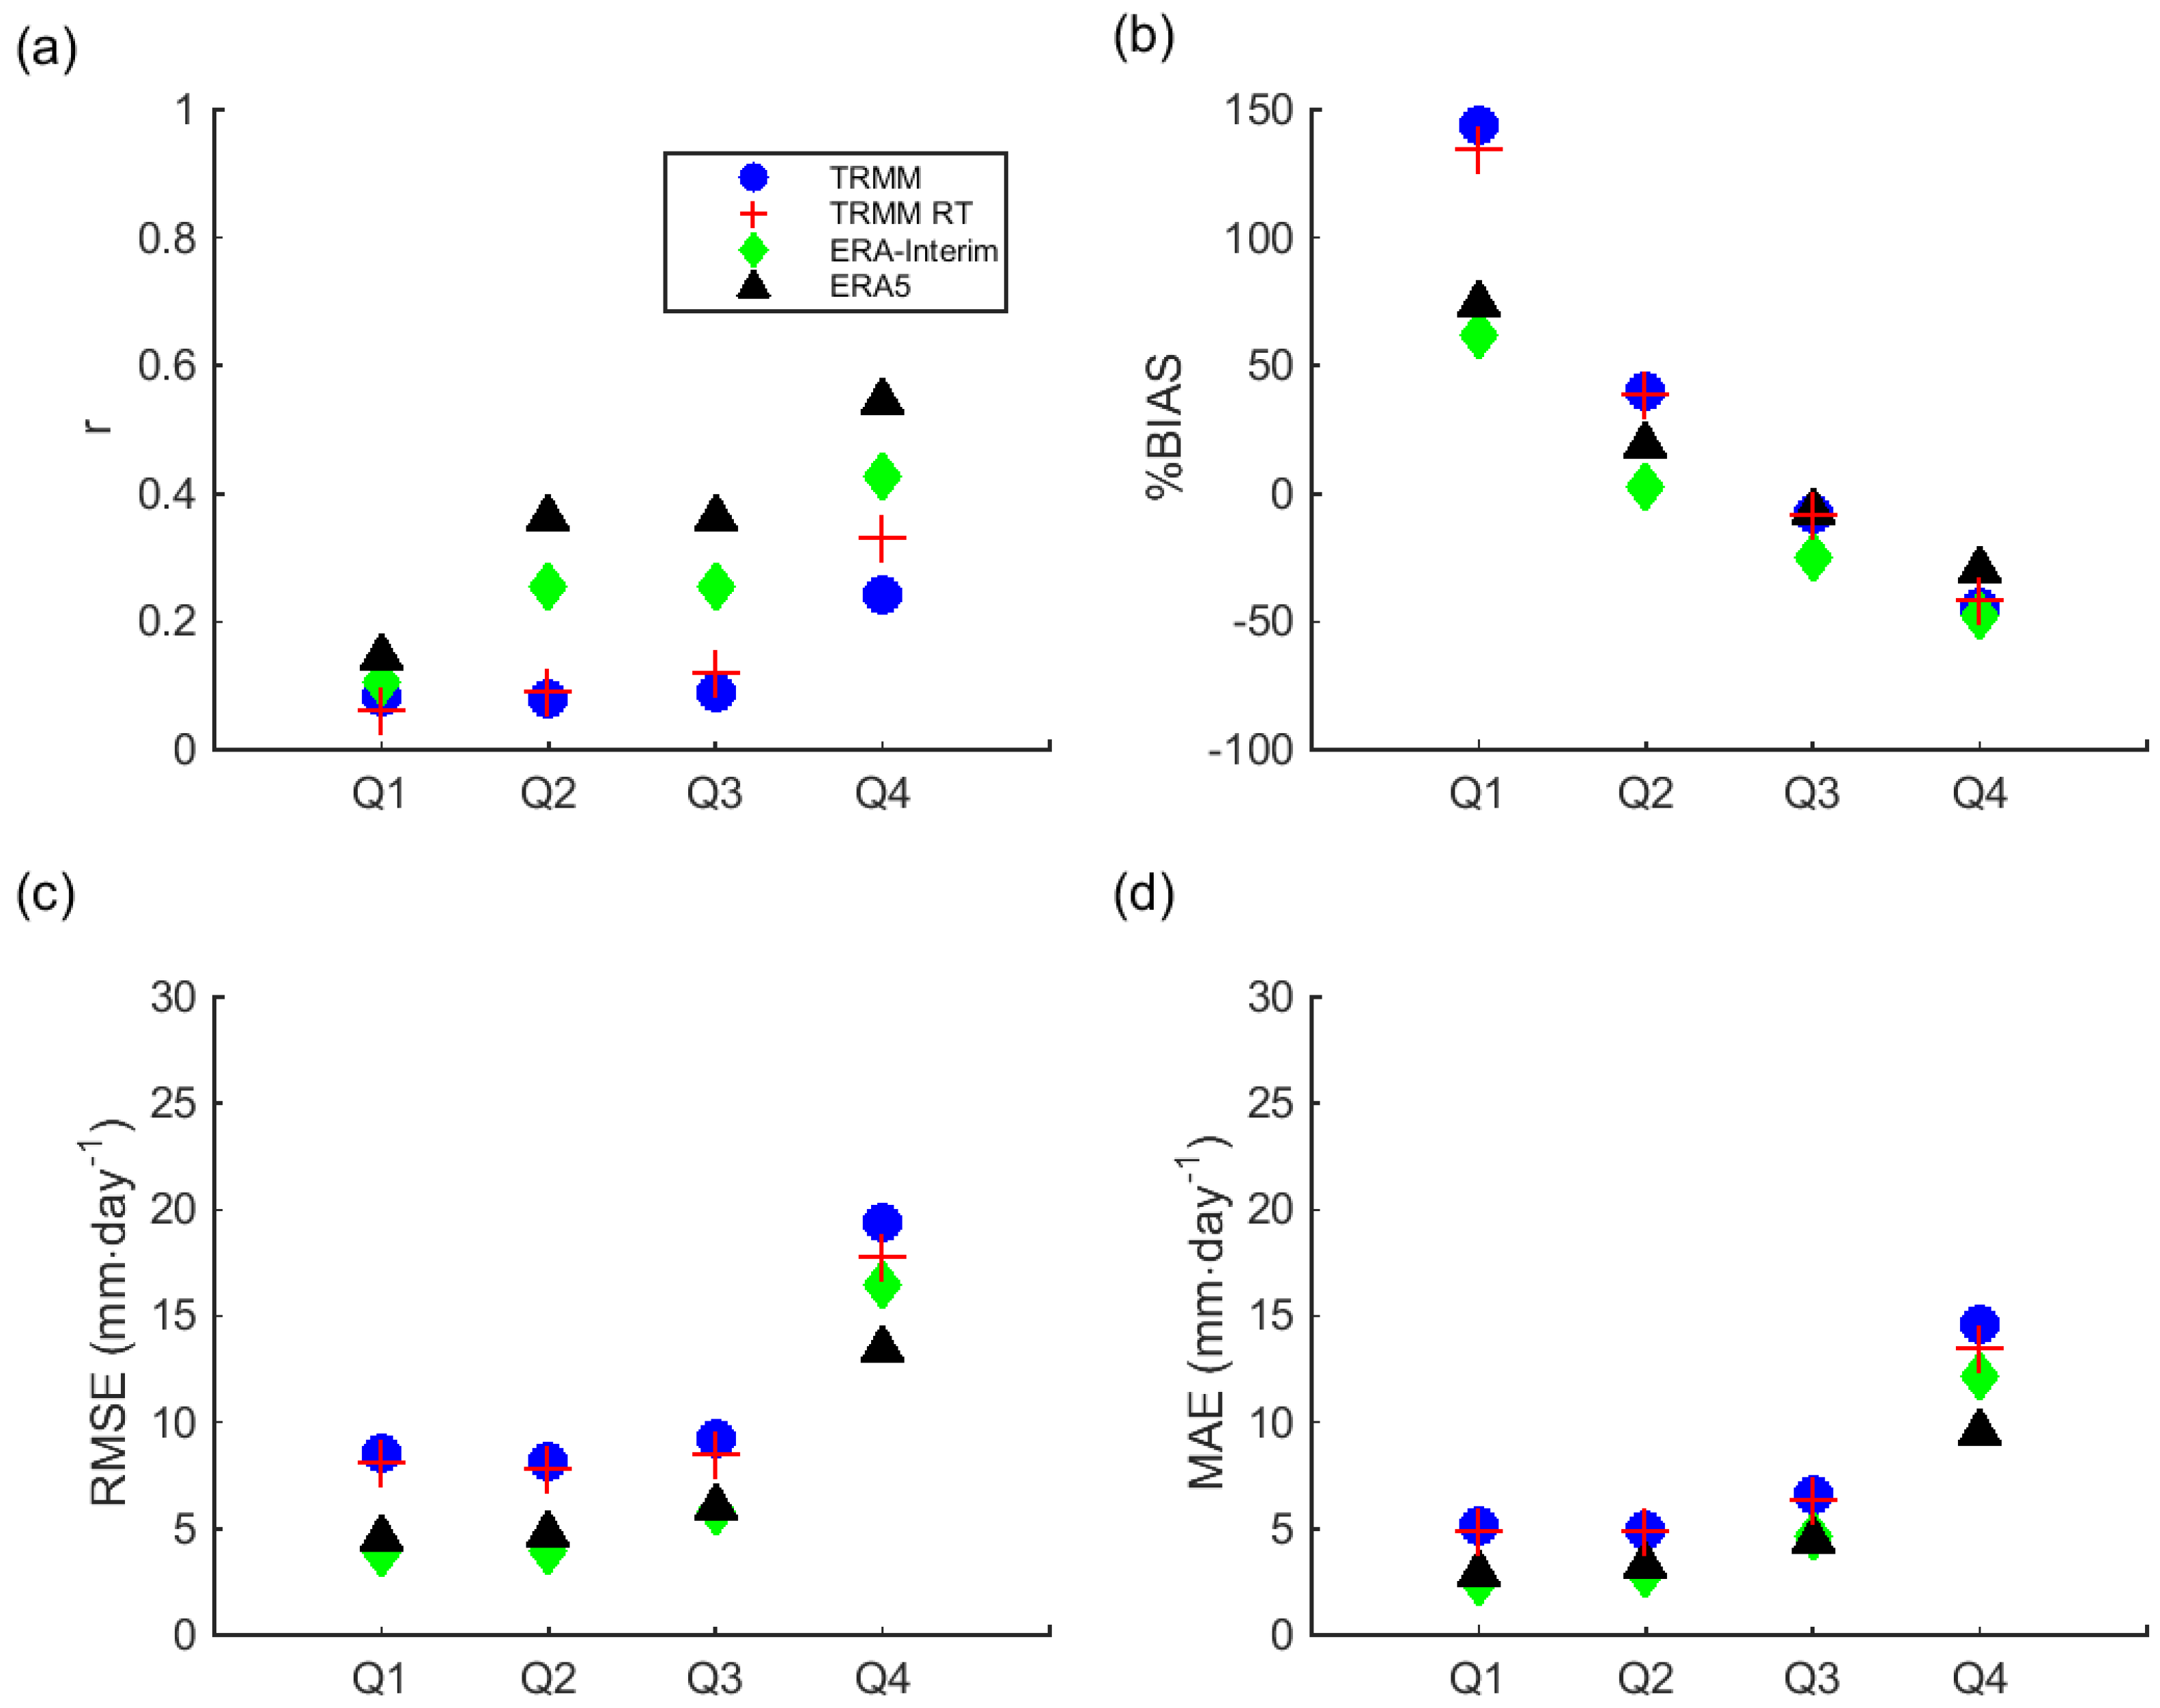
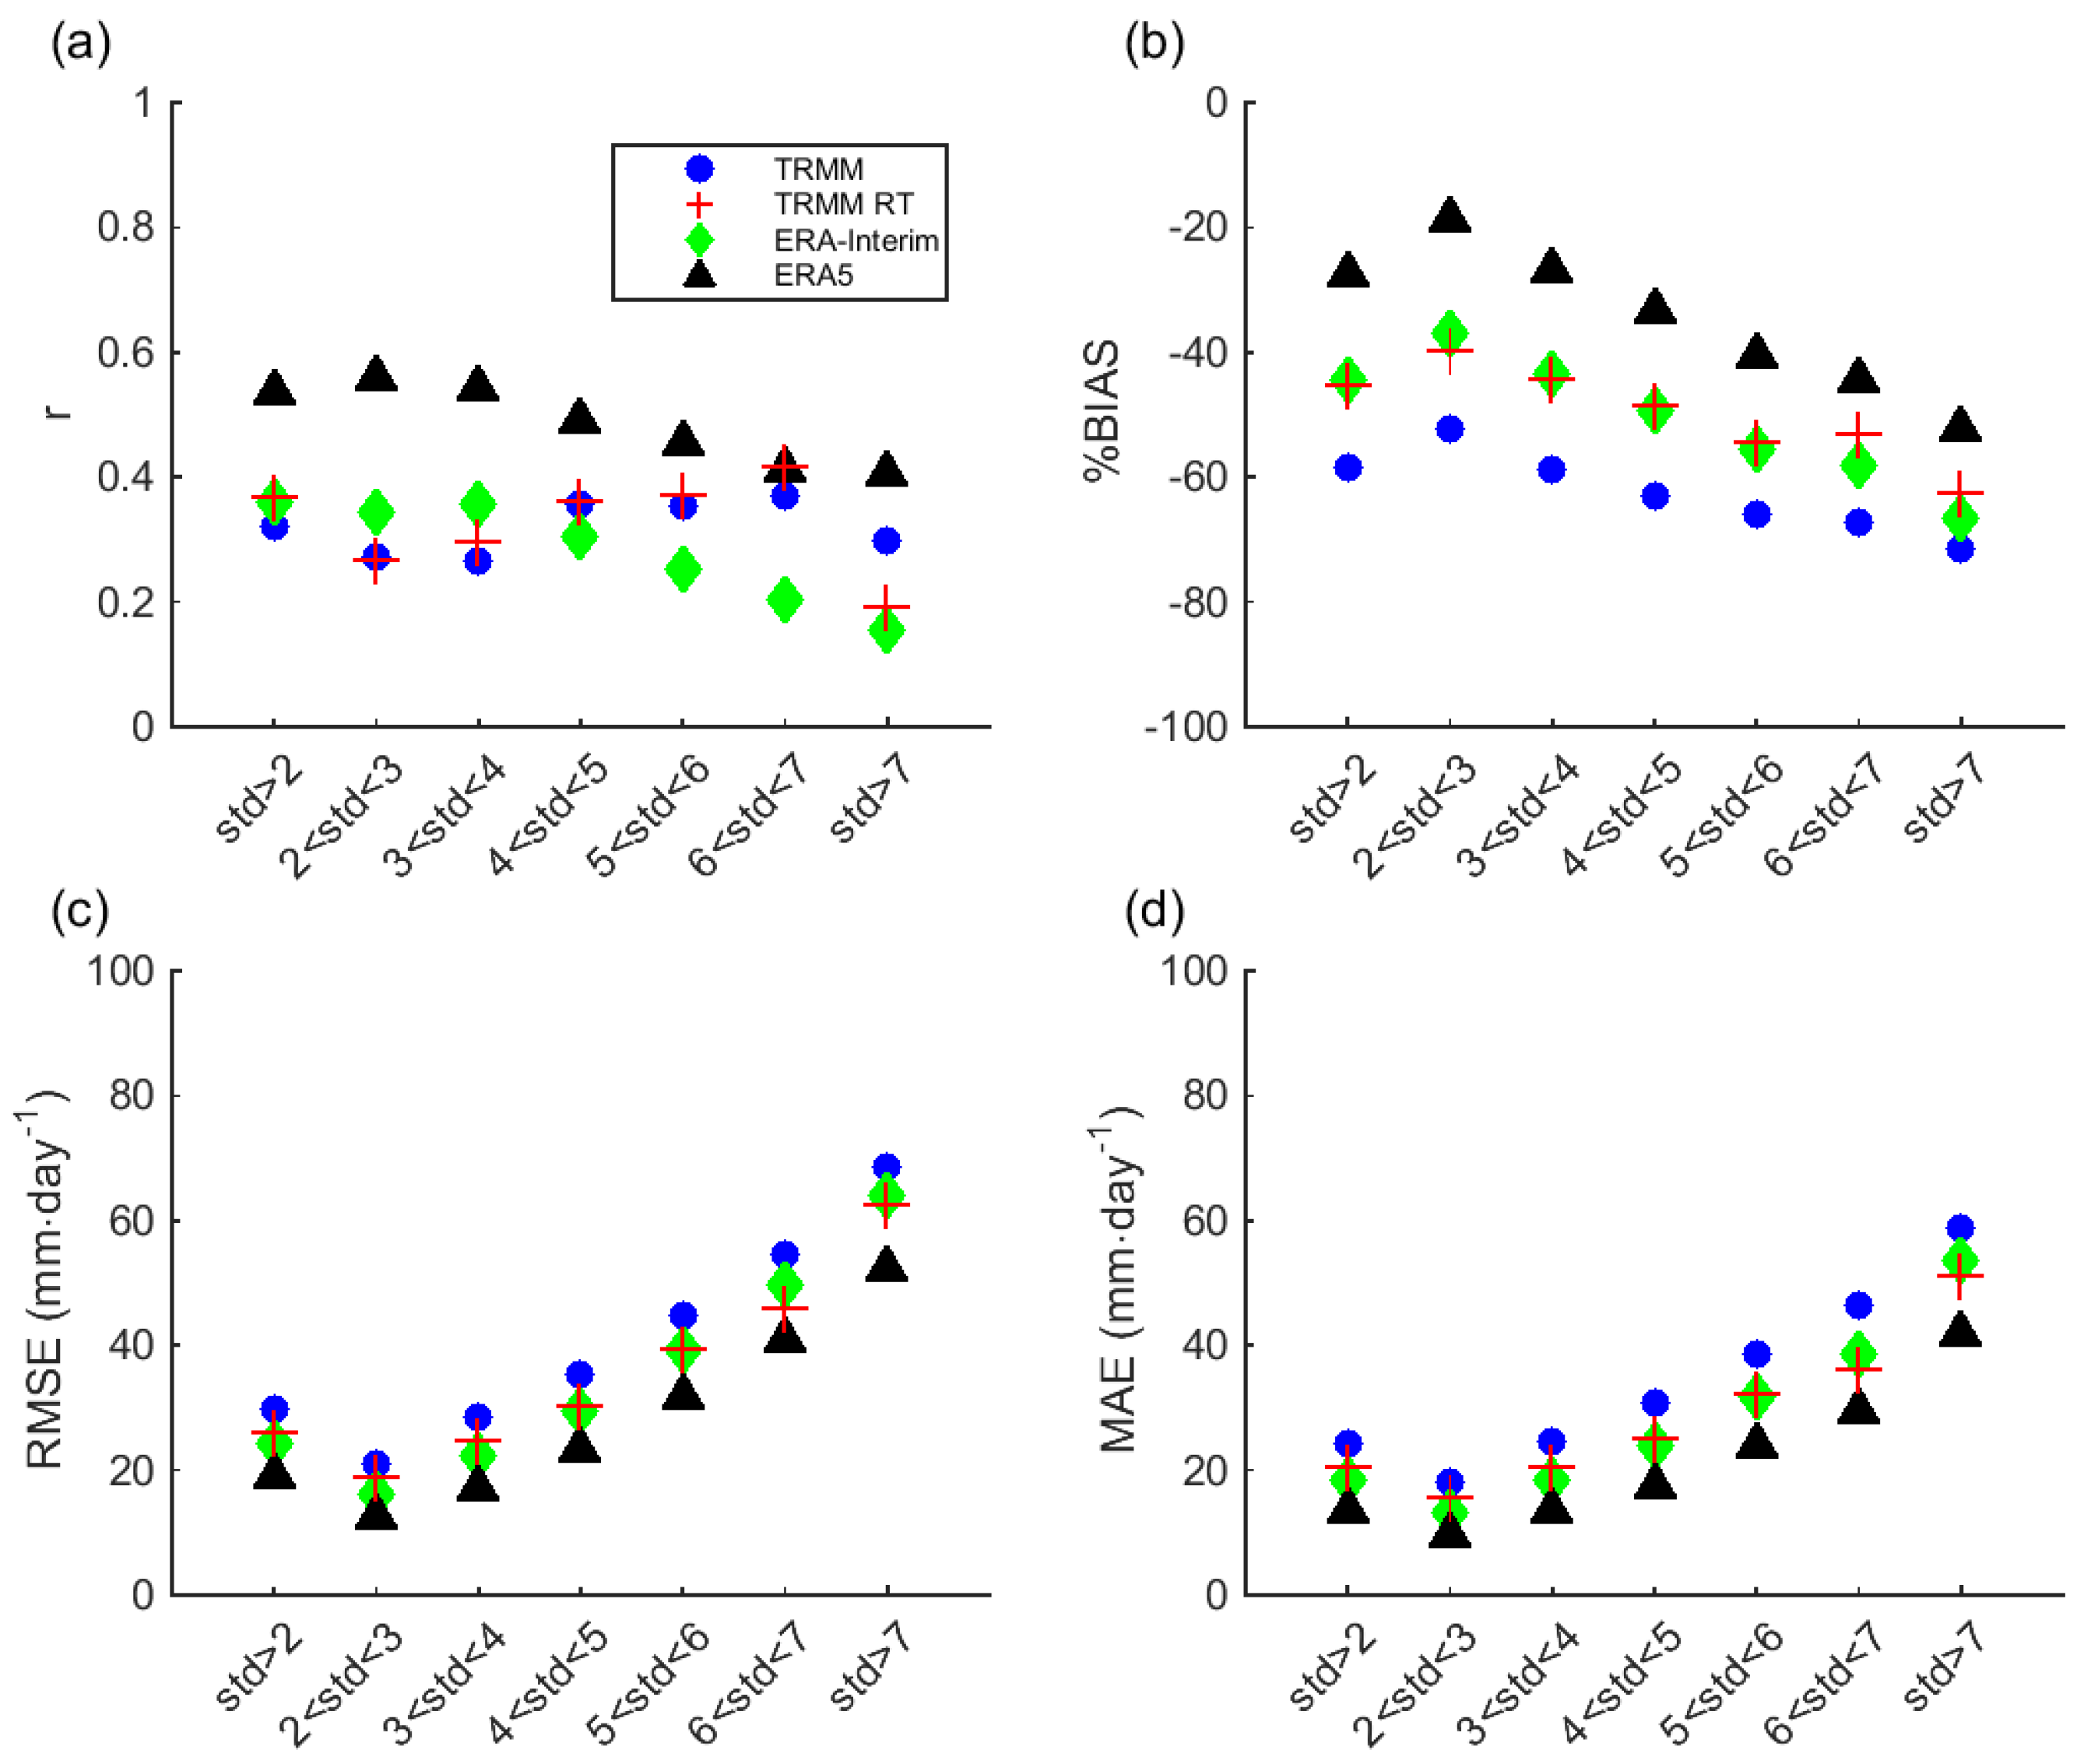
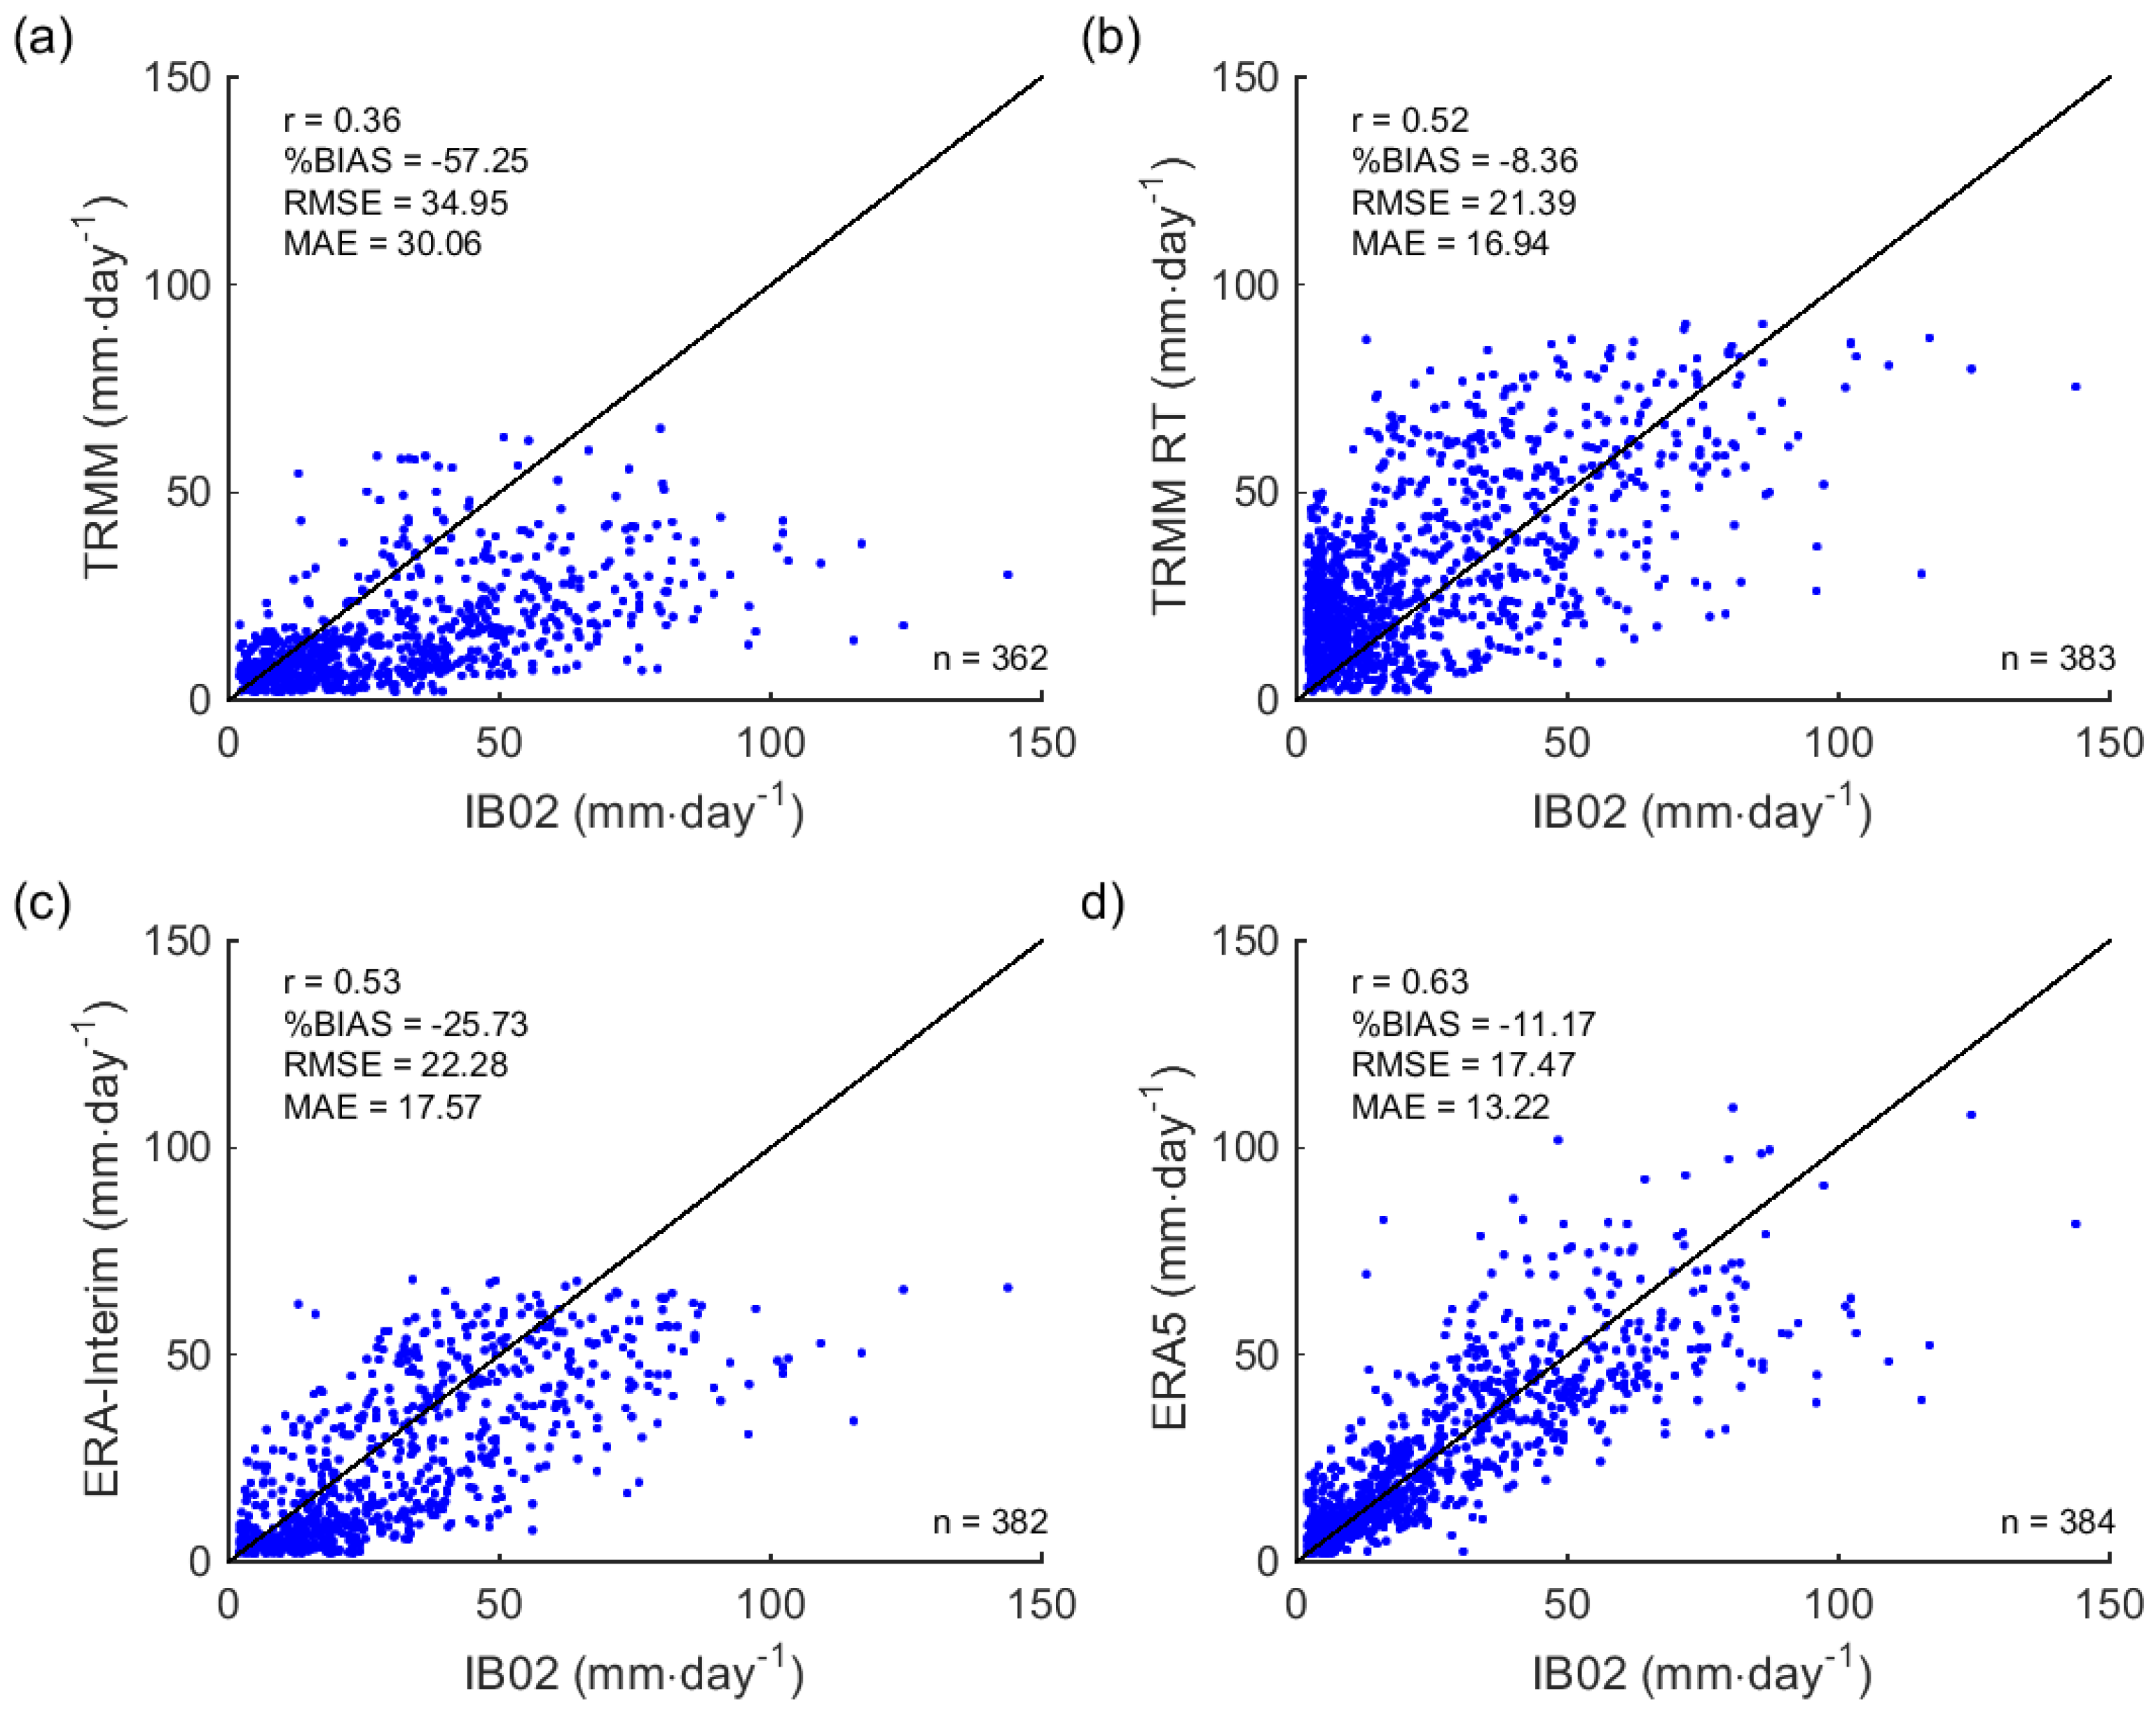
3.2. Accuracy Metrics for Quartiles of IP Precipitation for All Year on the Period 2000–2008

At first, the accumulated daily precipitation at each grid point during the 2000–2008 common period is classified in quartiles, according to the 25th/50th/75th percentiles for the daily precipitation, evaluated separately for each grid point and for each day of the year. The percentiles are given by the 7-year running mean all over the IB02 dataset (1950 to 2008). Throughout this section, the analysis is conducted for all days of the common period 2000–2008 and for the four quartiles separately, Q1 being the weakest one and Q4 the most extreme one.
Figure 2 includes the scatterplots of measured daily precipitation measured daily precipitation (mm·day−1) from IB02 versus the estimates from TRMM, TRMM RT, ERA-Interim, and ERA5, respectively.
For TRMM TMPA products, Q1 to Q3 data pairs are clustered more closely to the satellite estimates. On the contrary, the points belonging to Q4 spread closer to the identity line. ERA-Interim and ERA5 show the same pattern as described for the satellite products, the only difference being a higher correspondence between estimates and ground-based values also for Q3. As it is defined, Q4 includes the data pairs where IB02 daily precipitation exceeds the 75th percentile, that is, also the grid points with actual extreme precipitation. The fact that in the related scatterplots, a lot of points still spread close to the zero (of both x and y axes) is to be expected. The first case in fact relates to the underestimation of precipitation by the specific dataset considered, which is the larger for extreme events (as shown later). The second case comes from the IP grid points whose 75th percentiles for daily precipitation are very low, as it may occur over some inland and southern areas and during the drier months of the year.
The correlations coefficients (Figure 3a) indicate very low correlation for Q1 (all datasets below 0.2). They indicate low correlation also for Q2 and Q3 and a still poor but higher correlation for Q4 (0.26, 0.34, 0.43 and 0.54 for TRMM, TRMM RT, ERA-Interim, and ERA5, respectively). Both the reanalysis products perform better than TRMM (TMPA) products for all the quartiles and the main difference is observed for the intermediate quartiles Q2 and Q3, as suggested by the scatterplots. It is observed that the more the quartile includes higher precipitation data pairs, the more TRMM RT outperforms TRMM.
All the annual datasets considered show a positive (negative) %BIAS for Q1 and Q2 (Q3 and Q4) with respect to IB02 (Figure 3b). That is low (high) daily precipitation events over IP are overestimated (underestimated) by global datasets. The reanalysis products show the best adjustment to IB02 for Q1 and Q2, with ERA-Interim outperforming ERA5. On the contrary, ERA5 improves ERA-Interim for Q3 and Q4 and it turns out to be the best of all datasets for the most extreme quartile (−30% BIAS). In term of %BIAS, the TRMM RT product is equal to that of TRMM except for Q1, where both the TRMM TMPA products have poor performance (+144% and +133% BIAS, respectively).
Both the error metrics, namely the RMSE (Figure 3c) and MAE (Figure 3d), increase with increasing extremeness of the precipitation. Values of RMSE jump from Q3 to Q4 from less than 10 mm·day−1 to almost 20 mm·day−1, as clearly visible by the large degree of dispersion around the fitted line in the scatterplots (Figure 2). The MAE also increases the most from Q3 to Q4 (4–6 mm·day−1 to 9–15 mm·day−1). This behaviour is somehow expected as the spatio-temporal pattern of precipitation is more complex for heavy and extreme events because of localized peaks of rainfall and local effects of enhancement. Consistently with the other annual metrics, reanalysis datasets perform better than the TRMM TMPA products (ERA5 performs best for Q4) and TRMM RT outperforms the TRMM as far as the quartiles include more extreme values.

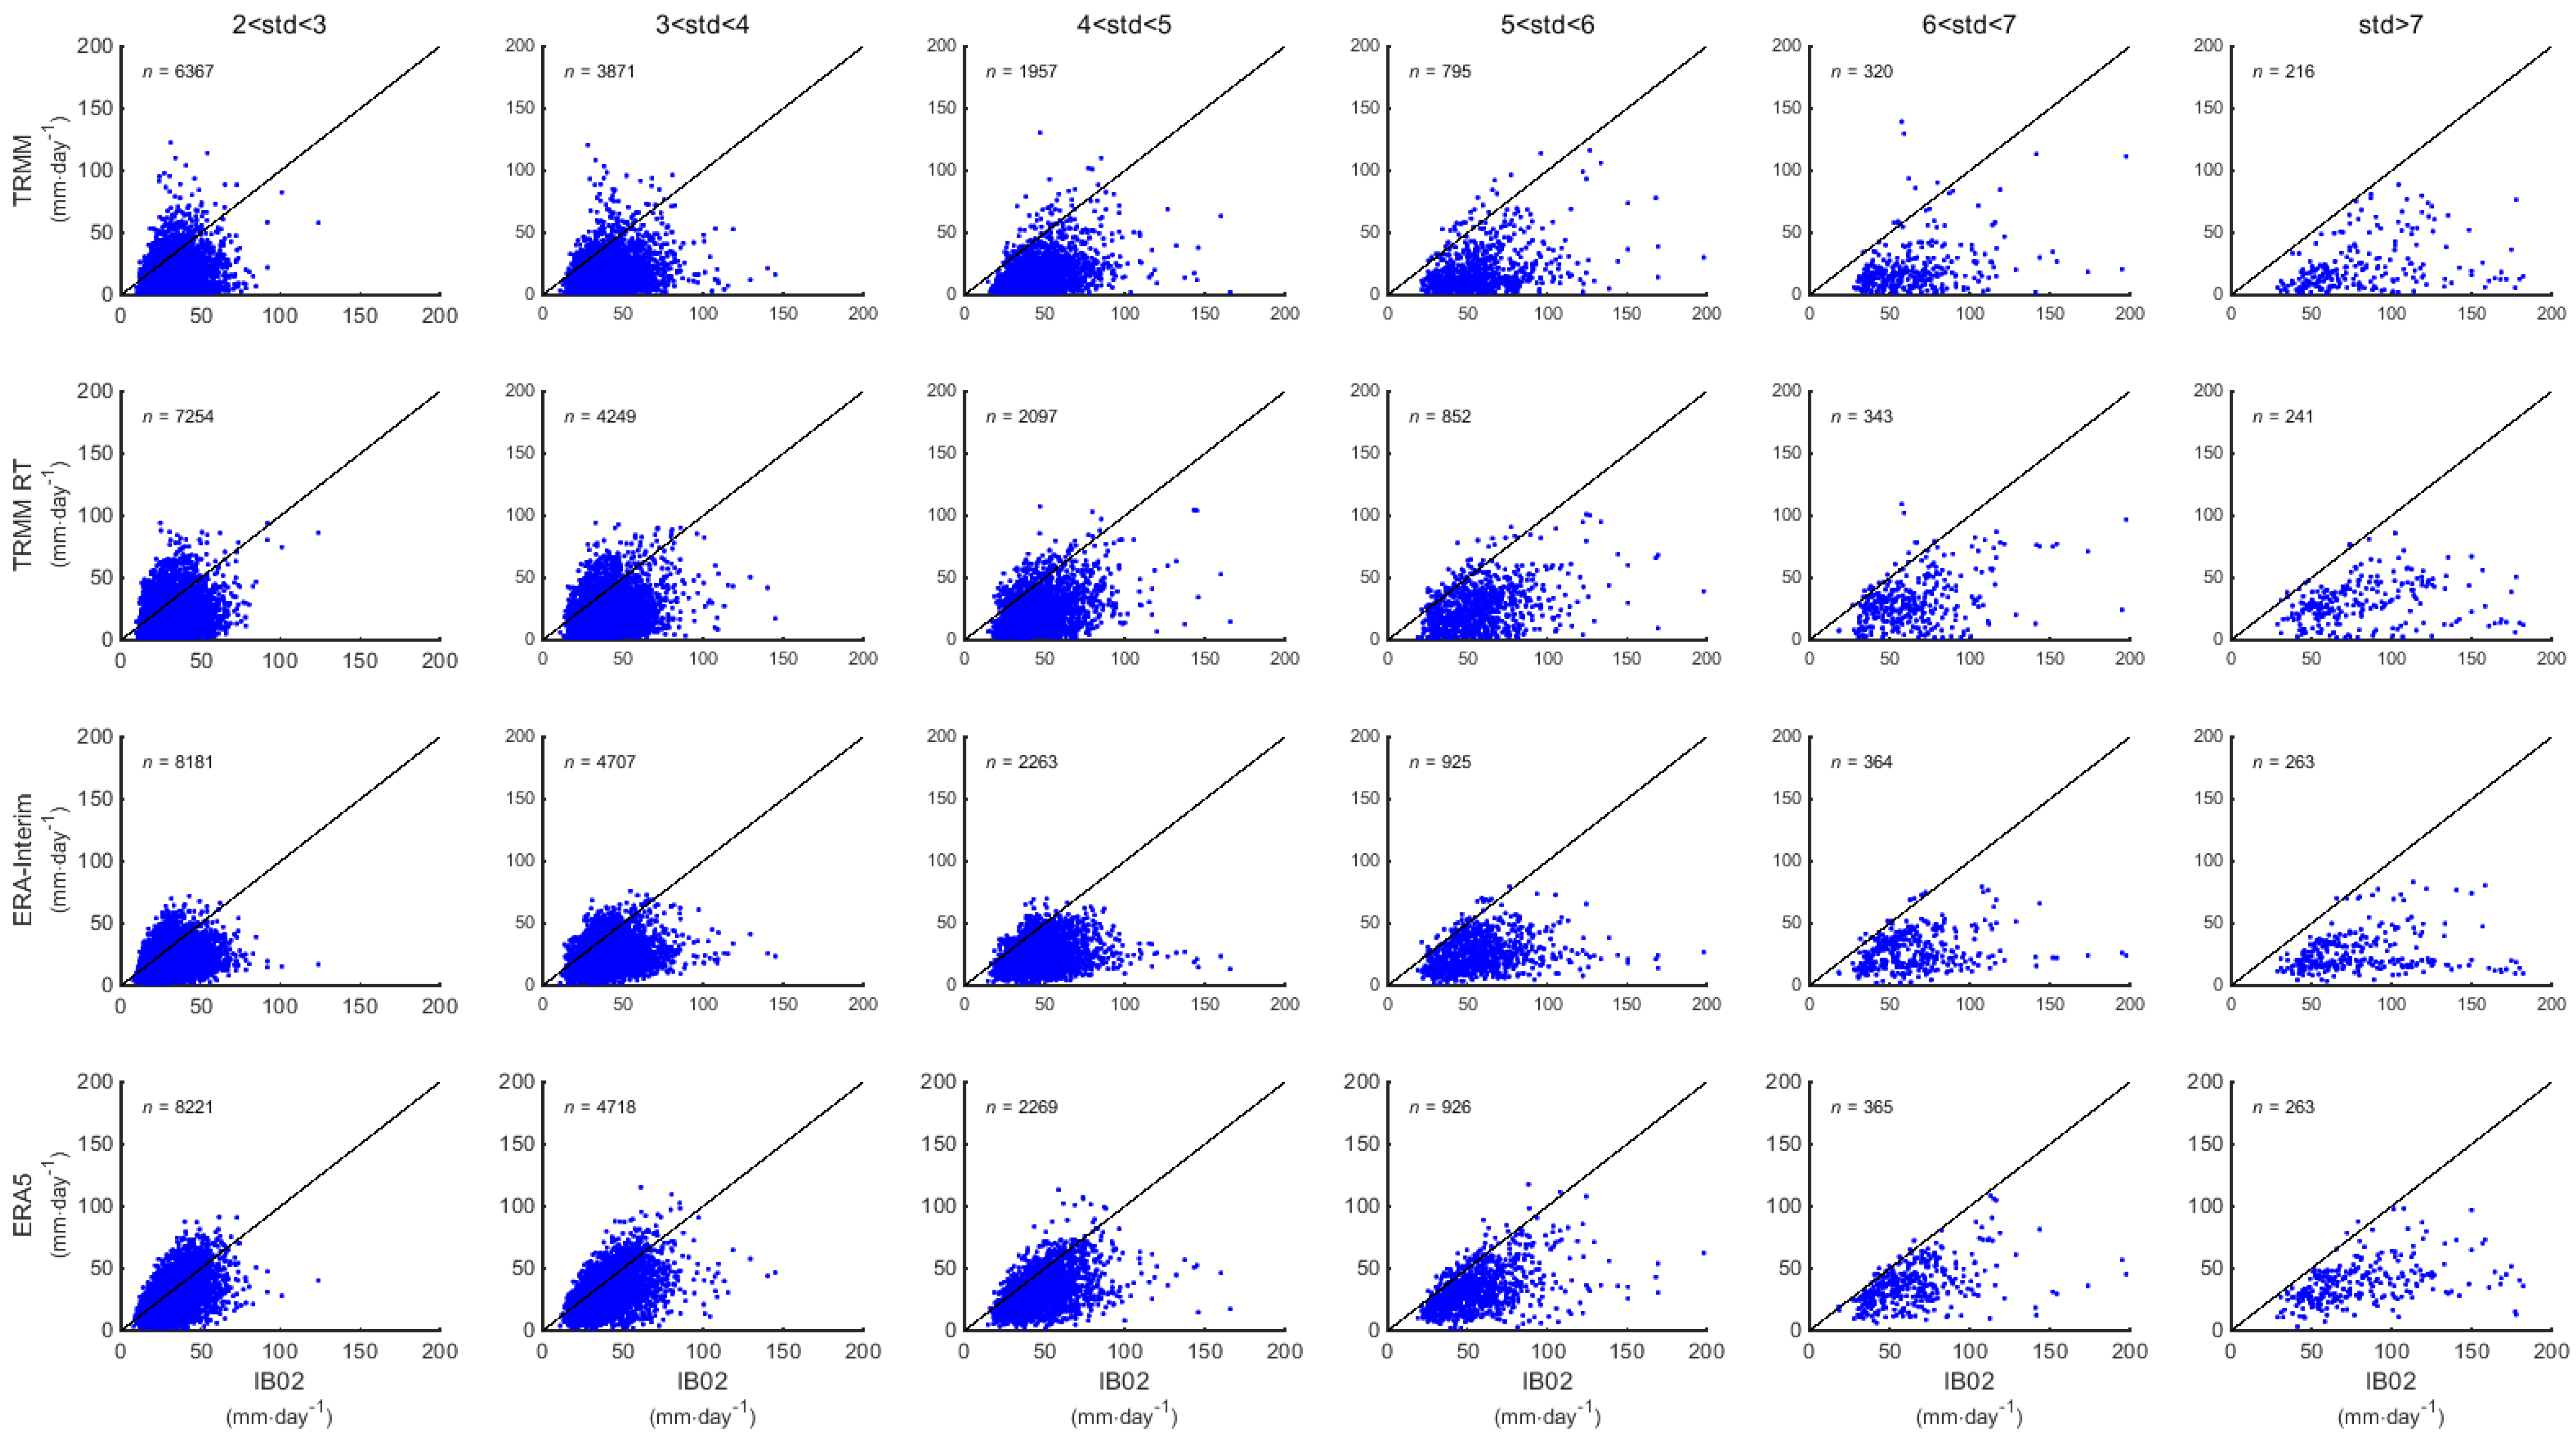
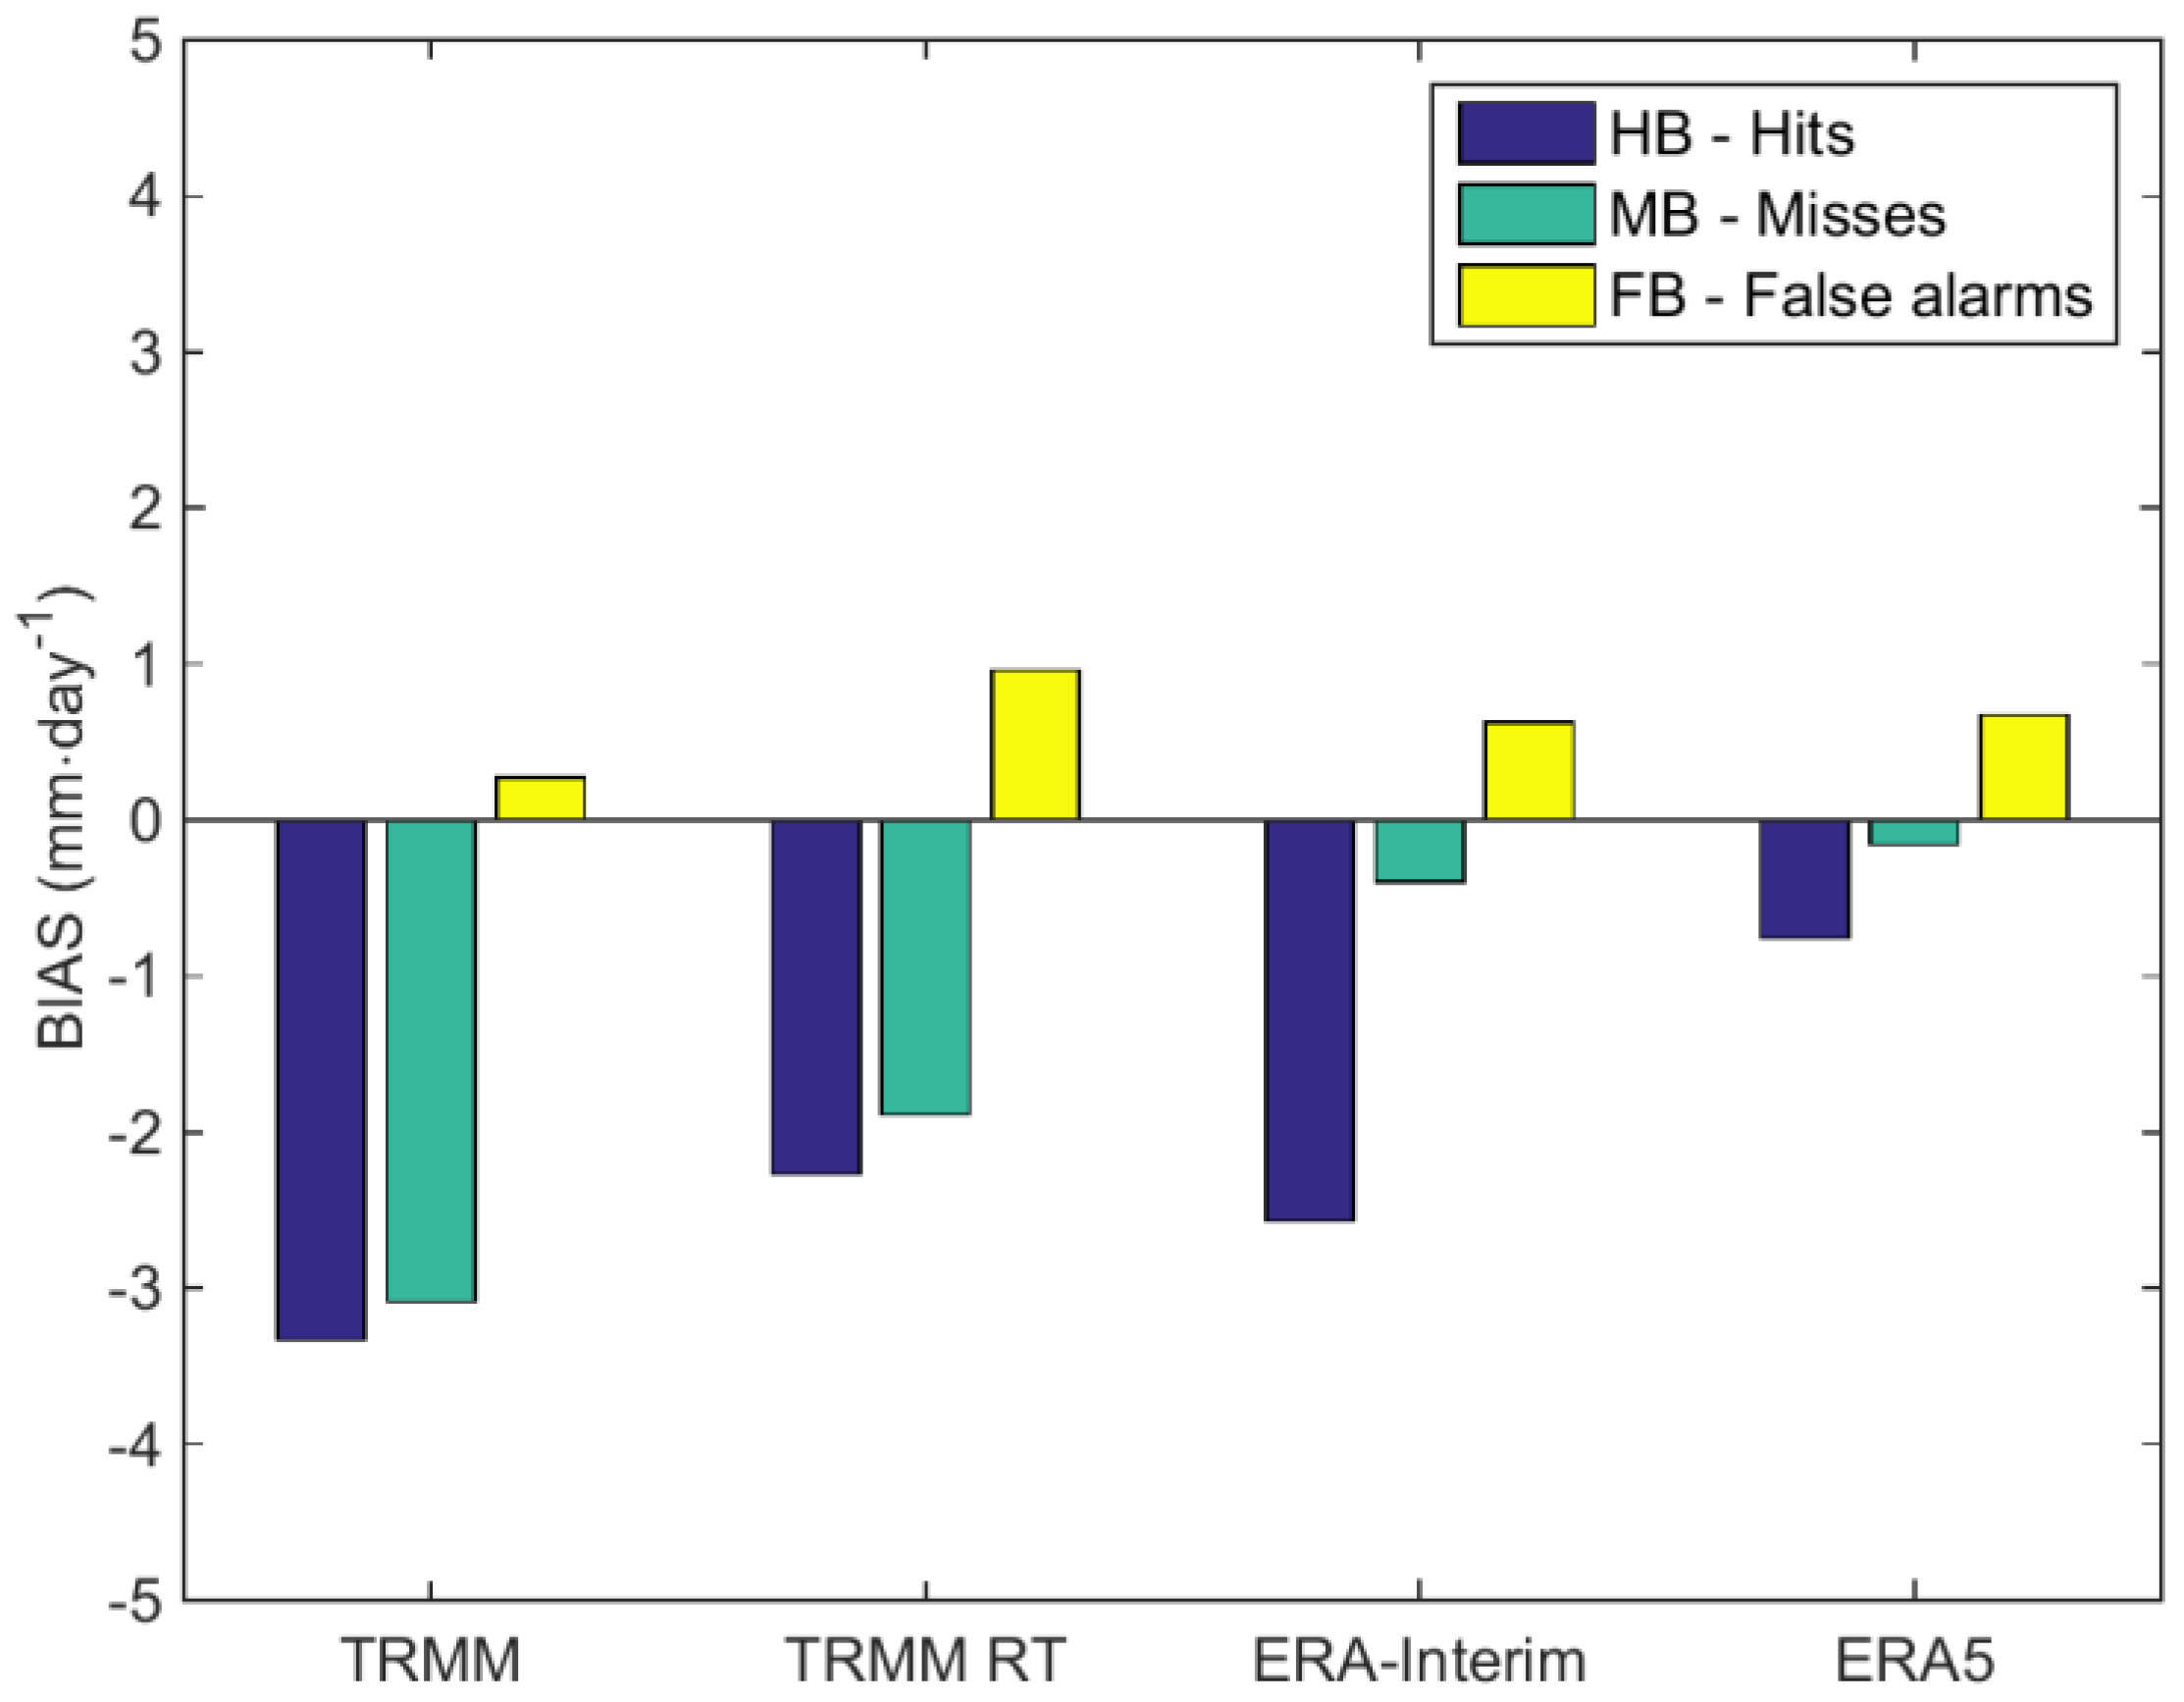
3.3. Insights on the Last Decile of EPEs for Extended Winter of the Common Period 2000–2008

As pointed out by the assessment presented in Section 3.2, the accuracy metrics for Q4 often show a different pattern with respect to the other quartiles, with larger errors but better adjustment in terms of correlation to the IB02 ground-truth. At the same time the related scatterplots show that Q4 still includes a significant number of grid points from IB02, for which precipitation cannot be considered as extreme. As a follow-up to the previous analysis, a set of objectively identified extreme events has been chosen and studied separately. The events were selected from the EPEs ranking dataset in [5] and, as described in Section 2.2, are limited to the 2000–2008 common period. Then, only daily precipitation values falling into the last decile (90th) are considered, which gives a total number of 84 events (the full list can be consulted in the Supplementary Material).
As before, it is firstly assessed whether the subset of events obtained from the full ranking over the common years can be considered representative of the longer dataset. As the ranking of EPEs only includes the extended wintertime months, the analysis from now onwards will account only for events that occurred between October and March. In addition, summertime is known to account for different precipitation regimes over the IP [24,25], with relevant regional patterns [14,23]. Therefore, it would require a different methodology to produce a valuable ranking. Main statistics are shown in Table 2: as previously found, mean daily precipitation has only a very slight decrease when the time-window is shortened to the common period. Still, it cannot be said to what extent this small change is due to a decrease in total precipitation or to actual changes in the mechanisms enhancing the extremeness of the events—which is out of the scope of this study.
Daily precipitation from IB02 is plotted against the estimates from TRMM, TRMM RT, ERA-Interim, and ERA5 (Figure 4) for all the data pairs of the 84 EPEs previously identified. Only grid points whose precipitation anomalies exceed 2 σ are considered, as described in [5]. The analysis is repeated for anomalies exceeding 3 σ to 7 σ and the number of grid points considered for each class is shown in each panel of Figure 4. For all the four datasets, but more evidently for TRMM (Figure 4—first row), data pairs show the tendency to be clustered towards IB02. This tendency gets clearer as far as only grid points beyond a certain threshold of standard deviation anomalies are considered. Therefore, also for the last decile of extreme events, it holds that the more the precipitation is extreme, the more the reanalysis and TRMM TMPA datasets underestimate IB02 ground truth.
By analysing the accuracy metrics for all grid points with precipitation anomalies over 2 σ (Figure 5), it becomes evident that TRMM RT has slightly higher correlation values than TRMM (r = 0.37 compared to r = 0.32) and lower %BIAS (−45.35% compared to −58.48%), RMSE (25.75 mm·day−1 compared to 29.85 mm·day−1), and MAE (20.21 mm·day−1 compared to 24.28 mm·day−1). These results suggest that TRMM RT is more adequate for winter EPEs than TRMM. All the errors metrics are lower for the reanalysis products with respect to TRMM TMPA products and ERA5 clearly improves ERA-Interim (−0.28% compared to −0.44% for %BIAS, 19.20 mm·day−1 compared to 24.34 mm·day−1 for RMSE, and 13.55 mm·day−1 compared to 18.26 mm·day−1 for MAE).
For subsets of grid points grouped according to the number of standard deviations they depart from the mean, TRMM RT still outperforms TRMM, with only the exception of the correlation for σ > 7 (r = 0.30 compared to r = 0.19 for TRMM RT and TRMM, respectively) for which the number of grid points is small in comparison with the other classes. It is observed that while the performance of the reanalysis products decreases for the most extreme classes, TRMM TMPA estimates become more reliable. For ERA-Interim, this behaviour is quite clear: for IB02 grid points with precipitation anomalies up to 4 σ , ERA-Interim and TRMM TMPA products still compete in terms of correlation (Figure 5a) but ERA-Interim suddenly drops beyond that threshold, to r ~ 0.2 for σ > 6, whereas TRMM TMPA products still approach r ~ 0.4. The ERA5 overcame this issue as its correlation never drops below r = 0.4, thus being again the best performing dataset. In terms of percentage of BIAS (Figure 5b), TRMM RT outperforms ERA-Interim only for grid points beyond the 5 σ threshold but still the ERA5 reanalysis is always preferable. TRMM dataset always underestimates by more than 50%. In terms of RMSE and MAE, TRMM RT behaves similarly to ERA-Interim, both outperforming TRMM but still accounting for larger errors than the new ERA5 reanalysis.
According to what has been observed in the scatterplots of Figure 2 and Figure 4, the analysis of the total bias is not always exhaustive. By splitting the total bias into its different components, that is, hit bias (HB), missed bias (MB), and false bias (FB), as described in Section 2.3, new insights provided for the performance of each dataset. In Figure 6, each bias source is divided by the total number of grid points, where bias is observed for the specific dataset so that the average values per grid point is plotted. HB is shown to be the main source of uncertainty for all the datasets. The second source of bias is MB for TRMM TMPA products and FB for ECMWF reanalysis. With respect to ERA-Interim, both the hit bias (HB) and missed rain bias (MB) are successfully cleared in ERA5. Regarding TRMM (TMPA) products, it is shown that even though the research-grade release reduced false alarms (from 0.96 mm·day−1 to 0.27 mm·day−1), the amount of underestimation and the number missing values are higher than in the real-time version (on average −3.33 mm·day−1 compared to –2.27 mm·day−1 for HB and −3.09 mm·day−1 compared to –1.89 mm·day−1 for MB for TRMM and TRMM RT, respectively).
As an example, the case study of 6 December 2000, the #4 in the ranking for IP [5] (and the #1 in the ranking considering only Portugal) is analysed, also through the related precipitation maps (Figure 7). In this case the TRMM RT estimates perform better than the associated TRMM product when precipitation is extreme, despite the latter being more widely used for research purposes. In this event, two main precipitation spots can be recognized: the first one across the northern border between Portugal and Spain, and the second one that extends from southwest to northeast over central Portugal (Figure 7a). Only the first spot is reproduced by ERA-Interim (Figure 7d) and TRMM (Figure 7b), even though it results wrongly displaced to the north. The analysis of this case shows also that ERA5 was improved over the previous ERA-Interim dataset and outperforms the other datasets considered. On the contrary, both TRMM RT (Figure 7c) and ERA5 (Figure 7e) are able to represent the precipitation over the southern sector. However, in TRMM RT the band is oriented from northwest to southeast in a manner that is almost symmetric with respect to IB02 (Figure 7d), whereas in ERA5 it is correctly displaced, although the precipitation amount is underestimated with respect to IB02. For ERA-Interim, the spatial and temporal pattern of precipitation is partially inconsistent with what it is shown in [34] where the same case is analysed. In that case, the precipitation maximum aforementioned is located more to the west. This difference is ascribable to the different resolution of the grid (1° × 1° in [37] and 0.2° × 0.2° in the present study) which may lead to displacements in the plotted field. In the case of TRMM RT, significant amounts of daily rainfall are detected all over the eastern and southern IP, even though no precipitation occurred according to IB02. This inaccuracy can be only partly explained by the 1 h 30 min time lag between TRMM TMPA products and the IB02 accumulation period (some of the precipitation over southern Portugal and Andalusia actually falls in the morning of 7 December). Therefore, this is an example on how relevant the contribution of false alarms to the total bias can be for TRMM RT.
As for the analysis of the maps, the main accuracy metrics also suggest that TRMM RT is more accurate than TRMM and that ERA5 is the dataset that best performs in reproducing extreme precipitation for this case study (Figure 8). By considering only data pairs for which the precipitation anomaly exceeds 2σ, the correlation coefficients differ among the four datasets: ERA5 has the largest correlation (r = 0.63), then ERA-Interim and TRMM RT almost equal each other (r = 0.53 and r = 0.52 respectively), and TRMM has the lowest (r = 0.44). The TRMM and ERA-Interim datasets significantly underestimate precipitation (−57.25% and −25.73% of BIAS, respectively) whereas, also because of the large occurrences of false alarms, TRMM RT shows a very low negative bias (−8.36%), even lower than that of ERA5 (−11.17%). The lowest values of both RMSE and MAE come from ERA5, and the largest from TRMM.

4. Discussion and Conclusions

An evaluation of the accuracy of several precipitation datasets in reproducing the spatial and temporal characteristics of extreme precipitation events (EPEs) over the continental Iberian Peninsula (IP) is undertaken. For this assessment, daily accumulated precipitation from a high-resolution (0.2° × 0.2°) ground-based gridded dataset (IB02), from ERA-Interim and ERA5, a new fifth-generation European reanalysis by ECMWF, and from two TRMM (TMPA) multi-satellite products are considered for the common period 2000–2008. Statistical analysis is performed through a set of standard accuracy metrics, including the Pearson linear correlation coefficient (r), the percentage bias (%BIAS), the root mean square error (RMSE), and the mean absolute error (MAE). Different contributions to the total precipitation bias are also analysed. At first, the study considers all days of the common period, grouping the data pairs into quartiles according to the percentiles of mean daily precipitation computed for each grid point and for each day of the year separately. Then, only the most extreme decile of wintertime EPEs, as ranked in [5], are considered.
Results show that reanalysis products account for the best scores in terms of accuracy metrics for all the quartiles. However, reanalysis products also show a different behaviour depending on the intensity of the precipitation events: light (heavy) precipitation is overestimated (underestimated). This tendency is even clearer for the multi-satellite TRMM TMPA products. Results from [37] already showed that for four of the most extreme precipitation events over the IP [5], the accumulated daily precipitation is underestimated with respect to IB02 by up to 80%. In [58], TRMM is assessed at regional scale over the IP for different thresholds of daily precipitation, and it is shown that it has reasonable skill for moderate daily precipitation amounts (up to 25 mm·day−1) but low skill for extremely light and strong events. The authors of [59] showed that over two river basins in China, both TRMM TMPA products dramatically underestimate heavy precipitation. To the author’s knowledge, there are only few studies directly comparing the accuracy of TRMM to TRMM RT [50,54,59]. According to the author of [50], the variation of individual differences between the two products is small (heavy) over regions of heavy (light) rain. The authors of [59] concluded that the month-to-month gauge adjustment applied in post-real time resulted in improved data accuracy of the related retrievals. On the contrary, clearly improvements of TRMM RT over TRMM have been found in the present analysis and it is shown that the difference between TRMM RT and TRMM does not change for quartiles Q1 to Q3, but it does for Q4. These differences with earlier studies likely depend on the different regions considered but also on how the classes of precipitation are defined: in [50,59] the classification of the events relies on fixed thresholds of daily precipitation, whereas in this study extreme days are objectively defined according to percentiles. Therefore, a group typically accounts for different daily precipitation amounts at the individual grid points, depending on the local climatology. On the other hand, the current results conform to those in [54], which studied six tropical-related heavy rainfall events over Louisiana (USA) and found a larger agreement for TRMM RT with respect to TRMM when considering the upper tail of the distribution of rain rate.
As a first assessment of ERA5 over the IP, this study concludes that the new reanalysis product has considerably novel skills in estimating extreme precipitation with respect to previous releases and also to TRMM TMPA products. Indeed, improvements with respect to ERA-Interim have been found regarding correlation (values for r increasing of ~0.1 for quartiles Q2, Q3 and Q4,) whereas for the other metrics, ERA5 clearly outperforms ERA-Interim for the most extreme quartile Q4.
However, when considering only the most extreme wintertime events and only those grid points with the most extreme precipitation values, the multi-satellite products considered become more competitive in this study. ERA5 still performs best, but the correlation coefficient is better for TRMM and TRMM RT for anomalies greater than 4σ and 5σ, respectively, as compared to ERA-Interim. Beyond 5σ, TRMM RT outperforms ERA-Interim also in term of %BIAS, thus showing a better performance than the corresponding research-grade version. All metrics actually show that TRMM RT has fairer agreement with extreme daily precipitation events than TRMM, including lower errors and higher correlation. The fact that the real-time product better identifies the spatial and temporal characteristics and intensity of extreme precipitation events gives a new perspective about the significance of this product for the midlatitudes regions. Most of earlier studies in fact rely on the solely research-grade product [49,52,55,56,57], which is believed to be more accurate because of the improvements given by the post-processing and by the different calibration period. Similarly, most of the studies that made direct comparison of TRMM RT to its counterpart TRMM found better agreement in term of reproducing daily precipitation for the latter.
This analysis also suggests that the main accuracy metrics were not able to characterize extensively all the weaknesses and strengths of the datasets considered. Through total bias decomposition, the different contributions to the total error are identified and the bias due to successful detection was identified as the dominant component. Results also show that the research-grade of TRMM TMPA products successfully removes false alarms with respect to TRMM RT. On the other side, it accounts for larger missed bias and for an overall larger total bias. The authors of [54] also found similar inconsistencies between the two TRMM TMPA versions when performing an assessment for a small set of tropical-related case studies. The current analysis extends those findings to the midlatitudes and consolidates them through a more extensive set of events. Finally, it is shown that most of the error sources are successfully removed in ERA5 as compared to ERA-Interim. Nevertheless, it should be noted that this work is the first assessment of ERA5 for precipitation estimates over the IP, and thus requires additional investigations.

Supplementary Materials

The following are available online at https://www.mdpi.com/2073-4441/10/11/1688/s1. Table S1: List of the 90th percentile of (84) extreme daily precipitation events extracted from the ranking described in [5] over the IP over the common period 2000–2008.

Author Contributions

M.L.R.L. and A.M.R. conceived, designed and conducted the research; R.H., A.M.R., and M.L.R.L. performed the experiments; R.H., M.L.R.L., A.M.R., and C.M.G. analysed the data and wrote the paper.

Funding

This work was supported by the project eCSAAP (CMU/CS/0012/2017) and by Instituto Dom Luiz (IDL, UID/GEO/50019/2013) funded by Fundação para a Ciência e a Tecnologia, Portugal (FCT) and Portugal Horizon2020. R.H. was supported by a FCT doctoral grant (PD/BD/114479/2016) and A.M.R. was also supported by a FCT postdoctoral grant (FCT/DFRH/SFRH/BPD/84328/2012).

Conflicts of Interest

The authors declare no conflict of interest.

References

  1. Sillmann, J.; Thorarinsdottir, T.; Keenlyside, N.; Schaller, N.; Alexander, L.V.; Hegerl, G.; Seneviratne, S.I.; Vautard, R.; Zhang, X.; Zwiers, F.W. Understanding, modeling and predicting weather and climate extremes: Challenges and opportunities. Weather Clim. Extremes 2017, 18, 65–74. [Google Scholar] [CrossRef]
  2. Swiss, Re. Natural Catastrophes and Man-Made Disasters in 2007: High losses in Europe—Sigma, Nr. 1/2008; Swiss Re Publishing: Zürich, Switzerland, 2008; Available online: www.swissre.com/sigma/1_2008.html (accessed on 24 September 2018).
  3. Pitt, M. The Pitt Reviews—Lessons Learned From the 2007 Summer Floods; Final Report; Environment Agency: London, UK, 2008.
  4. Jiang, S.; Zhang, Z.; Huang, Y.; Chen, X.; Chen, S. Evaluating the TRMM Multisatellite Precipitation Analysis for Extreme Precipitation and Streamflow in Ganjiang River Basin, China. Adv. Meteorol. 2017, 2017, 2902493. [Google Scholar] [CrossRef]
  5. Ramos, A.M.; Trigo, R.M.; Liberato, M.L.R. A ranking of high-resolution daily precipitation extreme events for the Iberian Peninsula. Atmos. Sci. Lett. 2014, 15, 328–334. [Google Scholar] [CrossRef]
  6. Ramos, A.M.; Trigo, R.M; Liberato, M.L.R. Ranking of multi-day extreme precipitation events over the Iberian Peninsula. Int. J. Climatol. 2017, 37, 607–620. [Google Scholar] [CrossRef]
  7. Liberato, M.L.R. The 19 January 2013 windstorm over the North Atlantic: Large-scale dynamics and impacts on Iberia. Weather Clim. Extremes 2014. [Google Scholar] [CrossRef]
  8. Trigo, R.M.; Ramos, C.; Pereira, S.S.; Ramos, A.M.; Zêzere, J.L.; Liberato, M.L.R. The deadliest storm of the 20th century striking Portugal: Flood impacts and atmospheric circulation. J. Hydrol. 2016, 541A, 597–610. [Google Scholar] [CrossRef]
  9. Trigo, R.M.; Varino, F.; Ramos, A.M.; Valente, M.A.; Zêzere, J.L.; Vaquero, J.M.; Gouveia, C.M.; Russo, A. The record precipitation and flood event in Iberia in December 1876: Description and synoptic analysis. Front. Earth Sci. 2014, 2. [Google Scholar] [CrossRef]
  10. Rebelo, L.; Ramos, A.M.; Pereira, S.; Trigo, R.M. Meteorological Driving Mechanisms and Human Impacts of the February 1979 Extreme Hydro-Geomorphological Event in Western Iberia. Water 2018, 10, 454. [Google Scholar] [CrossRef]
  11. Nieto, R.; Gimeno, L.; Anel, J.A.; De la Torre, L.; Gallego, D.; Barriopedro, D.; Gallego, M.; Gordillo, A.; Redaño, A.; Delgado, G. Analysis of the precipitation and cloudiness associated with COLs occurrence in the Iberian Peninsula. Meteorol. Atmos. Phys. 2007, 96, 103–119. [Google Scholar] [CrossRef]
  12. Ramos, A.M.; Cortesi, N.; Trigo, R.M. Circulation weather types and spatial variability of daily precipitation in the Iberian Peninsula. Front. Earth Sci. 2014, 2, 25. [Google Scholar] [CrossRef]
  13. Lionello, P. The Climate of the Mediterranean Region: From the Past to the Future; Elsevier: Amsterdam, The Netherlands, 2012. [Google Scholar]
  14. Nieto Ferreira, R. Synoptic climatology of cut-off low events that produced extreme precipitation in Valencia, Spain. First Int. Electron. Conf. Hydrol. Cycle 2017, 4858. [Google Scholar] [CrossRef]
  15. Hidalgo-Muñoz, J.M; Argüeso, D.; Gámiz-Fortis, S.R.; Esteban-Parra, M.J.; Castro-Díez, Y. Trends of extreme precipitation and associated synoptic patterns over the southern Iberian Peninsula. J. Hydrol. 2011, 409, 497–511. [Google Scholar] [CrossRef]
  16. Liberato, M.L.R.; Trigo, R.M. Extreme precipitation events and related impacts in Western Iberia. In Hydrology in a Changing World: Environmental and Human Dimensions; IAHS Red Book No. 363; IAHS: Wallingford, UK, 2014; pp. 171–176. ISSN 0144-7815. [Google Scholar]
  17. Serrano, A.; Garciacutea, J.; Mateos, V.; Cancillo, M.L.; Garrido, J. Monthly modes of variation of precipitation over the Iberian Peninsula. J. Clim. 1999, 12, 2894–2919. [Google Scholar] [CrossRef]
  18. Paredes, D.; Trigo, R.M.; García-Herrera, R.; Trigo, I.F. Understanding precipitation changes in Iberia in early spring: Weather typing and storm-tracking approaches. J. Hydrometeorol. 2006, 7, 101–113. [Google Scholar] [CrossRef]
  19. Ramos, A.M.; Trigo, R.M.; Liberato, M.L.R.; Tomé, R. Daily Precipitation Extreme Events in the Iberian Peninsula and Its Association with Atmospheric Rivers. J. Hydrometeorol. 2015, 16, 579–597. [Google Scholar] [CrossRef]
  20. Lavers, D.A.; Villarini, G. The contribution of atmospheric rivers to precipitation in Europe and the United States. J. Hydrol. 2015, 522, 382–390. [Google Scholar] [CrossRef]
  21. Hénin, R.; Ramos, A.M.; Schemm, S.; Gouveia, C.M.; Liberato, M.L.R. Assigning precipitation to mid-latitudes fronts on sub-daily scalesin the North Atlantic and European sector: Climatology and trends. Int. J. Climatol. 2018, 1–14. [Google Scholar] [CrossRef]
  22. Khodayar, S.; Kalthoff, N.; Kottmeier. Atmospheric conditions associated with heavy precipitation events in comparison to seasonal means in the western mediterranean region. Clim. Dyn. 2018, 51, 951–967. [Google Scholar] [CrossRef]
  23. Martín-Vide, J.; Gomez, L. Regionalization of Peninsular Spain based on the length of dry spells. Int. J. Climatol. 1999, 19, 537–555. [Google Scholar] [CrossRef] [Green Version]
  24. de Luis, M.; Brunetti, M.; Gonzalez-Hidalgo, J.C.; Longares, L.A.; Martin-Vide, J. Changes in seasonal precipitation in the Iberian Peninsula during 1946–2005. Glob. Planet. Chang. 2010, 74, 27–33. [Google Scholar] [CrossRef]
  25. Belo-Pereira, M.; Dutra, E.; Viterbo, P. Evaluation of global precipitation data sets over the Iberian Peninsula. J. Geophys. Res. 2011, 116, D20101. [Google Scholar] [CrossRef]
  26. Rhodes, R.I.; Shaffrey, L.C.; Gray, S.L. Can reanalyses represent extreme precipitation over England and Wales? Q. J. R. Meteorol. Soc. 2015, 141, 1114–1120. [Google Scholar] [CrossRef]
  27. Levizzani, V.; Bauer, P.; Turk, F.J. Measuring Precipitation from Space: EURAINSAT and the Future; Springer: Berlin, Germany, 2007; 722p. [Google Scholar]
  28. DeMoss, J.D.; Bowman, K.P. Changes in TRMM Rainfall due to the Orbit Boost Estimated from Buoy Rain Gauge Data. J. Atmos. Ocean. Technol. 2007, 24, 1598–1607. [Google Scholar] [CrossRef] [Green Version]
  29. Huffman, G.J.; Bolvin, D.T. TRMM and Other Data Precipitation Data Set Documentation. Available online: ftp://meso-a.gsfc.nasa.gov/pub/trmmdocs/3B42_3B43_doc.pdf (accessed on 25 September 2018).
  30. Adler, R.F.; Huffman, G.J.; Chang, A.; Ferraro, R.; Xie, P.; Janowiak, J.; Rudolf, B.; Schneider, U.; Curtis, S.; Bolvin, D.; et al. The version 2 global precipitation climatology project (GPCP) monthly precipitation analysis (1979–present). J. Hydrometeorol. 2003, 4, 1147–1167. [Google Scholar] [CrossRef]
  31. Behrangi, A.; Hsu, K.-L.; Imam, B.; Sorooshian, S.; Huffman, G.J.; Kuligowski, R.J. PERSIANN-MSA: A precipitation estimation method from satellite-based multispectral analysis. J. Hydrometeorol. 2009, 10, 1414–1429. [Google Scholar] [CrossRef]
  32. Joyce, R.J.; Janowiak, J.E.; Arkin, P.A.; Xie, P. CMORPH: A method that produces global precipitation estimates from passive microwave and infrared data at high spatial and temporal resolution. J. Hydrometeorol. 2004, 5, 487–503. [Google Scholar] [CrossRef]
  33. Huffman, G.J.; Adler, R.F.; Bolvin, D.T.; Nelkin, E.J. The TRMM Multi.satellite Precipitation Analysis (TMPA). In Satellite Rainfall Applications for Surface Hydrology; Hossain, F., Gebremichael, M., Eds.; Springer: Berlin, Germany, 2010; Chapter 1; pp. 3–22. ISBN 978-90-481-2914-0. [Google Scholar]
  34. Skofronick-Jackson, G.; Petersen, W.A.; Berg, W.; Kidd, C.; Stocker, E.F.; Kirschbaum, D.B.; Kakar, R.; Braun, S.A.; Huffman, G.J.; Iguchi, T.; et al. The Global Precipitation Measurement (GPM) Mission for Science and Society. Bull. Am. Meteorol. Soc. 2017, 98, 1679–1695. [Google Scholar] [CrossRef] [Green Version]
  35. Huffmann, G.J. The Transition in Multi-Satellite Products from TRMM to GPM (TMPA to IMERG). Available online: https://pmm.nasa.gov/sites/default/files/document_files/TMPA-to-IMERG_transition_161025.pdf (accessed on 24 September 2018).
  36. Liu, C.; Zipser, E. Differences between the Surface Precipitation Estimates from the TRMM Precipitation Radar and Passive Microwave Radiometer Version 7 Products. J. Hydrometeorol. 2014, 15, 2157–2175. [Google Scholar] [CrossRef]
  37. Liberato, M.L.R.; Hénin, R.; Ramos, A.M.; Gouveia, C. Evaluating extreme precipitation events on the Iberian Peninsula using TRMM data. First Int. Electron. Conf. Hydrol. Cycle 2017, 4880. [Google Scholar] [CrossRef]
  38. Herrera, S.; Gutiérrez, J.M.; Ancell, R.; Pons, M.R.; Frías, M.D.; Fernández, J. Development and analysis of a 50-year high-resolution daily gridded precipitation dataset over Spain (Spain02). Int. J. Climatol. 2012, 32, 74–85. [Google Scholar] [CrossRef] [Green Version]
  39. Sousa, P.M.; Barriopedro, D.; Trigo, R.M.; Ramos, A.M.; Nieto, R.; Gimeno, L.; Turkman, K.F.; Liberato, M.L.R. Impact of Euro-Atlantic blocking patterns in Iberia precipitation using a novel high-resolution dataset. Clim. Dyn. 2016, 46, 2573–2591. [Google Scholar] [CrossRef]
  40. Durán, L.; Barstad, I. Multi-scale evaluation of a linear model of orographic precipitation over Sierra de Guadarrama (Iberian Central System). Int. J. Climatol. 2018, 38, 4127–4141. [Google Scholar] [CrossRef]
  41. Guerreiro, S.; Kilsby, C.; Fowler, H.J. Rainfall in Iberian transnational basins: A drier future for the Douro, Tagus and Guadiana? Clim. Chang. 2016, 135, 467–480. [Google Scholar] [CrossRef]
  42. Dee, D.P.; Uppala, S.M.; Simmons, A.J.; Berrisford, P.; Poli, P.; Kobayashi, S.; Andrae, U.; Balmaseda, M.A.; Balsamo, G.; Bauer, P.; et al. The ERA-Interim reanalysis: Configuration and performance of the data assimilation system. Q. J. R. Meteorol. Soc. 2011, 137, 553–597. [Google Scholar] [CrossRef]
  43. Hersbach, H.; Dee, D. ERA-5 reanalysis is in production. ECMWF Newsl. 2016, 147, 7. [Google Scholar]
  44. Huffman, G.J.; Bolvin, D.T.; Nelkin, E.J.; Wolff, D.B.; Adler, R.F.; Gu, G.; Hong, Y.; Bowman, K.P.; Stocker, E.F. The TRMM Multisatellite Precipitation Analysis (TMPA): Quasi-Global, Multiyear, Combined-Sensor Precipitation Estimates at Fine Scales. J. Hydrometeorol. 2007, 8, 38–55. [Google Scholar] [CrossRef]
  45. Kummerow, C.; Barnes, W.; Kozu, T.; Shiue, J.; Simpson, J. The Tropical Rainfall Measuring Mission (TRMM) Sensor Package. J. Atmos. Ocean. Technol. 1998, 15, 809–817. [Google Scholar] [CrossRef]
  46. Liu, Z.; Ostrenga, D.; Teng, W.; Kempler, S. Tropical Rainfall Measuring Mission (TRMM) Precipitation Data and Services for Research and Applications. Bull. Am. Meteorol. Soc. 2012, 93, 1317–1325. [Google Scholar] [CrossRef] [Green Version]
  47. Huffman, G.J.; NASA/GSFC; Greenbelt, M.D.; Adler, R.F.; Stocker, E.F.; Bolvin, D.T.; Nelkin, E.J. Analysis of TRMM 3-hourly multi-satellite precipitation estimates computed in both real and post-real time. In Proceedings of the 12th Conference on Satellite Meteorology and Oceanography, Long Beach, CA, USA, 9–13 February 2003. Poster Session 4, Moisture, Fluxes and Retrievals. [Google Scholar]
  48. Bolvin, D.T.; Huffmann, G.J. Transition of 3B42/3B43 Research Product from Monthly to Climatological Calibration/Adjustment. Scientific Report; 2015. Available online: https://pmm.nasa.gov/sites/default/files/imce/3B42_3B43_TMPA_restart.pdf (accessed on 24 September 2018).
  49. Liu, Z. Comparison of versions 6 and 7 3-hourly TRMM multi-satellite precipitation analysis (TMPA) research products. Atmos. Res. 2015, 163, 91–101. [Google Scholar] [CrossRef]
  50. Liu, Z. Comparison of precipitation estimates between Version 7 3-hourly TRMM Multi-Satellite Precipitation Analysis (TMPA) near-real-time and research products. Atmos. Res. 2015, 153, 119–133. [Google Scholar] [CrossRef]
  51. Yong, B.; Ren, L.-L.; Hong, Y.; Wang, J.-H.; Gourley, J.J.; Jiang, S.-H.; Chen, X.; Wang, W. Hydrologic evaluation of Multisatellite Precipitation Analysis standard precipitation products in basins beyond its inclined latitude band: A case study in Laohahe basin, China. Water Resour. Res. 2010, 46, W07542. [Google Scholar] [CrossRef]
  52. Cai, Y.; Jin, C.; Wang, A.; Guan, D.; Wu, J.; Yuan, F.; Xu, L. Spatio-Temporal Analysis of the Accuracy of Tropical Multisatellite Precipitation Analysis 3B42 Precipitation Data in Mid-High Latitudes of China. PLoS ONE 2015, 10, e0120026. [Google Scholar] [CrossRef] [PubMed]
  53. Chen, S.; Hong, Y.; Cao, Q.; Gourley, J.J.; Kirstetter, P.E.; Yong, B.; Tian, Y.; Zhang, Z.; Shen, Y.; Hu, J.; et al. Similarity and difference of the two successive V6 and V7 TRMM multisatellite precipitation analysis performance over China. J. Geophys. Res. Atmos. 2013, 118, 13060–13074. [Google Scholar] [CrossRef]
  54. Habib, E.; Henschke, A.; Adler, R.F. Evaluation of TMPA satellite-based research and real-time rainfall estimates during six tropical-related heavy rainfall events over Louisiana, USA. Atmos. Res. 2009, 94, 373–388. [Google Scholar] [CrossRef]
  55. Scheel, M.L.M.; Rohrer, M.; Huggel, C.; Santos Villar, D.; Silvestre, E.; Huffmann, G.J. Evaluation of TRMM Multi-satellite Precipitation Analysis (TMPA) performance in the Central Andes region and its dependency on spatial and temporal resolution. Hydrol. Earth Syst. Sci. 2011, 15, 2649–2663. [Google Scholar] [CrossRef] [Green Version]
  56. Lo Conti, F.; Hsu, K.-L.; Noto, L.V.; Sorooshian, S. Evaluation and comparison of satellite precipitation estimates with reference to a local area in the Mediterranean Sea. Atmos. Res. 2014, 153, 119–133. [Google Scholar] [CrossRef]
  57. Villarini, G. Evaluation of the Research-Version TMPA Rainfall Estimate at Its Finest Spatial and Temporal Scales over the Rome Metropolitan Area. J. Appl. Meteorol. Climatol. 2010, 49, 2591–2602. [Google Scholar] [CrossRef]
  58. El Kenawy, A.M.; Lopez-Moreno, J.I.; McCabe, M.F.; Vicente-Serrano, S.M. Evaluation of the TMPA-3B42 precipitation product using a high-density rain gauge network over complex terrain in northeastern Iberia. Glob. Planet. Chang. 2015, 133, 188–200. [Google Scholar] [CrossRef] [Green Version]
  59. Yong, B.; Chen, B.; Gourley, J.J.; Ren, L.; Hong, Y.; Chen, X.; Wang, W.; Chen, S.; Gong, L. Intercomparison of the Version-6 and Version-7 TMPA precipitation products over high and low latitudes basins with independent gauge networks: Is the newer version better in both real-time and post-real-time analysis for water resources and hydrologic extremes? J. Hydrol. 2014, 508, 77–87. [Google Scholar] [CrossRef]
  60. Ebert, E.E.; Janowiak, J.E.; Kidd, C. Comparison of Near-Real-Time Precipitation Estimates from Satellite Observations and Numerical Models. Bull. Am. Meteorol. Soc. 2007, 88, 47–64. [Google Scholar] [CrossRef] [Green Version]
  61. Wilks, D.S. Statistical Methods in the Atmospheric Sciences, 2nd ed.; Academic Press: Cambridge, MA, USA, 2006; ISBN 0127519661. [Google Scholar]
  62. Daly, C.; Smith, J.W.; Smith, J.I.; McKane, R.B. High-Resolution Spatial Modeling of Daily Weather Elements for a Catchment in the Oregon Cascade Mountains, United States. J. Appl. Meteorol. Climatol. 2017, 46, 1565–1586. [Google Scholar] [CrossRef]
Figure 1. Scheme of the daily accumulation period considered for the different datasets used in this study. The left side refers to the beginning of the accumulation period (day n), the right side refers to the end of the accumulation period (day n + 1).
Water 10 01688 g001
Figure 2. Scatterplots of accumulated daily precipitation (mm·day−1) for each dataset vs. IB02 (over raw TRMM, TRMM RT, ERA-Interim and ERA5, respectively) and for each quartile (over columns). Data pairs refer to all years for the common period 2000–2008. Only values over 2 mm·day−1 are considered. The number of data pairs (n) is displayed. Please note that the x-axis limit is different for Q4 (200 mm·day−1); however, a certain number of data pairs (11 for TRMM, 10 for TRMM RT, 12 for ERA-Interim and ERA5) are still not displayed in Q4 panels. TRMM: Tropical Rainfall Measuring Mission.
Water 10 01688 g002
Figure 3. (a) Correlation coefficient (r), (b) percentage bias (%BIAS), (c) root mean square error (RMSE), and (d) mean absolute error (MAE) for accumulated daily precipitation (mm·day−1) of TRMM (blue circle), TRMM RT (red cross), ERA-Interim (green diamond), and ERA5 (black triangle) versus IB02. Metrics are plotted for different quartiles of daily precipitation for all year and for the common period 2000–2008. TRMM: Tropical Rainfall Measuring Mission.
Water 10 01688 g003
Figure 4. Scatterplot of accumulated daily precipitation (mm·day−1) for each dataset vs. IB02 (over rows: TRMM, TRMM RT, ERA-Interim, and ERA5, respectively) and for different ranges of precipitation anomaly (in σ units) at the grid points. Only days for extended winter and for the common period 2000–2008 beyond the 90th percentile of the ranking developed by [5] are considered. Only values over 2 mm·day−1 are considered. A certain number of data pairs (seven for each of the datasets considered) are not displayed due to x-axis limits. TRMM: Tropical Rainfall Measuring Mission.
Water 10 01688 g004
Figure 5. (a) Correlation coefficient (r), (b) percentage bias (%BIAS), (c) root mean square error (RMSE), and (d) mean absolute error (MAE) for accumulated daily precipitation (mm·day−1) of TRMM (blue circle), TRMM RT (red cross), ERA-Interim (green diamond), and ERA5 (black triangle) vs. IB02. Only daily precipitation for the wintertime and for the common period 2000–2008 that falls beyond the 90th percentile of the ranking developed in [5] is considered. Metrics are plotted for precipitation anomalies over 2 σ and for different ranges of precipitation anomalies (in σ units) at the grid points. TRMM: Tropical Rainfall Measuring Mission.
Water 10 01688 g005
Figure 6. Decomposition of total bias for each dataset versus IB02. The total bias is split into contributions from hits (HB—blue), misses (MB—green), and false alarms (FB—yellow) and the values are averaged over the total number of grid points. Only daily precipitation for extended winter and for the common period 2000–2008 that falls beyond the 90th percentile of the ranking developed in [5] is considered.
Water 10 01688 g006
Figure 7. Extreme precipitation event on 6 December 2000. Daily precipitation from (a) IB02, (b) TRMM (TMPA) research-grade product, (c) TRMM (TMPA) RT product, (d) ERA-Interim, and (e) ERA5. TRMM: Tropical Rainfall Measuring Mission.
Water 10 01688 g007
Figure 8. Scatterplot of accumulated daily precipitation for the extreme event on 6 December 2000 for (a) TRMM vs. IB02, (b) TRMM RT vs. IB02, (c) ERA-Interim vs. IB02, and (d) ERA5 vs. IB02. Only grid points whose precipitation anomaly exceeds 2σ are considered. Number of data pairs (n), correlation coefficient (r), percentage bias (%BIAS), root-mean-square error (RMSE), and mean absolute error (MAE) are displayed. TRMM: Tropical Rainfall Measuring Mission.
Water 10 01688 g008
Table 1. Main statistics for different temporal subranges of IB02 dataset.
Time RangeMean (STD) (mm·day−1)95th perc (mm·day−1)99th perc (mm·day−1)
All YearExtended WinterAll YearExtended WinterAll YearExtended Winter
59 years (1950–2008)10.28 (9.98)10.92 (10.65)29.1231.1248.7751.75
30 years (1979–2008)10.24 (10.09)10.95 (10.82)29.0330.7948.3751.55
9 years (2000–2008)9.90 (9.87)10.46 (10.41)28.4230.2347.4750.82
Table 2. Main statistics for different temporal subranges of IB02 dataset (extended wintertime extreme days).
Time RangeMean (STD) (mm·day−1)95th Percentile (mm·day−1)99th Percentile (mm·day−1)
59 years (1950–2008)11.46 (10.94)32.3853.16
30 years (1979–2008)11.53 (11.22)32.9954.25
9 years (2000–2008)11.07 (10.88)31.7553.0

