Hydrodynamic Performance Analysis of the Vertical Axis Twin-Rotor Tidal Current Turbine

1
School of Marine Engineering and Technology, Sun Yat-sen University, Guangzhou 518000, China
2
College of Shipbuilding Engineering, Harbin Engineering University, Harbin 150001, China
3
Department of Naval Architecture, Ocean &Marine Engineering, University of Strathclyde, Glasgow G1 1XQ, UK
*
Authors to whom correspondence should be addressed.
Water 2018, 10(11), 1694; https://doi.org/10.3390/w10111694
Submission received: 28 October 2018
/
Revised: 15 November 2018
/
Accepted: 17 November 2018
/
Published: 20 November 2018
(This article belongs to the Special Issue Applications of Computational Fluid Dynamics for Marine and Offshore Engineering)
Abstract
:The goal of this manuscript is to investigate the influence of relative distance between the twin rotors on the hydrodynamic performance of the vertical axis twin-rotor tidal current turbine. Computational fluid dynamics (CFD) simulations based on commercial software ANSYS-CFX have been performed to enhance the understanding of interactions between the twin-rotors. The interactions between the twin rotors are known to have increased the power output efficiency as a whole, and it is, therefore, of great significance to undertake deeper research. The simulation results are found to be consistent with similar research results in the literature in some aspects. The simulation results of stand-alone turbine and twin rotors are compared from three different aspects, including blade forces, power output efficiency and wake flow field. The results showed that the cyclic variations tendency of blade force coefficients of twin rotors is close to that of the stand-alone turbine. The average power output efficiency of the twin-rotors system is higher than that of the stand-alone turbine. The interactions between the turbines increase the power output of the twin turbine system as whole in a wide relative distance range. However, smaller relative distance between the twin rotors does not mean a bigger power output efficiency of such a system. The power out efficiency of such a system would decrease when the relative distance between the twin rotors exceeds the critical point. The power output of the twin rotors reaches the peak value when the ratio between the two main axis distance and diameter of the turbine is around 9/4. This research can provide a reference for the design and development of larger tidal power stations.
1. Introduction
Water resources are widely used in the daily lives of human beings in industry, agriculture, power generation, environmental transformation and so on. Power generation is one of the most important parts of the complex utilization of water resources. Power is an indispensable part of human lives, and hydropower is an important supplement power resource. Meanwhile, energy needs, their associated security of supply coupled with environmental issues and the impact of climate change will require policies to exploit non-polluting natural power sources [1].
As an important type of renewable energy, tidal current energy is widely distributed in the ocean and the development of tidal current energy has very little influence on the environment [2,3]. Among all the renewable energy resources, tidal current energy can be used to generate power without occupying fresh water and land, which is a huge benefit over others [4]. In order to generate power from tidal currents, a tidal current power generation device has to covert kinetic energy into circumrotation mechanical energy. For the tidal current power generation device, a tidal current turbine is one of the most important and indispensable parts of a tidal current power generation device [5]. The tidal current turbine can be divided into vertical axis turbine and horizontal-axis turbine by the relative position between the main shaft and the incoming flow direction [6]. Since the tidal current turbine research is inspired by the success of the horizontal axis wind turbine in wind power generation industry in the first place, horizontal axis tidal turbine investigation has been the focuses of the researchers, and horizontal axis tidal turbine remains one of the most common types of tidal turbines until now. At present, several pre-commercial prototypes of tidal current turbine have been deployed in the sea, e.g., Seagen (2008, Northern Ireland), TidEL (2006, UK), Kobold (2002, Italy), GHT (2002, USA) et al. According to [7], horizontal axis tidal turbines comprise a share of usage versus verticla axis turbines of 43% and 33%, respectively. Vertical axis tidal turbines are seeing renewed interest in tidal current energy conversion area, especially when the wind industry has effectively discarded this technology. Compared with the horizontal axis turbine, the vertical axis turbine has the advantages of independence of flow direction, simple blade structure, low manufacture cost, low possibility of cavitation, less noise emission and better flow direction adaptability [3]. The vertical axis tidal turbines allow the generator and other apparatus to be placed above the water level, which reduces the difficulty of water tightness and maintenance. Besides, the vertical axis tidal current turbine allows convenient mounting of various curvilinear or rectilinear ducts. The structure of the vertical axis turbines can be easily used for floating purposes.
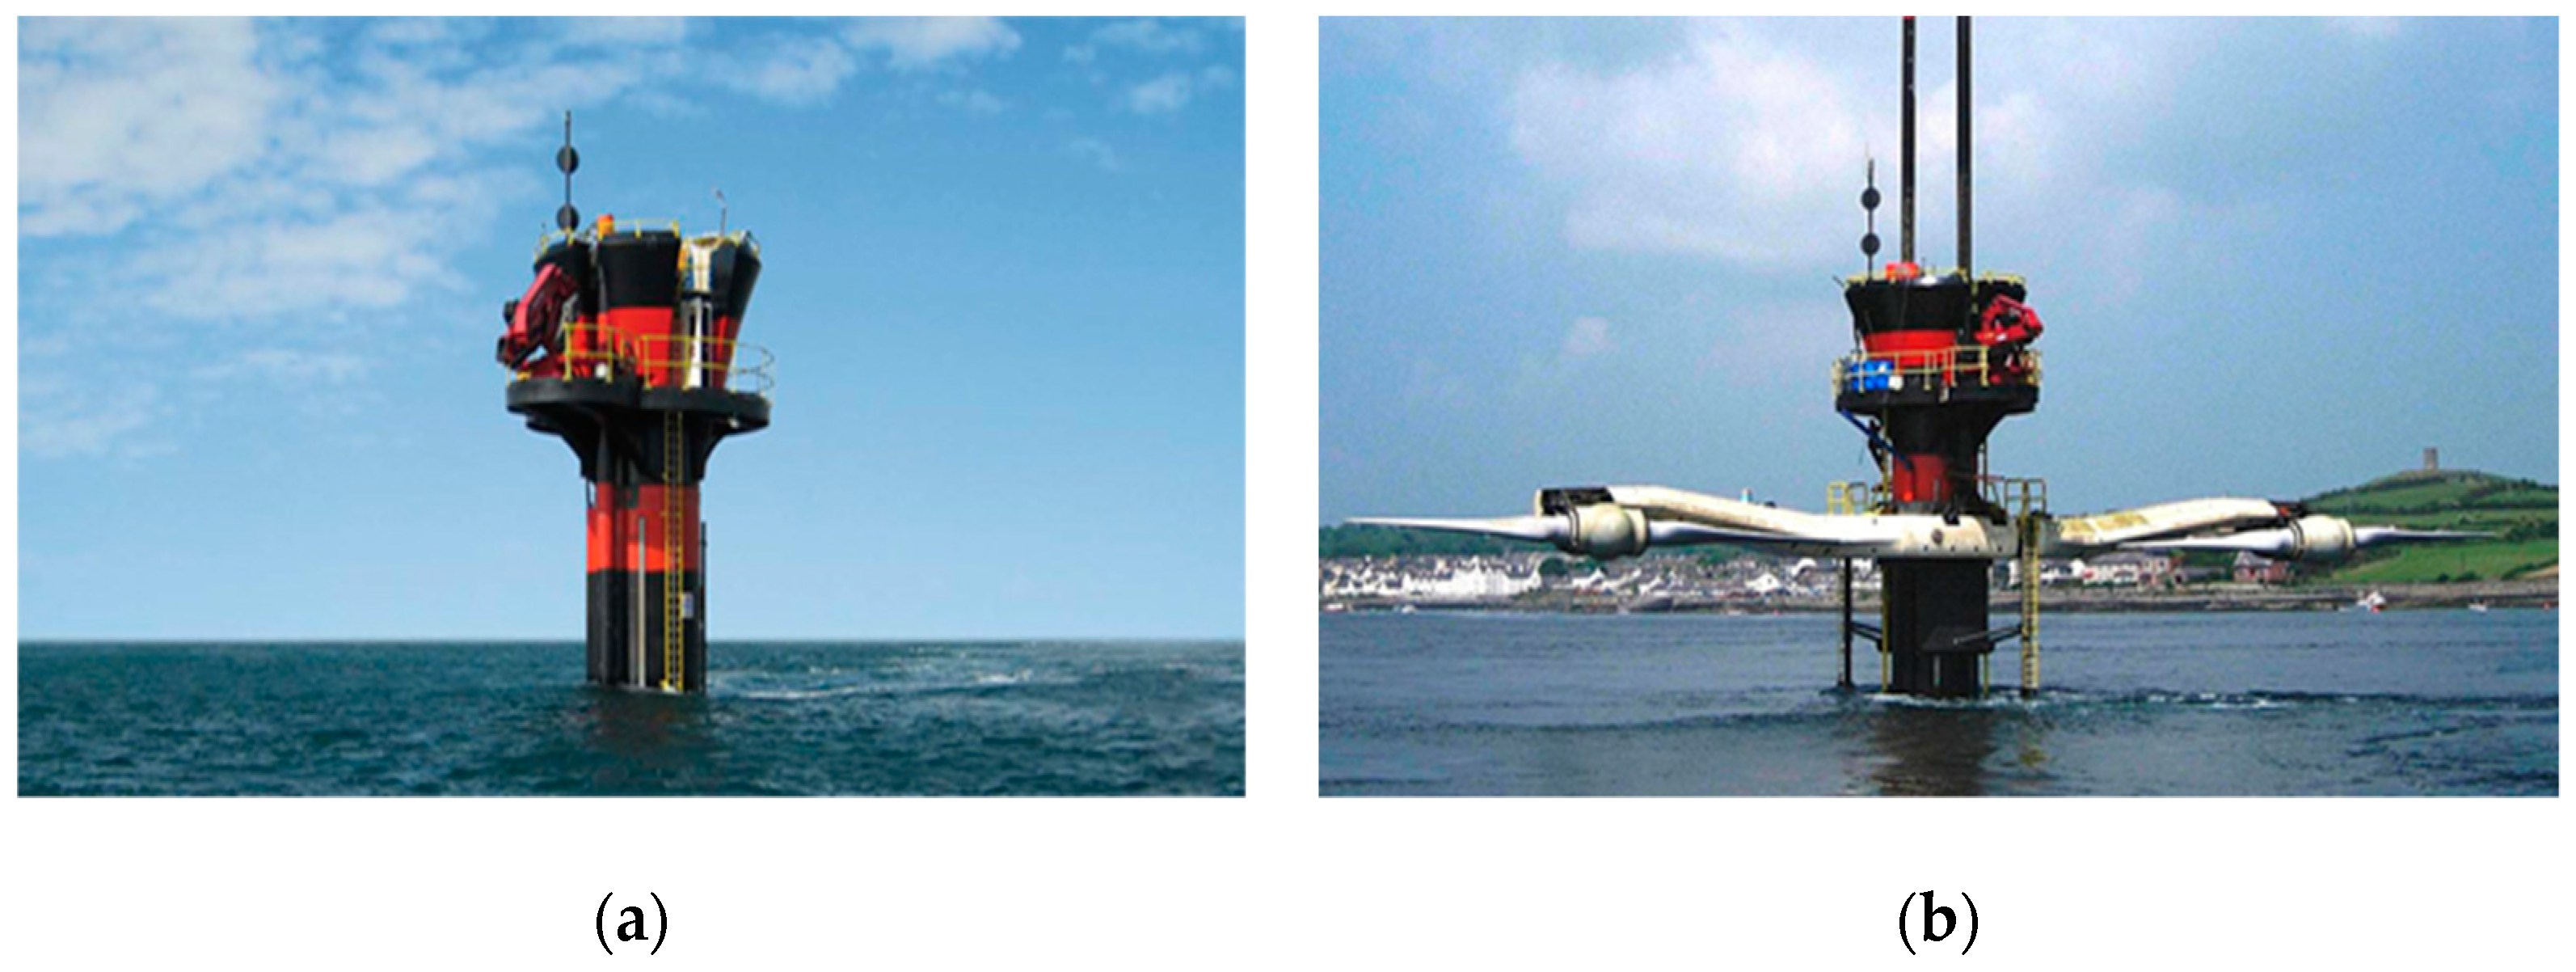
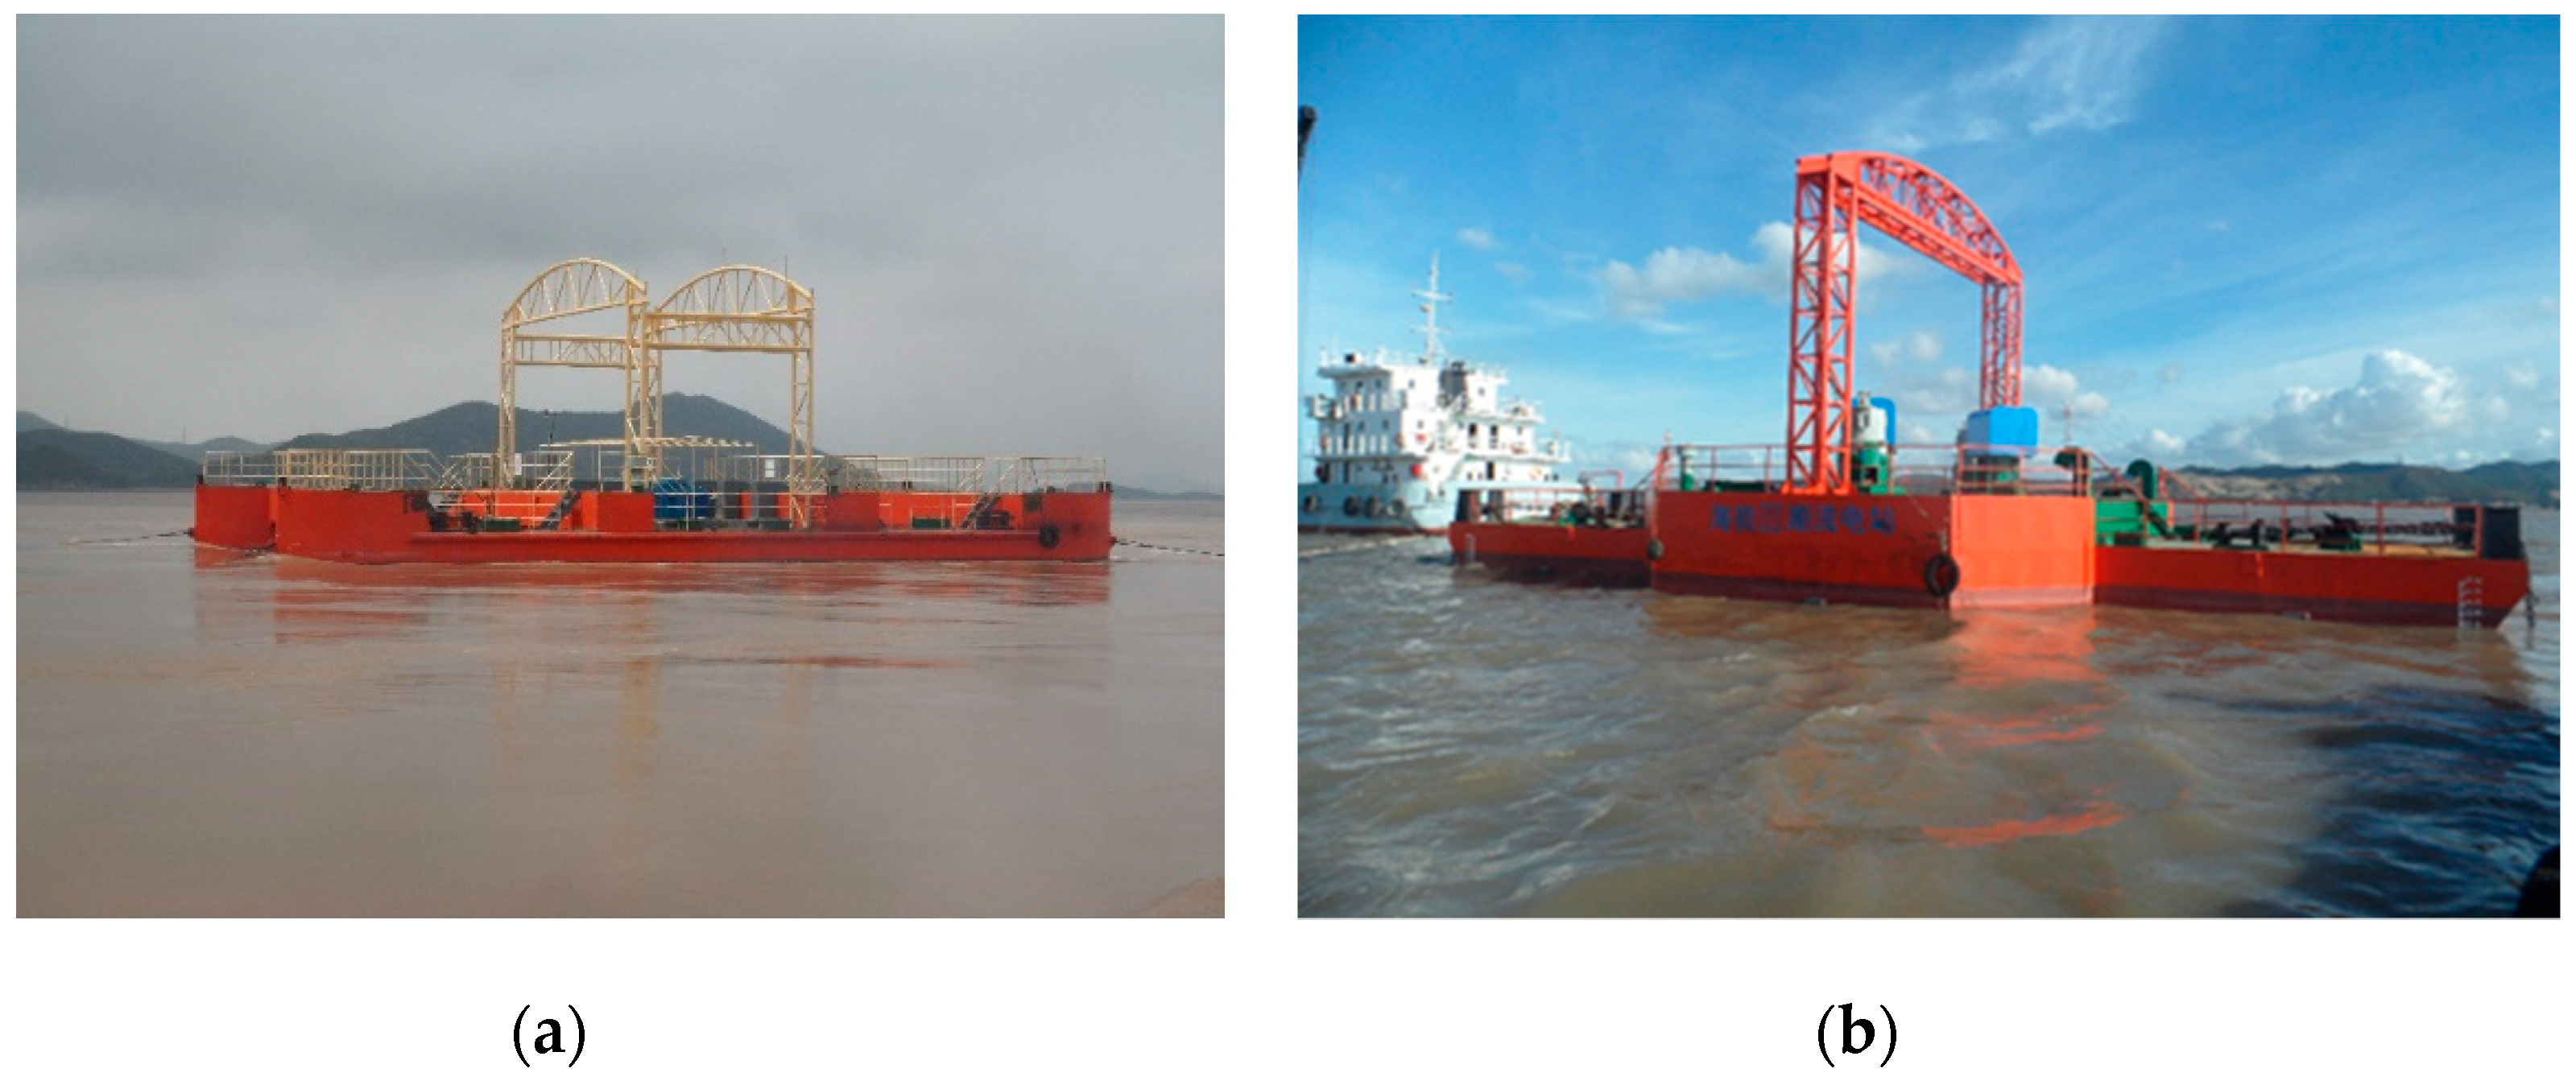
With the further research of vertical axis tidal turbines and, informed by the design of twin-propeller system in the marine industry, many tidal current turbine designers and researchers suggested that a twin-rotors system is a better deployment format. The stand-alone turbine system has the disadvantage of low income–investment ratio. The stand-alone turbine system will be continuously affected by lateral force of the turbine during operation, which can be a disadvantage for the stand-alone turbine system carrier to keep stable [8]. A few studies about the twin-rotors system with horizontal axis turbines and vertical axis turbines have been reported [9]. The first twin-rotors system with horizontal axis turbine is developed by Marine Current Turbines in Strangford Narrows, Northern Ireland (Figure 1). There are also some other creative twin-rotors systems equipped with horizontal axis tidal turbines, such as Kuroshio [10], Nauiricity [11], et al. Apart from the horizontal axis twin-rotors system, the vertical axis twin-rotors system also grabs the attention of researchers due to its unique advantages. Several prototypes of tidal current power stations equipped with vertical axis twin-rotors systems are developed by Harbin Engineering University, e.g., “HaiNeng I”, “HaiNeng III” (Figure 2) [12,13].
Despite the fact that the vertical axis twin-rotors systems have been deployed, research about the vertical axis twin-rotors system is seldomly reported in the literature. The interactions with the twin-rotors system are still not very clear. The power output increasing mechanism of twin-rotors system needs further investigation. Furthermore, the wake flow characteristics analyses of the twin rotors are still inadequate. The wake flow characteristics research of the twin-rotors system can enhance the understanding of power output increasing mechanism of such a system. The investigation of the twin rotors can provide references for the turbine array farm development.
The investigation tool of the hydrodynamic performance of turbine array can be divided into four categories: experimental method, blade element-momentum theory models, vortex methods based on potential theory, and computational fluid dynamics method based on viscous fluid theory. In terms of experimental method, Bahaj et al. [14] carried out an experiment to study the early generation marine current energy converter arrays. The turbine arrays are simulated by multiple actuator disk. The results highlight an optimal lateral spacing between devices where, under certain conditions, flow could be accelerated between a pair of rotor disks. This enhanced flow speed gives rise to the counterintuitive notion of a downstream row of devices producing more power than the upstream row. Sutherland et al. [15] carried out an experiment to investigate the lateral and stream-wise turbine spacing as well as differences between staggered and in-line layouts on power output. Results showed that staggered array with decreased streamwise spacing gained more power from the current than other layouts.
For blade element momentum method, Bai et al. [16] established a blade-element actuator disk model coupled with the blade element method and a three-dimensional Navier–Stokes (N–S) code. The turbine is simulated as an actuator disk. To achieve the same effect as rotating blades, a moment source calculated by blade element theory (BEM) is inserted to the computational fluid dynamics (CFD) solver. This model was used to investigate the relationship between power extraction and the layout of turbine arrays. Results showed that the power output of zigzag pattern turbine array was bigger than a turbine array in a row. Meanwhile, the rotation direction of upstream turbines has little effect on the average power output of zigzag pattern turbine array. The optimal lateral and longitudinal distance between the turbines in the turbine array location deployment were also suggested in the paper of Bai.
In terms of the vortex method based on potential theory, usually the turbine was simulated by a set of vortices filaments with an accurate description of blade geometry. Li et al. [17,18] investigated the relative rotation direction and relative position on the hydrodynamic performance of a twin-rotors array by self-developed vortex method—discrete vortex method–University of British Columbia (DVM–UBC). Research results showed that relative distance in the flowdirection is a crucial factor influencing the power output efficiency. Meanwhile, the average power output will increase when the rotation direction of the twin rotors is opposite. Goude et al. [19] investigated the hydrodynamic performance of several turbines using a 2D vortex method. The simulation results were compared with two combinations, one with all turbines in a row, and the other with a zigzag pattern. The total power output of the zigzag pattern was bigger than that of turbines in a row but the manuscript did not systematically investigate the influence of relative distance on the hydrodynamic performance of turbine array. Dyachuk et al. [20] investigated the influence of incoming flow angle on the hydrodynamic performance of turbine array in a row. Incoming flow direction has a bigger impact on the power output efficiency of the closer turbine array in a zigzag pattern. When the flow direction changed from 0° to 30°, the average power output efficiency of turbine array in a zigzag pattern decreases, while the average power output efficiency of the turbine array in a row remains constant. However, even for a small distance between the turbine array, the power output efficiency is larger than single turbine for a wide range of flow directions. Gebreslassis et al. [21] researched the influence of different turbine array deployments on the hydrodynamic performance of the turbines. Results showed that small relative distance for turbine in a row will lead to large power output loss of a turbine downstream. Nishino et al. [22] proposed an idea of scale separation between the flow around each turbine. The method also assumes that all device-scale flow events, including “far wake” mixing behind each turbine, take place much faster than the horizontal expansion of the flow around the entire array. Results showed that the efficiency increased as the spacing was reduced to the optimal value due to the effect of blockage, but then decreased as the spacing was further reduced due to the effect of array-scale choking.
The CFD method plays a more and more important role nowadays on hydrodynamic research due to the rapid development of computer technology. Georgescu et al. [23] established a 2D numerical method with COMSOL Multiphysics and Fluent software (15.0, ANSYS Inc, Pittsburgh, PA, USA) to compute the overall farm efficiency [24]. Three different turbine configurations were performed in the simulation and the simulation results were compared with experimental results. Simplified COMSOL overestimates the power output compared with Fluent software and experiments, but it can be relatively quick to decide the characterization of different arrangements of turbines. Results from COMSOL and Fluent agreed well with experimental results and more work needs to be done to draw conclusions on the limitations of two-dimensional numerical models. Wang et al. [25] investigated the initial phase angle on the performance of a twin-rotors system with commercial software Ansys-CFX (15.0, ANSYS Inc, Pittsburgh, PA, USA) [26]. Results showed that the total power output of 0 degree phase angle was lower than any other phase angles. The load of the blade at 90 degree phase angle is smaller than any other phase angles and the pressure near the blade tip is the smallest.
CFD is a powerful tool if used properly, but it is computationally expensive, especially when dealing with complex geometry such as a tidal current turbine. This paper presents investigations on the hydrodynamic characteristic of the twin rotors and the influence of the relative distance between the two rotors with commercial software Ansys-CFX. A high-performance computer work station has been used to carry out the transient CFD simulations to obtain reliable results within reasonable time. The discretization scheme method in the numerical simulation is the finite volume method (FVM). A Shear stress transport (SST) turbulent model is adopted in the paper. Several different validation cases are performed to make sure the independence of the numerical simulation results. The hydrodynamic performance (blade force coefficient, thrust coefficient, power output efficiency) of the twin-rotors system are analyzed and the results are compared with a stand-alone turbine system at first. After the analysis of turbine load coefficients, the mutual interferences between the two rotors are analyzed from two aspects, namely, velocity distribution and pressure distribution in the flow field. Secondly, to investigate the influence of the relative distance between two rotors on the hydrodynamic performance of such a system, this paper obtains the power output efficiency curves of twin-rotors system under different relative distances. The mechanism of power output efficiency change is analyzed from the wake flow field characteristics. The analysis of the flow field can give some insights into the power output increasing mechanism of the twin rotors. Through the analysis of the numerical results at different relative distances, an optimal relative distance should be existed in the twin-rotors system configuration. The results of this manuscript provides an important reference for the configuration of the twin-rotors system and further research on the twin-rotors system.
2. Definition of Coordinate System and Dimensionless Parameters of Turbine
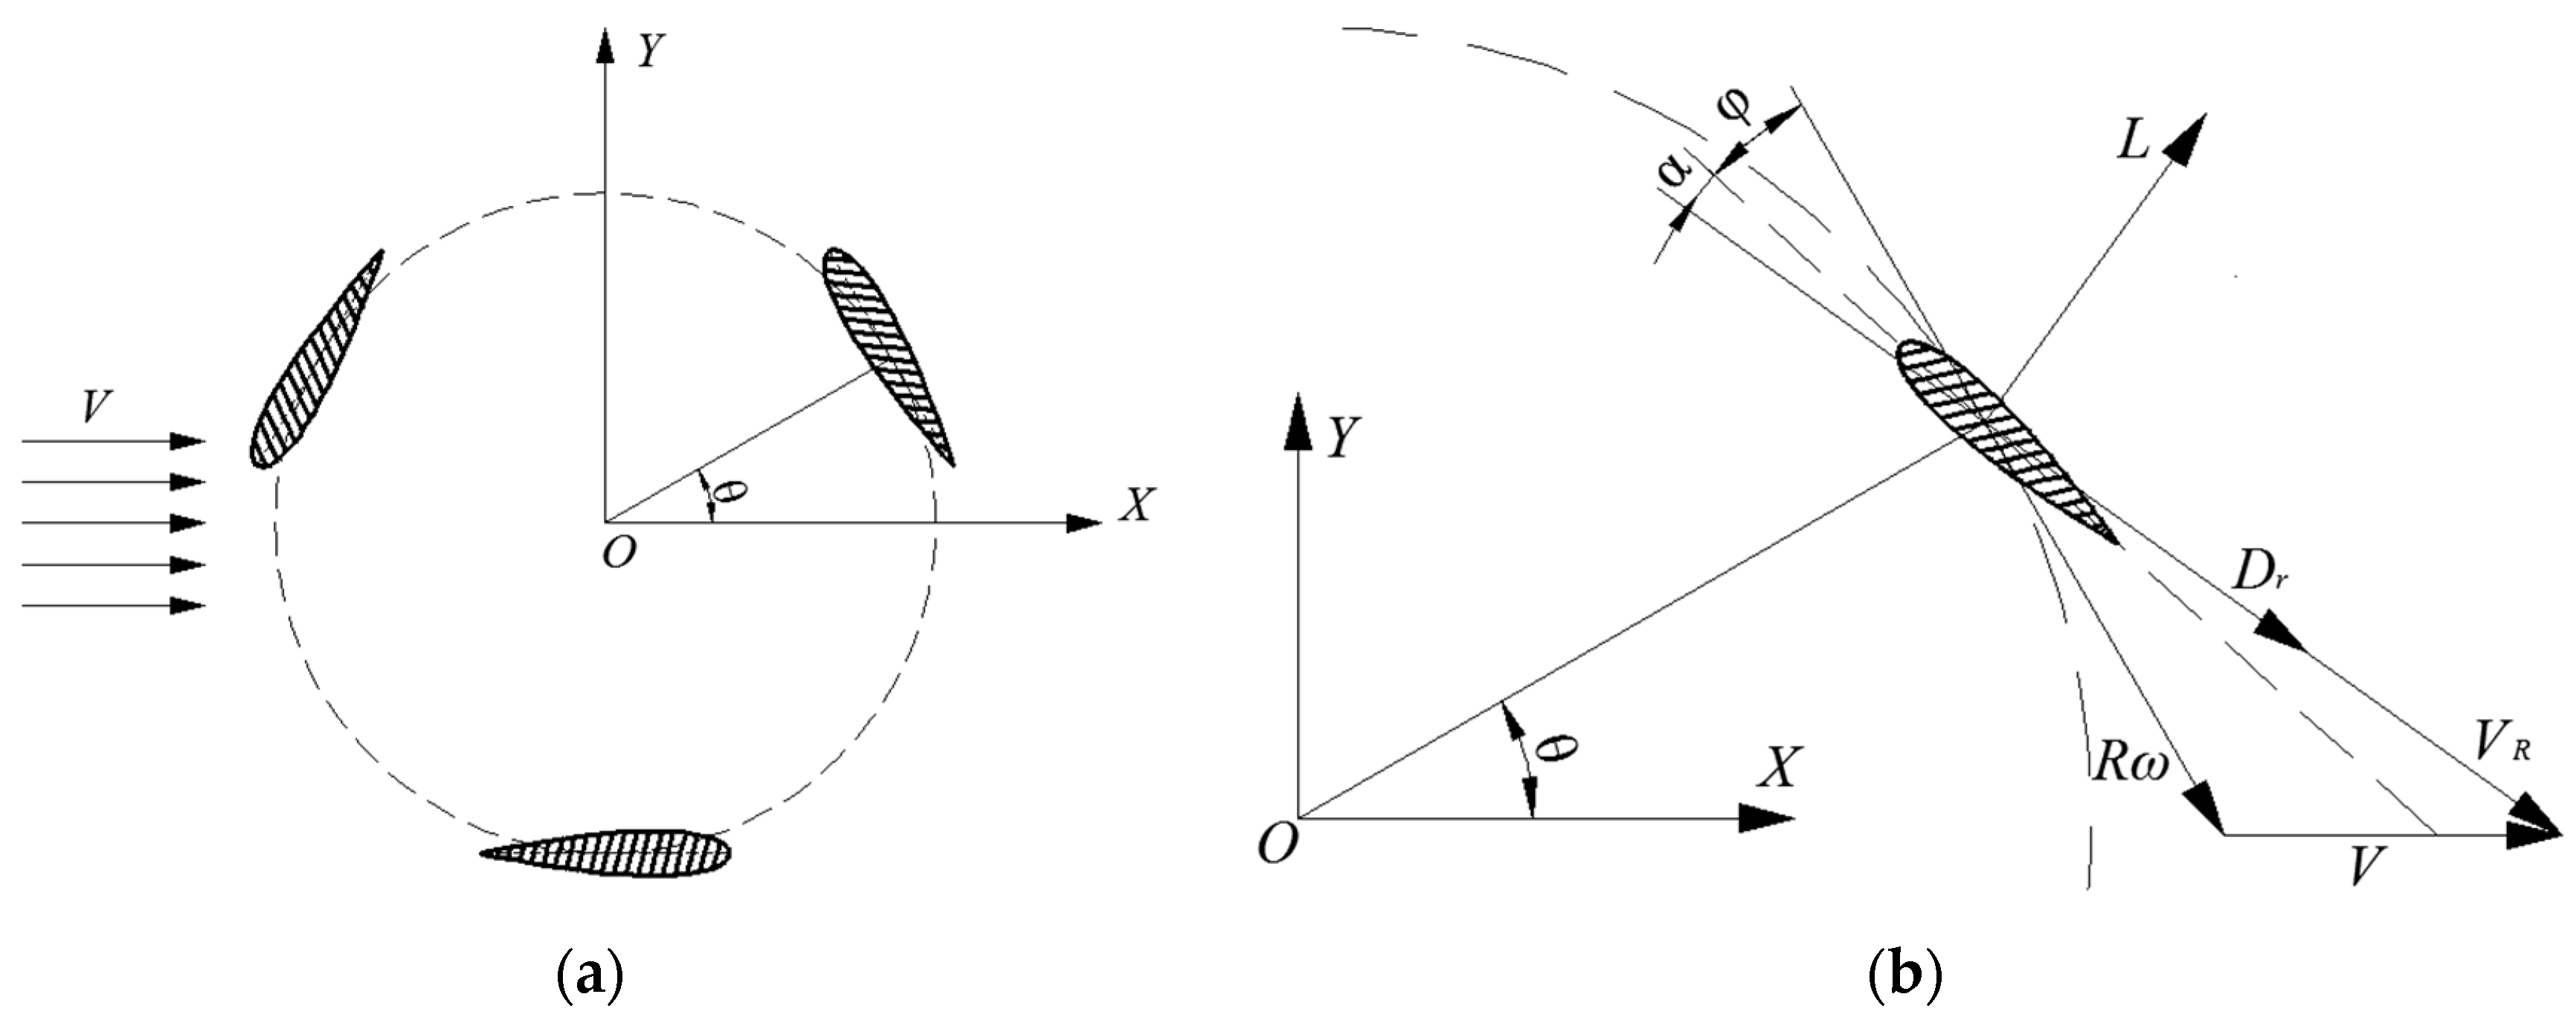
The coordinate for numerical simulation of this paper is shown as Figure 3. The water flow comes in the positive direction of the X-axis. The rotation of the turbine and the positive direction of the Z-axis conform to the right-hand rule. The definition of blade position angle and the initial position of the turbine are shown as Figure 3a, and the blade position angle of 0° is parallel to the positive direction of the X-axis. Defining the angle between the chord of the blade and the tangent track is the blade pitch angle . The definition of the blade pitch angle and attack angle are shown as Figure 3b.
During the rotation, the blades generated the lift force and drag force when the water flows through. When the blades are on the blade position angle , the lift force and drag force of the blade per unit length are:
where, is fluid density, is the flow velocity, , is the coefficients of the lift and drag, C is the chord of blade.
Decomposing the force along tangential direction and normal direction of the circular path, the tangential and normal force coefficient (,) of single blade are:
where, is positive from the trailing edge to leading edge, is positive when it is pointing to outside of the blade.
The thrust coefficient and lateral force coefficient of a single blade to rotation axis can be expressed as:
All the blade stress superposition can get the thrust and lateral force of the impeller, among them, the thrust is positive to the X-axis positive direction, the lateral force is positive to the Y-axis positive direction.
The torque of the single blade to rotation axis is:
where, R is the radius of the turbine.
From (5), the torque is the function of , and the average torque and the average power output are the mean value in one period and they can be expressed as follows:
where, is the number of blades, is the angle velocity of rotation.
For the convenience of dealing with calculation results and comparisons of different model results, it is necessary to make each parameter dimensionless. Through dimensional analysis, the dimensionless parameters can be obtained as follows:
where, is tip speed ratio; is compactness; is power output efficiency; is the tangential force of the blade; is the coefficient of the normal force of the blade; is coefficient of the thrust of the impeller is the coefficient of the lateral force of the impeller; is the coefficient of the torque of the impeller; is the diameter of the turbine; and is the span of the blade.
To make the conclusion more general, the paper defines relative distance “DIST” which is the ratio of the distance between the two main axis and turbine diameter. Its expression is as follows:
where, DIST is the dimensionless relative distance; DIST′ is the distance between the two main axis.
3. Computational Fluid Dynamics (CFD) Setup and Mesh
In the CFD simulation, the physical model is simplified to be 2D numerical model and there are no shaft, arms, and circular plate at the end of blades. The computer specifications used to simulate the 2D CFD analysis are Intel(R) Xeon(R) CPU E5-2696 [email protected] 2.20GHz (Core 2), 128GB RAM. The geometry of the tidal turbine was generated and meshed in the Integrated Computer Engineering and Manufacturing code for Computational Fluid Dynamics (ICEM CFD), then imported to ANSYS-Pre-16.1. During the simulation, the ANSYS-CFX code with the sliding mesh technique is used to solve the incompressible unsteady Renolds-averaged Navier–Stokes equations (RANS) [27].
Extra turbulent model is needed to make the RANS equation conservative. SST model was adopted in the numerical simulation. The SST turbulence model was developed by Menter in 1994 [28]. The SST model is a widely used two-equation model which combines the strengths of model and model. A thorough explanation of how CFX treats the boundary layer, the blending between and , and how the model treats the transportation of turbulent shear stress can be found in [29]. SST shows advantages in capturing complex boundary layer flows under adverse pressure gradients or simulating flow separation. Compared with other turbulence models, the SST turbulence model cost less time in the numerical simulation process and can better predict the dynamic stall characteristic of the turbine [30]. Research results obtained by Pona et al. and Shinon et al. showed that the SST model proved to be accurate in simulating rotation fluid machinery [31,32].
Convergence criteria were set to be root mean square (RMS) less than 1.0 × 10⁻⁴. CFX uses the SIMPLEC (Semi-Implicit Method for Pressure Linked Equations-Consistent) algorithm [33] in the pressure-velocity coupling, therefore, several iterations were required within each timestep to make sure that the mass is conserved and the results are trustworthy. In the transient simulation presented in this manuscript, the transient solver is set to at least two times iteration within each timestep. The maximum number of coefficient loops should be less than 10 within each timestep. Adaptive timesteps were chosen resulting in an adjustable timestep with target coefficient loops between three and five iterations. The timestep was set to a maximum timestep of 1.0 × 10⁻³ s. A detailed discussion of the timestep can be seen in Section 4.1.2. The high-resolution second-order backward Euler scheme is adopted to discretize the transient term, ensuring an implicit time discretization. Time discretization adopted first-order discrete format.
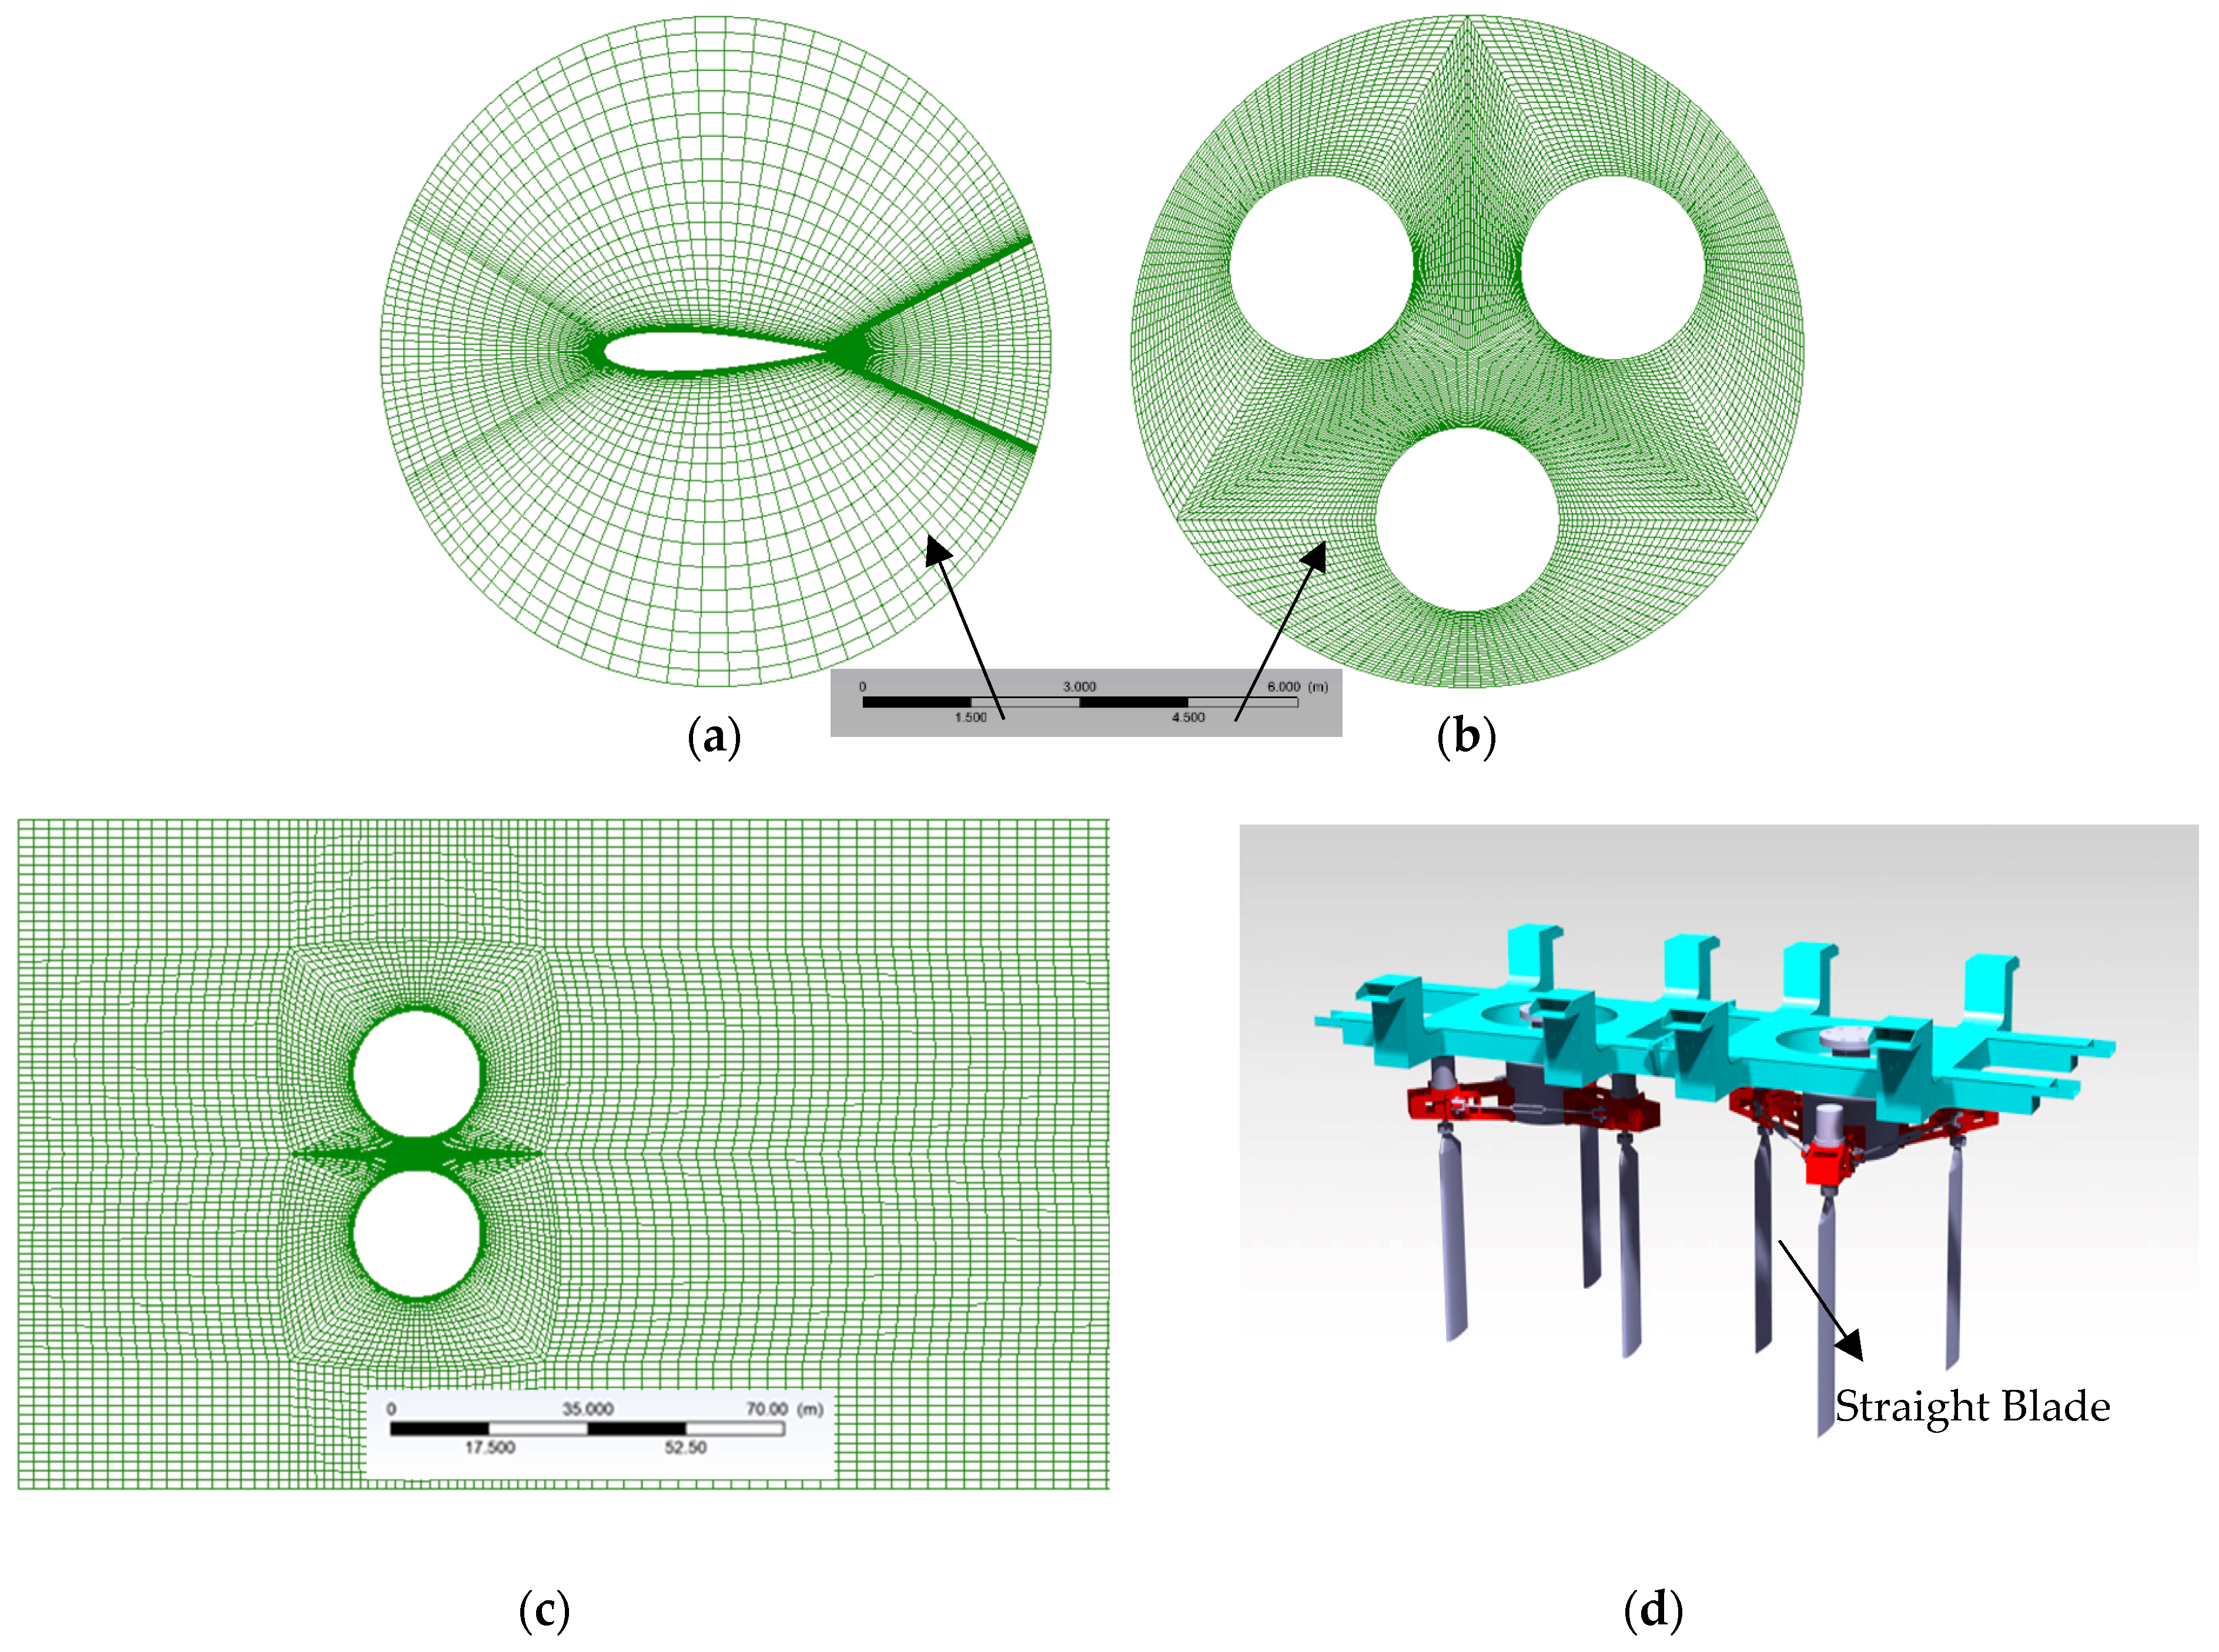
Considering the symmetrical characteristic of fluid field in the direction of the blade span of the vertical axis turbine, as well as saving the time of calculation, this research conducted the 2D numerical simulation. Compared with unstructured mesh, structural mesh shows more advantages in convergence speed and simulation accuracy [34]. To maintain the accuracy of the results, the structural mesh is used for calculation. The O-type meshing method is fully utilized in the rotation domain and the outer domain meshing. The rotation domain adopts the O-O mesh division method, and the static domain adopts the H-O mesh division method [35]. A first layer thickness of 0.0001 m and 30 inflation layers are used with a growth ratio of 1.02. Detailed discussion about the mesh settings can be seen in Section 4.1.1. Since the flow field between the two rotors is very complicated, therefore, the mesh density between the rotors has been refined when editing the mesh.
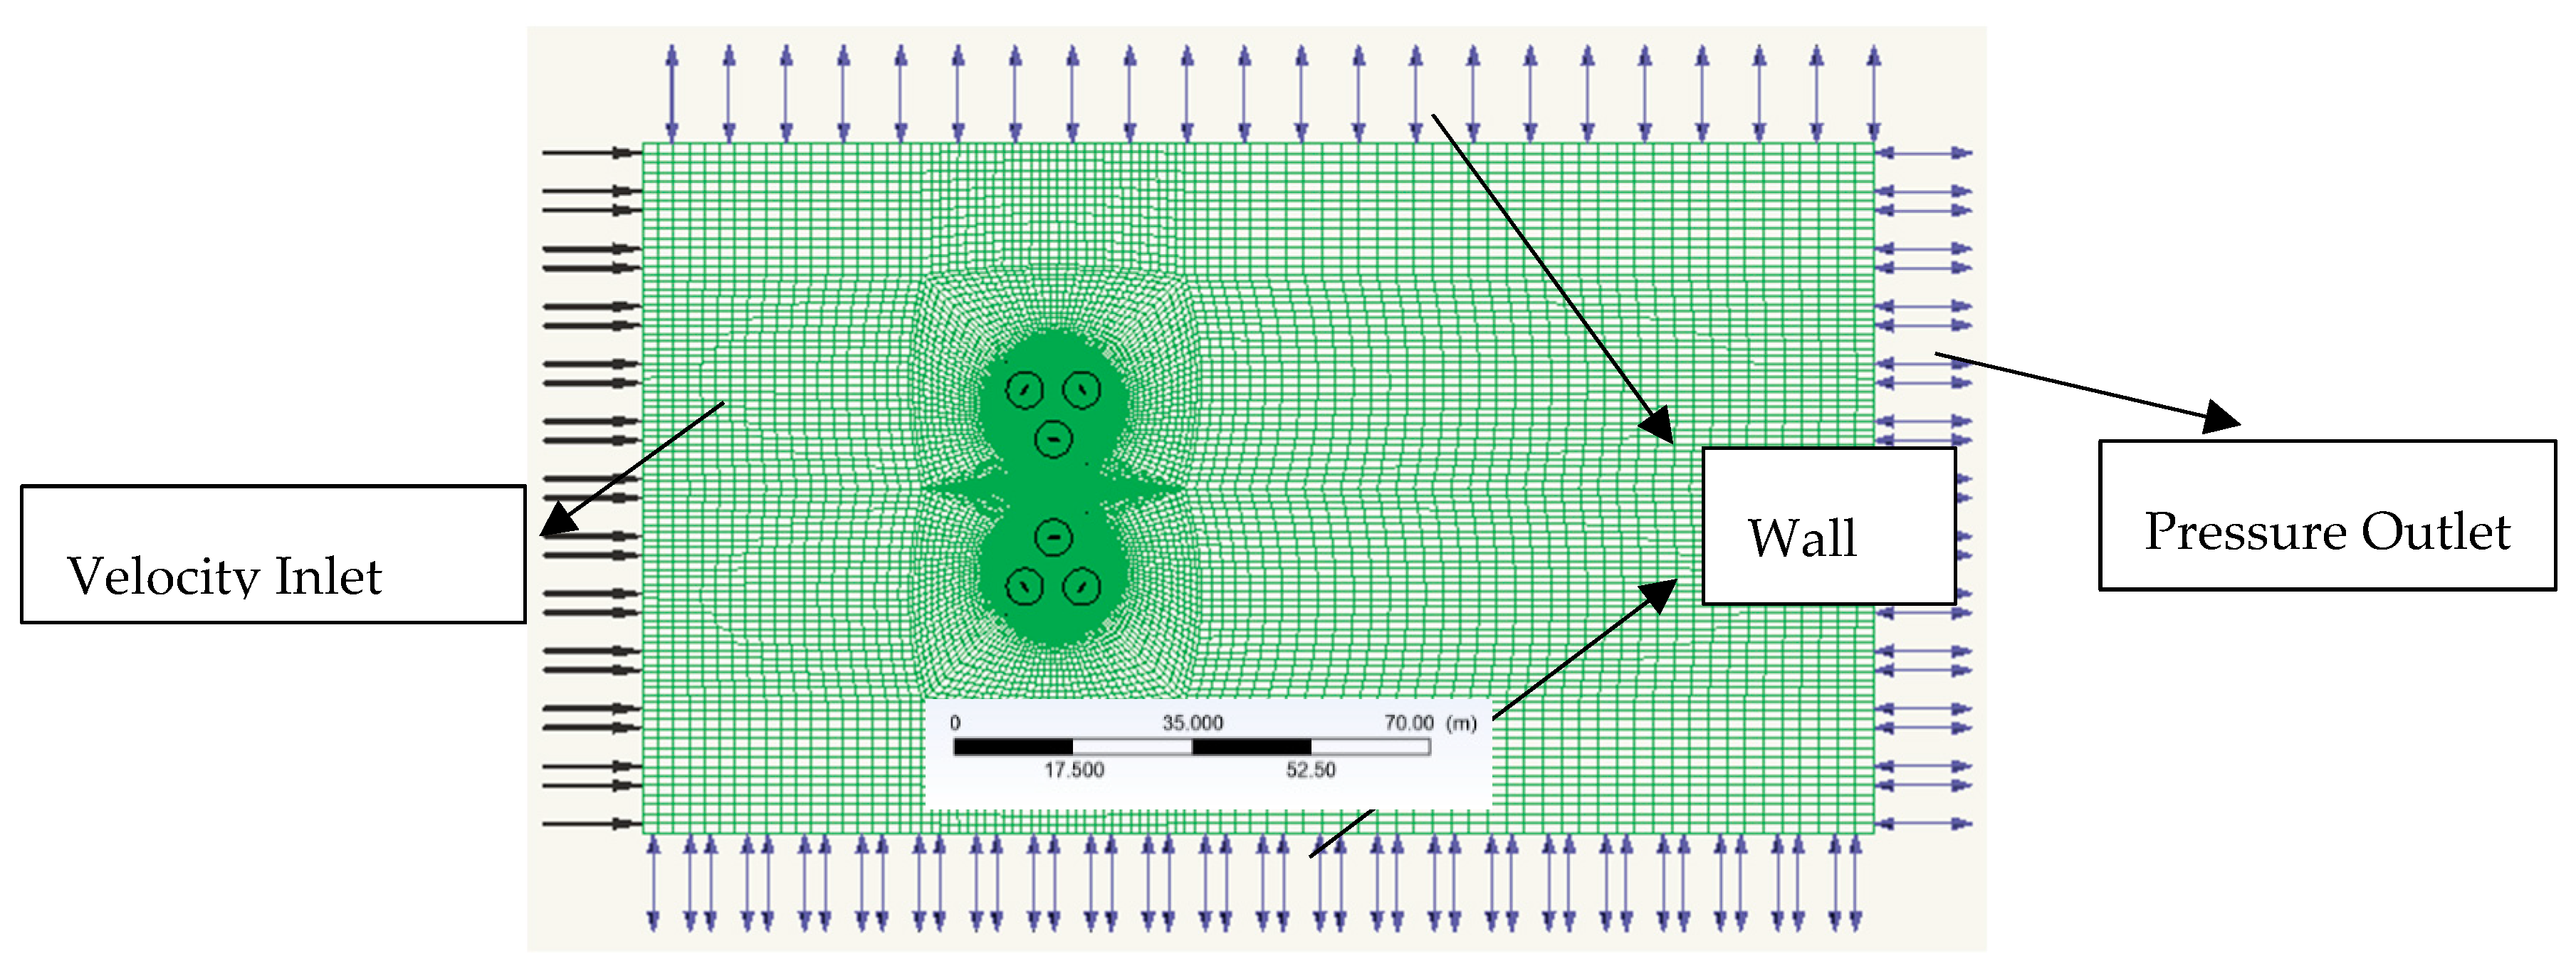
The mesh configuration settings are shown in Figure 4. The boundary condition settings are shown in Figure 5. The whole domain is divided into blade domain, rotation domain and outer domain, which is shown in Figure 4a–c. The two rotation domains of the twin rotors are arranged in the flow domain symmetrically with a certain distance. The outer domain and rotation domain are connected with interface and the relative motion between is realized by the sliding mesh technique. The interface type is the transient rotor-stator. The surface of the blade is set as non-slip wall and influenced by the fluid friction force. The outer side wall adopts the free sliding wall and the wall is not influenced by the fluid friction force.
The inlet is uniform flow and outlet is pressure opening. Several different turbulence intensities are implemented to investigate its influence on the hydrodynamic performance of the turbine. When the turbulence intensity increases from 0.5% to 15%, the average power output decreases by 0.6%. Turbulence intensity has very little effect on the hydrodynamic performance of the turbine, e.g., power output efficiency, but can cause larger blade forces fluctuations, as documented in [36]. Finally, the turbulence intensity 10% is adopted in the numerical simulation.
The numerical model of this paper is vertical axis twin-rotors. Two turbines have the same structural parameters, and they are parallel deployed with a certain distance in between. The diameter of the impeller is 8 m, the airfoil profile of the blade is NACA0018 (National Advisory Committee for Aeronautics), the chord length of blade is 1.476 m, each turbine has 3 blades, the solidity of is 0.1751, the DIST is 9/4. The rotation direction of the two rotors is opposite, and the phase difference is 0. The blades pitch angle is fixed.
4. Numerical Research on the Performance of Vertical Axis Twin-Rotors Tidal Current Turbine
4.1. Numerical Verification of CFD Simulation
4.1.1. Numerical Verification of Mesh Independence
The mesh quality of tidal turbine and flow field directly decides the accuracy of the simulation results and calculation time in the numerical simulation. The physical characteristics of the numerical turbine model can be simulated more accurately with higher mesh quality but at the cost of longer simulation time. Therefore, the mesh quality should maintain a balance between time consuming and results accuracy. Three different mesh qualities are chosen to verify the independence of mesh. Detailed mesh information is shown in Table 1.
Y plus is a dimensionless parameter in determining the scale of the first layer in numerical simulation. Usually, the thickness of the first layer near the wall will have a big influence on the accuracy of the simulation. Researches have already been carried out on the Y plus value during numerical simulation [30]. A common discipline is that the flow field around the turbine blade can be precisely simulated when Y plus is smaller than two [37]. The torque coefficient Cq can be obtained by Equation (15). Figure 6 shows the torque coefficient of the single turbine with three different mesh qualities. As we can see, the torque coefficient curve of mesh 1 is different from the other curves when the phase angle is between 150°~210°. The torque coefficient of mesh 2 and mesh 3 is almost the same. Therefore, mesh 2 has already reached the requirements of mesh independence and mesh 2 was adopted in the following numerical simulation.
4.1.2. Numerical Verification of Timestep
The right setting of the timestep is related to the accuracy of numerical simulation and the time consumption of the whole simulation process. Therefore, 0.005 s, 0.001 s, 0.0005 s are selected to verify the influence of timestep on the simulation process and results. Figure 7 shows the torque coefficient of the turbine in a period. As we can see, the curve is almost the same when the timestep is 0.001s and 0.0005 s. meanwhile, the curve of torque coefficient at 0.005 s is bigger than the other two. The time consumption of 0.0005 s in the simulation process is almost twice of the 0.001 s. Therefore, 0.001 s is chosen to be the timestep in the simulation process.
4.1.3. The Effects of Side Wall and Wall Category
Researchers have not drawn a unified conclusion about the category of wall and the distance between the wall and center of the turbine used in specific numerical simulations [38,39]. Therefore, the influence of wall category (slip wall and non-slip wall) and the distance Dw (distance between the side wall and center of the turbine) on the hydrodynamic performance of the turbine is investigated in this paper.
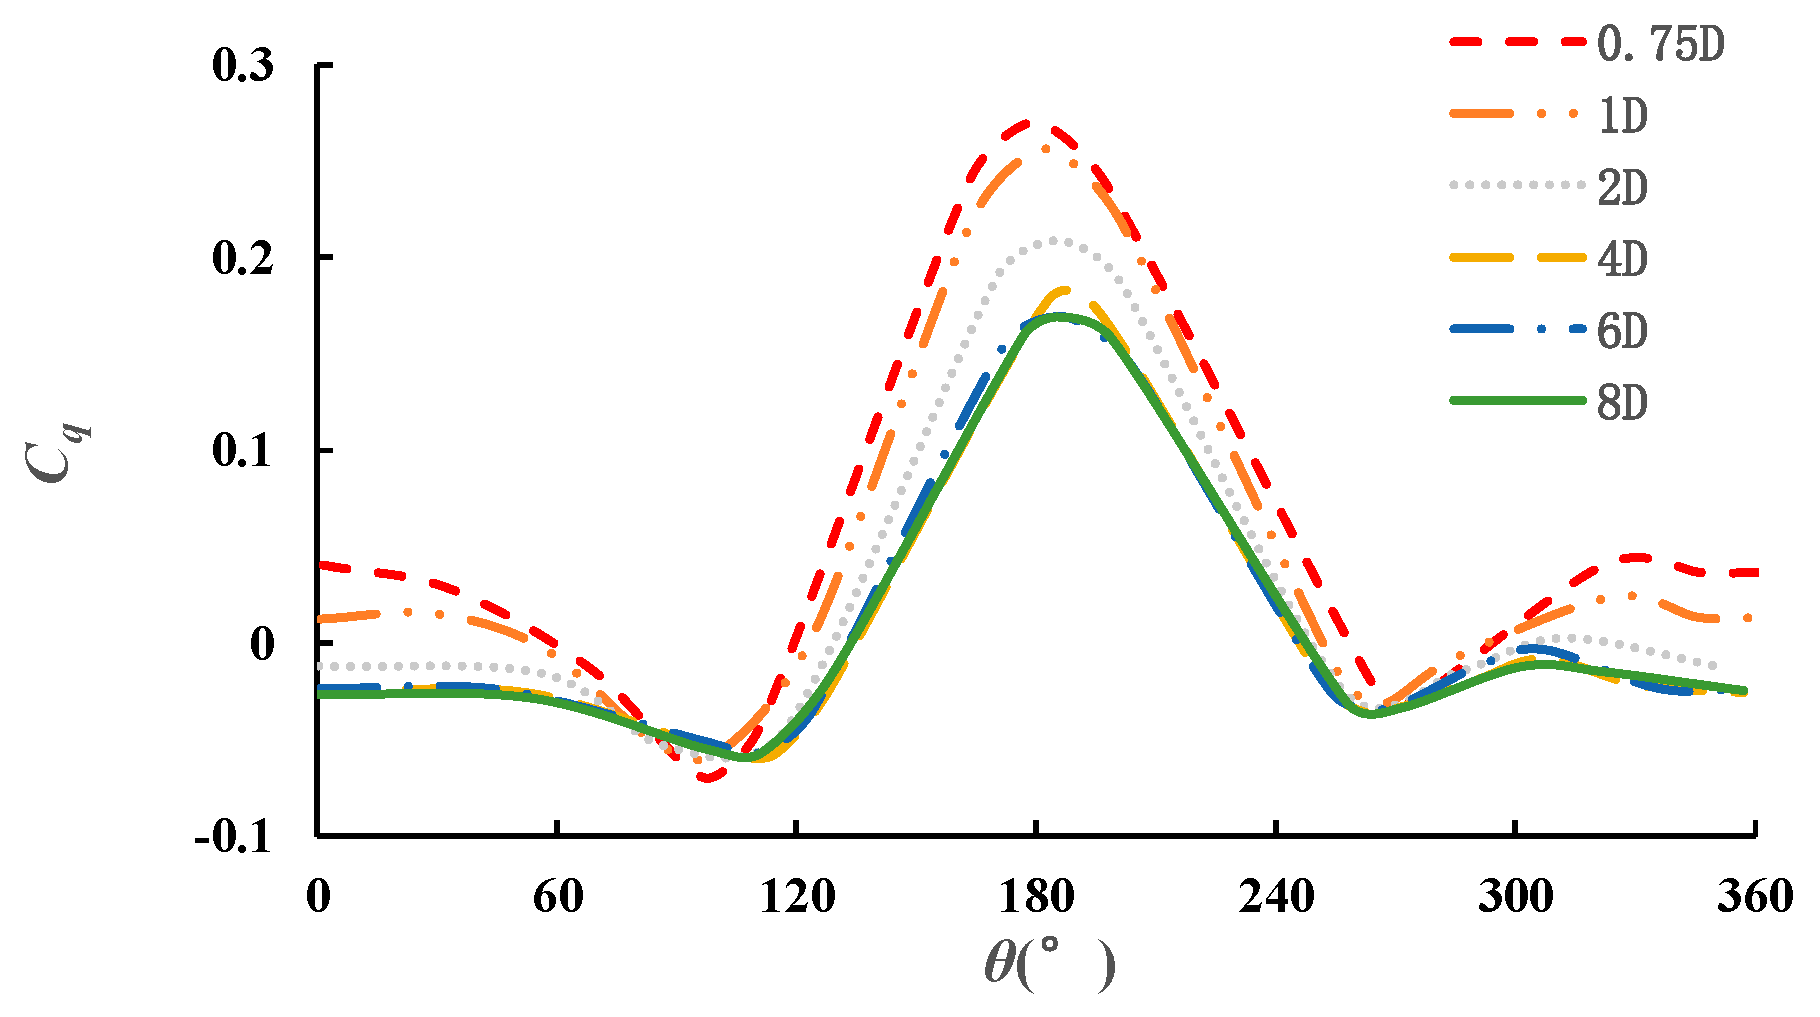
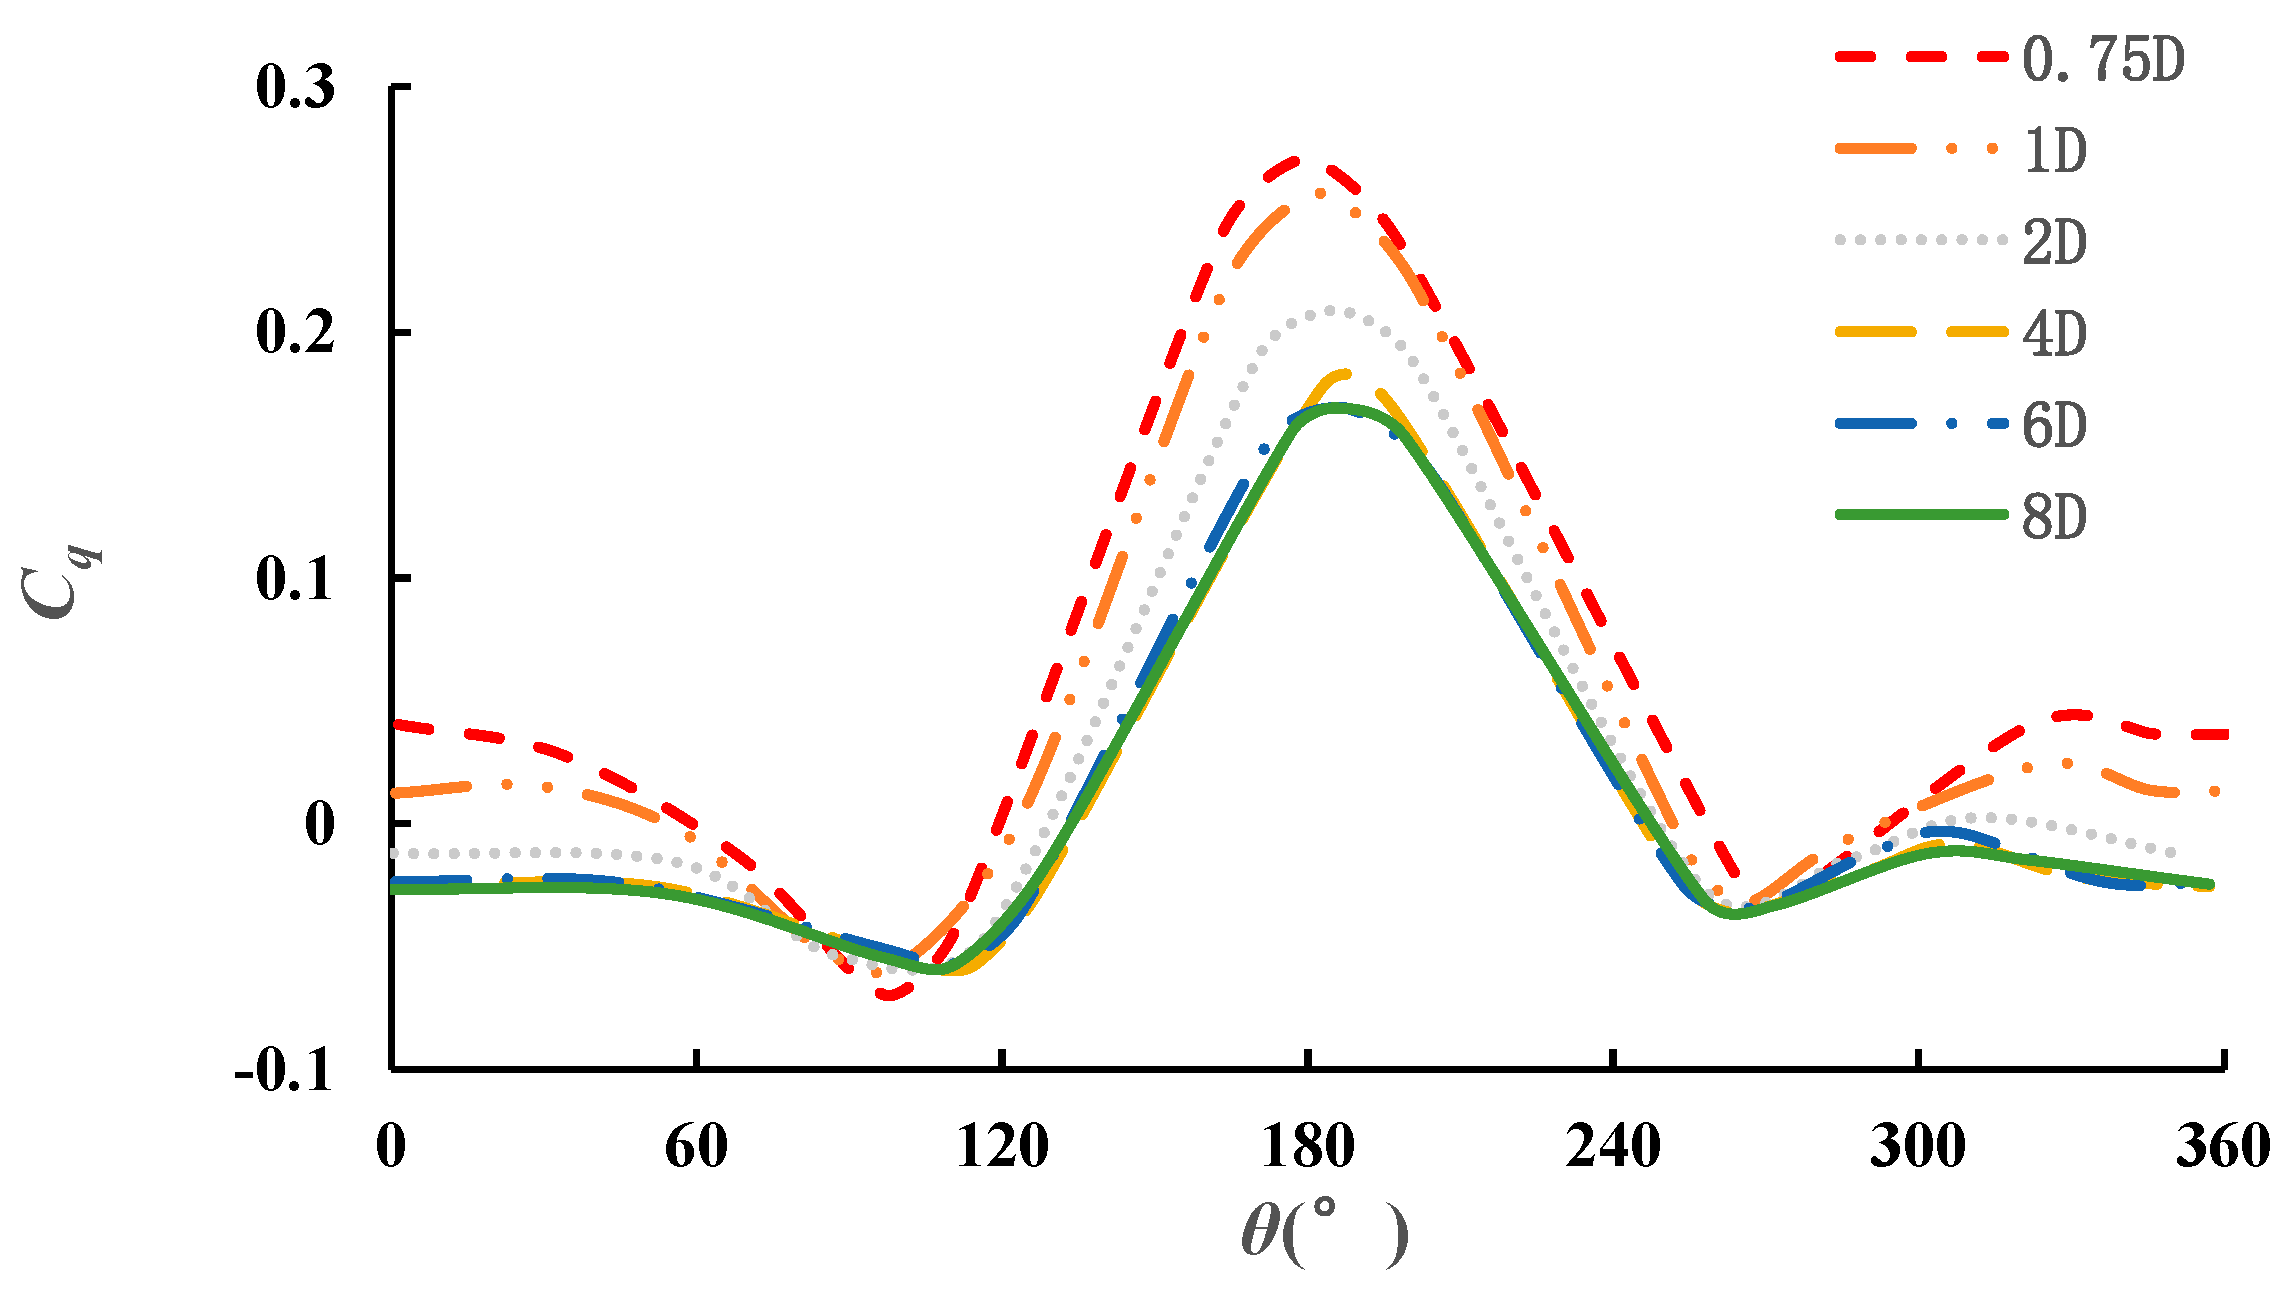
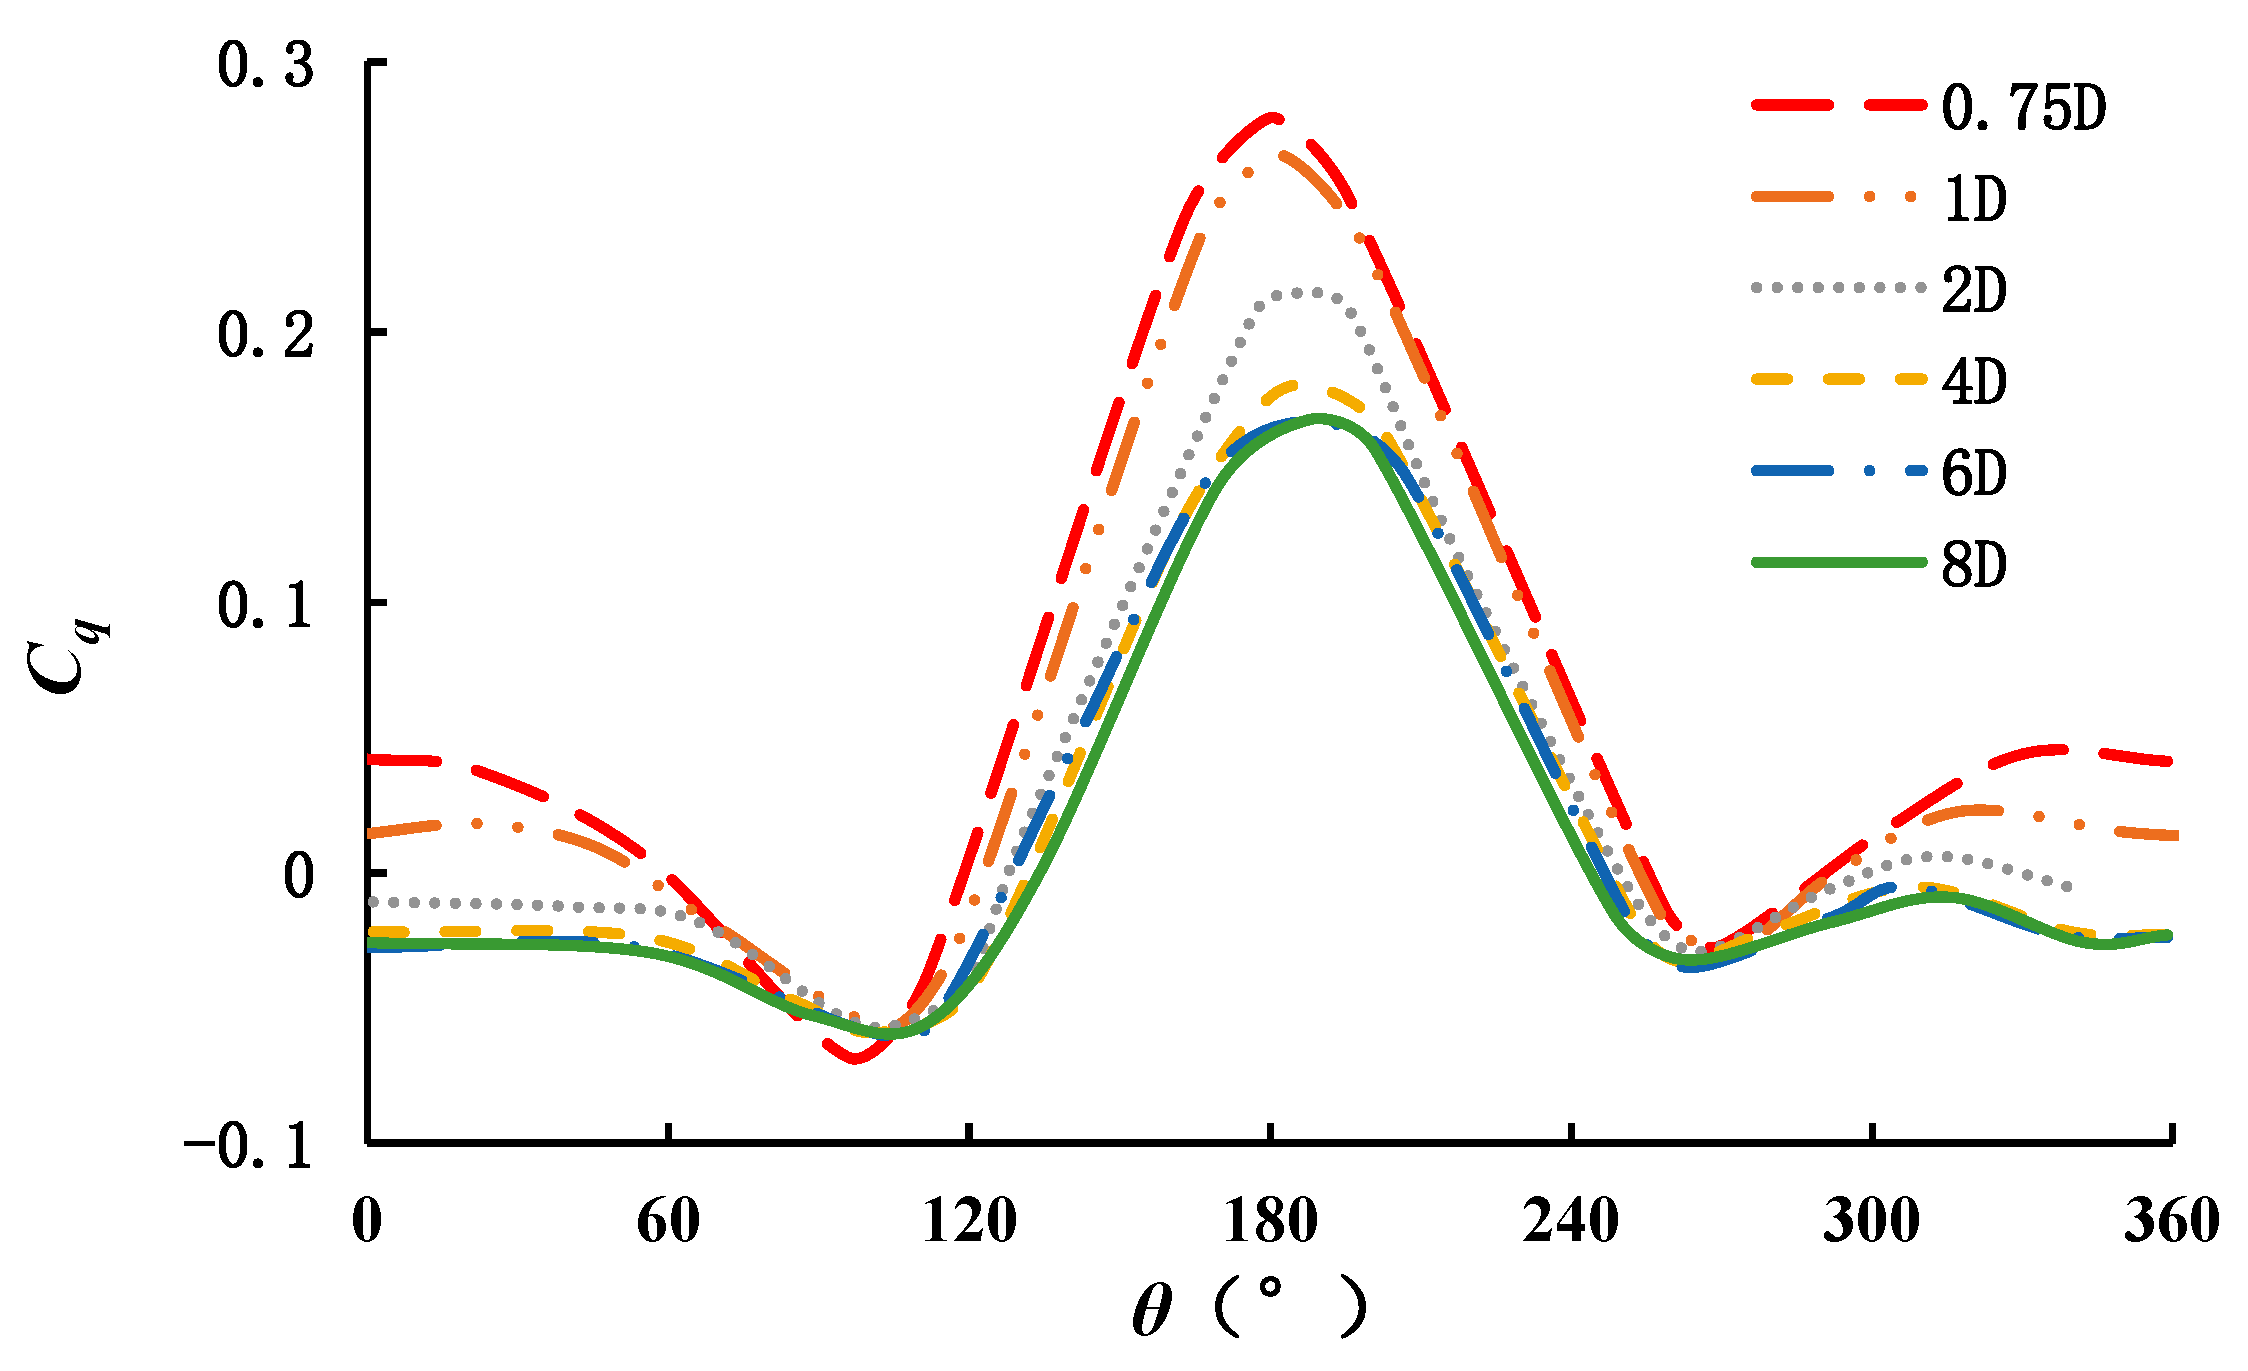
Five different Dw, namely 0.75D, 1D, 2D, 4D, 8D, are chosen to investigate the influence of side wall effects on the hydrodynamic performance of the turbine. Two different wall categories are chosen to investigate the influence of wall category on the hydrodynamic performance of the turbine. Figure 8 and Figure 9 shows the torque coefficient of a slip wall and a non-slip wall at different Dw. As Figure 8 and Figure 9 shows, the peak value of torque coefficient decreases with the increase of Dw. Deviation of torque coefficient is very big when Dw is less than 6D. The torque coefficient curve is almost the same when Dw is 6D and 8D, respectively. Therefore, when the distance between side wall and center of the turbine is bigger than 6D, the effects of side wall can be neglected. Figure 8 and Figure 9 shows the average Cq curve of the turbine with a slip wall and non-slip wall at different Dw. As Figure 9 shows, the Cq curve is almost the same when the Dw is bigger than 6D. Therefore, we can draw a conclusion that the effects of different wall categories can be neglected at certain conditions. In order to minimize the influence of the side wall on the hydrodynamic performance of turbine, we recommend that the distance between the side wall and the center of the turbine should be larger than 6D.
4.1.4. Comparison between Numerical Simulation and Model Experiments
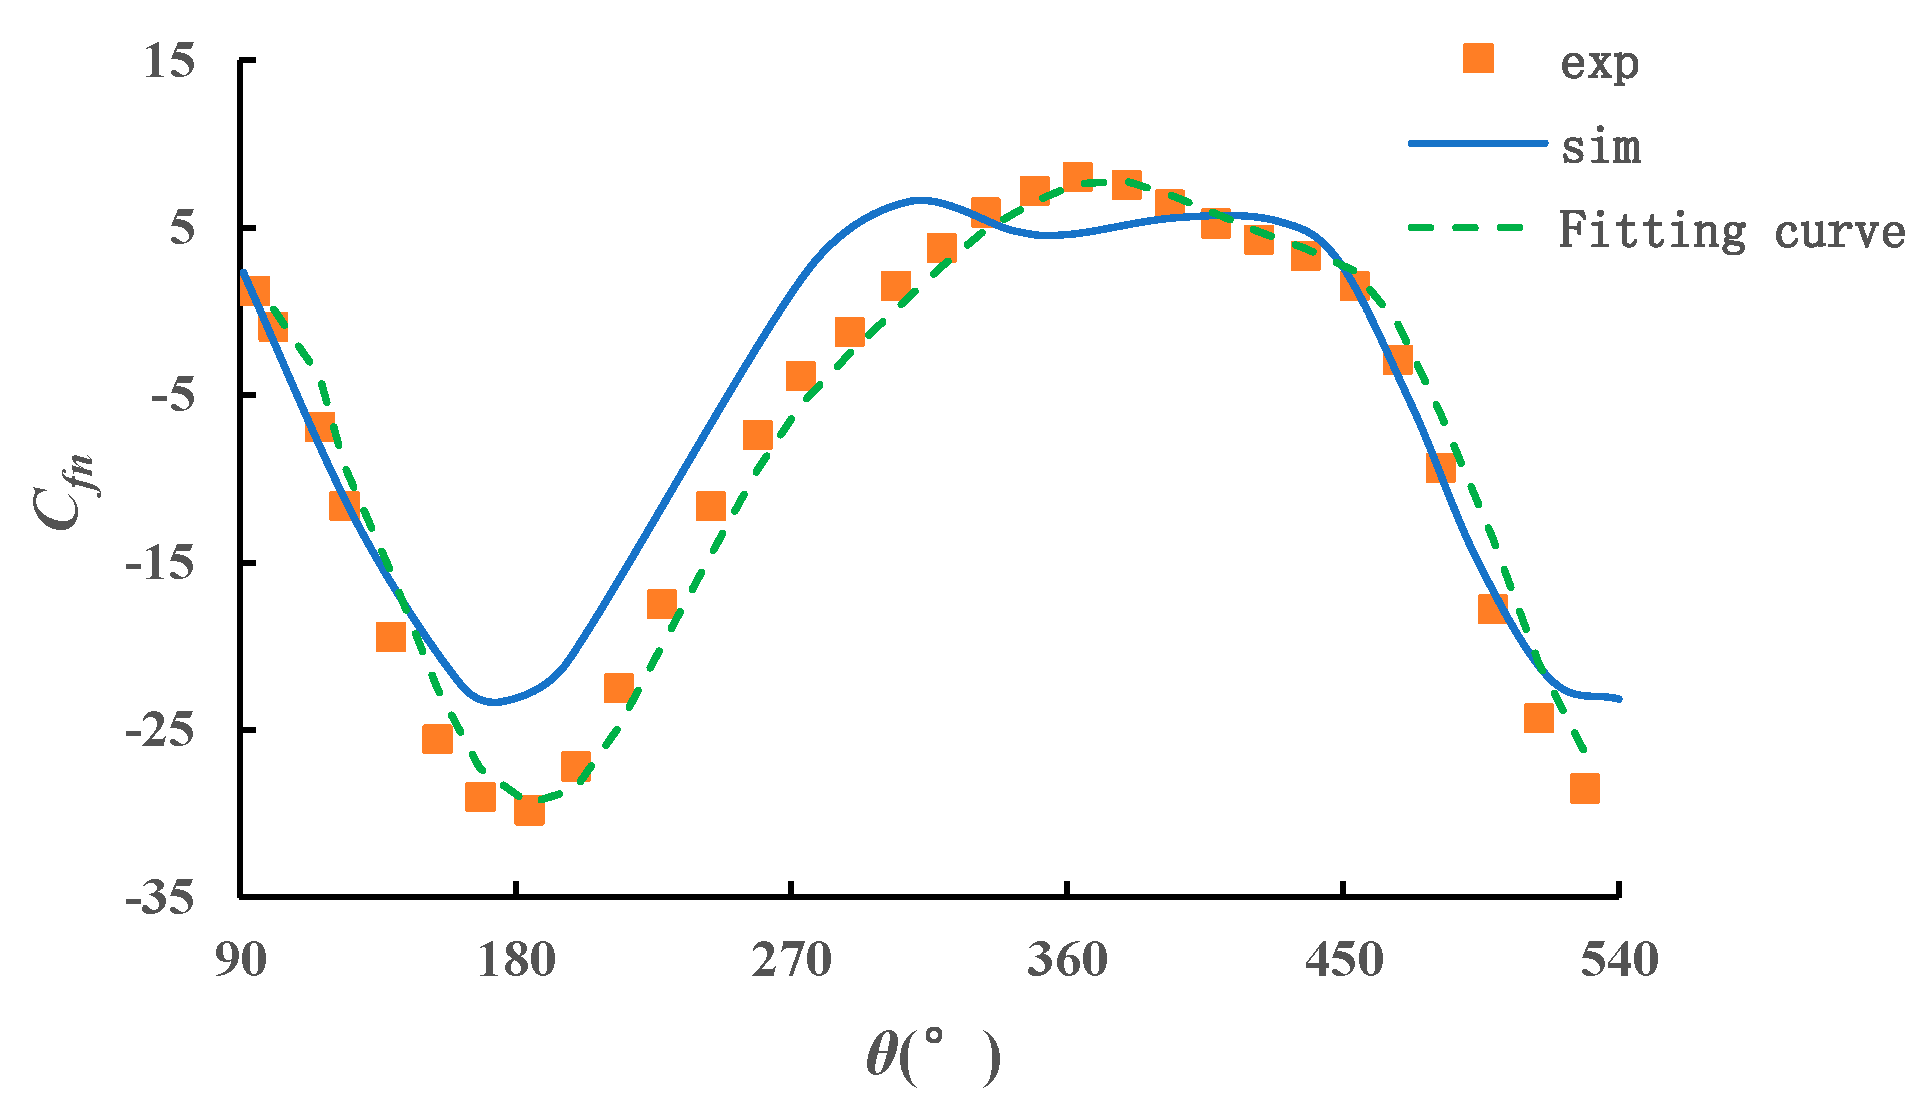
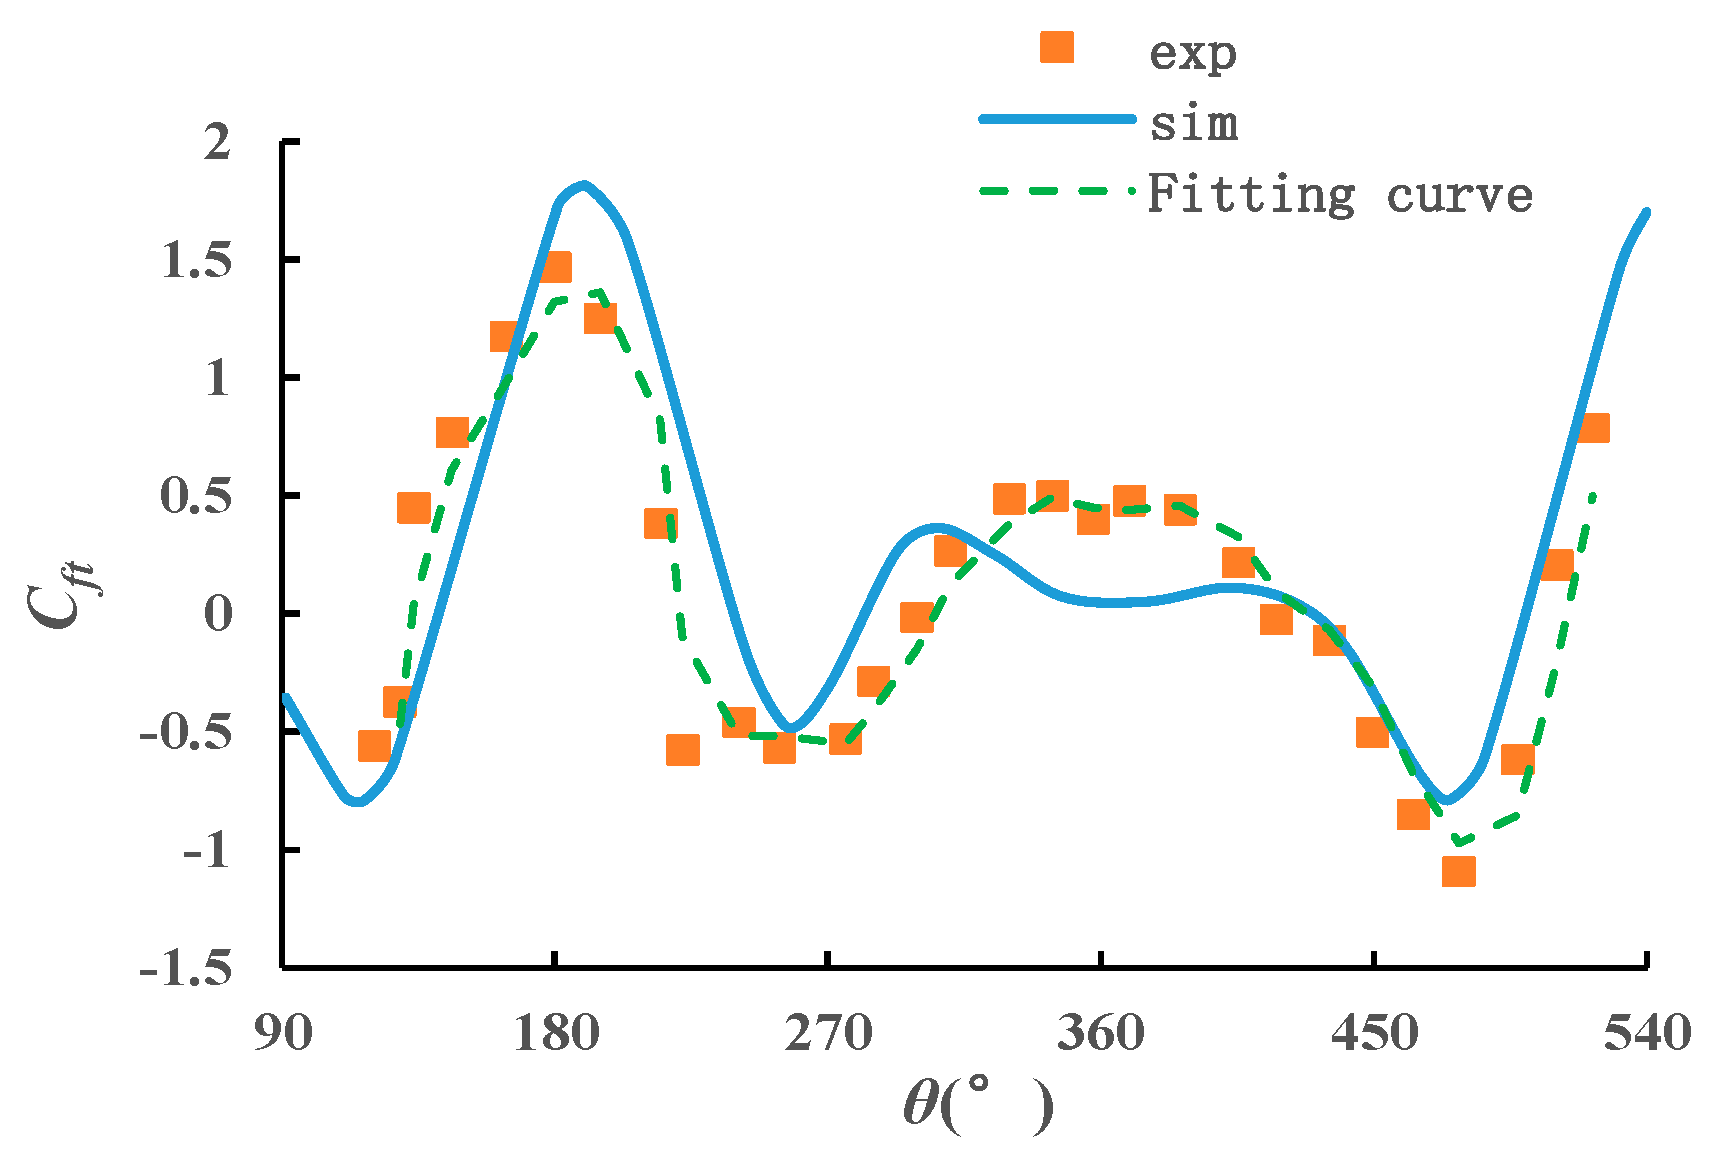
In order to verify the feasibility of 2D numerical simulation methods and accuracy of simulation results in vertical axis tidal turbines, the experimental results of a model test carried out by Strickland are used [40]. Figure 10 and Figure 11 shows the comparison of tangential force and normal force coefficient between numerical simulation results and experimental results.
Exp stands for curves of experimental results, while sim stands for curves of numerical simulation. The fitting curve is obtained by the moving average method based on the experimental results. As we can see, the curves have a good agreement between numerical result and experimental result among all degrees, except for some amplitude difference. The phase variation tendency of experimental results keeps constant with numerical results. There exist some differences ranging from 270°~450° between exp and sim. In the experiment of Strickland [33], the experimental results were compared with the analytical model. The results showed that normal force were seen to be in good agreement with the analytical model. However, experimental results for the tangential force agree rather poorly with the analytical model especially when the phase angle of the turbine ranges from 180° to 360°. Strickland explained that the tangential force in general is an order of magnitude smaller than the normal force and is thus much more subject to experimental error and extraneous noise. In our validation case, we thought that the bulge part of experimental curve ranging from 270°~450° might be caused by the installation deviation of the turbine blade. Apart from this, the vortex shedding of the upstream disk and block effect of the main shaft resulted in the complexity of the downstream flow field. The comparison verifies the feasibility of 2D numerical CFD simulation in investigating the hydrodynamic performance of vertical axis turbine.
4.2. The Analysis of the Hydrodynamic Characteristic of the Vertical Axis Twin-Rotors Tidal Current Turbine
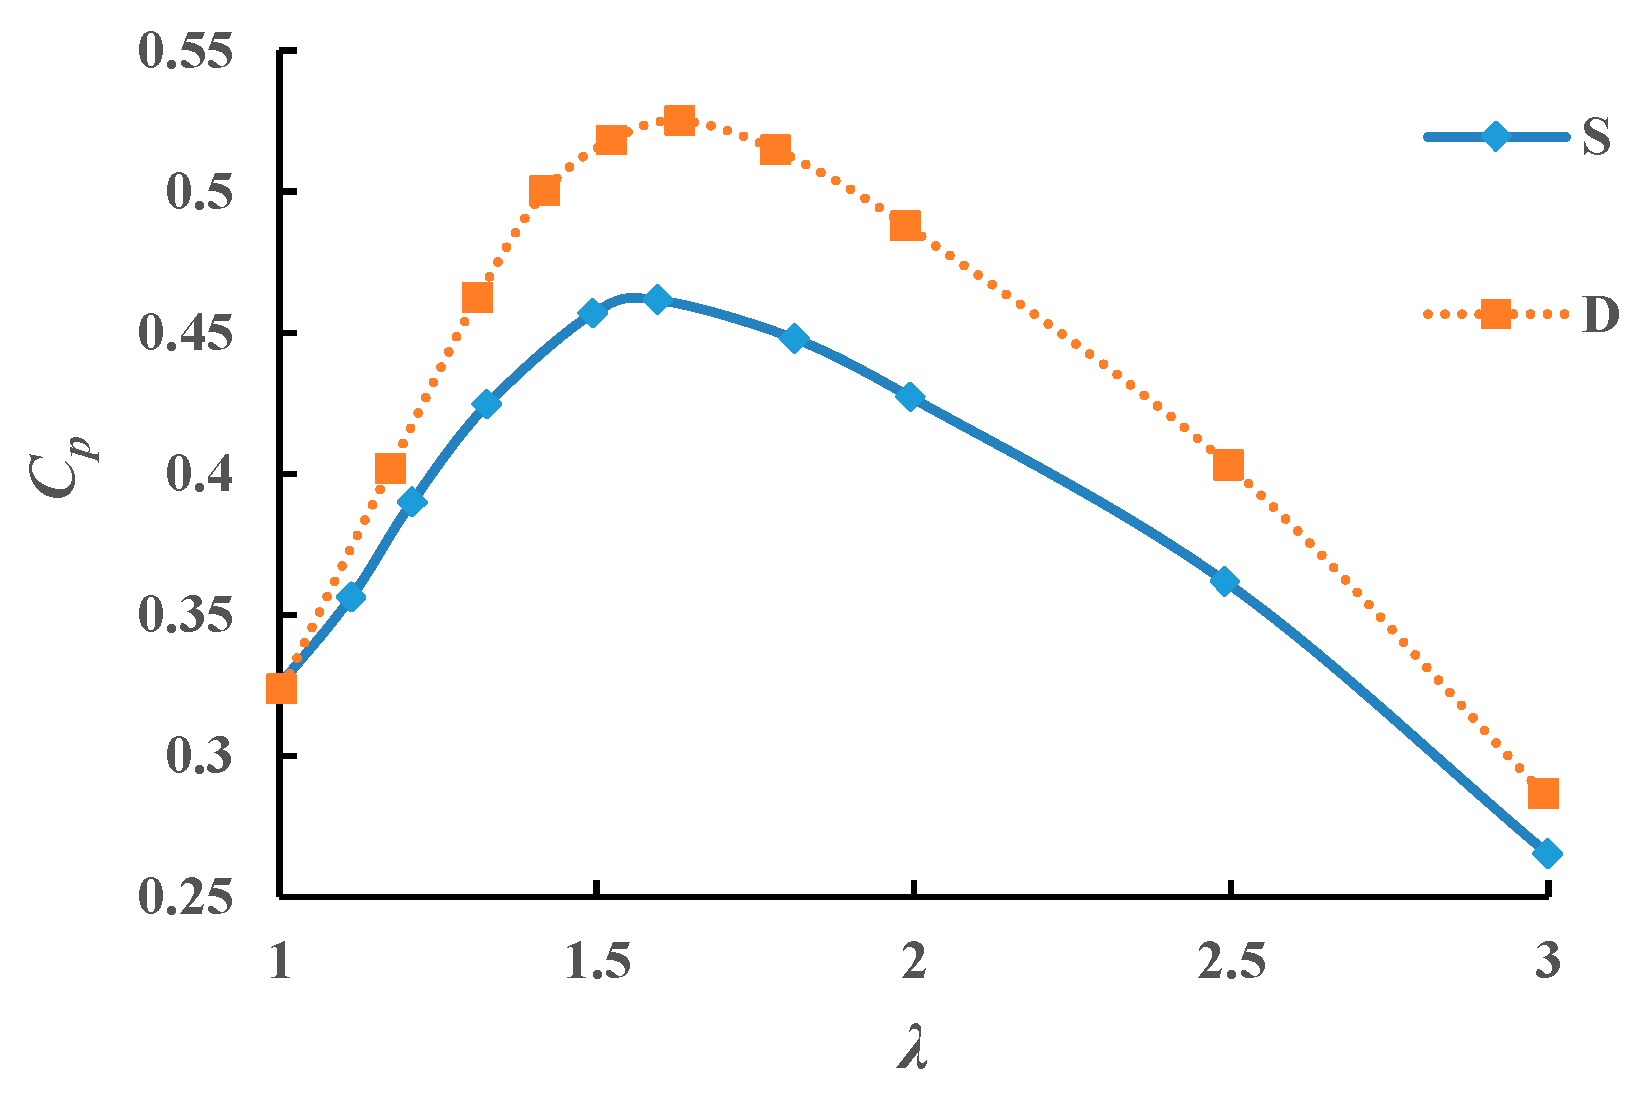
To investigate the interaction between the twin rotors, this paper gives the “Cp-λ” curves of both stand-alone turbine and twin rotors respectively, and each turbine has the same size. Cp can be obtained from Equation (10). The results are shown as Figure 12, where S stands for the stand-alone turbine and D stands for the twin rotors. Subsequent statements follow the same naming rules. It is noticed that the results are obtained from 2D numerical simulation. The average Cp is larger than the true value due to the fact that spoke effect and 3D effect were neglected in the numerical simulation. Li et al. [41] has carried out research about the influence of 3D effects and spoke effect on the hydrodynamic performance of the turbine. However, the variation tendency of the two curves has a good agreement with each other.
As Figure 12 shows, the power output efficiency of twin rotors is obviously larger than that of the single-turbine. When lambda is equal to 1.5, 2.0 and 2.5, the power output efficiency of twin rotors is larger than that of single-turbine by 12.76%, 14.03% and 12.01% respectively. The twin-rotors system has advantage in increasing overall power output compared with the stand-alone turbine system. The power output of each turbine of the twin-rotors system has increased. At the same time, the optimal tip speed ratio of the stand-alone turbine and twin rotors are the same, which means that the interaction of twin rotors dose not influence the optimal tip speed ratio.
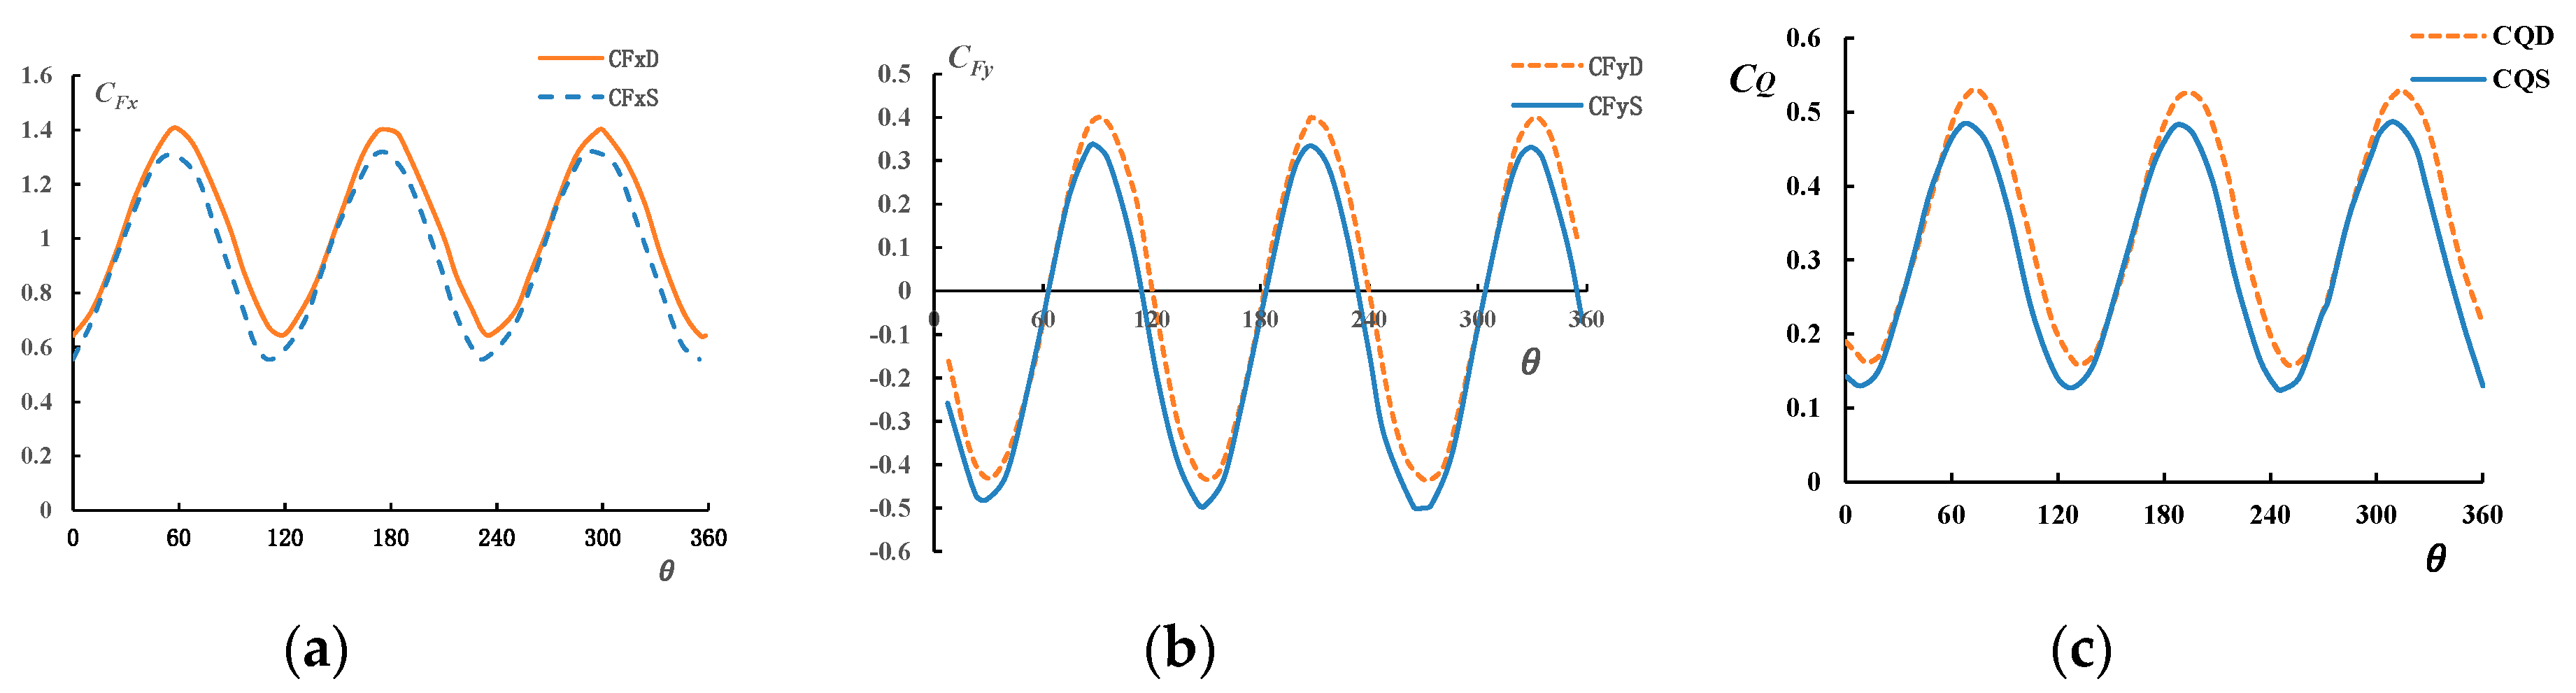
To evaluate the entire hydrodynamic performance of the turbine, it is necessary to consider the load circumstance of the turbine besides the power output efficiency. Therefore, the paper provides the coefficient curves of tangential force and normal force of the stand-alone turbine and twin-rotors system (Figure 13). Tangential force and normal force can be obtained from Equations (11) and (12), respectively. In order to analyze the load condition of the rotor, the paper gives the coefficient curves of the lateral force, thrust and torque change along with the phase angle (Figure 14).
As shown in Figure 13, the cyclic variation tendency of blade loads coefficients of stand-alone turbine and twin-rotors system are basically the same. The blade coefficient of the twin-rotors system is bigger than that of single turbine by less than 5% at the peak point. It can be inferred that the interaction between the two turbines has very little effect on the loads of the turbine blades for the twin-rotors system. This is beneficial for the structure strength design of twin-rotors blades, and designers can focus more on increasing the power output efficiency of the turbine without considering much about the structure strength of the blades. As shown in Figure 14a,b, there is a slight difference in the thrust and lateral force between the two different configurations. The thrust and lateral force coefficients of the twin-rotors system is a little higher than that of the stand-alone turbine by less than 7%, but the cyclic variation tendency of lateral force, thrust and torque of the twin-rotors and single turbine tends to be the same. Since the thrust and lateral force acts on the main shaft, therefore, we should consider more about the structural strength as well as fatigue strength when selecting the appropriate main shaft for the twin-rotors system. Meanwhile, as is shown in Figure 14b, the positive and negative distributions of the lateral force of the twin rotors are symmetrical about the x axis. Compared with the stand-alone turbine, the symmetrical distribution of lateral loads benefits the fatigue life of the twin rotors. In fact, the average lateral force coefficient slightly fluctuates around 0 for the twin rotors. In addition, as is shown in Figure 14c, the torque coefficient of the twin-rotors system increases compared with the stand-alone turbine system, which causes the increase of the power output of the twin-rotors system. Furthermore, the fluctuation amplitude of the torque coefficient of the twin-rotors system is at the same order with that of the single rotor turbine, the peak value of twin rotors is bigger than that of the stand-alone turbine by nearly 10%.
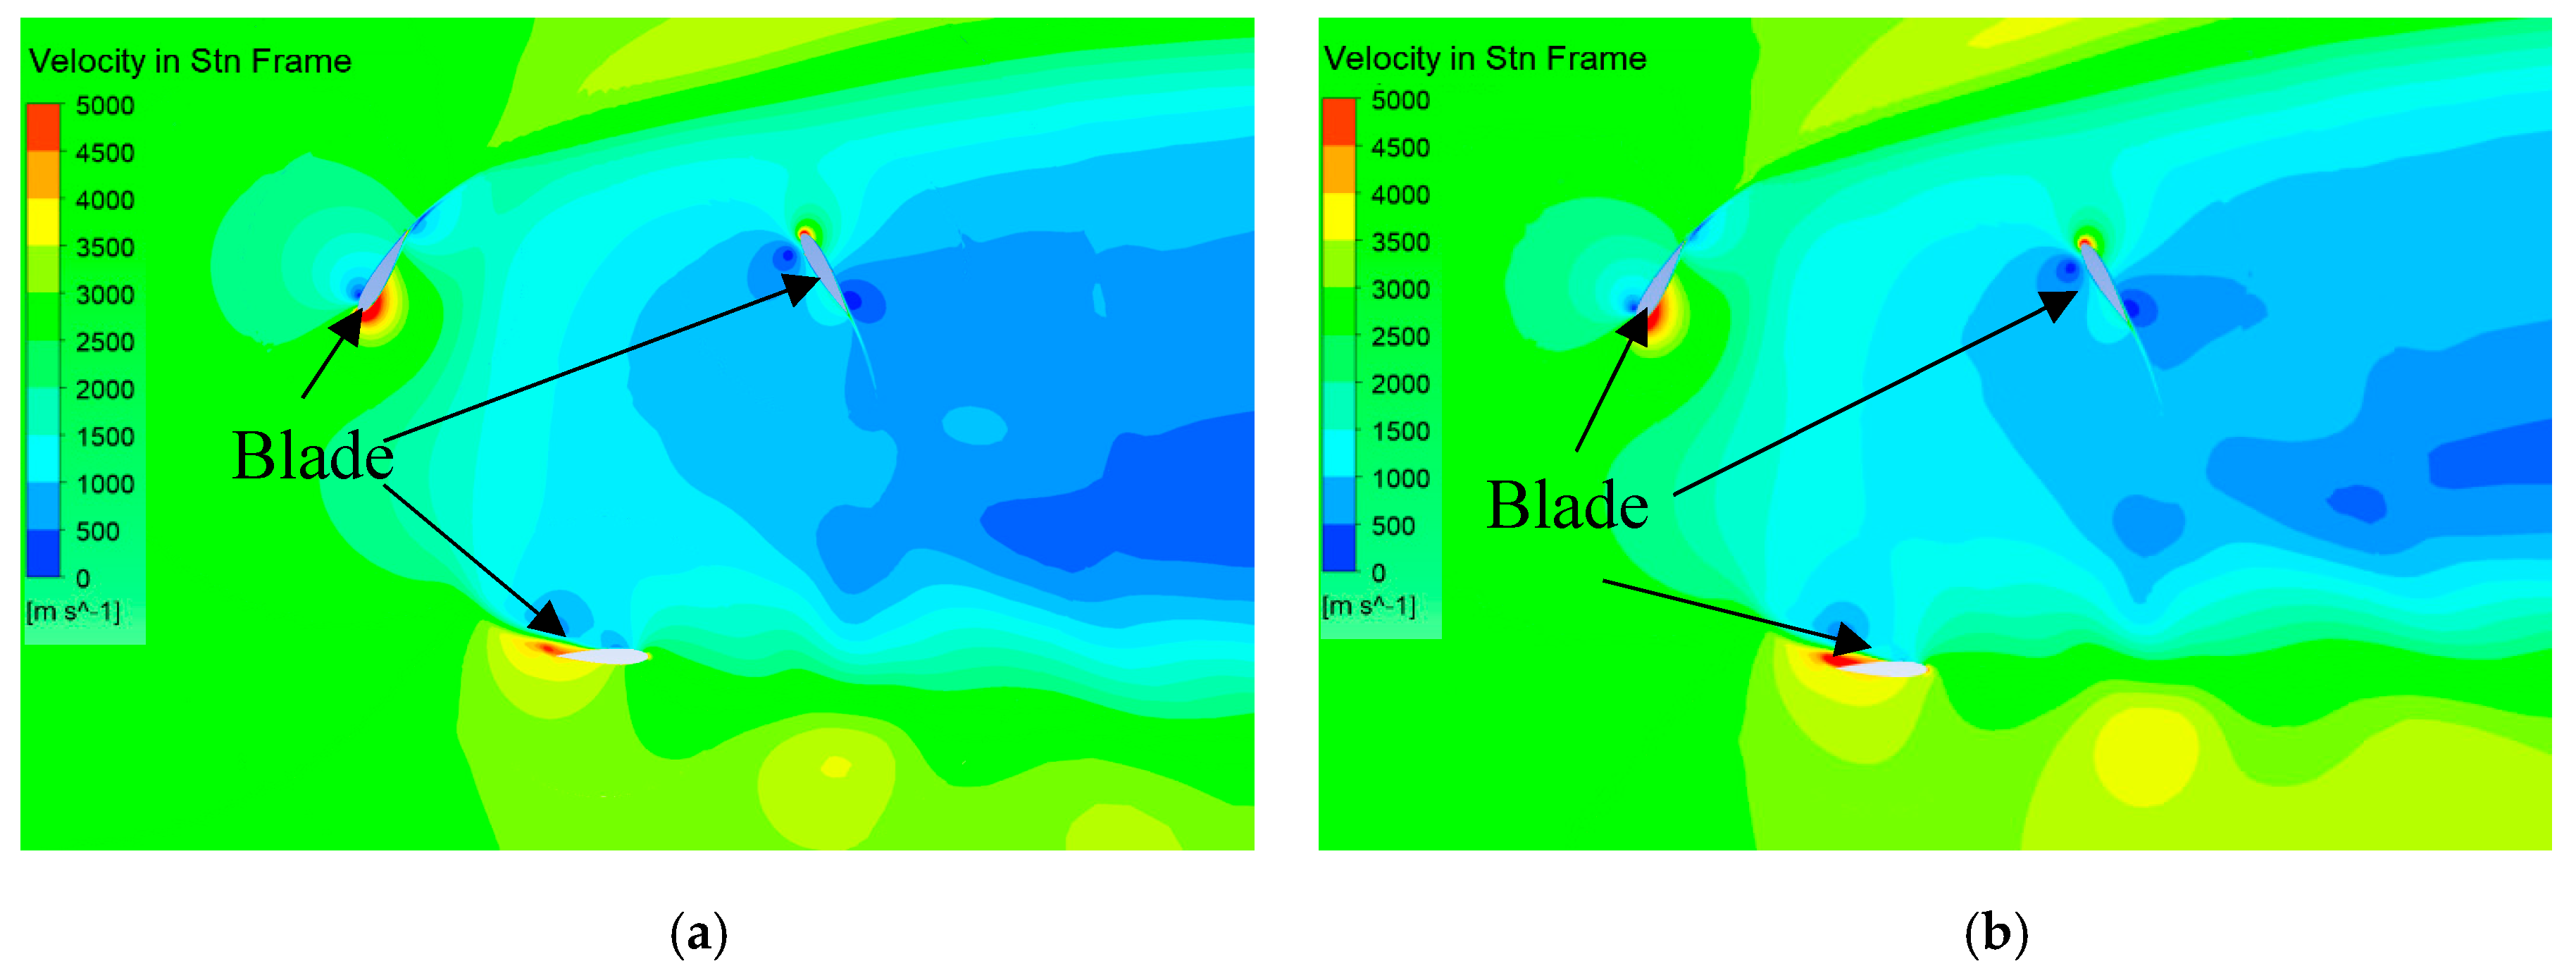
In order to analyze the reason that cause the variety of the load, it is necessary to analyze the details of the flow field. In fact, the wake flow field contains abundant information, the analysis of the wake flow field can give more insight into the fatigue characteristics. Cloud pictures of the velocity and pressure of the wake flow field are shown in Figure 15 and Figure 16.
As Figure 15 shows, compared with the stand-alone turbine system, the mean flow velocity around the turbine disk of the twin-rotors system is higher. The low flow velocity area around the turbine disk of the twin-rotors system is smaller. The high flow velocity area around the turbine blades of the twin-rotors system is bigger. The flow velocity distribution of the flow field for the twin-rotors system has improved as a whole. Therefore, the power output efficiency of the twin rotors increases. The increase of the load coefficient on the turbine blades can also explain the increase of the power output. Due to the increase of the flow velocity around the turbine blades, the lift and drag force increases, the lateral force of each blade also increases. As we know, the torque acting on the main shaft is mainly provided by the lateral force, the torque of the main shaft causes the rotation of the rotor. According to Equation (10), the power output efficiency can be increased when the rest of the parameters are constant. On the other hand, due to the blocking effect of the rotor of the twin-rotors system in the flow field, the flow velocity of the fluid between the two rotors increases, which explains the overall flow velocity increase of the twin-rotors system.
The contour of pressure in the flow field can reflect the distribution of the flow field and help analyze the load on the rotor. As shown in Figure 16, the interaction between the two rotors causes the flow field pressure between the two rotors to increase, thus, resulting in a greater lateral force when the blades passing through the area. When the position angle ranges from 180° to 270°, the absolute value of the tangential force and normal force of the twin rotors is bigger than that of the stand-alone turbine. When the position angle ranges from −90° to 0°, the loads on the blades for the twin rotors and stand-alone turbine are too small and the deviation of the loads can be neglected.
4.3. Effect of the Relative Distance of the System
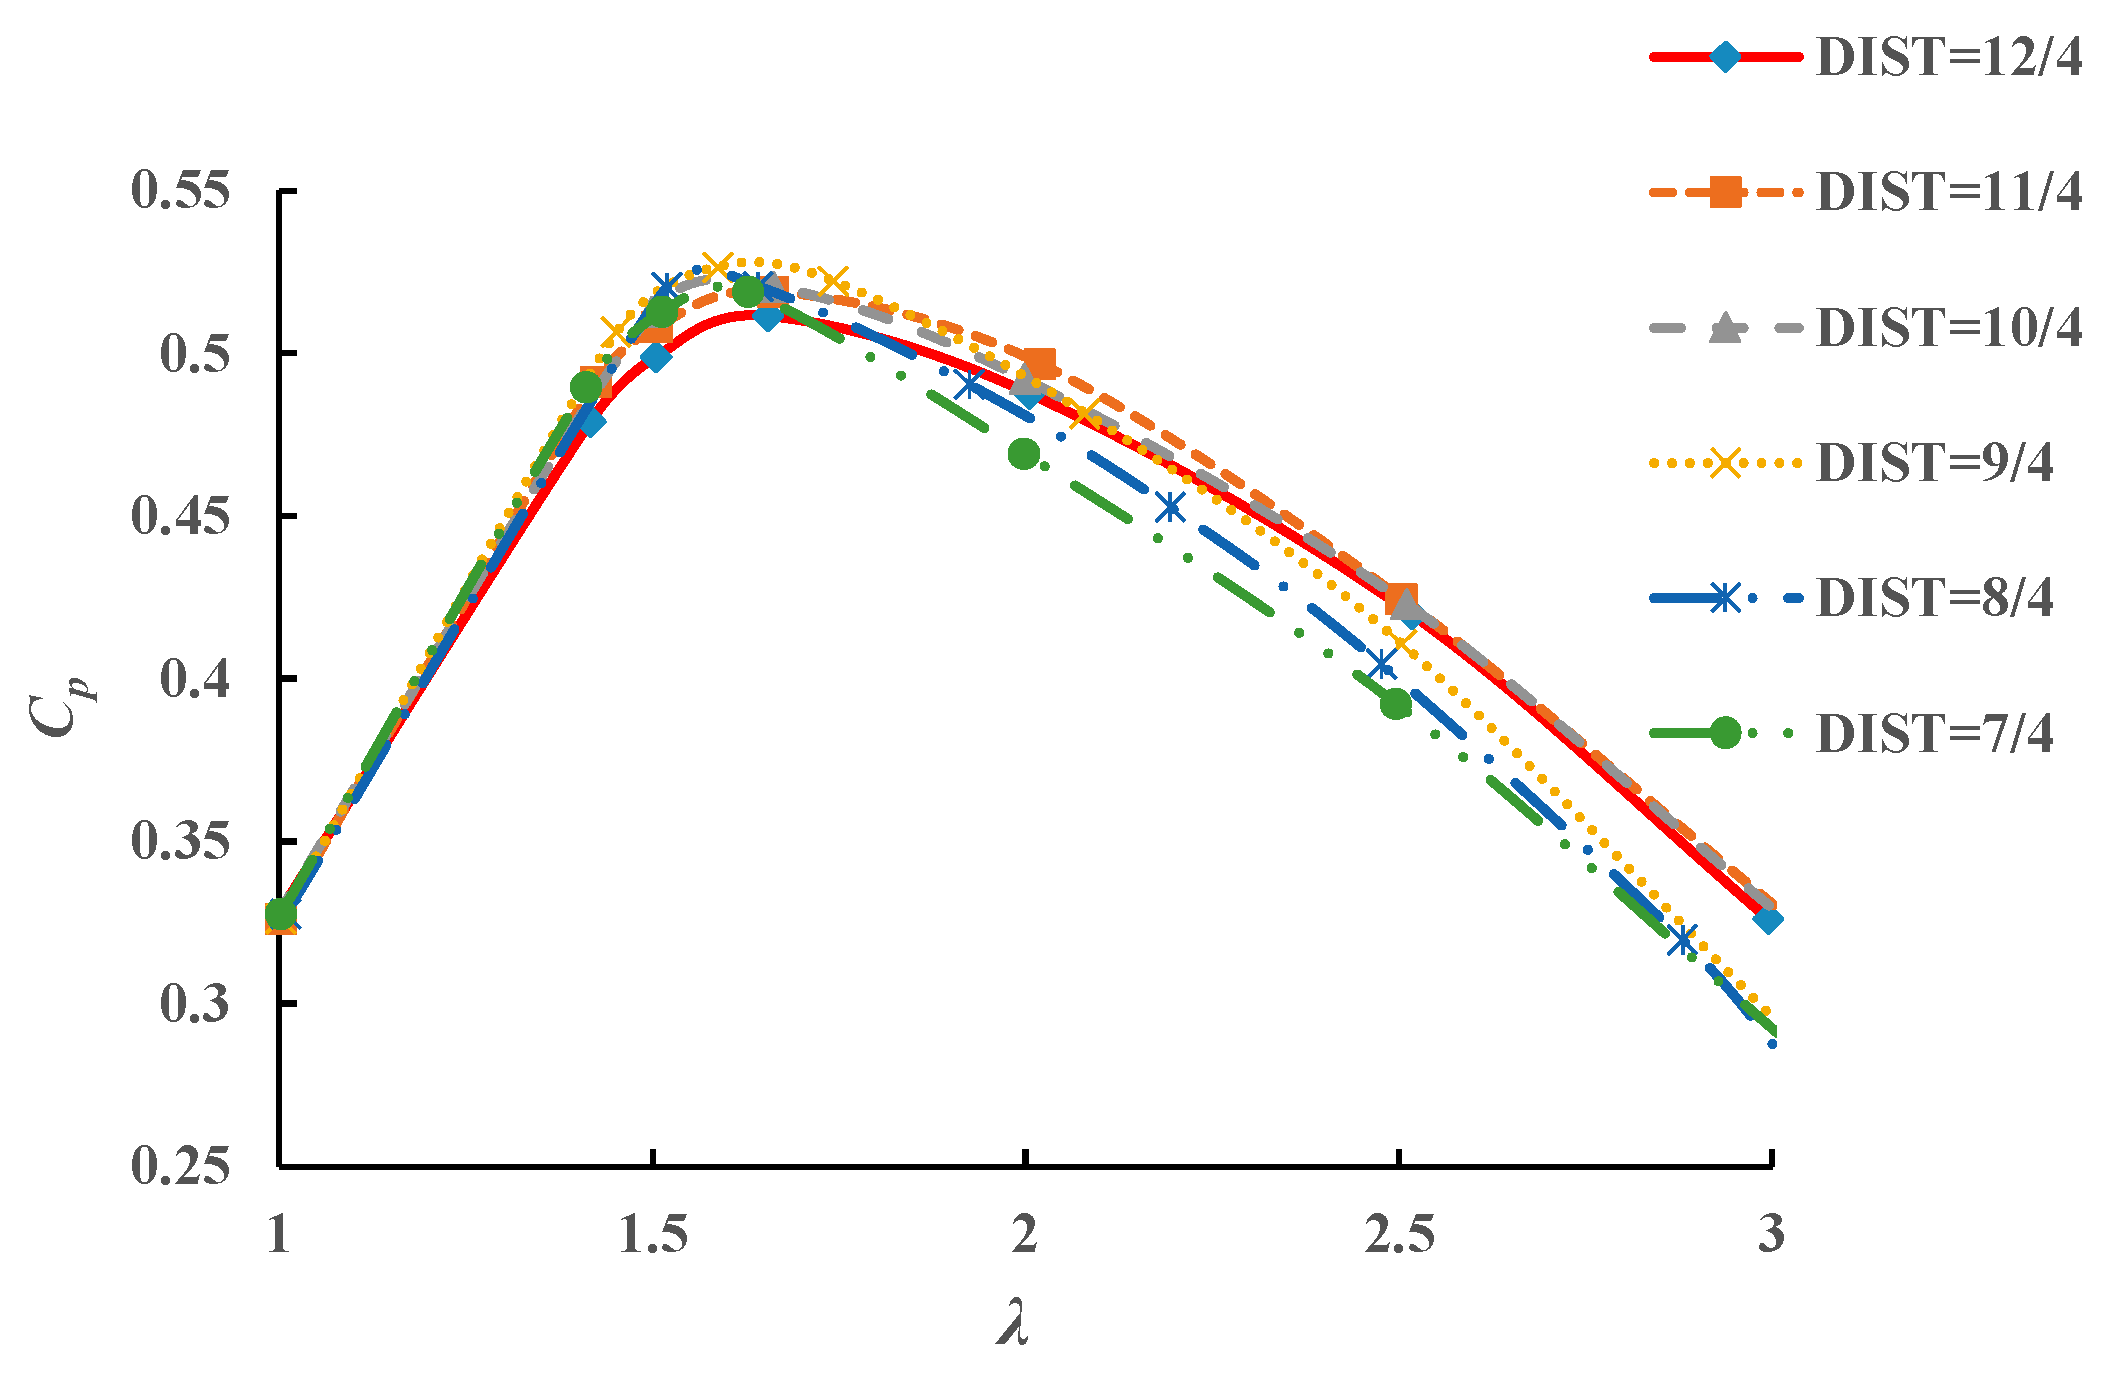
The relative distance between the two main axis of the twin-rotors system is one of the main parameters affecting the overall performance of the twin-rotors system. Figure 17 shows the variation curves of power output efficiency of twin-rotors system along with the tip speed ratio at different DIST (DIST is a dimensionless parameter, a ratio between the two main axis distance and the turbine diameter). The relative increasing amplitudes (compared with stand-alone system) of power output efficiency of the twin-rotors system at different DIST and tip speed ratio are presented (Table 2).
As shown in Figure 17, the maximum power output efficiency of twin rotors occurs at lambda equal to 1.5, which indicates that the relative distance has very slight influence on the optimal lambda. It is noticed that the maximum power output efficiency can be achieved when the DIST is around 9/4 and the maximum power output efficiency is 12.75% higher than that of stand-alone turbine. Then, as the DIST continues decreasing after that the power output reaches the peak, the power output efficiency gradually decreases. Therefore, we can conclude that the smaller relative distance does not mean bigger power output, which is consistent with [17]. The optimal relative distance for a specific twin rotors should be carefully decided in engineering practice. The relative distance should keep a balance between the regular maintenance convenience and power output efficiency.
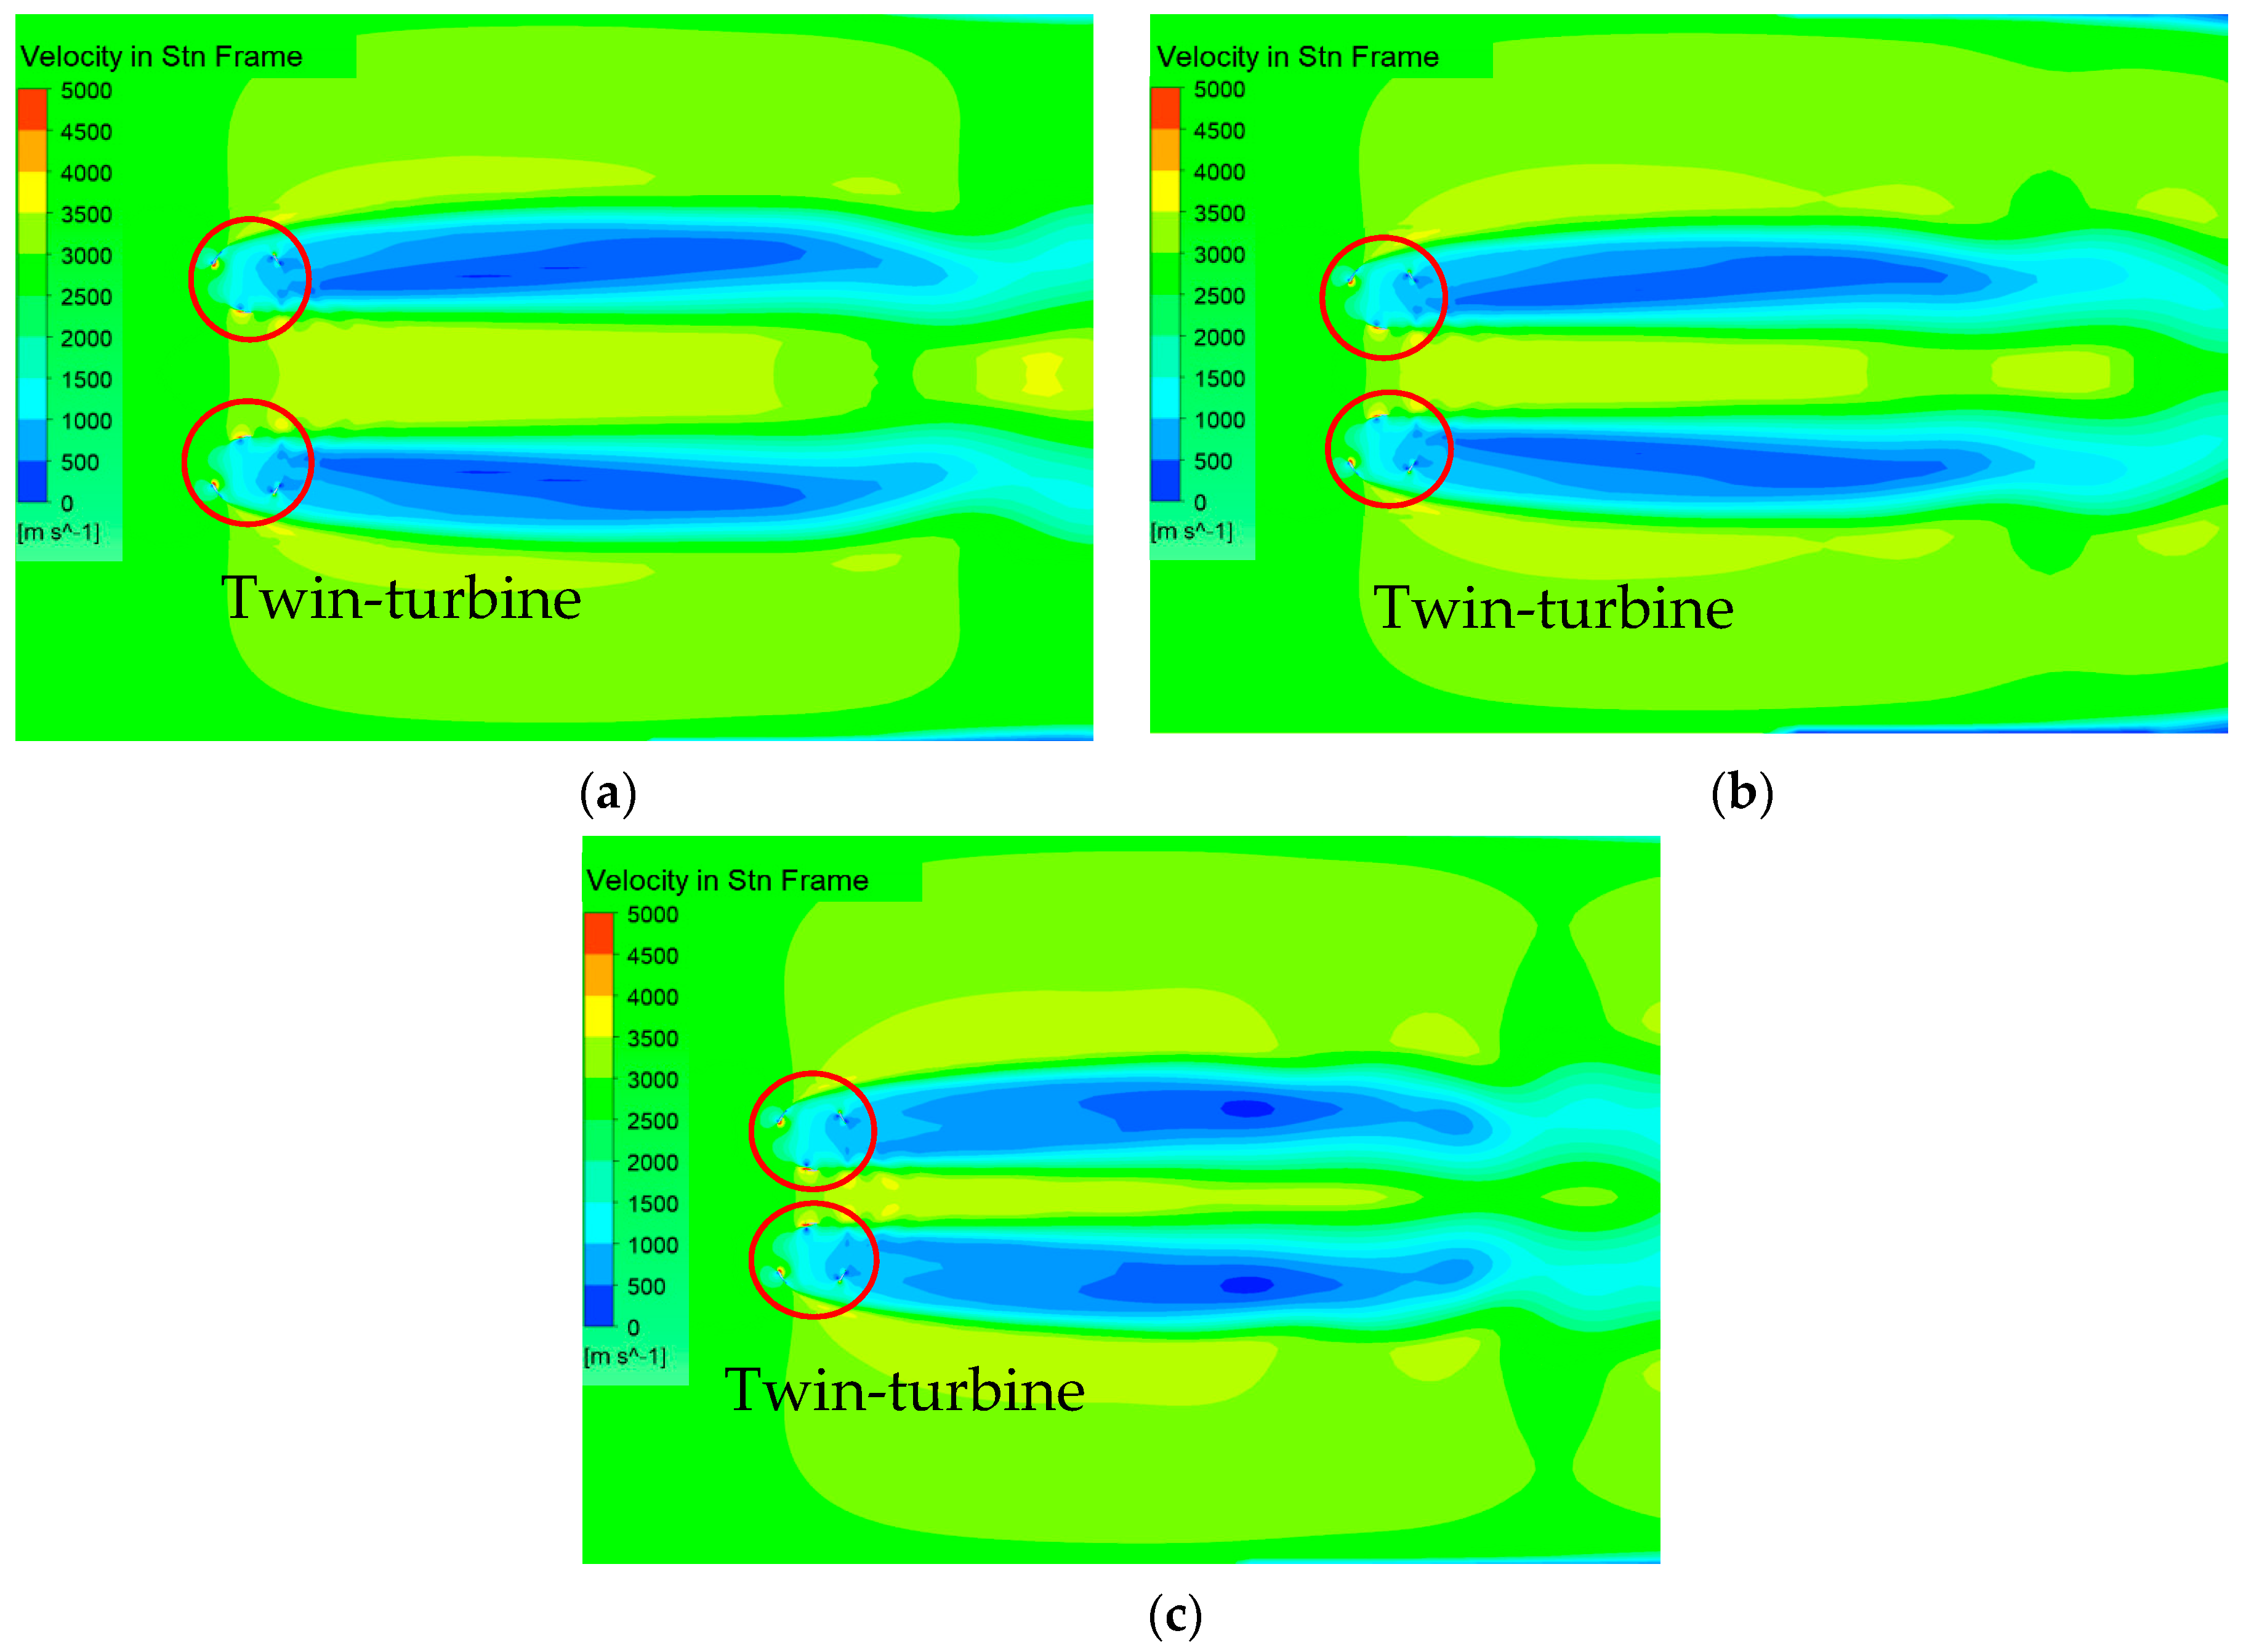
In order to analyze the reason why DIST influences the power output efficiency, the contours of the flow field of the twin-rotors system at different DIST are presented.
As Figure 18 shows, the wake flow fields are quite different at different DIST. The velocity in the channel increases as the DIST decreasing. Meanwhile, the low flow velocity area around the turbine grows bigger due to the blocking effect of the rotor. Comparing Figure 18a with Figure 18b, we can see that the high flow velocity area in the channel grows larger and gradually expands to the channel entrance when the DIST decrease from 11/4 to 9/4. Meanwhile, the low flow velocity area stays the same, causing the tangential force on the blades to increase when passing through the channel, and thus the torque increases. Comparing Figure 18b with Figure 18c, we can see that despite the fact that the high flow velocity area expands to the channel entrance, the low flow velocity area around the two rotors is already converging, which results in a strong blocking effect towards the coming flow. Furthermore, as Figure 18c shows, the two low flow velocity areas caused by the wake field of the two rotors diffuse from both sides to the middle when the DIST decrease to 7/4. The wake fields behind the two rotors tend to merge with each other and then block the middle channel. Therefore, the incoming flow might encounter a velocity decrease in the whole flow field, resulting in power output decreasing. From the above analysis, it can be concluded that the flow velocity distribution in the channel formed by the wake flow of the rotor vary with the change of DIST, thus causing the loads on the blade and power output efficiency to change.
5. Discussion
This paper carried out a numerical simulation of a twin-rotors system and a stand-alone turbine system by commercial computational fluid dynamics software ANSYS-CFX. First, the detailed CFX settings of the numerical model are described. Several verifications and comparisons are performed to guarantee the accuracy of the numerical simulation process. Then, we discuss the cause leading to the hydrodynamic performance changes of the twin-rotors system. The load coefficients of twin-rotors system are compared with those of a stand-alone turbine system. The cause of the hydrodynamic performance changes is analyzed from three different aspects, namely, blade force coefficients, velocity distribution of the wake flow field and pressure distribution of the wake flow field. Finally, we discuss the influence of ratio between the two main axis distances and the turbine diameter on the hydrodynamic performance of the twin-rotors system.
After several validation cases of the numerical simulations, we recommend the following schemes which should be adopted to maintain the independence and accuracy of numerical simulation results of vertical axis tidal current turbines. The value of Y-plus should be less than five when researchers carry out numerical research for a twin-rotors system based on commercial software ANSYS-CFX. The timestep should be less than 0.0005 s during the numerical simulation process of the twin-rotors system. The influence of wall category on the hydrodynamic performance of the twin-rotors system can be neglected in the numerical simulation.
The load on the rotors of the twin-rotors system is slightly bigger than that of stand-alone system by less than 5% at the peak point, but the cyclic variation trend of load coefficients tends to be the same. The mutual inference between the two rotors will not change the optimal operating tips speed ratio. The interaction between the twin rotors has very little extra influence on the fatigue life and structure strength of the twin-rotors system compared to the stand-alone turbine system. The positive and negative distributions of the lateral force coefficient of the twin-rotors system are symmetrical about the X-axis. The average lateral force of the twin-rotors system in a period is nearly 0. The load on the main shaft in the lateral direction for the twin rotors is more balanced and that is good for the fatigue life of the main shaft of the twin rotors. One of the main disadvantages of the vertical axis tidal current turbine is the cyclic loads acting on the main shaft, the symmetrical distribution of the lateral load of the twin rotors can benefit the structure strength of the turbine. The cyclic variation tendency of load coefficients between the two different systems is similar to each other. The mutual interference between the two rotors will not significantly change the period characteristics of the blade loads. The loads on the twin rotors will not be more complex by the mutual interference between the rotors. Therefore, more considerations should be put into the structural strength design rather than the fatigue life design when engineers are designing the main shaft.
Comparing with stand-alone turbine, the increase of the flow velocity and pressure in the rotor disk domain and the water tunnel between the two rotors can increase the lift force of the twin-rotors system, thus resulting in a power output increase. However, the power output of the twin-rotors system will not always increase with the decrease of the relative distance between the two rotors. In one scenario, one can observe from Figure 18 that when the distance between the two main axis is small enough, the wake flow field has the tendency to converge. That would lead to a huge blocking effect to the upstream incoming flow, and then the power output of the twin-rotors system would decrease. In a different scenario, whatever the relative distance is (the interaction between the two rotors still exists), the average power output efficiency of the twin-rotors system is bigger than that of stand-alone system. The reason lies in the fact that when the two rotors are deployed in close proximity, the flow between two rotors is accelerated due to the blockage effect of the rotors. When the blade pass through the area, the lift force increases, thus more energy can be captured by the turbine. The Lanchester–Betz limit (Cp = 16/27) for the maximum efficiency of a turbine in an infinite domain is increased by a factor of (1-A/Ac)−2 in a channel (A is the cross-sectional area of the turbine; Ac is the channel cross-sectional area). The actual power still increases as the area ratio A/Ac increases (in this case, the flow domain is like a flow channel, [A/Ac]twin-rotors > [A/Ac]single rotor). More details about the power output increasing can be seen in [42]. Nevertheless, the distance between two main shafts should also not be too close to each other for the convenience of maintenance. The distance should be carefully considered in real deployment of the twin-rotors system. It is noticed that the maximum power output efficiency can be achieved when the ratio between the two main axis distance and turbine diameter is around 9/4. If the ratio keeps decreasing, the power output efficiency of the twin-rotors system gradually decreases. The wake flow velocity distribution change in the middle channel of the twin-rotors system is one of the main causes of power output variation of twin-rotors system.
Since the experimental data for the twin-rotors system is seldom reported in the literature, the numerical results for the twin-rotors system in this manuscript are not directly validated with experimental results. However, the numerical results of the stand-alone turbine are validated with experimental results. The results can also verify the feasibility of the proposed numerical simulation methods to some degree. Some of the conclusions drawn in this paper are consistent with some corresponding literature. The interaction between the two rotors can result in the increase of power output for such a system. The interference between the two rotors will not change the optimal operating lambda of the turbine, which is in consistent with [17]. The analysis of the twin-rotors system from the wake flow field aspect can give some insights into the cause of the power output increasing in the twin-turbine. The results can provide a significant reference when engineers design the twin-rotors system.
6. Conclusions
We draw the following conclusions from the above numerical simulation of the twin-rotors system:
- The interactions between the twin rotors changes the velocity and pressure in the rotor disk domain, thus leading to an increase of the power output in the twin-rotors system.
- The twin-rotors system has the advantages of increasing power output without having large influence on fatigue life and structure strength. The load coefficients of twin rotors are bigger than that of stand-alone turbine by less than 5%. The cyclic variation tendency of twin-rotors system is almost the same with the stand-alone turbine system.
- The optimal ratio between the two main axis distances and turbine diameter is around 9/4 for the twin-rotors system in this manuscript. The optimal ratio is not applicable to a different twin-rotors system and the actual optimal ratio for other specific twin-rotors system should be carefully considered.
- The converging tendency of the wake flow field behind the twin rotors is the main cause of decrease of the twin-rotors system when the ratio between two main axis and turbine diameter is larger than 9/4.
Author Contributions
Conceptualization, Y.M.; Investigation, R.D.; Methodology, Y.L.; Software, C.H.; Supervision, Y.M., Y.L., R.D., L.L. and D.J.; Writing—original draft, C.H.
Funding
This paper was financially supported by the National Natural Science Foundation of China (Grant No. 51779062; 51579055), the Fundamental Research Funds for the Central Universities of China (No. HEUCFP201714), Shenzhen Special Fund for Future Industries (No. JCYJ20160331163751413).
Acknowledgments
C.H. acknowledged the support from Institute of Marine Renewable Energy in Harbin Engineering University. Please add the section, it should be different with the funding information. In this section you can acknowledge any support given which is not covered by the author contribution or funding sections. This may include administrative and technical support, or donations in kind (e.g., materials used for experiments).
Conflicts of Interest
The authors declare no conflict of interest.
Nomenclature
| Cp | Power output efficiency |
| Cq | Torque coefficient |
| D | Turbine diameter |
| b | Span of the blade |
| C | Chord length of the blade |
| Angular velocity of the turbine | |
| Blade position angle | |
| Blade pitch angle | |
| Attack angle | |
| Density of Water | |
| Compactness of the turbine | |
| λ | Tip speed ratio |
| L | Lift force of a single blade |
| Dr | Drag force of a single blade |
| Normal force coefficient of the blade | |
| Tangential force coefficient of the blade | |
| Thrust coefficient of the blade | |
| Lateral force coefficient of the blade | |
| Thrust of the rotor | |
| Lateral force of the rotor | |
| Tangential force coefficient of the blade | |
| Normal force coefficient of the blade | |
| Thrust coefficient | |
| Lateral force coefficient | |
| Torque coefficient | |
| N-S | Navier–Stokes |
| RMS | Root mean square |
| FVM | Finite volume method |
| Y plus | Dimensionless parameter of determining the scale of the first layer |
| CFD | Computational fluid dynamics |
| CEL | CFX expression language |
| DIST | Dimensionless parameter: ratio between two main axis distance and turbine diameter |
| DVM-UBC | Discrete vortex method–University of British Columbia |
| SST | Shear stress transport |
| RANS | Reynolds average Naiver–Stokes |
| ICEM | Integrated Computer Engineering and Manufacturing |
| Dw | Distance between the wall and center of the turbine |
References
- Bahaj, A.B.S. Generating electricity from the oceans. Renew. Sustainable Energy Rev. 2011, 15, 3399–3416. [Google Scholar] [CrossRef]
- Melo, A.B.; Sweeney, E.; Villate, J.L. Global review of recent ocean energy activities. Mar. Technol. Soc. J. 2013, 47, 97–103. [Google Scholar] [CrossRef]
- Nachtane, M.; Tarfaoui, M.; Saifaoui, D.; Hilmi, K.; Moumen, A.E. Assessment of energy production potential from tidal stream currents in Morocco. Energies 2018, 11, 1065. [Google Scholar] [CrossRef]
- Jo, C.H.; Kim, D.Y.; Hwang, S.J.; Goo, C.H. Shape design of the duct for tidal converters using both numerical and experimental approaches (pre-2015). Energies 2016, 9, 185. [Google Scholar] [CrossRef]
- Li, D.; Wang, S.; Yuan, P. An overview of development of tidal current in China: Energy resource, conversion technology and opportunities. Renew. Sustainable Energy Rev. 2010, 14, 2896–2905. [Google Scholar] [CrossRef]
- Zhang, L.; Li, X.; Geng, J.; Zhang, X. Tidal current energy update 2013. Adv. New Renew. Energy 2013, 1, 53–68. [Google Scholar]
- Khan, M.J.; Bhuyan, G.; Iqbal, M.T.; Quaicoe, J.E. Hydrokinetic energy conversion systems and assessment of horizontal and vertical axis turbines for river and tidal applications: A technology status review. Appl. Energy 2009, 86, 1823–1835. [Google Scholar] [CrossRef]
- Li, Y. Ocean Energy Development; Ocean Publishers: Beijing, China, 2008; pp. 101–138. [Google Scholar]
- Wang, S. Study on Hydrodynamic Performances of a Tidal Current Energy Conversion Device with Flexible Blade Turbine. Ph.D. Thesis, Ocean University of China, Qingdao, China, 2009. [Google Scholar]
- Chen, F. Kuroshio power plant development plan. Renew. Sustainable Energy Rev. 2010, 14, 2655–2668. [Google Scholar] [CrossRef]
- Porter, K.; Ordonez-Sanchez, S.; Johnstone, C.; Conesa, S. Integration of a direct drive contra-rotating generator with point absorber wave energy converters. In Proceedings of the 12th European Wave and Tidal Energy Conference, Cork, Ireland, 27 August–1 September 2017. [Google Scholar]
- Ma, Y.; Li, B.; Xu, Y.; Dong, Y. Design and hydrodynamic characteristics of the gate-type tidal current energy converter. In Proceedings of the 26th International Ocean and Polar Engineering Conference, Rhodes, Greece, 26 June–1 July 2016. [Google Scholar]
- Ma, Y.; Li, T.F.; Zhang, L.; Sheng, Q.H.; Zhang, X.W.; Jiang, J. Experimental study on hydrodynamic characteristics of vertical-axis floating tidal current energy power generation device. Chin. Ocean Eng. 2016, 30, 749–762. [Google Scholar] [CrossRef]
- Myers, L.E.; Bahaj, A.S. An experimental investigation simulating flow effects in first generation marine current energy converter arrays. Renew. Energy 2012, 37, 28–36. [Google Scholar] [CrossRef] [Green Version]
- Sutherland, D.; Ordonez-Sanchez, S.; Belmont, M.R.; Moon, I.; Steynor, J.; Davey, T.; Bruce, T. Experimental optimisation of power for large arrays of cross-flow tidal turbines. Renew. Energy 2018, 116, 685–696. [Google Scholar] [CrossRef]
- Bai, G.; Li, J.; Fan, P.; Li, G. Numerical investigations of the effects of different arrays on power extractions of horizontal axis tidal current turbines. Renew. Energy 2013, 53, 180–186. [Google Scholar] [CrossRef]
- Li, Y.; Calışal, S.M. Modeling of twin-rotors systems with vertical axis tidal current turbines: Part I—Power output. Ocean Eng. 2010, 37, 627–637. [Google Scholar] [CrossRef]
- Li, Y.; Calisal, S.M. Modeling of twin-rotors systems with vertical axis tidal current turbine: Part II—Torque fluctuation. Ocean Eng. 2011, 38, 550–558. [Google Scholar] [CrossRef]
- Goude, A.; Ågren, O. Numerical simulation of a farm of vertical axis marine current turbines. In Proceedings of the 29th International Conference on Ocean, Offshore and Arctic Engineering. American Society of Mechanical Engineers, Shanghai, China, 6–10 June 2010; pp. 335–344. [Google Scholar]
- Dyachuk, E.; Goude, A.; Lalander, E.; Bernhoff, H. Influence of incoming flow direction on spacing between vertical axis marine current turbines placed in a row. In Proceedings of the 31st International Conference on Ocean, Offshore and Arctic Engineering. American Society of Mechanical Engineers, Rio de Janeiro, Brazil, 1–6 July 2012; pp. 285–291. [Google Scholar]
- Gebreslassie, M.G.; Tabor, G.; Belmont, M.R. CFD simulations for sensitivity analysis of different parameters to the wake characteristics of tidal turbine. Open J. Fluid Dyn. 2012, 2, 56–64. [Google Scholar] [CrossRef]
- Nishino, T.; Willden, R.H.J. The efficiency of an array of tidal turbines partially blocking a wide channel. J. Fluid Mech. 2012, 708, 596–606. [Google Scholar] [CrossRef]
- Georgescu, A.M.; Georgescu, S.C.; Cosoiu, C.I.; Alboiu, N.; Hamzu, A. Velocity field in the wake of a hydropower farm equipped with Achard turbines. IOP Conf. Ser. Earth Environ. Sci. 2010, 12, 012108. [Google Scholar] [CrossRef] [Green Version]
- Ansys Inc. ANSYS Fluent; ANSYS Inc.: Pittsburgh, PA, USA, 2015. [Google Scholar]
- Wang, K.; Su, K.; Zhang, L. Impact of phase angle on the hydrodynamic performance of a bi-unit vertical axis tidal current energy. J. Harbin Eng. Univ. 2016, 37, 104–109. [Google Scholar]
- Ansys Inc. ANSYS CFX; ANSYS Inc.: Pittsburgh, PA, USA, 2015. [Google Scholar]
- Ansys Inc. ANSYS CFX User Manual; ANSYS Inc.: Pittsburgh, PA, USA, 2015. [Google Scholar]
- Menter, F.R. Two-equation eddy-viscosity turbulence models for engineering applications. AIAA J. 1994, 32, 1598–1605. [Google Scholar] [CrossRef] [Green Version]
- Holst, M.A.; Dahlhaug, O.G.; Faudot, C. Cfd analysis of wave-induced loads on tidal turbine blades. IEEE J. Oceanic Eng. 2015, 40, 506–521. [Google Scholar] [CrossRef]
- Menter, F.R.; Langtry, R.; Völker, S. Transition modelling for general purpose CFD codes. Flow Turbul. Combust. 2006, 77, 277–303. [Google Scholar] [CrossRef]
- Ponta, F.; Dutt, G. An improved vertical-axis water-current turbine incorporating a channelling device. Renew. Energy. 2000, 20, 223–241. [Google Scholar] [CrossRef]
- Shiono, M.; Suzuki, K.; Kiho, S. Output characteristics of Darrieus water turbine with helical blades for Tidal Current generations. In Proceedings of the 12th International Offshore and Polar Engineering Conference, Kitakyushu, Japan, 26–31 May 2002. [Google Scholar]
- Yang, C.; Mao, Z.S. Numerical simulation of interphase mass transfer with the level set approach. Chem. Eng. Sci. 2005, 60, 2643–2660. [Google Scholar] [CrossRef]
- Nejat, A.; Ollivier-Gooch, C. A high-order accurate unstructured finite volume Newton–Krylov algorithm for inviscid compressible flows. J. Comput. Phy. 2008, 227, 2582–2609. [Google Scholar] [CrossRef]
- Tan, X.; Zhang, X. A simple O-type mesh generation method. J. Changsha Univ. Electr. Power 2001, 4, 40–53. [Google Scholar]
- Maganga, F.; Germain, G.; King, J.; Pinon, G.; Rivoalen, E. Experimental characterisation of flow effects on marine current turbine behaviour and on its wake properties. IET Renew. Power Gener. 2010, 4, 498–509. [Google Scholar] [CrossRef]
- ANSYS Inc. ANSYS CFX Modeling Guide. Release 13.0; ANSYS Inc.: Pittsburgh, PA, USA, 2010. [Google Scholar]
- Gosselin, R. Analysis and Optimization of Vertical Axis Turbines. Ph.D. Thesis, Université Laval, Quebec, QC, Canada, 2015. [Google Scholar]
- Tralli, A.; Bijlsma, A.C.; te Velde, W.; de Haas, P. CFD study on free-surface influence on tidal turbines in hydraulic structures. In Proceedings of the ASME 2015 34th International Conference on Ocean, Offshore and Arctic Engineering, St. John’s, NL, Canada, 31 May–5 June 2015. [Google Scholar]
- Strickland, J.H.; Webster, B.T.; Nguyen, T. A vortex model of the Darrieus turbine: An analytical and Experimental Study. J. Fluids Eng. 1979, 101, 500–505. [Google Scholar] [CrossRef]
- Li, Y.; Calisal, S.M. Three-dimensional effects and arm effects on modeling a vertical axis tidal current turbine. Renew. Energy 2010, 35, 2325–2334. [Google Scholar] [CrossRef]
- Garrett, C.; Cummins, P. The efficiency of a turbine in a tidal channel. J. Fluid Mech. 2007, 588, 243–251. [Google Scholar] [CrossRef]
Figure 1.
SeaGen-Device, (a) submerging state; (b) lifting state.

Figure 2.
Prototypes of HaiNeng series, (a) 2 × 150 kW “HaiNeng I”; (b) 2 × 300 kW “HaiNeng III”.

Figure 3.
Position of the blades, (a) definition of the coordinate system; (b) forces on the blade.

Figure 4.
Mesh configuration, (a) mesh in blade domain, (b) mesh in rotating domain, (c) mesh in outer domain, (d) effect picture of twin-rotors system.
Figure 4.
Mesh configuration, (a) mesh in blade domain, (b) mesh in rotating domain, (c) mesh in outer domain, (d) effect picture of twin-rotors system.

Figure 5.
Boundary settings of the computing domain.

Figure 6.
Variation trend of torque coefficient of single turbine with phase angle for three different meshes.
Figure 6.
Variation trend of torque coefficient of single turbine with phase angle for three different meshes.

Figure 7.
Variation trend of torque coefficient of single turbine with phase angle for three different timesteps
Figure 7.
Variation trend of torque coefficient of single turbine with phase angle for three different timesteps

Figure 8.
Variation trend of torque coefficient of single turbine with phase angle and varying Dw for slip wall.
Figure 8.
Variation trend of torque coefficient of single turbine with phase angle and varying Dw for slip wall.

Figure 9.
Variation trend of torque coefficient of single turbine with phase angle and varying Dw for non-slip wall.
Figure 9.
Variation trend of torque coefficient of single turbine with phase angle and varying Dw for non-slip wall.

Figure 10.
Comparison of normal force coefficient between numerical simulation results and experimental results in the literature.
Figure 10.
Comparison of normal force coefficient between numerical simulation results and experimental results in the literature.

Figure 11.
Comparison of tangential force coefficient between numerical simulation results and experimental results in the literature.
Figure 11.
Comparison of tangential force coefficient between numerical simulation results and experimental results in the literature.

Figure 12.
Comparison of power output efficient with different lambda between stand-alone turbine and twin-rotors turbine.
Figure 12.
Comparison of power output efficient with different lambda between stand-alone turbine and twin-rotors turbine.

Figure 13.
Tangential and normal force coefficient curves, (a) normal force coefficient curves of stand-alone turbine and twin-rotors system, (b) tangential force coefficient curves of stand-alone turbine and twin-rotors turbine.
Figure 13.
Tangential and normal force coefficient curves, (a) normal force coefficient curves of stand-alone turbine and twin-rotors system, (b) tangential force coefficient curves of stand-alone turbine and twin-rotors turbine.

Figure 14.
Lateral force, thrust and torque coefficient curve, (a) thrust coefficient curves of stand-alone turbine and twin-rotors system, (b) lateral force coefficient curves of stand-alone turbine and twin-rotors system, (c) torque coefficient curves of stand-alone turbine and twin-rotors system.

Figure 15.
Cloud picture of velocity in the stand-alone turbine and twin-rotors turbine flow field. (a) Contour of velocity in the stand-alone turbine flow field, (b) contour of velocity of one of the rotors for the twin-rotors turbine flow field.
Figure 15.
Cloud picture of velocity in the stand-alone turbine and twin-rotors turbine flow field. (a) Contour of velocity in the stand-alone turbine flow field, (b) contour of velocity of one of the rotors for the twin-rotors turbine flow field.

Figure 16.
Cloud picture of pressure in the stand-alone turbine and twin-rotors turbine flow field. (a) Contour of pressure in the stand-alone turbine flow field, (b) contour of pressure in the twin-rotors turbine flow field.
Figure 16.
Cloud picture of pressure in the stand-alone turbine and twin-rotors turbine flow field. (a) Contour of pressure in the stand-alone turbine flow field, (b) contour of pressure in the twin-rotors turbine flow field.

Figure 17.
Power output efficient of twin-rotors system at different tip speed ratio and different axis distances.
Figure 17.
Power output efficient of twin-rotors system at different tip speed ratio and different axis distances.

Figure 18.
Cloud picture of velocity in twin-rotors system field with various axis distances. (a) Relative distance DIST = 11/4, (b) Relative distance DIST = 9/4, (c) Relative distance DIST = 7/4.
Figure 18.
Cloud picture of velocity in twin-rotors system field with various axis distances. (a) Relative distance DIST = 11/4, (b) Relative distance DIST = 9/4, (c) Relative distance DIST = 7/4.


Table 1.
Detailed mesh information.
| Mesh | Total Mesh Quantity (×103) | Y Plus | Simulation Time (h) | Number of Mesh Layer | Thickness of the First Layer (×10−4 m) |
|---|---|---|---|---|---|
| 1 | 45 | 21.5–38.2 | 4 | 30 | 4 |
| 2 | 119 | 2.65–4.76 | 12 | 30 | 1 |
| 3 | 274 | 0.83–1.96 | 26 | 30 | 0.5 |
Table 2.
Relative increase of power output efficiency.
| DIST | Relative Increase of Cp/% | ||||
|---|---|---|---|---|---|
| Lambda = 1.0 | Lambda = 1.5 | Lambda = 2.0 | Lambda = 2.5 | Lambda = 3.0 | |
| 12/4 | 0.65 | 8.74 | 13.39 | 15.73 | 21.24 |
| 11/4 | 0.74 | 10.55 | 14.63 | 16.63 | 22.63 |
| 10/4 | 0.42 | 11.57 | 14.99 | 16.45 | 19.55 |
| 9/4 | 0.23 | 12.76 | 14.03 | 12.01 | 8.57 |
| 8/4 | 0.38 | 12.37 | 10.99 | 10.04 | 5.53 |
| 7/4 | 0.13 | 11.71 | 8.90 | 7.89 | 9.07 |
© 2018 by the authors. Licensee MDPI, Basel, Switzerland. This article is an open access article distributed under the terms and conditions of the Creative Commons Attribution (CC BY) license (http://creativecommons.org/licenses/by/4.0/).
Share and Cite
MDPI and ACS Style
Ma, Y.; Hu, C.; Li, Y.; Li, L.; Deng, R.; Jiang, D. Hydrodynamic Performance Analysis of the Vertical Axis Twin-Rotor Tidal Current Turbine. Water 2018, 10, 1694. https://doi.org/10.3390/w10111694
AMA Style
Ma Y, Hu C, Li Y, Li L, Deng R, Jiang D. Hydrodynamic Performance Analysis of the Vertical Axis Twin-Rotor Tidal Current Turbine. Water. 2018; 10(11):1694. https://doi.org/10.3390/w10111694
Chicago/Turabian StyleMa, Yong, Chao Hu, Yulong Li, Lei Li, Rui Deng, and Dapeng Jiang. 2018. "Hydrodynamic Performance Analysis of the Vertical Axis Twin-Rotor Tidal Current Turbine" Water 10, no. 11: 1694. https://doi.org/10.3390/w10111694
Note that from the first issue of 2016, this journal uses article numbers instead of page numbers. See further details here.