Anthropogenic Impact and Ecological Risk Assessment of Thallium and Cobalt in Poyang Lake Using the Geochemical Baseline


1
State Key Laboratory of Simulation and Regulation of Water Cycle in River Basin, China Institute of Water Resources and Hydropower Research, Beijing 100038, China
2
Deportment of Water Environment, China Institute of Water Resources and Hydropower Research, Beijing 100038, China
*
Authors to whom correspondence should be addressed.
Water 2018, 10(11), 1703; https://doi.org/10.3390/w10111703
Submission received: 1 October 2018
/
Revised: 14 November 2018
/
Accepted: 15 November 2018
/
Published: 21 November 2018
(This article belongs to the Section Water Quality and Contamination)
Abstract
:As the largest freshwater lake in China, water environmental pollution in Poyang Lake is increasingly attracting attention. However, to date, the occurrence of seldom-monitored trace elements (SMTEs) (such as thallium (Tl) and cobalt (Co)) and their potential ecological influences in the Poyang Lake area remain unclear. Here, geochemical baseline concentrations (GBCs) were employed to investigate anthropogenic inputs of these two metals (Tl and Co) and were used to assess the potential ecological risk in surface sediments of Poyang Lake. The results showed that the mean concentrations of Tl and Co were 1.11 mg/kg and 15.42 mg/kg, respectively, slightly higher than background values (BVs) in local soil. Spatially, the Co concentrations in surface sediments of Poyang Lake varied; Co concentrations in the west of the study area were significantly lower than in the middle of the lake. In contrast, no significant spatial variation of Tl was found in studied areas of Poyang Lake. Average GBCs were similar to the mean measured concentrations of Tl and Co in the lake, and both were higher than the BVs in local soil. In anthropogenic source analysis based on the GBCs, 47.22% samples and 41.67% samples were influenced by human activity for Tl and Co, respectively; the mean anthropogenic contribution rate was 5.90% for Tl (0.43 to 16.22%), and 13.01% for Co (0.82 to 31.59%). These results indicated that Tl and Co mainly originate from natural processes. However, the anthropogenic contribution should not be ignored. Moreover, the geo-accumulation index (Igeo) and potential ecological parameter (Er) generally indicated no contamination and a low potential risk for Tl and Co in Poyang Lake sediments, which used the GBCs as BVs. The results of this study suggest that GBCs are more scientifically robust and practical as a reference than BVs. They can also be used when BVs are lacking.
1. Introduction
Due to their persistence, inherent toxicity, and non-degradability, the contamination of the aquatic environment with trace metals is highly concerning [1,2]. While previous studies have tended to focus on the commonly monitored trace elements (e.g., Cu, Hg, Pb, As, Cd, Cr, Mn, and Zn) [3,4]. Comparatively, ‘seldom-monitored trace elements (SMTEs)’, such as thallium (Tl) and cobalt (Co), have caused less concern, especially for sediments. However, these two metals also have potential health effects through accumulation in the food chain [5,6]. Tl and Co are dispersed metal elements that seldom occur in the form of independent minerals; they are commonly found in sulfur mines, along with copper, iron, lead, zinc and other metals [7,8,9]. However, Tl and Co are also poisonous, and can cause cancer and ultimately threaten human life [9,10,11]. As the metal constituent of vitamin B12, Co plays a biologically essential role [12]. Meanwhile, the 13th Report on Carcinogens (ROC) lists “cobalt sulfate” and “cobalt-tungsten carbide: powders and hard metals” as being reasonably anticipated to be human carcinogens [13], the study had found that cobalt metal may induce lung cancer [14]. Moreover, as a non-essential trace element, Tl had been recognized internationally as one of the 13 priority pollutants [15]. It is more toxic to mammals than mercury, cadmium, lead, copper, and zinc; even low concentration can harm most living organisms [8]. In China, Tl has been recognized as an emerging pollutant due to the increasing awareness of its high risk to human health [16]. Thallotoxicosis-related symptoms include weakness, muscle and joint pain, disturbance of vision, and hair loss [17]. Recently, Tl pollution incidents that took place in Pearl River further aroused public attention [18]. Due to their relatively low abundance and their particular sensitivity, once they have entered the aquatic environment, Tl and Co would typically precipitate into sediments or be adsorbed onto sediment particles. [19]. As both primary sources and a sink, many hazardous and toxic metals entering into aquatic systems can be stored in sediment [2]. Moreover, surface sediments also pose the potential threat of secondary pollution to lake ecosystems. Consequently, surface sediments can be used to study metal concentration levels in lakes, and represent an excellent tool for monitoring exogenous inputs.
Poyang Lake is the largest freshwater lake in China [20]. It is located to the north of Jiangxi Province and lies on the middle and lower reaches of the Yangtze River, which is the largest river in China. The Xiushui, Gangjiang, Fuhe, Xinjiang, and Raohe rivers are the main watercourses feeding into the lake. Poyang Lake is a critical freshwater resource, and is one of the top ten ecological function protectorates in China. It plays a vital role in maintaining the security of ecology for the region and state [21]. Despite its huge economic and social benefits, metal contamination in sediments of Poyang Lake has drawn significant attention [22]. The first non-ferrous metal mine in China, Dexing copper mine, is located on the side of Poyang Lake. Previous research has shown high trace metal concentrations in the surface sediments of Poyang Lake [23]. The research showed that the conjunction of the rivers has been subjected to metal contamination [24]. Moreover, significant volumes of waste metal are transported into the lake by the rivers due to the large uncontrolled metal inputs from the developing industrial and agricultural activity, especially mineral extraction [25], and the burden of Poyang Lake is increasing rather than decreasing [26]. Therefore, the contamination of metal in Poyang Lake should be taken seriously. However, previous studies have focused on the metal contamination of sediments in Poyang Lake by investigating commonly monitored trace elements [23,27], little is known about Tl and Co in the sediments of Poyang Lake. Now, therefore, for Tl and Co, it is necessary to determine the concentration, spatial patterns and accurate assessment of potential ecological risk in the sediments of Poyang Lake.
The geochemical baseline concentrations (GBCs) for trace elements are defined as the natural levels of metals in the geochemistry of the earth’s surface materials, like soil and sediment [28,29]. Meanwhile, it can distinguish between pedogenic and the anthropogenic origin of trace metals in the environmental compartments [30]. However, few studies have been reported on trace metals in lake sediments based on GBCs. Previous research into the evaluation of metals in sediments has generally used background values (BVs) of trace metals as a reference [22,31]. Numerous sediment evaluation methods have been developed, including the geo-accumulation index (Igeo), the single pollution indices (PI), and the potential ecological risk parameter (Er); using BVs as a basis, all have been widely applied to assess metal concentration in the sediments of Poyang Lake [25,31]. However, by simply using the BVs of trace metals in soils or sediments, evaluation results cannot mirror actual contamination rates; this is because BVs do not consider natural variations in the elementary contents [32]. Accordingly, it is critical to select a more suitable standard.
In this study, we established the GBCs of Tl and Co in order to accurately evaluate the contamination status in Poyang Lake. The main aims of this study were: (1) to determine the concentration and spatial distributions of Tl and Co in Poyang Lake surface sediments; (2) to establish the GBCs of Tl and Co in the surface sediments of Poyang Lake; (3) to analyze anthropogenic contributions based on GBCs; and (4) to evaluate the contamination state and potential risks of Tl and Co in the study area using the Igeo, PI, and Er. The results of this study provide an effective reference of geochemical patterns for Tl and Co in the surface sediments of Poyang Lake, and give new insights that will help to protect water quality.
2. Materials and Methods
2.1. Study Area
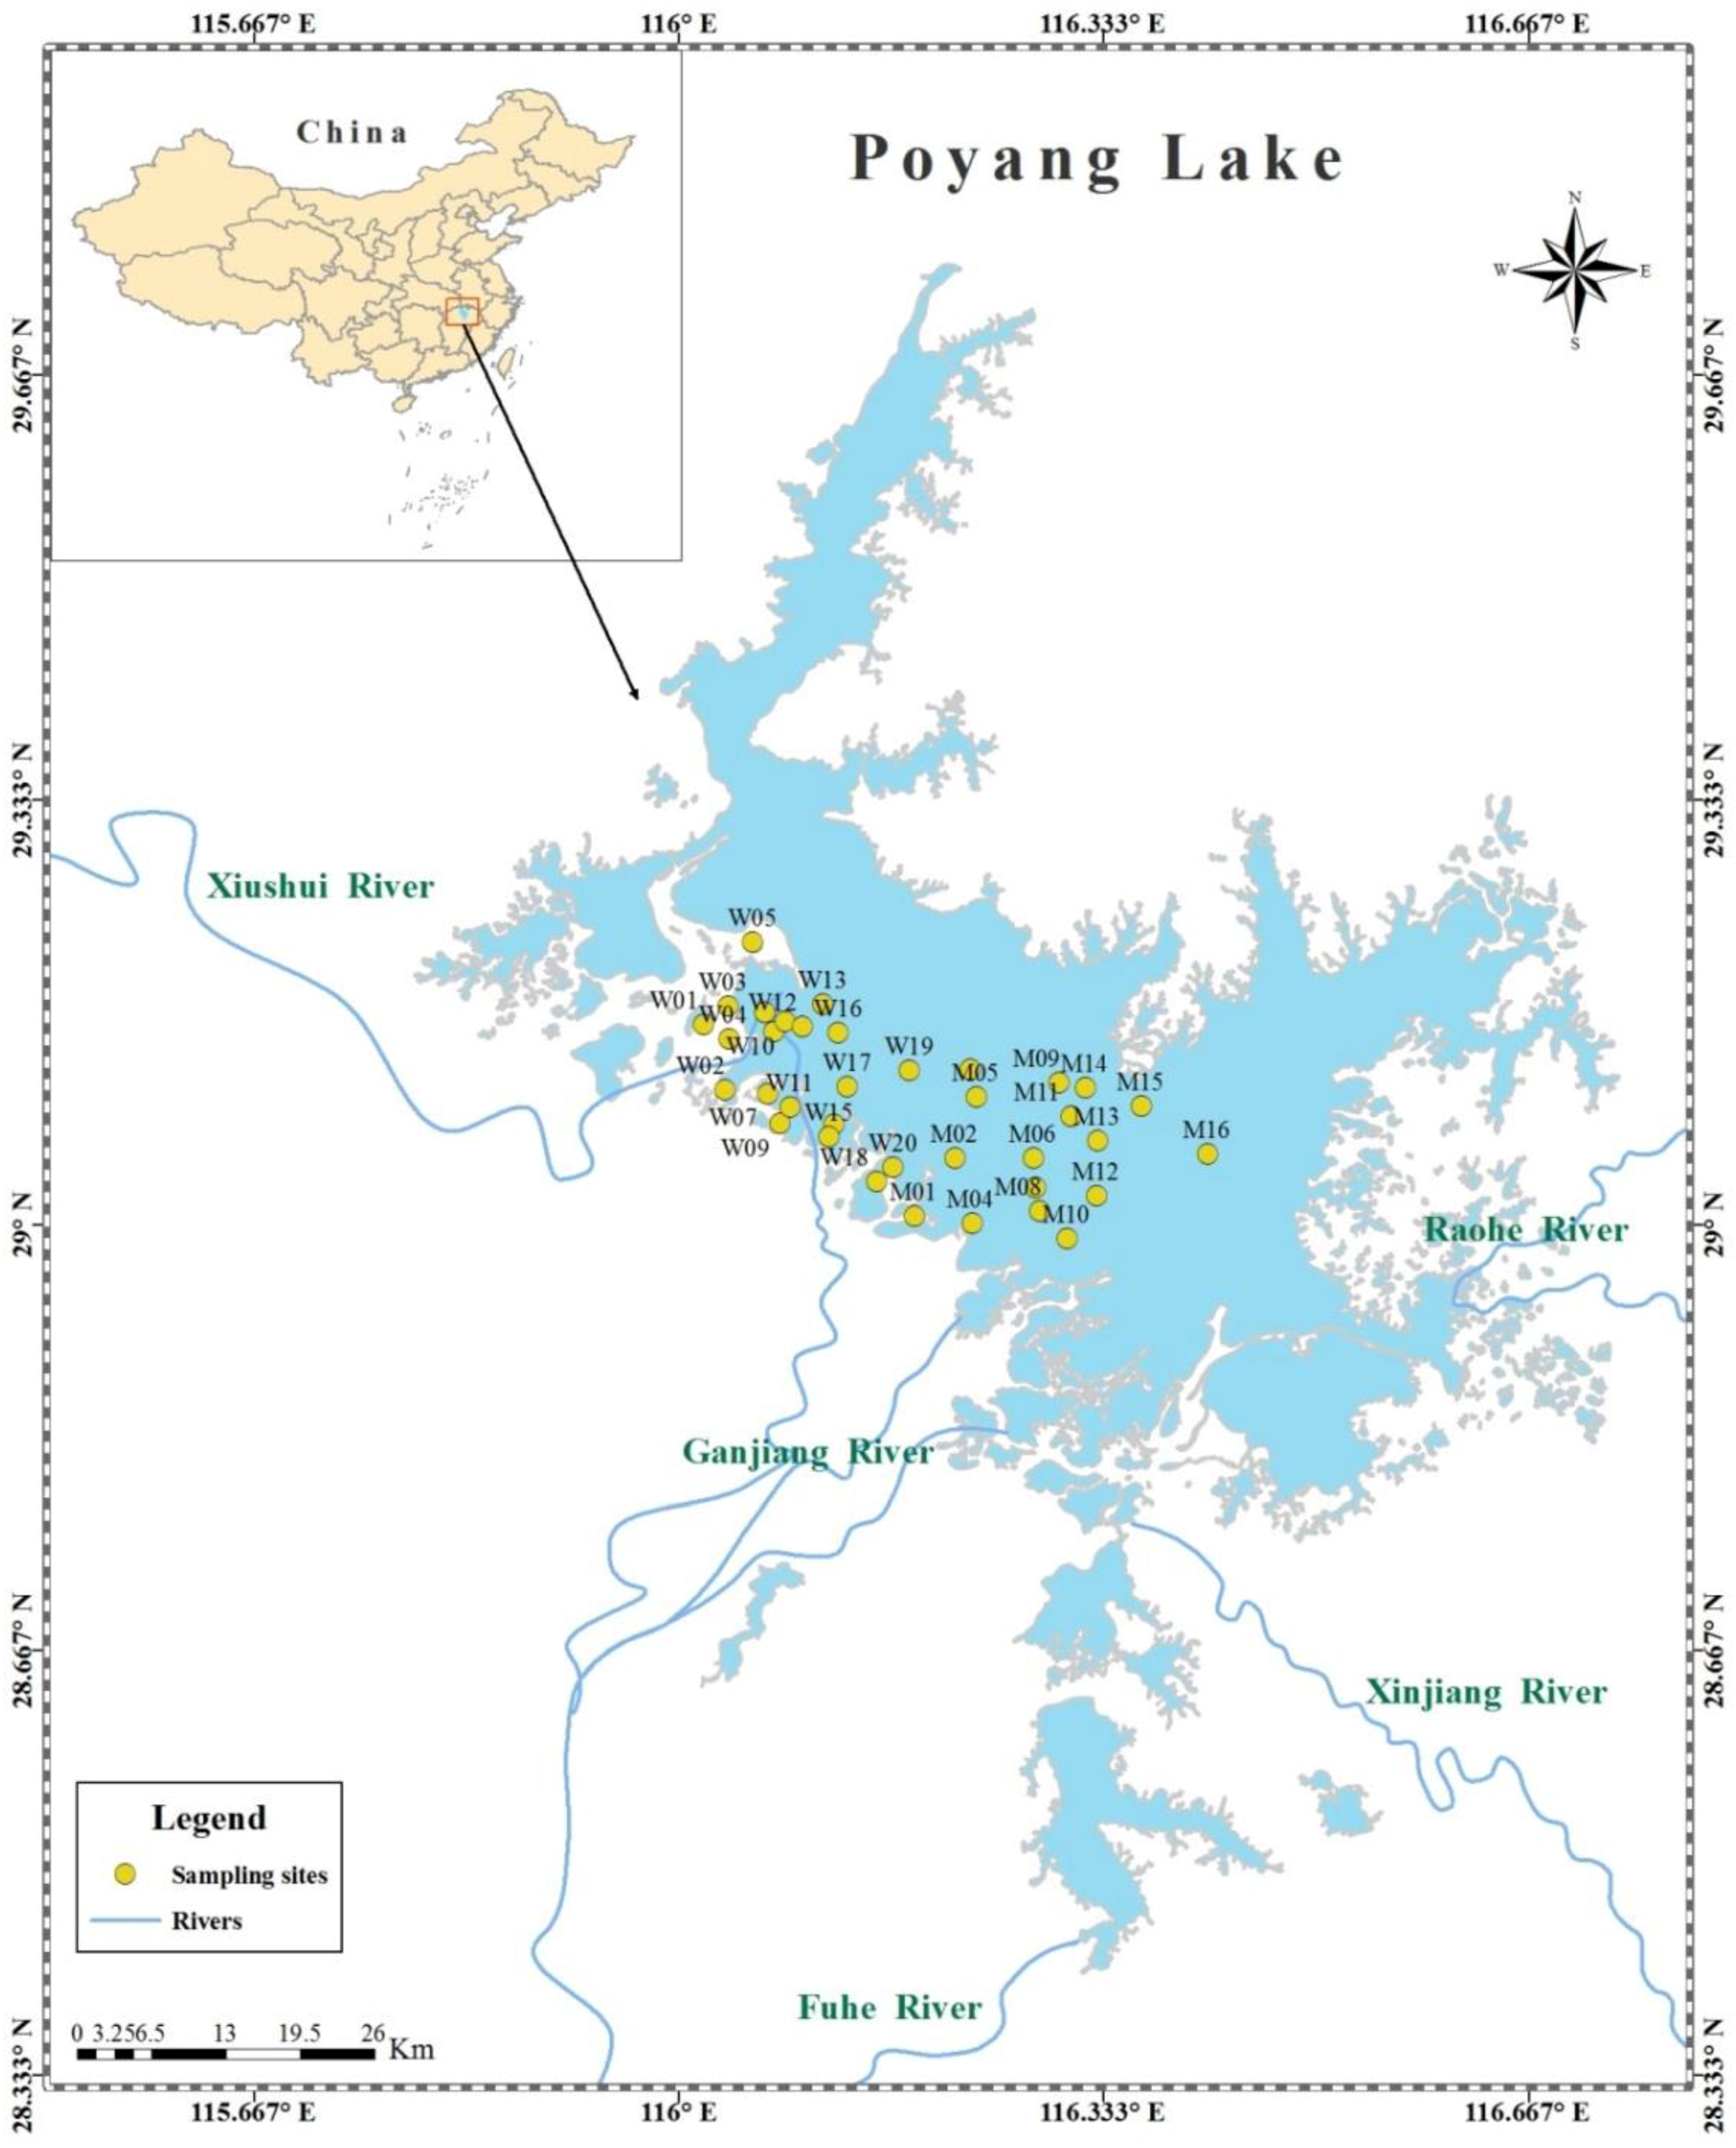
Poyang Lake (28.400°–29.767° N, 115.817°–116.767° E), with a drainage area of 162,000 km2, represents 97% of Jiangxi province [33]. Figure 1 shows the study area, with the location of sampling sites, choosing WG84 as the geographic coordinate system. The area experiences a subtropical humid monsoon climate, and annual mean temperatures are from 16.5 to 17.8 °C. The rainy season is from April to September, and mean annual precipitation is 1570 mm.
2.2. Sample Collection
A total of 36 surface sediment samples were collected from Poyang Lake in July 2016; sampling sites were arranged from the western side of the lake to the center of the lake (Figure 1). The sampling area extended from 116.050° to 116.416° E, with the dividing line between the western and central lake at 116.183° E. Sampling sites were numbered W01 to W20 (western lake) and M01 to M16 (central lake). Surface sediment sampling (at depths of between 0 and 10 cm) was carried out using a bottom sampler at each location. Samples were sealed in clean polyethylene bags, which were soaked in nitric acid for two days and rinsed with deionized water in advance, then samples were stored at low temperature and transported to the laboratory immediately. All collected sediment samples were freeze-dried, crushed, and ground in an agate mortar. Stones and plant fragments were removed by passing the samples through an acid-cleaned 65-mesh nylon sieve for chemical analysis.
2.3. Chemical Analysis and Quality Control
Tl and Co concentrations in sediments were measured using an established method [34]. In brief, 40 mg of each dry sediment sample was weighed; this was then digested using a strong acid solution (HNO3 + H2O2 + HF), and finally diluted with ultrapure water to 80 g. Total Tl and Co concentrations were measured by an inductively coupled plasma mass spectrometer (ICP-MS; PerkinElmer Elan DRC-e, USA) with a detection limit of 0.05 mg/kg. All chemical treatments were performed in an ultraclean laboratory, and adequate quality control measures were followed in all aspects of the study. Quality control was assured by blanks, standard reference materials and duplicates; Chinese stream sediments (GSD-10, GSD-1a) were employed to ensure the accuracy of the analytical procedures. The recovery of standard reference materials was 107–114% for Tl, and 100–105% for Co.
2.4. Geochemical Baseline Concentrations (GBCs)
The concept of GBCs was first put forward in the 1970s. Generally, GBCs are representative of element concentrations that to some extent reflect human activities; they differ from BVs in sediments or soil [35]. In this study, the GBCs for Tl and Co in the surface sediments of Poyang Lake were established using a normalization method [32]. This method uses correlation analysis between a conservative reference element (inert element) and the study element. In this study, lithium (Li) was recognized as the reference element owing to its stability and the significant liner correlation with Tl and Co. The GBCs of Tl and Co in the surface sediments of Poyang Lake were established using the following equation:
where Cm is the concentration of Tl or Co (mg/kg), CN is the concentration of Li (mg/kg), and a and b are regression constants.
Data outside the 95% confidence limit were removed through regression analysis, indicating that they were influenced by anthropogenic pollution. Data within the 95% limit were employed to obtain new regression constants (c and d). Finally, the GBCs of Tl and Co were obtained from the new regression line, and the GBCs were averaged as a reference to identify surface sediment contamination in Poyang Lake. The GBCs were calculated as follows:
where Bm is the GBC of Tl or Co (mg/kg) in the study area, is the normalized average of Li (mg/kg), and c and d are the new regression constants.
2.5. Assessment of Contamination and Ecological Risks
2.5.1. Geo-Accumulation Index (Igeo)
The geo-accumulation index is a quantitative evaluation method for sediments (especially sediments in water environments) [36]; it is widely employed to quantitatively assess the degree of contamination [37,38]. The equation for Igeo is defined as follows:
where Cn is the measured concentration of an element in the sediment (mg/kg), Bn represents the background concentration (mg/kg), and 1.5 corresponds to possible variation of in crustal contribution, mainly by lithogenic effects. A positive Igeo generally indicates an anthropogenic contribution [29]. Seven classes of Igeo were classified as follows: uncontaminated (Igeo < 0); uncontaminated to moderately contaminated (0 ≤ Igeo < 1), moderately contaminated (1 ≤ Igeo < 2), moderately to strongly contaminated (2 ≤ Igeo <3), strongly contaminated (3 ≤ Igeo < 4), strongly to extremely contaminated (4 ≤ Igeo <5), and extremely contaminated (Igeo ≥ 5).
2.5.2. Potential Ecological Risk Parameter (Er)
Single pollution indices (PI) are useful tools for determining contamination levels [27]. In this study, we used the potential ecological parameter (Er), which combines the concentrations of metals with their ecological and toxicological effects [39], to assess the potential ecological toxicity of Tl and Co in the surface sediments of Poyang Lake. RI can be calculated as the sum of the individual potential risk factors (Er), which were given by the following equations:
where PI denotes the contamination level for a certain metal, Cx is the measured concentration of the metal (Tl and Co), C0 indicates the BV of metals in the sediments. Er demonstrates the potential ecological risk of the element. Tr is the toxic response factor for the study element. In this study, the Tr of Tl and Co were defined as 10 and 5, respectively, based on previous studies [22,40].
2.6. Statistical Analysis
In this study, standard statistical analyses (mean, median, standard deviation) were carried out to describe the measured concentrations and GBCs of Tl and Co. The ArcGIS 10.1 software package was used for spatial mapping. SPSS 17.0, Origin Pro 2017, and Microsoft software packages were combined to process analytical data.
3. Results and Discussion
3.1. Concentrations and Spatial Variability of Tl and Co in the Surface Sediments
The concentrations of Tl and Co in the surface sediments of Poyang Lake are shown in Table 1 and Figure 2. The mean concentrations of Tl and Co in the sediments were 1.11 ± 0.15 mg/kg and 15.42 ± 4.09 mg/kg, respectively. The mean concentration of Tl was more than twice the BVs in the Yangtze River sediments [41]. Meanwhile, the mean Tl concentrations already exceeded the BVs in the soil of Nanchang (0.80 mg/kg) [42] and Jiangxi Province (0.88 mg/kg) [43]. The mean concentration of Co was higher than the BVs in Chinese sediments [41], but slightly lower than the BVs in Yangtze River sediments [41]. Meanwhile, mean Co concentrations also exceeded BVs in the soil of Nanchang (13.00 mg/kg) [42] and Jiangxi Province (11.50 mg/kg) [43]. In general, about 97.22% of samples for Tl and 80.56% of samples for Co exceeded the BVs in Nanchang soil, indicating the accumulation of these two metals in the sediments. Compared with previous studies [3,4], the concentrations of Tl and Co in Poyang Lake were found to have increased slightly (Table 2), suggesting that they were influenced by anthropogenic activities in the Poyang Lake basin. This is consistent with previous studies showing how anthropogenic activities [31], such as hydro-engineering works [44], shipping, mining, and agriculture, affect metal concentrations in Poyang Lake.
To gain a comprehensive understanding of the Tl and Co statuses of the surface sediments in this study, a comparison of the Tl and Co concentrations with those in other regions of China was performed (Table 2). The mean concentration of Tl in this study was higher than those reported at Chao Lake, Three Gorges Reservoir, and Laizhou Bay, but lower than those in the Xiang Jiang River, Hengyang section, and Beijiang River [19,45,46,47,48]. Meanwhile, the mean concentration of Co in our study was also higher than those of the Beijiang River and Chao Lake, but was significantly lower than those in the Xiang Jiang River, Hengyang section, and Three Gorges Reservoir [19,45,46,47]. These differences in concentrations of Tl and Co may not reflect actual pollution levels, owing to existing spatial heterogeneity [29]. Therefore, the reference used for metals must be considered when assessing metal contamination in sediments.
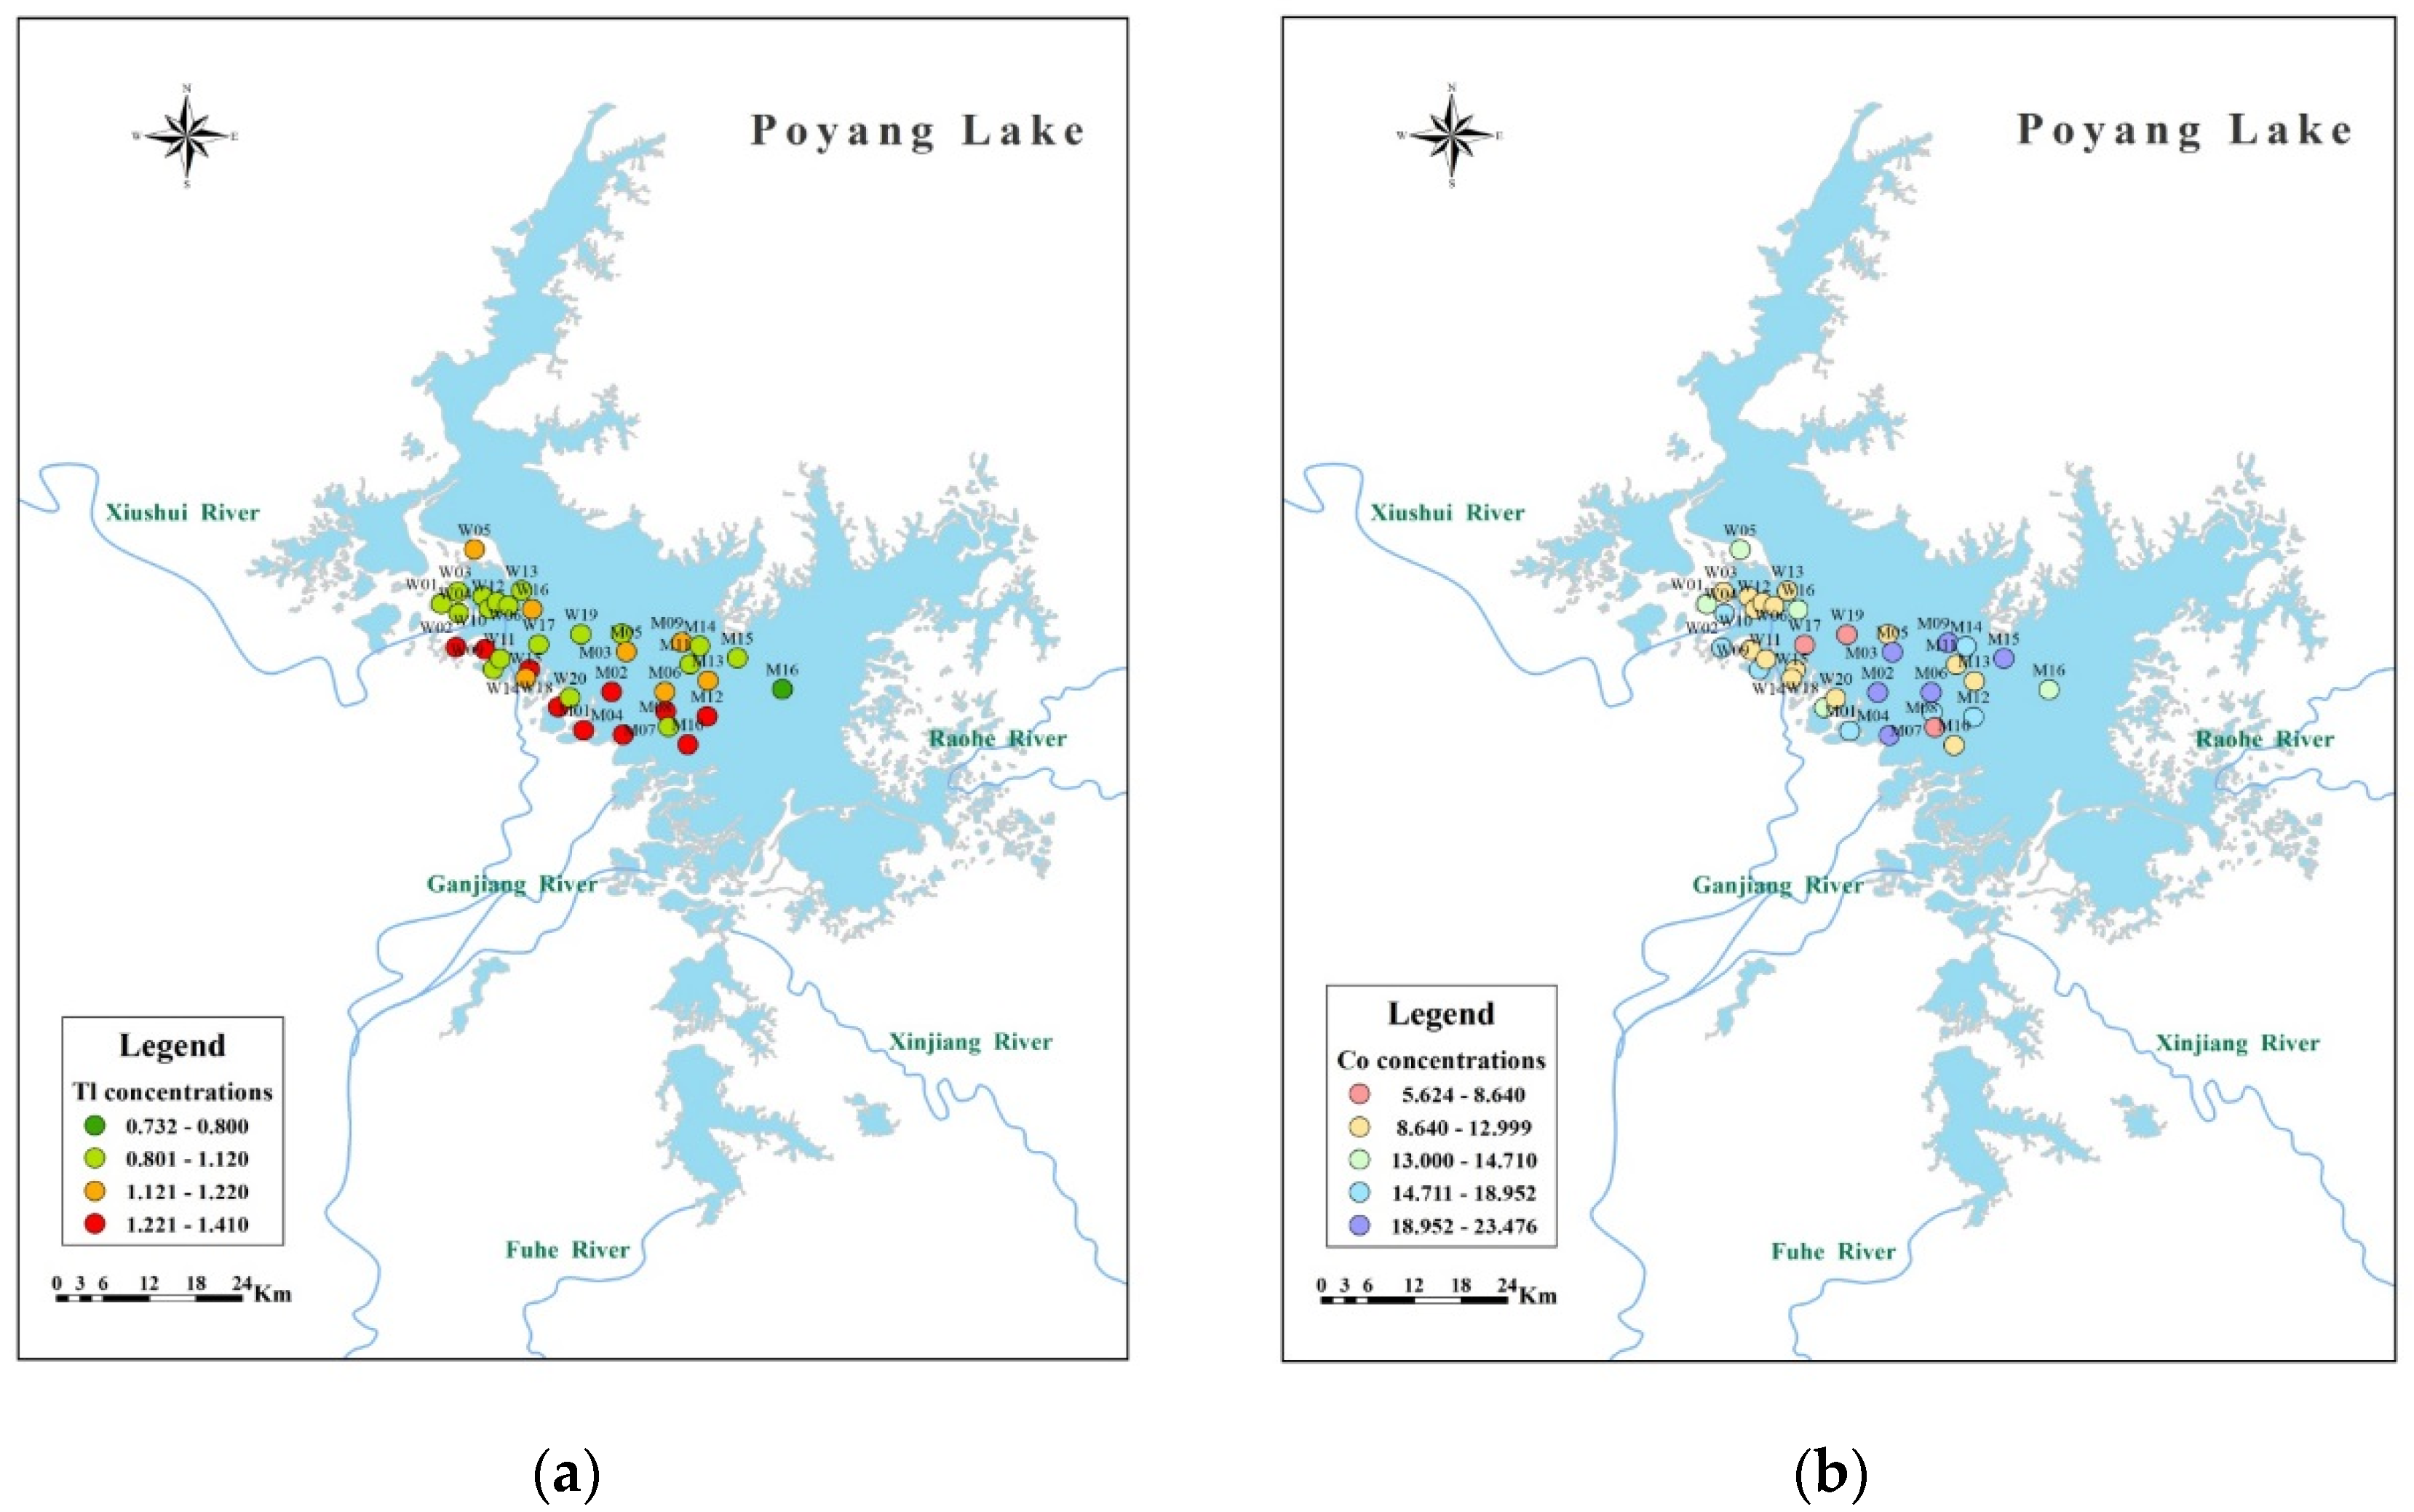
Spatially, the distribution of Tl concentrations was different from that of Co (Figure 2a,b). The concentrations of Tl in the surface sediments were not significantly different between the western and middle areas of Poyang Lake. Tl concentrations were highest at M07 and lowest at M16.While, larger variations of Co concentrations were observed. The Co concentrations in the surface sediments of the west lake were slightly lower compared with those in the middle of the lake; Co concentrations were highest at M02 and lowest at W19. The results indicate that Tl and Co have different spatial patterns, perhaps demonstrating that they were influenced by varying exogenous inputs.
3.2. Establishment of Geochemical Baselines for Tl and Co
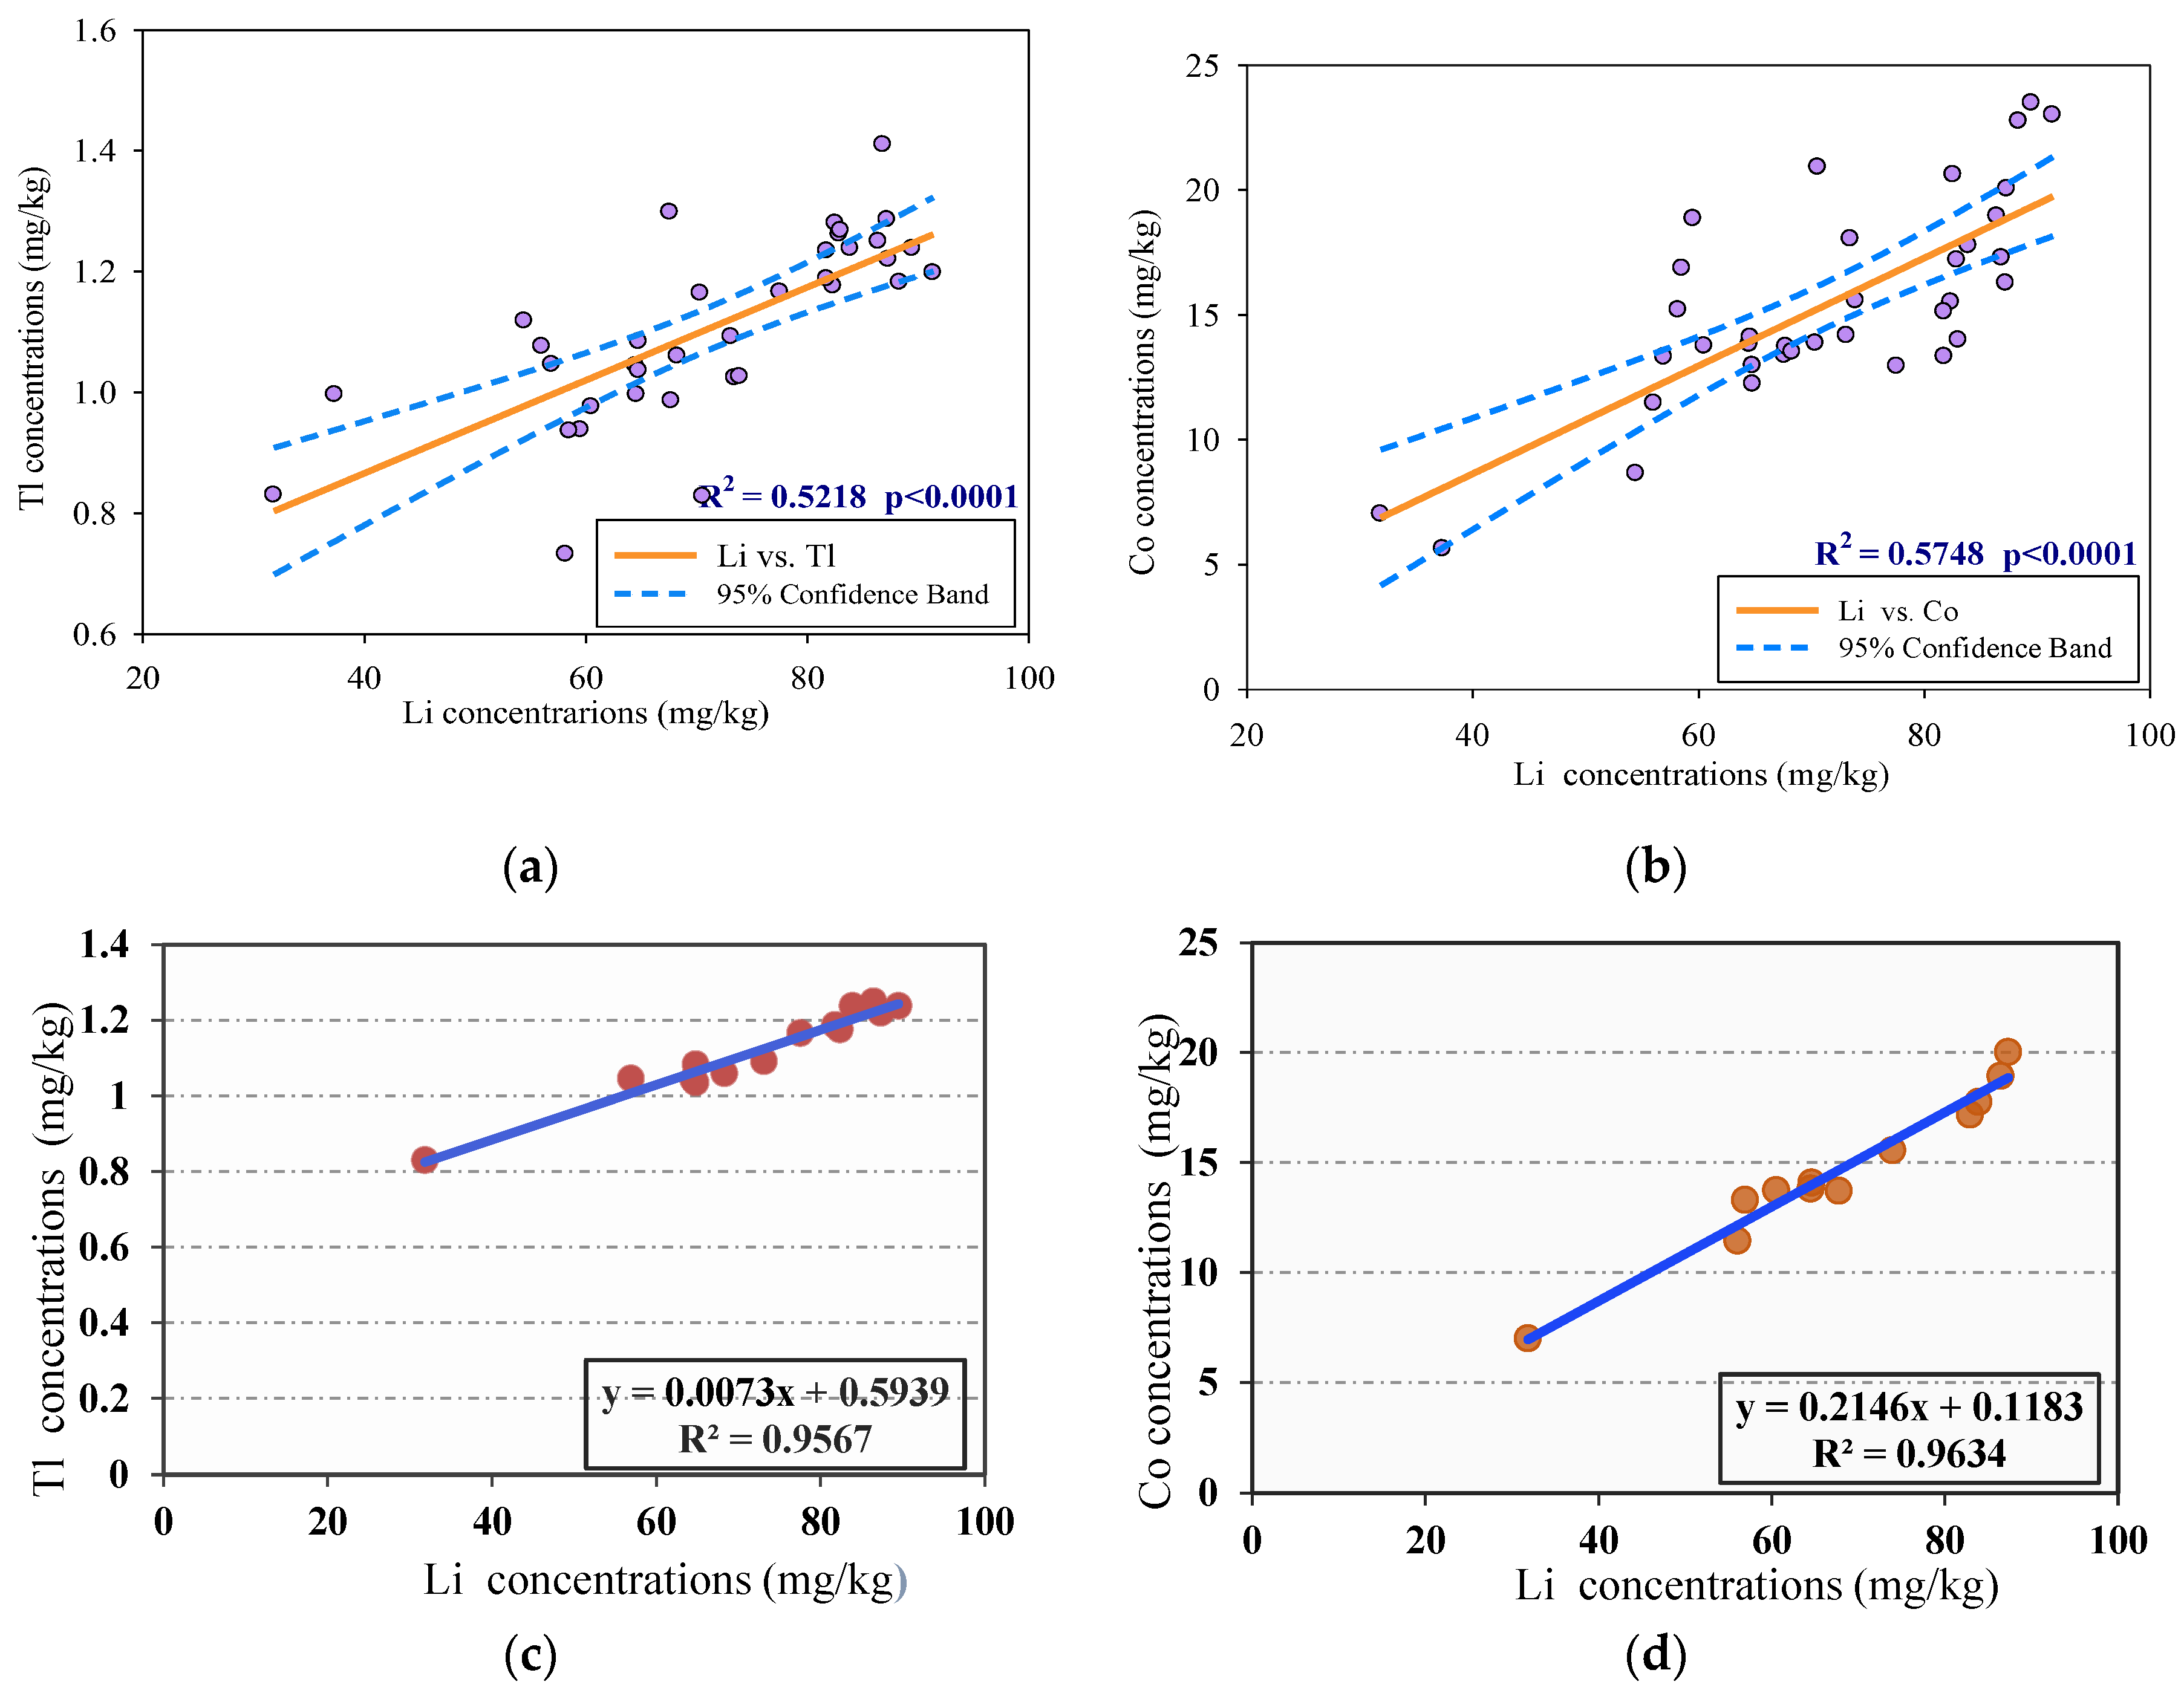
The results of correlation analysis revealed that the concentration of Tl and Co had significant positive relationships with the concentration of Li (p < 0.0001); the correlation coefficient for the linear regression was 0.7318 for Tl and 0.7582 for Co (Figure 3a,b). We removed all points that were beyond the 95% confidence band. Based on the remaining data, geochemical baselines were developed (Figure 3c,d) and the correlation coefficients of Tl and Co increased to 0.9781 and 0.9815, respectively.
As a result, the GBC ranges of Tl and Co in the surface sediments of Poyang Lake were 0.83–1.26 mg/kg and 6.95–19.73 mg/kg, respectively, and the mean GBC values were 1.12 ± 0.10 mg/kg and 15.44 ± 3.08 mg/kg, respectively. It was found that the GBC of Tl in the surface sediments of Poyang Lake was markedly higher than the BVs in the soil of Nanchang (0.80 mg/kg) [42], Jiang Xi Province (0.88 mg/kg) [43], and Yangtze River sediments (0.49 mg/kg) [41]. The GBC of Co also exceeded the BVs in the soil of Nanchang (13.00 mg/kg) [40] and Jiang Xi Province (11.50 mg/kg) [43], but was lower than the BV in the Yangtze River sediments (17.00 mg/kg) [41]. The mean GBCs very roughly approximated the mean concentrations of Tl and Co in Poyang Lake; therefore, we believe that the established GBCs are reasonable [29] and could be employed for the further pollution assessment of Tl and Co in Poyang Lake sediments.
To better understand the impact of anthropogenic sources, anthropogenic contribution rates were calculated based on the GBCs. Using the established linear regression equation, baseline concentration values of Tl and Co were determined for each sampling site in order to determine the differences between measured concentrations and baseline concentrations in the surface sediments of Poyang Lake. The GBCs of Tl and Co reflect the natural concentration status of the study area. If a measured concentration is higher than the baseline concentration, the metal has been influenced by anthropogenic inputs. Conversely, if the measured concentration is lower than the baseline concentration, variability is from a natural source. Thereby, the anthropogenic contribution of each sampling site can be obtained using the equations:
where Pm is the GBC at each sampling site, CN represents the measured concentration of Li in the sediments, c and d are constants in Equation (7), and Cm is the measured concentration of Tl or Co in the surface sediments.
Pm = c CN + d
Contribution rate (%) = (Cm − Pm)/Cm × 100%
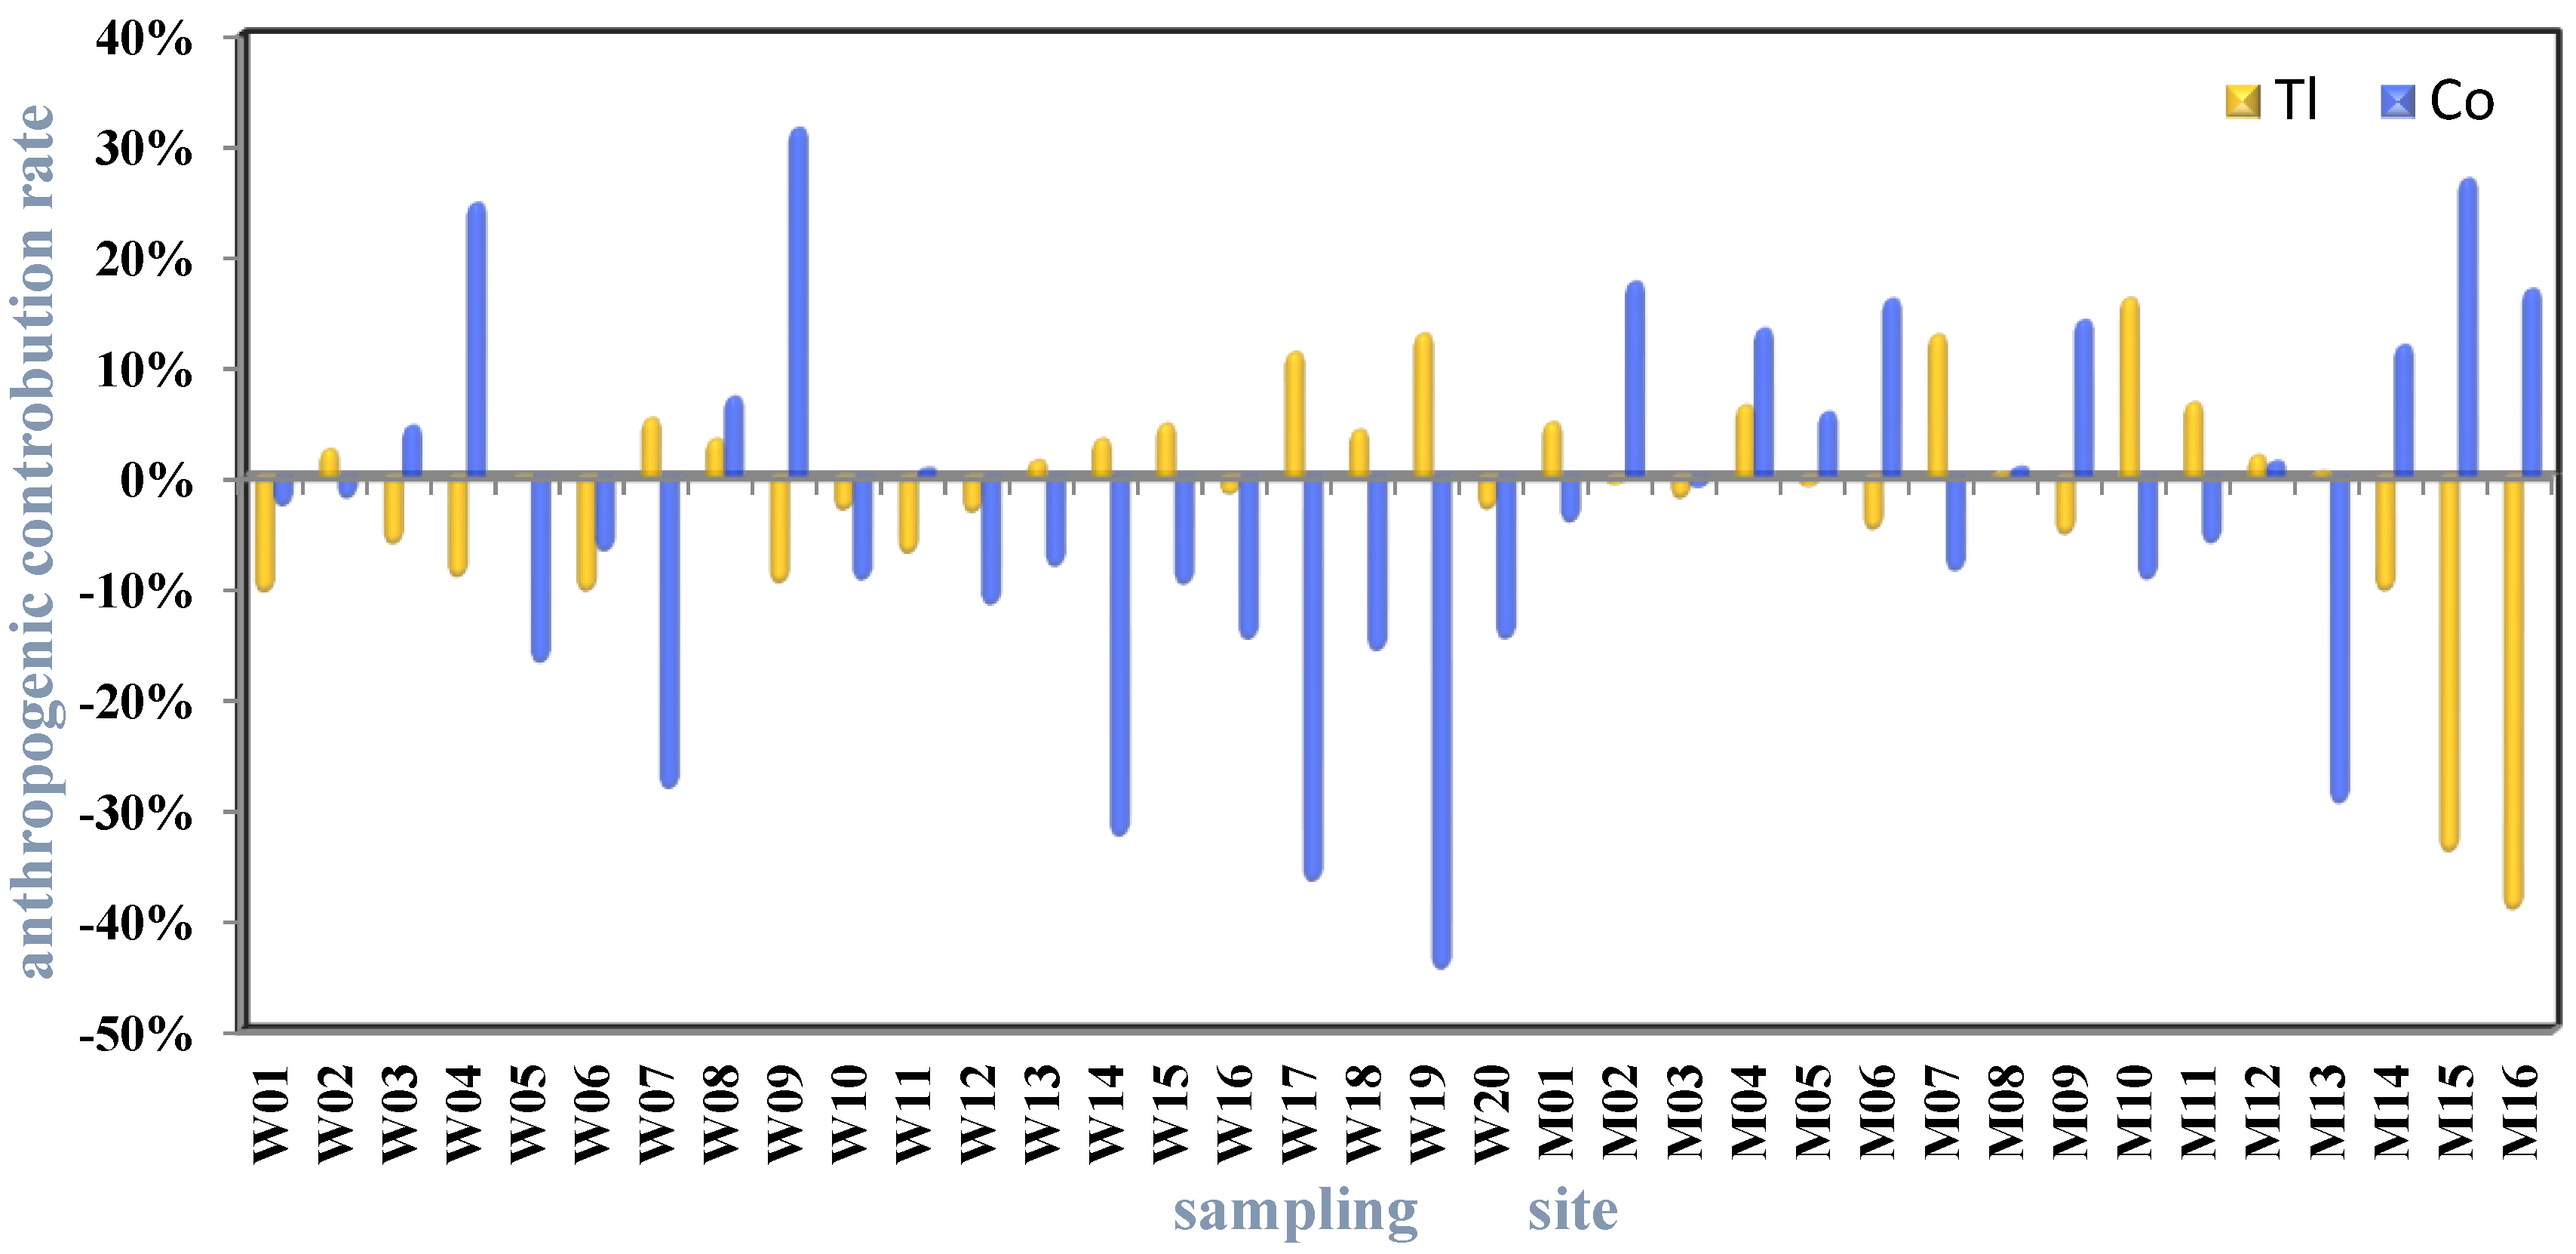
Our calculations showed that 47.22% of the differences between the measured concentrations and GBCs were positive for Tl (Figure 4). The anthropogenic contributions of Tl varied between 0.43% and 16.22%, with a mean value of 5.90%. The maximum value was 16.22%, which was observed at site M10 (Figure 4). For Co, 41.67% of samples were impacted by anthropogenic sources to varying degrees (Figure 4). While the anthropogenic contribution of Co ranged from 0.82 to 31.59%, the mean value was 13.01%; the maximum was observed at site W09 (Figure 4). As shown in Figure 2 and Figure 4, the maximum anthropogenic contributions were not found at the highest concentrations of Tl and Co. This confirms that using GBCs to distinguish anthropogenic input and natural sources has practical significance.
From the above, the anthropogenic influences for both Tl and Co were relatively minor, but differed from one another. The anthropogenic contribution differed depending on sample location. Generally, the proportion of sampling sites influenced by anthropogenic sources was fewer than 50% for Tl and Co. The results show that the increase of Tl and Co in the surface sediments of Poyang Lake can mainly be attributed to natural factors; however, the anthropogenic influences cannot be neglected.
3.3. Assessment of Potential Ecological Risk by Tl and Co
In the assessment of potential ecological risk, we employed the mean GBCs of Tl and Co instead of BVs for several reasons: (1) GBCs consider the natural variations of a metal, but can also distinguish anthropogenic contributions from exogenous inputs; (2) the BVs of Tl and Co in the sediments of Poyang Lake were unavailable; (3) assessments of lake sediment state with BVs of the soil or stream sediments have been shown to be imprecise. Three different quantitative indices (Igeo, PI, and Er) were used to evaluate the potential ecological risk of Tl and Co in Poyang Lake sediments.
3.3.1. Geo-Accumulation Index
Table 3 summarizes the calculated Igeo values for Tl and Co. Based on the GBCs, negative Igeo values were observed for Tl and Co, except for a very few sampling sites. The results revealed that these two metals did not cause pollution in the surface sediments of Poyang Lake. To be specific, all Igeo values for Tl were less than zero, ranging from −1.20 to −0.25, and with a mean of −0.61. Therefore, the surface sediments of Poyang Lake were uncontaminated by Tl. For Co, almost all Igeo values were also less than zero, except for that at M02; the Igeo values of Co varied between −2.04 and 0.02, with a mean of −0.64. In general, this also suggests that the sediments of Poyang Lake were uncontaminated by Co, although site M02 was found to be uncontaminated to moderately contaminated. The large spatial variation of Co suggested that its distributions could be influenced by anthropogenic activities.
3.3.2. Potential Ecological Risk
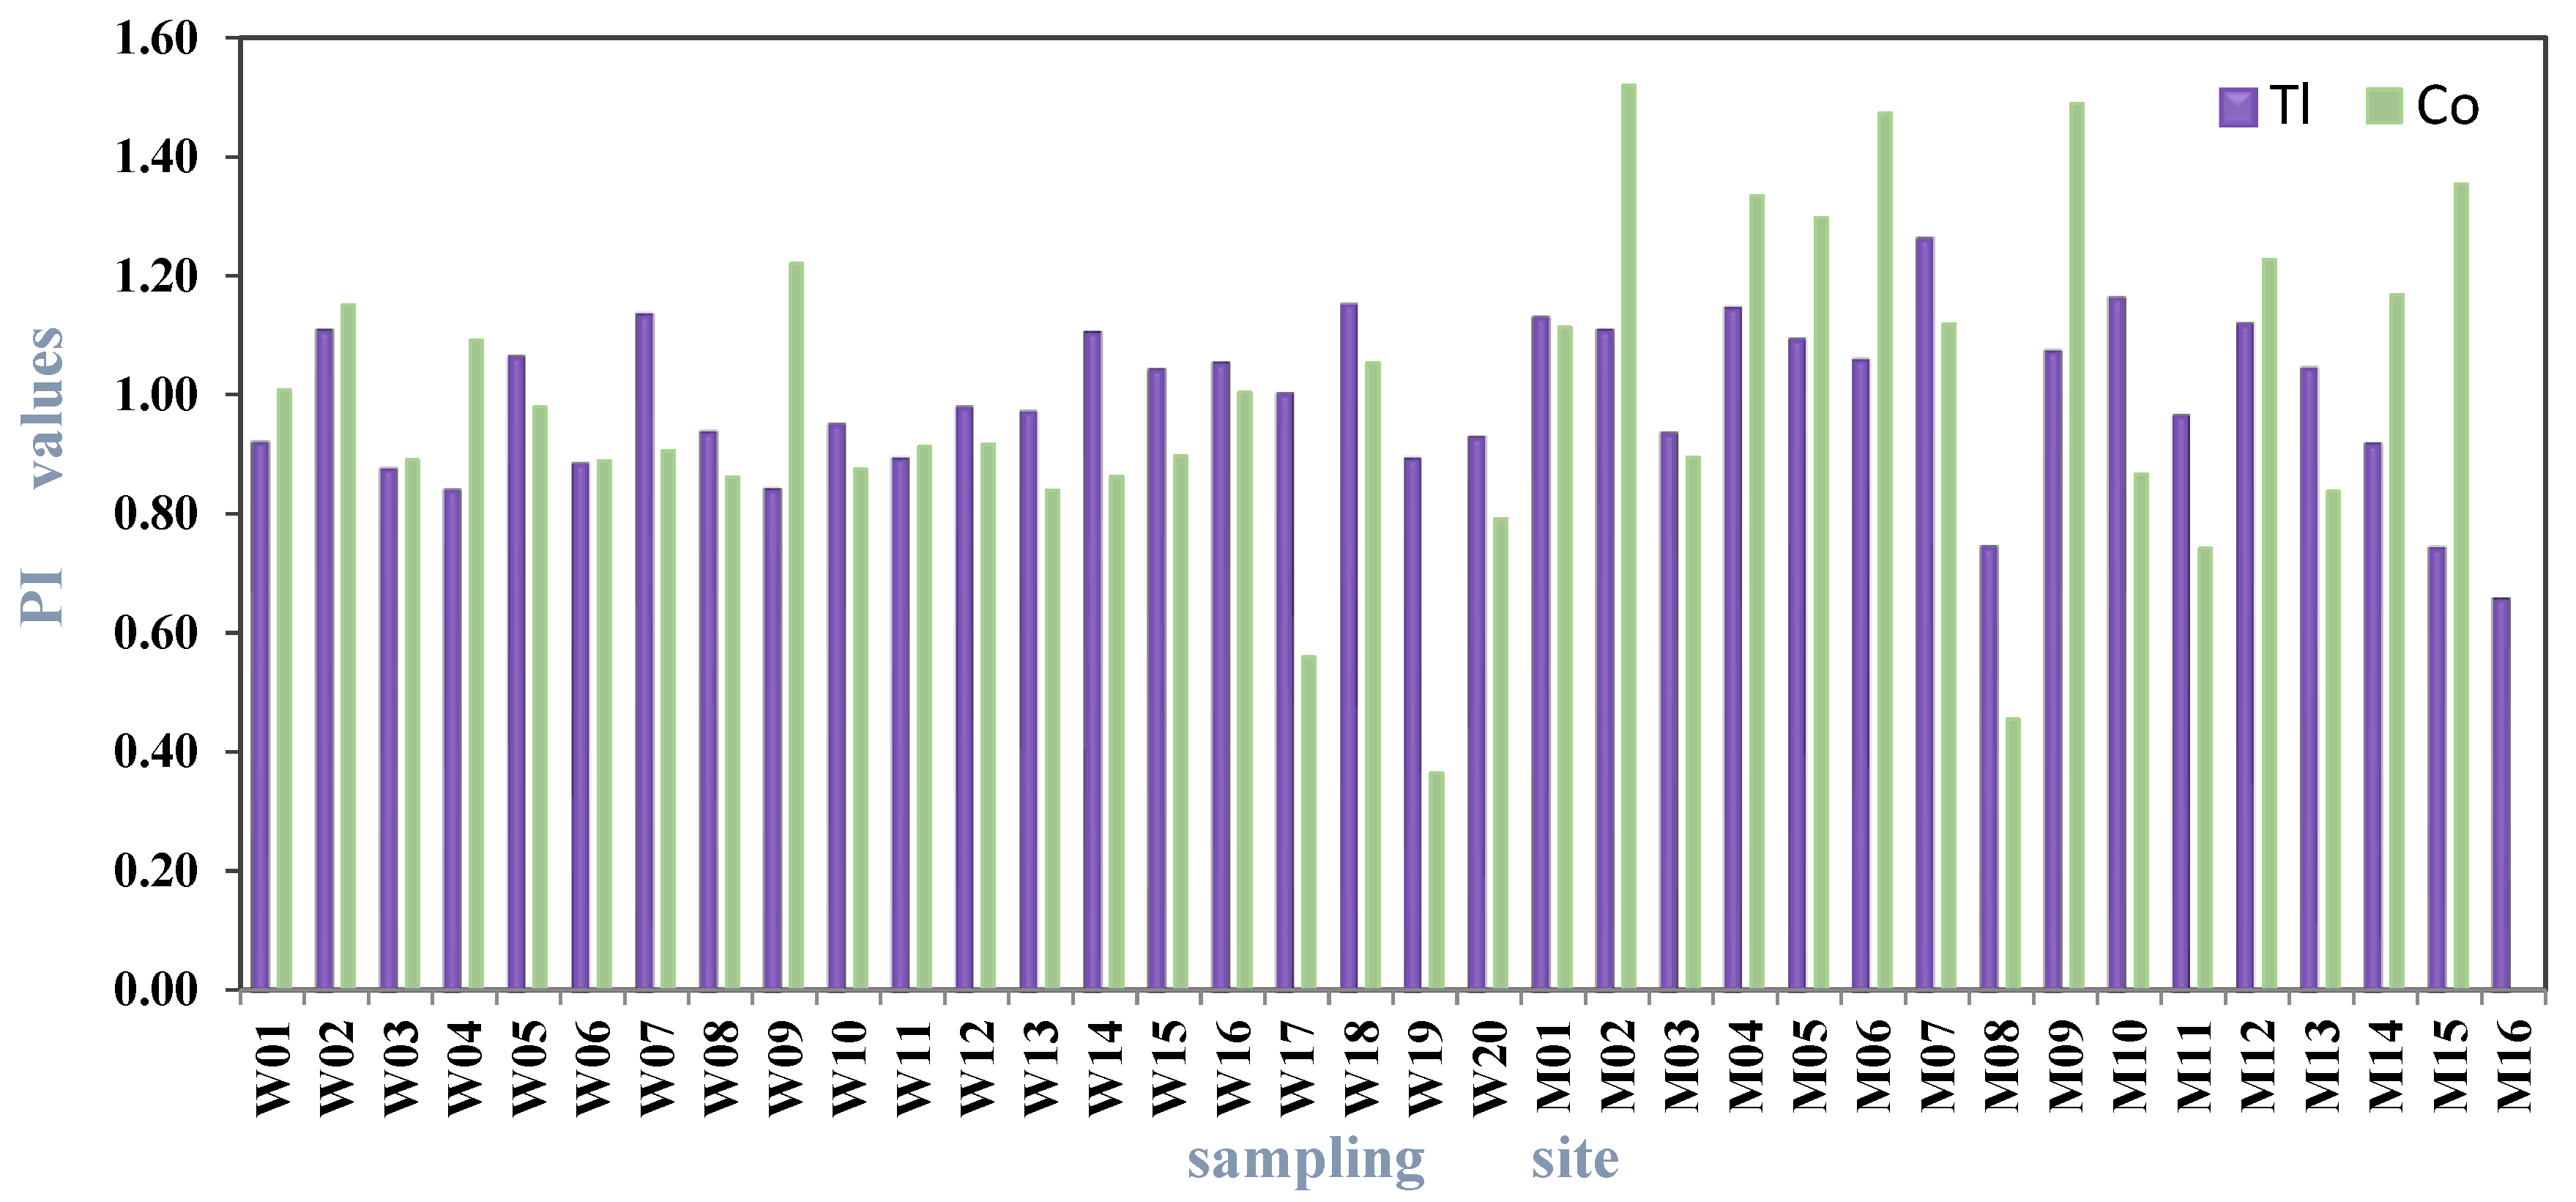
The PI values for Tl and Co are shown in Table 3. For Tl, PI varied between 0.65 and 1.26, with a mean value of 0.99; the results suggest that 47.22% of sampling sites had minor Tl enrichment, and 52.78% had no contamination. The PI of Co varied between 0.36 and 1.52, with a mean value of 1.00. The results suggest that the study area has minor Co pollution. The distribution of PI values for Tl and Co is presented in Figure 5; contamination levels of Tl and Co were marginally different. The PI of Co in the surface sediments of Poyang Lake showed greater fluctuation, indicating that Co is more susceptible to anthropogenic discharge.
The potential ecological risk of metals is not only related to PI, but is also dependent on the toxic response factor (Tr). Considering the different toxicities of the contaminants to organisms, Er and RI were adopted to comprehensively assess the potential ecological risk resulting from Tl and Co. According to the Häkanson ecological risk assessment index, all sampling sites of Tl and Co exhibited a significantly low potential ecological risk. The results of Er ranged from 6.54 to 12.59 for Tl, with a mean value of 9.89; the maximum value was recorded at site M07. For Co, Er varied between 1.82 and 7.60, with a mean value was 4.99; the maximum value was recorded at site M02. All Er values for Tl and Co were below 40.00, and RI values were far less than 150. In consequence, all surface sediment sampling sites had a low potential ecological risk from Tl and Co.
4. Conclusions
This study presents the first analysis of Tl and Co in the surface sediments of Poyang Lake based on GBCs. The contents of Co were apparently higher than Tl; mean concentrations were 1.11 mg/kg for Tl and 15.42 mg/kg for Co. Spatially, Tl and Co showed different distribution patterns. For Tl, there was weak spatial variation across the study area. In contrast, Co concentrations in the surface sediments of Poyang Lake were significantly higher in the western lake than in the middle of the lake.
The GBCs of Tl and Co in Poyang Lake were 0.83–1.26 mg/kg and 6.95–19.73 mg/kg, respectively. Mean GBCs were similar to mean measured concentrations of Tl and Co in the lake, and both were higher than the BVs in local soils. For anthropogenic source analysis, we employed the GBCs; the mean contribution rate was 5.90% for Tl (ranging from 0.43 to 16.22%), and the mean contribution rate for Co was 13.01% (ranging from 0.82 to 31.59%). The results suggest that the Tl and Co in Poyang Lake mainly originate from natural sources, with only minor anthropogenic inputs.
Based on the GBCs established for Tl and Co in the surface sediments of Poyang Lake, the Igeo, PI, and Er were employed to estimate potential ecological risk. The contamination levels of Tl and Co in the surface sediments were found to be not polluted based on the Igeo, except for one sampling site. For PI, 47.22% of the sampling sites showed slight enrichment in Tl, and the whole study area showed slight enrichment in Co (mean PI value of 1.00). Based on Er, the potential ecological risk of Tl and Co was low. The use of GBCs was found to be a practical method for accurately assessing metal contamination in surface sediments and for creating rational strategies in water environment protection.
Author Contributions
B.G. and M.Z. designed the experiments; Y.L. and B.G. performed the experiment and wrote the paper; X.Q. and Y.Y. participated in the sampling collection. Y.L., M.Z. and W.P. analyzed the data and edited the paper.
Funding
This work was jointly supported by National Natural Science foundation of China (51439007), IWHR Research & Development Support Program (WE0145B532017, WE0145B592017).
Acknowledgments
We appreciate the anonymous reviewers for their valuable comments and efforts to improve this manuscript.
Conflicts of Interest
The authors declare no conflicts of interest
References
- Cobbina, S.J.; Chen, Y.; Zhou, Z.; Wu, X.; Zhao, T.; Zhang, Z.; Feng, W.; Wang, W.; Li, Q.; Wu, X. Toxicity assessment due to sub-chronic exposure to individual and mixtures of four toxic heavy metals. J. Hazard. Mater. 2015, 294, 109–120. [Google Scholar] [CrossRef] [PubMed]
- Pejman, A.; Bidhendi, G.N.; Ardestani, M.; Saeedi, M.; Baghvand, A. A new index for assessing heavy metals contamination in sediments: A case study. Ecol. Indic. 2015, 58, 365–373. [Google Scholar] [CrossRef]
- Peng, J.F.; Song, Y.H.; Yuan, P.; Cui, X.Y.; Qiu, G.L. The remediation of heavy metals contaminated sediment. J. Hazard. Mater. 2009, 161, 633–640. [Google Scholar] [CrossRef] [PubMed]
- Yi, Y.; Yang, Z.; Zhang, S. Ecological risk assessment of heavy metals in sediment and human health risk assessment of heavy metals in fishes in the middle and lower reaches of the Yangtze River basin. Environ. Pollut. 2011, 159, 2575–2585. [Google Scholar] [CrossRef] [PubMed]
- Zhang, C.; Yu, Z.G.; Zeng, G.M.; Jiang, M.; Yang, Z.Z.; Cui, F.; Zhu, M.; Shen, L.; Hu, L. Effects of sediment geochemical properties on heavy metal bioavailability. Environ. Int. 2014, 73, 270–281. [Google Scholar] [CrossRef] [PubMed]
- Ahmad, N.I.; Noh, M.F.; Mahiyuddin, W.R.; Jaafar, H.; Ishak, I.; Azmi, W.N.; Veloo, Y.; Hairi, M.H. Mercury levels of marine fish commonly consumed in Peninsular Malaysia. Environ. Sci. Pollut. Res. 2015, 22, 3672–3686. [Google Scholar] [CrossRef] [PubMed]
- The United States Department of Health and Human Services (HHS); Public Health Service (PHS); Agency for Toxic Substances Disease Registry (ATSDR). Toxicological Profile for Cobalt; Astdr Toxicological Profile: Atlanta, GA, USA, 2004. [Google Scholar]
- Peter, A.L.J.; Viraraghavan, T. Thallium: A review of public health and environmental concerns. Environ. Int. 2005, 31, 493–501. [Google Scholar] [CrossRef] [PubMed]
- Suh, M.; Thompson, C.M.; Brorby, G.P.; Mittal, L.; Proctor, D.M. Inhalation cancer risk assessment of cobalt metal. Regul. Toxicol. Pharmacol. 2016, 79, 74–82. [Google Scholar] [CrossRef] [PubMed]
- Gomez-Gonzalez, M.A.; Garcia-Guinea, J.; Laborda, F.; Garrido, F. Thallium occurrence and partitioning in soils and sediments affected by mining activities in Madrid province (Spain). Sci. Total Environ. 2015, 536, 268–278. [Google Scholar] [CrossRef] [PubMed] [Green Version]
- Liu, J.; Luo, X.; Wang, J.; Xiao, T.; Chen, D.; Sheng, G.; Yin, M.; Lippold, H.; Wang, C.; Chen, Y. Thallium contamination in arable soils and vegetables around a steel plant-A newly-found significant source of Tl pollution in South China. Environ. Pollut. 2017, 224, 445–453. [Google Scholar] [CrossRef] [PubMed]
- Strachan, S. Trace elements. Curr. Anaesth. Crit. Care 2010, 21, 44–48. [Google Scholar] [CrossRef]
- National Toxicology Program (NTP). Toxicology and Carcinogenesis Studies of Cobalt Metal (CAS No. 7440-48-4) in F344/N Rats and B6C3F1 Mice and Toxicology and Carcinogenesis Studies of Cobalt Metal (CAS No. 74 40-4 8-4) in F34 4/N Rats and B6C3F1/N Mice (Inhalation Studies); Peer Review Draft, Technical Report Series No. 581, NIH Publication No. 14-5923; U.S. Department of Health and Human Services, Public Health Service, National Institutes of Health: Research Triangle Park, NC, USA, 2014.
- Behl, M.; Stout, M.D.; Herbert, R.A.; Dill, J.A.; Baker, G.L.; Hayden, B.K.; Roycroft, J.H.; Bucher, J.R.; Hooth, M.J. Comparative toxicity and carcinogenicity of soluble and insoluble cobalt compounds. Toxicology 2015, 333, 195–205. [Google Scholar] [CrossRef] [PubMed]
- Keith, I.H.; Telliard, W.A. Priority pollutants: I. A Perspective View. Environ. Sci. Technol. 1979, 13, 416–423. [Google Scholar] [CrossRef]
- Xiao, T.; Yang, F.; Li, S.H.; Zheng, B.S.; Ning, Z.P. Thallium pollution in China: A geo-environmental perspective. Sci. Total Environ. 2012, 421–422, 51–58. [Google Scholar] [CrossRef] [PubMed]
- Zhou, D.X.; Liu, D.N. Chronic thallium poisoning in a rural area of Guizhou Province, China. J. Environ. Health 1985, 48, 14–18. [Google Scholar]
- Xinhua News Agency. Production Suspended at S China Smeltery as Thallium Contamination Detected. Available online: http://en.people.cn/90001/90776/90882/7174483.html (accessed on 22 October 2010).
- Han, L.F.; Gao, B.; Zhou, H.D.; Xu, D.Y.; Wei, X.; Gao, L. The spatial distribution, accumulation and potential source of seldom monitored trace elements insediments of Thre Gorges Reservoir, China. Sci. Rep. 2015, 5, 16170–16180. [Google Scholar] [CrossRef] [PubMed]
- Huang, J.C.; Qi, L.; Gao, J.; Kim, D.K. Risk assessment of hazardous materials loading into four large lakes in China: A new hydrodynamic indicator based on EFDC. Ecol. Indic. 2017, 80, 23–30. [Google Scholar] [CrossRef]
- Xie, Z.L.; Jiang, Y.H.; Zhang, H.; Wang, D.; Qi, S.H.; Du, Z.B.; Zhang, H. Assessing heavy metal contamination and ecological risk in Poyang Lake area, China. Environ. Earth Sci. 2016, 75, 549. [Google Scholar] [CrossRef]
- Zhang, H.; Jiang, Y.H.; Ding, M.J.; Xie, Z.L. Level, source identification, and risk analysis of heavy metal in surface sediments from river-lake ecosystems in the Poyang Lake, China. Environ. Sci. Pollut. Res. 2017, 24, 21902–21916. [Google Scholar] [CrossRef] [PubMed]
- Dai, L.; Wang, L.; Li, L.; Liang, T.; Zhang, Y.; Ma, C.; Xing, B. Multivariate geostatistical analysis and source identification of heavy metals in the sediment of Poyang Lake in China. Sci. Total Environ. 2018, 621, 1433–1444. [Google Scholar] [CrossRef] [PubMed]
- Ji, Y.; Zhang, J.; Li, R.H.; Pan, B.Z.; Zhang, L.W.; Chen, X. Distribution and partitioning of heavy metals in sediments of the Xinjiang River in Poyang Lake Region, China. Environ. Prog. Sustain. 2015, 34, 713–723. [Google Scholar] [CrossRef]
- Chen, H.Y.; Chen, R.H.; Teng, Y.G.; Jin, W. Contamination characteristics, ecological risk and source identification of trace metals in sediments of the Le’an River (China). Ecotoxicol. Environ. Saf. 2015, 125, 85–92. [Google Scholar] [CrossRef] [PubMed]
- Yuan, G.L.; Liu, C.; Chen, L.; Zhang, F.Y. Inputting history of heavy metals into the inland lake recorded in sediment profiles: Poyang Lake in China. Hazard. Mater. 2011, 185, 336–345. [Google Scholar] [CrossRef] [PubMed]
- Wang, H.; Zhao, Y.; Liang, D.F.; Deng, Y.Q.; Pang, Y. 30+ year evolution of Cu in the surface sediment of Lake Poyang, China. Chemosphere 2017, 168, 1604–1612. [Google Scholar] [CrossRef] [PubMed]
- Galán, E.; Fernández-Caliani, J.C.; González, I.; Aparicio, P.; Romero, A. Influence of geological setting on geochemical baselines of trace elements in soils. Application to soils of South–West Spain. J. Geochem. Explor. 2008, 98, 89–106. [Google Scholar]
- Tian, K.; Huang, B.; Xing, Z.; Hu, W. Geochemical baseline establishment and ecological risk evaluation of heavy metals in greenhouse soils from Dongtai, China. Ecol. Indic. 2017, 72, 510–520. [Google Scholar] [CrossRef]
- Salminen, R.; Tarvainen, T. The problem of defining geo-chemical baselines. A case study of selected elements andgeological materials in Finland. J. Geochem. Explor. 1997, 60, 91–98. [Google Scholar] [CrossRef]
- Zhang, W.Q.; Jin, X.; Di, Z.Z.; Zhu, X.L.; Shan, B.Q. Heavy metals in surface sediments of the shallow lakes in eastern China: Their relations with environmental factors and anthropogenic activities. Environ. Sci. Pollut. Res. 2016, 23, 25364–25373. [Google Scholar] [CrossRef] [PubMed]
- Covelli, S.; Fontolan, G. Application of a normalization procedure in determining regional geochemical baselines. Environ. Geol. 1997, 30, 34–44. [Google Scholar] [CrossRef]
- David, S.K.; Liang, Q.L. Landscape changes and increasing flood frequency in China’s Poyang Lake region. Prof. Geogr. 2010, 55, 434–445. [Google Scholar]
- Xu, D.Y.; Gao, B.; Gao, L.; Zhou, H.D.; Zhao, X.J.; Yin, S.H. Characteristics of cadmium remobilization in tributary sediments in Three Gorges Reservoir using chemical sequential extraction and DGT technology. Environ. Pollut. 2016, 218, 1094–1101. [Google Scholar] [CrossRef] [PubMed]
- Rice, K.C. Trace-element concentrations in streambed sediment across the conterminous United States. Environ. Sci. Technol. 1999, 33, 2499–2504. [Google Scholar] [CrossRef]
- Müller, G. Index of geoaccumulation in sediments of the rhine river. Geojournal 1969, 2, 108–118. [Google Scholar]
- Gao, B.; Zhou, H.D.; Yu, Y.; Wang, Y.C. Occurrence, distribution, and risk assessment of the metals in sediments and fish from the largest reservoir in China. RSC Adv. 2015, 5, 60322–60329. [Google Scholar] [CrossRef]
- Guo, W.; Huo, S.; Xi, B.; Zhang, J.; Wu, F. Heavy metal contamination in sediments from typical lakes in the five geographic regions of china: Distribution, bioavailability, and risk. Ecol. Eng. 2015, 81, 243–255. [Google Scholar] [CrossRef]
- Häkanson, L. An ecological risk index for aquatic pollution control. A sedimentological spproach. Water Res. 1980, 14, 975–1001. [Google Scholar]
- Liu, Y.; Wang, Q.; Zhuang, W.; Yuan, Y.L.; Yuan, Y.N.; Jiao, K.Q.; Wang, M.T.; Chen, Q. Calculation of Thallium’s toxicity coefficient in the evaluation of potential ecological risk index: A case study. Chemosphere 2017, 194, 562–569. [Google Scholar] [CrossRef] [PubMed]
- Chi, Q.H.; Yan, M.C. Handbook of Elemental Abundance for Applied Geochemistry; Geological Publishing House: Beijing, China, 2007. (In Chinese) [Google Scholar]
- Cheng, H.X.; Li, K.; Li, M.; Yang, K.; Liu, F.; Cheng, X.M. Geochemical bacground and baseline value of chemical elements in urban soil in China. Earth Sci. Front. 2014, 21, 265–306. (In Chinese) [Google Scholar]
- China National Environmental Monitoring Center (CNEMC). The Backgrounds of Soil Environment in China; Environmental Science Press of China: Beijing, China, 1990. (In Chinese) [Google Scholar]
- Feng, L.; Hu, C.; Chen, X.; Zhao, X. Dramatic inundation changes of China’s two largest freshwater lakes linked to the Three Gorges Dam. Environ. Sci. Technol. 2013, 47, 9628–9634. [Google Scholar] [CrossRef] [PubMed]
- He, W.; Bai, Z.L.; Liu, W.X.; Kong, X.Z.; Yang, B.; Yang, C.; Jørgensen, S.E.; Xu, F.L. Occurrence, spatial distribution, sources, and risks of polychlorinated biphenyls and heavy metals in surface sediments from a large eutrophic Chinese lake (Lake Chaohu). Environ. Sci. Pollut. Res. 2016, 23, 10335–10348. [Google Scholar] [CrossRef] [PubMed]
- Wang, C.; Zeng, X.Y.; Yu, Z.Q.; Sheng, G.Y.; Fu, J.M. Distribution and risk assessment of thallium and other metals in sediments from Hengyang Section of Xiangjiang River. Asian J. Ecotoxicol. 2013, 8, 16–22. (In Chinese) [Google Scholar]
- Gao, B.; Sun, K.; Ren, M.Z.; Liang, X.R.; Peng, P.A.; Sheng, G.Y.; Fu, J.M. Ecological risk assessment of thallium pollution in the surface sediment of Beijiang River. Ecol. Environ. 2007, 17, 528–532. (In Chinese) [Google Scholar]
- Zhuang, W.; Gao, X. Distribution, enrichment and sources of thallium in thesurface sediments of the southwestern coastal Laizhou Bay, Bohai Sea. Mar. Pollut. Bull. 2015, 96, 502–507. [Google Scholar] [CrossRef] [PubMed]
Figure 1.
Sampling sites in Poyang Lake, China.

Figure 2.
Tl and Co concentrations in the surface sediments of Poyang Lake. (a) The spatial pattern of Tl in the study area; (b) the spatial pattern of Co in the study area.
Figure 2.
Tl and Co concentrations in the surface sediments of Poyang Lake. (a) The spatial pattern of Tl in the study area; (b) the spatial pattern of Co in the study area.

Figure 3.
Normalization analysis and geochemical baselines for Tl and Co. (a) The linear regression analysis between Tl and Li; (b) The linear regression analysis between Co and Li; (c) The geochemical baseline for Tl; (d) The geochemical baseline for Co.
Figure 3.
Normalization analysis and geochemical baselines for Tl and Co. (a) The linear regression analysis between Tl and Li; (b) The linear regression analysis between Co and Li; (c) The geochemical baseline for Tl; (d) The geochemical baseline for Co.

Figure 4.
Anthropogenic contribution rate of Tl and Co at each sampling site.

Figure 5.
Single pollution indices (PI) based on geochemical baseline concentrations (GBCs) for each sampling site.
Figure 5.
Single pollution indices (PI) based on geochemical baseline concentrations (GBCs) for each sampling site.


Table 1.
Concentrations of Tl and Co in the surface sediments of Poyang Lake (unit: mg/kg).
| Statistics | Tl | Co | Reference | ||
|---|---|---|---|---|---|
| Measured concentration | Min | 0.73 | 5.62 | this study | |
| Max | 1.41 | 23.48 | this study | ||
| Mean | 1.11 | 15.42 | this study | ||
| S.D. | 0.15 | 4.09 | this study | ||
| RSD % | 13.61 | 26.49 | this study | ||
| BVs | Sediment | Yangtze River | 0.49 | 17.00 | [41] |
| Yellow River | 0.45 | 9.00 | [41] | ||
| China | / | 12.00 | [41] | ||
| Soil | Nanchang | 0.80 | 13.00 | [42] | |
| Jiangxi | 0.88 | 11.50 | [43] | ||
| China | 0.62 | 12.70 | [43] | ||
Table 2.
Mean concentrations of Tl and Co in other literature (unit: mg/kg).
| Location | Tl | Co | Reference | ||
|---|---|---|---|---|---|
| Sediment | Poyang Lake | 1.11 ± 0.15 | 15.42 ± 4.09 | this study | |
| / | 12.84 | [21] | |||
| 0.86 | 11.53 | [22] | |||
| Three Gorges Reservoir | summer | 0.75 | 18.54 | [19] | |
| winter | 0.67 | 21.47 | |||
| Chao Lake | 0.65 | 10.67 | [45] | ||
| Xiang Jiang River, Hengyang section | 1.23 | 17.50 | [46] | ||
| Beijiang River | 1.67 | 9.90 | [47] | ||
| Laizhou Bay, Bohai | 0.45 | / | [48] | ||
Table 3.
Assessment of Tl and Co in surface sediments of Poyang Lake using geochemical baseline concentrations (GBCs).
Table 3.
Assessment of Tl and Co in surface sediments of Poyang Lake using geochemical baseline concentrations (GBCs).
| Sampling Site | Tl | Co | ||||
|---|---|---|---|---|---|---|
| Igeo | PI | Er | Igeo | PI | Er | |
| W01 | −0.71 | 0.92 | 9.16 | −0.57 | 1.01 | 5.04 |
| W02 | −0.44 | 1.11 | 11.05 | −0.38 | 1.15 | 5.75 |
| W03 | −0.78 | 0.87 | 8.71 | −0.75 | 0.89 | 4.45 |
| W04 | −0.84 | 0.84 | 8.36 | −0.46 | 1.09 | 5.46 |
| W05 | −0.50 | 1.06 | 10.61 | −0.62 | 0.98 | 4.90 |
| W06 | −0.77 | 0.88 | 8.80 | −0.75 | 0.89 | 4.44 |
| W07 | −0.41 | 1.13 | 11.32 | −0.73 | 0.91 | 4.53 |
| W08 | −0.68 | 0.93 | 9.34 | −0.80 | 0.86 | 4.31 |
| W09 | −0.84 | 0.84 | 8.38 | −0.30 | 1.22 | 6.10 |
| W10 | −0.66 | 0.95 | 9.46 | −0.78 | 0.87 | 4.37 |
| W11 | −0.75 | 0.89 | 8.89 | −0.72 | 0.91 | 4.57 |
| W12 | −0.62 | 0.98 | 9.75 | −0.71 | 0.92 | 4.59 |
| W13 | −0.63 | 0.97 | 9.68 | −0.84 | 0.84 | 4.20 |
| W14 | −0.45 | 1.10 | 11.02 | −0.80 | 0.86 | 4.32 |
| W15 | −0.53 | 1.04 | 10.39 | −0.74 | 0.90 | 4.49 |
| W16 | −0.51 | 1.05 | 10.50 | −0.58 | 1.00 | 5.02 |
| W17 | −0.59 | 1.00 | 9.98 | −1.42 | 0.56 | 2.80 |
| W18 | −0.39 | 1.15 | 11.48 | −0.51 | 1.05 | 5.27 |
| W19 | −0.75 | 0.89 | 8.89 | −2.04 | 0.36 | 1.82 |
| W20 | −0.70 | 0.93 | 9.25 | −0.92 | 0.79 | 3.96 |
| M01 | −0.41 | 1.13 | 11.27 | −0.43 | 1.11 | 5.57 |
| M02 | −0.44 | 1.11 | 11.05 | 0.02 | 1.52 | 7.60 |
| M03 | −0.69 | 0.93 | 9.32 | 0.74 | 0.90 | 4.48 |
| M04 | −0.39 | 1.14 | 11.43 | −0.17 | 1.33 | 6.67 |
| M05 | −0.46 | 1.09 | 10.89 | −0.21 | 1.30 | 6.49 |
| M06 | −0.51 | 1.06 | 10.55 | −0.03 | 1.47 | 7.37 |
| M07 | −0.25 | 1.26 | 12.59 | −0.42 | 1.12 | 5.60 |
| M08 | −1.02 | 0.74 | 7.41 | −1.72 | 0.45 | 2.27 |
| M09 | −0.49 | 1.07 | 10.70 | −0.01 | 1.49 | 7.45 |
| M10 | −0.37 | 1.16 | 11.59 | −0.79 | 0.87 | 4.33 |
| M11 | −0.64 | 0.96 | 9.61 | −1.02 | 0.74 | 3.71 |
| M12 | −0.43 | 1.12 | 11.16 | −0.29 | 1.23 | 6.14 |
| M13 | −0.53 | 1.04 | 10.41 | −0.84 | 0.84 | 4.19 |
| M14 | −0.71 | 0.91 | 9.14 | −0.36 | 1.17 | 5.84 |
| M15 | −1.02 | 0.74 | 7.39 | −0.15 | 1.35 | 6.77 |
| M16 | −1.20 | 0.65 | 6.54 | −0.61 | 0.98 | 4.92 |
| Min | −1.20 | 0.65 | 6.54 | −2.04 | 0.36 | 1.82 |
| Max | −0.25 | 1.26 | 12.59 | 0.02 | 1.52 | 7.60 |
| Mean | −0.61 | 0.99 | 9.89 | −0.64 | 1.00 | 4.99 |
| S.D. | 0.21 | 0.13 | 1.35 | 0.43 | 0.26 | 1.32 |
© 2018 by the authors. Licensee MDPI, Basel, Switzerland. This article is an open access article distributed under the terms and conditions of the Creative Commons Attribution (CC BY) license (http://creativecommons.org/licenses/by/4.0/).
Share and Cite
MDPI and ACS Style
Li, Y.; Qu, X.; Zhang, M.; Peng, W.; Yu, Y.; Gao, B. Anthropogenic Impact and Ecological Risk Assessment of Thallium and Cobalt in Poyang Lake Using the Geochemical Baseline. Water 2018, 10, 1703. https://doi.org/10.3390/w10111703
AMA Style
Li Y, Qu X, Zhang M, Peng W, Yu Y, Gao B. Anthropogenic Impact and Ecological Risk Assessment of Thallium and Cobalt in Poyang Lake Using the Geochemical Baseline. Water. 2018; 10(11):1703. https://doi.org/10.3390/w10111703
Chicago/Turabian StyleLi, Yanyan, Xiaodong Qu, Min Zhang, Wenqi Peng, Yang Yu, and Bo Gao. 2018. "Anthropogenic Impact and Ecological Risk Assessment of Thallium and Cobalt in Poyang Lake Using the Geochemical Baseline" Water 10, no. 11: 1703. https://doi.org/10.3390/w10111703
Note that from the first issue of 2016, this journal uses article numbers instead of page numbers. See further details here.