Article

Flow Regime and Nutrient-Loading Trends from the Largest South European Watersheds: Implications for the Productivity of Mediterranean and Black Sea’s Coastal Areas

1
CNR—ISMAR Marine Science Institute, 34149 Trieste, Italy
2
IRTA—Aquatic Ecosystems Program, Sant Carles de la Ràpita, 43540 Catalunya, Spain
3
NIMRD—National Institute for Marine Research and Development, 900581 Constanța, Romania
4
Aix Marseille Université, CNRS/INSU, Université de Toulon, IRD, Mediterranean Institute of Oceanography (MIO), 13288 Marseille, France
5
OGS—Istituto Nazionale di Oceanografia e di Geofisica Sperimentale, 34151 Trieste, Italy
*
Author to whom correspondence should be addressed.
Water 2019, 11(1), 1; https://doi.org/10.3390/w11010001
Submission received: 14 November 2018 / Revised: 7 December 2018 / Accepted: 12 December 2018 / Published: 20 December 2018
(This article belongs to the Special Issue Environmental Flows, Ecological Quality and Ecosystem Services)

Abstract

:
In the last century, large watersheds in Southern Europe have been impacted by a combination of anthropogenic and climatic pressures, which have rapidly evolved to change the ecological status of freshwater and coastal systems. A comparative analysis was performed for Ebro, Rhône, Po and Danube rivers, to investigate if they exhibited differential dynamics in hydrology and water quality that can be linked to specific human and natural forces acting at sub-continental scales. Flow regime series were analyzed from daily to multi-decadal scales, considering frequency distributions, trends (Mann–Kendall and Sen tests) and discontinuities (SRSD Method). River loads of suspended matter, nutrients and organic matter and the eutrophication potential of river nutrients were estimated to assess the impact of river loads on adjacent coastal areas. The decline of freshwater resources largely impacted the Ebro watershed on annual (−0.139 km3 yr−1) and seasonal (−0.4% yr−1) scales. In the other rivers, only spring–summer showed significant decreases of the runoff coupled to an exacerbated flow variability (0.1–0.3% yr−1), which suggested the presence of an enhanced regional climatic instability. Discontinuities in annual runoff series (every 20–30 years) indicated a similar long-term evolution of Rhône and Po rivers, differently from Ebro and Danube. Higher nutrient concentrations in the Ebro and Po (+50%) compared to Rhône and Danube and distinct stoichiometric nutrient ratios may exert specific impacts on the growth of plankton biomass in coastal areas. The overall decline of inorganic phosphorus in the Rhône and Po (since the 1980s) and the Ebro and Danube (since the 1990s) mitigated the eutrophication in coastal ecosystems inducing, however, a phase in which the role of organic phosphorus loads (Po > Danube > Rhône > Ebro) on coastal productivity could be more relevant. Overall, the study showed that the largest South European watersheds are differently impacted by anthropogenic and climatic forces and that this will influence their vulnerability to future changes of flow regime and water quality.

Graphical Abstract

1. Introduction

Over the past half of the century, anthropogenic activities have largely impacted freshwater and coastal ecosystems, changing river loads of suspended matter, nutrients, organic matter and causing the mobilization of a variety of human-derived chemicals from the land to receiving water bodies. The increase of river nutrient loads, besides sustaining the productivity of large marine regions, have caused widespread eutrophication and changes in the structure of fluvial, estuarine and marine food webs [1,2,3,4,5]. High freshwater and nutrient loads enhance the stratification of the water column and the accumulation of algal biomass in estuaries and coastal areas, frequently leading to hypoxic conditions that cause the degradation of pelagic and benthic habitats [6,7,8,9,10,11,12]. Harmful algal blooms can be promoted by high nutrient loads or by altered nutrient ratios, with negative consequences for marine fauna and human health [6,7]. The delivery of terrestrial organic matter to the coastal zones, in combination to the enrichment of nutrients, can affect the growth of marine bacteria [13,14]. Pulsed or reduced inputs of suspended particulate modify the morphology of deltas, coasts and bottom sediments [15,16,17]. All these alterations have been linked to changes in abundance and structure of pelagic and benthic communities, mass mortality events and jellyfish proliferation.
The Mediterranean and Black Sea are the largest semi-enclosed marine basins on the Earth, in which the effects of river discharges can be assessed [6,18,19,20]. The current river inputs of total nitrogen, phosphorus and dissolved silica to the Mediterranean (1077 kt-N yr−1, 49 kt-P yr−1, 1028 kt-Si yr−1) are similar to those to the Black Sea (1116 kt-N yr−1, 55 kt-P yr−1, 861 kt-Si yr−1), which is a basin ≈ 5 times smaller than the Mediterranean one, but surrounded by a large drainage region [21]. For comparison, the Mediterranean Sea exports through the Gibraltar Strait nitrate and phosphate respectively at 1947 kt-N yr−1 and 147 kt-P yr−1 [22] and it receives them from the atmosphere as a bulk deposition at 1246 kt-N yr−1 and 34 kt-P yr−1 [18].
In Southern Europe, river nutrient discharge has increased during the last century, because of the growth of industrial and urban settlements and the introduction of intensive practices in livestock farming and agriculture, causing problems of eutrophication in the receiving coastal zones. This process has occurred mostly in 1960–1980, being it afterwards partially mitigated by stricter environmental policies [23,24,25]. For this reason, several environmental studies were focused on specific drainage basins e.g., [4,26,27,28,29] and on their impacts in the adjacent coastal zones e.g., [6,9,10,11,30,31].
However, the differences at regional scale in river water and nutrient loads and in the responses of fluvial, estuarine and coastal ecosystems are still poorly investigated in Southern Europe, due to the inhomogeneous availability of long-term datasets covering multiple watersheds. Comparative studies are of basic importance as drainage and coastal systems can experience divergent evolutions, even in the presence of common anthropogenic impacts, if they are subjected to climatic conditions with distinct meso-scale features [32]. The combination of anthropogenic and natural pressures can induce in these ecosystems specific hydrological and biogeochemical transformations at highly variable spatial and temporal scales [30,33,34,35]. For example, comparative studies showed a more pronounced shift toward dry climatic conditions in the Ebro basin with respect to Adige and Sava basins [36]. A recent common trend towards pluvial-torrential regimes was observed for the Rhône, Po and Danube, with a higher runoff in early spring originated by snowmelt in the mountainous areas [37]. Differences in the extension of drainage basins were found to affect annual and seasonal loads of water and nutrient in some rivers in the W Mediterranean [25].
In this study, a comparative analysis of the discharges of freshwater, suspended matter, nutrients and organic matter to the sea of the four most important South European watersheds (Ebro, Rhône, Po and Danube), from daily to decadal scales, is performed through the compilation of an extended dataset and a harmonized data analysis (Figure 1). The impacts of the changes in river loadings on fluvial and coastal ecosystems is also discussed through the estimate of the eutrophication potential of river nutrients in the coastal zones and through a meta-analysis of the available literature. The aim is to compare the evolution of flow regime in South European watersheds, since existing literature either includes specific studies focused on single drainage basins or global analysis, in order to investigate how the hydrology and water quality (nutrients) can be linked to specific anthropogenic pressures and climatic conditions acting at a regional scale, and to infer the current role that flow regime exerts on the productivity of the coastal ecosystems.

2. Materials and Methods

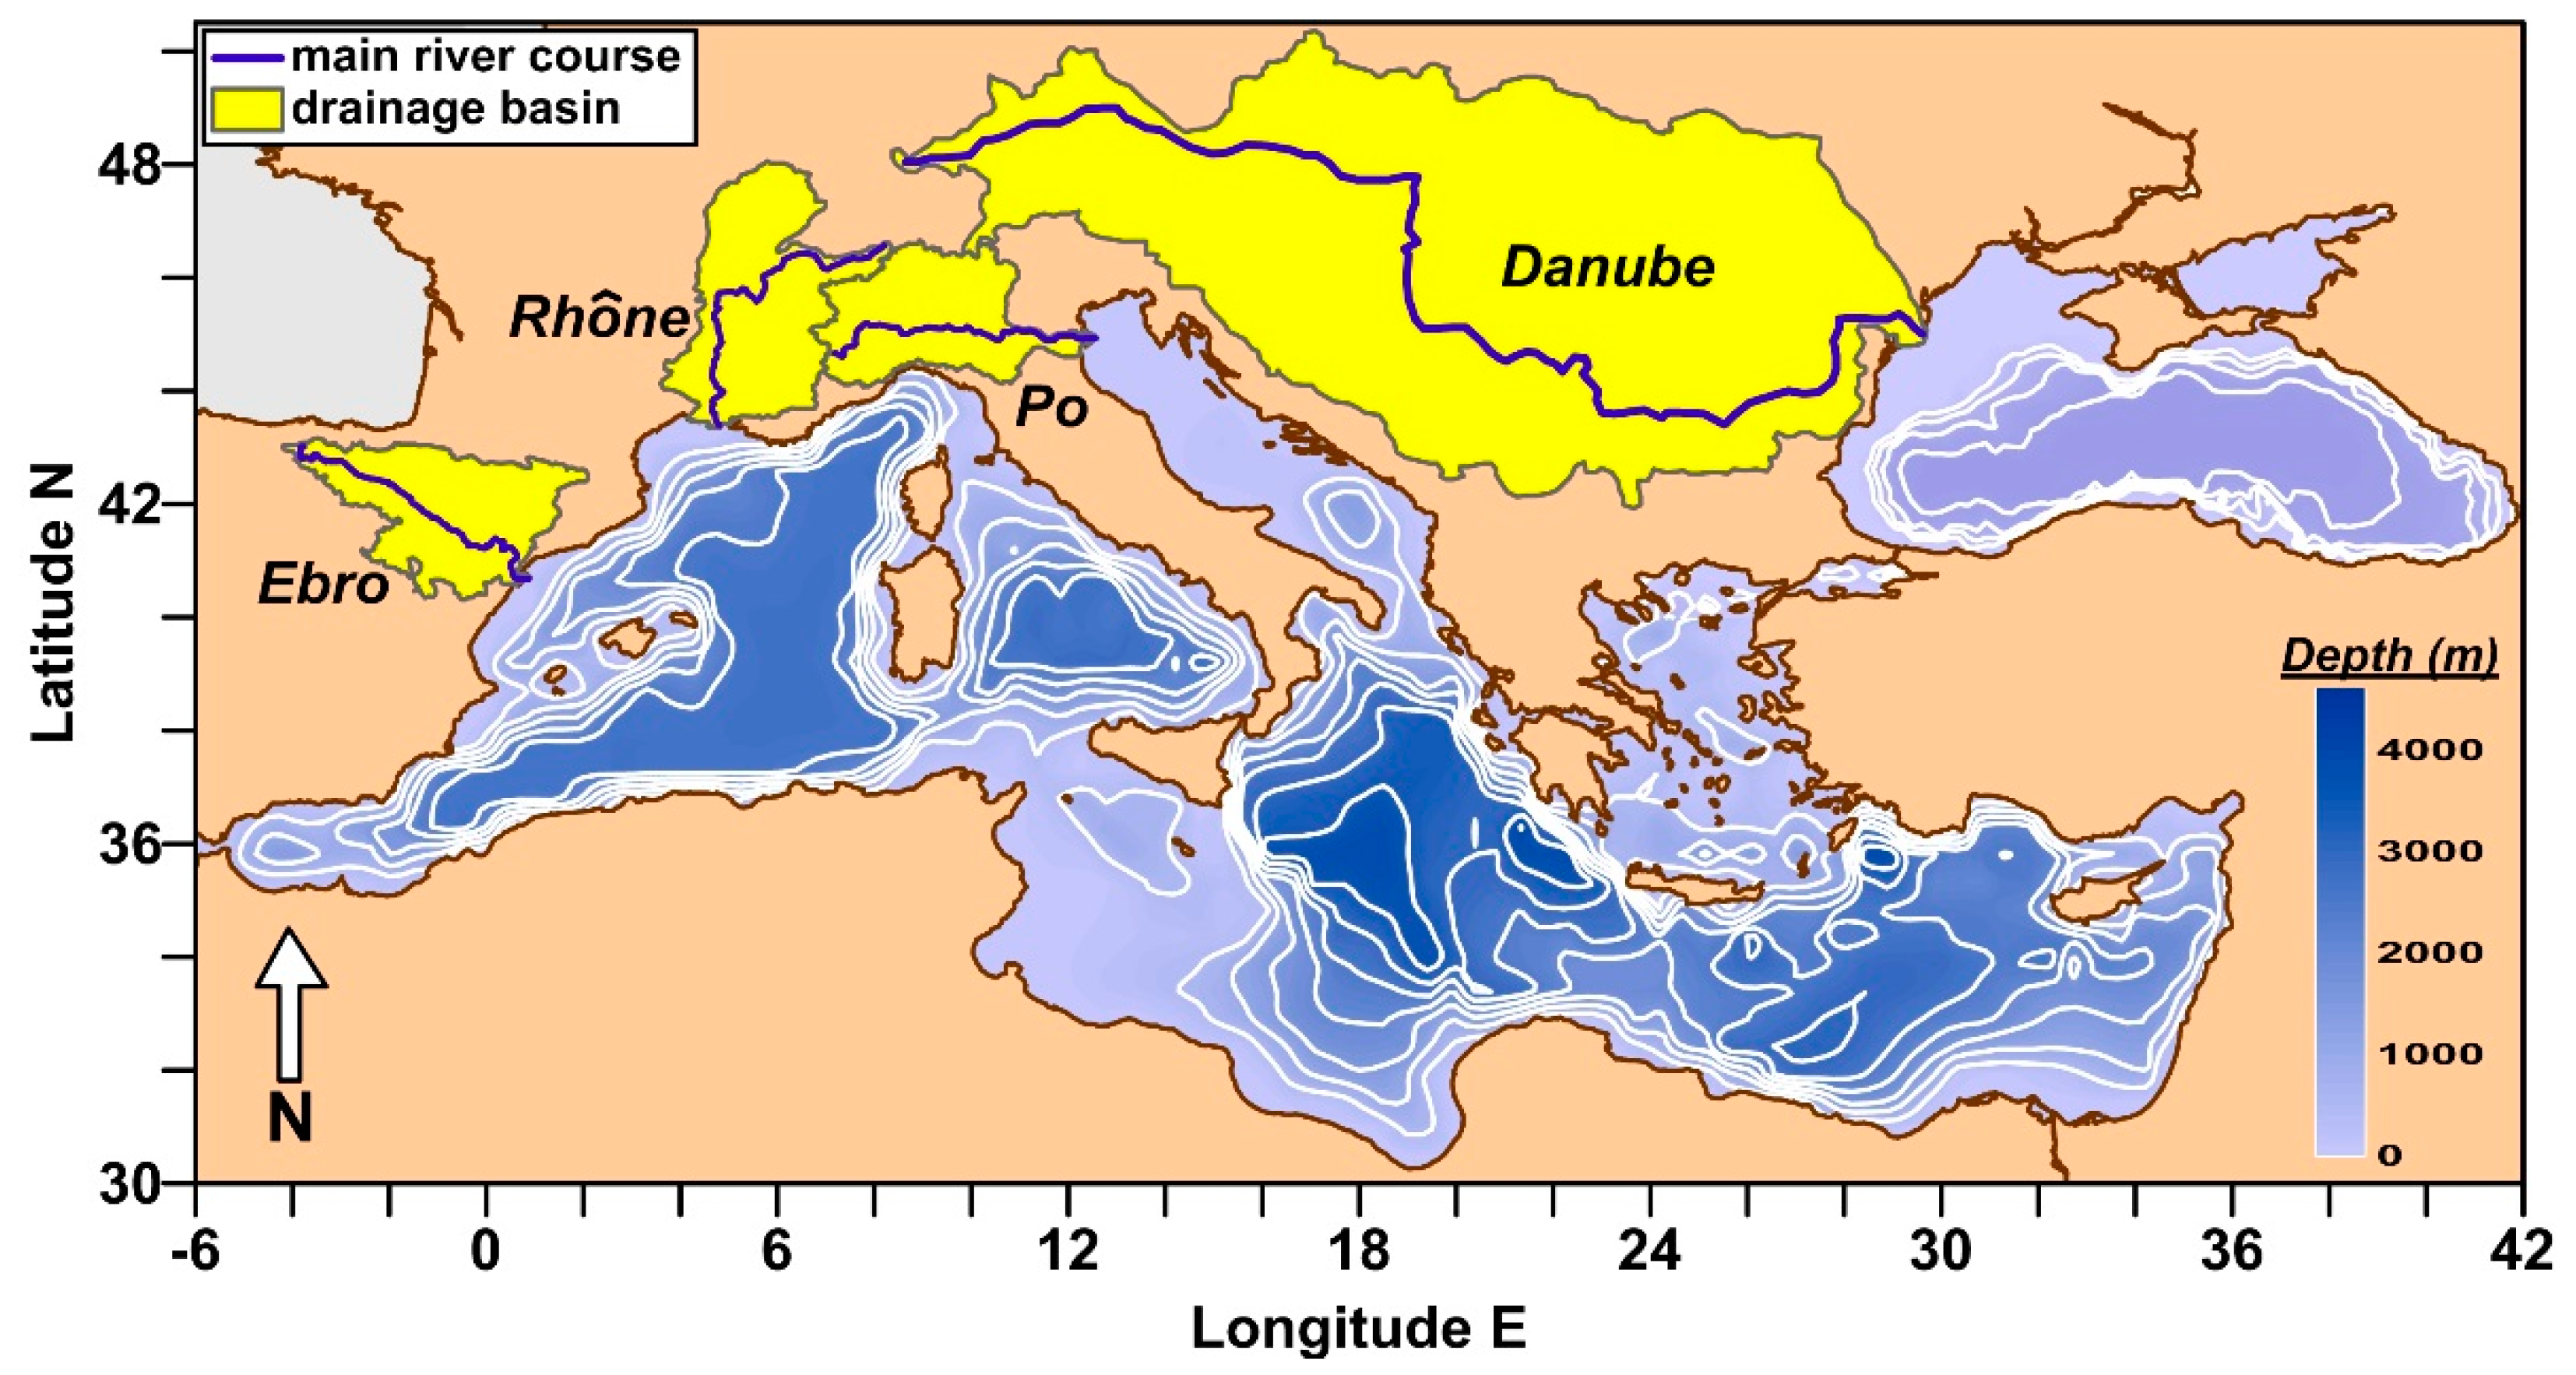
2.1. Geographical Settings of River Basins

The Ebro is the largest river in the Iberian Peninsula draining to the Mediterranean Sea, and it has a watershed surrounded by the mountainous areas of Cantabrian Range, Pyrenees, Iberian Massif and parts of the Castillian “meseta” (Table 1). The river and the tributaries are subjected to a controlled flow, due to the presence of several dams and irrigation canals mostly built in 1920–1980 for farming and hydropower generation purposes. The last dam along the main river course in Ribarroja (100 km upstream the river mouth) controls the flow of the lower Ebro [38]. Agriculture covers ≈ 50% of the Ebro basin and it is the main source for nitrate inputs, whereas urban and industrial activities are the most important sources for phosphate inputs [36,39,40]. A long-term decrease of the runoff has characterized this river since the 1960s, whereas a decline of phosphate and ammonium was detected since the 1990s. This process caused a re-oligotrophication of the fluvial ecosystem with the collapse of phytoplankton and the spread of macrophytes [4,27]. Changes in freshwater phytoplankton community were reported due to the regulation of the flow caused by dams and water reservoirs [41]. The decrease in TSM due to dam construction has been also dramatic, as much as 99%, with severe consequences on the erosion of the Ebro Delta [38].
The Rhône has its source in Switzerland and it has most of the drainage basin in mountainous areas of Alps, Jura, Cevennes and Vosges. This feature causes a large runoff compared to the river length, because of the contributions of snowmelt and rainfall [28]. Fifty kilometers upstream the mouth, the Rhône splits in two branches of “Grand Rhône” and “Petit Rhône”, which carry about 90% and 10% of the total flow, respectively. After the damming of the Nile in 1968, the Rhône has become the major source of freshwater in the Mediterranean [42]. This river is characterized by large loads of nitrogen and phosphorus, which has increased in the period 1970–1990 [43,44]. The environment of the lower Rhône has been largely modified by human activities, mostly since the 1970s, leading to a stronger regulation of the flow and an increase of nutrient inputs [45].
The Po is the largest river in Italy, with a drainage basin that hosts urban and industrial settlements and large areas devoted to intensive cropping and livestock activities [46]. As a consequence, nutrient transport by Po River is mainly of anthropogenic origin and it is due to rain-driven diffuse sources (20% for TN, 20% for TP), point sources (40% for TN, 80% for TP) and groundwater, springs and tributaries (40% for TN) [29,47]. Freshwater loads of the Po have shown a complex and partially unresolved long-term variability, which included strong multi-year oscillations [34] and a shift towards early spring peaks of the runoff [37]. A decoupling between the transport of dissolved and suspended elements was also observed during the floods. This phenomenon was due to the contrasting effects of water flow on erosion, groundwater, dilution and biological processes in the river environment [48].
The Danube is the largest river in Mediterranean and Black Seas and it is about three times longer than the other rivers considered in this study (Table 1). Its catchment covers 33% of the whole Black Sea drainage basin; it is shared by 19 highly industrialized countries and it hosts 82 million inhabitants [26]. The river has a large Delta (≈ 7000 km2) characterized by a moderate continental climate [16]. Since the early 1970s, the regime of the Danube has changed with respect to a previous more pristine condition, because of the construction of water reservoirs, dams and hydropower plants, which significantly regulated its flow [49]. In the period 1960–1990, nitrogen discharge from Danube basin has increased about five times whereas phosphate doubled due to the increase of anthropogenic inputs. During the most recent years, a reduction of nutrient loads was observed because of political and economic changes occurred in several eastern European countries [26].

2.2. River Flow Data

Daily flow rates (m3 s−1) were obtained from publications and databases maintained by river and government authorities. Gauging stations were selected on the basis of the availability of long-term data series and of their representativeness of total water discharge from the drainage basins, upstream of the partition of flows among the arms that can be encountered in the deltas.
Ebro River flows in 1913–1931 and in 1952–2012 (Tortosa station; 40.82° N, 0.51° E; 25 m AMSL) were published in the “Anuarios de Aforos” by Ministry of Agriculture, Food and Environment of Spain (URL: http://hercules.cedex.es/anuarioaforos/afo/). Rhône River flows in 1920–2012 (Beaucaire station; 43.79° N 4.65° E; 6 m AMSL) were provided by HYDRO data center (URL: http://www.hydro.eaufrance.fr/) of Ministry of Ecology, Sustainable Development and Energy of France. Po River flows in 1917–2012 (Pontelagoscuro station; 44.88° N, 11.60° E; 8 m AMSL) were published in the “Annali Idrologici” (URL: http://www.acq.isprambiente.it/annalipdf/) by Hydrographic and Mareographic National Service of Italy (SIMN) and by the Regional Environmental Protection Agency of Emilia Romagna (ARPA; URL: http://www.arpa.emr.it/). Danube River flows in 1931–2012 (Ceatal Izmail station; 45.18° N, 28.80° E; 1 m AMSL) were provided by the Global Runoff Data Center (GRDC; URL: http://www.bafg.de/GRDC/EN/) of the German Federal Institute of Hydrology.

2.3. Chemical Parameters

The concentrations of total suspended matter (TSM), nitrate (NO3), nitrite (NO2), ammonium (NH4+), reactive phosphorus (PO43−), reactive silicate (SiO2), total nitrogen (TN), total phosphorus (TP) and total organic carbon (TOC) in river waters were obtained by monitoring programs, research projects, water treatment companies and published datasets. These chemical data were mostly collected monthly or seasonally, but monthly average concentrations were calculated when a higher sampling resolution was available.
For the Ebro, chemical data at Tortosa station (1980–2011) were provided by Confederacion Hidrografica del Ebro (CHE; URL: http://www.chebro.es/) and by the Water Consortium of Tarragona (CAT). For the Rhône, chemical data (1980–2012) were provided by MOOSE Program (Mediterranean Oceanic Observing System for the Environment) at Arles station (43.67° N, 4.62° E, 4 m AMSL). This station is located in the main course of the Rhône, downstream the diffluence of the Petit Rhône. For the Po, chemical data (1969–2012) were obtained from the literature [34], from monitoring programs of environmental institutions (ARPA Emilia Romagna, ICRAM and IRSA) and from past research projects focused on Adriatic ecosystem (PRISMA and MAT). Po river data referred to three sampling stations (Pontelagoscuro, Polesella and Serravalle; 44.88–44.97° N, 11.60–12.04° E; 6–8 m AMSL) located on the main river course at the enclosure of the drainage basin, 45–90 km upstream the river mouth. For the Danube, nutrient data at Reni station (45.46° N, 28.25° E, 4 m AMSL) were provided by the International Commission for the Protection of the Danube River (ICPDR; URL: www.icpdr.org), except for SiO2 whose time series was obtained by NIMRD at Sulina station (45.15° N, 29.66° E, 2 m AMSL).
TSM was collected on membrane filters and determined by gravimetry. Nutrient concentrations were determined by standard colorimetric methods. TN and TP were determined in unfiltered samples by persulfate oxidation method followed by the colorimetric determinations of NO3 + NO2 and PO43−. TOC was determined by High Temperature Catalytic Oxidation method in unfiltered water samples. The concentration of dissolved inorganic nitrogen (DIN) was calculated as NO3 + NO2 + NH4+, whereas the concentrations of organic nitrogen (ON) and phosphorus (OP) in the dissolved and particulate pools were calculated as TN − DIN and TP − PO43−, respectively. The analytical methods used for the determination of these chemicals are outlined at the national level by different environmental regulations and they could have been partially changed during the period of study. However, chemical data analyzed here can be considered comparable to those applied in a wide range of environmental [50] and oceanographic [51] studies due to the high concentrations usually encountered in the river waters. The detection limits of these techniques applied to the analysis in river waters can be assumed as 1 mg L−1 for TSM, 0.1 μmol L−1 for NO3, 0.5 μmol L−1 for NH4+, 0.05 μmol L−1 for NO2, 0.03 μmol L−1 for PO43−, 1 μmol L−1 for SiO2, 1 μmol L−1 for TN, 0.3 μmol L−1 for TP.

2.4. Data Analysis

Variability and trends of river runoff were analyzed from daily to multi-decadal scales, in order to explore the complex dynamics that characterizes these watersheds. Daily flow distributions (m3 s−1) were analyzed in each river through the calculation their symmetry properties: mode (M0), moment coefficient of skewness (γ) and Kurtosis (β). These parameters represent respectively the most frequent value of the flow, a measure of the asymmetry of tailed distributions and an index of higher (β > 0) or lower (β < 0) weights of the outliers in the population data compared to a normal distribution (β = 0). The presence of annual cycles in river water discharges was evaluated through the nonparametric statistical analysis of monthly data series [52].
Significance and magnitude of long-term trends in the series of water discharges were assessed by Mann–Kendall test (MKT) and Sen’s test (ST). Mann–Kendall test is used to verify the significance of a monotonic change of a parameter over a selected period. The Sen’s test quantifies this change through the calculation of the slope of the linear interpolation model [53]. These tests were applied to the time series of annual water loads (km3 yr−1), monthly water loads (km3 month−1) and maximum flow variability in each month. Maximum flow variability was calculated as difference between the highest and lowest daily flows in each month and normalized as percentage ([Qmax − Qmin] × 100/Qmax; %).
The analysis of the trends was completed with that of the discontinuities in the series of annual water discharge, using SRSD method (Sequential Regime Shift Detector) [54]. This algorithm consists in a sequential application of the t-test to identify abrupt changes in the series and it allows their analysis avoiding a lower performance towards the end of the dataset.
Annual integrated river transport of TSM, nutrients, TN, TP and TOC (F; expressed in kt yr−1 of C, N, P and Si) was estimated using the equation based on discharge weighted means of daily loads:
F = [ i = 1 n ( C i Q i ) / i = 1 n Q i ] Q yr m A 10 9
where Ci and Qi are nutrient concentration (mol m−3) and flow (m3 s−1) for each day of sampling during the year (n ≥ 4), Qyr is the annual water discharge (m3 yr−1) and mA is the atomic mass of the element. This method allows the best estimate of river transport through the compensation of the biases originated by (i) the variability of flows encountered in concomitance of the samplings and by (ii) the different resolutions of chemical and flow data [23]. The statistical analysis of river nutrient loads was performed using the same nonparametric methods previously mentioned for freshwater loads.
The eutrophication potential of river nutrient loads in the coastal zones (EP; kt-C yr−1) was also estimated for all considered watersheds. It was calculated by annual river transports of N, P and Si, expressed as carbon biomass by Redfield’s model, using the ratios proposed for the Mediterranean Sea: C:N:P = 169:23.3:1 [55] and Si:N = 0.84 [56]. EP represents the fraction of new production of algal biomass potentially sustained, in the receiving coastal water bodies, by the delivery of nitrogen, phosphorus and silicon of riverine origin [2]. Despite it does not include other processes that supply new nutrients in the coastal zones (e.g., upwelling of deeper waters, wastewater loads, atmospheric deposition), as well as the regenerated production, this calculation highlights the role of the rivers to induce nitrogen or phosphorus limitations of the new production in the coastal zones and to favor (depress) the growth of non-siliceous algal species delivering large (scarce) quantities of both these nutrients compared to silicon. Moreover, considering the ability of several autotrophic plankton species to use organic phosphorus for their growth after enzymatic hydrolysis [57,58], the eutrophication potential of DIN was compared to both those of PO43− and TP.

3. Results

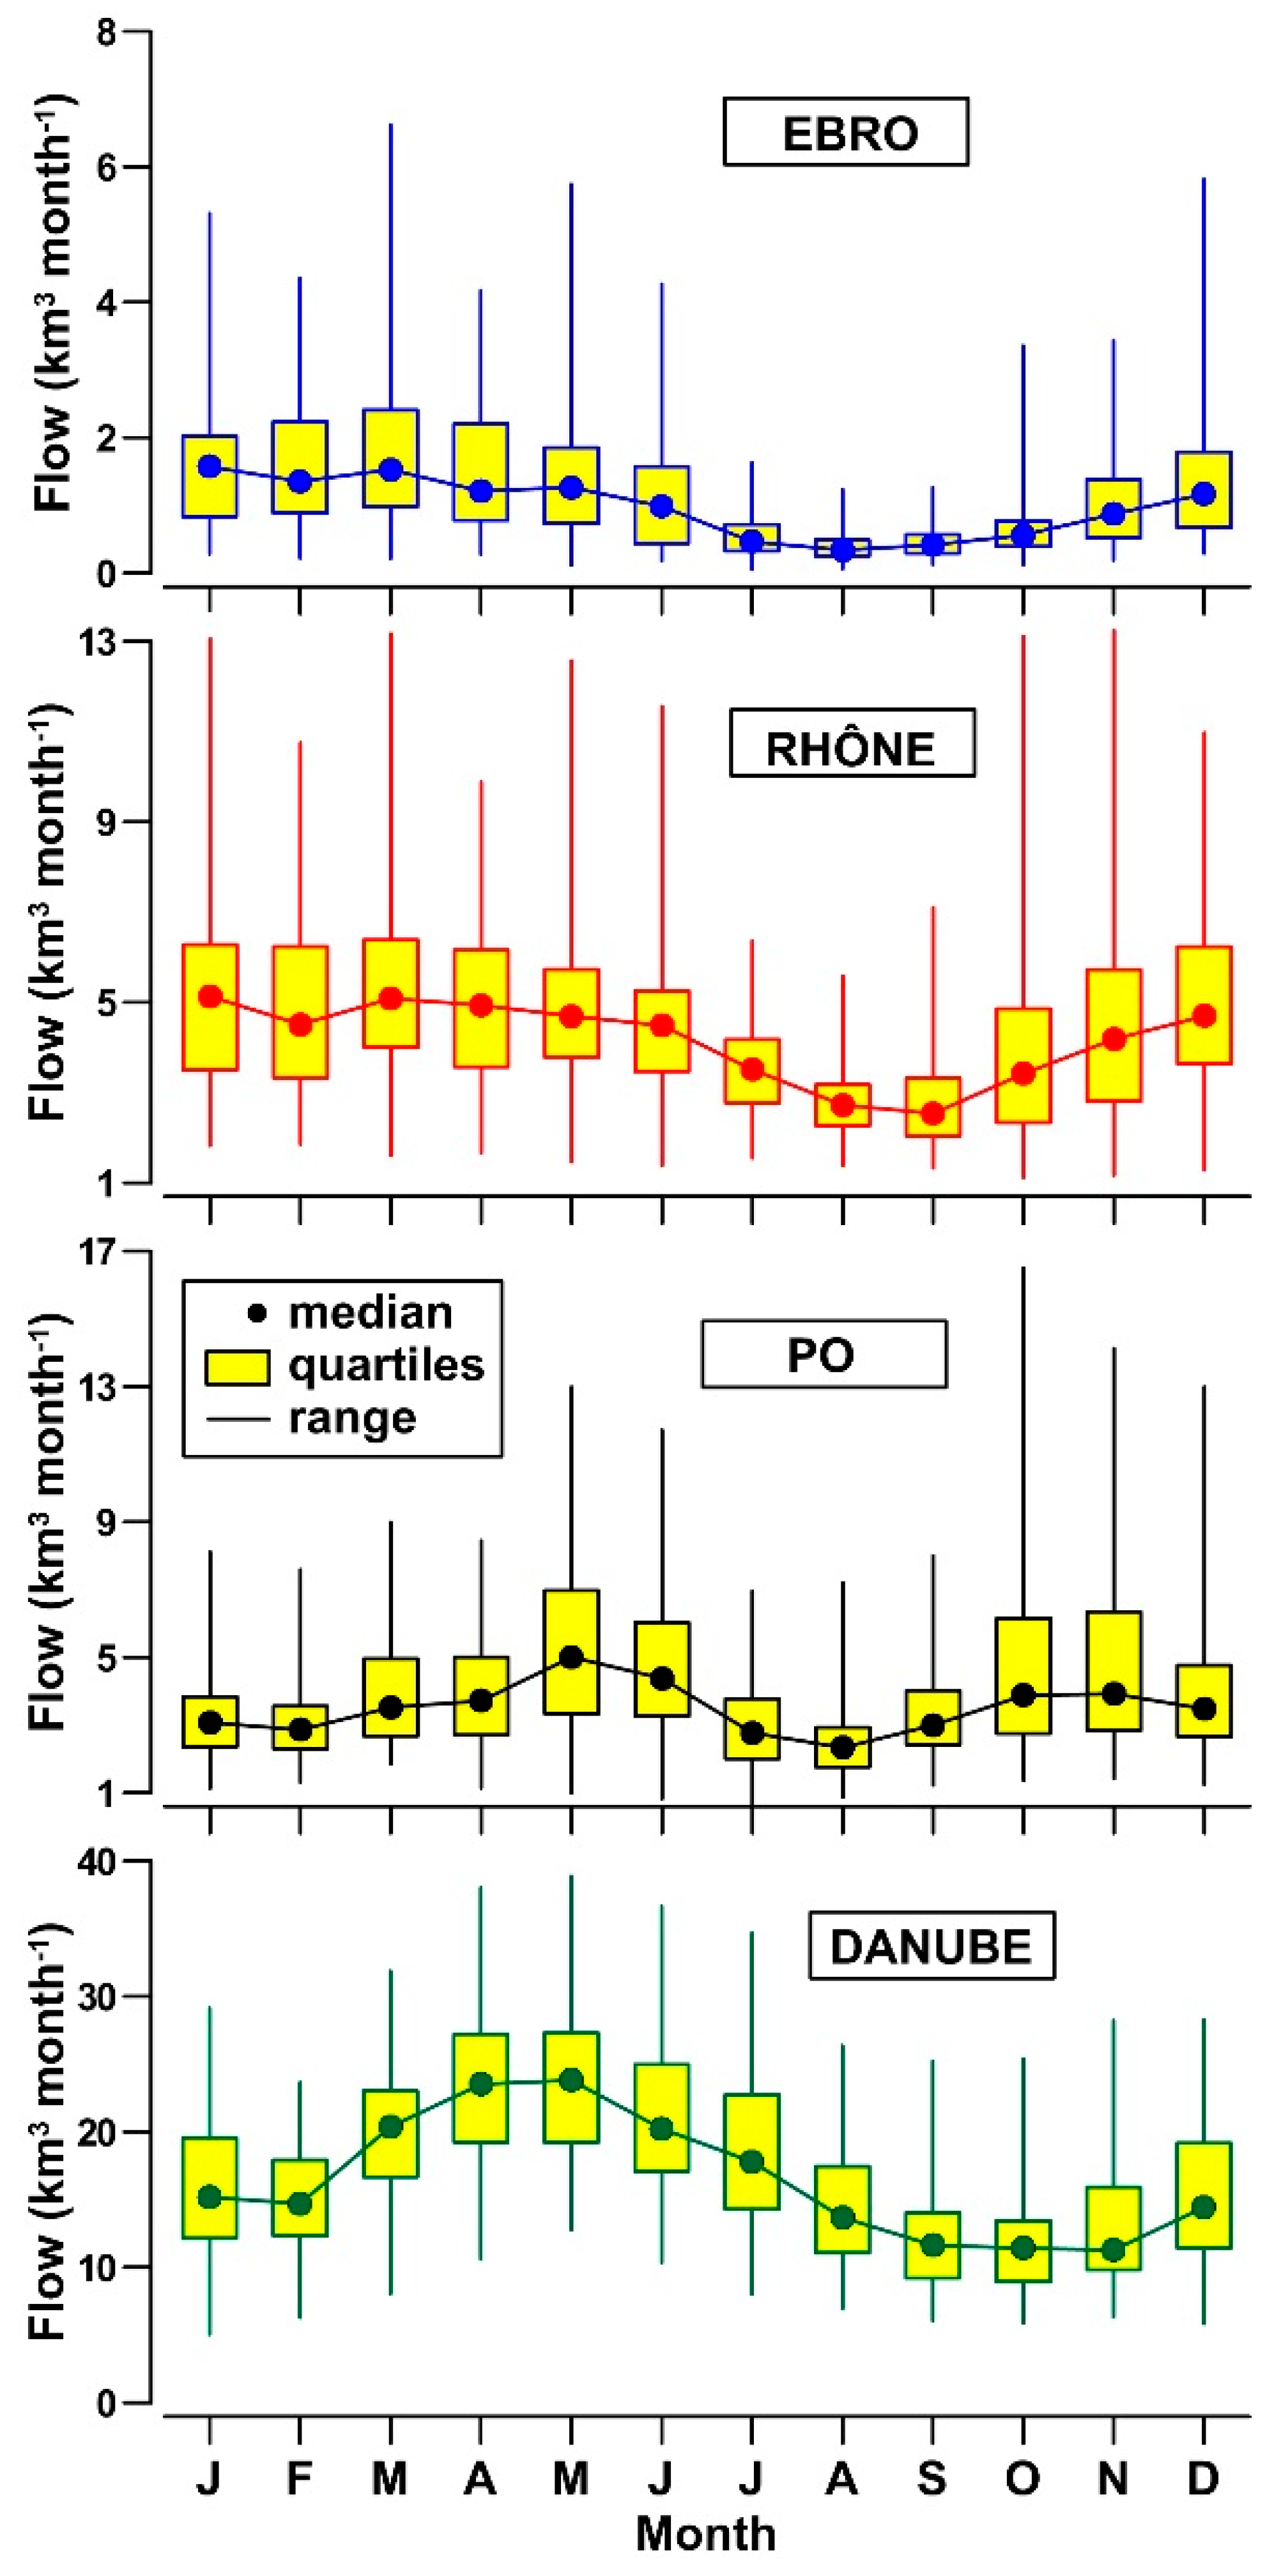
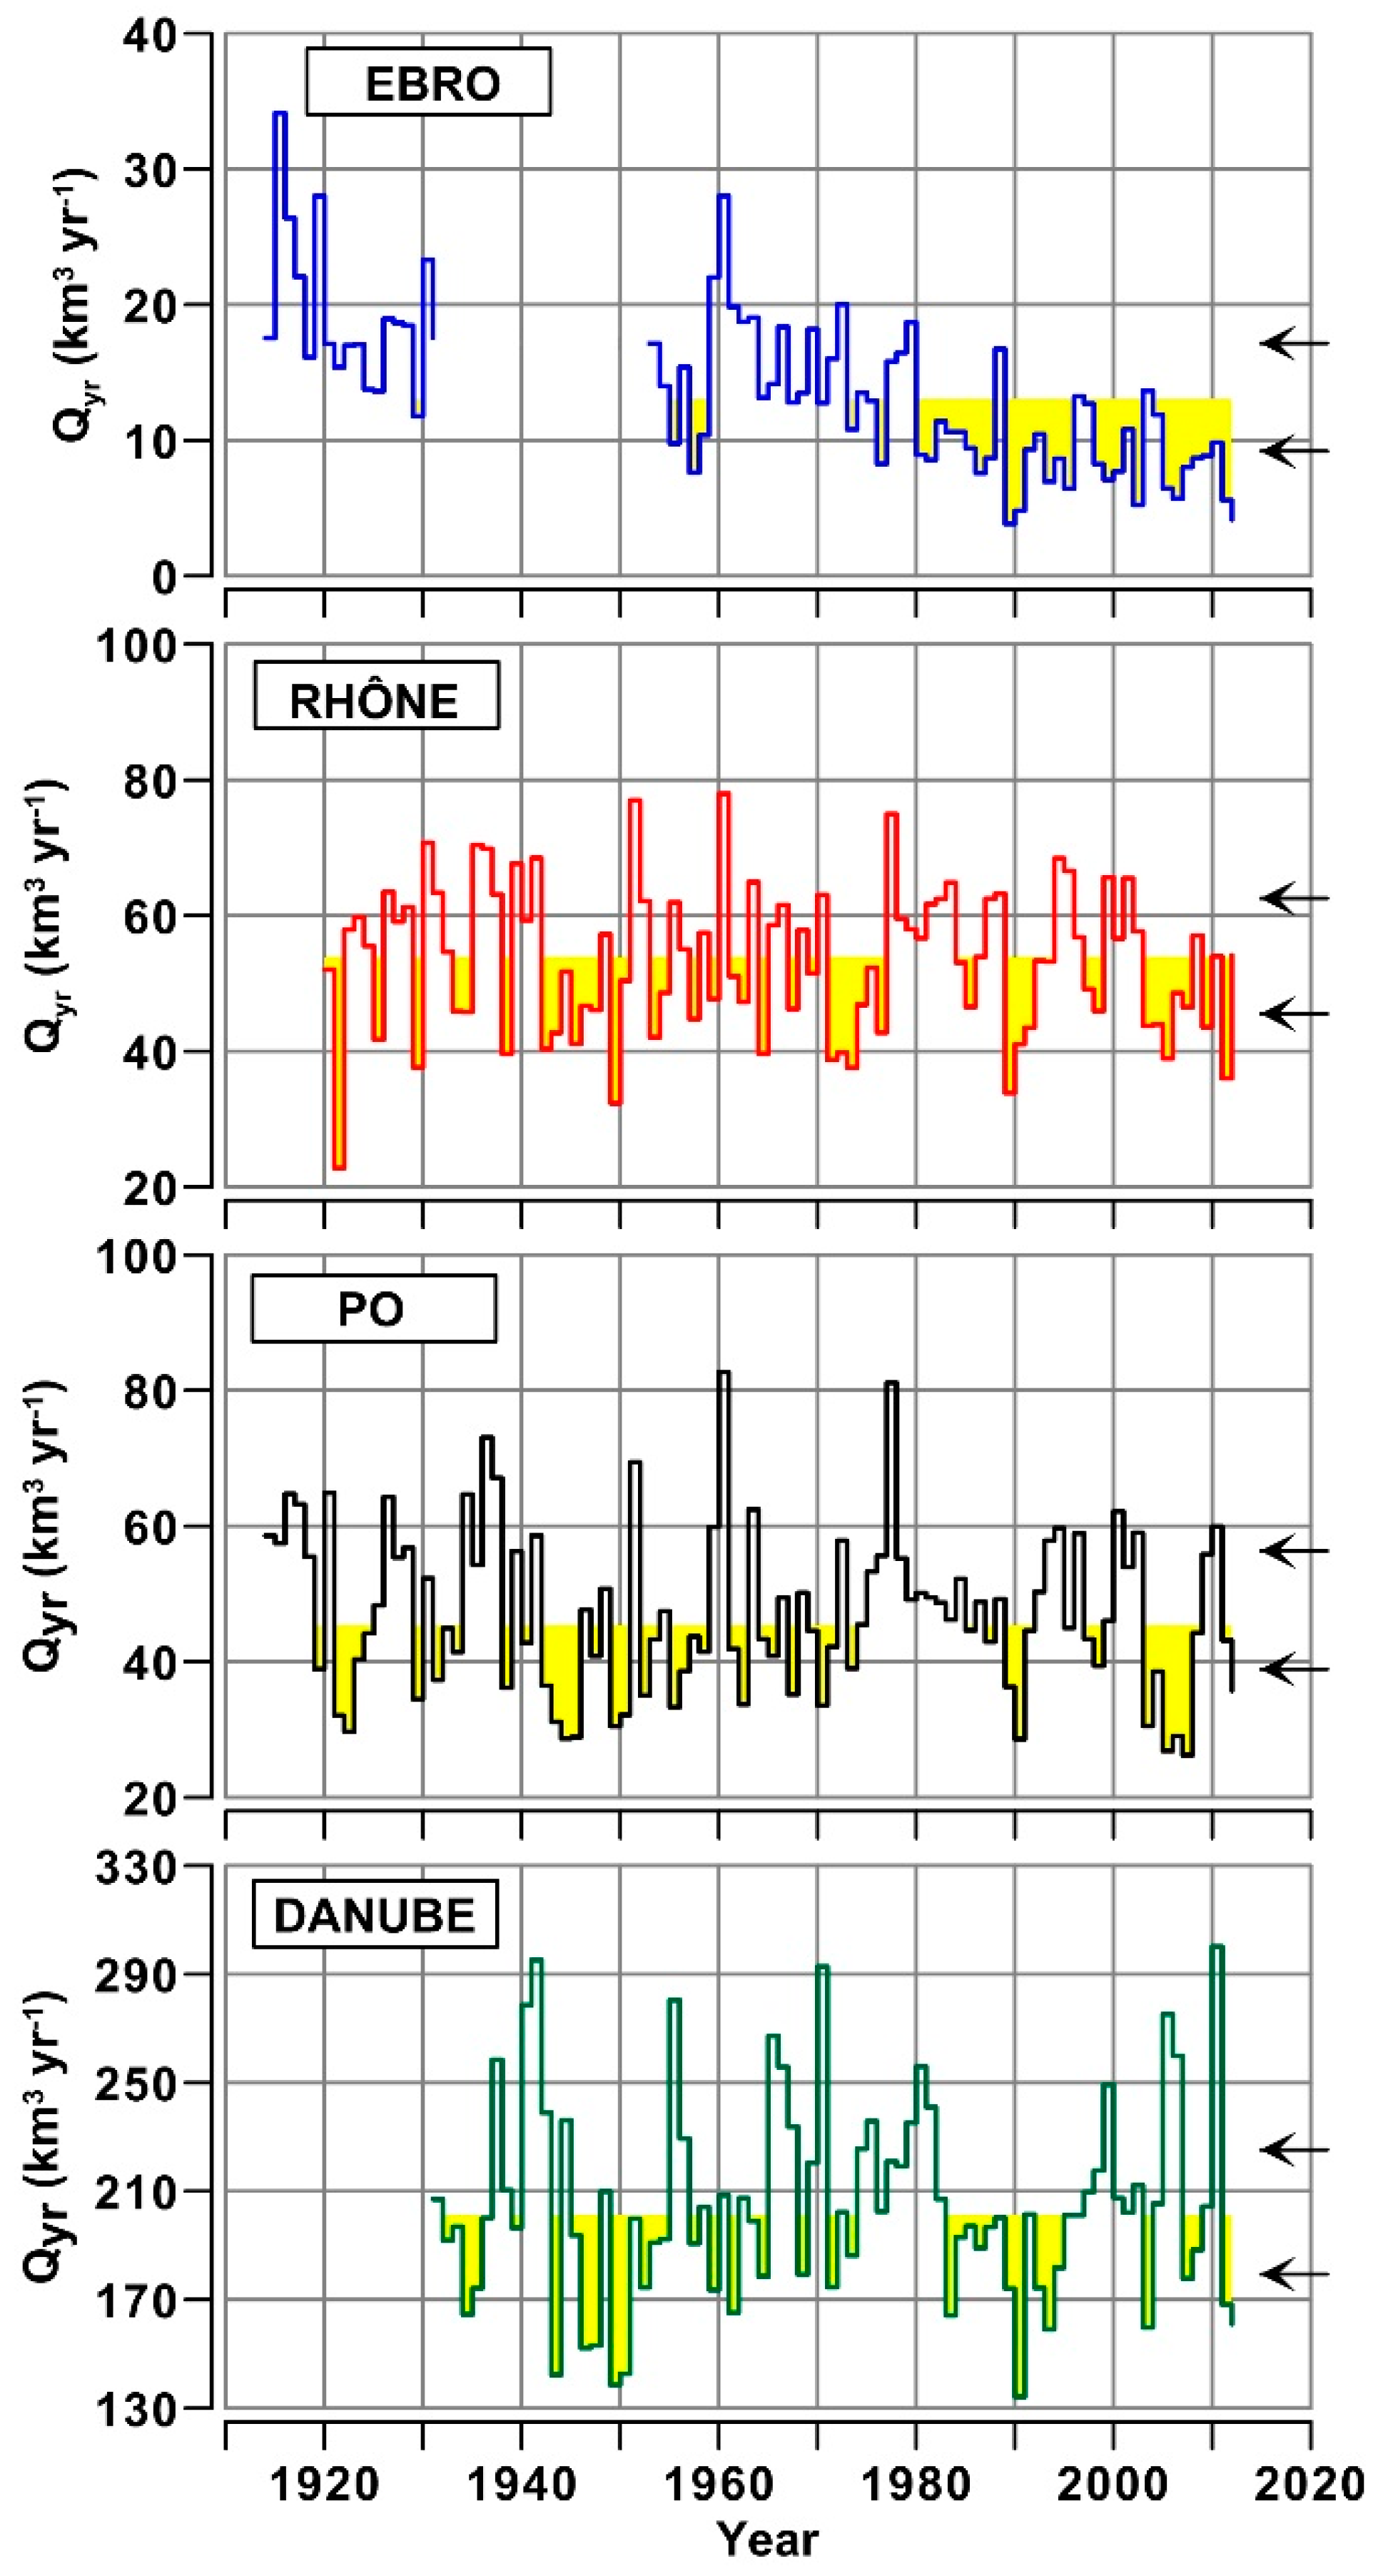
3.1. Daily to Multi-Decadal Variability of River Flows

The comparison of flow series indicated that the largest South European watersheds have distinct characteristics, which have to be analyzed on a multi-scale resolution. The most frequent values of daily flow (M0) varied in the order: Danube > Rhône > Po > Ebro (4,214, 1,036, 929, 113 m3 s−1, respectively). The moment coefficient of skewness indicated a heavy-tailed distribution of the flow for Ebro (γ = 2.59), a river characterized by infrequent but extreme freshets that generate discharges 40-times higher than the regular flow. This asymmetry progressively reduced for Po (γ = 2.30), Rhône (γ = 1.88) and Danube (γ = 0.56), which is a river showing persistent high flows (3000–10,000 m3 s−1) and infrequent freshets in the range 10,000–15,900 m3 s−1. The values of Kurtosis confirmed that the weight of the outliers was consistent to the asymmetry and in the order: Ebro > Po > Rhône > Danube (β = 10.6, 7.5, 5.6, −0.2, respectively) and that only the distribution of the Danube was characterized by a degree of peakedness lower than the normal distribution (Figure A1; Appendix A).
On monthly scale, the analysis of integrated water loads indicated that these rivers also have distinct annual cycles of the regime (Figure 2). The Ebro has a single period of low runoff in July–October, with the lowest median in August (0.34 km3 month−1). During the other months, it is relatively high with a maximum in March (1.53 km3 month−1). The regime of the Rhône is similar to that of the Ebro, although its higher water discharge (2.54 km3 month−1 in September, 5.13 km3 month−1 in January). The annual cycle of the Po is characterized by two dry periods in January–February (>1.35 km3 month−1) and July–September (>0.34 km3 month−1), alternated by two periods of high runoff that reach the highest median in May (5.00 km3 month−1). The Danube shows only one main period of high discharge in March–June (20.38–23.82 km3 month−1) and the lowest runoff in October (11.41 km3 month−1). Ebro, Rhône and Po rivers also show the largest variability of the flows during the months of high discharge, whereas the Danube shows a similar dispersion of monthly data regardless of the level of the flow.
On a decadal scale, the analysis of the presence of flow trends indicated for the Ebro a highly significant impoverishment of freshwater resources in all the months (from −0.002 to −0.020 km3 month−1 yr−1), with special regards to the periods of January–June and November–December (Table A1; Appendix A). For the other three rivers, flow reduction during the last century was significant only in late spring and summer months: May–August for the Rhône (−0.07 to −0.010 km3 month−1 yr−1), June–August for the Po (−0.08 to −0.015 km3 month−1 yr−1) and only June for the Danube (−0.052 km3 month−1 yr−1). For these rivers, flow trends were almost always not significant during the other periods of the year.
The range of variability of river flow can show long-term increase (decreases) in each month that, independently from the total water loads, suggests a possible exacerbation (mitigation) of the alternation between freshets and droughts. For the Ebro, the decrease of monthly water discharge previously mentioned was concomitant to a decrease of flow instability during almost all the months (Table A2; Appendix A). This reduction was pronounced in summer (−0.48% per year) and in autumn–winter (−0.25% per year). For the Rhône and Po, flow variability significantly increased in June–August (up to +0.28 and +0.13% per year, respectively), in contrast to the decrease of water discharges. In the case of the Danube, date series showed a persistent period of enhanced flow irregularity (April–August; up to +0.20% per year), although the decline of water discharge was statistically significant only in June.
The time series of annual water load indicated the presence of further changes of river regime from interannual to multi-decadal scales, which go beyond to the seasonal component of flow variability (Figure 3). MKT indicated that Ebro was the only river showing a highly significant decrease of the annual runoff during the whole of the last century (α = 0.001), with a mean slope estimated by ST of −0.139 km3 yr−1. This trend lead to a persistent scarce water discharge since the early 1980s. The other rivers were characterized by a strong interannual variability with, however, little (0.031–0.041 km3 yr−1) and not significant (α > 0.1) overall increments of annual runoff during the century.
Several abrupt changes were also detected in these time series (Table 2). For the Ebro, an important reduction of the runoff was observed in 1980 (−7.4 km3 yr−1), which differentiated an early long period of high flow in 1914–1979 from a period of low flow in 1980–2010. A further decrease was observed in 2011, whose persistence will have to be evaluated in the future. The Rhône was characterized by two periods of high flow (1920–1941, 1977–2002) alternated by two periods of low flow (1942–1976, 2003–2012), which implied the occurrence of three discontinuities (−10.1 to +5.8 km3 yr−1). The behavior of the Po was similar with the alternation of three periods of high (1914–1941), low (1942–1974) and high (1975–2002) runoff, in which the mean annual runoff changed about 7 km3 yr−1. The last two changes in 2003 and 2009 indicated respectively the beginning and the end of the strongest drought experienced by this river during the last century (−17.9 km3 yr−1). For the Danube, five alternated periods of high and low runoff were detected since the 1930s. The flows were high in 1931–1945 and 1965–1982 and low in 1946–1964 and 1983–2010, with differences of 23–36 km3 yr−1. After the highest discharge of the time series in 2010 (300 km3 yr−1), the Danube was again characterized by a low flow.

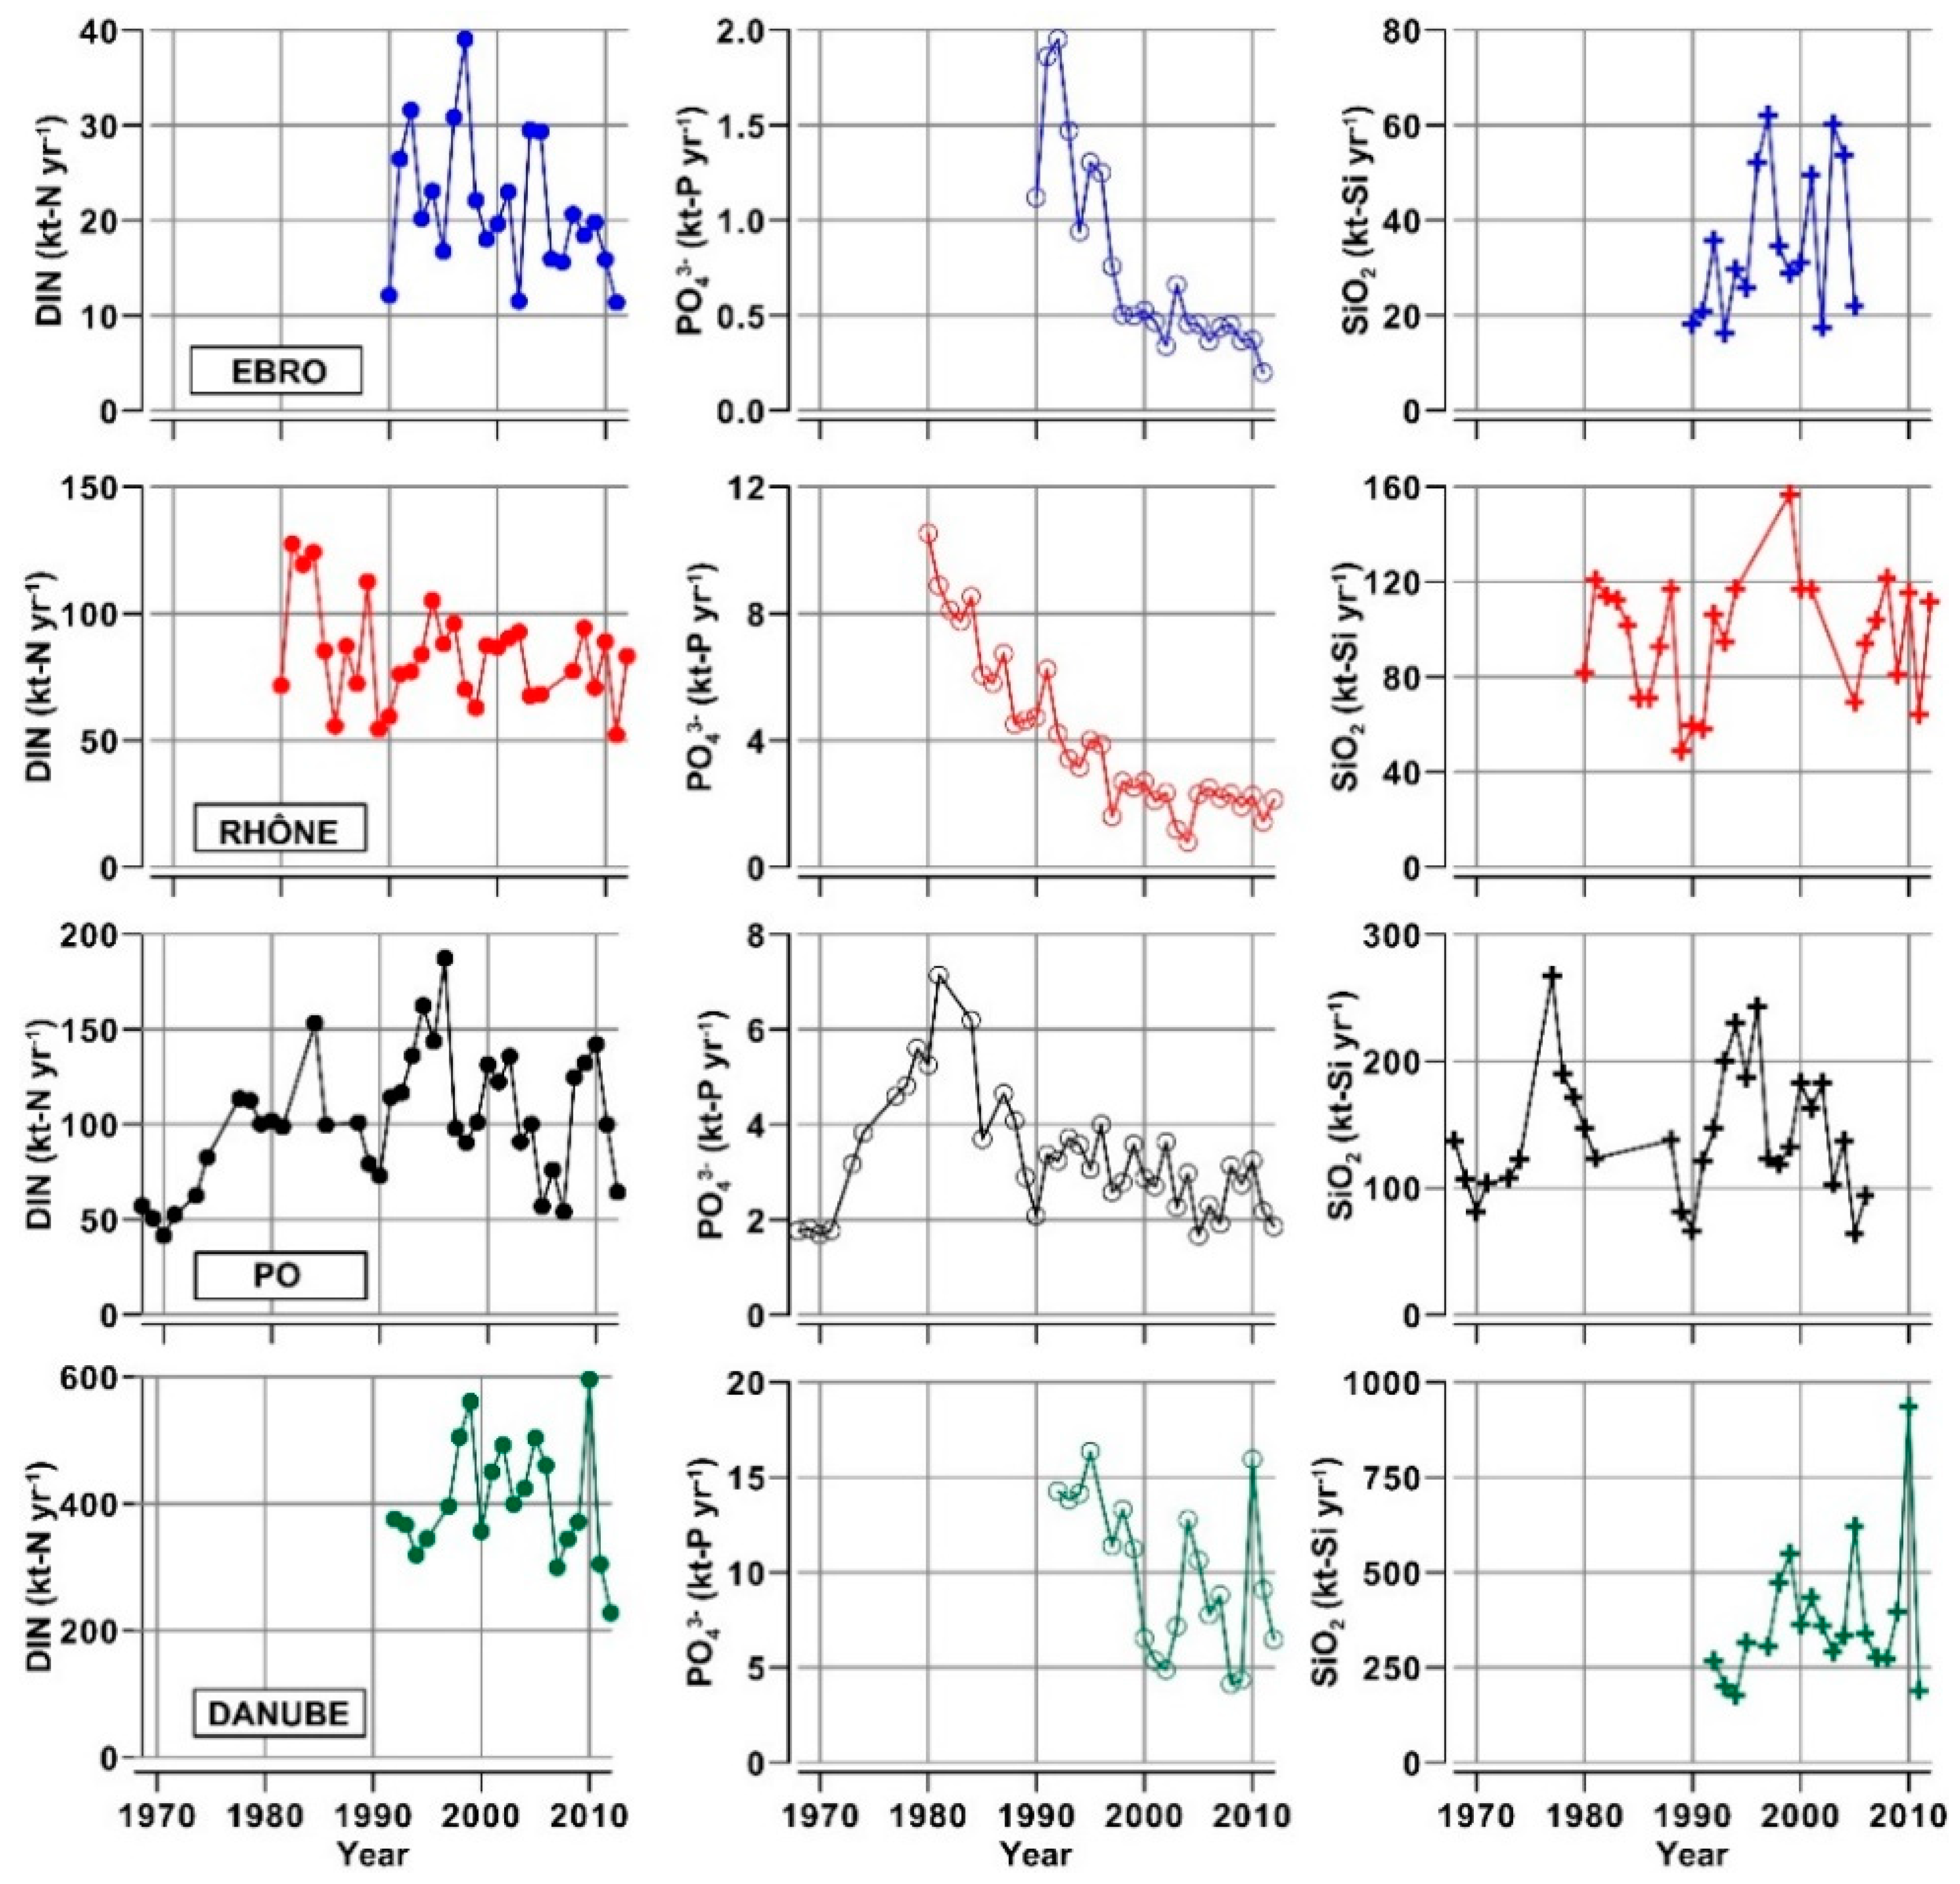
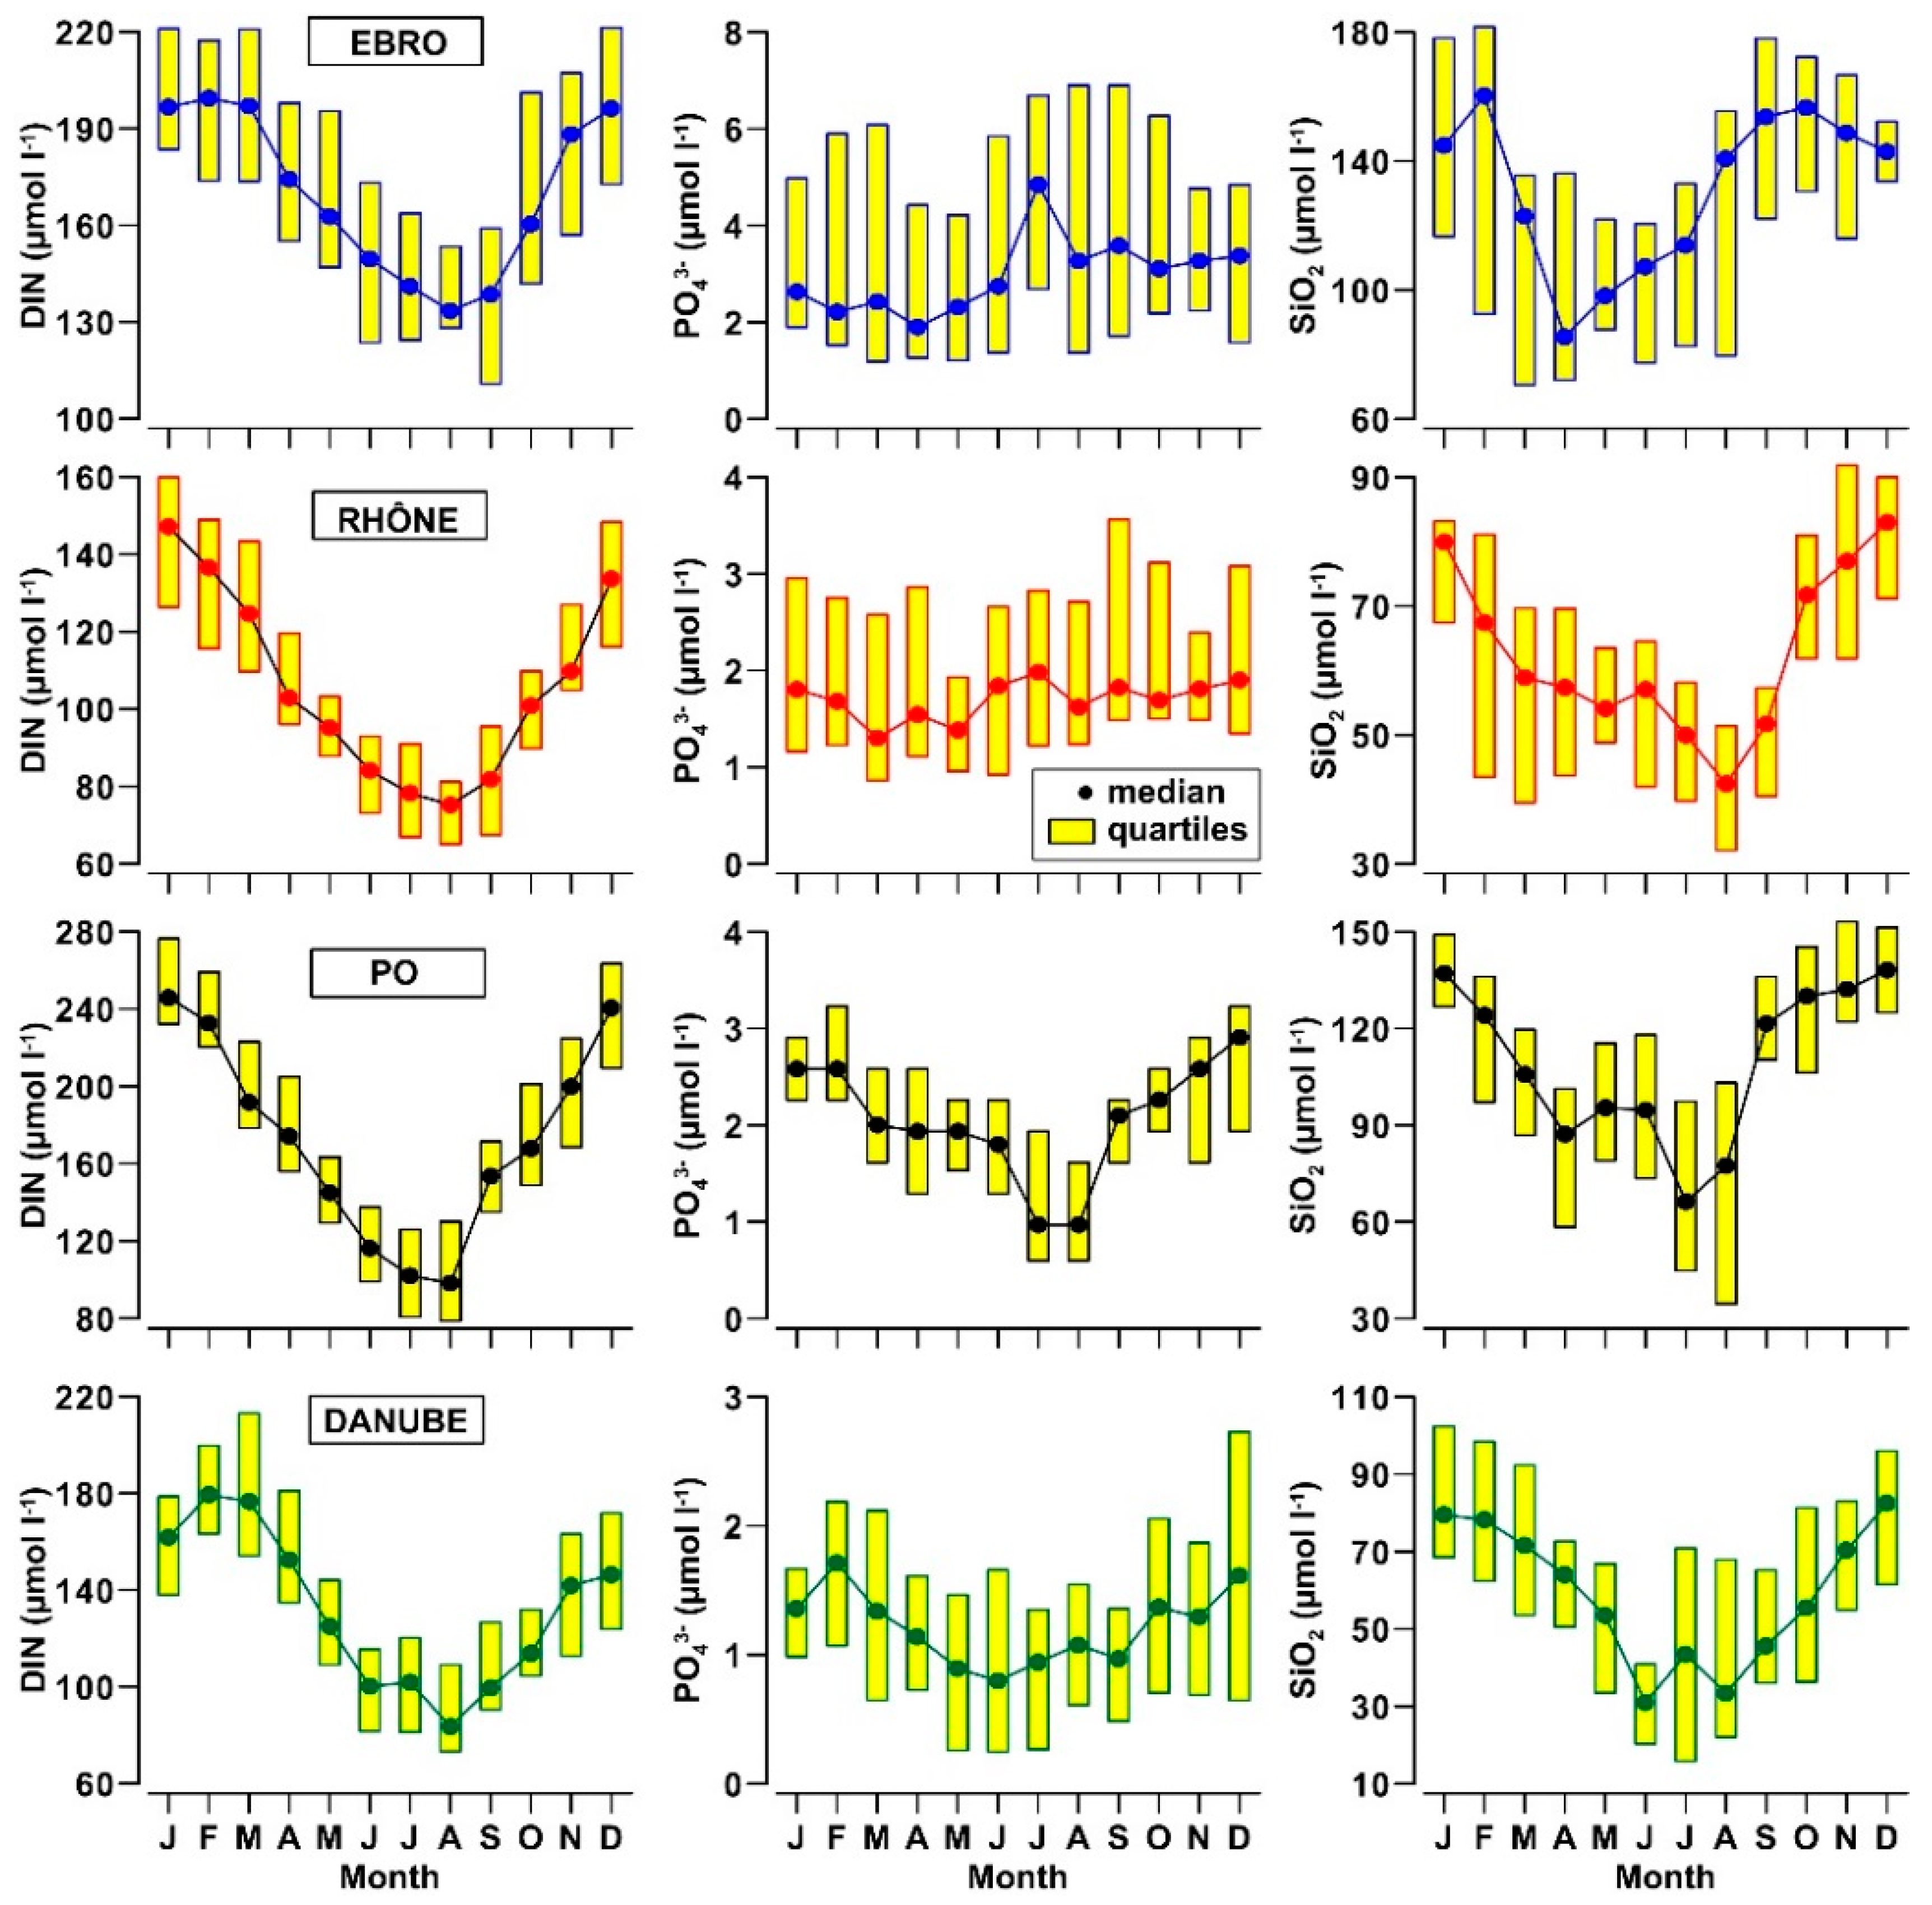
3.2. Nutrients and Organic Matter in River Waters

Since the early 1990s, water loads of these rivers have been characterized by a high median concentration of DIN (102–171 μmol L−1), which was due to the large abundance of NO3 in the pool of dissolved inorganic nitrogen (Table 3). NO2 and NH4+ were secondary nitrogen forms, although the concentration of NH4+ was slightly higher in Danube waters (15.0 μmol L−1) than in the other rivers (2.8–5.3 μmol L−1). The concentration of PO43− was in the range 1.3–2.3 μmol L−1, whereas that of SiO2 was 61–130 μmol L−1. The concentrations of inorganic N, P and Si were about 50% higher in the Ebro and Po compared to Rhône and Danube, suggesting that a larger nutrient accumulation occurs in river basins with smaller flows. Nutrient ratios indicated a large excess (sensu Redfield’s model) of inorganic nitrogen with respect to inorganic phosphorus (DIN/PO43− = 72–94) and to reactive silicate (Si/DIN = 0.5–0.7) in all the rivers.
Median concentration of TN was in the range 123–249 μmol L−1 and that of TP was in the range 2.6–4.8 μmol L−1, with the highest levels encountered in both cases in the Po (Table 3). The pool of nitrogen was mainly constituted by the inorganic forms since ON was 15–34% of TN. The partitioning of phosphorus was more balanced, with OP corresponding to 32–60% of TP. The excess of nitrogen compared to phosphorus was less pronounced in the pool of organic matter (ON/OP = 15–25) compared to that of dissolved nutrients. The concentration of TOC was high in river waters (241–398 μmol L−1) and followed the order Danube > Po > Ebro > Rhône, but monitoring data covered only two years for the Danube.
TSM followed a distinct pattern from those of nutrients, as it is mainly regulated by the geomorphological characteristics of drainage basins and by the presence of dams. TSM concentration was relatively high for the Po and Danube (46.8 and 26.5 mg L−1, respectively) and low for the Rhône and Ebro (12.3 and 7.5 mg L−1, respectively).
Compiled data indicate that all chemical parameters in river waters were highly variable a long time. For some nutrients, like NH4+ and PO43−, most of the highest concentrations occurred in early 1990s, suggesting that an improved management of nutrients in river basins has mitigated high anthropogenic loads during the last two decades. The relationships between nutrient concentration and daily flow were always complex for these rivers. However, there was a common tendency towards low concentrations of PO43− and high concentrations of SiO2 with the increase of the flow in the cases of Ebro, Rhône and Po.
The analysis of monthly distributions of nutrient concentrations indicated the presence of pronounced annual cycles of DIN and SiO2 for all the rivers (Figure A2, Appendix A). The concentration of DIN was lower in summer compared to winter and autumn, due to periodic decreases of NO3 (60–120 μmol L−1) and of NO2 (1–2 μmol L−1). SiO2 also showed large annual variations (40–90 μmol L−1) due to a strong decrease in April–September. For PO43−, seasonal oscillations were observed for Po and Danube, whereas they appeared in the Rhône waters only in the most recent years (2007–2012). The seasonal oscillations of ON and OP were scarce and, therefore, those of TN and TP were mainly due to the changes of inorganic nutrients. For TOC, available data did not allow a robust analysis of seasonal variability as the monitoring of this parameter in river waters was adopted by national regulations later than that of inorganic nutrients and often with an incomplete temporal coverage.
Stoichiometric ratios of the nutrients also changed seasonally in Ebro, Rhône and Po waters. The highest excess of nitrogen, both in inorganic and total pools, were found in winter and early spring (DIN/PO43− = 71–108, TN/TP = 47–76). In summer, DIN/PO43− and TN/TP ratios were less unbalanced (30–88 and 36–55, respectively), due to a larger decrease of nitrogen concentration compared to phosphorus concentration. The early annual decrease of SiO2 concentration in the waters of these three rivers caused lower Si/DIN ratios in March–April (0.42–0.60) with respect to summer (0.60–1.14). However, silicate was seldom in excess with respect to inorganic nitrogen. For the Danube, seasonal oscillations of the concentration of DIN and PO43− were similar in amplitude and in phase, determining rather constant values of DIN/PO43− ratio. By contrast, the strong decrease of SiO2 concentration in summer reduced the values of Si/DIN ratio in this season with respect to winter and autumn. TN/TP ratio varied from 41 to 82 and it was maximum in February–June (Figure A3, Appendix A).

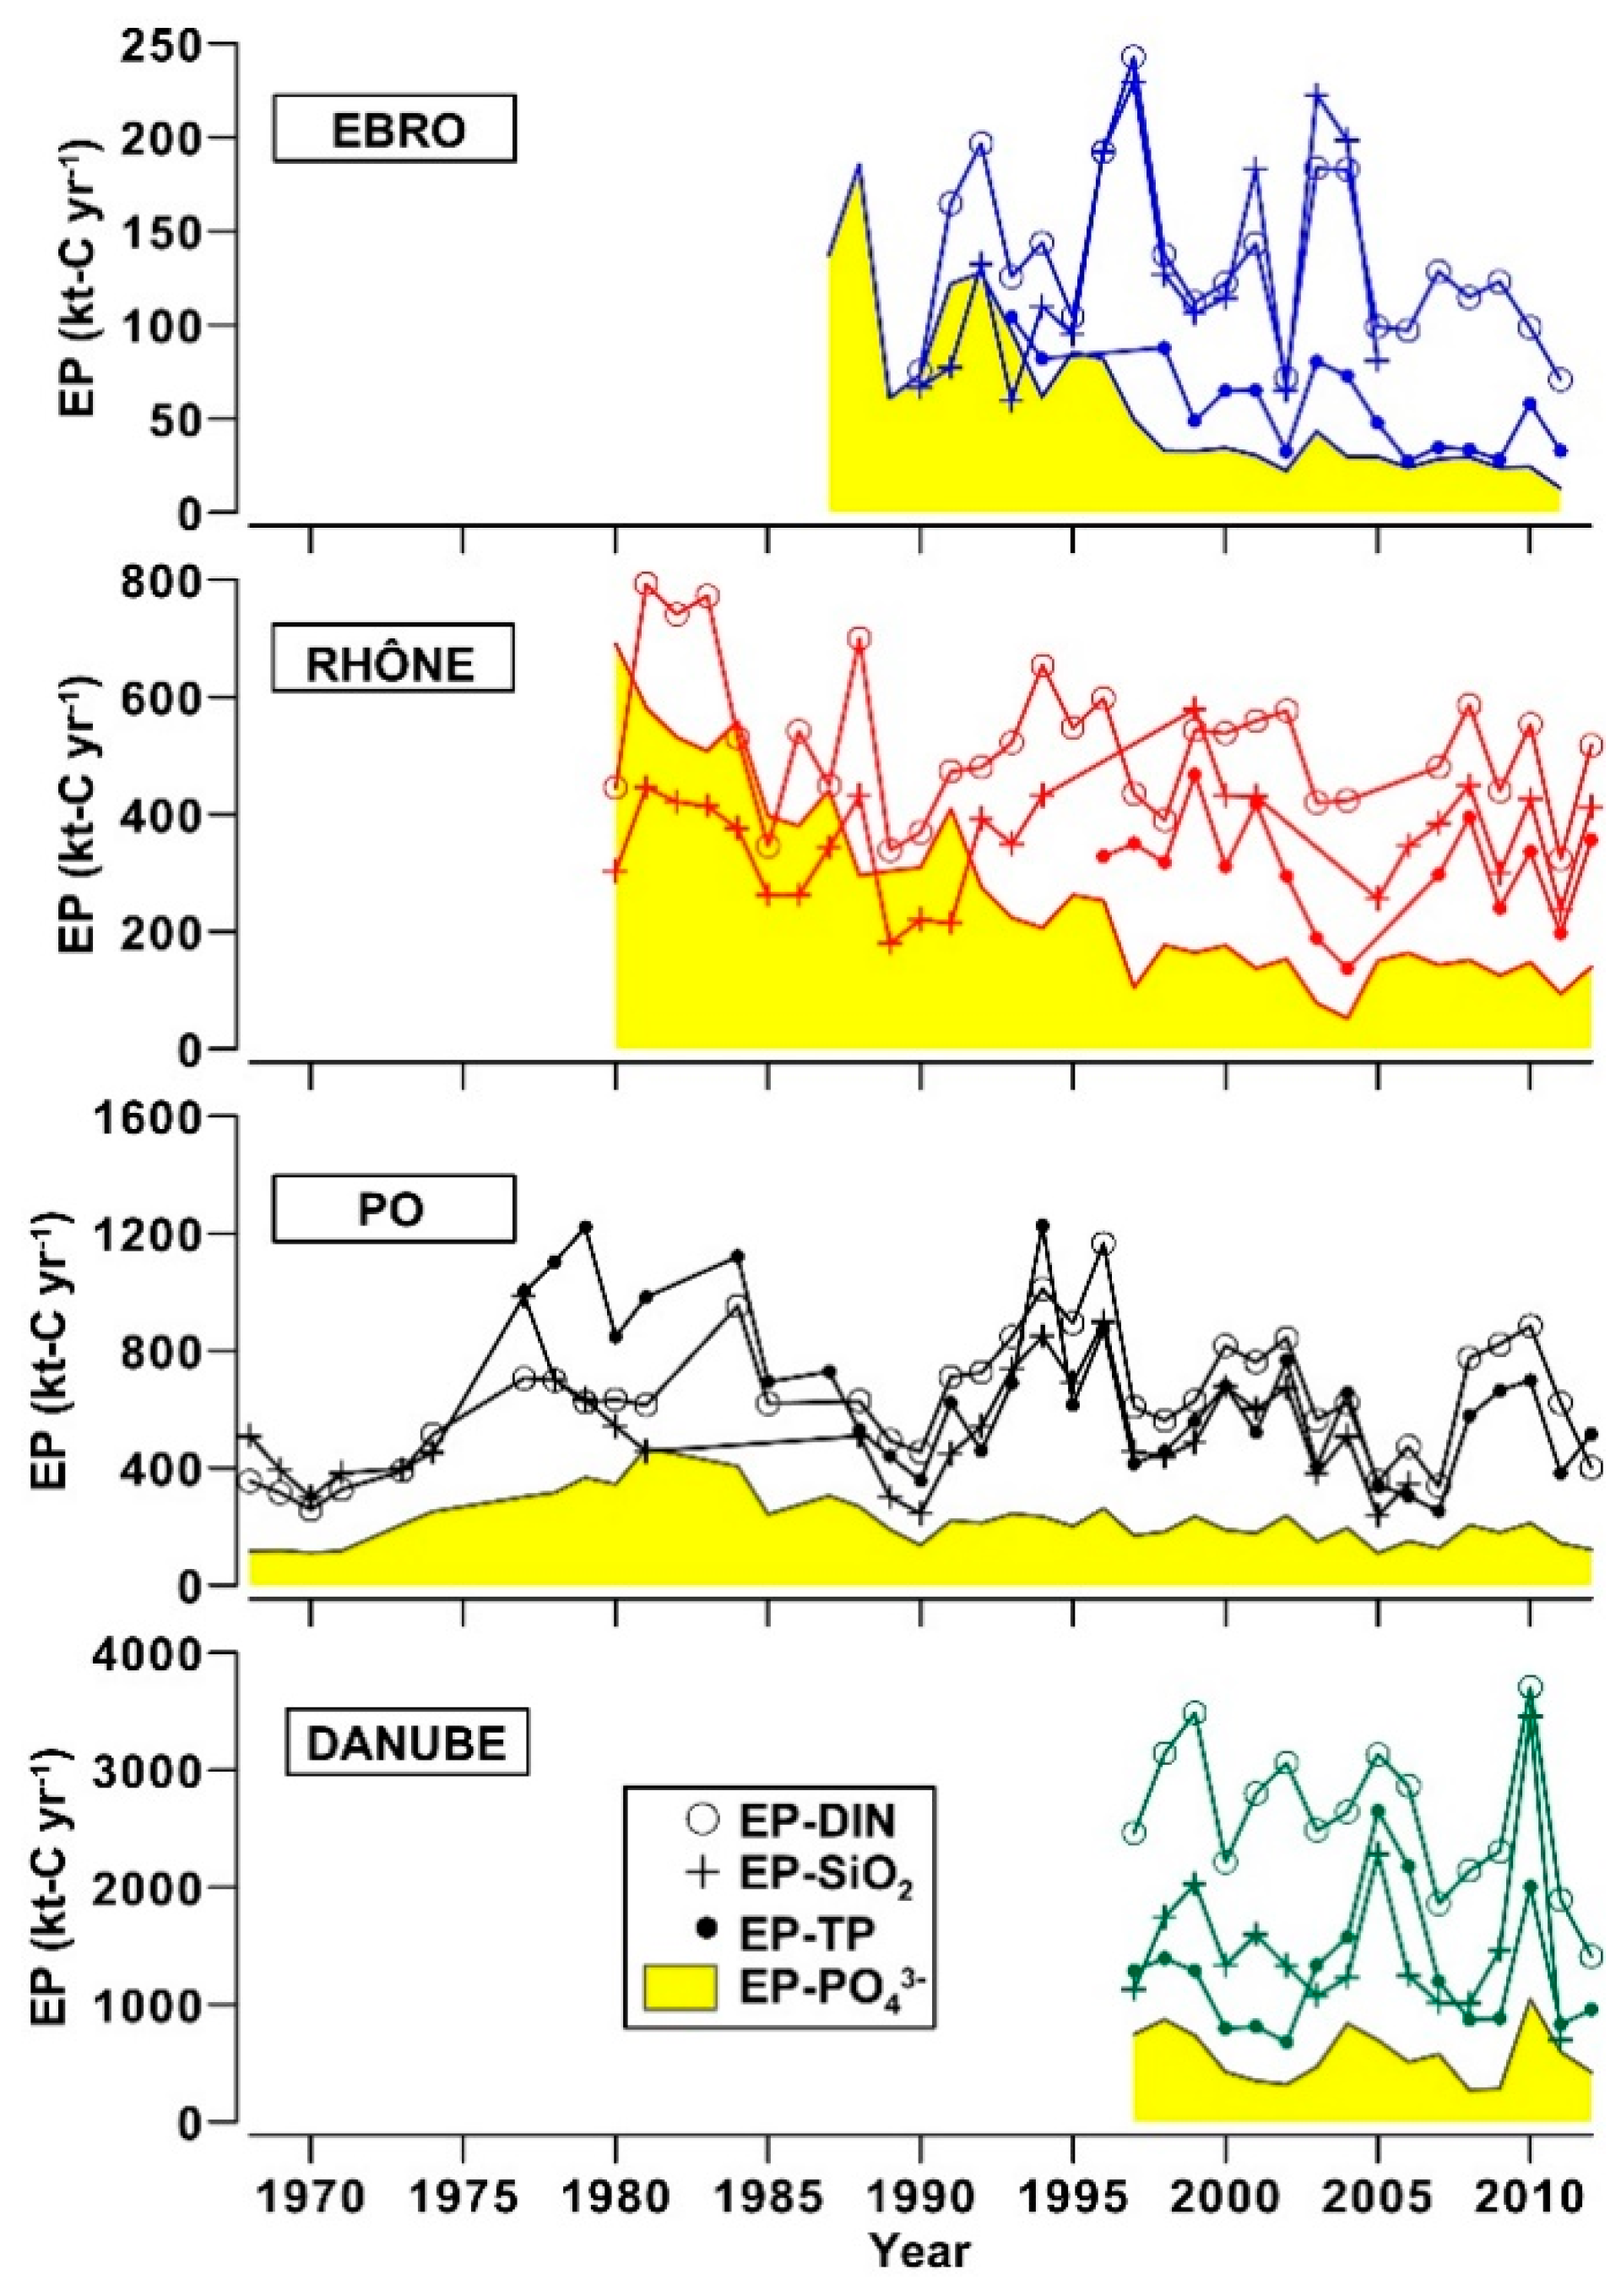
3.3. River Discharges of Biogenic Elements and Eutrophication Potential in Coastal Zones

Since the 1990s, median discharges of TSM were 71 kt yr−1 for the Ebro, 2031 kt yr−1 for the Rhône, 5547 kt yr−1 for the Po and 6565 kt yr−1 for the Danube, indicating a relatively high discharge of suspended matter in comparison to the flow for the Po. The values of DIN load (20–412 kt-N yr−1) indicated that the discharge of inorganic nitrogen by the Danube was 4–20 times higher than in other rivers. PO43− transport varied from 0.5 kt-P yr−1 for the Ebro to 8.3 kt-P yr−1 for the Danube, whereas the transport of SiO2 (30–360 kt-Si yr−1) was similar to that of DIN. The transport of TN (26–446 kt-N yr−1) and TP (0.8–19.0 kt-P yr−1) and TOC (29–1140 kt-C yr−1) again indicated that these rivers directly deliver large quantities of particulate and dissolved organic matter to the receiving coastal zones (Table A3, Appendix A).
Annual loads of river nutrients showed long-term trends and a high interannual variability that can have important effects in fluvial and coastal ecosystems (Figure 4). In the Po case, DIN and PO43− loads increased until mid-1980s and, in the following three decades, their trends differed with a significant decrease of PO43− load and variable, but not decreasing, loads of DIN. The decline of PO43− transport was common to the other three rivers, but it occurred for the Ebro and Danube over one decade later than for the Rhône and Po. Annual loads of SiO2 were mainly characterized by a strong variability with, however, a tendency toward low values in the most recent years.
The analysis of the trends by MKT and ST, performed for all chemical parameters over the available time series, indicated significant decreases (α ≤ 0.1) of the transport of TSM, NO2, DIN, PO43−, TOC and TP for the Ebro (Table A4, Appendix A). For the Rhône, the most important change was a long-term reduction of PO43− load (−0.22 kt yr−2), as NO2 decrease (−0.04 kt yr−2) is only a secondary nitrogen form and the time series of ON, even if characterized by a decrease (−1.13 kt yr−2), also showed a strong variability. For the Po, significant decreases of NH4+, NO2, PO43− and TP occurred after mid 1980s. Since 1997, a tendency towards reduced loads of inorganic and organic nitrogen was observed in the case of the Danube but, in this more recent period, the decrease was statistically significant only for NH4+ (−3.58 kt yr−2).
The contribution of the discharge of river nutrients to the growth of algal biomass in the receiving coastal zones was estimated by the eutrophication potential [2]. For all the rivers, EP based on the river loads of DIN was higher than that of PO43−, suggesting that the supply of land-borne inorganic phosphorus was fundamentally the factor limiting the new production in the coastal marine environment (Figure 5). However, the scarcity of phosphorus could be mitigated by the fraction of the organic phosphorus pool potentially bioavailable for algal growth [57,58]. During the last two decades, this compensation was potentially greater for the Rhône and Po (TP-based production respectively equal to 61% and 79% of DIN-based production) compared to the Ebro and Danube (TP-based production equal to 45% and 54% of DIN-based production).
EP estimated with SiO2 loads was often similar to that of PO43− in the period from 1980 to the early 1990s (Figure 5). Afterwards, the decline of phosphorus transport induced a persistent condition of excess of SiO2 compared to PO43− for algal growth (EP-SiO2 2–6 folds higher than EP-PO43−, in 2000–2012).
Despite TOC series are not so long like those of nutrients, a comparison between the new carbon production potentially generated by river nutrients in the coastal zones and the direct discharge of riverine TOC can be done. In the current post-eutrophic phase, available data indicated a median TOC transport of 29 kt-C yr−1 for the Ebro, 155 kt-C yr−1 for the Rhone, 246 kt-C yr−1 for the Po and 1140 kt C yr−1 for the Danube (Table A3). These values suggest that the supply of river organic carbon is not negligible compared to the fraction of new production currently sustained by riverine nutrients, when PO43− is considered the nutrient limiting the growth of the biomass (median values of 46, 141, 194 and 889 kt-C yr−1, respectively). The importance of riverine TOC decreases for all the rivers (≈50%) when the potential new production is based on TP loads (median values of 69, 317, 587 and 1484 kt-C yr−1, respectively).

4. Discussion

The watersheds considered in this study cover wide ranges of longitude (4° Long. W–30° Long. E), surface (74,000–801,500 km3), inhabitants (3–82×106) and flows (9–15,900 m3 s−1). Moreover, they constitute the main contribution to the runoff in the Mediterranean and Black Seas. The comparative analysis of their characteristics has highlighted a multi-scale variability at sub-continental scales that cannot be ignored as it reflects in distinct hydrological and ecological impacts across freshwater and coastal environments in Southern Europe (Table 4).

4.1. Seasonal to Decadal Trends of River Flows and Coastal Hydrology

Despite flow regulation systems are nowadays present in all drainage basins [16,38,45,46] flow dynamics is still distinct for these rivers, suggesting that their effects on the receiving coastal zones differ depending both on the quantity and on the regime of freshwater discharges. Smaller drainage basins are primarily the cause of a low mean runoff, on which are superimposed infrequent peaks of high discharge generated by rainfall and snowmelt (Table 1; Figure A1). The Ebro watershed has a Mediterranean climate with continental characteristics, with a current precipitation regime (annual mean of 600 mm) characterized by the occurrence of persistent droughts in the middle and lower basin alternated with heavy rainfall events [41,59]. Annual precipitation in the Rhône watershed (1030 mm) depends on a seasonal contribution of snowfall and by the rainfall, which exhibits a high variability mainly due to localized storms occurring on the lower river basin [28]. A high interannual variability of the precipitation (1200 mm) is also typical of mild continental climatic conditions in the Po Basin [17,37]. Mean Annual precipitation in the Danube watershed varies from 500 mm in the central plain and delta regions to 2000 mm in the western mountainous regions [60]. For the Rhône, Po and Danube, the contribution of glacier-melt water to river runoff, although not of primary importance, is a term that should be better quantified [28,37].
The presence of distinct annual cycles of river runoff has consequences on the hydrology of the coastal zones as the advection of river waters interacts with stratified (mixed) seawater in summer (winter). Summer is the driest season for the Ebro, Rhône and Po (Figure 2). In the case of the Danube, the driest period occurs in late summer early autumn, due to a larger contribution of rainfall and snowmelt in April–July [16]. For the Po, it was shown that scarce summer discharges contribute to the weakening of the circulation in NW Adriatic [61], enhancing the retention of coastal waters and the eutrophication problems even in the presence of a low nutrient supply [31]. By contrast, low runoff reduces the impact of Ebro and Rhône on the mesoscale circulation on their continental shelves as they have a greater depth and large open boundaries with the sea [9,15].
The Po and Danube are also characterized by a dry season in winter, contrary to Ebro and Rhône. The timing of the freshets in late winter and early spring is important as it causes the earliest stratification of the water column and the earliest allochthonous nutrient enrichment during the year, mostly favoring diatom blooms. In the other seasons, river discharges can favor non-siliceous species that often lead to undesirable effects in the coastal waters [2]. For this reason, the possible alteration of the timing of river freshets, due to dam regulation and climate changes, is a factor able to modify the succession of plankton communities.
The characteristics of continental shelf regions further concur to differentiate the impacts of these rivers. For the Ebro, the long-term decline of the runoff, coupled to a rather narrow continental shelf and to a relatively strong coastal current, limits the extension of the river plume [15,30]. Meteorological conditions and large-scale circulation in NW Mediterranean regulate the extension of the coastal front generated by the Rhône in the Gulf of Lion, usually preventing eutrophication problems [60]. The fine haline structure of Rhône plume, which includes the presence of persistent low-salinity surface water lenses, can favor a high production sustained by river nutrients, but these processes are usually temporarily [33].
The cases of Po and Danube are opposite. The wide, shallow and semi-enclosed continental shelf of N Adriatic strongly enhances the impact of Po discharges. Particularly during summer, a weak circulation and stable meteorological conditions cause the retention of low-salinity waters on the shelf and the formation of coastal fronts with meanders and gyres that favor alternated eutrophic and oligotrophic conditions [20], as well as seasonal hypoxia [11,31]. For the Danube, a persistent large water discharge (3000–10,000 m3 s−1) with a scarce incidence of the freshets (Figure A1), coupled to the orography of the shallow continental shelf of NW Black Sea, maintains a permanently low-salinity upper layer as far as 20 km from river mouths, which isolates the deeper layer favoring bottom hypoxia [16].
The analysis of long-term trends indicated a significant decrease of the runoff all along the year in the Ebro basin (Table A1, Figure 3), concomitant to a decrease of the variability of river discharge (Table A2). An important part of this trend has anthropogenic causes like an increased usage of freshwater for cropping in the middle river basin and a stronger regulation of river flow after dam building. However, the afforestation in mountain areas of the basin following the progressive abandonment of farming has also contributed to the decline of the runoff in the last decades [38]. At the same time, climate change effects such as large droughts observed in Iberian Peninsula in the 2000s, increased evapotranspiration and recurrent heat waves have exacerbated the scarcity of freshwater in this region [32,36]. These events had significant socio-economic impacts, in particular on crop and livestock productions, hydropower generation, tourism and population health [32,38].
In the other three river basins, significant trends were detected essentially in summer, a season where the decline of the runoff was counterbalanced by an increased flow irregularity. An overall reduction of the runoff is expected in Southern Europe in a scenario of climatic warming, due to the increase of evapotranspiration and to the reduction of snow cover and precipitation [32], but present results support the importance of a higher resolution assessment of the related environmental and socio-economic impacts on river drainage basins [47]. Similarly, reliable streamflow simulations at regional scales are of basic importance to study these differences, but they have to be obtained applying appropriate downscaling techniques to global precipitation models [61,62]. The shortage of freshwater in the Iberian Peninsula along most of the year that gradually reduces eastward to only summer in the Balkans indicates that the anthropogenic usage of freshwater and regional climatic conditions are yet differently affecting each of these drainage and coastal systems. For the Danube, current data show only a large variability, but model results suggest an oncoming decrease of the runoff in the whole basin in summer and in the middle and lower basins in autumn in the next 30 years. By contrast, winter water loads should be maintained by the presence of a heavy seasonal rainfall and by an early annual snowmelt [62].
Long-term series of annual water discharge also showed several discontinuities, which indicate alternate positive or negative changes of the runoff in Southern Europe, often separated by intervals of 20–30 years (Table 2). Adjacent drainage basins like those of Rhône and Po showed concomitant changes, different from those of the Ebro and Danube. This feature points out the importance of Mediterranean climate patterns, which are characterized by a latitudinal transition from a maritime coastal climate to a subtropical desert climate and by a longitudinal variability due to the influence of Atlantic circulation, South Asian monsoons in summer and Siberian high-pressure systems in winter. Mesoscale climatic features are significantly modulated by land orography, in particular in mountainous regions like the Alps [63]. This variability easily induces distinct regional regimes of snowmelt, rainfall and evapotranspiration and a distinct variability of river discharges from daily to multi-decadal scales [37,61,64]. Moreover, human interventions for the regulation of river flows and the demographic and economic growth in South European countries during the last century can have contributed to differentiate long-term trends of the runoff in these watersheds.
Multi-year phases of anomalous freshwater discharge can modify the biogeochemistry of marine systems at basin scales as river plumes affect the pelagic and benthic compartments in extended portions of the continental margins [19]. This process was observed in N Adriatic basin in 2003–2007, when a prolonged period of extremely low runoff caused the increase of salinity and the decreases of nutrient concentration and phytoplankton biomass [20,34].

4.2. Loading of Biogenic Elements and Impacts on Fluvial and Coastal Systems

Currently, most of nitrogen and phosphorus loads in these drainage basins are due to human activities, with an overload of NO3 mainly originated by agriculture and atmospheric deposition and PO43− inputs mainly linked to urban and industrial wastewaters [26,29,36,40,44]. The dissolution of SiO2 is a natural process caused by the weathering of rocks and sediments. However, the regulation of river flow caused by dam building was shown to reduce silicate transport of the Danube [49]. The concentration of nutrients and organic matter is further modified by the presence of the reservoirs along the rivers [41] and by the hydrological characteristics of deltas [16] as they affect the residence time of waters, the sedimentation of particulate matter and the growth of plankton communities. The combination of these complex processes causes distinct levels of biogenic elements in these four rivers and a variability of nutrient ratios different from that of the concentrations, with excesses of DIN compared to PO43− in the order: Danube > Po > Rhône > Ebro, with more similar Si/DIN ratios in all these rivers and with rather high ON/OP ratios in the Po (Table 3).
Another factor that have contributed to the differentiation of nutrient trends in these rivers was the timing of adoption of the measures for the reduction of eutrophication problems by National and Environmental Authorities in each drainage basin. They have included reduction of polyphosphate in the detergents, reduction of the use of fertilizers, improvement of wastewater treatment methodologies and the reconversion of animal farms and industries. However, it should be noticed that changes in nutrient management can have delayed effects in freshwater and coastal ecosystems due to the different turnover times of these elements in groundwater and soils, which have to be monitored for years after their adoption [26,27,29,46].
The current annual cycle of river nutrients generates the largest overloads of nitrogen in winter and autumn and a scarcer and more balanced nutrient supply in summer (Figure A2 and Figure A3). Phytoplankton blooms are favored by large river discharges in winter-early spring and, with a minor intensity, in autumn in the coastal zones of the Rhône [65,66,67], Po [68,69] and Danube [8]. However, periods of scarce river nutrient discharge not always prevent the eutrophication in the coastal waters due to possible opposite effects of meteorological conditions and circulation, which are particularly important in the shallow, semi-enclosed and more extended continental shelves of N Adriatic and NW Black Sea. Coastal hypoxia is enhanced in summer by a long retention of Po River nutrients in warm and highly stratified shallow waters, even in the presence of a scarce runoff [20,31]. The upwelling of hypoxic near-bottom waters in the coastal zone of the Danube can occur in all the seasons under the influence of western winds [16]. In the coastal zones of the Ebro and Rhône, river inputs can also induce a high biological productivity in early spring and autumn, however, the orography of the continental margins favors the dispersion of nutrient loads limiting eutrophication problems [9,30,33,70].
The transport of TSM is regulated by the morphological characteristics of drainage basins and by the frequency of freshets, which determine the erosion of sediments, but the presence of dams limits again the delivering of suspended sediments to the sea. The present study indicates that the Po is a river with a particularly high transport of TSM, because of the large release of sediments from the mountainous area of Apennines in the southern part of its drainage basin and the absence of dams along its lower course. The decrease of TSM transport due to human activities in the drainage basins can enhance the erosion of deltas and sandy coasts, in particular if it is coupled to changes of storm frequency, circulation and sea level [16,17,38].
The analysis of annual nutrient budgets indicated that the decline of PO43− transport has been the most important long-term change characterizing river loadings. This reduction occurred earlier for Rhône and Po compared to Ebro and Danube (Figure 4). Annual discharges of DIN and SiO2 have shown lower values during the last decade, but the interannual variability of their budgets, mainly originated by the changes in water discharge [34], have been the prominent characteristics of their behavior. The oligotrophication due to phosphorus decline is more relevant in estuaries and semi-enclosed coastal zones with strong riverine influence, where the runoff sustains the largest fraction of the production [4,30,71]. Trophic levels in coastal zones differ at regional scales, due to distinct environmental and climatic conditions. However, this significant decrease of continental inputs of PO43− has certainly strengthened a recent P-limitation in the whole Mediterranean and Black Sea [10,19,20,21,35]. For this reason, future research is needed to better assess the impact of such changes on a variety of ecosystem services [5,67].
Primary production sustained by rivers represents only less than 2% of the production in the Mediterranean and less than 5% in the Black Sea, but it can be ten times higher in the regions of freshwater influence [21]. During the last century, all considered rivers have passed through three phases characterized by “pristine”, eutrophic and post-eutrophic conditions [4,26,27,34,72]. In the eutrophic periods (c.a. 1970–1990), the increase of the discharges of inorganic nutrients with rather balanced N:Si:P ratios caused severe eutrophication in the lower river environments, estuaries and coastal zones of N Adriatic and NW Black Sea, which were not previously observed [4,6,10,73]. In the current phase, eutrophication potential of river nutrients based on PO43− uptake is always lower compared to that of DIN and SiO2 (Figure 5), indicating that the impact of these rivers on the marine environment is mitigated by the scarcity of inorganic phosphorus.
For Ebro River, this trend of oligotrophication caused a quick decrease in chlorophyll and a large increase transparency in river waters, triggering the subsequent colonization of macrophytes [4]. The Ebro estuary shifted from a highly eutrophic condition, with summer anoxia in the salt wedge and nearly absence of macroinvertebrates to meso- and oligo-trophic conditions with a total recovery of oxygen levels and a rich macroinvertabrate community [73]. In the Gulf of Lions, the increase of nutrient loadings by the Rhône in the period 1970–1990 had an important impact on the productivity of coastal waters [33,44]. Afterwards, phosphorus limitation of algal growth was proved in coastal waters affected by river inputs [70].
In N Adriatic, an increase of offshore and coastal hypoxia was observed until the 1980s [11,31], coupled to the degradation of the benthic compartment [12] and to recurrent dinoflagellate blooms [74]. Afterwards, the more recent nutrient imbalance in river waters of this region was related to a shift towards oscillating trophic conditions that can have favored the appearance of mucilaginous aggregates [20,74,75].
In the shallow coastal shelf of W Black Sea, river nutrient loads have increased since the 1970s, specifically during the 1980s, causing a long-term increase of eutrophication, which included chronic harmful algal blooms, reduced transparence of the water column, persistent hypoxia, jellyfish proliferation and mass mortality events of pelagic and benthic organisms [35,76]. Since the early 1990s, PO43− decline had an important role in the transition of this coastal system from a eutrophic state to a low-energy and degraded food web dominated by non-siliceous plankton communities, which is not comparable to a pristine condition [10,35,77]. For both Po and Danube coastal zones, the regeneration of organic nitrogen and phosphorus entrapped in marine sediments became an additional source of nutrients for plankton communities able to maintain eutrophic conditions independently of the runoff [8,31].
Present budgets further indicate that the imbalance in the delivery of river nitrogen and phosphorus in the coastal zones might be significantly reduced, if particular and dissolved organic phosphorus is considered at least partially available for marine plankton growth (Figure 5). The bioavailability of riverine particulate phosphorus is limited in the estuarine zones, when it is in a mineral form or if the sedimentation of particles is fast [72]. Nevertheless, a high concentration of bioavailable particulate phosphorus was found in the Danube Delta [78]. Moreover, many freshwater and marine algae species are able to synthesize alkaline phosphatase to obtain PO43− by the enzymatic hydrolysis of phosphormonoesters, which are an important component of the natural pool of dissolved organic phosphorus [57]. This enzymatic catalysis can significantly sustain phytoplankton productivity in the marine environments characterized by a persistent deprivation of PO43−, like the Northern Adriatic [58]. For these reasons, the real eutrophication potential of river nutrient loads would be better assessed in term of DIN/TP ratio rather than DIN/PO43− ratio [79] and the role of river inputs of organic phosphorus to sustain autotrophic production should be further investigated in these drainage systems.
Finally, it can be noticed that in the current post-eutrophic phase the discharge of TOC by these rivers is not negligible compared to the new carbon production potentially sustained by river nutrients in the receiving coastal zones, assuming that is limited by phosphorus. Despite the overall production on continental margins also depends by nutrient remineralization, upwelling of nutrient-rich deep waters, wastewater discharges and atmospheric deposition, these data indicates that the consequences of the loads of riverine TOC in the coastal environments should be better investigated. The particulate organic carbon discharged by these rivers in the adjacent continental shelves can be suspended, buried or transferred to the deep sea depending on the river flows and marine circulation [15,42,48,80]. This organic material, together to terrestrial dissolved organic carbon, can be at least partially made available for marine food webs through bacterial degradation [14]. The discordance between the large delivery of terrestrial TOC to the global ocean and its limited quantity usually detected in coastal marine environments suggests that river TOC is used by the marine food webs, both at regional and at global scales [13].

5. Conclusions

Results show that the largest watersheds in Southern Europe have distinct features (Table 4), which originate by the combination of regional climatic conditions, anthropogenic usage of freshwater resource, adopted policies for the mitigation of eutrophication and oceanographic features of the receiving coastal water bodies. Their flow regimes show a complex dynamics that have to be analyzed from daily to multi-decadal scales. Notwithstanding the inhomogeneous coverage of time series of TSM, nutrients and organic matter in river waters, these data are fundamental to assess the possible combined impacts of anthropogenic and climatic pressures on coastal environments. Comparative analysis of these aquatic ecosystems are not common, but they should be intensified to better understand their distinct responses to environmental changes at sub-continental scales. The following main results are highlighted by the present study:
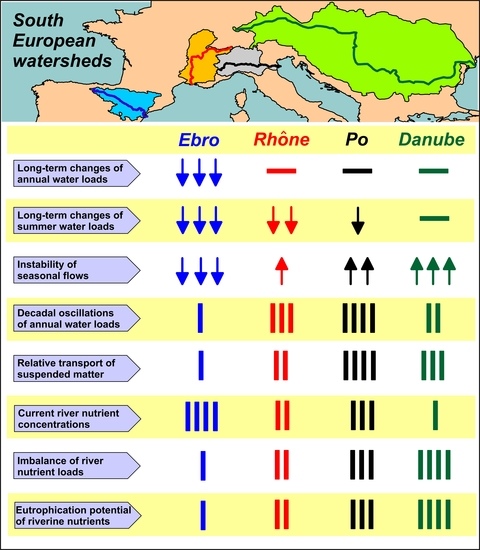
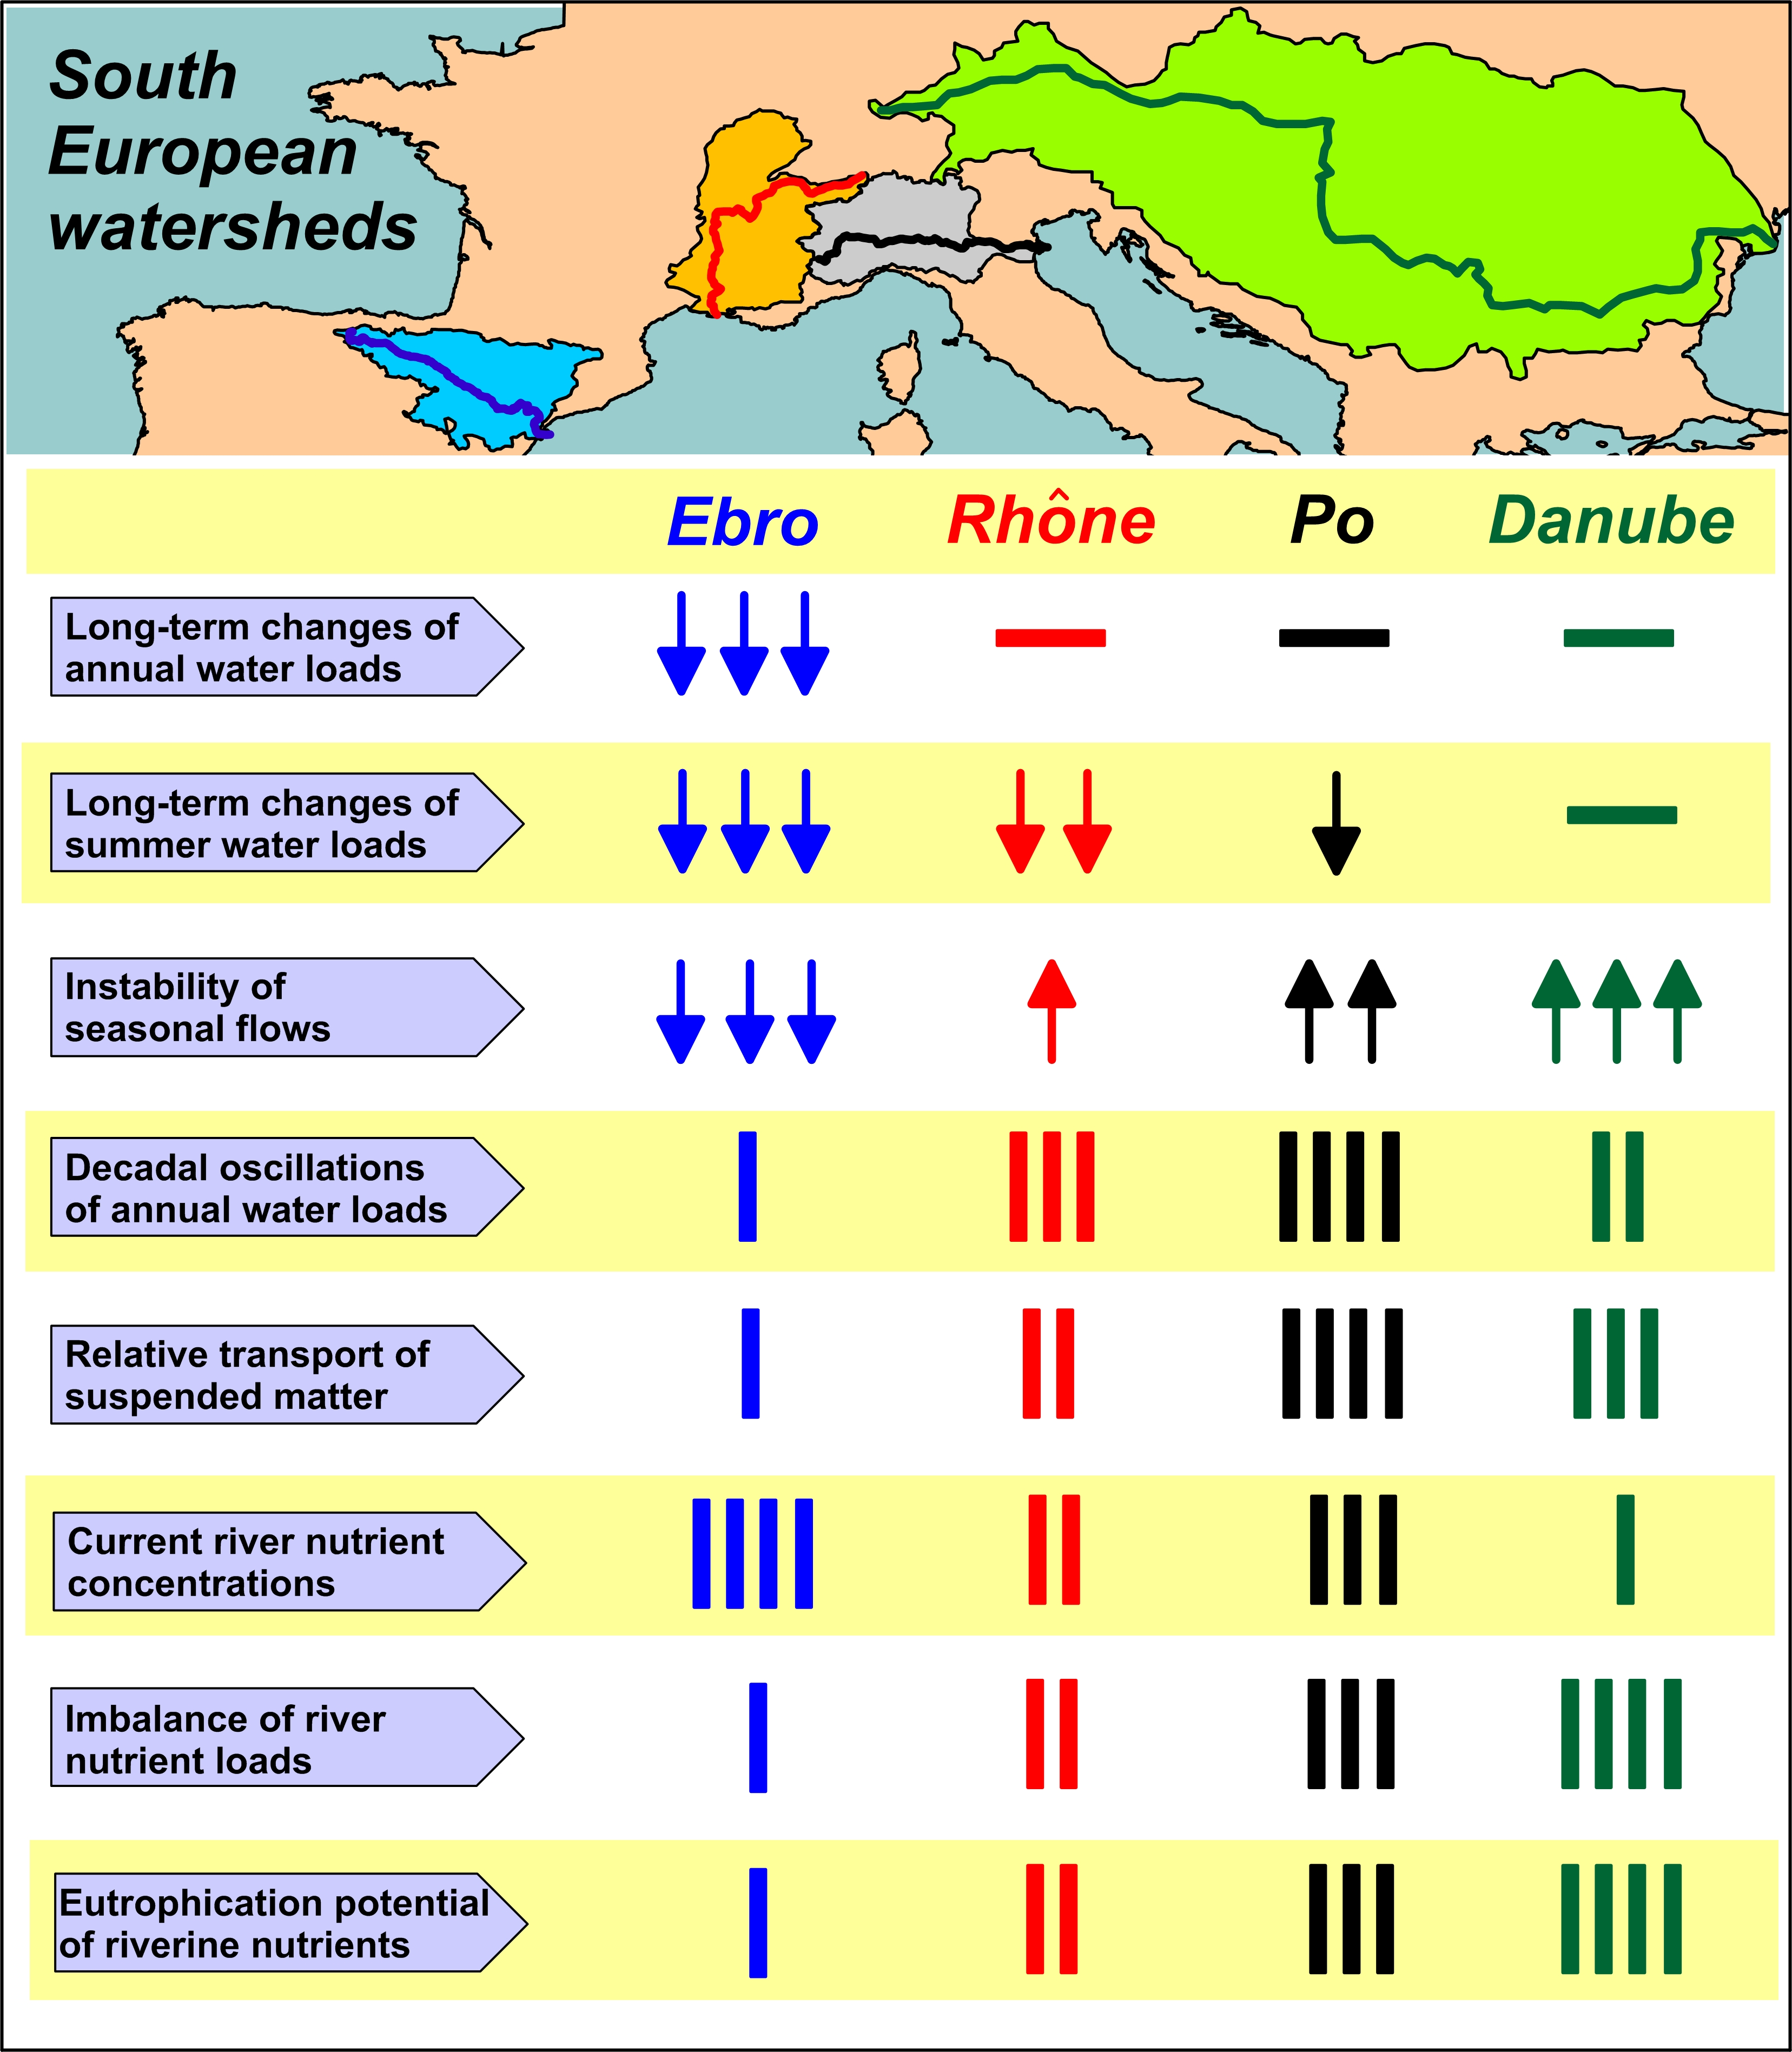
  • Flow dynamics of Ebro, Rhône, Po and Danube rivers exhibits a different incidence of freshets and droughts and distinct annual cycles. This feature suggests the importance of regional climatic factors in these drainage basins, despite the widespread presence of flow regulation systems.
  • Annual water discharges of the Ebro significantly decreased during the last century, whereas those Rhône, Po and Danube showed multi-decadal oscillations. For the Ebro, this difference is consistent with the rise of anthropogenic usage of freshwater in the drainage basins and with regional climate changes. For the other rivers, interannual variability of water discharge is still prevailing on long-term trends.
  • The decrease of water discharge of the Ebro was concomitant to a reduction of flow variability in all the seasons. For the Rhône, Po and Danube, the decrease of discharges occurred mostly in summer, with a concomitant increase of flow variability that suggests a greater instability of climatic conditions in their regions.
  • The concentrations of inorganic nutrients, TN and TP in the waters of Ebro and Po are about 50% higher than in those of Rhône and Danube. This finding suggests that the former two watersheds might be the most impacted ones by nutrient pollution, in a future scenario of reduced runoff, even in the presence of constant inputs due to agricultural, urban and industrial activities.
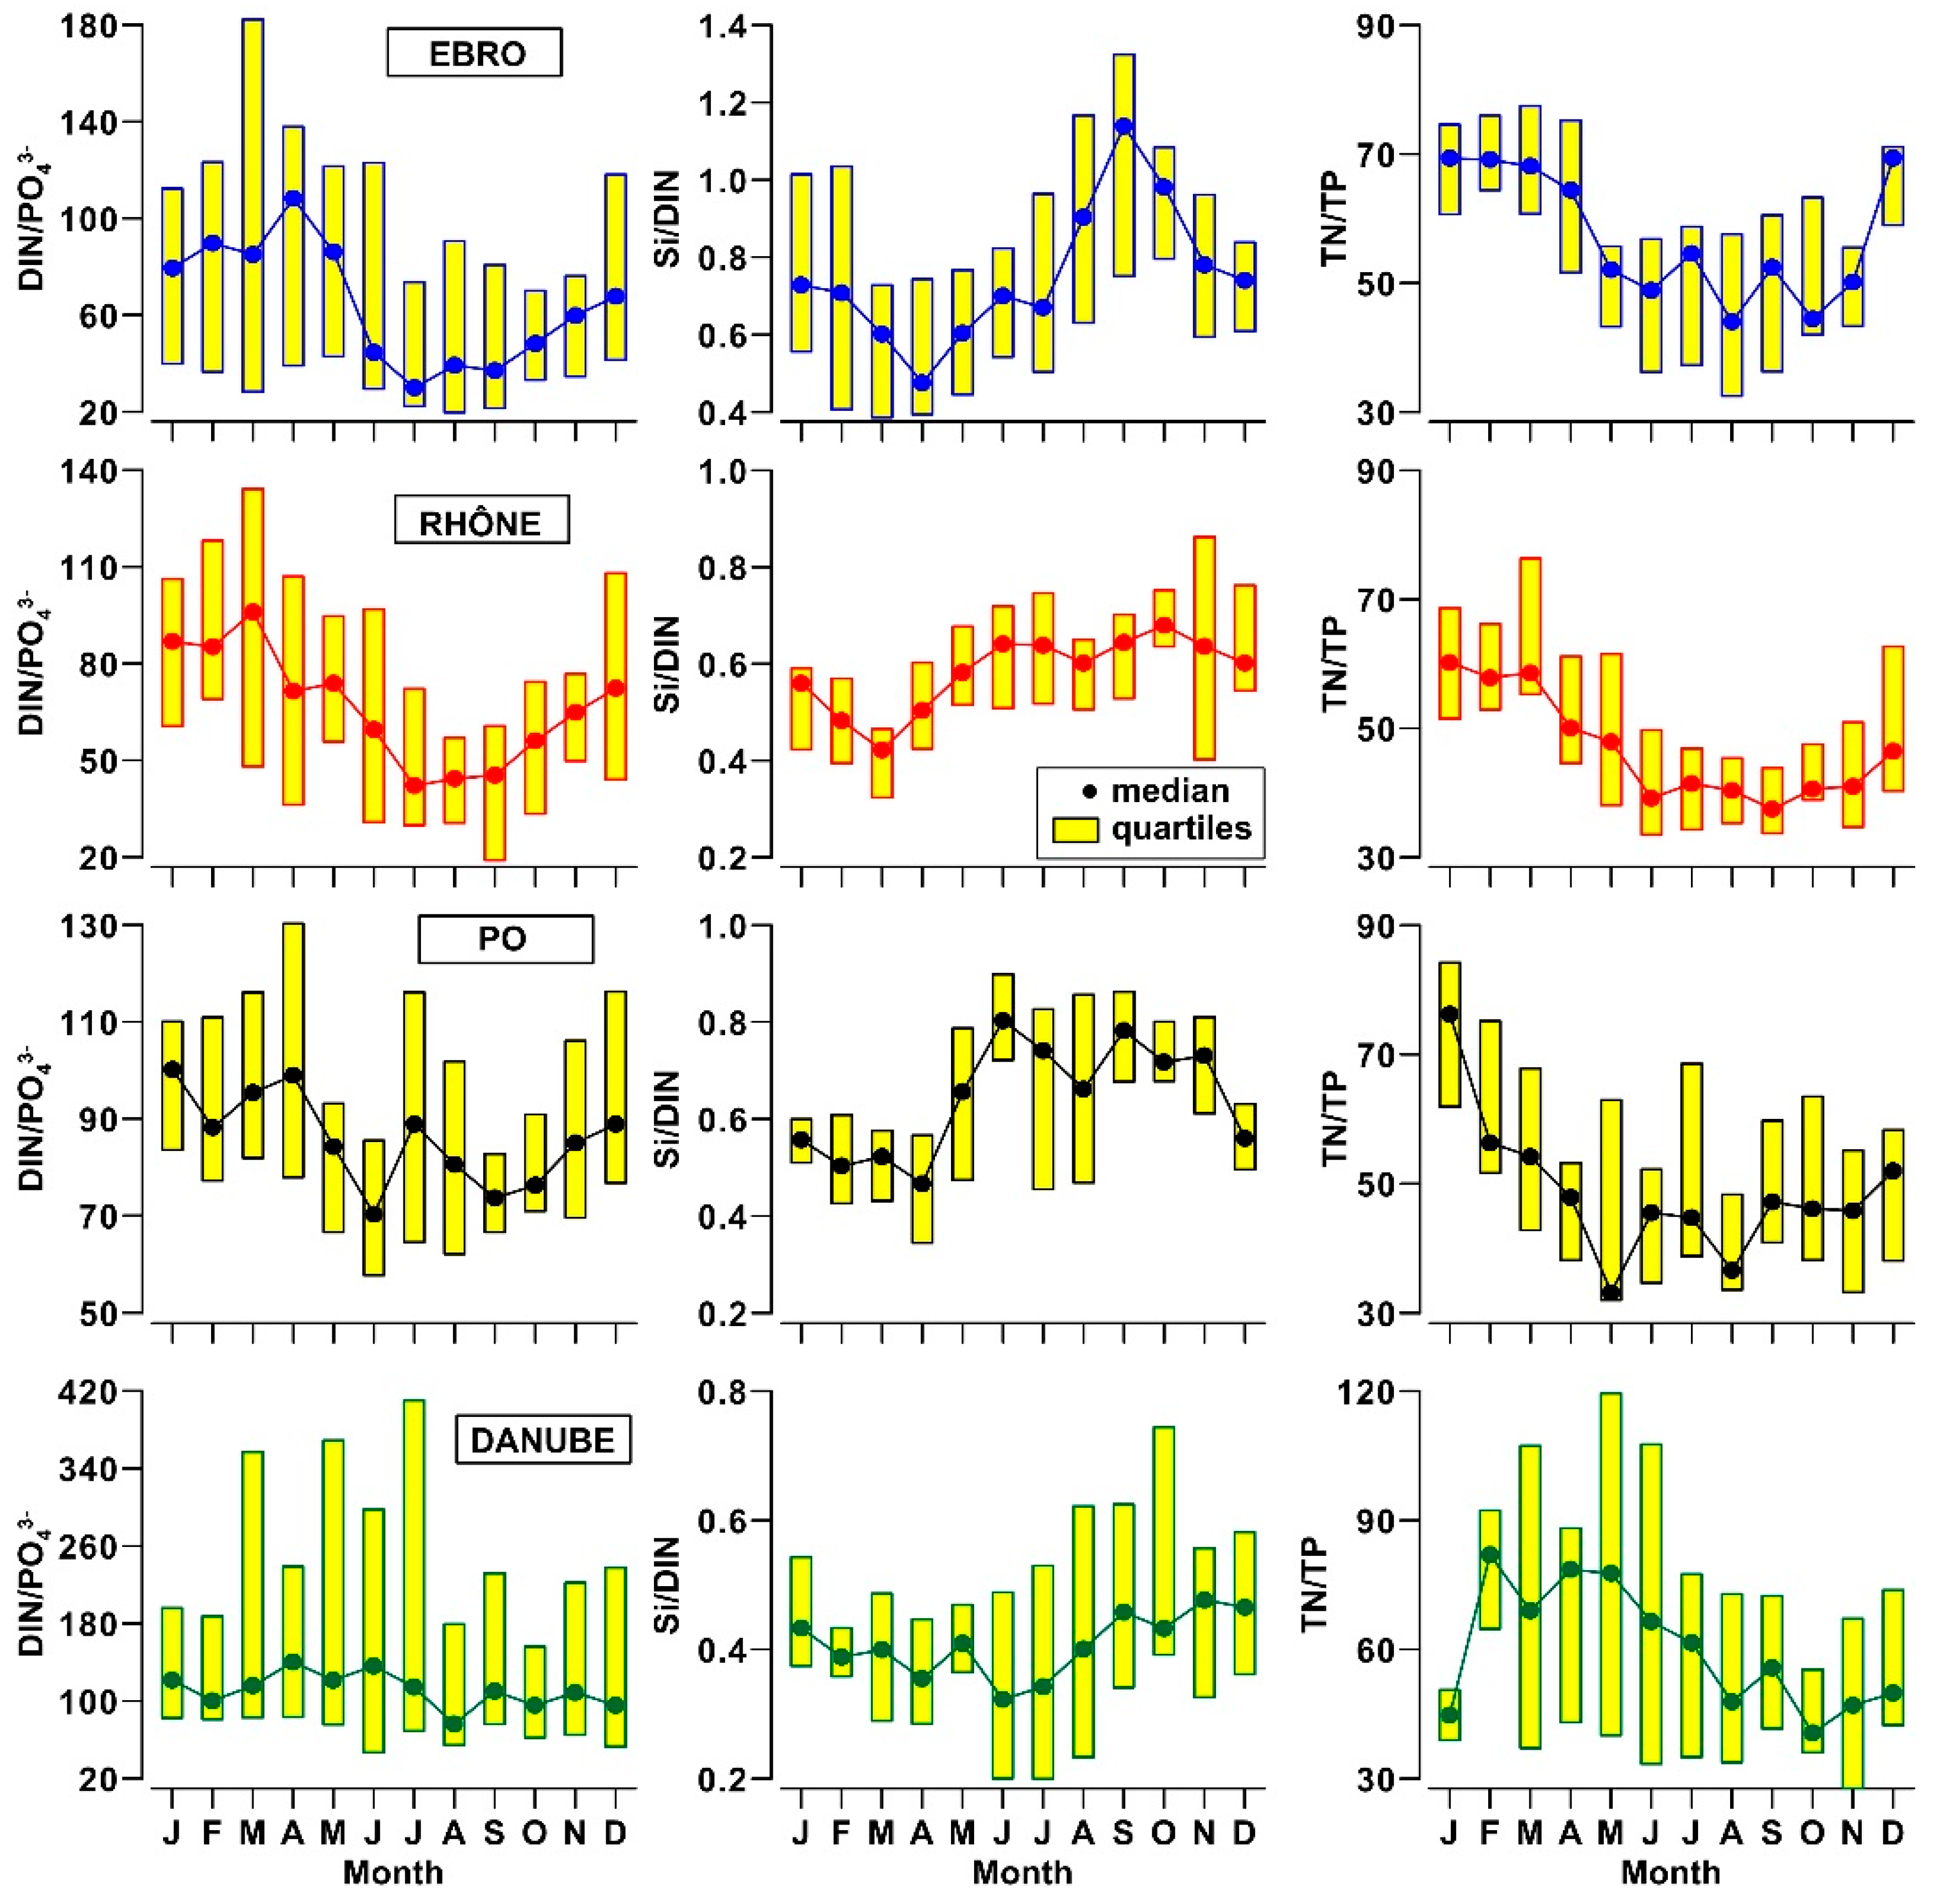
  • The concentrations of DIN and SiO2 show a clear annual cycle in these rivers, with the lowest levels (−50%) being reached in spring and summer. This cycle changes seasonally quantity and composition of the nutrient pool delivered into the receiving coastal water bodies.
  • The analysis of nutrient budgets indicated that these rivers have changed from a past condition characterized by large discharges of nutrients, with a rather balanced N:Si:P ratio, to overloads of DIN and SiO2 with respect to PO43−. This process has reduced the eutrophication of rivers, estuaries and coastal marine environments inducing, however, changes of ecological conditions that have to be further assessed.
  • Phosphorus scarcity is a common feature of these river and coastal ecosystems, but its potential ability to limit primary production significantly reduces if organic phosphorus is considered at least partially available for the growth of phytoplankton. For this reason, the real bioavailability of riverine organic phosphorus for auto- and hetero-trophs should be better investigated as it could play a key role in the regulation of the productivity and structure of plankton communities.
  • In the current post-eutrophic phase, the discharge of riverine TOC to the coastal zone is not negligible with respect to the eutrophication potential of river nutrients.

Author Contributions

Conception and design of the research, S.C. and M.G.; Data curation, S.C., C.I., L.L., P.R. and M.G.; Methodology, S.C.; Writing—original draft, S.C.; Writing—review & editing, S.C., C.I., L.L., P.R. and M.G.

Funding

This research was funded by European Project PERSEUS, “Policy-oriented marine Environmental Research in the Southern EUropean Seas” (FP 7, n. 287600).

Acknowledgments

The authors thank national institutions and environmental agencies of Spain (MAGRAMA, CHE, CAT), France (MEDDE, MIO), Italy (SIMN, ARPA Emilia Romagna, ICRAM, IRSA) and Romania (ABA Dobrogea-Litoral), as well as the European Environment Agency (EEA) for supplying information, flow and chemical data in river waters. For the Rhône, monitoring data were provided by the MOOSE Program with the support of the “Agence de l’eau Rhône–Méditérranée–Corse”. For the Danube, flow data were provided by the Global Runoff Data Center (GRDC - BFG) and monitoring data were provided by the International Commission for the Protection of the Danube River (ICPDR).

Conflicts of Interest

The authors declare no conflict of interest. The funders had no role in the design of the study; in the collection, analyses, or interpretation of data; in the writing of the manuscript, or in the decision to publish the results.

Appendix A

Figure A1. Frequency distributions of daily flows (m3 s−1) of the rivers and symmetry properties of population data (M0 = mode, γ = moment coefficient of skewness, β = Kurtosis).
Water 11 00001 g0a1
Table A1. Slope (km3 month−1 yr−1) of monthly integrated river discharge (km3 month−1) vs. time (yr) in flow series of Table 1 estimated by MKT and ST. The levels of significance of these trends are highlighted in gray (*** α = 0.001, ** α = 0.01, * α = 0.05, + α = 0.1, no symbols α > 0.1).
MonthEbroRhônePoDanube
km3 month−1 yr−1
Jan.−0.013 ***+0.011+0.001+0.045
Feb.−0.014 ***+0.008+0.001+0.041 *
Mar.−0.020 ***−0.001−0.009 +−0.005
Apr.−0.019 ***−0.002−0.007+0.025
May−0.015 ***−0.010 +−0.001−0.015
Jun.−0.014 ***−0.010 +−0.015 *−0.052 +
Jul.−0.005 ***−0.009 *−0.016 **−0.040
Aug.−0.002 *−0.007 **−0.008 *−0.014
Sep.−0.003 ***−0.004+0.001+0.011
Oct.−0.005 ***−0.001−0.004+0.020
Nov.−0.010 ***−0.001−0.005+0.006
Dec.−0.013 ***+0.012 +0.000+0.007
Table A2. Slope (% yr−1) of maximum monthly flow variability ([Qmax − Qmin] × 100/Qmax; %) vs. time (yr) in flow series of Table 1 estimated by MKT and ST. The levels of significance of these trends are highlighted in gray (*** α = 0.001, ** α = 0.01, * α = 0.05, + α = 0.1, no symbols α > 0.1).
MonthEbroRhônePoDanube
% yr−1
Jan.−0.116 ++0.065−0.065−0.123 *
Feb.−0.211 ***−0.002−0.054−0.135
Mar.−0.060+0.019−0.106+0.028
Apr.−0.019+0.082−0.021+0.074 +
May+0.063+0.047+0.007+0.201 ***
Jun.−0.040+0.105 ++0.119 *+0.123 *
Jul.−0.420 ***+0.279 ***+0.134 **+0.127 *
Aug.−0.417 ***+0.128 *−0.012+0.091 +
Sep.−0.481 ***+0.020−0.086+0.072
Oct.−0.251**+0.006−0.042+0.004
Nov.−0.222 ***+0.062−0.009−0.012
Dec.−0.165 *+0.017+0.038+0.034
Figure A2. Box Whisker Plot (median and quartiles) of monthly distribution of nutrient concentration (μmol L−1) in the Ebro, Rhône, Po and Danube waters, in 1990–2012.
Water 11 00001 g0a2
Table A3. Statistics of the dataset of annual transport (F; kt yr−1) of TSM, nutrients and total nitrogen and phosphorus at the river mouths of the Ebro, Rhône, Po and Danube, in 1990–2012.
YearF-TSM
kt yr−1
F-NO3
kt-N yr−1
F-NH4+
kt-N yr−1
F-NO2
kt-N yr−1
F-PO43−
kt-P yr−1
F-SiO2
kt-Si yr−1
F-TOC
kt-C yr−1
F-TN
kt-N yr−1
F-TP
kt-P yr−1
Ebro
Median70.9119.170.500.190.5030.3729.2826.120.81
1th Quartile51.7015.740.270.150.4421.6425.7021.850.51
3rd Quartile98.9124.640.690.281.0850.2043.2134.111.14
Min.21.0321.030.180.090.2016.1612.8313.680.42
Max.224.1038.151.480.431.9562.1449.3347.241.59
Rhône
Median2030.5679.982.911.272.33105.05155.20101.914.85
1th Quartile1262.6365.712.390.982.1178.11143.9289.274.08
3rd Quartile3972.3083.933.431.533.28116.62229.02109.665.39
Min.405.1449.671.160.440.7958.02124.2562.792.09
Max.7998.6099.544.592.526.24156.88279.43115.807.13
Po
Median5546.90102.113.991.442.88137.49246.42156.808.53
1th Quartile3434.5185.433.051.162.28118.75229.18111.376.27
3rd Quartile7771.78126.306.081.853.30183.28299.69227.1110.25
Min.1030.4751.421.600.541.6764.39225.1494.193.83
Max.16,292.57179.199.692.534.00243.46366.53295.1618.71
Danube
Median6565.15338.7762.727.958.28360.131139.75446.3018.96
1th Quartile4820.07297.0836.095.676.19298.29968.46374.2713.17
3rd Quartile10,478.27406.2675.938.9211.27452.541311.04587.2021.95
Min.2645.97188.4026.082.144.13189.11797.17270.0010.39
Max.19,077.89535.2289.7912.0515.96935.851482.33714.0540.47
Figure A3. Box Whisker Plot (median and quartiles) of monthly distribution of molar ratios of nutrients in the Ebro, Rhône, Po and Danube waters, in 1990–2012.
Water 11 00001 g0a3
Table A4. Slope (kt yr−2) of annual river transport (F; kt yr−1) of TSM, nutrients and organic matter vs time (yr) estimated by MKT and ST since the 1980s for Ebro, Rhône and Po and since 1997 for the Danube. The levels of significance (Mann-Kendall test) of these trends are highlighted in gray (*** α = 0.001, ** α = 0.01, * α = 0.05, + α = 0.1, no symbols α > 0.1).
ParameterEbroRhônePoDanube
kt yr−2
F-TSM−1.2 +−10.6−171+190
F-NO3−0.23−0.11−0.35−8.31
F-NH4++0.01−0.06−0.28 ***−3.58 **
F-NO2−0.01 *−0.04 ***−0.06 ***−0.18
F-DIN−0.36 +−0.35−0.81−11.1
F-PO43−−0.06 ***−0.22 ***−0.06 **−0.18
F-SiO2+1.3+0.04−1.06−7.04
F-TOC−1.36 +---
F-TN−0.22−0.52−1.07−32.5
F-TP−0.05 **−0.09−0.12 +0.00
F-ON+0.01−1.13 *+0.09−4.30
F-OP−0.01−0.02−0.04+0.08

References

  1. Smith, V.H. Eutrophication of freshwater and coastal marine ecosystems. A global problem. Environ. Sci. Pollut. Res. 2003, 10, 1–14. [Google Scholar] [CrossRef]
  2. Garnier, J.; Beusen, A.; Thieu, V.; Billen, G.; Bouwman, L. N:P:Si nutrient export ratios and ecological consequences in coastal seas evaluated by the ICEP approach. Glob. Biogeochem. Cycles 2010, 24, GB0A05. [Google Scholar] [CrossRef]
  3. Howarth, R.; Chan, F.; Conley, D.J.; Garnier, J.; Doney, S.C.; Marino, R.; Billen, G. Coupled biogeochemical cycles: Eutrophication and hypoxia in temperate estuaries and coastal marine ecosystems. Front. Ecol. Environ. 2011, 9, 18–26. [Google Scholar] [CrossRef]
  4. Ibáñez, C.; Alcaraz, C.; Caiola, N.; Rovira, A.; Trobajo, R.; Alonso, M.; Duran, C.; Jiménez, P.J.; Munné, A.; Prat, N. Regime shift from phytoplankton to macrophyte dominance in a large river: Top-down versus bottom-up effects. Sci. Total Environ. 2012, 416, 314–322. [Google Scholar] [CrossRef] [PubMed]
  5. Peñuelas, J.; Poulter, B.; Sardans, J.; Ciais, P.; van der Velde, M.; Bopp, L.; Boucher, O.; Godderis, Y.; Hinsinger, P.; Llusia, J.; et al. Human-induced nitrogen–phosphorus imbalances alter natural and managed ecosystems across the globe. Nat. Commun. 2013, 4, 2934. [Google Scholar] [CrossRef] [PubMed] [Green Version]
  6. Vollenweider, R.A.; Marchetti, R.; Viviani, R. Marine Coastal Eutrophication. Proceedings of an International Conference, Bologna, Italy, 21–24 March 1990; Elsevier: Amsterdam, The Netherlands; London, UK; New York, NY, USA; Tokyo, Japan, 1992; p. 1310. ISBN 978-0-444-89990-3. [Google Scholar]
  7. Howarth, R.; Anderson, D.; Cloern, J.; Elfring, C.; Hopkinson, C.; Lapointe, B.; Malone, T.; Marcus, N.; McGlathery, K.; Sharpley, A.; et al. Nutrient Pollution of Coastal Rivers, Bays, and Seas; Issues in Ecology, Ecological Society of America: Washington, DC, USA, 2000; Volume 7, p. 17. ISSN 1092-8987. [Google Scholar]
  8. Yunev, O.A.; Carstensen, J.; Moncheva, S.; Khaliulin, A.; Ærtebjerg, G.; Nixon, S. Nutrient and phytoplankton trends on the western Black Sea shelf in response to cultural eutrophication and climate changes. Estuar. Coast. Shelf Sci. 2007, 74, 63–76. [Google Scholar] [CrossRef]
  9. Rabouille, C.; Conley, D.J.; Dai, M.H.; Cai, W.-J.; Chen, C.T.A.; Lansard, B.; Green, R.; Yin, K.; Harrison, P.J.; Dagg, M.; et al. Comparison of hypoxia among four river-dominated ocean margin: The Changjiang (Yangtze), Mississippi, Pearl, and Rhône rivers. Cont. Shelf Res. 2008, 28, 1527–1537. [Google Scholar] [CrossRef]
  10. Oguz, T.; Velikova, V. Abrupt transition of the northwestern Black Sea shelf ecosystem from a eutrophic to an alternative pristine state. Mar. Ecol. Prog. Ser. 2010, 405, 231–242. [Google Scholar] [CrossRef] [Green Version]
  11. Djakovac, T.; Supić, N.; Bernardi-Aubry, F.; Degobbis, D.; Giani, M. Mechanisms of hypoxia frequency changes in the northern Adriatic Sea during the period 1972–2012. J. Mar. Syst. 2014, 141, 179–189. [Google Scholar] [CrossRef]
  12. Stachowitsch, M. Coastal hypoxia and anoxia: A multi-tiered holistic approach. Biogeosciences 2014, 11, 2281–2285. [Google Scholar] [CrossRef]
  13. Bianchi, T.S. The role of terrestrially derived organic carbon in the coastal ocean: A changing paradigm and the priming effect. Proc. Natl. Acad. Sci. USA 2011, 108, 19473–19481. [Google Scholar] [CrossRef] [PubMed] [Green Version]
  14. Asmala, E.; Autio, R.; Kaartokallio, H.; Stedmon, C.A.; Thomas, D.N. Processing of humic-rich riverine dissolved organic matter by estuarine bacteria: Effects of predegradation and inorganic nutrients. Aquat. Sci. 2014, 76, 451–463. [Google Scholar] [CrossRef]
  15. Durand, N.; Fiandrino, A.; Fraunié, P.; Ouillon, S.; Forget, P.; Naudin, J.J. Suspended matter dispersion in the Ebro ROFI: An integrated approach. Cont. Shelf Res. 2002, 22, 267–284. [Google Scholar] [CrossRef]
  16. Berlinsky, N.; Bogatova, Y.; Garkavaya, G. Estuary of the Danube. In Handbook of Environmental Chemistry; Water Pollution, 5 (PART H); Wangersky, P.J., Ed.; Springer: Berlin/Heidelberg, Germany, 2006; Volume 5, pp. 233–264. ISBN 978-3-540-00270-3. [Google Scholar]
  17. Syvitski, J.P.M.; Kettner, A.J.; Overeem, I.; Hutton, E.W.H.; Hannon, M.T.; Brakenridge, G.R.; Day, J.; Vörösmarty, C.; Saito, Y.; Giosan, L.; et al. Sinking deltas due to human activities. Nat. Geosci. 2009, 2, 681–686. [Google Scholar] [CrossRef] [Green Version]
  18. Markaki, Z.; Loÿe-Pilot, M.D.; Violaki, K.; Benyahya, L.; Mihalopoulos, N. Variability of atmospheric deposition of dissolved nitrogen and phosphorus in the Mediterranean and possible link to the anomalous seawater N/P ratio. Mar. Chem. 2010, 120, 187–194. [Google Scholar] [CrossRef]
  19. The MerMex Group. Marine ecosystems’ responses to climatic and anthropogenic forcings in the Mediterranean. Prog. Oceanogr. 2011, 91, 97–166. [Google Scholar] [CrossRef]
  20. Giani, M.; Djakovac, T.; Degobbis, D.; Cozzi, S.; Solidoro, C.; Fonda Umani, S. Recent changes in the marine ecosystems of the northern Adriatic Sea. Estuar. Coast. Shelf Sci. 2012, 115, 1–13. [Google Scholar] [CrossRef]
  21. Ludwig, W.; Dumont, E.; Meybeck, M.; Heussner, S. River discharges of water and nutrients to the Mediterranean and Black Sea: Major drivers for ecosystem changes during past and future decades? Prog. Oceanogr. 2009, 80, 199–217. [Google Scholar] [CrossRef]
  22. Huertas, I.E.; Ríos, A.F.; García-Lafuente, J.; Navarro, G.; Makaoui, A.; Sánchez-Román, A.; Rodriguez-Galvez, S.; Orbi, A.; Ruíz, J.; Pérez, F.F. Atlantic forcing of the Mediterranean oligotrophy. Glob. Biogeochem. Cycles 2012, 26, GB2022. [Google Scholar] [CrossRef]
  23. Kempe, S.; Pettine, M.; Cauwet, G. Biogeochemistry of European Rivers. In Biogeochemistry of Major World Rivers; SCOPE Report 42; Degens, E.T., Kempe, S., Richey, J.E., Eds.; ICSU, UNEP, John Wiley & Sons Ltd.: Chichester, UK, 1991; pp. 169–211. ISSN 1052-7613. [Google Scholar]
  24. Grizzetti, B.; Bouraoui, F.; Aloe, A. Changes of nitrogen and phosphorus loads to European seas. Glob. Chang. Biol. 2012, 18, 769–782. [Google Scholar] [CrossRef]
  25. Romero, E.; Garnier, J.; Lassaletta, L.; Billen, G.; Le Gendre, R.; Riou, P.; Cugier, P. Large-scale patterns of river inputs in southwestern Europe: Seasonal and interannual variations and potential eutrophication effects at the coastal zone. Biogeochemistry 2013, 113, 481–505. [Google Scholar] [CrossRef]
  26. DANUBS Final Report. Nutrient Management in the Danube Basin and Its Impact on the Black Sea. EVK1-CT-2000-00051. 2005, p. 78. Available online: http://danubs.tuwien.ac.at (accessed on 12 October 2017).
  27. Ibáñez, C.; Prat, N.; Duran, C.; Pardos, M.; Munné, A.; Andreu, R.; Caiola, N.; Cid, N.; Hampel, H.; Sánchez, R.; Trobajo, R. Changes in dissolved nutrients in the lower Ebro river: Causes and consequences. Limnetica 2008, 27, 131–142. [Google Scholar]
  28. Ollivier, P.; Radakovitch, O.; Hamelin, B. Major and trace element partition and fluxes in the Rhône River. Chem. Geol. 2011, 285, 15–31. [Google Scholar] [CrossRef]
  29. Viaroli, P.; Soana, E.; Pecora, S.; Laini, A.; Naldi, M.; Fano, E.A.; Nizzoli, D. Space and time variations of watershed N and P budgets and their relationships with reactive N and P loadings in a heavily impacted river basin (Po river, Northern Italy). Sci. Total Environ. 2018, 639, 1574–1587. [Google Scholar] [CrossRef] [PubMed]
  30. Cruzado, A.; Velásquez, Z.; Pérez, M.D.C.; Bahamón, N.; Grimaldo, N.S.; Ridolfi, F. Nutrient fluxes from the Ebro River and subsequent across-shelf dispersion. Cont. Shelf Res. 2002, 22, 349–360. [Google Scholar] [CrossRef]
  31. Alvisi, F.; Cozzi, S. Seasonal dynamics and long-term trends of hypoxia in the coastal zone of Emilia Romagna (NW Adriatic Sea, Italy). Sci. Total Environ. 2016, 541, 1448–1462. [Google Scholar] [CrossRef] [PubMed]
  32. Kovats, R.S.; Valentini, R.; Bouwer, L.M.; Georgopoulou, E.; Jacob, D.; Martin, E.; Rounsevell, M.; Soussana, J.-F. Europe. In Climate Change 2014: Impacts, Adaptation, and Vulnerability. Part B: Regional Aspects. Contribution of Working Group II to the Fifth Assessment Report of IPCC; Cambridge University Press: Cambridge, UK; New York, NY, USA, 2014; pp. 1267–1326. ISBN 978-1-107-05816-3. [Google Scholar]
  33. Díaz, F.; Naudin, J.J.; Courties, C.; Rimmelin, P.; Oriol, L. Biogeochemical and ecological functioning of the low-salinity water lenses in the region of the Rhone River freshwater influence, NW Mediterranean Sea. Cont. Shelf Res. 2008, 28, 1511–1526. [Google Scholar] [CrossRef]
  34. Cozzi, S.; Giani, M. River water and nutrient discharges in the Northern Adriatic Sea: Current importance and long-term changes. Cont. Shelf Res. 2011, 31, 1881–1893. [Google Scholar] [CrossRef]
  35. Tuǧrul, S.; Murray, J.W.; Friederich, G.E.; Salihoǧlu, T. Spatial and temporal variability in the chemical properties of the oxic and suboxic layers of the Black Sea. J. Mar. Syst. 2014, 135, 29–43. [Google Scholar] [CrossRef]
  36. Lutz, S.R.; Mallucci, S.; Diamantini, E.; Majone, B.; Bellin, A.; Merz, R. Hydroclimatic and water quality trends across three Mediterranean river basins. Sci. Total Environ. 2016, 571, 1392–1406. [Google Scholar] [CrossRef]
  37. Zampieri, M.; Scoccimarro, E.; Gualdi, S.; Navarra, A. Observed shift towards earlier spring discharge in the main Alpine rivers. Sci. Total Environ. 2015, 503–504, 222–232. [Google Scholar] [CrossRef] [PubMed]
  38. Ibáñez, C.; Prat, N. The environmental impact of the Spanish National Hydrological Plan on the lower Ebro River and Delta. Int. J. Water Resour. Dev. 2003, 19, 485–500. [Google Scholar] [CrossRef]
  39. Falco, S.; Niencheski, L.F.; Rodilla, M.; Romero, I.; González del Río, J.; Sierra, J.P.; Mösso, C. Nutrient flux and budget in the Ebro Estuary. Estuar. Coast. Shelf Sci. 2010, 87, 92–102. [Google Scholar] [CrossRef]
  40. Torrecilla, N.J.; Galve, J.P.; Zaera, L.G.; Retamar, J.F.; Álvarez, A.N.A. Nutrient sources and dynamics in a Mediterranean fluvial regime (Ebro River, NE Spain) and their implications for water management. J. Hydrol. 2005, 304, 166–182. [Google Scholar] [CrossRef]
  41. Tornés, E.; Pérez, M.C.; Durán, C.; Sabater, S. Reservoirs override seasonal variability of phytoplankton communities in a regulated Mediterranean river. Sci. Total Environ. 2014, 475, 225–233. [Google Scholar] [CrossRef] [PubMed]
  42. Higueras, M.; Kerhervé, P.; Sanchez-Vidal, A.; Calafat, A.; Ludwig, W.; Verdoit-Jarraya, M.; Heussner, S.; Canals, M. Biogeochemical characterization of the riverine particulate organic matter transferred to the NW Mediterranean Sea. Biogeosciences 2014, 11, 157–172. [Google Scholar] [CrossRef] [Green Version]
  43. Denant, V.; Saliot, A. Seasonal variations of nutrients (NO3, NO2, NH4+, PO43− and Si(OH)4) and suspended matter in the Rhône delta, France. Oceanol. Acta 1990, 13, 47–52. [Google Scholar]
  44. Moutin, T.; Raimbault, P.; Golterman, H.L.; Coste, B. The input of nutrients by the Rhône River into the Mediterranean Sea: Recent observations and comparison with earlier data. Hydrobiologia 1998, 373/374, 237–246. [Google Scholar] [CrossRef]
  45. Fruget, J.-F.; Centofanti, M.; Dessaix, J.; Olivier, J.-M.; Druart, J.-C.; Martinez, P.-J. Temporal and spatial dynamics in large rivers: Example of a long-term monitoring of the middle Rhône River. Ann. Limnol. 2001, 37, 237–251. [Google Scholar] [CrossRef]
  46. Basin Authority of Po River. Characteristics of Po River Basin and Preliminary Assessment of the Environmental Impact of Human Activities on Hydrological Resources. Parma, Italy, 2006; p. 643, [Italian]. Available online: http://www.adbpo.gov.it/it/distretto-del-po/alcuni-dati (accessed on 29 January 2017).
  47. Copetti, D.; Carniato, L.; Crise, A.; Guyennon, N.; Palmeri, L.; Pisacane, G.; Struglia, M.V.; Tartari, G. Impacts of Climate Change on Water Quality. In Regional Assessment of Climate Change in the Mediterranean; Advances in Global Change Research; Navarra, A., Tubiana, L., Eds.; Springer: Dordrecht, The Netherlands, 2013; Volume 50, pp. 307–332. ISBN 978-94-007-5780-6. [Google Scholar]
  48. Tesi, T.; Miserocchi, S.; Acri, F.; Langone, L.; Boldrin, A.; Hatten, J.A.; Albertazzi, S. Flood-driven transport of sediment, particulate organic matter, and nutrients from the Po River watershed to the Mediterranean Sea. J. Hydrol. 2013, 498, 144–152. [Google Scholar] [CrossRef]
  49. Humborg, C.; Ittekkot, V.; Cociasu, A.; Bodungen, B.V. Effect of Danube River dam on Black Sea biogeochemistry and ecosystem structure. Nature 1997, 386, 385–388. [Google Scholar] [CrossRef]
  50. Rice, E.W.; Baird, R.B.; Eaton, A.D.; Clesceri, L.S. Standard Methods for the Examination of Water and Wastewater, 22nd ed.; American Public Health Association: Washington, DC, USA, 2012; p. 1360. ISBN 978-087553-013-0. [Google Scholar]
  51. Grasshoff, K.; Kremling, K.; Ehrhardt, M. Methods of Seawater Analysis. Third Completely Revised and Extended Edition; Wiley-VCH Verlag GmbH: Weinheim, Germany, 1999; p. 632. ISBN 978-3-527-61399-1. [Google Scholar]
  52. Ott, W.R. Environmental Statistics and Data Analysis; Lewis Publishers: Boca Raton, FL, USA; London, UK; New York, NY, USA; Washington, DC, USA, 1994; p. 336. ISBN 9780873718486. [Google Scholar]
  53. Chen, Z.; Grasby, S.E. Impact of decadal and century-scale oscillations on hydroclimate trend analyses. J. Hydrol. 2009, 365, 122–133. [Google Scholar] [CrossRef]
  54. Rodionov, S.N. A sequential method of detecting abrupt changes in the correlation coefficient and its application to Bering Sea Climate. Climate 2015, 3, 474–491. [Google Scholar] [CrossRef]
  55. Pujo-Pay, M.; Conan, P.; Oriol, L.; Cornet-Barthaux, V.; Falco, C.; Ghiglione, J.-F.; Goyet, C.; Moutin, T.; Prieur, L. Integrated survey of elemental stoichiometry (C, N, P) from the western to eastern Mediterranean Sea. Biogeosciences 2011, 8, 883–899. [Google Scholar] [CrossRef] [Green Version]
  56. Dafner, E.V.; Boscolo, R.; Bryden, H.L. The N:Si:P molar ratio in the Strait of Gibraltar. Geophys. Res. Lett. 2003, 30, 1506. [Google Scholar] [CrossRef]
  57. Ren, L.; Wang, P.; Wang, C.; Chen, J.; Hou, J.; Qian, J. Algal growth and utilization of phosphorus studied by combined mono-culture and co-culture experiments. Environ. Pollut. 2017, 220, 274–285. [Google Scholar] [CrossRef]
  58. Ivančić, I.; Godrijan, J.; Pfannkuchen, M.; Marić, D.; Gašparović, B.; Djakovac, T.; Najdeka, M. Survival mechanisms of phytoplankton in conditions of stratification-induced deprivation of orthophosphate: Northern Adriatic case study. Limnol. Oceanogr. 2012, 57, 1721–1731. [Google Scholar] [CrossRef]
  59. Ursella, L.; Poulain, P.M.; Signell, R.P. Surface drifter derived circulation in the northern and middle Adriatic Sea: Response to wind regime and season. J. Geophys. Res. Oceans 2007, 112, C03S04. [Google Scholar] [CrossRef]
  60. Naudin, J.J.; Cauwet, G.; Fajon, C.; Oriol, L.; Terzic, S.; Devenon, J.-L.; Broche, P. Effect of mixing on microbial communities in the Rhone River plume. J. Mar. Syst. 2001, 28, 203–227. [Google Scholar] [CrossRef]
  61. Turco, M.; Quintana-Seguí, P.; Llasat, M.C.; Herrera, S.; Gutiérrez, J.M. Testing MOS precipitation downscaling for ENSEMBLES regional climate models over Spain. J. Geophys. Res. 2011, 116, D18109. [Google Scholar] [CrossRef]
  62. Stagl, J.C.; Hattermann, F.F. Impacts of Climate Change on the Hydrological Regime of the Danube River and Its Tributaries Using an Ensemble of Climate Scenarios. Water 2015, 7, 6139–6172. [Google Scholar] [CrossRef] [Green Version]
  63. Lionello, P.; Malanotte-Rizzoli, P.; Boscolo, R.; Alpert, P.; Artale, V.; Li, L.; Luterbacher, J.; May, W.; Trigo, R.; Tsimplis, M.; et al. The Mediterranean climate: An overview of the main characteristics and issues. Dev. Earth Environ. Sci. 2006, 4, 1–26. [Google Scholar] [CrossRef]
  64. Schubert, S.D.; Stewart, R.E.; Wang, H.; Barlow, M.; Berbery, E.H.; Cai, W.; Hoerling, M.P.; Kanikicharla, K.K.; Koster, R.D.; Lyon, B.; et al. Global meteorological drought: A synthesis of current understanding with a focus on SST drivers of precipitation deficits. J. Clim. 2016, 29, 3989–4019. [Google Scholar] [CrossRef]
  65. Forget, P.; André, G. Can Satellite-derived Chlorophyll Imagery Be Used to Trace Surface Dynamics in Coastal Zone? A Case Study in the Northwestern Mediterranean Sea. Sensors 2007, 7, 884–904. [Google Scholar] [CrossRef] [Green Version]
  66. D’Ortenzio, F.; Ribera d’Alcalà, M. On the trophic regimes of the Mediterranean Sea. Biogeosciences 2009, 6, 139–148. [Google Scholar] [CrossRef]
  67. Alekseenko, E.; Raybaud, V.; Espinasse, B.; Carlotti, F.; Queguiner, B.; Thouvenin, B.; Garreau, P.; Baklouti, M. Seasonal dynamics and stoichiometry of the planktonic community in the NW Mediterranean Sea: A 3D modeling approach. Ocean Dyn. 2014. [Google Scholar] [CrossRef]
  68. Harding, L.W.; Degobbis, D.; Precali, R. Production and fate of phytoplankton: Annual cycles and interannual variability. In Ecosystems at the Land-Sea Margin: Drainage Basin to Coastal Sea; Coastal and Estuarine Studies; Malone, T.C., Malej, A., Harding, L.W., Smodlaka, N., Turner, R.E., Eds.; American Geophysical Union: Washington, DC, USA, 1999; Volume 55, pp. 131–172. ISBN 0-87590-269-3. [Google Scholar]
  69. Melin, F.; Vantrepotte, V.; Clerici, M.; D’Alimonte, D.; Zibordi, G.; Berthon, J.-F.; Canuti, E. Multi-sensor satellite time series of optical properties and chlorophyll-a concentration in the Adriatic Sea. Prog. Oceanogr. 2011, 91, 229–244. [Google Scholar] [CrossRef]
  70. Díaz, F.; Raimbault, P.; Boudjellal, B.; Garcia, N.; Moutin, T. Early phosphorus limitation during spring in the Gulf of Lions. Mar. Ecol. Prog. Ser. 2001, 211, 51–62. [Google Scholar] [CrossRef]
  71. Cristofor, S.; Vadineanu, A.; Ignat, G. Importance of flood zones for nitrogen and phosphorus dynamics in the Danube Delta. Hydrobiologia 1993, 251, 143–148. [Google Scholar] [CrossRef]
  72. Raimbault, P.; Durrieu de Madron, X. Research activities in the Gulf of Lion (NW Mediterranean) within the 1997–2001 PNEC project. Oceanol. Acta 2003, 26, 291–298. [Google Scholar] [CrossRef]
  73. Nebra, A.; Alcaraz, C.; Caiola, N.; Muñoz-Camarillo, G.; Ibáñez, C. Benthic macrofaunal dynamics and environmental stress across a salt wedge Mediterranean estuary. Mar. Environ. Res. 2016, 117, 21–31. [Google Scholar] [CrossRef] [PubMed]
  74. Fonda Umani, S. Pelagic production and biomass in the Adriatic Sea. Sci. Mar. 1996, 60, 65–77. [Google Scholar]
  75. Giani, M.; Rinaldi, A.; Degobbis, D. Mucilages in the Adriatic and Tyrrhenian Sea: An introduction. Sci. Total Environ. 2005, 353, 3–9. [Google Scholar] [CrossRef] [PubMed]
  76. Aubrey, D.; Moncheva, S.; Demirov, E.; Diaconu, V.; Dimitrov, A. Environmental changes in the western Black Sea related to anthropogenic and natural conditions. J. Mar. Syst. 1996, 7, 411–425. [Google Scholar] [CrossRef]
  77. Daskalov, G.M.; Boicenco, L.; Grishin, A.N.; Lazar, L.; Mihneva, V.; Shlyakhov, V.A.; Zengin, M. Architecture of collapse: Regime shift and recovery in an hierarchically structured marine ecosystem. Glob. Chang. Biol. 2017, 23, 1486–1498. [Google Scholar] [CrossRef] [PubMed]
  78. Bostan, V.; Dominik, J.; Bostina, M.; Pardos, M. Forms of particulate phosphorus in suspension and in bottom sediment in the Danube Delta. Lakes Reserv. Res. Manag. 2000, 5, 105–110. [Google Scholar] [CrossRef]
  79. Ptacnik, R.; Andersen, T.; Tamminen, T. Performance of the Redfield Ratio and a family of nutrient limitation indicators as thresholds for phytoplankton N vs. P limitation. Ecosystems 2010, 13, 1201–1214. [Google Scholar] [CrossRef]
  80. Lazǎr, L.; Gomoiu, M.-T.; Boicenco, L.; Vasiliu, D. Total Organic Carbon (TOC) of the surface layer sediments covering the seafloor of the Romanian Black Sea coast. Geoecomarina 2012, 18, 121–132. [Google Scholar]
Figure 1. Drainage basins and main river courses of the Ebro, Rhône, Po and Danube.
Water 11 00001 g001
Figure 2. Box Whisker Plot (median, quartiles, data range) of monthly integrated river water discharge (km3 month−1).
Water 11 00001 g002
Figure 3. Time series of annual discharge (Qyr; km3 yr−1) of the Ebro, Rhône, Po and Danube during the last century. Yellow areas indicate the median of water discharge and the arrows indicate 1st and 3rd quartile (data in Table 1).
Water 11 00001 g003
Figure 4. Time series of annual transport (kt yr−1) of the main nutrients (DIN, PO43− and SiO2) in the four considered rivers.
Water 11 00001 g004
Figure 5. Eutrophication potential of river nutrient loads (EP; kt-C yr−1) estimated by Redfield’s model and annual river discharges of DIN, SiO2, TP and PO43−. For each year, the lowest value of EP identifies the nutrient that potentially limits the new production sustained by river loads.
Water 11 00001 g005
Table 1. General characteristics of drainage basins and river runoff (km3 yr−1) of the Ebro, Rhône, Po and Danube.
River
(Gauging Station)
Drainage Basin
(km2)
River Length
(km)
Inhabitants
(n · 106)
Water Flow Data Series
(yr)
Annual Water Flow
(km3 yr−1)
Median 1th–3rd Quartile Range
Ebro
(Tortosa)
86,80093031914–1931,
1951–2012
13.08.7–17.13.8–34.1
Rhône
(Beaucaire)
157,950813181920–201253.945.8–61.722.8–78.0
Po
(Pontelagoscuro)
74,000682161914–201245.538.8–55.726.2–82.7
Danube
(Ceatal Izmail)
801,5002857821931–2012201.2178.6–221.0134.2–300.2
Total1,120,25052821201951–2012316.8297.9–344.9208.6–424.0
included tributaries; main river course.
Table 2. Analysis of the discontinuities in the series of annual river water discharge by SRSD method (cut-off length = 10 yr, Huber’s weight = 1): periods of homogenous flow, year of the shift, change of annual flow (Δ-flow) and confidence level (α).
RiverPeriodMean Flow
km3 yr−1 (m3 s−1)
Duration
yr
Year of Change
yr
Δ-Flow
km3 yr−1
Confidence
α
1914–197916.5 (539)66
Ebro1980–20109.1 (292)311980−7.40.0001
2011–20124.9 (154)22011−4.20.0209
Rhône1920–194155.9 (1772)22
1942–197650.9 (1614)351942−5.00.1292
1977–200256.7 (1797)261977+5.80.0284
2003–201246.6 (1478)102003−10.10.0018
Po1914–194151.3 (1593)28
1942–197443.7 (1390)331942−7.60.0163
1975–200250.4 (1626)281975+6.70.0183
2003–200832.6 (1058)62003−17.80.0006
2009–201248.7 (1551)42009+16.10.0548
Danube1931–1945212.4 (6729)15
1946–1964189.0 (5990)191946−23.40.0910
1965–1982225.3 (7141)181965+36.30.0016
1983–2010201.5 (6381)281983−23.80.0208
2011–2012164.6 (5213)22011−36.90.0003
Table 3. Concentration (median, 1st–3rd quartile) of TSM (mg L−1), nutrients and organic matter (μmol L−1) in river waters and nutrient molar ratios, in 1990–2012.
River
(Station)
Ebro
(Tortosa)
Rhône
(Arles)
Po
(Polesella, Serravalle, Pontelagoscuro)
Danube
(Reni, Sulina)
TSM (mg L−1)7.5 (5.0–11.0)12.3 (7.4–29)46.8 (28.4–110)26.5 (15.0–44)
NO3 (µmol L−1)165 (142–194)97 (76–119)161 (124–202)111 (82–141)
NH4+ (µmol L−1)2.8 (2.2–5.5)3.3 (1.5–5.6)5.3 (2.6–10.2)15.0 (9.1–25)
NO2 (µmol L−1)1.5 (1.1–2.0)1.6 (1.1–2.0)2.0 (1.3–3.0)2.1 (1.4–3.4)
DIN (µmol L−1)171 (146–201)102 (84–125)168 (302–216)132 (105–163)
PO43− (µmol L−1)2.3 (1.5–4.5)1.5 (1.1–1.9)1.9 (1.6–2.6)1.3 (0.6–2.0)
SiO2 (µmol L−1)130 (93–160) 64 (51–78)113 (85–134)61 (37–82)
TN (µmol L−1)211 (180–234) 123 (101–148) *249 (197–304) +147 (121–187) °°
TP (µmol L−1)2.9 (2.6–3.6)2.6 (2.2–3.2) *4.8 (4.2–6.1)2.8 (1.9–4.0)
TOC (µmol L−1)270 (208–341) 241 (199–304)340 (268–460) °398 (294–569) **
ON (µmol L−1)28.1 (22–46) 18.2 (12.7–29) *76 (41–145)25.3 (19.2–33) °°
OP (µmol L−1)1.0 (0.4–1.7)1.2 (0.8–1.8) *2.9 (1.9–4.1)1.2 (0.6–2.1)
DIN/PO43− (molar)72 (36–118)73 (52–100)85 (61–107)94 (62–228)
Si/DIN (molar)0.7 (0.5–1.0) 0.6 (0.5–0.7)0.6 (0.5–0.8)0.5 (0.4–0.8) °°
TN/TP (molar)58 (44–70) 45 (37–59) *49 (37–64)55 (38–82) °°
ON/OP (molar)20 (11–31)15 (10–22) *25 (16–46)17 (9–41) °°
ON/TN (%)15 (11–21) 16 (10–22) *34 (20–49)16 (13–22) °°
OP/TP (%)32 (13–57)49 (35–63) *60 (47–72)49 (30–72)
1990–2005; * 1996–2012; ** 2006–2007; ° 1995–2002; °° 1996–2012.
Table 4. Summary of the descriptors analyzed in this study and of the potential impacts in the adjacent coastal zones discussed in the Section 4.1 and Section 4.2.
DescriptorEbro
NE Shelf of Spain
Rhône
Gulf of Lion
Po
NW Adriatic Sea
Danube
NW Black Sea
Environmental Impacts
Annual freshwater dischargeLong-term decrease.Interannual to multi-decadal oscillations increased recently.Interannual to multi-decadal oscillations increased recently.Interannual to multi-decadal oscillations.Marked regional differences of river discharges. Increased droughts in summer more marked in SW Europe than in SE Europe. Increased oscillations of summer runoff in SE Europe.
Long-term trend of monthly flowsDecrease in all months.Decrease in late spring and summer.Decrease in summer.Small decrease in summer.
Long-term trend of flow oscillationsDecrease in all months.Increase in summer.Increase in summer.Increase in spring and summer.
Dry seasonsSummer.Summer.Winter and summer.Winter and summer.
Flow regimeLow with a high incidence of freshets.High with low incidence of freshets.Intermediate with a high incidence of freshets.Very high with low incidence of freshets.
Concentrations of TSM and nutrientsLow TSM, high nutrients.Low TSM, low nutrients.High TSM, high nutrients.Medium TSM, medium nutrients.Impact of the decrease of TSM transport on estuarine and coastal areas. Distinct impacts of seasonal changes of nutrients on riverine, estuarine and coastal ecosystems.
Variability of nutrient concentrationsSeasonal cycle (except PO43−).Seasonal cycle (for PO43− only since 2007).Seasonal cycle.Seasonal cycle
Variability of DIN/PO43−, TN/TP and Si/DIN ratiosSeasonal oscillations (low N/P in summer, low Si/DIN in spring).Seasonal oscillations (low N/P in summer, low Si/DIN in spring).Seasonal oscillations (low N/P in summer, low Si/DIN in spring).Rather constant DIN/PO43− through the year, high TN/TP in spring.
Incidence of organic nitrogen and phosphorus on TN and TP poolsON: low
OP: low
ON: low
OP: medium
ON: high
OP: high
ON: low
OP: high
Potential growth of marine plankton species able to utilize riverine ON and OP.
Recent trends of annual loads of TSM, nutrients and OMDecreases of TSM, N, P and TOC transport since the 1990s. Oscillations of SiO2.Decrease of PO43− and ON transport since the 1980s. Oscillations of SiO2 and DIN.Decreases of NH4+, NO2 and PO43− and TP transport since the 1980s. Oscillations of SiO2.Decreased transport of NH4+ since the 1990s. Oscillating N, P transports since the 2000s.Reduction of PO43− transport leading to phytoplankton biomass reduction. Oscillation of nutrient loads linked to runoff variability.
Marine region of freshwater influenceSmall, limited by continental shelf orography.Medium, limited by continental shelf orography.Large, enhanced by continental shelf orography.Very large, enhanced by continental shelf orography.Larger impacts in the coastal zones of Po and Danube, even if river loads are reduced.
Eutrophication potential of river nutrient loads in the receiving coastal zonesUntil 1995, high and balanced nutrient loads. Afterwards, excesses of DIN and SiO2 over PO43−. Low weight of OP in TP.Until 1990, high and balanced nutrient loads. Afterwards, excesses of DIN and SiO2, over PO43−. Medium weight of OP in TP.Until 1990, high and balanced nutrient loads, with a surplus of OP. Afterwards, excesses of DIN and SiO2, over PO43−. Persistent high weight of OP in TP.Since 2000s, excesses of DIN and SiO2, over PO43−. Medium weight of OP in TP.Shift form eutrophic conditions to oligotrophic, but still degraded, conditions around the 1990s. PO43− scarcity sometime potentially compensated by OP bioavailability.

