Phosphorus Budget for a Forested-Agricultural Watershed in Korea
by
 ,
,
Arif Reza
1,2,† ,
,
Jaesung Eum
1,†, 
Sungmin Jung
1,
Youngsoon Choi
1,
Changwon Jang
1,
Kiyong Kim
1,
Jeffrey S. Owen
3 and
Bomchul Kim
1,* 1
Department of Environmental Science, Kangwon National University, Chuncheon 24341, Korea
2
Department of Environmental Science, College of Agricultural Sciences, International University of Business Agriculture and Technology, Dhaka 1230, Bangladesh
3
Department of Environmental Science, Hankuk University of Foreign Studies, Yongin 17035, Korea
*
Author to whom correspondence should be addressed.
†
These authors contributed equally to this work.
Water 2019, 11(1), 4; https://doi.org/10.3390/w11010004
Submission received: 16 November 2018
/
Revised: 13 December 2018
/
Accepted: 17 December 2018
/
Published: 20 December 2018
(This article belongs to the Section Water Quality and Contamination)
Abstract
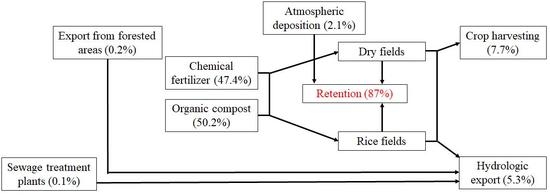
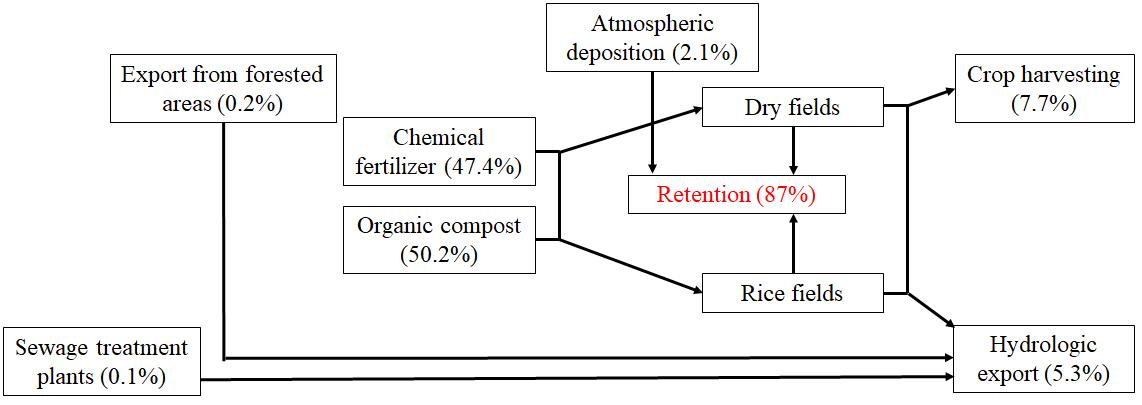
:Despite increased attention to the need for sustainable agriculture, fertilizer application rates above crop requirements remain common agricultural practices in South Korea, causing eutrophication of freshwater and coastal ecosystems. The aim of this study is to quantify phosphorus (P) inputs, outputs, and retention in a forested-agricultural watershed. The P budget showed that the combined use of chemical fertilizer and organic compost was the largest source of P (97.6% of the total) followed by atmospheric wet deposition (2.1% of the total P), whereas forest export (0.2% of the total) and sewage treatment plants (STPs) (0.1% of the total) were negligible. The P outputs were crop harvesting and hydrologic export to surface water. The P balance showed that P inputs are higher than the P outputs; approximately 87% of the total P input was retained in the soils within the watershed. However, P concentrations in drainage water were still high enough to cause eutrophication of downstream reservoirs. The results provide important details on the proportion of P export and retention in the watershed. This will help efforts to improve water quality and design better management strategies for agricultural nonpoint source pollution.
1. Introduction
Anthropogenic impacts on the global phosphorus (P) cycle have been a major research topic in the field of P biogeochemistry, especially in agricultural ecosystems. Because of the increase in P fertilizer use during the last few decades, global P inputs from terrestrial to aquatic ecosystems have doubled and eutrophication remains a global issue [1,2].
Eutrophication is a serious environmental challenge in Korea and P export from agricultural fields has been identified as major contributor to nonpoint source (NPS) nutrient pollution [3]. The characteristic intense rainfall during the East Asian summer monsoon dramatically influences the export of NPS derived nutrients from highland agricultural croplands in Korea [4]. Some studies have shown that P export from agricultural fields in Korea is higher than in other regions [3,4]. To ensure short-term productivity as well as long-term sustainability, minimizing P losses and achieving a balance between P inputs and P outputs in agricultural systems is important. P budget studies can help to identify and rank the sources (fertilizer, compost, cropped land, grassland, irrigated land, atmospheric deposition, foods and feeds, surface runoff from forested areas, weathering, urban stormwater runoff, and wastewater treatment plants) and determine the fates (surface runoff and crop harvesting) of P, which are important for regional water quality issues. Improved knowledge of watershed P budgets can also help evaluate the impacts of agricultural practices on P accumulation and losses. Therefore, development of a budget approach using well documented and consistent methods for data collection and analysis is of prime importance.
Using a mass balance approach to calculate P budgets is a commonly used approach in agricultural systems [5,6,7,8]. Continued accumulation of P in agricultural land beyond crop requirements may well become a long-term concern in Korea. Although there are many watersheds with mixed (forested and agricultural) land use distributed throughout most areas of Korea [9], no research has focused on constructing P budgets for these mixed land use watersheds. The current study was conducted in the Haean watershed, a subwatershed located at the upper reaches of Lake Soyang (the largest reservoir in South Korea). The study area is an advantageous location for studying the watershed P budget because it has only a single outlet (Mandae Stream). Previous studies on NPS of sediment and nutrient have conducted in the Haean watershed and the watershed is known as a hot spot for soil erosion and export of NPS pollution to Lake Soyang [4].
The aim of this study was to construct a P budget for the 2013 growing season to quantify P inputs, outputs, and retention for the Haean watershed.
2. Materials and Methods
2.1. Study Site and Land Use
The Haean watershed is located in Gangwon Province in the eastern region of Korea (Figure 1). The physical characteristics of the study watershed are shown in Table 1. The hydrologic characteristics of the watershed are strongly influenced by the East Asian summer monsoon climate. Over 50% of the annual precipitation occurs in July and August [10]. Approximately 90% of the annual rainfall occurs during the April to October cropping season [11]. The 10 year (2004–2013) mean annual temperature in the Haean watershed is 10.9 °C with a mean annual precipitation of 1506 mm [4].
The soils in the watershed are classified as Cambisols but most agricultural soils are Anthrosols due to the long-term use of soil amendments with sandy soil as a top dressing [13]. The study area is one of the largest highland agricultural areas in the Lake Soyang watershed [10]. Generally, in highland agricultural fields high value horticultural row crops such as potato, radish, cabbage, and soybean are preferred over other crops [9]. In the study area, rice fields account for more than 30% of the agricultural land, while dryland crops (cabbage, potato, radish, and soybean) account for approximately 52% of the agricultural land (Table 2) [14].
2.2. Sampling and Chemical Analysis
To collect more representative samples, thirty-two crop fields (5–8 replicates from 1 m2 area for each crop) located within the watershed were randomly selected. The selected fields were managed by the land owners in accordance to local agricultural practices (Table 3). Crop biomass (above and belowground) was estimated gravimetrically at time of final harvest. Immediately after separating the plant parts, the fresh weight (FW) of leaves, stems, roots, and grains were measured. Dry matter (DM) of plant parts was measured after oven drying at 80 °C for 72 h. A finely pulverized aliquot of each sample was combusted in a muffle furnace at 550 °C for 1 hr. After cooling, the sample was washed with 25 mL 1N HCl and boiled for 15 min [16]. Then the sample was diluted to 100 mL and analyzed colorimetrically for total phosphorus (TP) concentration using the ascorbic acid method followed by persulfate digestion [17]. Soil (3–5 samples from 0–20 cm depth) samples were collected using an auger after final harvest and then air dried. Soil samples were mixed thoroughly, sieved (2 mm). Soil P concentration was measured using the modified Lancaster method [18]. In the modified Lancaster method, extraction is done in two steps. Five grams of soil was extracted using 5 mL of 0.05 M HCl and kept undisturbed for 10 min. In the second step, 20 mL of a solution containing 1.58 N CH3COOH-0.125 N CH2(COOH)2-0.187 N C4H6O5-0.037 N NH4F-0.03 N AlCl3.6H2O was added. NH4OH was used to adjust the solution pH to 4. Then, samples were shaken for 10 min and filtered using Whatman filter paper no. 1. Rainfall data were collected from a weather station maintained by the Korean Meteorological Administration (KMA). Rain samples were collected monthly using tipping buckets near a long-term monitoring site in a forested subwatershed, from November 2012 to October 2013. TP concentration in rain samples was measured colorimetrically using the ascorbic acid method followed by persulfate digestion of unfiltered samples [17].
2.3. Budget Methodology
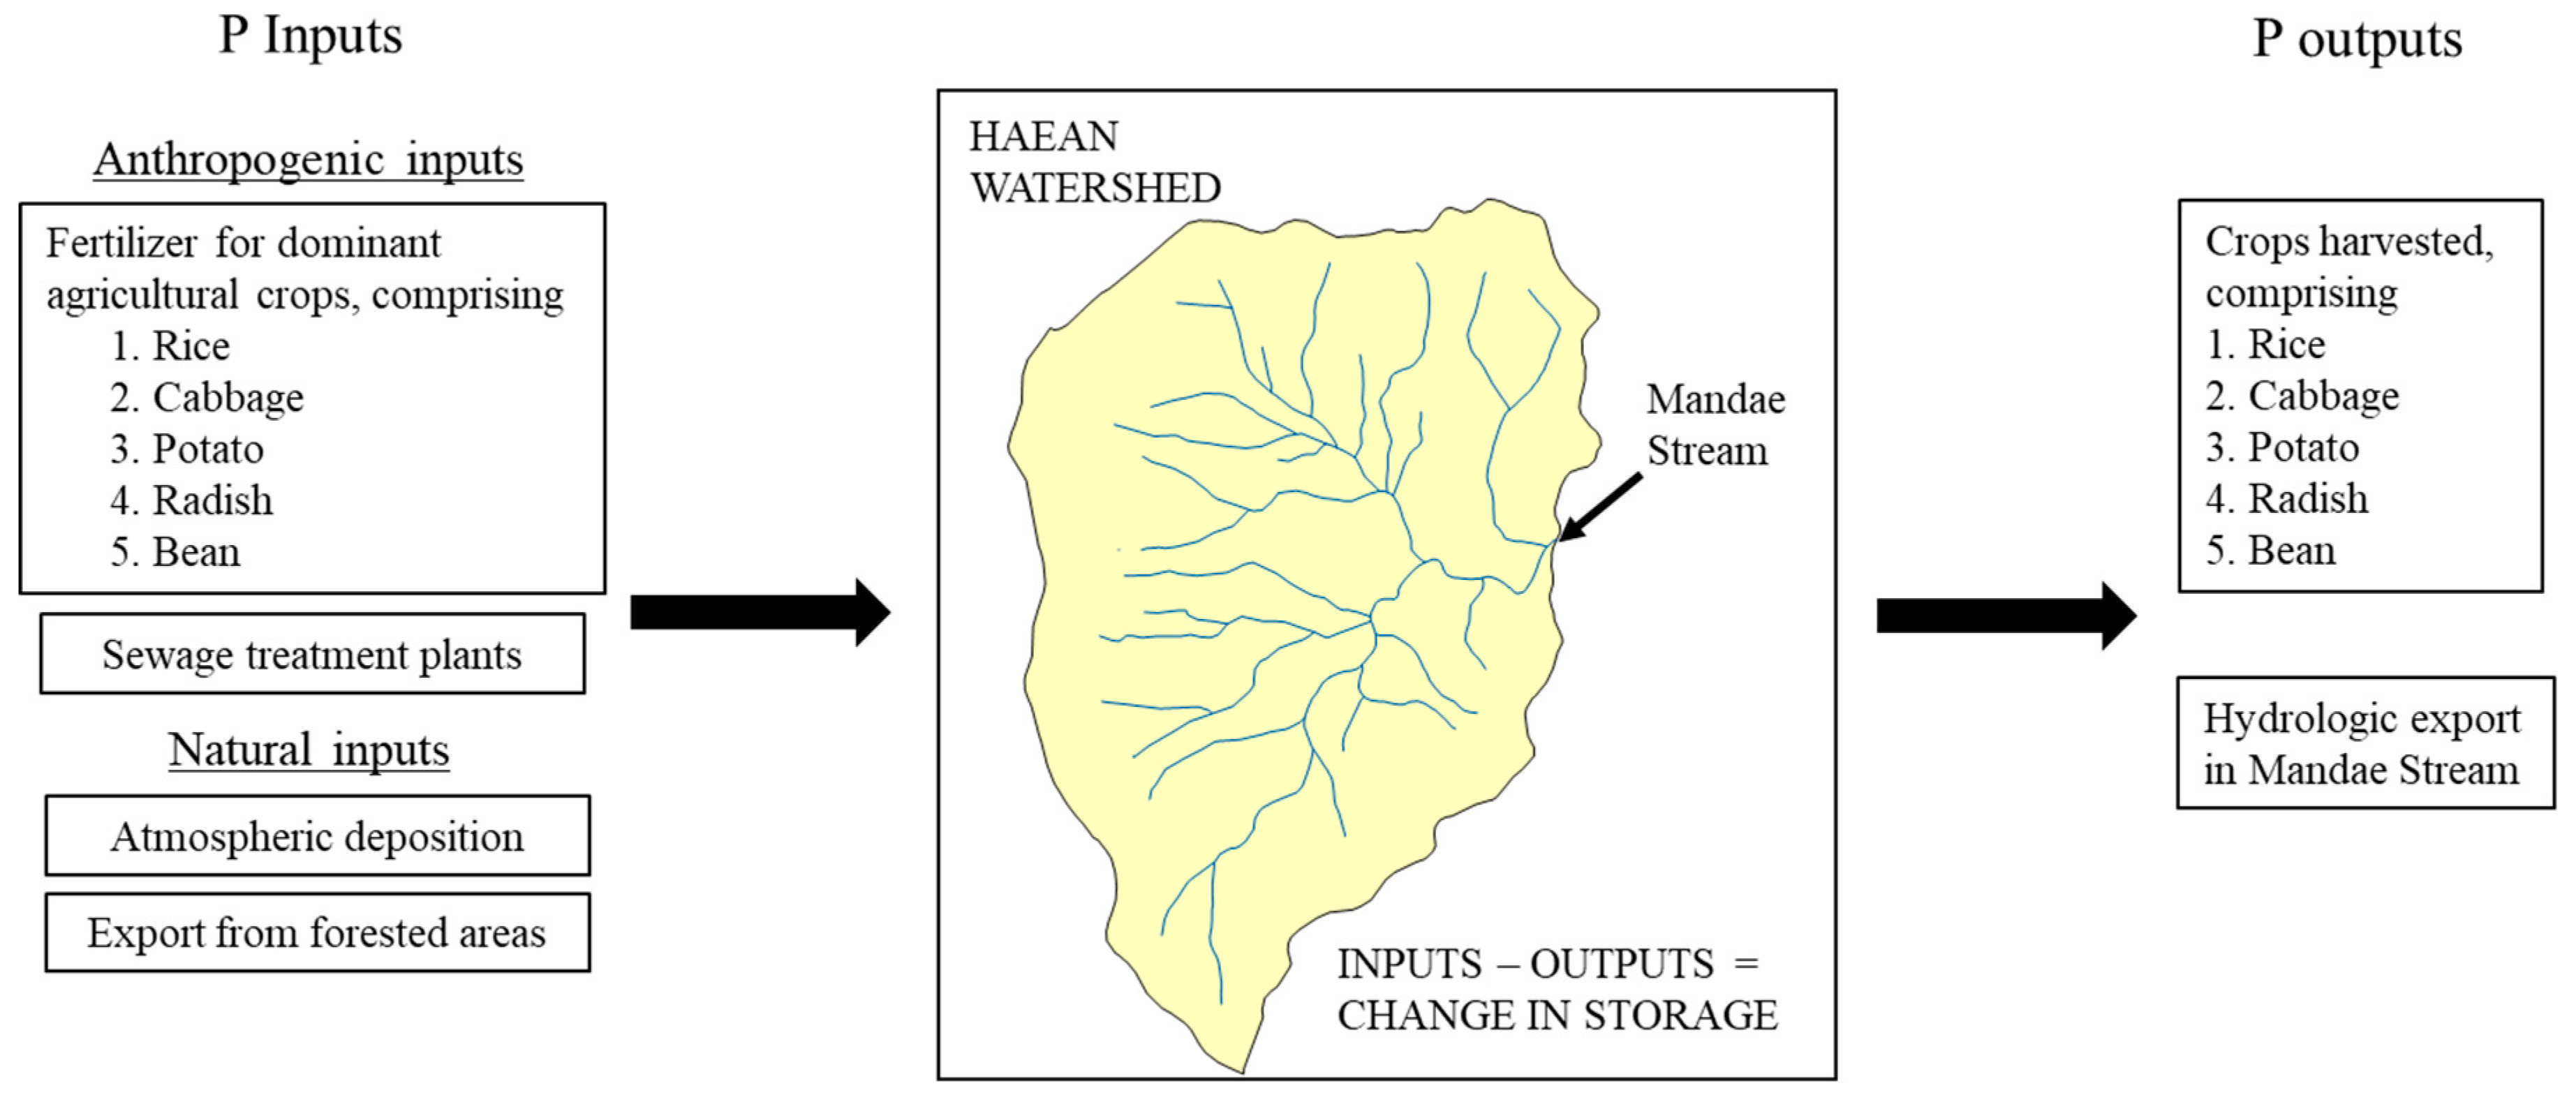
A mass balance approach was used to compare P inputs and P outputs and estimate annual P storage in the watershed in 2013 (Figure 2). To develop a more realistic budget, information on local agricultural practices and crop production were collected using a farm census. A total of 52 farmers involved in cultivating the major crops in the study watershed were interviewed during the study period. Data from the results of the farm census together with data from field and literature values were used to develop the P budget. Conceptually, P inputs to the Haean watershed were separated into two groups: anthropogenic sources (fertilizer application and sewage treatment plants) and natural sources (atmospheric deposition and surface runoff from forested areas). P outputs from the Haean watershed were calculated using data on P concentrations from the crop harvest and hydrologic export in Mandae Stream.
2.3.1. P Inputs to the Haean Watershed
● Inputs from fertilizer application
Interviews with farmers were conducted to collect information on fertilizer (chemical and compost) application rates. Fertilizer P content was obtained from data provided by the RDA and from previous studies [15,19]. The total amount of P in fertilizer used in the Haean watershed was calculated by multiplying the rate of fertilizer application by the fertilizer P content and the agricultural land area for each crop and expressed as
where PFert is the P input from the fertilizer (kg/year), FA is the rate of fertilizer application (kg/ha/year), CFert is the P content in fertilizer (chemical and organic compost) (%), and A is the agricultural land area for each crop (ha).
● Inputs from sewage treatment plants
Sewage treatment plants (STPs) are an obvious point source of P inputs. Though most of the study area is rural, three small STPs discharge treated wastewater in the Haean watershed. The outflow and TP concentrations were obtained from the managing authority [14]. The amount of P from STPs was calculated using the following equation,
where PSTP is the P input from the STPs (kg/year), CSTP is the average P concentration (mg/L), and FR is the average annual flowrate of the effluent (m3/year).
● Inputs from atmospheric deposition
In regions with sufficient rainfall, P inputs in through wet deposition is more important than dry deposition of P [20]. Therefore, P input from dry deposition was not considered in this study; input in wet deposition was estimated by the following approach [6],
where Prain is P input from wet deposition (kg/year), A is the watershed area (ha), Crain is the average P concentration in wet deposition during the study period (mg/L), and Vrain is the 10 year (2004–2013) mean annual rainfall (mm/year).
● Inputs from forested areas
The P input in surface runoff from forested areas was considered as a natural source. Due to the widely different sampling frequency for rain event and dry period samples, inputs from forested areas were estimated by summing the inputs during sampled and nonsampled rain events and dry period [21].
2.3.2. P Outputs from the Haean Watershed
● Removal through crop harvesting
Crop production data were obtained from a local farm census. P removal from the Haean watershed was calculated by multiplying the measured P content in crop samples and the crop harvest estimated for each crop and expressed as
where PCH is the P output through crop harvesting (kg/year), CP is the crop production (kg/ha/year), CCH is the P content (%), and A is the agricultural land area for each crop (ha).
● Hydrologic export in Mandae Stream
Hydrologic export of P export in Mandae Stream (the watershed outlet) was obtained from an earlier intensive monitoring study conducted by the authors (2009–2013) [4].
3. Results
3.1. P Inputs
3.1.1. Fertilizer Application
The calculated annual P input from chemical fertilizer was 81,779 kg P/year (47.8% of total P inputs). Compost supplied 86,640 kg P/year (50.7% of total P inputs) to the Haean watershed. Among the five most common crops, fertilizer used in rice fields was found to be the largest contributor of P in the watershed followed by potato, radish, soybean and cabbage (Table 4). The P input from fertilizer use for rice, potato, radish, soybean, and cabbage was 61,447, 35,461, 27,297, 23,347, and 20,867 kg P/year, respectively.
3.1.2. Sewage Treatment Plants (STPs)
P input from STPs accounted for a small fraction of the total P input to the Haean watershed. With the limited human population and little industrial development in the study area, STPs accounted for only 196 kg P/year (0.1% of total P inputs) in the Haean watershed (Table 5).
3.1.3. Atmospheric Deposition
The mean P concentration of the wet deposition samples was 0.04 mg/L (range, 0.003 to 0.171 mg/L). In 2013, the annual rainfall was 713 mm, less than half of the 10 years (2004–2013) average annual rainfall (1506 mm) in the study area. Therefore, the annual P input from wet deposition was only 3719 kg P/year (Table 5). Atmospheric inputs accounted for about 2.1% of total P inputs.
3.1.4. Export from Forested Areas
3.1.5. Summary of P Inputs
Our inventory of the P inputs showed considerable variation in the P content among the five most common crops in the watershed (Table 4). The total P input to the watershed was approximately 172,607 kg/year for the 2013 growing season (Table 5). Agricultural P inputs in the form of organic compost were the largest source of P, accounting for 50.2% of total P input. Chemical fertilizers were the second largest P source, accounting for 47.4% of the total P input. P inputs from STPs contributed only 0.1% of all the P entering the watershed. Natural P inputs, such as wet atmospheric deposition and export from forested area, accounted for only 2.3% of the total P input. Overall, anthropogenic P inputs (chemical fertilizer and organic compost applications) were the largest P inputs in the Haean watershed (Table 5).
3.2. P Outputs
3.2.1. P Removal through Crop Harvesting
Crop production in the Haean watershed is solely commercial. We assumed that all the harvested crops left the watershed and none of the crops were consumed within the watershed. P output as harvested crops was 13,216 kg P/year, accounting for 58.9% of total P output (Table 6).
3.2.2. Hydrologic Export in Mandae Stream
3.2.3. Summary of Phosphorus Outputs
We calculated a net export of P in harvested crops of 58.9% of the total P output compared to export in Mandae Stream of 41.1% of the total P output (Table 7). Thus, P export through crop harvesting was identified as the main pathway for P outputs.
3.3. Summary P Budget
We found that fertilizer use (including chemical fertilizer and organic compost application) is the largest P input to the Haean watershed. Secondary P inputs are wet deposition and surface runoff from forested land. P input from STPs accounted for only a small portion of P inputs. Hydrologic export in the watershed outlet and crop harvesting were the most important P outputs. Based on the current study, a net positive P balance was indicated for the Haean watershed (Table 8). We found that approximately 87% of the total P inputs were retained in the watershed (Table 8).
4. Discussion
4.1. Fertilizer Application and Fate of P in Soils
We have identified fertilizer use as the major P input in the Haean study watershed. Specifically, organic compost was the biggest contributor to the total P input for most of the common crops except rice. For the case of rice, chemical fertilizer was found to be the largest P input. Although the RDA has not recommended any organic compost application in rice fields, most farmers in the Haean watershed do apply organic compost in their rice fields. The estimated fertilizer consumption in Korea is 3.6 times higher than the global average [22]. Furthermore, application rates in the study watershed for chemical fertilizers and organic compost application rates have been 2.5 to 4 and 4.5 to 8 times higher than the recommended application rates (kg/ha/year) by the RDA, respectively.
As part of this study, our interviews with local farmers showed that fertilizer application rates for rice, cabbage, potato, radish, and soybean surpassed the RDA recommended P fertilizer application rates by 5.7, 3.4, 6, 4, and 4.6 times, respectively. Farmers in the Haean watershed generally applied all the P fertilizer in a single dose at the beginning of the growing season and did not use additional applications of P fertilizer later in the year. At the beginning of the growing season, plant growth is thought to be slow with relatively low P uptake. Thus, excess P fertilizer application early in the growing season combined with substantial rainfall could result in enhanced loss of P from soils. Therefore, splitting P fertilizer applications into two or three separate fertilizer applications based on crop P requirement could be a useful measure to reduce harmful P losses. While annual chemical fertilizer consumption in the Haean watershed has been decreasing in recent years [14], there are still considerable opportunities to reduce P fertilizer inputs and eventually decrease P surpluses in the watershed.
The detailed inventory of P inputs and outputs in this study has shown that P inputs are higher than the outputs (Table 8). Approximately 150,177 kg P/year (Table 8) is retained in soils in the Haean watershed, signifying the potential for contributing to eutrophication and leaching into ground water. This finding is further supported by the increase in soil P concentration in the watershed. An increase in average soil test P concentrations in the dry fields from 76.3 mg/kg (estimated in 2009) [23] to 95.9 mg/kg (this study) suggests that the excess P is being held in the soil. Based on the calculation method used by Bennet et al. [1], if farmers in the watershed immediately stop applying excess P fertilizer and apply the same amount of P that is exported from the watershed (assuming that agricultural production and P export will not decline with reduced fertilizer application), more than 22 years would be required for P in the soil to reach equilibrium P concentrations. Therefore, achieving reductions in soil P concentrations in the Haean watershed is a goal with long-term benefits.
P sequestered in soil is often considered a ‘chemical time bomb’ [24]. Excessive P stored in soils can result in increased water-soluble P concentrations in soils, thus amplifying the potential for hydrologic export [25]. The general soil texture of soils in the Haean watershed is sandy loam; these soils are susceptible to erosion during the summer monsoon season [26]. Related to this, observations from other monitoring studies show that most (>83%) of the P exported from the Haean watershed in surface water is in particulate form [12]. Even if P fertilizer applications are reduced, soil P will continue to be available for hydrologic export to Lake Soyang. Soil P can be desorbed by changes in soil chemistry which might be related to changing inputs of acidic precipitation [5]. With continued climate change, the intensity of tropical and subtropical cyclones is likely to increase in summer monsoon regions [27,28]. Future efforts focused on the design and implementation of revised P management programs should consider the importance of P retained in highland agricultural soils in the study area.
In this study, we measured P inputs in wet deposition of 3719 kg P/year. This estimate is similar to P inputs in wet deposition in other studies [29,30]. Although forested land covers more than 61% of the total watershed area, only a small amount of P was lost from forests in the Haean watershed (274 kg P/year). This estimate is within the range of measurements of P lost in surface runoff from forested land in other regions [31,32]. Forested-agricultural watersheds can be found throughout Korea and future research directed at understanding P retention in mixed forested-agricultural systems would provide insight on how to better manage P losses at long-term scales.
Our study was not focused on identifying the biogeochemical processes controlling specific pathways of P sequestration or export. Generally, P losses from agricultural land are related to soil erosion [33,34]. In the Haean watershed, hydrologic export of P is influenced by meteorological factors including rainfall amount, rainfall intensity, and the number of antecedent dry days [4].
4.2. P Input and Output Budgets from Other Studies
Studies on the global P cycle confirm that the average P accumulation rate in the world’s soil has increased along with the dramatic increase in P consumption observed since 1960 [35,36]. P accumulation in agricultural soils has been documented in most areas of Korea [37,38]. The amount of P retained in the Haean watershed—24.4 kg P/ha/year—is similar to P retention in countries with intensive agricultural practices such as the Netherlands [39]. To understand the magnitude of P retention in a regional context, we compared P retention in the Haean watershed with P retention in watersheds in other locations (Table 9). The Haean watershed shows high P retention and has a larger area of forest land use compared to the other watersheds. Changing crop types in the watershed from annual crops to perennial crops with lower recommended fertilizer P applications is a possible management strategy that would lower the amount of P sequestered in the watershed. However, perennial crops cannot replace the economic value of annual crops in Korea, and this strategy might be limited to only certain fields. In addition to P input and output budgets, more studies on the biogeochemical processes controlling P dynamics are needed. Developing more efficient and sustainable fertilization strategies will be useful to minimize long-term P sequestration in the Haean watershed.
5. Conclusions
The P budget approach used in this study represents the first comprehensive attempt to identify the origin and fate of P in highland forested-agricultural watersheds in Korea. The P budget in the Haean watershed is dominated by fertilizer inputs, while crop harvesting and hydrologic export are almost equally important in the P outputs. There is a net accumulation of P in the system even though nutrient loss and soil erosion occurs during the summer monsoon season in areas with intensive agriculture. Comparing the balance between P inputs and outputs of the present study with a number of diverse watersheds throughout the world shows common patterns with the Haean watershed, despite the significant differences in site specific soil characteristics, agricultural practices, geologic, and meteorological factors among the watersheds. Comparing the P retention in the Haean watershed in the present study with other studies shows that the amount of P retained in the Haean watershed is much higher than for many watersheds. This study also confirmed that even if all the P inputs in the watershed were eliminated, soil P concentrations may not drop immediately because of the high P accumulation in agricultural soils. The P budget in this study provides a useful analysis tool to design better management practices to mitigate NPS-derived P pollution problems in mixed land use watersheds in Korea.
Author Contributions
Conceptualization, A.R., J.E., and B.K.; Methodology, A.R. and J.E.; Formal Analysis, A.R. and J.E.; Investigation, A.R., J.E., S.J., Y.C., C.J., and K.K.; Data Curation, J.E., S.J., Y.C., C.J., and K.K.; Writing—Original Draft Preparation, A.R.; Writing—Review and Editing, J.S.O. and B.K.; Supervision, B.K.; Funding Acquisition, B.K.
Funding
This research was funded by the Korean Ministry of Environment and Kangwon National University.
Conflicts of Interest
The authors declare no conflicts of interest. The funders had no role in the design of the study; in the collection, analyses, or interpretation of data; in the writing of the manuscript, or in the decision to publish the results.
References
- Bennett, E.M.; Carpenter, S.R.; Caraco, N.F. Human impact on erodable phosphorus and eutrophication: A global perspective. Bioscience 2001, 51, 227–234. [Google Scholar] [CrossRef]
- Elser, J.J.; Bracken, M.E.S.; Cleland, E.E.; Gruner, D.S.; Harpole, W.S.; Hillebrand, H.; Ngai, J.T.; Seabloom, E.W.; Shurin, J.B.; Smith, J.E. Global analysis of nitrogen and phosphorus limitation of primary producers in freshwater, marine and terrestrial ecosystems. Ecol. Lett. 2007, 10, 1135–1142. [Google Scholar] [CrossRef] [PubMed] [Green Version]
- Kim, B.; Park, J.H.; Hwang, G.; Jun, M.S.; Choi, K. Eutrophication of reservoirs in South Korea. Limnology 2001, 2, 223–229. [Google Scholar] [CrossRef]
- Reza, A.; Eum, J.; Jung, S.; Choi, Y.; Owen, J.S.; Kim, B. Export of non-point source suspended sediment, nitrogen, and phosphorus from sloping highland agricultural fields in the East Asian monsoon region. Environ. Monit. Assess. 2016, 188, 692. [Google Scholar] [CrossRef] [PubMed]
- Bennett, E.M.; Reed-Andersen, T.; Houser, J.N.; Gabriel, J.R.; Carpenter, S.R. A phosphorus budget for the Lake Mendota watershed. Ecosystems 1999, 2, 69–75. [Google Scholar] [CrossRef]
- Yan, W.; Yin, C.; Zhang, S. Nutrient budgets and biogeochemistry in an experimental agricultural watershed in Southeastern China. Biogeochemistry 1999, 45, 1–9. [Google Scholar] [CrossRef]
- Borbor-Cordova, M.J.; Boyer, E.W.; McDowell, W.H.; Hall, C.A. Nitrogen and phosphorus budgets for a tropical watershed impacted by agricultural land use: Guayas, Ecuador. Biogeochemistry 2006, 79, 135–161. [Google Scholar] [CrossRef]
- Faridmarandi, S.; Naja, G.M. Phosphorus and water budgets in an agricultural basin. Environ. Sci. Technol. 2014, 48, 8481–8490. [Google Scholar] [CrossRef]
- Kim, G.; Chung, S.; Lee, C. Water quality of runoff from agricultural-forestry watersheds in the Geum River Basin, Korea. Environ. Monit. Assess. 2007, 134, 441. [Google Scholar] [CrossRef]
- Kim, B.; Choi, K.; Kim, C.; Lee, U.H.; Kim, Y.H. Effects of the summer monsoon on the distribution and loading of organic carbon in a deep reservoir, Lake Soyang, Korea. Water Res. 2000, 34, 3495–3504. [Google Scholar] [CrossRef]
- Kettering, J.; Park, J.H.; Lindner, S.; Lee, B.; Tenhunen, J.; Kuzyakov, Y. N fluxes in an agricultural catchment under monsoon climate: A budget approach at different scales. Agric. Ecosys. Environ. 2012, 161, 101–111. [Google Scholar] [CrossRef]
- Eum, J. Runoff Characteristics of NPS from Agricultural Watershed and Water Quality Simulations with Crop Change. Ph.D. Thesis, Kangwon National University, Chuncheon, South Korea, 2015. (In Korean). [Google Scholar]
- IUSS Working Group WRB. World reference base for soil resources. In World Soil Resources Report No.103; FAO: Rome, Italy, 2007. [Google Scholar]
- Yanggu Statistical Yearbook 2011; Yanngu County Office: Gangwon Province, South Korea, 2012. (In Korean)
- The Standard Rate of Chemical Fertilizer for Crops; Rural Development Administration: Suwon, Korea, 2010.
- Andersen, J.M. An ignition method for determination of total phosphorus in lake sediments. Water Res. 1976, 10, 329–331. [Google Scholar] [CrossRef]
- Murphy, J.A.; Riley, J.P. A modified single solution method for the determination of phosphate in natural waters. Anal. Chim. Acta 1962, 27, 31–36. [Google Scholar] [CrossRef]
- Methods of Soil and Plant Analysis; National Institute of Agricultural Science and Technology: Suwon, Korea, 2000. (In Korean)
- Lee, S.B.; Kim, J.G.; Lee, D.B.; Lee, K.B.; Han, S.S.; Kim, J.D.; Baek, S.H. Changes of physico-chemical properties and microflora of pig manure due to composting with turning time and depth. Korean J. Soil Sci. Fertil. 2002, 35, 127–135, (In Korean with English abstract). [Google Scholar]
- Loye-Pilot, M.D.; Martin, J.M. Saharan Dust Input to the Western Mediterranean: An Eleven Years Record in Corsica. In The Impact of Desert Dust Across the Mediterranean; Guerzoni, S., Chester, S., Eds.; Springer: Dordrecht, The Netherlands, 1996; pp. 191–199. ISBN 978-94-017-3354-0. [Google Scholar]
- Reza, A.; Eum, J.; Jung, S.; Kim, B. Influence of East Asian summer monsoon on suspended sediment and nutrient export from a pristine forested watershed. In Proceedings of the Annual Conference on Environmental Research, Kangwon National University, Chuncheon, South Korea, 2016. [Google Scholar]
- Fertilizer Consumption (Kilograms per Hectare of Arable Land) 2012. Available online: https://data.worldbank.org/indicator/AG.CON.FERT.ZS (accessed on 26 June 2016).
- Yoo, D. Evaluation of Sediment Yield Using Area-Weighted Measured Slope and Slope Length at Haean Myeon Watershed. Master’s Thesis, Kangwon National University, Chuncheon, South Korea, 2011. (In Korean). [Google Scholar]
- Stigliani, W.M.; Doelman, P.; Salomons, W.; Schulin, R.; Smidt, G.R.; Van der Zee, S.E. Chemical time bombs: Predicting the unpredictable. Environ. Sci. Policy Sustain. Dev. 1991, 33, 4–30. [Google Scholar] [CrossRef]
- Stout, W.L.; Sharpley, A.N.; Gburek, W.J.; Pionke, H.B. Reducing phosphorus export from croplands with FBC fly ash and FGD gypsum. Fuel 1999, 78, 175–178. [Google Scholar] [CrossRef]
- Choi, J.D.; Lee, H.J.; Park, S.Y.; Choi, Y.H.; Lim, K.J.; Gilkes, R.J. Sediment control practices in sloping highland fields in Korea. In Proceedings of the 19th World Congress of Soil Science: Soil solutions for a changing world, Brisbane, Australia, 1–6 August 2010. [Google Scholar]
- Webster, P.J.; Holland, G.J.; Curry, J.A.; Chang, H.R. Changes in tropical cyclone number, duration, and intensity in a warming environment. Science 2005, 309, 1844–1846. [Google Scholar] [CrossRef]
- Kang, N.Y.; Elsner, J.B. Climate mechanism for stronger typhoons in a warmer world. J. Clim. 2016, 29, 1051–1057. [Google Scholar] [CrossRef]
- Gibson, C.E.; Wu, Y.; Pinkerton, D. Substance budgets of an upland catchment: The significance of atmospheric phosphorus inputs. Freshw. Biol. 1995, 33, 385–392. [Google Scholar] [CrossRef]
- Haygarth, P.M.; Chapman, P.J.; Jarvis, S.C.; Smith, R.V. Phosphorus budgets for two contrasting grassland farming systems in the UK. Soil Use Manag. 1998, 14, 160–167. [Google Scholar] [CrossRef]
- Lin, J.P. Review of Published Export Coefficient and Event Mean Concentration (EMC) Data; U.S. Army Corps of Engineers, Engineer Research and Development Center: Vicksburg, MS, USA, 2004. [Google Scholar]
- White, M.; Harmel, D.; Yen, H.; Arnold, J.; Gambone, M.; Haney, R. Development of sediment and nutrient export coefficients for US ecoregions. J. Am. Water Resour. Assoc. 2015, 51, 758–775. [Google Scholar] [CrossRef]
- Sharpley, A.N.; Daniel, T.C.; Edwards, D.R. Phosphorus movement in the landscape. J. Prod. Agric. 1993, 6, 492–500. [Google Scholar] [CrossRef]
- Haygarth, P.M.; Jarvis, S.C. Transfer of phosphorus from agricultural soils. Adv. Agron. 1999, 66, 196–249. [Google Scholar]
- Carpenter, S.R.; Caraco, N.F.; Correll, D.L.; Howarth, R.W.; Sharpley, A.N.; Smith, V.H. Nonpoint pollution of surface waters with phosphorus and nitrogen. Ecol. Appl. 1998, 8, 559–568. [Google Scholar] [CrossRef]
- Lu, C.; Tian, H. Global nitrogen and phosphorus fertilizer use for agriculture production in the past half century: Shifted hot spots and nutrient imbalance. Earth Syst. Sci. Data 2017, 9, 181. [Google Scholar] [CrossRef]
- Lee, C.H.; Park, C.Y.; Park, K.D.; Jeon, W.T.; Kim, P.J. Long-term effects of fertilization on the forms and availability of soil phosphorus in rice paddy. Chemosphere 2004, 56, 299–304. [Google Scholar] [CrossRef]
- Park, M.; Singvilay, O.; Shin, W.; Kim, E.; Chung, J.; Sa, T. Effects of long-term compost and fertilizer application on soil phosphorus status under paddy cropping system. Commun. Soil Sci. Plant Anal. 2004, 35, 1635–1644. [Google Scholar] [CrossRef]
- Chardon, W.J.; Koopmans, G.F. Critical evaluation of options for reducing phosphorus loss from agriculture. In Proceedings of the 4th International Phosphorus Workshop, Wageningen, The Netherlands, 16–19 August 2004. [Google Scholar]
- Hiscock, J.G.; Thourot, C.S.; Zhang, J. Phosphorus budget—Land use relationships for the northern Lake Okeechobee watershed, Florida. Ecol. Eng. 2003, 21, 63–74. [Google Scholar] [CrossRef]
- He, Z.; Hiscock, J.G.; Merlin, A.; Hornung, L.; Liu, Y.; Zhang, J. Phosphorus budget and land use relationships for the Lake Okeechobee Watershed, Florida. Ecol. Eng. 2014, 64, 325–336. [Google Scholar] [CrossRef]
- Luu, T.N.M.; Garnier, J.; Billen, G.; Le, T.P.Q.; Nemery, J.; Orange, D.; Le, L.A. N, P, Si budgets for the Red River Delta (northern Vietnam): How the delta affects river nutrient delivery to the sea. Biogeochemistry 2012, 107, 241–259. [Google Scholar] [CrossRef]
- Han, H.; Bosch, N.; Allan, J.D. Spatial and temporal variation in phosphorus budgets for 24 watersheds in the Lake Erie and Lake Michigan basins. Biogeochemistry 2011, 102, 45–58. [Google Scholar] [CrossRef]
- McMahon, G.; Woodside, M.D. Nutrient mass balance for the Albemarle-Pamlico drainage basin, North Carolina and Virginia, 1990. J. Am. Water Resour. Assoc. 1997, 33, 573–589. [Google Scholar] [CrossRef]
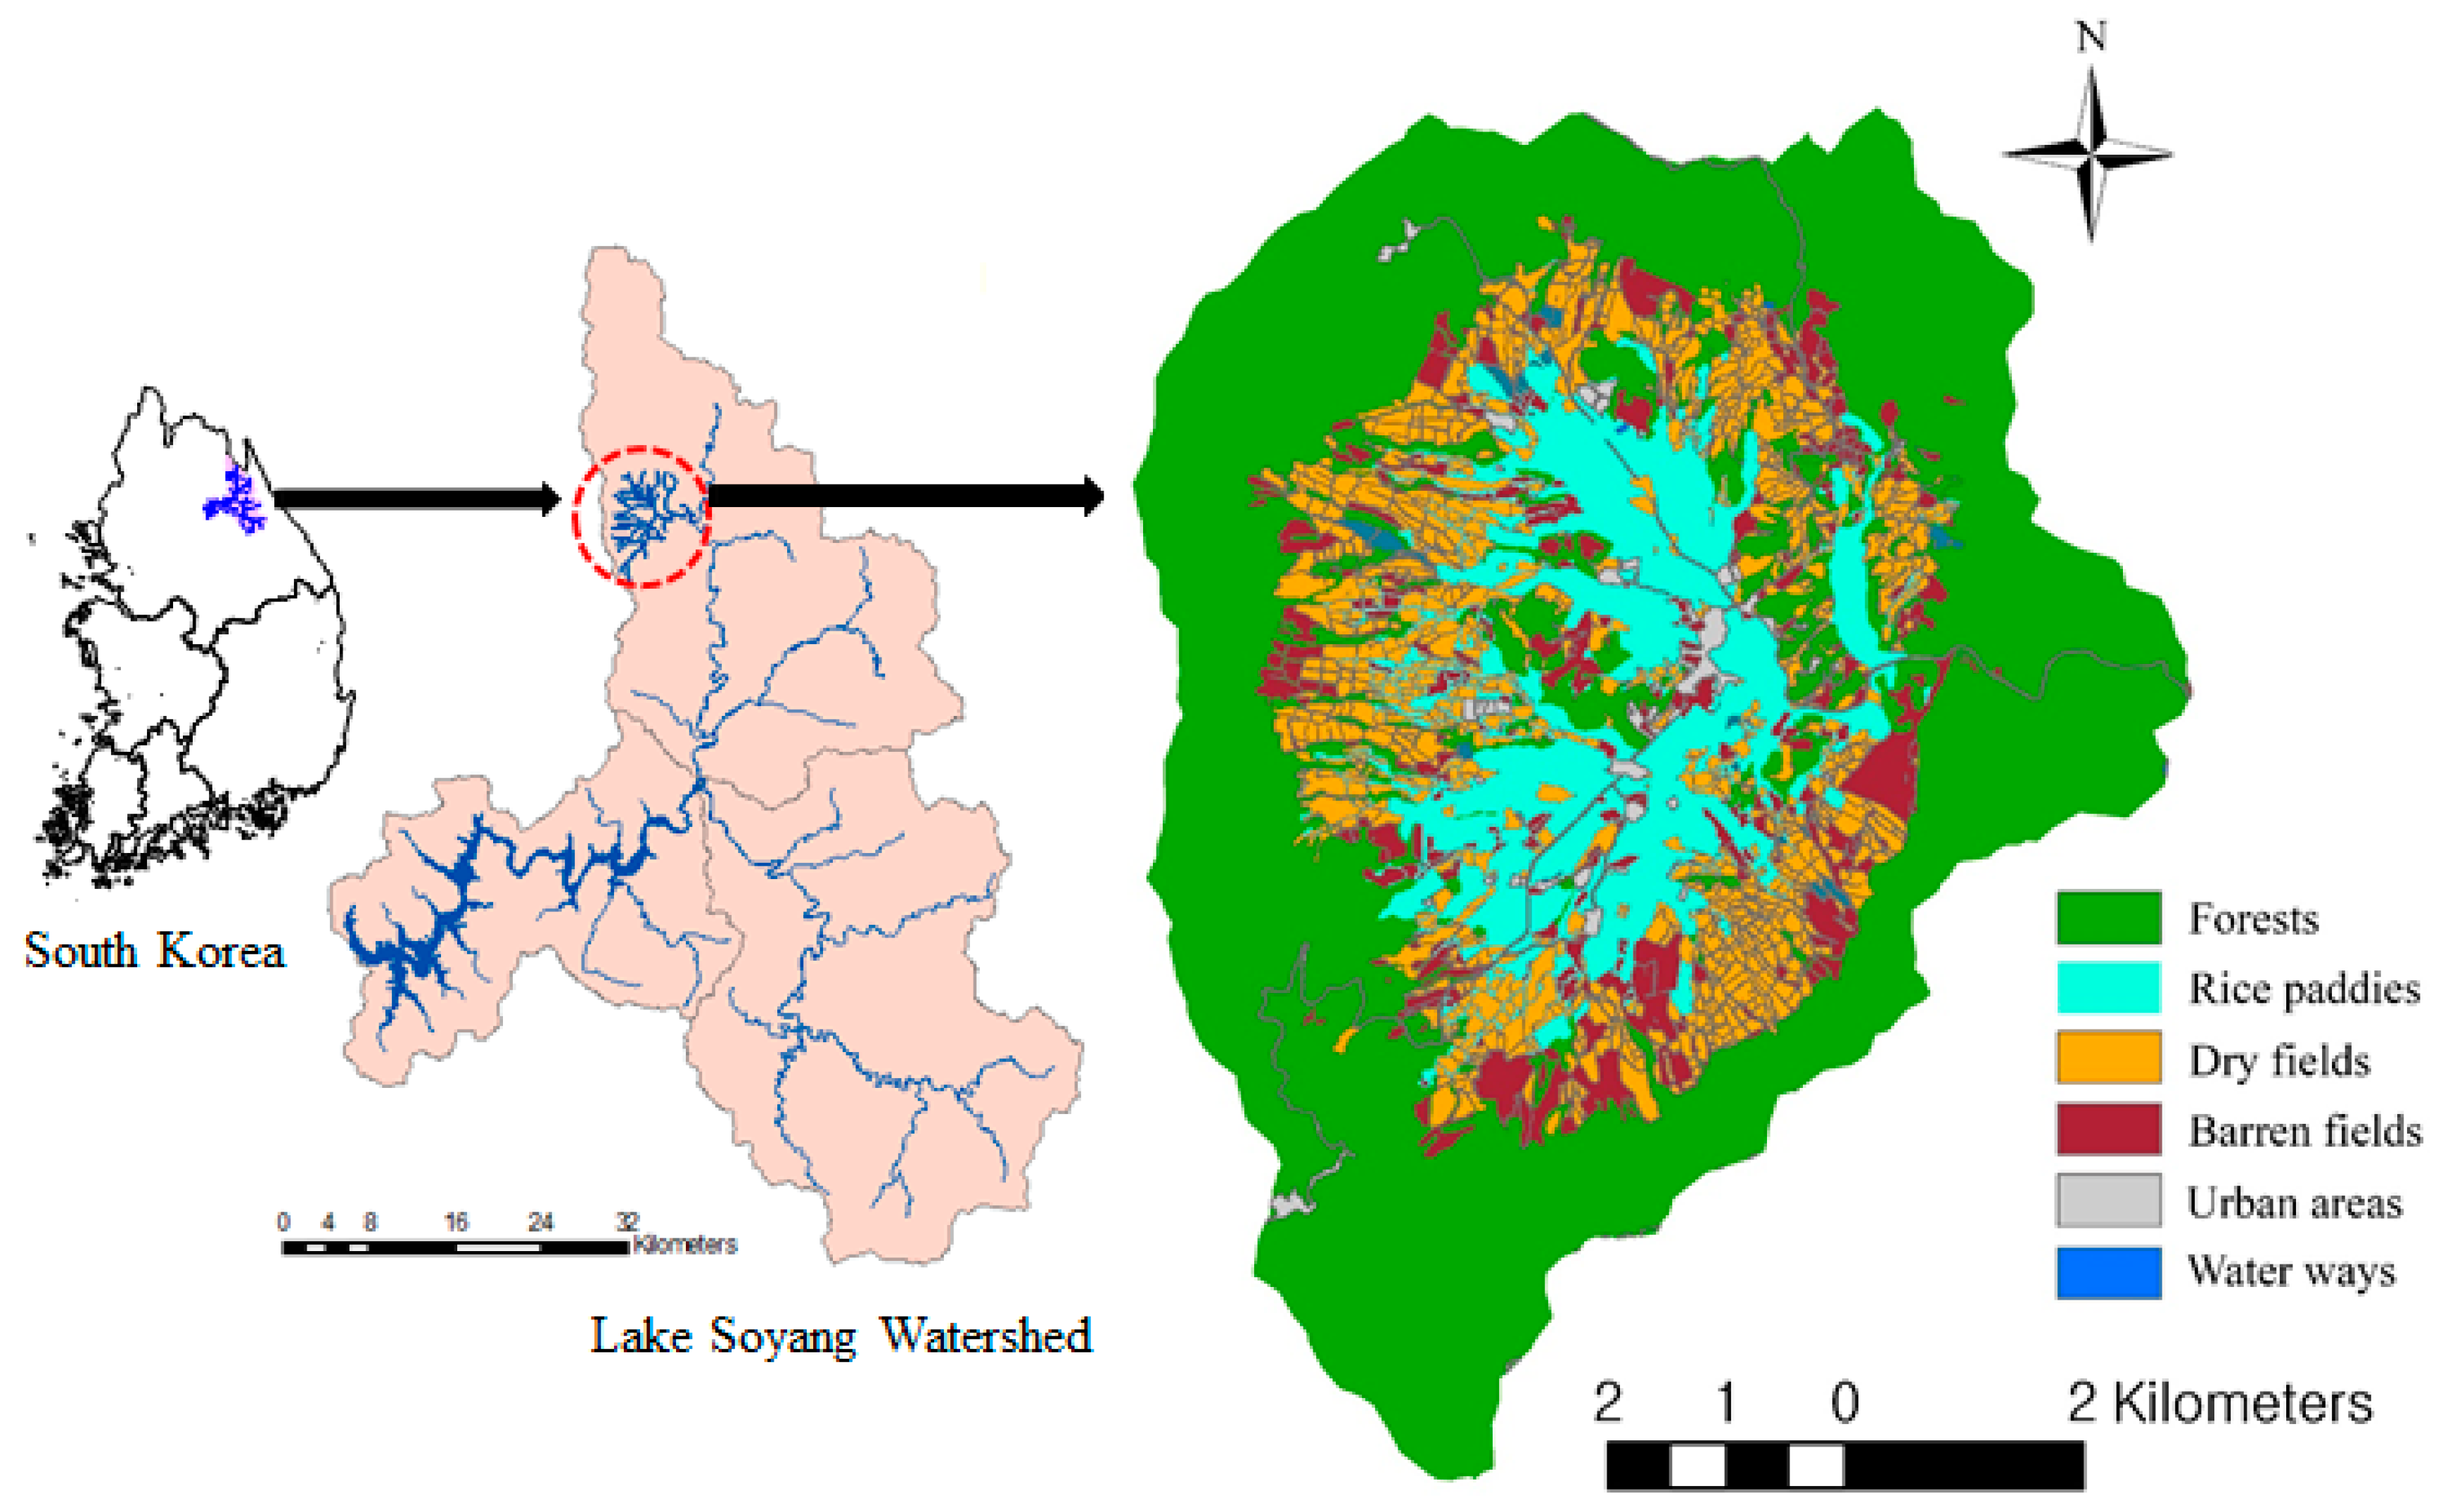
Figure 1.
Location of the Haean watershed in eastern Korea and map showing the land use in the mixed-use watershed [4,12].

Figure 2.
Schematic diagram of P inputs and outputs used to calculate the phosphorus budget for the Haean watershed.
Figure 2.
Schematic diagram of P inputs and outputs used to calculate the phosphorus budget for the Haean watershed.


| Watershed | Area (ha) | Population Density (Person/ha) | Elevation (m) | Longtitude | Latitude | Slope (°) | % Coverage | ||||
|---|---|---|---|---|---|---|---|---|---|---|---|
| Forest | Crop | Urban | Other 1 | Total | |||||||
| Haean | 6174 | 0.23 | 340–1320 | 128°50′ to 128°11′E | 38°13′ to 38°20′N | 5–20 | 61.1 | 29.6 | 0.62 | 8.68 | 100 |
1 Barren fields and water ways.
Table 2.
Agricultural land use in the Haean watershed (2012) [14].
Table 2.
Agricultural land use in the Haean watershed (2012) [14].
| Crop | Area (ha) | Percent of the Total (%) |
|---|---|---|
| Annual | ||
| Rice paddy | 569 | 31.1 |
| Cabbage | 142 | 7.77 |
| Potato | 225 | 12.3 |
| Radish | 213 | 11.7 |
| Soybean | 163 | 8.92 |
| Maize | 52 | 2.84 |
| Pumpkin | 34 | 1.86 |
| Perennial | ||
| Orchard | 85 | 4.65 |
| Ginseng | 82 | 4.49 |
| Codonopsis | 28 | 1.53 |
| Peach | 19 | 1.04 |
| Grape | 18 | 0.98 |
| Others | 198 | 10.8 |
| Total | 1828 | 100 |
Table 3.
Local agricultural practices for the five most common crops accounting for ~72% of the total agricultural area in the Haean watershed [15].
Table 3.
Local agricultural practices for the five most common crops accounting for ~72% of the total agricultural area in the Haean watershed [15].
| Crop | Cultivation Period | Number of Applications | Fertilizer Application Rates (kg P/ha/year) | ||
|---|---|---|---|---|---|
| Types | RDA Recommended | Applied | |||
| Rice paddy | Mid May–End October | 1–2 | Chemical | 20 | 78 |
| Compost | - | 30 | |||
| Cabbage | End July–End October | 1–2 | Chemical | 26 | 64 |
| Compost | 19 | 83 | |||
| Potato | End April–Mid August | 1 | Chemical | 14 | 55 |
| Compost | 13 | 103 | |||
| Radish | End July–End September | 1–3 | Chemical | 13 | 37 |
| Compost | 19 | 91 | |||
| Soybean | End May–End October | 1 | Chemical | 13 | 51 |
| Compost | 19 | 92 | |||
Table 4.
P inputs from fertilizer (chemical and compost) for the five most common crops in the Haean watershed.
Table 4.
P inputs from fertilizer (chemical and compost) for the five most common crops in the Haean watershed.
| Crop | Fertilizer Input (kg P/Year) | P Content (%) 1 | P Input (kg P/Year) | ||||
|---|---|---|---|---|---|---|---|
| Chemical | Compost | Chemical | Compost | Chemical | Compost | Total | |
| Rice | 441,981 | 1,437,443 | 10 | 1.20 | 44,198 | 17,249 | 61,447 |
| Cabbage | 303,188 | 980,915 | 3 | 9096 | 11,771 | 20,867 | |
| Potato | 308,306 | 1,927,391 | 4 | 12,332 | 23,129 | 35,461 | |
| Radish | 261,072 | 1,622,053 | 3 | 7832 | 19,465 | 27,297 | |
| Soybean | 64,005 | 1,252,168 | 13 | 8321 | 15,026 | 23,347 | |
| Total | 81,779 | 86,640 | 168,418 | ||||
Table 5.
Summary of phosphorus inputs in the Haean watershed.
| Phosphorus Inputs | Amount (kg/Year) | Percent of the Total (%) |
|---|---|---|
| Anthropogenic | ||
| Chemical Fertilizer | 81,779 | 47.4 |
| Organic matter | 86,640 | 50.2 |
| Sewage treatment plants | 196 | 0.1 |
| Natural | ||
| Atmospheric deposition | 3719 | 2.1 |
| Export from forested areas | 274 | 0.2 |
| Total | 172,607 | 100 |
Table 6.
Phosphorus outputs from the watershed through crop harvesting.
| Crop | Yield (kg/Year) | Water Content (%) | Dry Weight (kg/Year) | P Content (%) | Harvested P (kg P/Year) |
|---|---|---|---|---|---|
| Rice paddy | 3,218,833 | 11.3 | 2,855,105 | 0.22 | 6281 |
| Cabbage | 6,882,456 | 91.8 | 564,361 | 0.35 | 1975 |
| Potato | 3,578,850 | 77.2 | 815,978 | 0.23 | 1877 |
| Radish | 6,184,242 | 94.0 | 371,055 | 0.40 | 1484 |
| Soybean | 261,126 | 10.0 | 235,013 | 0.68 | 1598 |
| Total | 13,216 |
Table 7.
Summary of phosphorus outputs in the Haean watershed.
| Phosphorus Outputs | Amount (kg/Year) | Fraction of Total Output (%) |
|---|---|---|
| Crop harvesting | 13,216 | 58.9 |
| Hydrologic export | 9215 | 41.1 |
| Total | 22,431 | 100 |
Table 8.
Summary of the annual phosphorus budget of the Haean watershed.
| Phosphorus | Amount (kg/Year) |
|---|---|
| Inputs (I) | 172,607 |
| Outputs (O) | 22,431 |
| Balance (I – O) | 150,177 |
| % Retained | 87.0 |
Table 9.
Comparison of the P budget in this study with P budgets for other watersheds.
| Watershed | Area (ha) | Land Use (%) | Phosphorus Flux (kg/ha/year) | Retention (%) | Ref. | ||||
|---|---|---|---|---|---|---|---|---|---|
| Forest | Agri. | Others | Input | Output | Balance | ||||
| Haean, Korea | 6174 | 61.1 | 29.6 | 5.45 | 28.0 | 3.63 | 24.4 | 87.0 | This study |
| EAA, South Florida | 191,198 | - | 93.3 | 7.70 | 3.32 | 0.82 | 2.50 | 75.2 | [8] |
| Lake Okeechobe, Florida | 1,392,987 | 30.3 | 55.2 | 14.5 | 5.99 | 0.88 | 5.11 | 85.3 | [40] |
| Lake Okeechobe, Florida | 1,392,874 | 29.5 | 56.2 | 14.3 | 4.59 | 0.97 | 3.62 | 78.9 | [41] |
| Bui SB, Vietnam | 2751 | 13.6 | 45.8 | 40.6 | 5.7 | 0.90 | 4.80 | 84.1 | [42] |
| Cuyahoga, Ohio | 182,300 | 41.6 | 31.0 | 27.4 | 12.1 | 2.43 | 9.47 | 79.9 | [43] |
| Grand, Ohio | 182,500 | 44.2 | 38.8 | 17.0 | 7.42 | 1.81 | 5.61 | 75.6 | |
| Guayaquil, Ecuador | 136,000 | 6.40 | 39.8 | 53.8 | 4.36 | 0.93 | 3.43 | 78.7 | [7] |
| Liuchahe, China | 732 | 17.9 | 70.1 | 12.0 | 53.4 | 5.46 | 47.9 | 89.8 | [6] |
| Roanoke, North Carolina | 2,194,756 | 60.4 | 33.3 | 6.30 | 2.55 | 0.46 | 2.09 | 81.9 | [44] |
© 2018 by the authors. Licensee MDPI, Basel, Switzerland. This article is an open access article distributed under the terms and conditions of the Creative Commons Attribution (CC BY) license (http://creativecommons.org/licenses/by/4.0/).
Share and Cite
MDPI and ACS Style
Reza, A.; Eum, J.; Jung, S.; Choi, Y.; Jang, C.; Kim, K.; Owen, J.S.; Kim, B. Phosphorus Budget for a Forested-Agricultural Watershed in Korea. Water 2019, 11, 4. https://doi.org/10.3390/w11010004
AMA Style
Reza A, Eum J, Jung S, Choi Y, Jang C, Kim K, Owen JS, Kim B. Phosphorus Budget for a Forested-Agricultural Watershed in Korea. Water. 2019; 11(1):4. https://doi.org/10.3390/w11010004
Chicago/Turabian StyleReza, Arif, Jaesung Eum, Sungmin Jung, Youngsoon Choi, Changwon Jang, Kiyong Kim, Jeffrey S. Owen, and Bomchul Kim. 2019. "Phosphorus Budget for a Forested-Agricultural Watershed in Korea" Water 11, no. 1: 4. https://doi.org/10.3390/w11010004
Note that from the first issue of 2016, this journal uses article numbers instead of page numbers. See further details here.